the intosai working group on key national indicators
DESCRIPTION
The INTOSAI Working Group on Key National Indicators. Methodic and informational support of the visualization and assessment of KNI for the use in SAIs activity for the purpose of international comparisons. The 5 th Meeting April 3-4, 2012, Riga. Development Goals Identification Problem. - PowerPoint PPT PresentationTRANSCRIPT

The INTOSAI Working Group on Key National Indicators
Methodic and informational support of the visualization and assessment of KNI for the
use in SAIs activity for the purpose of international comparisons
The 5th MeetingApril 3-4, 2012, Riga
2
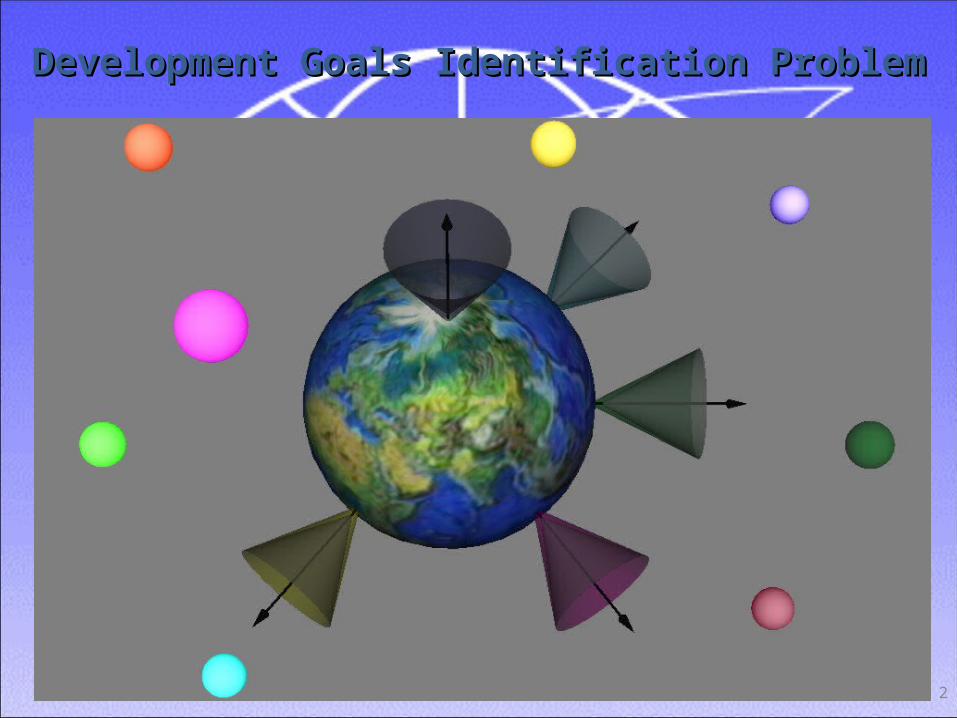
Development Goals Identification ProblemDevelopment Goals Identification Problem

Problem of transparencyProblem of transparency in progress measurementin progress measurement
3
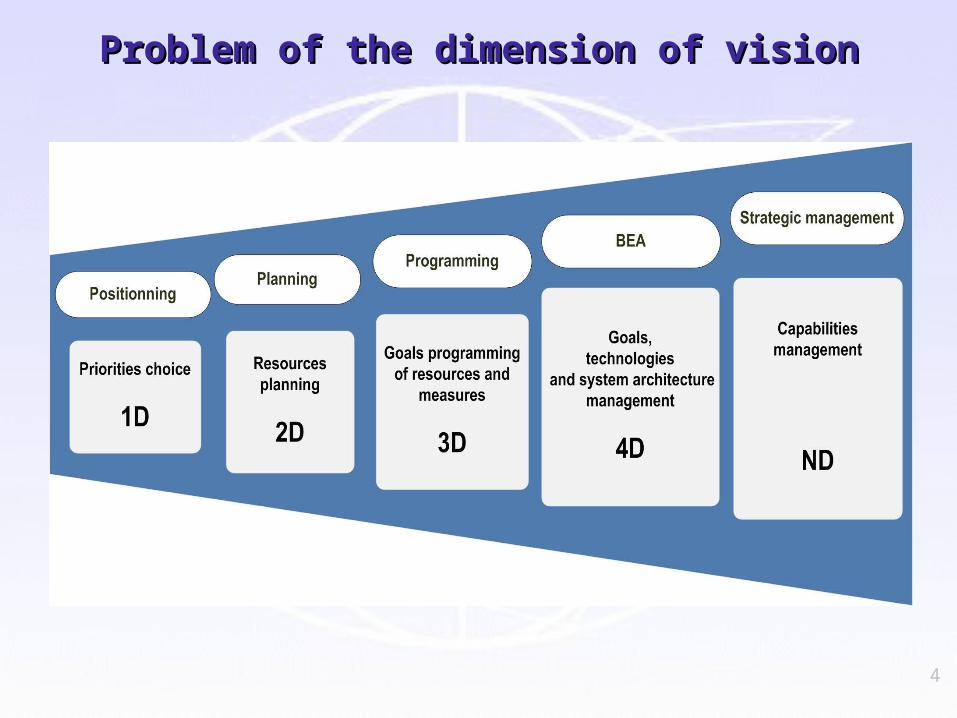
Problem of the dimension of visionProblem of the dimension of vision
4

Population distributionPopulation distribution
5
By 1.01.2010 1099 cities : 13 – million citizens or more 22 – 500-1000 thousand citizens 38 – 250-500 thousand citizens 91 – 100-250 thousand citizens
23 907 municipal formations 512 urban districts 1829 municipalities 1739 towns 19591 rural settlements

Composition and availability of information presented Composition and availability of information presented by G-20 members within Mutual Assessment Processby G-20 members within Mutual Assessment Process
6
7
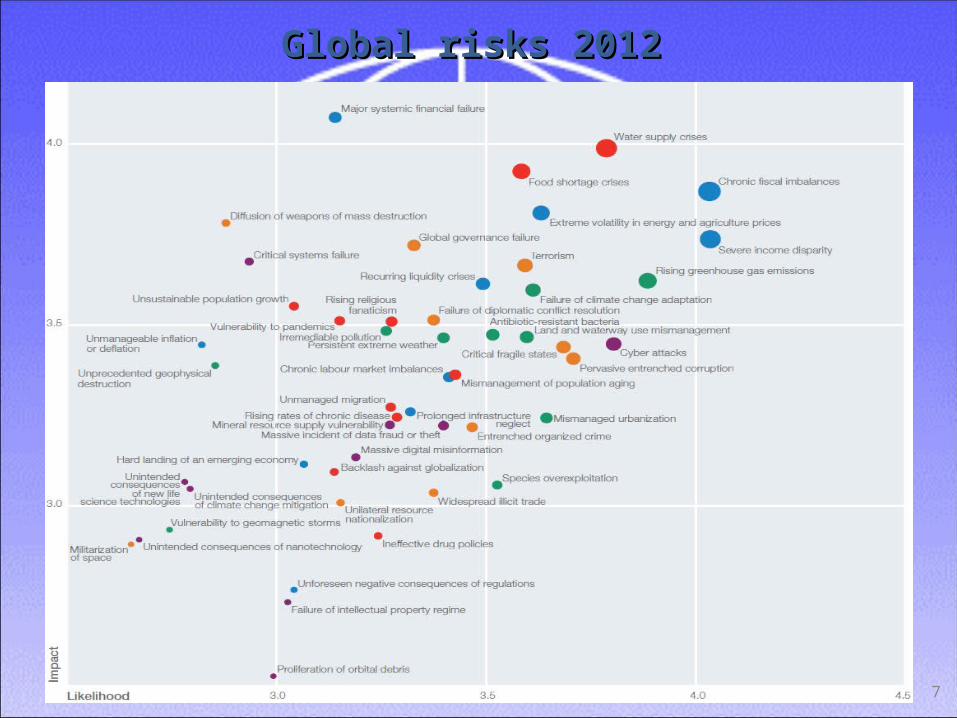
Global risks 2012Global risks 2012
8
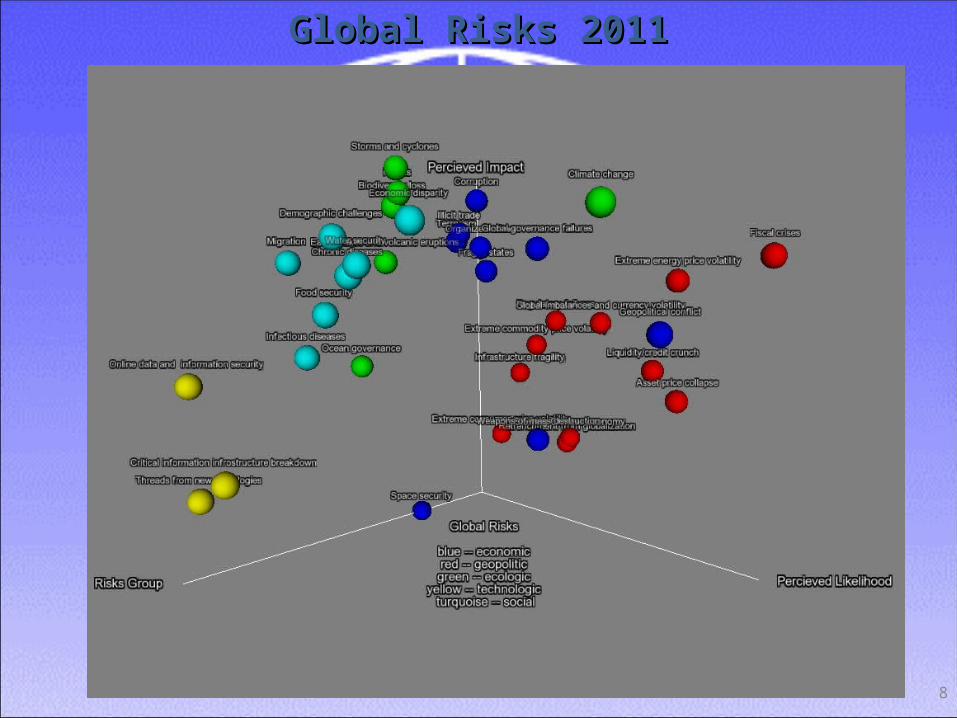
Global Risks 2011Global Risks 2011

9
Version of the social metrics of progressVersion of the social metrics of progress

10
G-20 Mutual Assessment Process results G-20 Mutual Assessment Process results (case of China)(case of China)

11
G-20 Mutual Assessment Process results G-20 Mutual Assessment Process results (case of USA)(case of USA)

12
G-20 Mutual Assessment Process results G-20 Mutual Assessment Process results (case of Russia)(case of Russia)
13
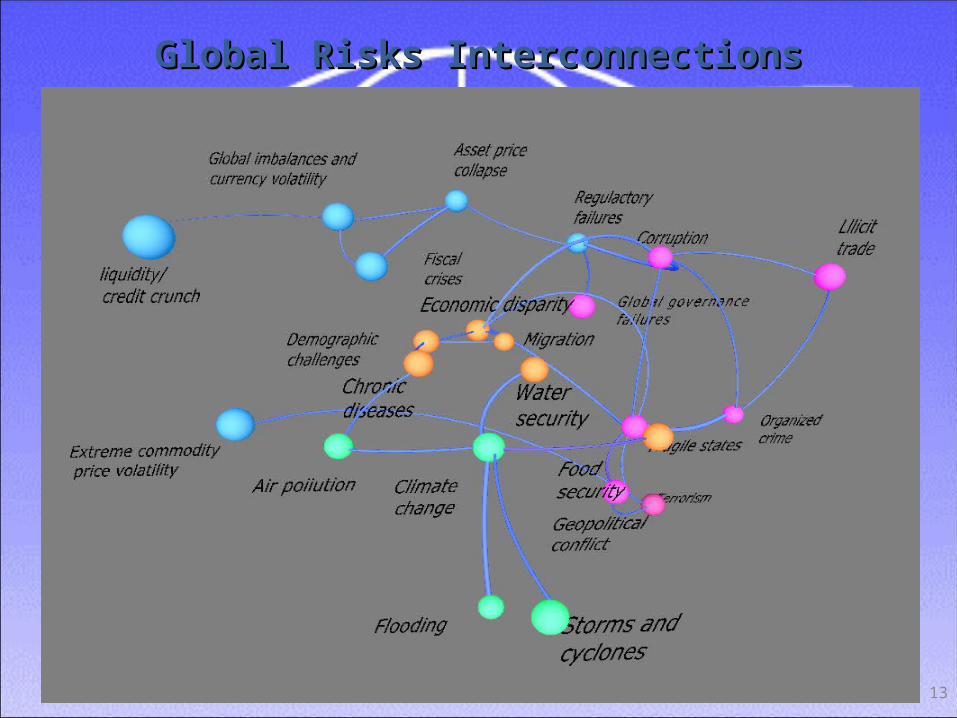
Global Risks InterconnectionsGlobal Risks Interconnections

14
Analysis of the evaluated social development factorsAnalysis of the evaluated social development factors
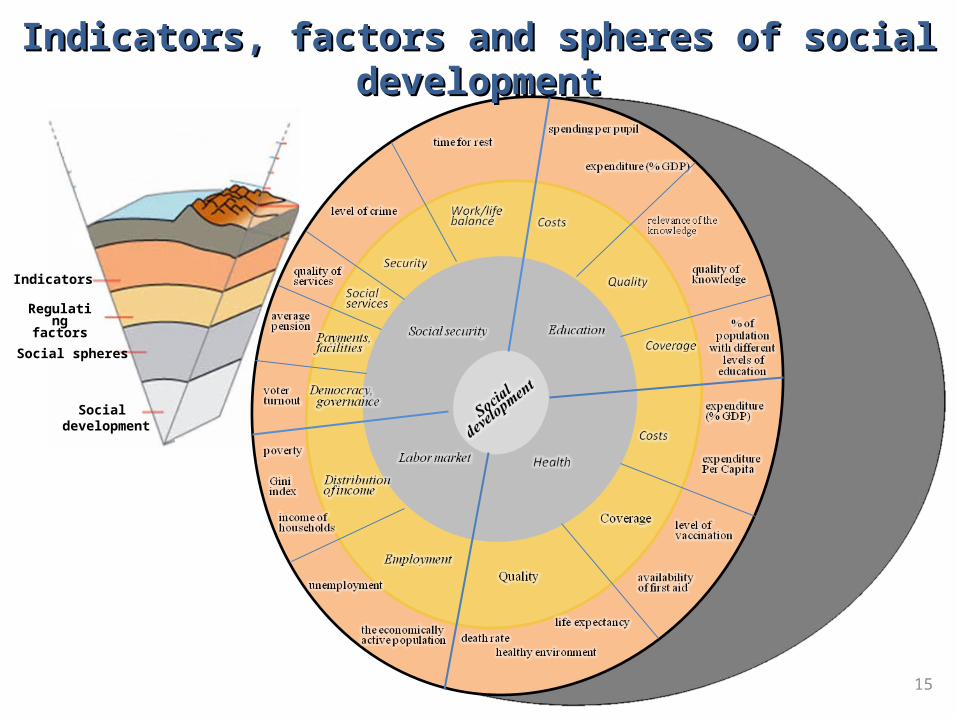
Социальные сферы
Social spheres
Social development
Regulatingfactors
Indicators
Indicators, factors and spheres of social developmentIndicators, factors and spheres of social development
15

16
Gross National Happiness (GNH)Gross National Happiness (GNH)
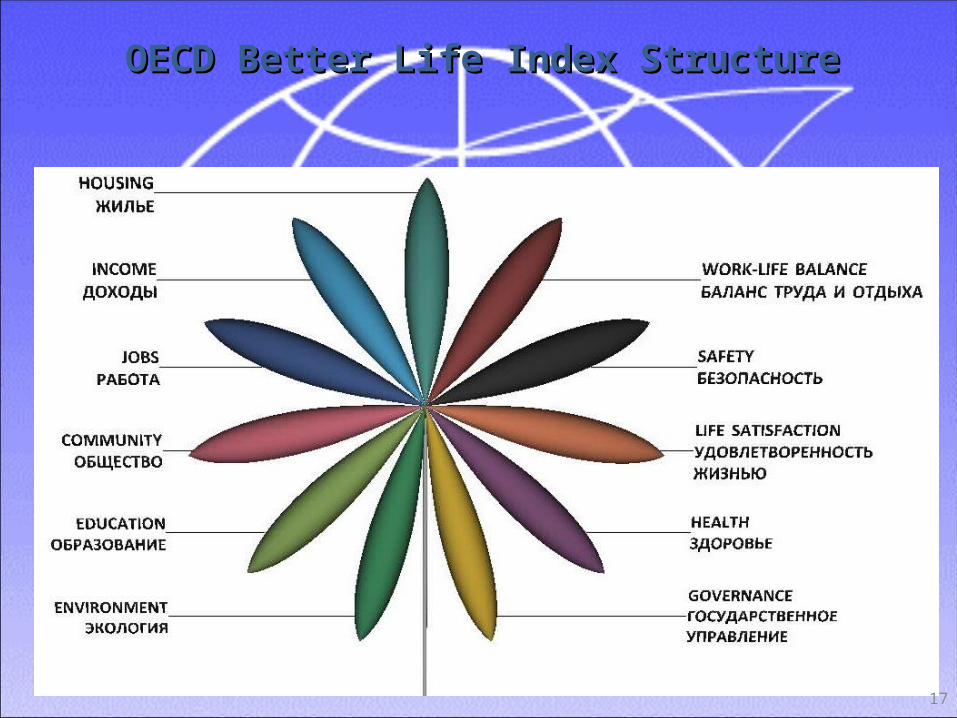
OECD Better Life Index StructureOECD Better Life Index Structure
17
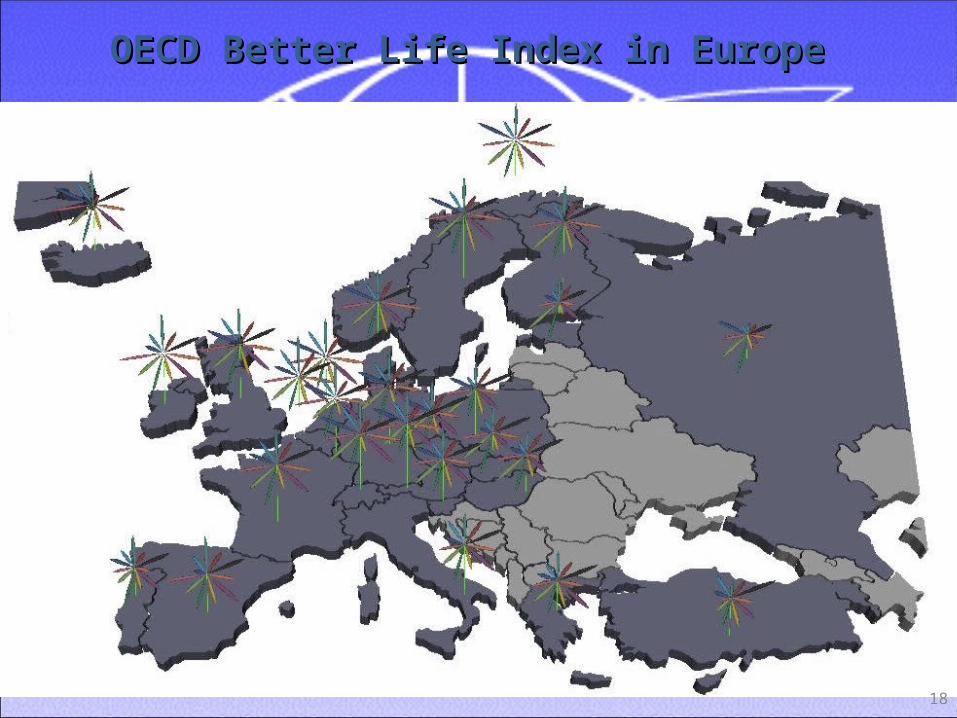
OECD Better Life Index in EuropeOECD Better Life Index in Europe
18

19
Analysis of the evaluated economic development Analysis of the evaluated economic development factorsfactors

WEF Global Competitiveness Index StructureWEF Global Competitiveness Index Structure
20

WEF Global Competitiveness Index in EuropeWEF Global Competitiveness Index in Europe
21

Imbalance of social and economic goals and Imbalance of social and economic goals and indicatorsindicators
22
OECD Global Project«Measurement of the progress of
society»
G20 working group on economic imbalances
• Health• Education• Jobs• Income• Life satisfaction• Community
• Public dept• Public fiscal deficits• Private savings rate• Private dept• Trade imbalance• Imbalance of net investment
income flows and transfers

Comparison of Better Life Index and Global Comparison of Better Life Index and Global Competitiveness IndexCompetitiveness Index
(case of Russia)(case of Russia)
23

24
Comparison of Better Life Index and Global Comparison of Better Life Index and Global Competitiveness IndexCompetitiveness Index
(case of Germany)(case of Germany)
25
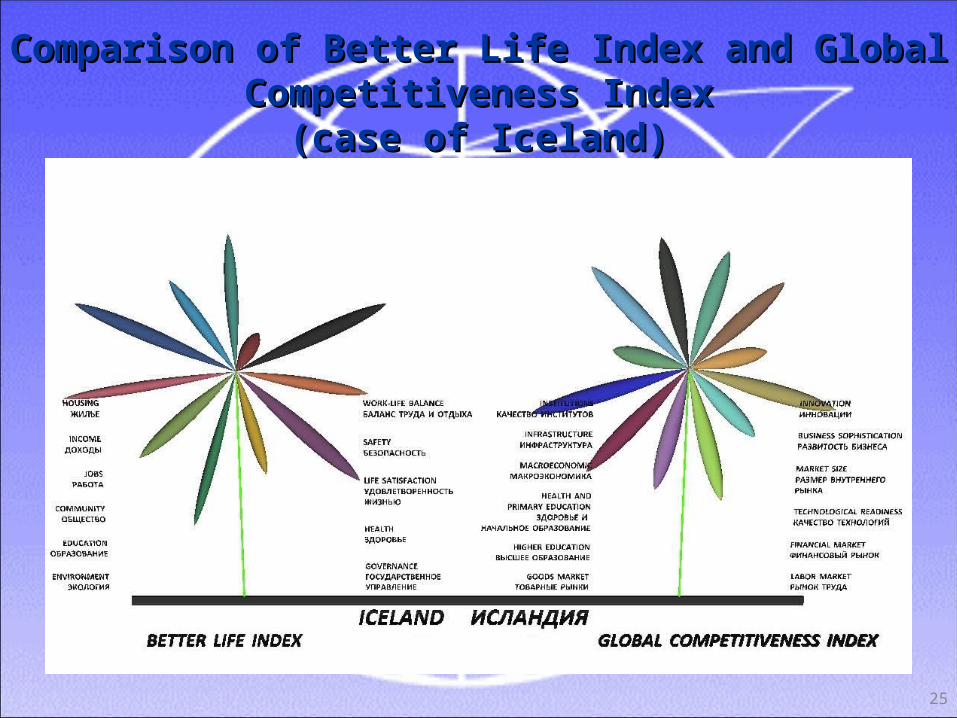
Comparison of Better Life Index and Global Comparison of Better Life Index and Global Competitiveness IndexCompetitiveness Index
(case of Iceland)(case of Iceland)
26
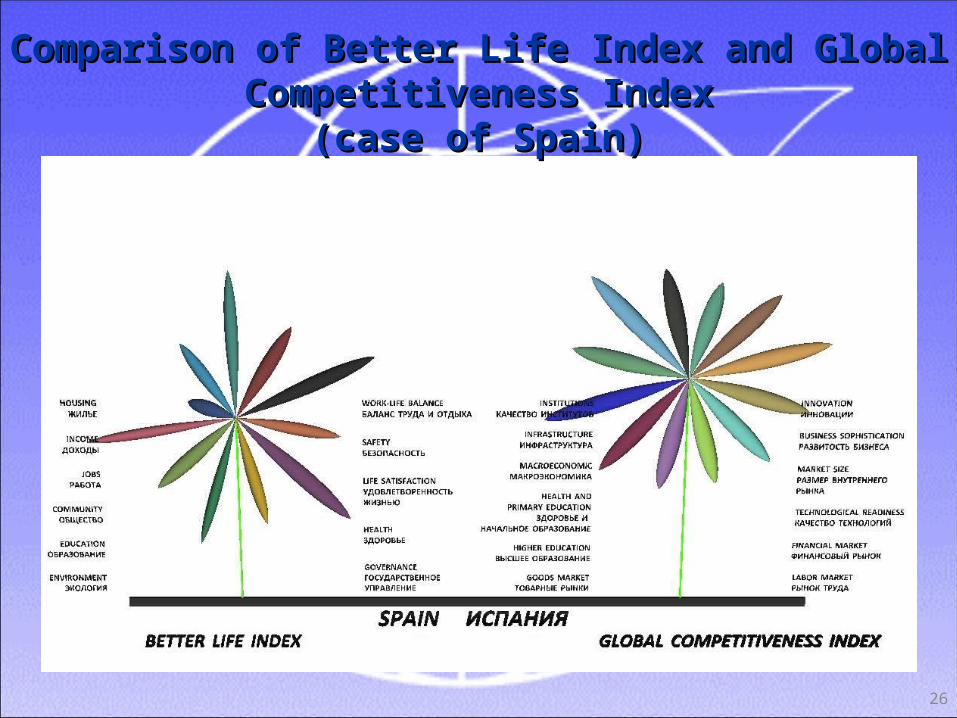
Comparison of Better Life Index and Global Comparison of Better Life Index and Global Competitiveness IndexCompetitiveness Index
(case of Spain)(case of Spain)

Problem of key development indicators imbalanceProblem of key development indicators imbalance
Industrial capital
Natural capital
Human capital
National wealth
Evaluation of social indicators
Evaluation of economic indicators
Evaluation of sustainable
development
Imbalances of key
development assets
National wealth,
trillion US$
Natural capital
Industrial capital
Humancapital
Russia 10,5 42,8% 24,2% 33,3%
China 25,0 20,9% 31,3% 46,4%
USA 218,0 1,9% 13,6% 85,4%
World 708,0 6,1% 17,6% 76,5%
27

Visualization of countries current positions and Visualization of countries current positions and
development goalsdevelopment goals
28

Thank you for attentionThank you for attention!!
29