the israeli economy: challenges and opportunities objectives of economic policy for 2011-2012 state...
TRANSCRIPT

The Israeli Economy: Challenges and
OpportunitiesObjectives of Economic Policy for 2011-2012
State of IsraelMinistry of Finance
Click here for attached press release

Topics:
Israel’s economy: strengths, weaknesses, threats, and opportunities
Challenges of economic policy
Key points of economic policy

Challenges of Economic Policy
Resilience of the economic system to shocks
Increase in per-capita GDP and improvement of relative positioning
Strengthening disadvantaged population groups and reducing social inequalities

Key Points of Economic Policy
Chapter I – The future of human capital and the sophisticated industries
Chapter II – Infrastructure development and promotion of internal growth drivers
Chapter III – Addressing the labor market
Chapter IV – Responsible fiscal policies

Strengths and Opportunities
A tradition of structural reforms and responsible fiscal policies
Coped impressively with the challenges of the last decade
Strong starting point compared to peer countries
The Israeli Economy: Strengths, Weaknesses, Threats, and Opportunities
A Tradition of Structural Reforms and Responsible Fiscal Policies
Five years of high growth rates (until the crisis) Consistent surplus in balance of payments; strong
currency Responsible, growth-supporting fiscal policies:
Gradual reduction of level of public expenditures Falling levels of deficit and debt Competitive tax rates Balance and stability in the public-sector wage system
Monetary stability
Strengths and Opportunities
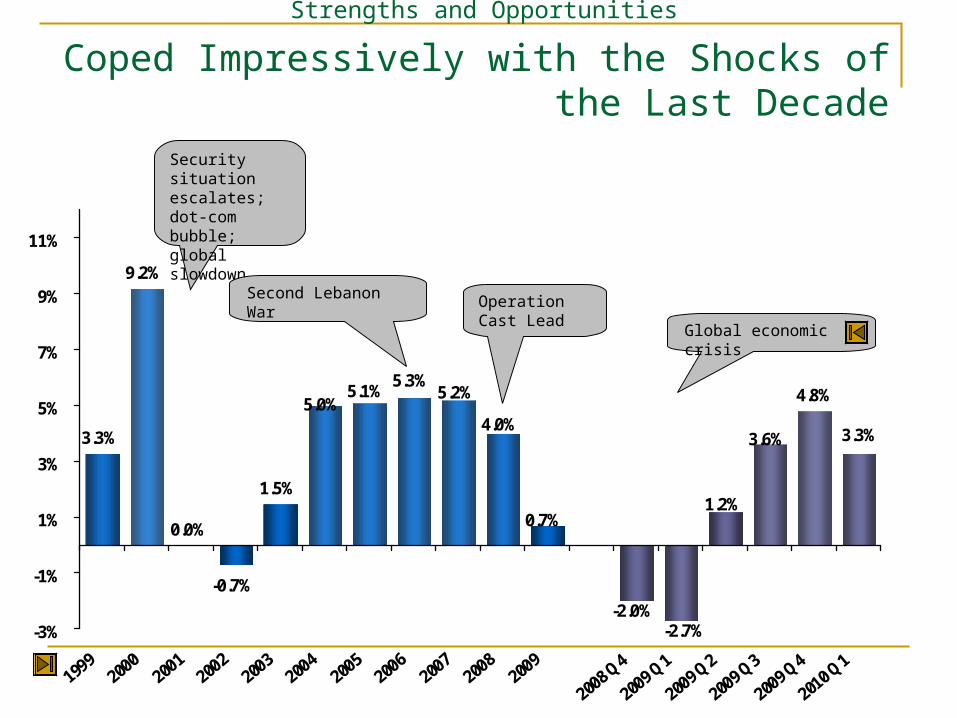
3.3%
9.2%
0.0%
-0.7%
1.5%
3.3%3.6%
4.8%
0.7%
4.0%
-2.0%-2.7%
1.2%
5.0%
5.3%5.2%5.1%
-3%
-1%
1%
3%
5%
7%
9%
11%
1999
2000
2001
2002
2003
2004
2005
2006
2007
2008
2009
2008 Q
4
2009 Q
1
2009 Q
2
2009 Q
3
2009 Q
4
2010 Q
1
Security situation escalates; dot-com bubble; global slowdown
Second Lebanon War
Operation Cast Lead
Global economic crisis
Coped Impressively with the Shocks of the Last Decade
Strengths and Opportunities
Strong Starting Point Compared to Peer Countries
Growth-supporting fiscal environment High national expenditure on R&D Outstanding knowledge-intensive industries High quality of human capital Flexible business-sector labor market
Strengths and Opportunities
Signs of Erosion and Threats Erosion of human capital and knowledge-intensive
industries Worsening competitive conditions in the global arena Rapid changes in composition of population – education
and employment Quality of services for citizens and businesses in need of
improvement Infrastructure gaps – overloaded transportation systems;
land and real estate Heavy burden of defense along with security risks Uncertainty in the global economy
The Israeli Economy: Strengths, Weaknesses, Threats, and Opportunities

Relative advantage in leading fields
Ongoing improvement in macro data
Good launching point at emergence from the crisis
High growth potential for the Israeli economy
Window of opportunity to take advantage of success
One Economy – Two Stories
Trend towards erosion of advantages Demographic scenario: decline in
employment and productivity, increase in social inequalities
Uncertainty in the global economy Regional / security-related instability
Doubts regarding growth potential; level of competition and level of inequality
Need to inject new fuel into growth engines
An opportunity to set the direction of the economy for the coming years
The Israeli Economy: Strengths, Weaknesses, Threats, and Opportunities

Challenges of the Economic Policy
Resilience of the economic system to shocks
Increase in per-capita GDP and improvement of relative positioning
Strengthening disadvantaged population groups and reducing social inequalities

Key Points of Economic Policy
Chapter I – The future of human capital and the sophisticated industries
Chapter II – Infrastructure development and promotion of internal growth drivers
Chapter III – Addressing the labor market
Chapter IV – Responsible fiscal policies

Chapter I – The Future of Human Capital and the Sophisticated
Industries Promotion and development of knowledge-intensive industries
Human capital – education and reform of higher education
Increasing the relative advantage of export industries while granting precedence to industry in peripheral regions
Key Points of Economic Policy

Chapter II – Infrastructures and Promotion of Internal
Growth Drivers Physical infrastructures – land, real estate,
transportation Improved services for citizens and reduced
bureaucracy Improved ability to do business More efficient court system Better management and execution capabilities in the
public sector Structural reforms – energy, ports, communications,
and defense industries
Key Points of Economic Policy

Chapter III – Addressing the Labor Market
Adoption of policy targets in the area of employment A national plan for employment of chronically
unemployed persons based on the “Employment Lights” format
Removal of barriers for Haredi (ultra-orthodox) men to seek work
Improvement of tools for the encouragement of employment of Arab women
Reduction of the number of foreign workers Addressing the problem of illegal entry
Key Points of Economic Policy

Section IV – Responsible Macro-Economic Policies
A continued responsible fiscal policy – a sustainable fiscal rule: Desirable government size Falling deficit trajectory Debt reduction
Two-year budget
Key Points of Economic Policy
Maintaining fiscal credibility
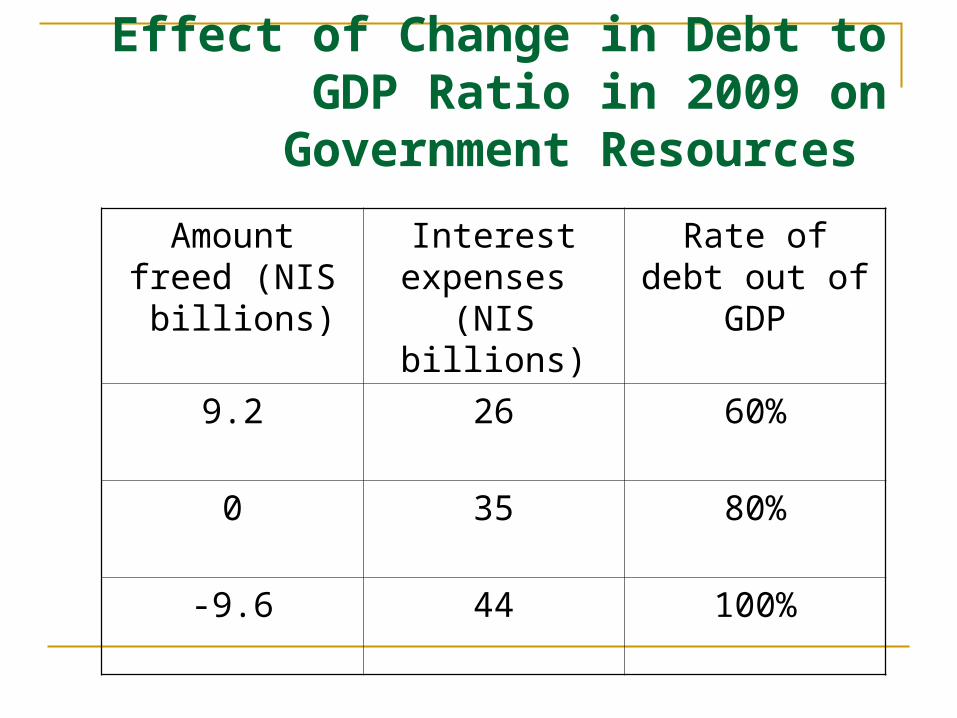
Effect of Change in Debt to GDP Ratio in 2009 on
Government Resources
Rate of debt out of GDP
Interest expenses
(NIS billions)
Amount freed (NIS billions)
60%269.2
80%350
100%449.6-

Israel’s Credit Rating
1992
1993
1994
1995
1996
1997
1998
1999
2000
2001
2002
2003
2004
2005
2006
2007
2008
2009
2010
Moody's S&P Fitch
A1/A+
A2/A
A3/A-
Baa1/BBB+
Baa2/BBB
Baa3/BBB-
Aa3/AA-
Current credit rating Moody’s - A1 (Stable)
S&P – A (Stable)
Fitch – A (Stable)
Nov 2007S&P upgrade
Israel to A
Nov 2007S&P upgrade
Israel to A
Feb 2008Fitch upgrade
Israel to A
Feb 2008Fitch upgrade
Israel to A
April 2008Moody’s upgrade
Israel to A1
April 2008Moody’s upgrade
Israel to A1
All Three Credit Rating Agencies Re-affirmed
Israel’s Rating/Outlook in 2009
All Three Credit Rating Agencies Re-affirmed
Israel’s Rating/Outlook in 2009

End
Strengths: Indicators

Five years of high growth, rapid recovery from the crisis
3.3%
9.2%
0.0%
-0.7%
1.5%
3.3%3.6%
4.8%
0.7%
4.0%
-2.0%-2.7%
1.2%
5.0%
5.3%5.2%5.1%
-3%
-1%
1%
3%
5%
7%
9%
11%
1999
2000
2001
2002
2003
2004
2005
2006
2007
2008
2009
2008 Q
4
2009 Q
1
2009 Q
2
2009 Q
3
2009 Q
4
2010 Q
1
Recovery Starting in Q2 2009
1999-2010, annual rates of change

-1.3%
-3.5%-4.3%
-4.9%
-3.0%
-0.9%-1.3%
-0.8%-1.0%-0.8%
3.7%
-5.0%
-2.1%
0.3%0.5% 1.2%
2.3%
3.1%
0.7%
2.9%
5.1%
-6000
-4000
-2000
0
2000
4000
6000
8000
10000
1989
1990
1991
1992
1993
1994
1995
1996
1997
1998
1999
2000
2001
2002
2003
2004
2005
2006
2007
2008
2009
-6%
-4%
-2%
0%
2%
4%
6%
8%
10%
Confidence in the markets – a surplus in the current account of the balance of
payments
Percent of GDP (right axis)
In USD millions and in percent of GDP

Falling rates of debt
78.079.977.2
99.0
84.4
100.8
119.2
136.2
145.1
158.2
20
30
40
50
60
70
80
90
100
110
120
130
140
150
160
170
1986
1987
1988
1989
1990
1991
1992
1993
1994
1995
1996
1997
1998
1999
2000
2001
2002
2003
2004
2005
2006
2007
2008
2009
2010F
Source: CBS; Economics and Research Division, MOF
Reduction of Public Debt as a Percentage of GDP

40%
50%
60%
70%
80%
90%
100%
110%
2003 2005 2007 2009 2011 2013 2015
ʤʩʁʬʥʮʩɦ ʬʲ ʥɹʡ ʨʫʩyʨɦ ʠʮ̋ ʰʮʠ
Assuming growth rates of 4% in 2011-2013 and 3.5% from 2014 forward.
67.8%
Test point
Trajectory for Reduction of Debt-to-GDP Ratio, 2003-2020
Responsible, balanced fiscal horizon
Simulation Actual
Maastricht Treaty

Gradual reduction of level of public expenditure
59.0
56.355.4
52.0
47.2
50.3
42.942.9
42.4
30
35
40
45
50
55
60
1987
1988
1989
1990
1991
1992
1993
1994
1995
1996
1997
1998
1999
2000
2001
2002
2003
2004
2005
2006
2007
2008
2009
2010F
Source: CBS; Economics and Research Division, MOF
Reduction of Public Expenditure as a Percentage of GDP

35%
40%
45%
50%
55%
2003 2005 2007 2009 2011 2013 2015
סימולציה בפועל
Assuming growth of 4% in 2011-2013 and 3.5% from 2014 forward.
Responsible, balanced fiscal horizon
Trajectory for Reduction of Public Expenditure, 2003-2020
Simulation Actual

4.8%
3.3%
5.6%
-7.4%
0.7%
-2.0% -2.7%
1.2%
3.6%
-6.4%-5.4%
-2.7%
-0.7%
2.2%3.2%
-1.6%
-9.6%
-0.4%
1.6% 1.2%0.4%
-10%
-6%
-2%
2%
6%
2008-Q3 2008-Q4 2009-Q1 2009-Q2 2009-Q3 2009-Q4 2010-Q1
Israel
US
Eurozone
The economic crisis: Late, moderate damage; early
recovery
Quarterly growth, annualized rate
Growth of Gross Domestic Product, in Israel and Globally

Expenditure for Civilian R&D, 2007* (in percent of GDP)4.8
3.6 3.5 3.5 3.4
2.92.7 2.7 2.6 2.6 2.5
2.32.1 2.0 1.9 1.9 1.8 1.7 1.6 1.6 1.5
1.3 1.3 1.2 1.2 1.11.0
0.7 0.6 0.6 0.5
0
1
2
3
4
5
6
Isra
el
Swed
en
Finla
nd
Korea
Japan
Switz
erland
Icel
and
US
Austria
Denm
ark
Ger
man
y
Weig
hted a
vera
ge
France
Austra
lia
Canada
Belgiu
m
UK
Netherla
nds
Norway
Luxembourg
Czech
Rep
ublic
Irela
nd
Spain
New Z
ealan
d
Portugal
Italy
Hungary
Turkey
Gre
ece
Poland
Slovak
ia
* 2007 or latest year for which data are available.
High rates of expenditure on civilian R&D

Rate of Contribution of Technology Sector to Exports,
2001-2009
0.36
0.330.30
0.320.31
0.340.33 0.32
0.41
0.00%
5.00%
10.00%
15.00%
20.00%
25.00%
30.00%
35.00%
40.00%
45.00%
2001 2002 2003 2004 2005 2006 2007 2008 2009
0
5
10
15
20
25
30
35
Norway
United
Stat
es
Nether
lands
Israe
l
Icelan
d
Canad
a
New Z
ealan
d
Denmar
k
Korea
Austra
lia
Japa
n
Sweden
United
King
dom
Estonia
Russia
n Fed
erati
on
Irelan
d
Finlan
d
Switzer
land
Spain
OECD ave
rage
Poland
Luxe
mbour
g
Hunga
ry
Franc
e
Germ
any
Greec
e
Mex
ico
Belgium
Portu
gal
Czech
Rep
ublic
Italy
Slovak
Rep
ublic
Sloven
ia
Turke
y
Austria
Chile
Brazil
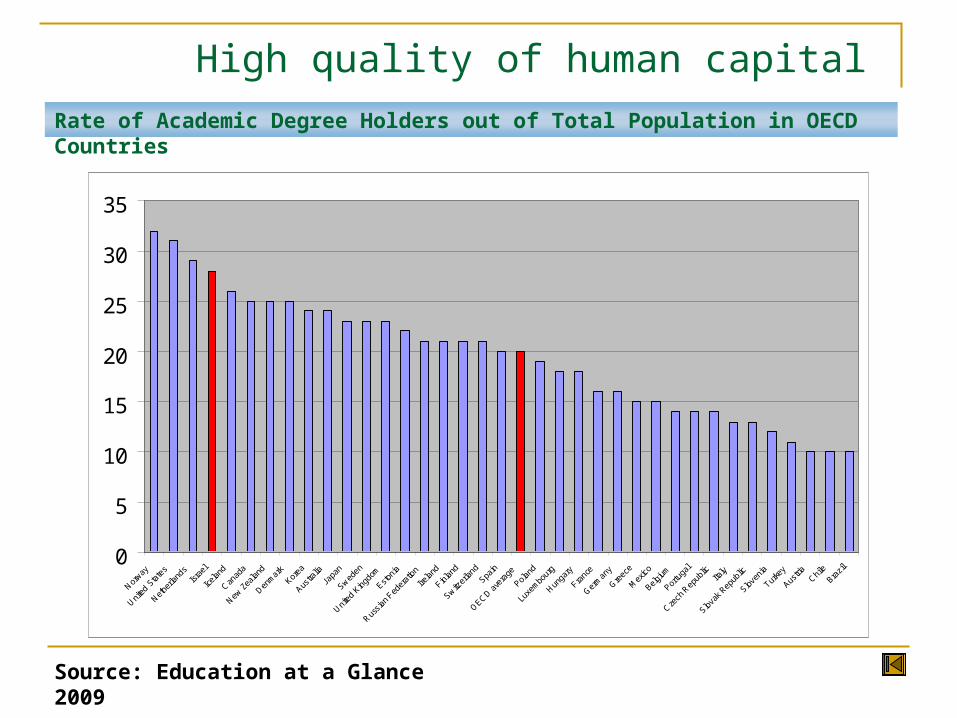
Source: Education at a Glance 2009
High quality of human capital Rate of Academic Degree Holders out of Total Population in OECD Countries
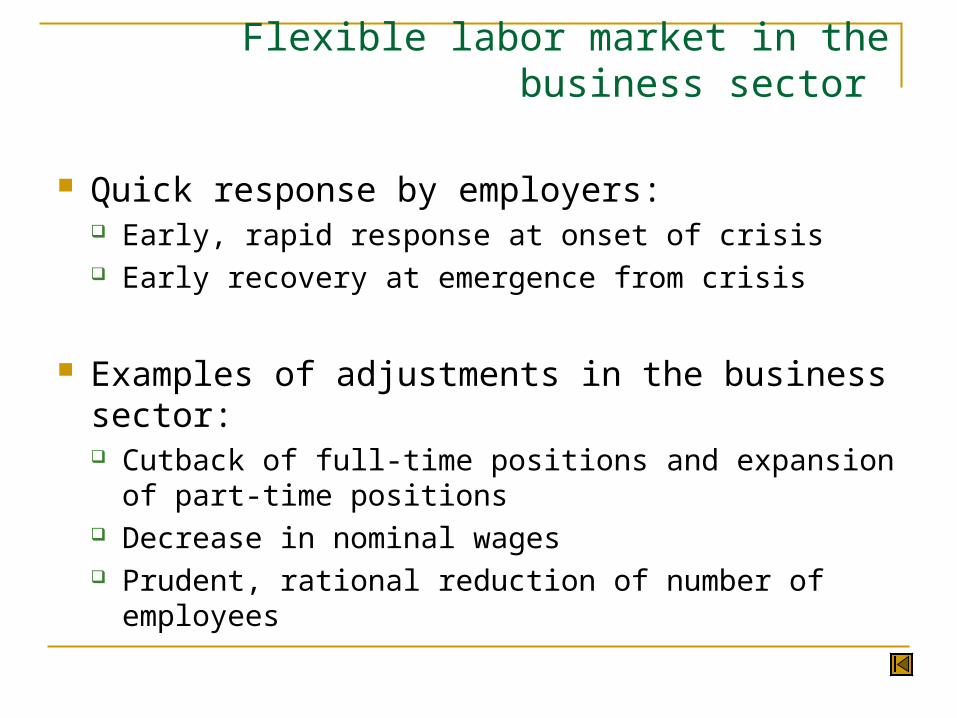
Flexible labor market in the business sector
Quick response by employers: Early, rapid response at onset of crisis Early recovery at emergence from crisis
Examples of adjustments in the business sector: Cutback of full-time positions and expansion of part-
time positions Decrease in nominal wages Prudent, rational reduction of number of employees

Signs of Erosion and Threats:
Indicators

Low achievement at all levels, including excellent
Pisa 2006
Signs of Erosion and Threats
Level 6
Level 5
Level 4
Level 3
Level 2
Level 1
Below Level 6
Israel OECD average

Aging of academic staff, moving away from optimal academic productivity age
Average age of senior academic
staff in Israel, 2010
Source: B. Jones, “Age and great Invention”, Review of Economics and Statistics, January 2010
Signs of Erosion and Threats
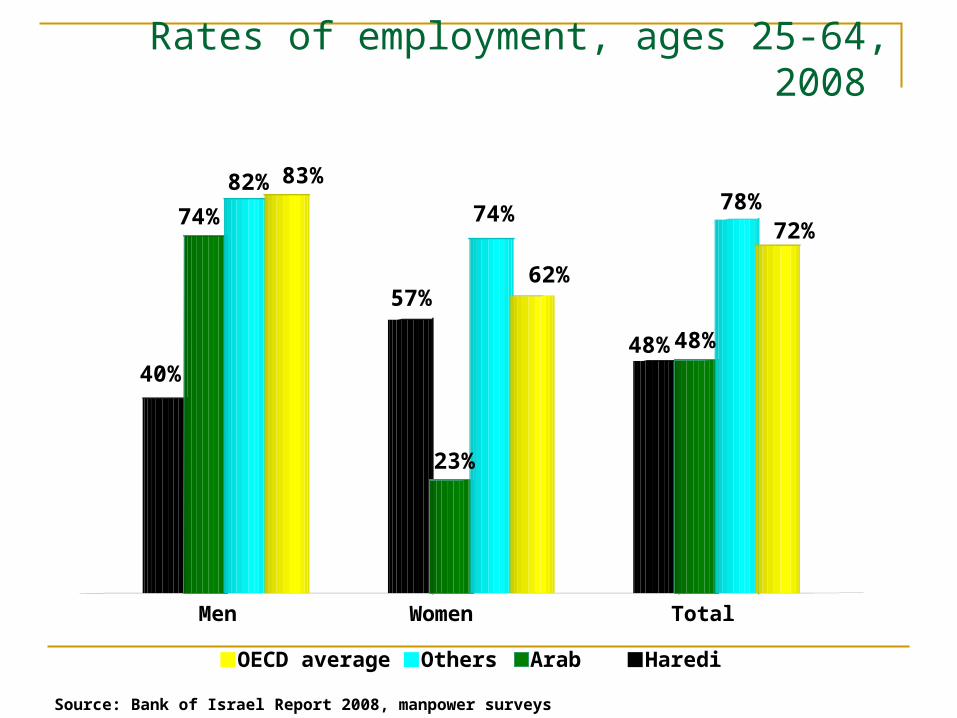
Rates of employment, ages 25-64, 2008
Source: Bank of Israel Report 2008, manpower surveys
83%82%
74%
40%
62%
74%
23%
57%
72%78%
48%48%
TotalWomenMen
OECD average Others Arab Haredi

Gender differences in wages Average Wages, in NIS per Employee Position,
2007
Source: Karnit Flug, “The Israeli Labor Market: An International Comparison,” Sept. 2009. Calculations based on CBS data.
4 , 279 ) 72(%
4 , 351 ) 73(%
6, 154 ) 103(% 5,957
6 , 582 ) 71(%
5 , 759 ) 62(%
10,085) 108(%
9,263
₪0
₪2,000
₪4,000
₪6,000
₪8,000
₪10,000
₪12,000
Women MenHaredi Arab Non-Haredi Jews Average wages
Source: CBS Statistical Almanac, 2009. Calculations by Taub Center.
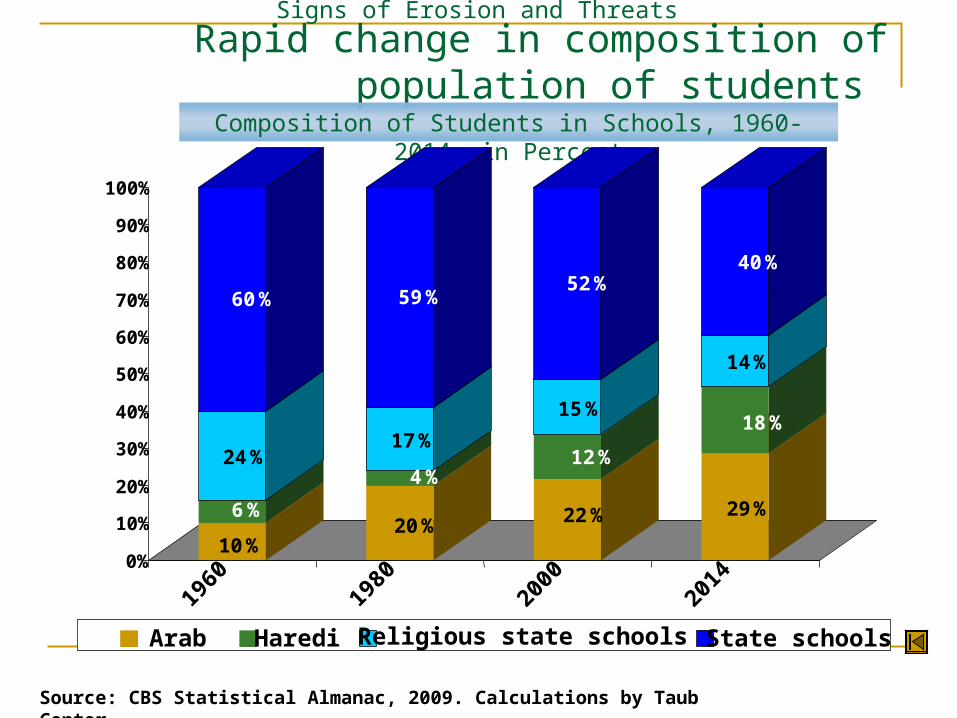
Rapid change in composition of population of students
Composition of Students in Schools, 1960-2014, in Percent
Signs of Erosion and Threats
10%
6%
24%
60%
20%
4%
17%
59%
22%
12%
15%
52%
29%
18%
14%
40%
0%
10%
20%
30%
40%
50%
60%
70%
80%
90%
100%
1960
1980
2000
2014
Arab Haredi Religious state schools State schools

Gap between supply and demand in the housing market
-
10,000
20,000
30,000
40,000
50,000
60,000
70,000
1996 1997 1998 1999 2000 2001 2002 2003 2004 2005 2006 2007 2008
התחלות בנייה
גידול משקי הבית
Source: CBS
Cumulative gap over one decade: 116,000 housing units, ~10,000 units per year
Signs of Erosion and Threats
Construction startsIncrease in households

תקציב מקורי
49,033
38,708
35,000
37,000
39,000
41,000
43,000
45,000
47,000
49,000
51,000
2000 2001 2002 2003 2004 2005 2006 2007 2008 2009 2010
תקציב מקורי
Original budget
26.6% growth within a decade!
Development of IDF/Defense Ministry Budget
NIS millions, 2010 budget prices (net budget)
Heavy burden of defense budget
Original budget

Changes in Net Defense Budget for 2006-2009 (2010 prices)
39.9 40.643.4
47.81.9
2.4
1.8
2.0 3.72.5
2.0
4.1
35.0
40.0
45.0
50.0
55.0
2006 2007 2008 2009
תקציב מקורי שינויים במהלך השנה הוצאות לחימה
46.048.
346.2
51.6
Original budget Changes during the year
Combat expenses
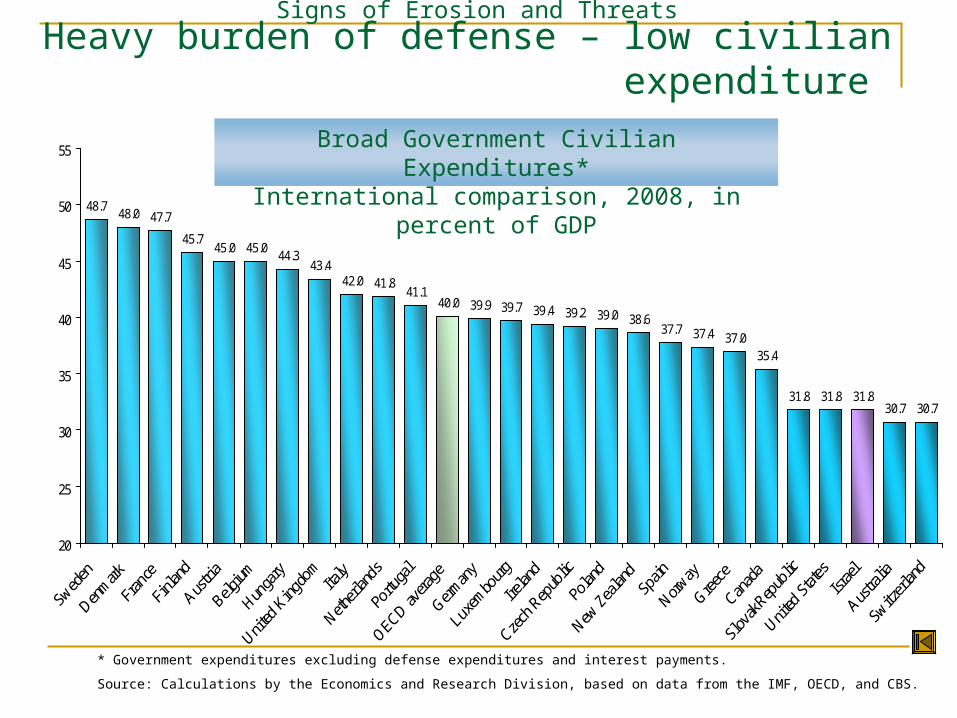
48.748.0 47.7
45.745.0 45.0
44.343.4
42.0 41.841.1
40.0 39.9 39.7 39.4 39.2 39.0 38.637.7 37.4 37.0
35.4
31.8 31.8 31.830.7 30.7
20
25
30
35
40
45
50
55
* Government expenditures excluding defense expenditures and interest payments.
Source: Calculations by the Economics and Research Division, based on data from the IMF, OECD, and CBS.
Heavy burden of defense – low civilian expenditure
Broad Government Civilian Expenditures*International comparison, 2008, in percent of GDP
Signs of Erosion and Threats

94.2%
89.3%
86.3%
78.8%
91.7%
88.2%
60%
70%
80%
90%
100%
2009 2010 2011 2012 2013 2014 2015 2016 2017 2018 2019 2020 2021 2022 2023 2024 2025 2026 2027 2028 2029 2030
שיעור תעסוקה פריון למבוגר 20+ שכר למועסק
Source: Dr. Michael Sarel, Israel Economic Association conference, May 2010.
In the “business as usual” scenario – a negative demographic effect at an annual rate
of 0.45% (per-capita GDP)Men: Effect of Demographic Composition for Ages 20+
Analysis of the “business as usual” trend with regard to the adoption of employment and wage patterns in the non-Haredi Jewish population .
One Economy, Two Stories
Employment rate
Productivity for adults (20+)
Wages per employee