the isv business case for building saas on amazon web ... · pdf filethe isv business case for...
TRANSCRIPT

A Forrester Total Economic
Impact™ Study
Commissioned By
Amazon
Project Directors:
Michael Speyer
Sarah Musto
August 2016
The ISV Business Case
For Building SaaS on
Amazon Web Services
(AWS) A Total Economic Impact™ Analysis

Table Of Contents
Executive Summary .................................................................................... 3
Disclosures .................................................................................................. 5
Market Overview: ISVs Transition From Traditional To SaaS
Applications ................................................................................................. 6
TEI Framework And Methodology .......................................................... 11
The ISV Partners’ Journey ....................................................................... 12
Analysis ...................................................................................................... 18
Amazon Web Services: Overview ........................................................... 28
Appendix A: Total Economic Impact™ Overview ................................. 29
Appendix B: SaaS Revenue Calculations .............................................. 30
Appendix C: Glossary ............................................................................... 31
Appendix D: Supplemental Material ....................................................... 32
ABOUT FORRESTER CONSULTING
Forrester Consulting provides independent and objective research-based
consulting to help leaders succeed in their organizations. Ranging in scope from
a short strategy session to custom projects, Forrester’s Consulting services
connect you directly with research analysts who apply expert insight to your
specific business challenges. For more information, visit
forrester.com/consulting.
© 2016, Forrester Research, Inc. All rights reserved. Unauthorized reproduction is strictly prohibited.
Information is based on best available resources. Opinions reflect judgment at the time and are subject to
change. Forrester®, Technographics®, Forrester Wave, RoleView, TechRadar, and Total Economic Impact
are trademarks of Forrester Research, Inc. All other trademarks are the property of their respective
companies. For additional information, go to www.forrester.com.
3
Executive Summary
Amazon Web Services (AWS) commissioned Forrester
Consulting to conduct a Total Economic Impact™ (TEI) study
to develop the business case for independent software
vendors (ISVs) that sell on-premises software to develop
software-as-a-service (SaaS) on AWS. The purpose of this
study is to provide readers with a framework to evaluate the
potential financial impact of developing a SaaS product.
To better understand the revenues, investments, and risks
associated with developing and launching a SaaS product,
Forrester conducted 10 in-depth interviews with ISVs that had
developed SaaS products that run on AWS. Nine of the
interviewed ISVs had made the transition from developing on-
premises software to developing SaaS; one interviewed ISV was born in the cloud and, from inception, only built SaaS. We
built our analysis and model on the nine transitional ISVs and looked to the 10th ISV for anecdotal feedback on building and
deploying SaaS from launch. We also conducted an online survey of 106 ISVs, hosted either on AWS or with other cloud
providers, that had made the transition from on-premises software to SaaS, and we used the survey results to develop a
broader market overview of ISV drivers, behaviors, and performance trends.
The nine interviewed ISVs were driven to develop SaaS products by customer demand for SaaS solutions, the need to
protect their customer base from SaaS competitors, and the desire to bring innovations and new product features to market
more quickly and easily. Similarly, the surveyed ISVs were driven to develop SaaS products in response to customer
demand for SaaS delivery (89%), to fend off SaaS competitors (71%), and to increase their agility and responsiveness to
changing market demands (80%).
The nine interviewed ISVs had SaaS products in the market ranging from three to 10 years, and seven continued to sell and
support their on-premises software products. SaaS subscription revenues as a percentage of total revenues ranged from
less than 10% to 100%. SaaS gross margins typically ranged from 40% to 70%.
The areas of largest investment were for initial SaaS product development, sales and marketing, and customer support.
Seven of the interviewed ISVs developed multitenant architectures while still supporting single-tenant deployments. Thirty-
nine percent of the surveyed ISVs supported both single and multitenant architectures, while 51% supported multitenant
architectures only. The interviewed ISVs’ investments in customer support were intended to help customers maximize the
value received from the SaaS product, which in turn would minimize churn and increase contract renewal rates.
The interviewed ISVs chose AWS as their infrastructure provider for many reasons, predominantly for the maturity of AWS’
technical capabilities and breadth of services, presence in local markets, overall geographic reach, and reputation and
credibility. The ISVs also noted the development support that AWS provided, such as architectural reviews, best practice
guidance, and whitepapers. The ongoing go-to-market support that the ISVs receive through AWS and the AWS Partner
Network (APN) was also a clear benefit noted by the interviewees.
SAAS ON AWS OFFERS ISVS A ROBUST PLATFORM FOR BUSINESS TRANSFORMATION
For this analysis, Forrester developed a composite ISV based on what we learned from the nine interviewed and 106
surveyed ISVs that made the transition from developing on-premises software to SaaS. Prior to developing its SaaS product,
the composite ISV was a B2B software company with revenues coming from licenses sales and software maintenance fees.
In response to competitive pressures and seeking to broaden its potential market, the composite ISV decided to develop
SaaS products and transform its business from an on-premises, license-based software business to a SaaS business model.
Of 106 surveyed ISVs that had made the transition
from on-premises software to SaaS:
Eighty-two percent had SaaS gross
margins that were greater than or the
same as on-premises software.
Eighty-one percent reported improved
time-to-market for new applications.
Eighty-four percent realized cost savings
related to application maintenance.

4
Our economic model shows that by Year 5 of selling SaaS the products, the composite ISV has $50 million in net-new
recurring subscription revenues from its SaaS products (in addition to any revenues coming from traditional sales platforms)
and gross margins of 63%. The SaaS operations become profitable in the fourth year of operations (see Table 1).
The model assumes the following:
• Per-seat prices are $150.
• SaaS sales growth rates are 100% in Year 2, 90% in Year 3, 60% in Year 4, and 50% in Year 5.
• The annual average revenue churn rate is 5%.
• The composite ISV develops new and complementary products for cross- and upsell purposes.
TABLE 1
Five-Year Pro Forma Income Statement ($1000s)
Ref. Calculation Initial Year 1 Year 2 Year 3 Year 4 Year 5
PL1 Subscription revenues 2,407 7,102 15,895 29,738 50,207
PL2 Onboarding expense 406 813 1,463 2,356 3,494
PL3 Cloud hosting and third-party technology expense
1,375 3,733 7,280 12,513 15,083
PL4 Gross margins PL1-PL2-PL3 626 2,557 7,153 14,869 31,630
PL5 Gross margin (%) PL4/PL1 26% 36% 45% 50% 63%
PL6 Sales and marketing 1,358 1,868 2,995 4,374 5,810
PL7 General and administration 385 1,136 2,543 4,758 8,033
PL8 Customer support 335 419 503 586 670
PL9 IT operations 94 94 94 94 94
PL10 R&D 1,406 750 938 1,125 1,125 1,313
PL11 Total operating expense PL6+PL7+PL8+P
L9+PL10 $1,406 $2,922 $4,454 $7,259 $10,937 $15,920
PL12 Total operating income PL4-PL11 ($1,406) ($2,296) ($1,897) ($106) $3,931 $15,711
PL13 Operating profit PL12/PL1 (95%) (27%) (1%) 13% 31%
Source: Forrester Research, Inc.

5
› Revenues. The composite ISV generated SaaS revenues from the following:
• Recurring subscription revenues. These revenues are generated predominantly from converting on-premises
software customers to SaaS. Most revenues are from direct sales, with some coming from partners.
› Investments and expenses. The composite ISV experienced investment and expenses in the following areas:
• Customer onboarding. This is the staff expense needed to ensure successful customer engagement from the
beginning of the customer relationship.
• Hosting and third-party technology expense. This is the expense to AWS for hosting and related services, and to
any other providers whose technologies may be used to deliver the SaaS solution.
• Sales and marketing. This is the staff expense associated with salespeople, pre-sales engineers, and marketing. It
does not include any expense associated with partner-driven sales.
• General and administration. This general and administration expense is assumed to be 16% of revenues. Data for
this assumption was obtained from third-party surveys of SaaS ISVs (see Appendix D).
• Customer support. This is the staff expense for post-sales customer engagement and support. Customer support
managers focused on ensuring customers were deriving as much value as possible from the SaaS offering, exploring
opportunities to sell more seats, and managing the overall customer relationship.
• IT operations. This is the staff expense associated with technical operations support for the SaaS product.
• Research and development. This is the expense needed to develop the first launch-ready product and for ongoing
development of new features, new products, and bug fixing.
Disclosures
The reader should be aware of the following:
› The study is commissioned by AWS and delivered by Forrester Consulting. It is not meant to be used as a competitive
analysis.
› Forrester makes no assumptions as to the potential result that other ISVs will see. Forrester strongly advises that readers
use their own estimates within the framework provided in the report to determine the appropriateness of using AWS.
› AWS reviewed and provided feedback to Forrester, but Forrester maintains editorial control over the study and its findings
and does not accept changes to the study that contradict Forrester's findings or obscure the meaning of the study.
› AWS provided the ISV partner names for the interviews but did not participate in the interviews.

6
Market Overview: ISVs Transition From Traditional To SaaS Applications
The rise of cloud computing has led to dramatic changes in how infrastructure and software are consumed. Forrester
estimates that enterprise adoption of SaaS ranges from 18% to 23% of enterprises, depending on the application (see
Appendix D). In the face of increasing SaaS adoption and other market forces, ISVs that offer traditional on-premises
software solutions are facing increasing pressure to develop SaaS solutions. ISVs that are planning to offer SaaS solutions
need to carefully consider the broad range of decisions that they will need to make and how they will manage the transition
from on-premises software to SaaS, as these decisions may fundamentally affect their business models and operations.
To evaluate why and how ISVs transition from developing and selling traditional on-premises applications to offering SaaS
applications, Forrester conducted a survey of 106 ISVs that have transitioned some or all of their on-premises applications to
SaaS. Survey respondents were not solely AWS customers; the cloud hosting provider used by respondents varied.
Forrester asked these ISVs to explain the challenges and objectives leading to the decision to transition to providing SaaS
applications. We also asked them to describe their SaaS development and delivery costs and key business outcomes.
WHY ARE ISVS DRIVEN TO DEVELOP SAAS SOLUTIONS?
When Forrester surveyed 106 ISVs to learn the important factors in their decision to develop SaaS products, the ISVs
identified several key drivers, including:
› Customer demand for SaaS delivery or new solutions. Eighty-nine percent of ISVs consider satisfying customer
demand for SaaS delivery to be a key motivator. Additionally, 90% of all the surveyed ISVs developed a SaaS product as
a response to customer demand for new solutions (that would be delivered via SaaS).
› Competitive pressure to deliver a SaaS solution. With established competitors developing SaaS solutions and new
competitors entering the market, 71% of ISVs noted that losing traditional-on-premises software customers to SaaS
competitors was a key motivator to enter the SaaS market.
› Increased agility and responsiveness to changing market demands. In response to increasing competitive pressures,
80% of ISVs noted that the ability to rapidly respond to changing customer and market needs was an important factor in
developing a SaaS product, with 82% highlighting the desire to launch completely new applications.
› Lower cost of application development. Seventy-seven percent of ISVs noted that high development costs associated
with on-premises software products limited what they could provide to their on-premises software customers, and 78% of
ISVs viewed SaaS development as a way to streamline software research and development (R&D) and delivery costs.
› Expansion of addressable market. SaaS pricing and ease of deployment open doors to reach new customer segments.
Eighty-five percent of ISVs viewed SaaS delivery as a way to reach new geographies; 80% saw it as a way to enter new
verticals; and 78% thought SaaS products could aid expansion into new, usually smaller company size segments.
OUTCOMES AND BENEFITS OF DEVELOPING SAAS SOLUTIONS
The decision to migrate traditional applications to SaaS rests not only on whether SaaS enablement can create enough
value to justify the costs and risks associated with the transition, but also on whether an ISV can even survive without a
SaaS solution in today’s market. Surveyed ISVs described the following outcomes from launching SaaS solutions:
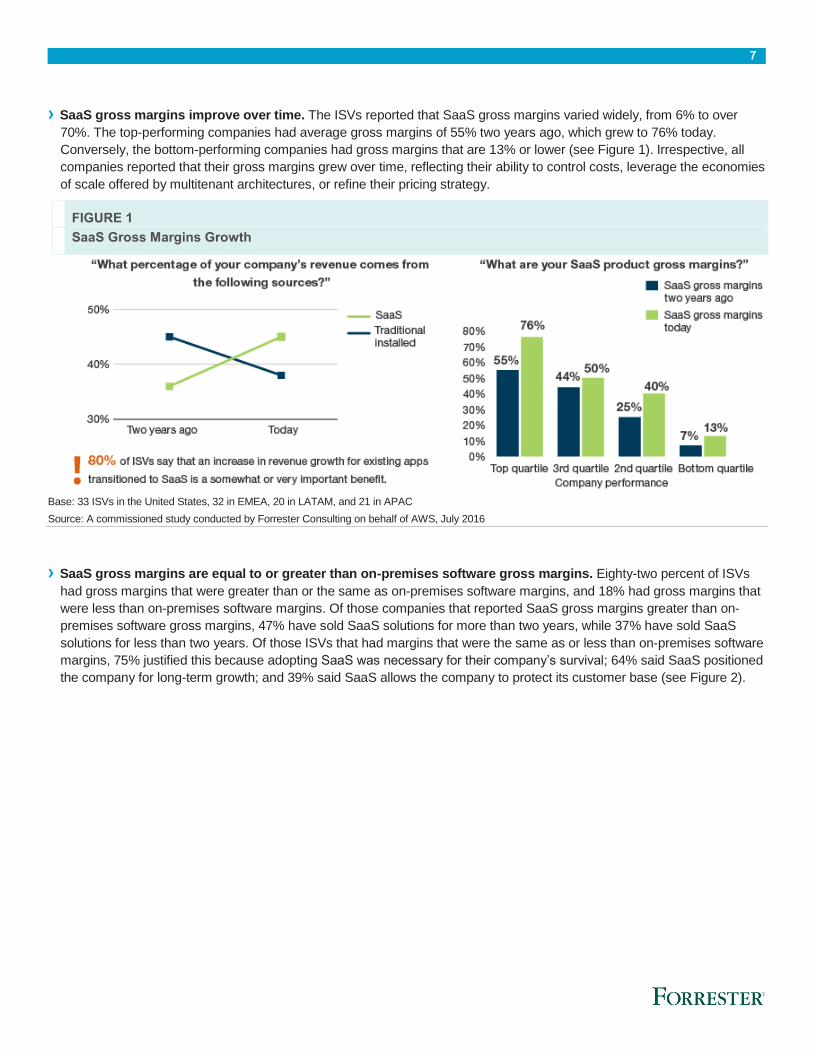
› SaaS revenues are a fast-growing portion of overall revenues. Eighty percent of ISVs said that a key benefit is an
increase in revenue growth for existing applications that were transitioned to SaaS. The ISVs reported that two years ago,
revenue from SaaS subscriptions was 36% of total company revenue, while the on-premises software share was 45%.
Today, revenue from SaaS subscriptions has grown to 45% of total revenue, surpassing the current on-premises software
share of 38%.
7
› SaaS gross margins improve over time. The ISVs reported that SaaS gross margins varied widely, from 6% to over
70%. The top-performing companies had average gross margins of 55% two years ago, which grew to 76% today.
Conversely, the bottom-performing companies had gross margins that are 13% or lower (see Figure 1). Irrespective, all
companies reported that their gross margins grew over time, reflecting their ability to control costs, leverage the economies
of scale offered by multitenant architectures, or refine their pricing strategy.
FIGURE 1
SaaS Gross Margins Growth
Base: 33 ISVs in the United States, 32 in EMEA, 20 in LATAM, and 21 in APAC
Source: A commissioned study conducted by Forrester Consulting on behalf of AWS, July 2016
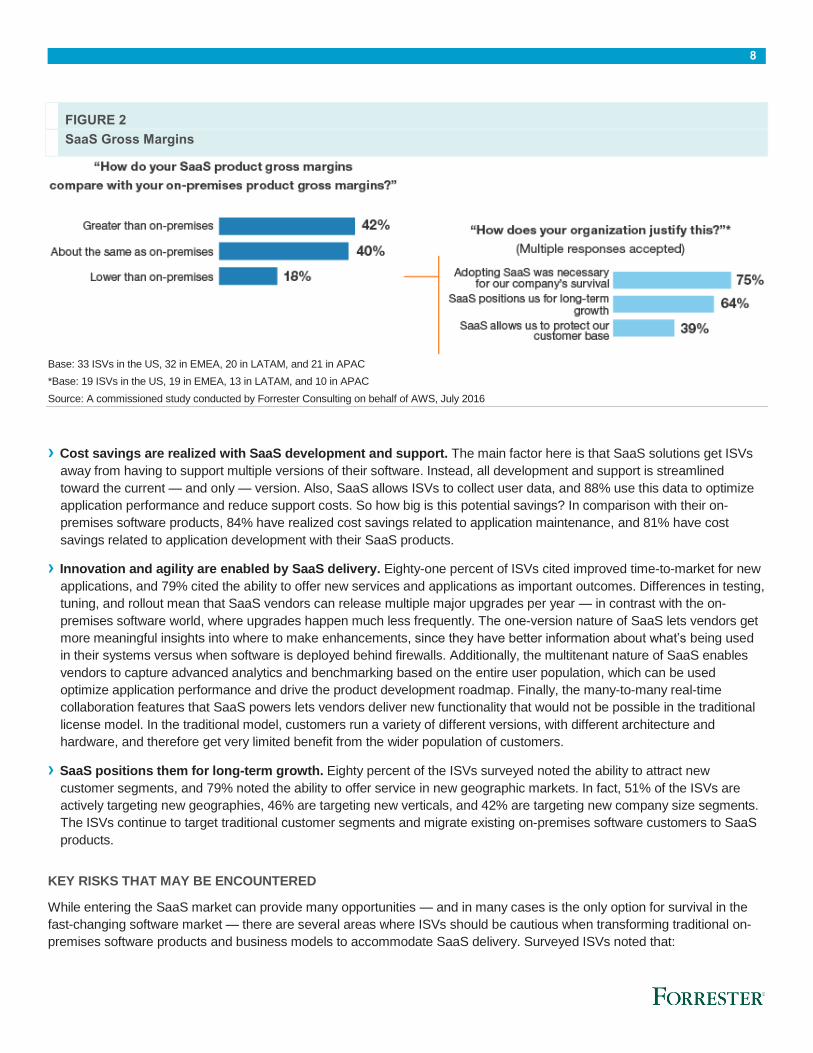
› SaaS gross margins are equal to or greater than on-premises software gross margins. Eighty-two percent of ISVs
had gross margins that were greater than or the same as on-premises software margins, and 18% had gross margins that
were less than on-premises software margins. Of those companies that reported SaaS gross margins greater than on-
premises software gross margins, 47% have sold SaaS solutions for more than two years, while 37% have sold SaaS
solutions for less than two years. Of those ISVs that had margins that were the same as or less than on-premises software
margins, 75% justified this because adopting SaaS was necessary for their company’s survival; 64% said SaaS positioned
the company for long-term growth; and 39% said SaaS allows the company to protect its customer base (see Figure 2).
8
FIGURE 2
SaaS Gross Margins
Base: 33 ISVs in the US, 32 in EMEA, 20 in LATAM, and 21 in APAC
*Base: 19 ISVs in the US, 19 in EMEA, 13 in LATAM, and 10 in APAC
Source: A commissioned study conducted by Forrester Consulting on behalf of AWS, July 2016
› Cost savings are realized with SaaS development and support. The main factor here is that SaaS solutions get ISVs
away from having to support multiple versions of their software. Instead, all development and support is streamlined
toward the current — and only — version. Also, SaaS allows ISVs to collect user data, and 88% use this data to optimize
application performance and reduce support costs. So how big is this potential savings? In comparison with their on-
premises software products, 84% have realized cost savings related to application maintenance, and 81% have cost
savings related to application development with their SaaS products.
› Innovation and agility are enabled by SaaS delivery. Eighty-one percent of ISVs cited improved time-to-market for new
applications, and 79% cited the ability to offer new services and applications as important outcomes. Differences in testing,
tuning, and rollout mean that SaaS vendors can release multiple major upgrades per year — in contrast with the on-
premises software world, where upgrades happen much less frequently. The one-version nature of SaaS lets vendors get
more meaningful insights into where to make enhancements, since they have better information about what’s being used
in their systems versus when software is deployed behind firewalls. Additionally, the multitenant nature of SaaS enables
vendors to capture advanced analytics and benchmarking based on the entire user population, which can be used
optimize application performance and drive the product development roadmap. Finally, the many-to-many real-time
collaboration features that SaaS powers lets vendors deliver new functionality that would not be possible in the traditional
license model. In the traditional model, customers run a variety of different versions, with different architecture and
hardware, and therefore get very limited benefit from the wider population of customers.
› SaaS positions them for long-term growth. Eighty percent of the ISVs surveyed noted the ability to attract new
customer segments, and 79% noted the ability to offer service in new geographic markets. In fact, 51% of the ISVs are
actively targeting new geographies, 46% are targeting new verticals, and 42% are targeting new company size segments.
The ISVs continue to target traditional customer segments and migrate existing on-premises software customers to SaaS
products.
KEY RISKS THAT MAY BE ENCOUNTERED
While entering the SaaS market can provide many opportunities — and in many cases is the only option for survival in the
fast-changing software market — there are several areas where ISVs should be cautious when transforming traditional on-
premises software products and business models to accommodate SaaS delivery. Surveyed ISVs noted that:
9
› Costs to develop SaaS products may be higher than expected. Fifty-nine percent of ISVs said that development costs
were within budget, but 38% of ISVs found that costs to develop the first minimally viable SaaS product exceeded their
planned budget. For those ISVs with older or more complex code, development costs may be relatively higher, because
more rearchitecting or rewriting may be needed. Most ISVs also have to invest a significant amount in change
management and new methods such as Agile deployment, which may be unfamiliar for the existing developer resources.
› Customers may have concerns about adopting SaaS solutions. Although 80% of the surveyed ISVs developed SaaS
solutions in response to customer demand, the ISVs reported that some customers had concerns with SaaS. Customer
concerns focused on economics, application performance, and compliance. Forty-three percent of ISVs noted customer
fears of financial lock-in with the same vendor; 40% mentioned concerns about switching from license- to subscription-
based models; and 39% said customers were concerned about total costs being too high. Forty percent of ISVs said
customers had concerns about data security, and 39% mentioned compliance and data privacy. Forty-two percent said
customers were concerned about SaaS application performance. ISVs can alleviate customer concerns by showing total
cost of ownership comparisons between SaaS and on-premises applications, and by becoming knowledgeable about the
security and compliance capabilities of their cloud provider, which can help them enhance the security of their applications.
› SaaS products may deliver lower-than-expected revenues. Some ISVs experienced lower-than-expected revenues
from their SaaS products. The reasons cited varied according to how long the ISVs had been selling SaaS solutions. For
ISVs that had been selling SaaS for one to two years, 70% cited short time-in-market, while 60% cited limited geographic
availability and feature gaps in their products. ISVs that had been selling SaaS for more than two years cited similar
reasons but in different proportions. Sixty-one percent cited features gaps in their products; 48% mentioned geographic
availability; and 45% cited competition from other SaaS vendors as reasons for lower-than-expected revenues. ISVs
should ensure that they have sufficient development resources to ensure that their initial SaaS products have enough
features to satisfy customer needs, and that they can bring these products to market in a timely manner.
THE JOURNEY TO SAAS: WHAT TO CONSIDER
Transitioning to SaaS delivery will require ISVs to re-evaluate their cost models, develop new pricing strategies, and focus on
subscription-based metrics. ISVs that are planning to make the journey to SaaS need to consider:
› Whether to rewrite or transition existing on-premises applications or to develop completely new ones. Fifty-two
percent of ISVs transitioned existing applications to SaaS products, and 41% of ISVs created newer versions or
derivatives of on-premises software products for the cloud. In addition to leveraging existing on-premises software
solutions, 80% of ISVs created completely new applications for SaaS delivery. No matter which path they choose, ISVs
should ensure that their SaaS products are optimized for the cloud and take advantage of the automation that the cloud
affords.
› What to look for in a cloud technology platform. When we asked ISVs to rank their top three priorities when selecting a
cloud technology platform provider, they indicated that their top priority was technical features and capabilities (42%).
Other top-ranked priorities included global reach at 10% and brand, security, and compliance tied at 8%.
› Whether and when to support multitenant and single-tenant deployments. Most ISVs chose either a multitenant
deployment or a mix of single and multitenant deployments. Fifty-one percent of ISVs deployed their SaaS offerings as
multitenant-only solutions, and 39% of ISVs supported both single and multitenant deployments. Over time, ISVs moved
away from supporting single-tenant and toward multitenant deployments. The number of ISVs supporting single-tenant-
only deployments dropped from 13% to 9% over two years. Single-tenant architectures are the easiest path for a
traditional ISV, but they generally won’t be able to offer the benefits that customers have come to expect from SaaS in the
long run. Multitenant architectures are what enable some of the unique customer benefits such as elasticity, many-to-many
collaboration, and seamless automatic upgrades. Additionally, multitenant architectures can result in better economies of
scale for the ISV. Less work will be involved in deploying and managing the solution if the ISV only has to make the

10
changes in one place. However, we learned that ISVs continue to support single-tenant deployments for those customers
who require it and for those for whom single tenant is a good fit.
› How to establish the appropriate budget for upfront SaaS development costs. ISVs should consult with their peers
and other developers to ascertain the work effort and required resources needed to bring their SaaS product to market
within their budget and timeframe. On average, ISVs spent 14 months developing the first minimally viable SaaS product,
but development times ranged from three months to two years.
› How to establish the appropriate pricing model and price point for the SaaS products. The surveyed ISVs took into
account many considerations when determining the right price for their product. ISVs chose one or more consumption-
based variables as part of the SaaS pricing formula. Sixty-five percent of ISVs used per-user pricing; 55% used per-
product pricing; 53% used per-location pricing; 48% used per-company pricing; and 39% chose usage-based factors (like
number of transactions), among other variables. Seventy-one percent of ISVs factored in pricing models and price points
established by competitors. ISVs should understand the elements (e.g., resource consumption) and costs that will be
reflected in the price and know how to measure these costs and elements. ISVs should also consult with their peers to
determine the appropriate pricing model.
› The metrics used to gauge the financial health of the SaaS business. ISVs track several metrics to gauge the financial
health of their SaaS business, but the emphasis on which metrics they track has changed over time. Monthly recurring
revenue (MMR) was the top metric for ISVs that had sold SaaS for one to two years. However, ISVs that had been in the
market for more than two years put comparatively greater emphasis on MMR growth (41% versus 34%) and churn rate
(37% versus 18%). This suggests that more mature SaaS ISVs understand that controlling churn is key to long-term
growth and profitability, because it’s usually less expensive to renew a contract with an existing customer than it is to
attract a new customer. The survey did not distinguish between revenue churn and customer churn, and we note that
customer churn leads to revenue churn.

11
TEI Framework And Methodology
INTRODUCTION
From the information provided in the interviews, Forrester has constructed a Total Economic Impact (TEI) framework for ISV
partners that wish to build SaaS solutions on AWS. The objective of the framework is to identify the cost, benefit, flexibility,
and risk factors that affect investment decisions.
APPROACH AND METHODOLOGY
Forrester took a multistep approach to evaluate the business case for AWS (see Figure 3). Specifically, we:
› Interviewed AWS personnel, along with Forrester analysts, to gather data relative to AWS and the marketplace for AWS.
› Interviewed 10 ISV partner organizations that are currently using Amazon Web Services and surveyed 106 ISV partner
organizations to obtain data with respect to costs, benefits, and risks.
› Designed a composite ISV based on characteristics of the interviewed and surveyed ISVs.
› Constructed a financial model representative of the interviews and survey data using the TEI methodology. The financial
model is populated with the expense and revenue data obtained from the interviews as applied to the composite ISV.
› Risk-adjusted the financial model based on issues and concerns the interviewed ISVs highlighted. Risk adjustment is a key
part of the TEI methodology. While interviewed ISVs provided expense and revenue estimates, some categories included
a broad range of responses or had a number of outside forces that might have affected the results. For that reason, some
expense and revenue figures have been risk-adjusted and are detailed in each relevant section.
Forrester employed four fundamental elements of TEI in modeling the impact of Amazon Web Services: revenues,
expenses, flexibility, and risks. Please see Appendix A for additional information on the TEI methodology.
FIGURE 3
TEI Approach
Source: Forrester Research, Inc.
Perform due diligence
Conduct ISV interviews and
survey
Design composite ISV
Construct financial
model using TEI framework
Write case study
12
The ISV Partners’ Journey
INTERVIEW HIGHLIGHTS
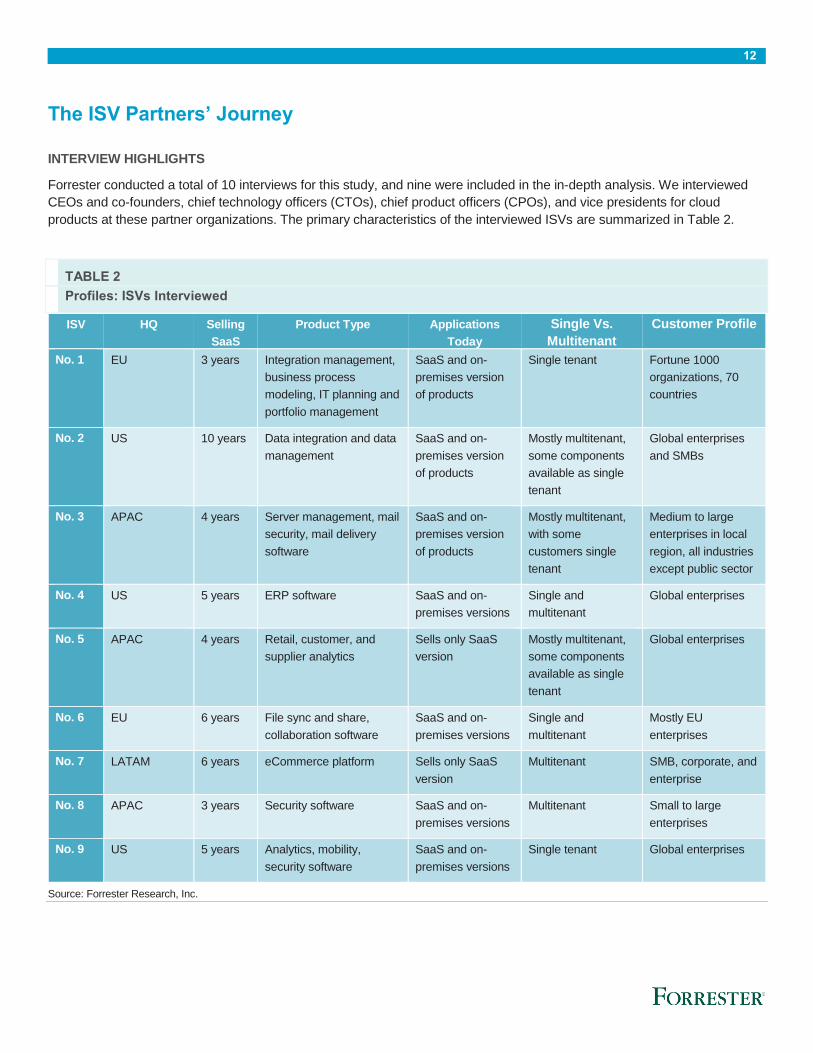
Forrester conducted a total of 10 interviews for this study, and nine were included in the in-depth analysis. We interviewed
CEOs and co-founders, chief technology officers (CTOs), chief product officers (CPOs), and vice presidents for cloud
products at these partner organizations. The primary characteristics of the interviewed ISVs are summarized in Table 2.
TABLE 2
Profiles: ISVs Interviewed
ISV HQ Selling
SaaS
Product Type Applications
Today
Single Vs.
Multitenant
Customer Profile
No. 1 EU 3 years Integration management,
business process
modeling, IT planning and
portfolio management
SaaS and on-
premises version
of products
Single tenant Fortune 1000
organizations, 70
countries
No. 2 US 10 years Data integration and data
management
SaaS and on-
premises version
of products
Mostly multitenant,
some components
available as single
tenant
Global enterprises
and SMBs
No. 3 APAC 4 years Server management, mail
security, mail delivery
software
SaaS and on-
premises version
of products
Mostly multitenant,
with some
customers single
tenant
Medium to large
enterprises in local
region, all industries
except public sector
No. 4 US 5 years ERP software SaaS and on-
premises versions
Single and
multitenant
Global enterprises
No. 5 APAC 4 years Retail, customer, and
supplier analytics
Sells only SaaS
version
Mostly multitenant,
some components
available as single
tenant
Global enterprises
No. 6 EU 6 years File sync and share,
collaboration software
SaaS and on-
premises versions
Single and
multitenant
Mostly EU
enterprises
No. 7 LATAM 6 years eCommerce platform Sells only SaaS
version
Multitenant SMB, corporate, and
enterprise
No. 8 APAC 3 years Security software SaaS and on-
premises versions
Multitenant Small to large
enterprises
No. 9 US 5 years Analytics, mobility,
security software
SaaS and on-
premises versions
Single tenant Global enterprises
Source: Forrester Research, Inc.

13
SaaS Strategy Business Drivers
The interviewed ISVs each had multiple business drivers for pursuing a SaaS version of their existing software products,
including the ability to:
› Satisfy customers’ demand for SaaS solutions. Increasing customer demand was a key motivating factor in the
decision to pursue a SaaS offering. Customers sought cloud solutions for many reasons, including ease of deployment,
consumption-based pricing, the ability to switch IT costs from capex to opex, the use of IT resources for business needs
instead of infrastructure management, and quick access to new software releases. In one instance, an ISV was told that a
cloud solution was necessary in order to be included in a customer’s RFP.
› Protect the existing customer base. Competitive pressures
from new entrants and current competitors who had SaaS
delivery options motivated some ISVs to develop their own SaaS
solutions in order to protect their market share.
› Enable access to new markets and buyers. SaaS delivery
offered the potential to enter new markets because SaaS
solutions can inherently overcome geographic boundaries and
avoid high upfront expenses associated with on-premises
software solutions. New markets include vertical industries,
companies of different size segments, and new geographies.
Additionally, within their current customer base, the interviewees
were able to sell to business users, thereby establishing new
relationships outside of IT.
› Enable a platform for rapid delivery of innovative solutions.
Cloud environments provide unique architectural capabilities that enable faster product innovation, allowing ISVs to rapidly
respond to customer needs and competitive pressures. Many interviewees stressed the need to evolve products faster
and reduce the time-to-market for new features. To increase competitive advantage, these ISVs wanted to enhance
product functionality, ease of use, and ability to capitalize on technology trends within their markets.
› Remove adoption barriers for on-premises software that requires large capital investments. Certain types of
software like data analytics or ERP often require a substantial capital investment in both hardware and software licenses in
order to enable the solution. For the ISVs whose on-premises software products required a large capital investment, SaaS
allowed customers to avoid this investment. It also offered entry into new markets (e.g., smaller customers) that were
previously unreachable.
Reasons For Choosing AWS
After making the decision to pursue a SaaS product strategy, the interviewed ISVs needed to select an appropriate
development, and cloud infrastructure platform. They noted that the right cloud provider should provide the scalability,
reliability, availability, and security to build a superior product road map while also providing better global reach than can be
achieved with an on-premises software solution.
The ISVs’ reasons for choosing Amazon Web Services were influenced by:
› Reputation and credibility. The interviewed ISVs noted the importance of AWS’ reputation as a market leader both
among their customers and in the overall IaaS market, which addresses customer concerns about the reliability of the
ISV’s hosting provider.
› Presence in local markets and overall geographic reach. AWS’ global and regional presence was important to global
ISVs that wished to offer SaaS solutions to all their customers, as well as to smaller ISVs that aspired to expand beyond
“Some of the larger deals we
won last year, if we didn’t
have a cloud-based offering,
we wouldn’t have even been
invited to the table.”
~ Vice president for cloud
14
their local or regional markets. For some ISVs, AWS was the only game in town within their local geographic market,
making AWS the obvious choice.
› Maturity of AWS’ technical capabilities and breadth of services. There was consensus across the interviewees that
the tools within AWS’ portfolio enabled faster time-to-market and provided a stable and scalable platform for growth. These
tools also help ISVs achieve high levels of automation to drive down costs. The interviewed ISVs used a broad spectrum
of AWS’ capabilities, including compute services like Amazon Elastic Compute Cloud (Amazon EC2), Auto Scaling, and
Elastic Load Balancing, storage capabilities with Amazon Simple Storage Service (Amazon S3) and Amazon CloudFront,
database services like Amazon Relational Database Service (Amazon RDS) and Amazon Redshift, and management
tools like Amazon CloudWatch. Several interviewees also noted that AWS has strong security capabilities which is critical
for their customers.
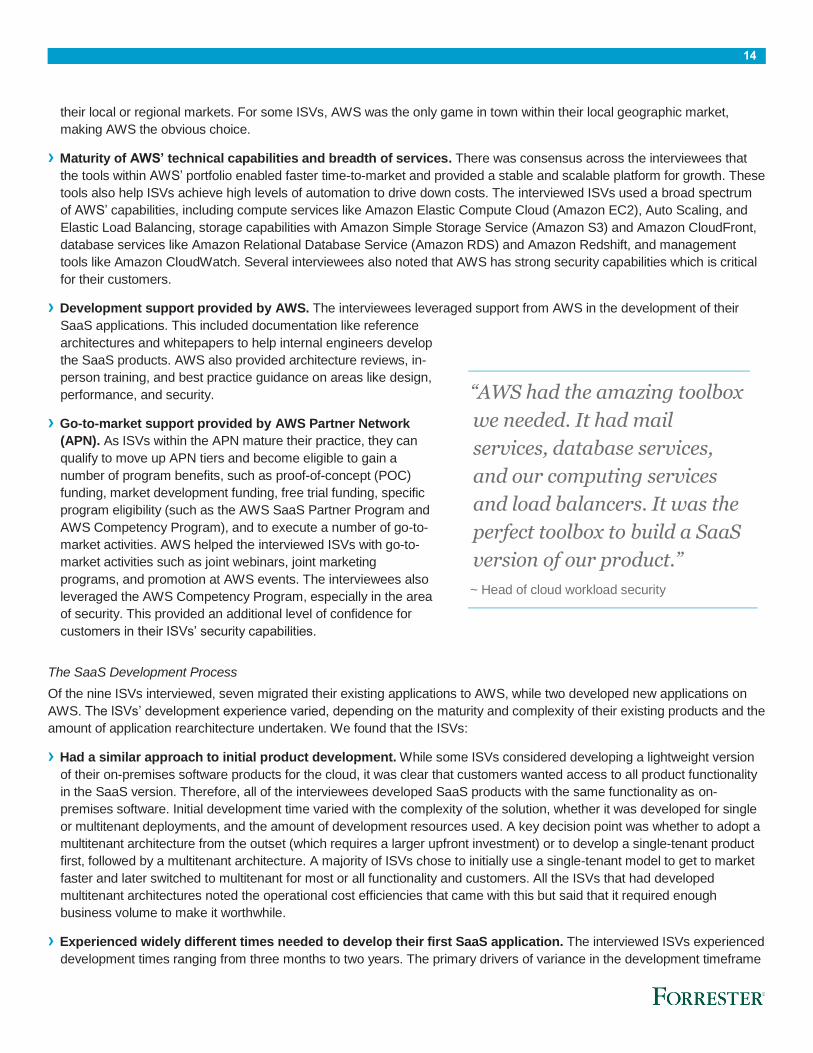
› Development support provided by AWS. The interviewees leveraged support from AWS in the development of their
SaaS applications. This included documentation like reference
architectures and whitepapers to help internal engineers develop
the SaaS products. AWS also provided architecture reviews, in-
person training, and best practice guidance on areas like design,
performance, and security.
› Go-to-market support provided by AWS Partner Network
(APN). As ISVs within the APN mature their practice, they can
qualify to move up APN tiers and become eligible to gain a
number of program benefits, such as proof-of-concept (POC)
funding, market development funding, free trial funding, specific
program eligibility (such as the AWS SaaS Partner Program and
AWS Competency Program), and to execute a number of go-to-
market activities. AWS helped the interviewed ISVs with go-to-
market activities such as joint webinars, joint marketing
programs, and promotion at AWS events. The interviewees also
leveraged the AWS Competency Program, especially in the area
of security. This provided an additional level of confidence for
customers in their ISVs’ security capabilities.
The SaaS Development Process
Of the nine ISVs interviewed, seven migrated their existing applications to AWS, while two developed new applications on
AWS. The ISVs’ development experience varied, depending on the maturity and complexity of their existing products and the
amount of application rearchitecture undertaken. We found that the ISVs:
› Had a similar approach to initial product development. While some ISVs considered developing a lightweight version
of their on-premises software products for the cloud, it was clear that customers wanted access to all product functionality
in the SaaS version. Therefore, all of the interviewees developed SaaS products with the same functionality as on-
premises software. Initial development time varied with the complexity of the solution, whether it was developed for single
or multitenant deployments, and the amount of development resources used. A key decision point was whether to adopt a
multitenant architecture from the outset (which requires a larger upfront investment) or to develop a single-tenant product
first, followed by a multitenant architecture. A majority of ISVs chose to initially use a single-tenant model to get to market
faster and later switched to multitenant for most or all functionality and customers. All the ISVs that had developed
multitenant architectures noted the operational cost efficiencies that came with this but said that it required enough
business volume to make it worthwhile.
› Experienced widely different times needed to develop their first SaaS application. The interviewed ISVs experienced
development times ranging from three months to two years. The primary drivers of variance in the development timeframe
“AWS had the amazing toolbox
we needed. It had mail
services, database services,
and our computing services
and load balancers. It was the
perfect toolbox to build a SaaS
version of our product.”
~ Head of cloud workload security
15
include product complexity, the amount of on-premises software code that requires rewriting, the completeness of features
built into the initial product, and whether a multitenant platform was developed. Similarly, the team size for the initial
development varied from three to 16 FTEs. This initial period includes design, training, development, testing, and
deployment of the first viable SaaS product.
› Invested in regular and frequent application development. Incremental development was a critical focus for all
interviewed ISVs, with interviewees deploying new releases every three to six months on average. Early ongoing
development often focused on porting additional application
functionality to the cloud and, because many ISVs chose to
deploy initially into a single-tenant environment, pursuing
additional automation to drive down costs. ISVs would also focus
on adding new features and functionality. Eventually, if they did
not do this initially, they would move most or all product
components and customers to a multitenant environment to
achieve additional cost efficiencies.
Sales Strategy
The introduction of SaaS products necessitated changes to the
sales organization. Many ISVs leveraged a mix of direct, partner,
and occasionally web sales channels. The sales changes focused
on:
› Whether the ISV continued to sell and support on-premises
software products. There was a broad range of approaches to
the sales focus after the SaaS product was introduced.
Strategies ranged from the ISV focusing sales on the on-
premises software products while letting the SaaS business grow
organically to switching its go-to-market strategy to be exclusively
SaaS. Most fell in the middle by focusing new business
development on the SaaS product while continuing to sell and support the on-premises software product in a manner that
was financially sound (the on-premises software products, which had relatively slow growth, offered a reliable high margin
revenue stream). While some cannibalization of on-premises software revenues was inevitable, the survey of 106 ISVs
found that 80% of them believed that the increase in revenue growth for existing applications that had transitioned to SaaS
was a primary benefit of offering SaaS solutions.
› The structure of the sales organization. Interviewees made a wide variety of changes to their sales organizations with
the launch of the SaaS products. Some interviewees created a separate sales force for the SaaS product with both new
hires and existing sales staff, while some used their existing sales team to sell both types of products. The use of partners
also varied: Some interviewees reduced their reliance on partners for SaaS sales and deployment because they could sell
and deploy with a direct model and earn higher margins. Others noted that they needed to engage with or develop a new
partner ecosystem for the SaaS product (they sought after partners with deep cloud experience), and that these partners
were helpful for lead generation, international expansion, technical integration, and hybrid cloud/on-premises software
deployments. Due to the ease of deployment of the SaaS product, some ISVs were able to sell direct via web channels. Of
the 106 ISVs that we surveyed, approximately 36% of SaaS revenues came from a direct sales force, 33% through Web
channels and 31% through partners.
› Sales compensation with a SaaS product. Most interviewees noted that key changes had to be made in sales
compensation plans to account for the new subscription revenue basis. Sales quotas and commission structures were
modified to fit the subscription pricing model and contract renewals. High emphasis was placed on customer retention
because the cost of renewing a customer was lower than the cost of selling to a new customer.
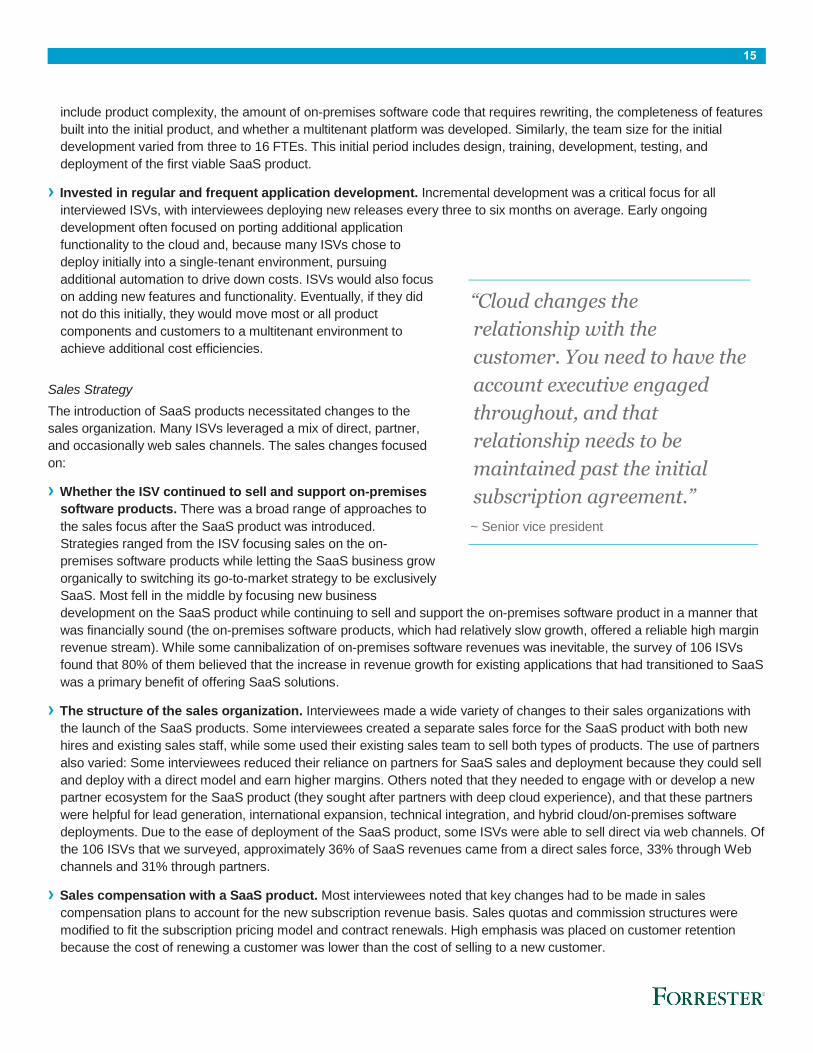
“Cloud changes the
relationship with the
customer. You need to have the
account executive engaged
throughout, and that
relationship needs to be
maintained past the initial
subscription agreement.”
~ Senior vice president

16
› Sales training appropriate for SaaS products. Because the SaaS product often had the same or similar functionality as
the on-premises software product, SaaS training focused on understanding the needs of SaaS buyers and the SaaS
deployment model. At a minimum, ISVs provided training on pricing, selling strategies, and SaaS target customers.
Operational Changes
The interviewed ISVs noted that important investments were made in operations. These include:
› Incremental investments in customer onboarding and customer relationship management. The interviewees noted
the need to ensure customer success with the SaaS product from the customer’s initial onboarding experience until
contract renewal. Customer onboarding primarily focused on coordinating activities between the deployment, migration,
and training teams to ensure smooth adoption of the SaaS
product. These ISVs noted that onboarding was much faster
with SaaS because of simplified procurement compared with
the on-premises software product. In one instance, a provider
of big data and analytics services was able to reduce
customer onboarding time from “four to six months” to “days
or weeks.” Post-deployment, the focus shifted to customer
retention and deeper account penetration. Customer support
managers focused on ensuring customers were deriving as
much value as possible from the SaaS offering, exploring
opportunities to sell more seats, and managing the overall
customer relationship.
› A new team to provide cloud infrastructure assistance.
Most interviewees established some type of SaaS-specific
operations team. This team would be responsible for technical
assistance related to cloud infrastructure, policies, and
procedures and post-sales support. Some interviewees
leveraged the existing on-premises software support team to
manage product issues while establishing a separate cloud
operations team for cloud infrastructure issues. Some ISVs
created a small team that specialized in AWS in addition to the existing operations team. Forward-looking ISVs adopted a
DevOps model. (See Appendix D for more information about DevOps).
› A cloud security expert. Some ISVs noted the importance of investing in a cloud security and compliance resource.
Some interviewees provided training to existing staff to fill this role, while others hired externally to bring in the right
knowledge to ensure that cloud products remained within desired security levels.
Key Performance Indicators
To gauge the success of the SaaS investment, the ISVs monitored several key metrics, including:
› Metrics related to value and revenues. These included metrics such as annual contract value, total contract value, and
annualized return per customer. Additionally, ISVs tracked SaaS gross margins and SaaS revenue growth. For all of the
interviewed organizations, SaaS products represented a key revenue growth area, with year-over-year growth exceeding
40%. Gross margins for SaaS products typically ranged from 40% to 70%, with higher gross margins for simpler products
like cloud security or secure cloud storage and multitenant environments. For the 106 ISVs that we surveyed, all had
experienced gross margin growth over the previous two years, and 82% had SaaS gross margins that were greater than
or the same as on-premises software margins. The top-performing ISVs had average SaaS gross margins of 76%.
“Both our direct sales and our
partner sales model has
evolved to be more in tune
with the SaaS-based offering
and pricing model. We’ve also
brought elements of customer
retention into our sales
strategy.”
~ Chief product officer

17
› Metrics describing customer retention. ISVs placed additional attention on customer retention metrics like customer
churn rate, renewal rates, and recurring revenue. These types of metrics became more important with the introduction of a
subscription-based model. Of the 106 surveyed ISVs that had been in market for more than two years, 41% said they
focused on monthly recurring revenue growth and 37% said they focused on churn rate. The survey did not distinguish
between revenue churn and customer churn, and we note that customer churn leads to revenue churn.
› Metrics that measure sales efficiency. ISVs tracked metrics related to sales efficiency, including conversion rates from
trial period to paying customer, new SaaS bookings, new tenants per week, customer acquisition costs, and sales cycle
length. Most interviewees noted that SaaS sales cycles were often 25% to 50% shorter than on-premises software sales
cycles due to faster pilots, the use of free trials, and “freemium” models. The reduction in sales cycles directly reduced
customer acquisition costs compared with on-premises software products.
› Metrics related to the usage and performance of the SaaS products. ISVs also created specific metrics to measure
SaaS usage, both at the individual user level and for product features. This was done to understand potential customer
dissatisfaction and subsequent churn. Metrics varied greatly by product type and included number of active users, user
session duration, number of active jobs, transaction value, gross merchandising value, and hours or protection provided.
Metrics were also developed that would trigger a billable event if certain thresholds were exceeded, like storage or
bandwidth.
R&D, Innovation, And Agility In A SaaS Environment
A key result of migrating applications to the cloud is the opportunity for increased innovation and agility, so most of the
interviewed ISVs allocate a significant portion of overall SaaS costs
to R&D. Ongoing development efforts are focused on three key
areas:
› Leveraging sophisticated tooling and architecture
innovation to drive down costs. ISVs consistently searched for
new ways to simplify the cloud footprint, automate processes,
and optimize AWS usage to achieve process efficiencies and
cost savings.
› Pursuing regular releases of new functionality to enhance
competitive advantage in the market. Most ISVs leveraged the
ease of deploying updates with a SaaS model to boost
competitive advantage. These ISVs could introduce new features
faster to meet evolving customer needs and more effectively fight
off competition. In one instance, an ISV was able to deliver
releases every three weeks with SaaS versus three times a year
with on-premises software. Rapid updates allowed those ISVs
that sought to be perceived as market leaders to increase the
frequency and speed of updates. Updates were usually released
on a quarterly or biannual basis, and there was much flexibility in
this. Three of the interviewed ISVs established DevOps teams for their SaaS product development and operations.
› Investing in expansion to new regions. With an on-premises software product, an ISV’s expansion to new regions could
require significant capital investment. By using a global cloud platform to deliver their products, many ISVs noted the new
opportunity for international expansion for their SaaS products. These ISVs often leveraged local partners to help sell
products in new regions.
“We’ve definitely become more
agile in terms of putting out
feature functionality, and we
typically try to do that every
quarter. We’ve accelerated the
innovation as a function of
being on the cloud.”
~ Chief technology officer

18
Analysis
THE COMPOSITE ISV
For this TEI study, Forrester has created a composite ISV to illustrate the quantifiable revenues and costs of pursuing a
SaaS strategy. The composite ISV is intended to represent a software whose customers are companies in the midmarket
and enterprise segments (companies with more than 500 employees). The company sells its software in multiple countries.
The composite ISV’s on-premises software products require customers to make an upfront investment in software licenses
and professional services in order to fully deploy the solution in the customer’s environment. The cost to the ISV of
developing and deploying software upgrades made it difficult and time-consuming to bring new features and functionality to
the market. Similarly, the cost of deploying upgrades was such that customers often skipped release cycles, which frequently
meant forgoing the benefits of new features. For these reasons, the composite ISV found that more nimble competitors with
SaaS solutions were beginning to make inroads into its core customer base.
The composite ISV decided to pursue a SaaS strategy for the following reasons:
› Respond to customer demand for new features.
› Satisfy demand for SaaS delivery from existing customers.
› Reach new geographic markets.
› Respond to competition from new market entrants.
In pursuing its SaaS strategy, the composite ISV decided to build out a multitenant platform from the outset. It understood
that this would require a larger upfront investment but would result in lower operating costs over time. The company planned
to support single-tenant deployments when customers required it.
The composite ISV’s top requirements of its SaaS hosting vendor were:
› Technical features and capabilities of the platform.
› Security features or ability to meet local compliance requirements.
› Global reach of the vendor.

19
REVENUES
The composite ISV experienced the following revenues streams that are related to the SaaS product:
Recurring Subscription Revenues And Gross Margins
From the interviews, we learned that SaaS revenue growth varied considerably from ISV to ISV. Drivers of
revenue growth under an ISV’s control were sales and marketing investment, ability to manage revenue churn,
product maturity, and each ISV’s appetite for transitioning its business model away from on-premises software to
SaaS. The timing of investments in sales, marketing, and product development also varied, driven by each ISV’s
need for growth, profitability, and product development.
In the SaaS business model, the cost of revenues (equivalent to the cost of goods sold) has two primary
components: 1) hosting and third-party expenses and 2) customer onboarding. Hosting and third-party expenses
varied widely among the interviewed ISVs and depended on the volume and variability of the hosting services
that were consumed. The onboarding expense was driven by the number of people assigned to perform these
tasks, which in turn was driven by the sales growth rate and customer support management strategy.
For the composite ISV, we assume the following:
• SaaS revenues are predominantly generated from converting existing on-premises software customers
to SaaS. This strategy yields a lower cost of sale compared with new customer sales and achieves a
faster breakeven period on a per-customer basis.
• Assumed SaaS sales growth rates are based on net-new accounts and are not accumulated recurring
revenues.
• Gross margins increase gradually over time and reach 63% after five years of operations. This is a result
of accumulating subscription revenue and the composite ISV’s ability to amortize its hosting costs over
more customers. As noted earlier, the composite ISV pursued a multitenant architecture from the outset,
which is inherently suited for driving economies of scale. We note that for the interviewed ISVs, gross
margins ranged from 40% to 70%, and these gross margins were achieved after five-plus years of selling
SaaS products.
• The revenue churn rate is 5% annually. Revenue churn rate accounts for contract non-renewals and
adjustments to the contract size during the contract period (e.g., by reducing the number of users). The
churn rate is accounted for by adjusting recurring revenues accordingly.
• Onboarding expense is commensurate with customer growth. The onboarding expense is the labor effort
needed to ensure successful solution delivery and initial adoption and usage of the SaaS product. The
onboarding expense is detailed in the Investments and Expenses section.
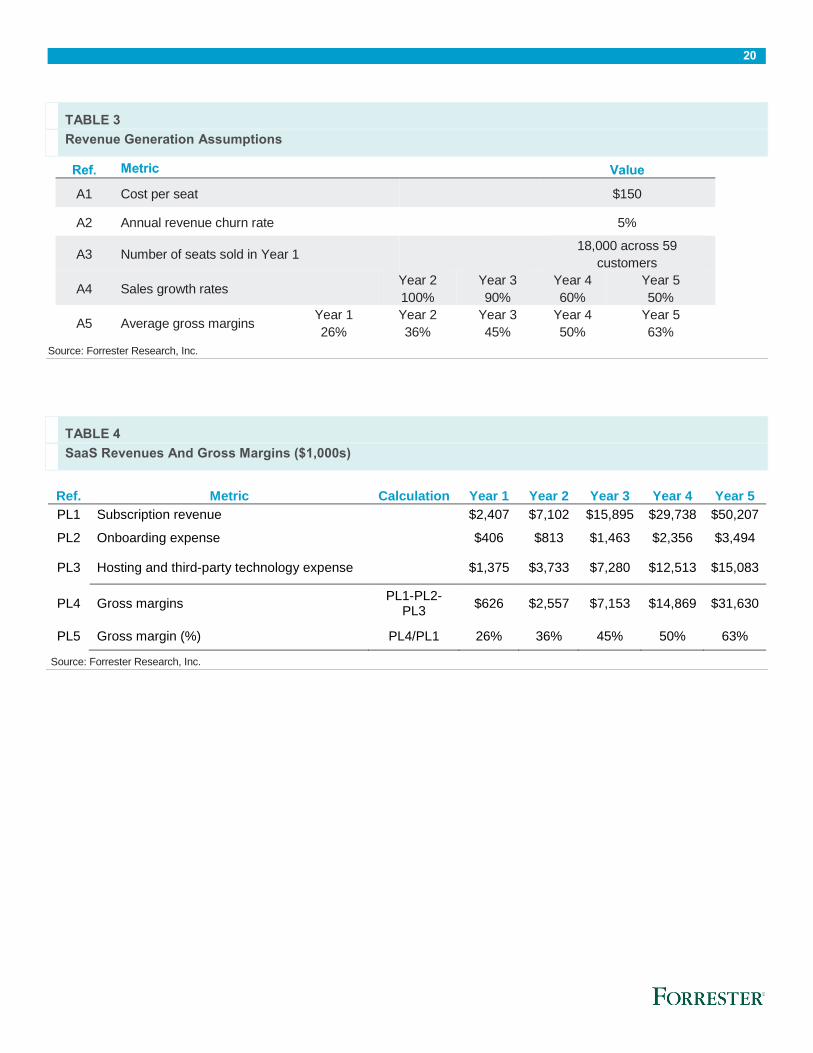
Assumptions regarding cost per seat and sales growth are shown in Table 3.
Table 4 shows the revenues and gross margins for the composite ISV’s SaaS operations. By Year 5, the
composite ISV has accumulated subscription revenues of $50.2 million.
The calculations for the recurring revenues are shown in Appendix B.
20
TABLE 3
Revenue Generation Assumptions
Ref. Metric Value
A1 Cost per seat $150
A2 Annual revenue churn rate 5%
A3 Number of seats sold in Year 1 18,000 across 59
customers
A4 Sales growth rates Year 2
100%
Year 3
90%
Year 4
60%
Year 5
50%
A5 Average gross margins Year 1
26%
Year 2
36%
Year 3
45%
Year 4
50%
Year 5
63%
Source: Forrester Research, Inc.
TABLE 4
SaaS Revenues And Gross Margins ($1,000s)
Ref. Metric Calculation Year 1 Year 2 Year 3 Year 4 Year 5
PL1 Subscription revenue $2,407 $7,102 $15,895 $29,738 $50,207
PL2 Onboarding expense $406 $813 $1,463 $2,356 $3,494
PL3 Hosting and third-party technology expense $1,375 $3,733 $7,280 $12,513 $15,083
PL4 Gross margins PL1-PL2-
PL3 $626 $2,557 $7,153 $14,869 $31,630
PL5 Gross margin (%) PL4/PL1 26% 36% 45% 50% 63%
Source: Forrester Research, Inc.

21
INVESTMENTS AND EXPENSES
The composite ISV invested in the following areas:
› Initial product development.
› Incremental product development.
› Sales and marketing.
› Customer onboarding.
› Customer support.
› Operations support.
› General and administration.
These represent the internal costs needed to develop, sell, and operate its SaaS products. A five-year summary of
investments and expenses are shown on Table 5.
TABLE 5
Total Investments And Costs ($1,000s)
Ref. Cost Category Initial Year 1 Year 2 Year 3 Year 4 Year 5
Btr Initial product development $1,406 $0 $0 $0 $0 $0
Ctr Incremental product development $0 $750 $938 $1,125 $1,125 $1,313
Dtr Sales and marketing $0 $1,358 $1,868 $2,995 $4,374 $5,810
Etr Customer onboarding $0 $406 $813 $1,463 $2,356 $3,494
Ftr Customer support $0 $335 $419 $503 $586 $670
Gtr Operations support $0 $94 $94 $94 $94 $94
Htr General and administration $0 $385 $1,136 $2,543 $4,758 $8,033
Source: Forrester Research, Inc.
Initial Product Development
22
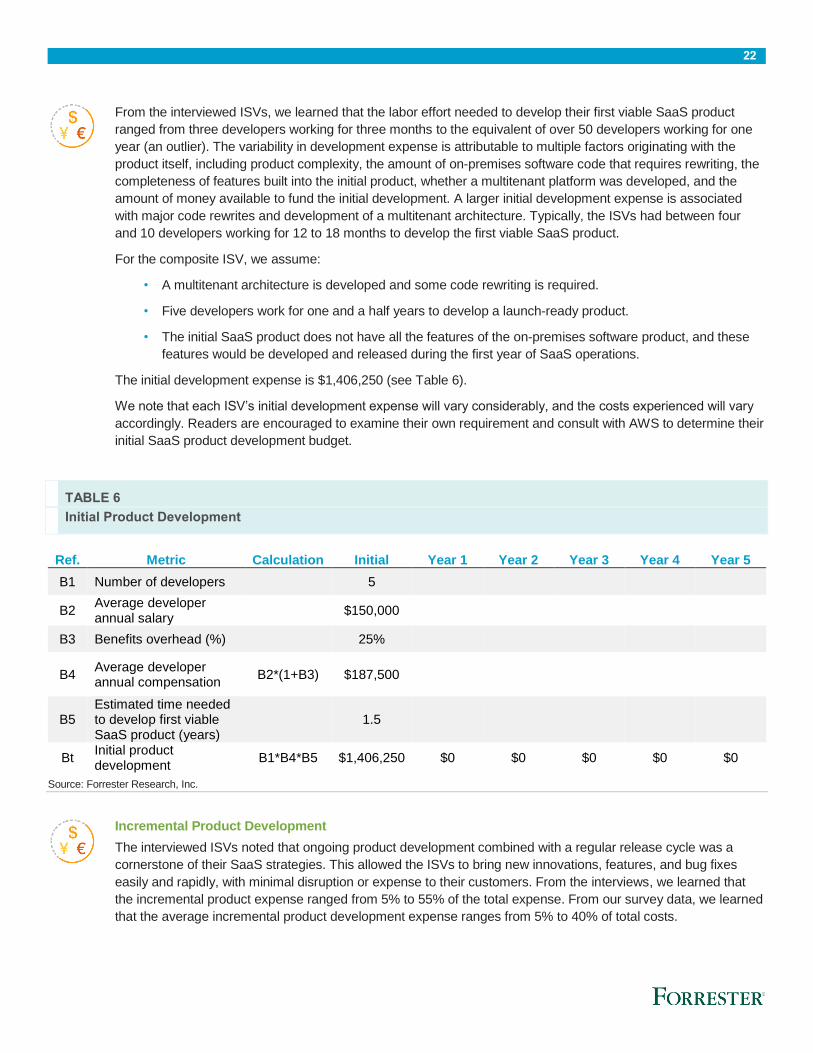
From the interviewed ISVs, we learned that the labor effort needed to develop their first viable SaaS product
ranged from three developers working for three months to the equivalent of over 50 developers working for one
year (an outlier). The variability in development expense is attributable to multiple factors originating with the
product itself, including product complexity, the amount of on-premises software code that requires rewriting, the
completeness of features built into the initial product, whether a multitenant platform was developed, and the
amount of money available to fund the initial development. A larger initial development expense is associated
with major code rewrites and development of a multitenant architecture. Typically, the ISVs had between four
and 10 developers working for 12 to 18 months to develop the first viable SaaS product.
For the composite ISV, we assume:
• A multitenant architecture is developed and some code rewriting is required.
• Five developers work for one and a half years to develop a launch-ready product.
• The initial SaaS product does not have all the features of the on-premises software product, and these
features would be developed and released during the first year of SaaS operations.
The initial development expense is $1,406,250 (see Table 6).
We note that each ISV’s initial development expense will vary considerably, and the costs experienced will vary
accordingly. Readers are encouraged to examine their own requirement and consult with AWS to determine their
initial SaaS product development budget.
TABLE 6
Initial Product Development
Ref. Metric Calculation Initial Year 1 Year 2 Year 3 Year 4 Year 5
B1 Number of developers 5
B2 Average developer annual salary
$150,000
B3 Benefits overhead (%) 25%
B4 Average developer annual compensation
B2*(1+B3) $187,500
B5 Estimated time needed to develop first viable SaaS product (years)
1.5
Bt Initial product development
B1*B4*B5 $1,406,250 $0 $0 $0 $0 $0
Source: Forrester Research, Inc.
Incremental Product Development
The interviewed ISVs noted that ongoing product development combined with a regular release cycle was a
cornerstone of their SaaS strategies. This allowed the ISVs to bring new innovations, features, and bug fixes
easily and rapidly, with minimal disruption or expense to their customers. From the interviews, we learned that
the incremental product expense ranged from 5% to 55% of the total expense. From our survey data, we learned
that the average incremental product development expense ranges from 5% to 40% of total costs.

23
For the composite ISV, we assume that the number of full-time equivalent (FTE) developers grows from four in
Year 1 of operations to seven in Year 5 of operations.
The annual incremental product development expense is shown in Table 7.
TABLE 7
Incremental Product Development
Ref. Metric Calculation Year 1 Year 2 Year 3 Year 4 Year 5
C1 Number of developers 4 5 6 6 7
C2 Developer average annual salary
$150,000 $150,000 $150,000 $150,000 $150,000
C3 Benefits overhead (%) 25% 25% 25% 25% 25%
Ct Incremental product development
C1*(C2*(1+C3)) $750,000 $937,500 $1,125,000 $1,125,000 $1,312,500
Source: Forrester Research, Inc.
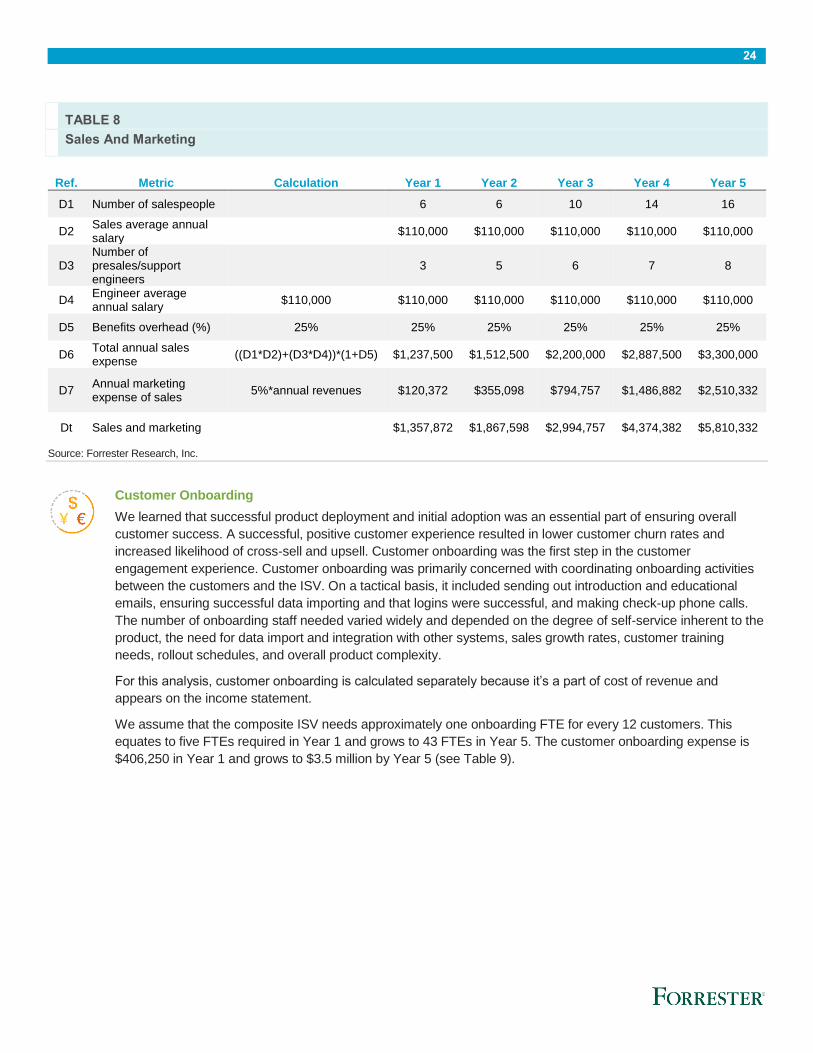
Sales And Marketing
The interviewed ISVs adopted a range of strategies to building their sales forces. These strategies included
training the existing sales force to sell all products and hiring and training a completely new sales force to sell
SaaS. The sales force composition usually had a mix of existing and new resources. The size of the sales force
varied with sales growth targets and the use of partners or other indirect channels. We note that the overall sales
and marketing expense includes the cost of the sales forces, pre-sales engineers who may be involved in selling
activities, and the marketing expense.
For the composite ISV, we assume:
• There is a sales force tasked with selling SaaS and legacy on-premises software.
• Sales required involvement of engineers working in a pre-sales role.
• The marketing expense is 5% of revenues.
The sales and marketing expense is $1.3 million in Year 1 and grows to $5.8 million by Year 5 (see Table 8).
24
TABLE 8
Sales And Marketing
Ref. Metric Calculation Year 1 Year 2 Year 3 Year 4 Year 5
D1 Number of salespeople 6 6 10 14 16
D2 Sales average annual salary
$110,000 $110,000 $110,000 $110,000 $110,000
D3 Number of presales/support engineers
3 5 6 7 8
D4 Engineer average annual salary
$110,000 $110,000 $110,000 $110,000 $110,000 $110,000
D5 Benefits overhead (%) 25% 25% 25% 25% 25% 25%
D6 Total annual sales expense
((D1*D2)+(D3*D4))*(1+D5) $1,237,500 $1,512,500 $2,200,000 $2,887,500 $3,300,000
D7 Annual marketing expense of sales
5%*annual revenues $120,372 $355,098 $794,757 $1,486,882 $2,510,332
Dt Sales and marketing $1,357,872 $1,867,598 $2,994,757 $4,374,382 $5,810,332
Source: Forrester Research, Inc.
Customer Onboarding
We learned that successful product deployment and initial adoption was an essential part of ensuring overall
customer success. A successful, positive customer experience resulted in lower customer churn rates and
increased likelihood of cross-sell and upsell. Customer onboarding was the first step in the customer
engagement experience. Customer onboarding was primarily concerned with coordinating onboarding activities
between the customers and the ISV. On a tactical basis, it included sending out introduction and educational
emails, ensuring successful data importing and that logins were successful, and making check-up phone calls.
The number of onboarding staff needed varied widely and depended on the degree of self-service inherent to the
product, the need for data import and integration with other systems, sales growth rates, customer training
needs, rollout schedules, and overall product complexity.
For this analysis, customer onboarding is calculated separately because it’s a part of cost of revenue and
appears on the income statement.
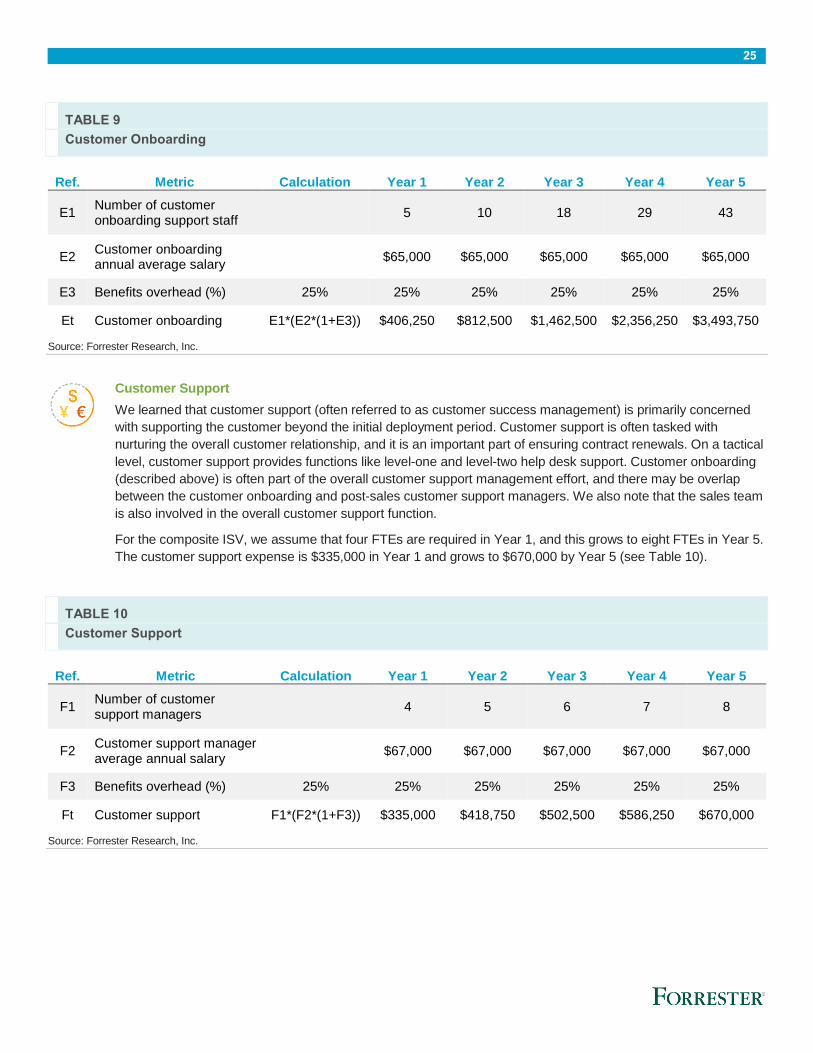
We assume that the composite ISV needs approximately one onboarding FTE for every 12 customers. This
equates to five FTEs required in Year 1 and grows to 43 FTEs in Year 5. The customer onboarding expense is
$406,250 in Year 1 and grows to $3.5 million by Year 5 (see Table 9).
25
TABLE 9
Customer Onboarding
Ref. Metric Calculation Year 1 Year 2 Year 3 Year 4 Year 5
E1 Number of customer onboarding support staff
5 10 18 29 43
E2 Customer onboarding annual average salary
$65,000 $65,000 $65,000 $65,000 $65,000
E3 Benefits overhead (%) 25% 25% 25% 25% 25% 25%
Et Customer onboarding E1*(E2*(1+E3)) $406,250 $812,500 $1,462,500 $2,356,250 $3,493,750
Source: Forrester Research, Inc.
Customer Support
We learned that customer support (often referred to as customer success management) is primarily concerned
with supporting the customer beyond the initial deployment period. Customer support is often tasked with
nurturing the overall customer relationship, and it is an important part of ensuring contract renewals. On a tactical
level, customer support provides functions like level-one and level-two help desk support. Customer onboarding
(described above) is often part of the overall customer support management effort, and there may be overlap
between the customer onboarding and post-sales customer support managers. We also note that the sales team
is also involved in the overall customer support function.
For the composite ISV, we assume that four FTEs are required in Year 1, and this grows to eight FTEs in Year 5.
The customer support expense is $335,000 in Year 1 and grows to $670,000 by Year 5 (see Table 10).
TABLE 10
Customer Support
Ref. Metric Calculation Year 1 Year 2 Year 3 Year 4 Year 5
F1 Number of customer support managers
4 5 6 7 8
F2 Customer support manager average annual salary
$67,000 $67,000 $67,000 $67,000 $67,000
F3 Benefits overhead (%) 25% 25% 25% 25% 25% 25%
Ft Customer support F1*(F2*(1+F3)) $335,000 $418,750 $502,500 $586,250 $670,000
Source: Forrester Research, Inc.

26
IT Operations
For the interviewed ISVs, operations support primarily dealt with technical operations of the SaaS platform. SaaS
operations support performed a wide range of duties, including ensuring that the production environment was
equipped with the proper level of resources and designed correctly to scale per business needs; analyzing and
resolving SaaS customer issues escalated by the customer support team; and interfacing between support and
development to help identify and troubleshoot issues and optimize the reliability, performance, and supportability
of the overall infrastructure. Staffing levels varied with scope, scale, and complexity of the infrastructure and the
presence of customized use cases in single-tenant environments.
We assume that the composite ISV needs one FTE. The annual operations support expense is $93,750 (see
Table 11). Forrester recognizes that staffing levels will vary according to each ISV’s needs and may grow over
time. We encourage readers to estimate staffing levels according to their own use case.
TABLE 11
IT Operations
Ref. Metric Calculation Year 1 Year 2 Year 3 Year 4 Year 5
G1 Number of operations support staff
1 1 1 1 1
G2 Operations support staff average annual salary
$75,000 $75,000 $75,000 $75,000 $75,000
G3 Benefits overhead (%) 25% 25% 25% 25% 25%
Gt IT operations G1*(G2*(1+G3)) $93,750 $93,750 $93,750 $93,750 $93,750
Source: Forrester Research, Inc.
General And Administration Expense
For the composite ISV, we assume that the general and administration expense is 16% of revenues. Estimates
for the general and administration expense were obtained from the 2015 Pacific Crest SaaS Survey (see
Appendix D). The annual general and administration expense is shown in Table 12.
TABLE 12
General And Administration Expense
Ref. Metric Calculation Year 1 Year 2 Year 3 Year 4 Year 5
H1 Annual revenues $2,407,443 $7,101,958 $15,895,146 $29,737,645 $50,206,647
Ht General and administration
16% $385,191 $1,136,313 $2,543,223 $4,758,023 $8,033,064
Source: Forrester Research, Inc.

27
RISKS
Forrester defines two types of risk associated with this analysis: “implementation risk” and “impact risk.” Implementation risk
is the risk that a proposed investment in the SaaS product may deviate from the original or expected requirements, resulting
in higher costs than anticipated. Impact risk refers to the risk that the business needs of the organization may not be met by
the investment in the SaaS product, resulting in lower overall total revenues and margins. The greater the uncertainty, the
wider the potential range of outcomes for cost and benefit estimates.
Quantitatively capturing implementation risk and impact risk by directly adjusting the financial estimates results provides
more meaningful and accurate estimates and a more accurate projection of the ROI. In general, risks affect costs by raising
the original estimates, and they affect benefits by reducing the original estimates. This study shows the risk-adjusted
numbers, which should be taken as “realistic” expectations since they represent the expected values considering risk.
The following impact risks that may affect revenues and margin are:
› Sales growth rates may not be achieved.
› Revenue churn rate will vary with each ISV’s ability to manage churn.
› Onboarding expenses will vary with each ISV’s needs.
The following implementation risks that may affect expenses and costs are:
› Initial and ongoing development expenses will vary with product complexity, features, and functionality, and whether a
multi- or single-tenant architecture is deployed.
› AWS expenses will vary in accordance with SaaS product functionality and the AWS resources used.
› Salaries and associated overhead rates will vary.
› Staffing levels required for each function will vary according to each ISV’s needs.

28
Amazon Web Services: Overview
Amazon Web Services (AWS) is a highly reliable, scalable, low-cost infrastructure platform in the cloud that powers over one
million customer organizations, including enterprise, government and startup businesses, in 190 countries around the world.
Launched in 2006, Amazon Web Services officially began offering developer customers access to web services — now
widely known as cloud computing — based on Amazon's own back-end technology platform.
Technology innovation has always been at the heart of the company culture, driving the growth of Amazon.com. After more
than a decade building and running the highly scalable web application, Amazon.com, the company realized it had
developed a successful core competency operating massive scale technology infrastructure and data centers and embarked
on a much broader mission to serve a new customer segment—developers and businesses—with a platform of web
services.
AWS has been continually expanding its services to support virtually any cloud workload, and it now has more than 70
services that range from compute, storage, networking, database, analytics, application services, deployment, management
and mobile.
To learn more about AWS, visit http://aws.amazon.com.

29
Appendix A: Total Economic Impact™ Overview
Total Economic Impact is a methodology developed by Forrester Research that enhances a company’s technology decision-
making processes and assists vendors in communicating the value proposition of their products and services to clients. The
TEI methodology helps companies demonstrate, justify, and realize the tangible value of IT initiatives to both senior
management and other key business stakeholders. TEI assists technology vendors in winning, serving, and retaining
customers.
The TEI methodology consists of four components to evaluate investment value: benefits, costs, flexibility, and risks.
BENEFITS
Benefits represent the value delivered to the user organization — IT and/or business units — by the proposed product or
project. Often, product or project justification exercises focus just on IT cost and cost reduction, leaving little room to analyze
the effect of the technology on the entire organization. The TEI methodology and the resulting financial model place equal
weight on the measure of benefits and the measure of costs, allowing for a full examination of the effect of the technology on
the entire organization. Calculation of benefit estimates involves a clear dialogue with the user organization to understand
the specific value that is created. In addition, Forrester also requires that there be a clear line of accountability established
between the measurement and justification of benefit estimates after the project has been completed. This ensures that
benefit estimates tie back directly to the bottom line.
COSTS
Costs represent the investment necessary to capture the value, or benefits, of the proposed project. IT or the business units
may incur costs in the form of fully burdened labor, subcontractors, or materials. Costs consider all the investments and
expenses necessary to deliver the proposed value. In addition, the cost category within TEI captures any incremental costs
over the existing environment for ongoing costs associated with the solution. All costs must be tied to the benefits that are
created.
FLEXIBILITY
Within the TEI methodology, direct benefits represent one part of the investment value. While direct benefits can typically be
the primary way to justify a project, Forrester believes that organizations should be able to measure the strategic value of an
investment. Flexibility represents the value that can be obtained for some future additional investment building on top of the
initial investment already made. For instance, an investment in an enterprise-wide upgrade of an office productivity suite can
potentially increase standardization (to increase efficiency) and reduce licensing costs. However, an embedded collaboration
feature may translate to greater worker productivity if activated. The collaboration can only be used with additional
investment in training at some future point. However, having the ability to capture that benefit has a PV that can be
estimated. The flexibility component of TEI captures that value.
RISKS
Risks measure the uncertainty of benefit and cost estimates contained within the investment. Uncertainty is measured in two
ways: 1) the likelihood that the cost and benefit estimates will meet the original projections and 2) the likelihood that the
estimates will be measured and tracked over time. TEI risk factors are based on a probability density function known as
“triangular distribution” to the values entered. At a minimum, three values are calculated to estimate the risk factor around
each cost and benefit.

30
Appendix B: SaaS Revenue Calculations
The recurring SaaS revenues calculations are shown in the table below:
RA1 Average price/seat $150
RA2Number of seats sold in
Year 116,500
RA3 Average annual churn rate 5.0%
RA4Equivalent monthly churn
rate0.43% Monthly churn = 1 - ( 1 - annual churn rate ) ̂1/12
Year 1 Year 2 Year 3 Year 4 Year 5
RA5 Annual sales growth rate 100% 90% 60% 50%
RA6 Yearly sales $2,475,000 $4,950,000 $9,405,000 $15,048,000 $22,572,000
Ref. Year 1 Calc, Jan Feb … Nov Dec
R1 Start R4 $205,370 $2,014,729 $2,211,506
R2 Net new MRR RA6/12 $206,250 $206,250 $206,250 $206,250
R3 Monthly churn (R1+R2)*RA4 $880 $1,756 $9,473 $10,313
R4 Month End MRR R1+R2-R3 $205,370 $409,865 $2,211,506 $2,407,443
Year 2 Calc, Jan Feb … Nov Dec
R5
Year 1 contract carry over
revenues R4 $2,407,443
R6 Year 2 net new sales RA6 $4,950,000
R7 Start R10 $2,407,443 $2,807,916 $6,336,165 $6,719,880
R8 Net new MRR R6/12 $412,500 $412,500 $412,500 $412,500
R9 Monthly churn (R7+R8)*RA4 $12,028 $13,736 $28,785 $30,422
R10 Month End MRR R7+R8-R9 $2,807,916 $3,206,679 $6,719,880 $7,101,958
Year 3 Calc, Jan Feb … Nov Dec
R11Years 1+2 contract carry
overR10 $7,101,958
R12 Year 3 net new sales RA6 $9,405,000
R13 Start R16 $7,101,958 $7,852,073 $14,460,757 $15,179,484
R14 Net new MRR R12/12 $783,750 $783,750 $783,750 $783,750
R15 Monthly churn (R13+R14)*RA4 $33,635 $36,835 $65,023 $68,088
R16 Month End MRR R13+R14-R15 $7,852,073 $8,598,989 $15,179,484 $15,895,146
Year 4 Calc, Jan Feb … Nov Dec
R17Years 1+2+3 contract
carry overR16 $15,895,146
R18 Year 4 net new sales RA6 $15,048,000
R19 Start R22 $15,895,146 $17,075,999 $27,479,586 $28,611,029
R20 Net new MRR R18/12 $1,254,000 $1,254,000 $1,254,000 $1,254,000
R21 Monthly churn (R19+R20)*RA4 $73,147 $78,183 $122,558 $127,384
R22 Month End MRR R19+R20-R21 $17,075,999 $18,251,816 $28,611,029 $29,737,645
Year 5 Calc, Jan Feb … Nov Dec
R23Years 1+2+3+4 contract
carry overR22 $29,737,645
R24 Year 5 net new sales RA6 $22,572,000
R25 Start R28 $29,737,645 $31,483,781 $46,867,640 $48,540,712
R26 Net new MRR R14/12 $1,881,000 $1,881,000 $1,881,000 $1,881,000
R27 Monthly churn (R25+R26)*RA4 $134,864 $142,311 $207,928 $215,065
R28 Month End MRR R25+R26-R27 $31,483,781 $33,222,470 $48,540,712 $50,206,647

31
Appendix C: Glossary
Discount rate: The interest rate used in cash flow analysis to take into account the time value of money. Companies set
their own discount rate based on their business and investment environment. Forrester assumes a yearly discount rate of
10% for this analysis. Organizations typically use discount rates between 8% and 16% based on their current environment.
Readers are urged to consult their respective organizations to determine the most appropriate discount rate to use in their
own environment.
Net present value (NPV): The present or current value of (discounted) future net cash flows given an interest rate (the
discount rate). A positive project NPV normally indicates that the investment should be made, unless other projects have
higher NPVs.
Present value (PV): The present or current value of (discounted) cost and benefit estimates given at an interest rate (the
discount rate). The PV of costs and benefits feed into the total NPV of cash flows.
Payback period: The breakeven point for an investment. This is the point in time at which net benefits (benefits minus costs)
equal initial investment or cost.
Return on investment (ROI): A measure of a project’s expected return in percentage terms. ROI is calculated by dividing
net benefits (benefits minus costs) by costs.

32
Appendix D: Supplemental Material
Related Forrester Research
The estimate for enterprise adoption of SaaS applications was obtained from the following Forrester Research report:
“Application Adoption Trends 2016: SaaS Expands Across The Enterprise And Across The Globe,” Forrester Research, Inc.,
March 30, 2016
Online Resources
Estimates for general and administration expenses were taken from the 2015 Pacific Crest SaaS Survey, which can be
found at http://www.forentrepreneurs.com/2015-saas-survey-part-2/.
More information about DevOps may be found at https://aws.amazon.com/devops/.