the jobs crisis and stimulus policy lawrence mishel president, epi
TRANSCRIPT
The Jobs Crisis and Stimulus Policy
Lawrence MishelPresident, EPI
www.epinet.org
Recession: Costing Jobs and Wages, Generating
Inequality• Employment losses are steep.• Unemployment will continue to grow.• Particular groups have been hit hard.• Recession has resulted in wage and
income losses.• Recession has renewed growth of
inequality.
A jobless recovery
• Jobs down 2 million since recession began.
• Greater job loss than in earlier recessions.
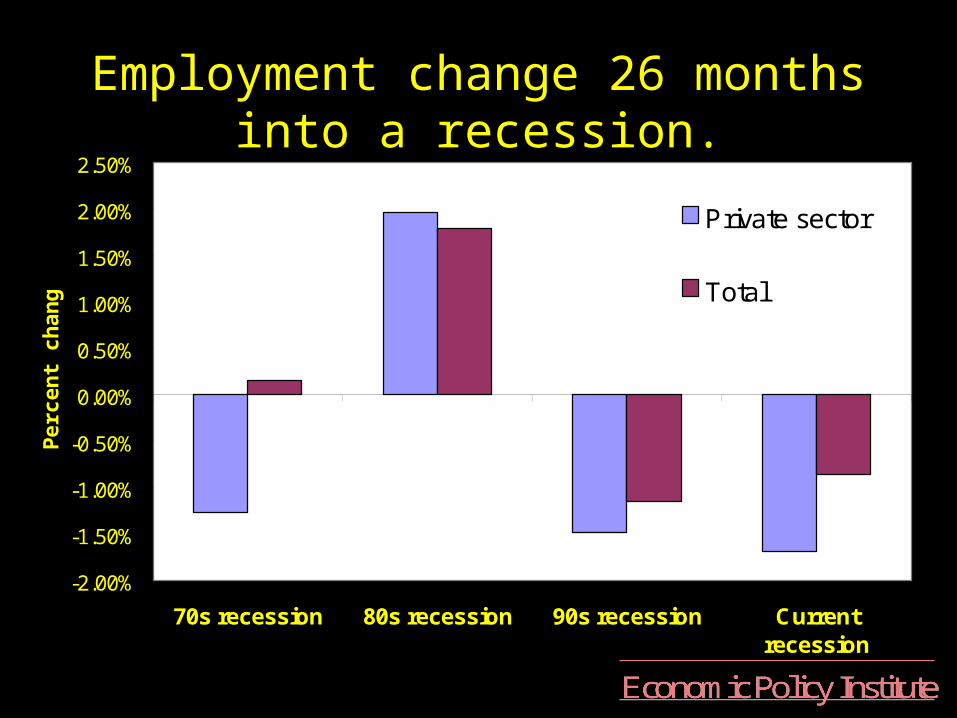
Employment change 26 months into a recession.
-2.00%
-1.50%
-1.00%
-0.50%
0.00%
0.50%
1.00%
1.50%
2.00%
2.50%
70s recession 80s recession 90s recession Currentrecession
Per
cen
t ch
ang
e
Private sector
Total
•Unemployment up from 3.9% to 6.0%
•Labor force growing minimally
Source: Mishel, Lawrence, Jared Bernstein, and Heather Boushey. 2003. The State of Working America 2002-03. Cornell University Press.
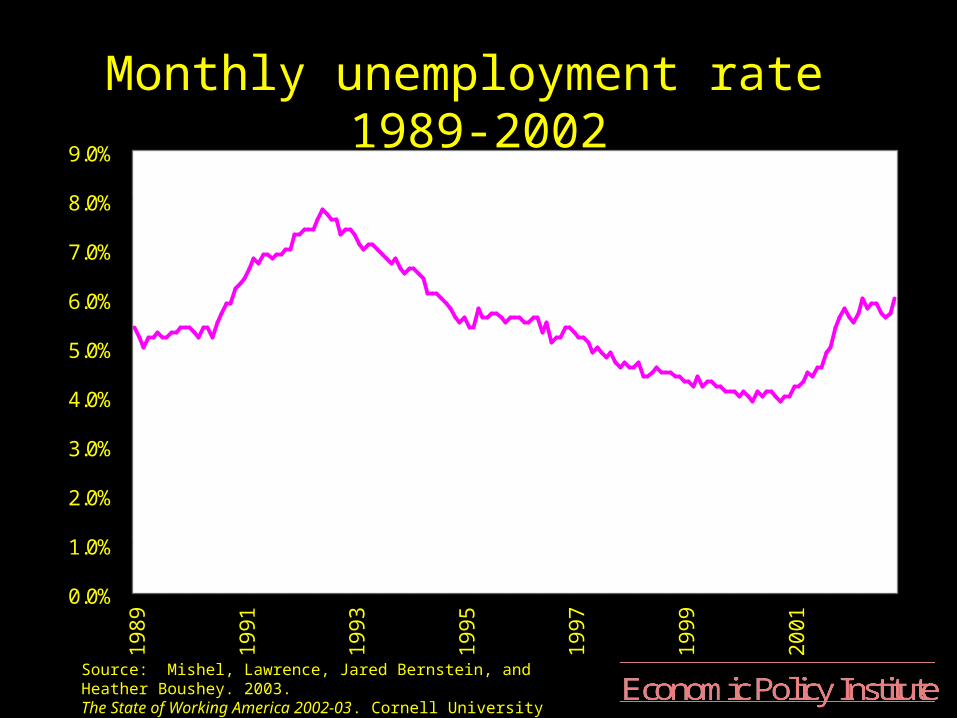
Monthly unemployment rate 1989-2002
0.0%
1.0%
2.0%
3.0%
4.0%
5.0%
6.0%
7.0%
8.0%
9.0%19
89
1991
1993
1995
1997
1999
2001

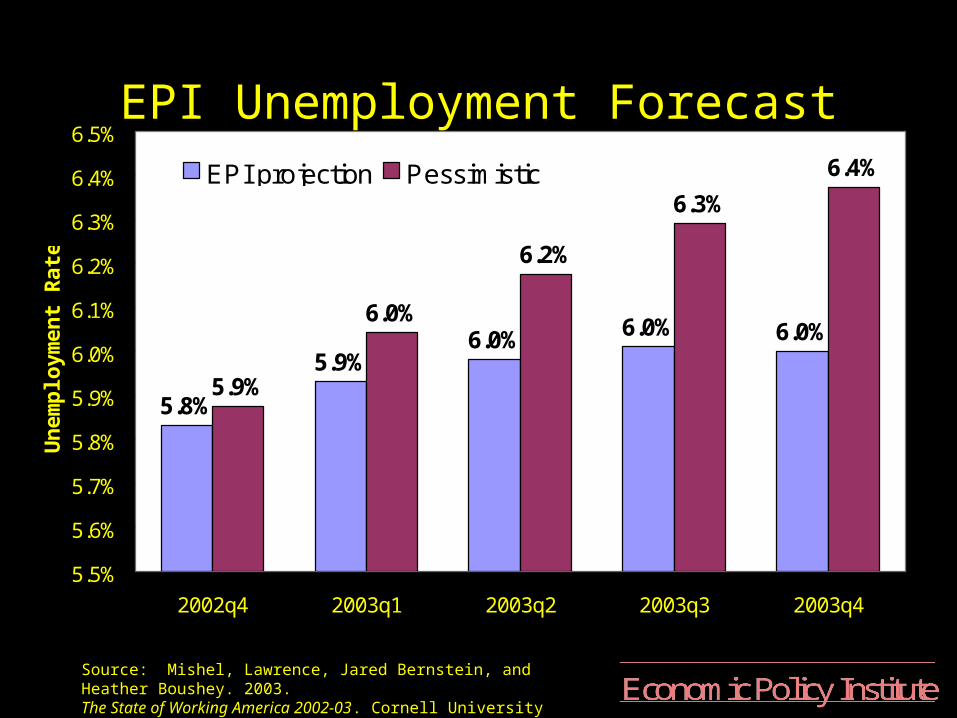
Unemployment will stay high throughout
2003.
Source: Mishel, Lawrence, Jared Bernstein, and Heather Boushey. 2003. The State of Working America 2002-03. Cornell University Press.
EPI Unemployment Forecast
5.8%
5.9%6.0% 6.0% 6.0%
5.9%
6.0%
6.2%
6.3%
6.4%
5.5%
5.6%
5.7%
5.8%
5.9%
6.0%
6.1%
6.2%
6.3%
6.4%
6.5%
2002q4 2003q1 2003q2 2003q3 2003q4
Un
emp
loym
ent
Rat
e
EPI projection Pessimistic
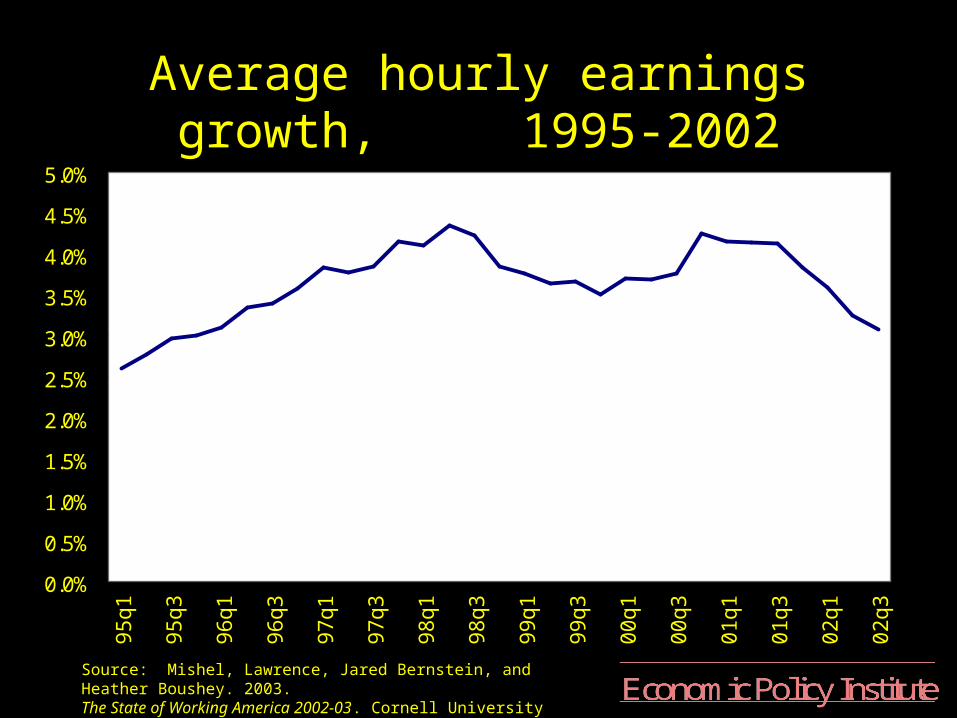
Wage Growth: Slowest rate since mid-1990s
Source: Mishel, Lawrence, Jared Bernstein, and Heather Boushey. 2003. The State of Working America 2002-03. Cornell University Press.
Average hourly earnings growth, 1995-2002
0.0%
0.5%
1.0%
1.5%
2.0%
2.5%
3.0%
3.5%
4.0%
4.5%
5.0%
95q1
95q3
96q1
96q3
97q1
97q3
98q1
98q3
99q1
99q3
00q1
00q3
01q1
01q3
02q1
02q3
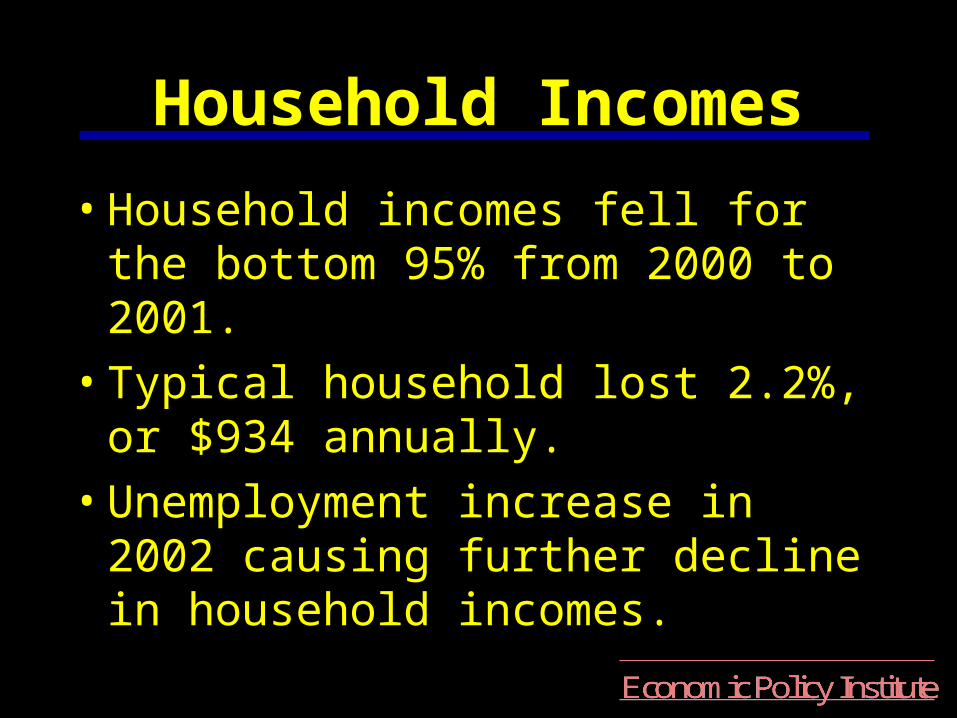
• Household incomes fell for the bottom 95% from 2000 to 2001.
• Typical household lost 2.2%, or $934 annually.
• Unemployment increase in 2002 causing further decline in household incomes.
Household Incomes
Source: Mishel, Lawrence, Jared Bernstein, and Heather Boushey. 2003. The State of Working America 2002-03. Cornell University Press.
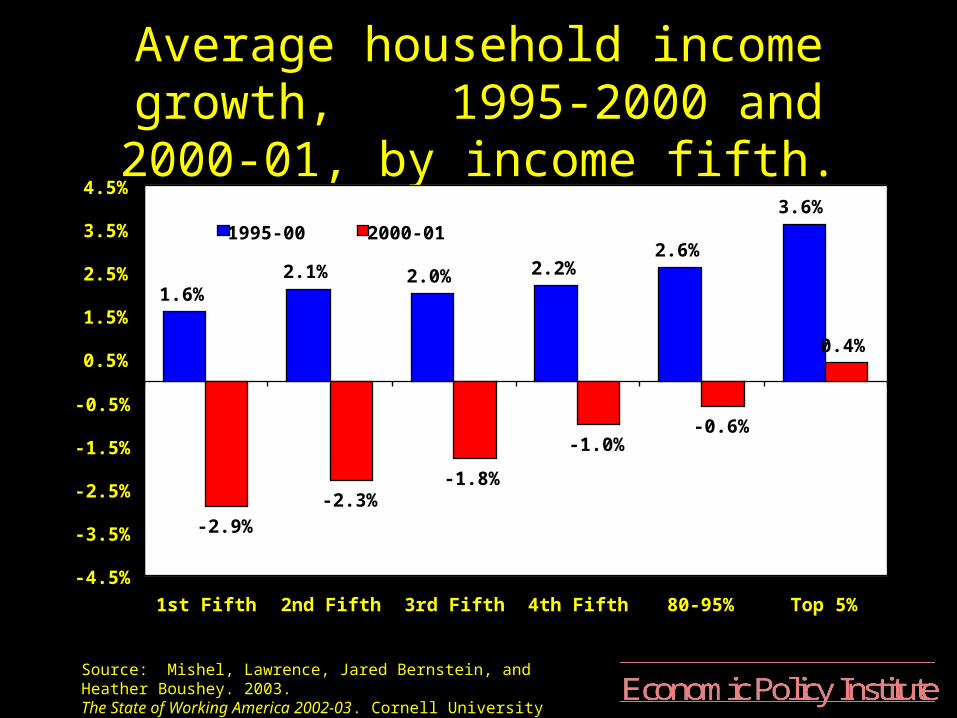
Average household income growth, 1995-2000 and 2000-01, by income fifth.
1.6%2.1% 2.0% 2.2%
2.6%
3.6%
-2.9%
-2.3%-1.8%
-1.0%-0.6%
0.4%
-4.5%
-3.5%
-2.5%
-1.5%
-0.5%
0.5%
1.5%
2.5%
3.5%
4.5%
1st Fifth 2nd Fifth 3rd Fifth 4th Fifth 80-95% Top 5%
1995-00 2000-01

CRITERIA FOR EFFECTIVE STIMULUS
1. Generate Growth and Jobs
• Create more customers (i.e., demand)--consumers & government.
• With unused capacity, investment incentives are ineffective.
• Spending is more stimulative than tax cuts.
• Tax cuts are a more immediate stimulus.
2. Be Fiscally Responsible
• Temporary tax cuts
• Temporary spending
• Leave long-term fiscal balance untouched
• Permanent measures unnecessary
3. Timing
• Economy needs some immediate stimulus.
• Impact of stimulus must be felt over the next 15 to 18 months.
Source: Mishel, Lawrence, Jared Bernstein, and Heather Boushey. 2003. The State of Working America 2002-03. Cornell University Press.
4. Stimulus must be fair
• Should lessen, not exacerbate inequalities.
Source: Mishel, Lawrence, Jared Bernstein, and Heather Boushey. 2003. The State of Working America 2002-03. Cornell University Press.
5. Stimulus should target currently existing
unmet needs
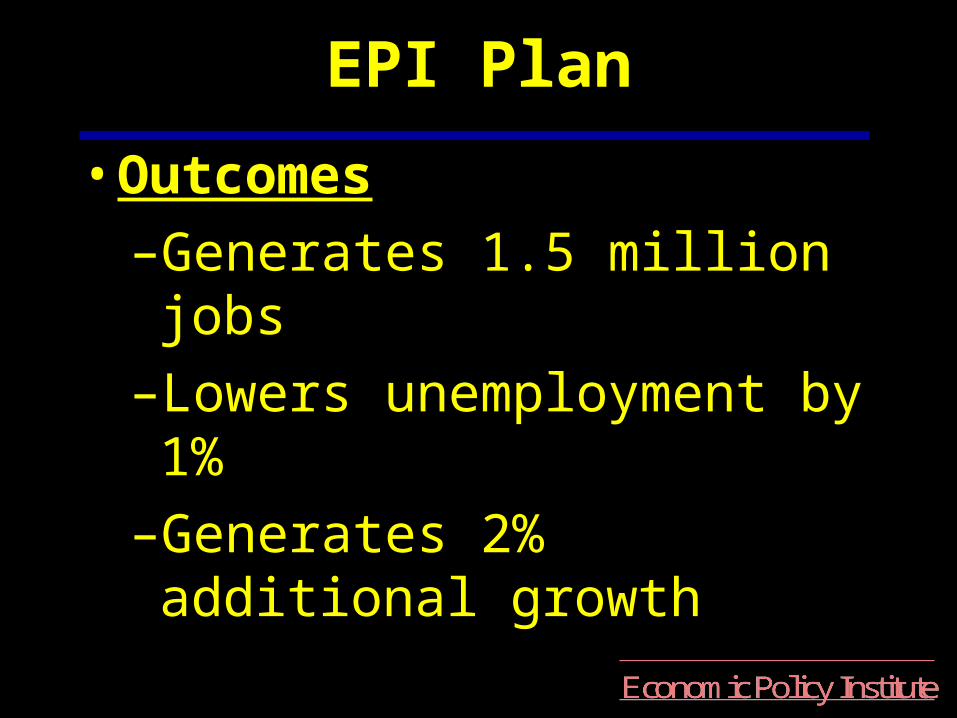
EPI Plan
• Outcomes
–Generates 1.5 million jobs
–Lowers unemployment by 1%
–Generates 2% additional growth
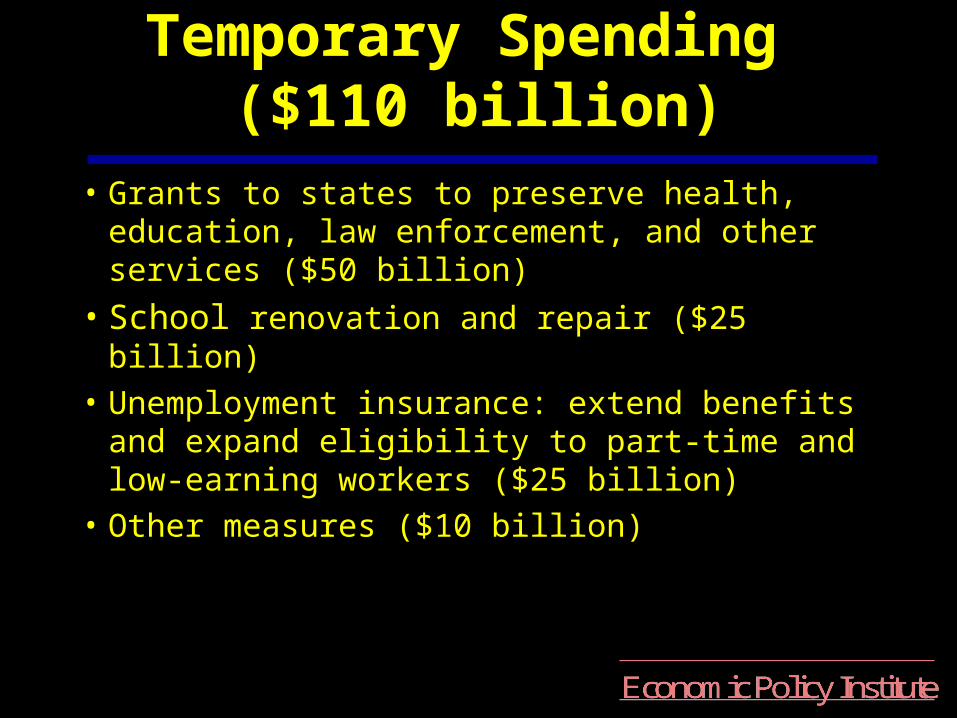
Temporary Spending ($110 billion)
• Grants to states to preserve health, education, law enforcement, and other services ($50 billion)
• School renovation and repair ($25 billion)
• Unemployment insurance: extend benefits and expand eligibility to part-time and low-earning workers ($25 billion)
• Other measures ($10 billion)
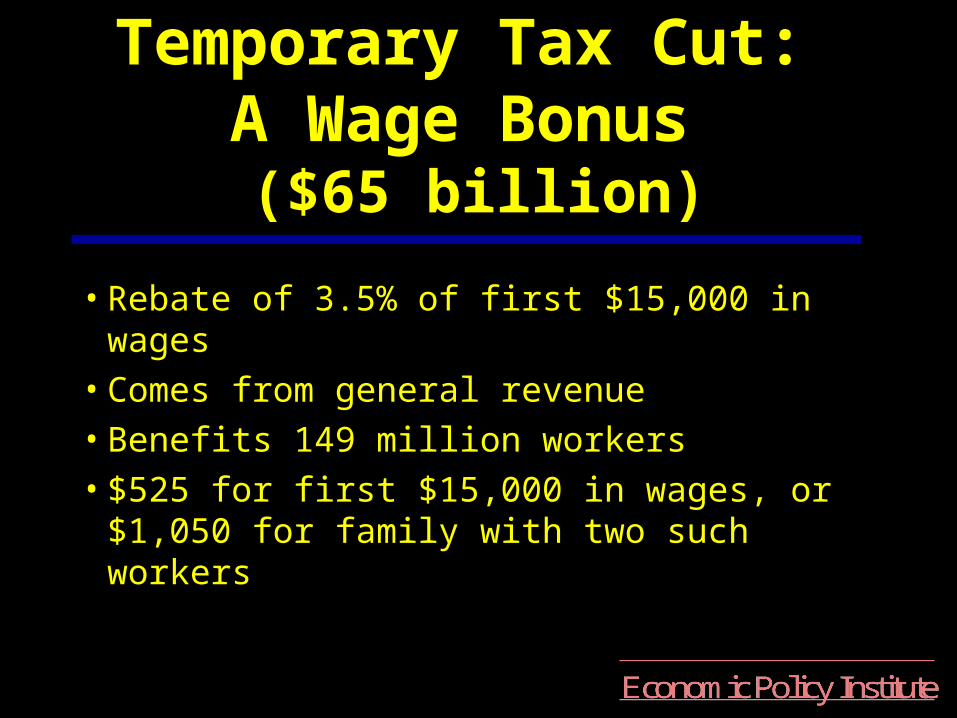
Temporary Tax Cut: A Wage Bonus
($65 billion)
• Rebate of 3.5% of first $15,000 in wages
• Comes from general revenue
• Benefits 149 million workers
• $525 for first $15,000 in wages, or $1,050 for family with two such workers