the johns hopkins university applied physics laboratory shine 2005, july 11-15, 2005 transient...
TRANSCRIPT
The Johns Hopkins UniversityApplied Physics Laboratory SHINE 2005, July 11-15, 2005SHINE 2005, July 11-15, 2005
Transient Shocks and Associated Transient Shocks and Associated Energetic Particle Events Observed Energetic Particle Events Observed
by ACE during Solar Cycle 23by ACE during Solar Cycle 23
George C. HoGeorge C. Ho11, David Lario, David Lario11, Robert B. Decker, Robert B. Decker11, Mihir I. Desai, Mihir I. Desai22, , Qiang HuQiang Hu33, Justin Kasper, Justin Kasper44
11The Johns Hopkins UniversityThe Johns Hopkins University Applied Physics Laboratory, Applied Physics Laboratory, 22Southwest Research InstituteSouthwest Research Institute
33Institute of Geophysics and Planetary Physics, University of California at RiversideInstitute of Geophysics and Planetary Physics, University of California at Riverside44Center for Space Research, MITCenter for Space Research, MIT
Acknowledgement: The work at JHU/APL is supported under NASA grant NNG04GA84G

The Johns Hopkins UniversityApplied Physics Laboratory SHINE 2005, July 11-15, 2005SHINE 2005, July 11-15, 2005
Outline
• Introduction• ACE ESP events survey
– Time-intensity profiles
– Spectral evolution– Spectral profiles
• Selected ACE/Wind ESP events
• Summary

The Johns Hopkins UniversityApplied Physics Laboratory SHINE 2005, July 11-15, 2005SHINE 2005, July 11-15, 2005
Energetic Storm Particle (ESP) Events
Energetic Storm Particle (ESP) events are increases of energetic charged particle intensities that are observed upstream and downstream of interplanetary (IP) shocks. ESP events are observed most commonly in ion intensities and have time scales ~hours.
The energetic particle signatures of ESP events have been studied extensively during the 80s (Tsurutani and Lin, 1985; van Nes et al., 1984; Scholer, 1988; Decker, 1981; etc.). Lee [1983] modeled the energetic particles within ESP events with a diffusive shock acceleration model at a quasi-parallel shock, while Decker [1983] successfully applied the shock drift model to explain the shock-spike events.

The Johns Hopkins UniversityApplied Physics Laboratory SHINE 2005, July 11-15, 2005SHINE 2005, July 11-15, 2005
Time-intensity Profiles of SEP and ESP
Reames, 1999

The Johns Hopkins UniversityApplied Physics Laboratory SHINE 2005, July 11-15, 2005SHINE 2005, July 11-15, 2005
SEP and ESP During Cycle 22
Reames, 1999
The Johns Hopkins UniversityApplied Physics Laboratory SHINE 2005, July 11-15, 2005SHINE 2005, July 11-15, 2005
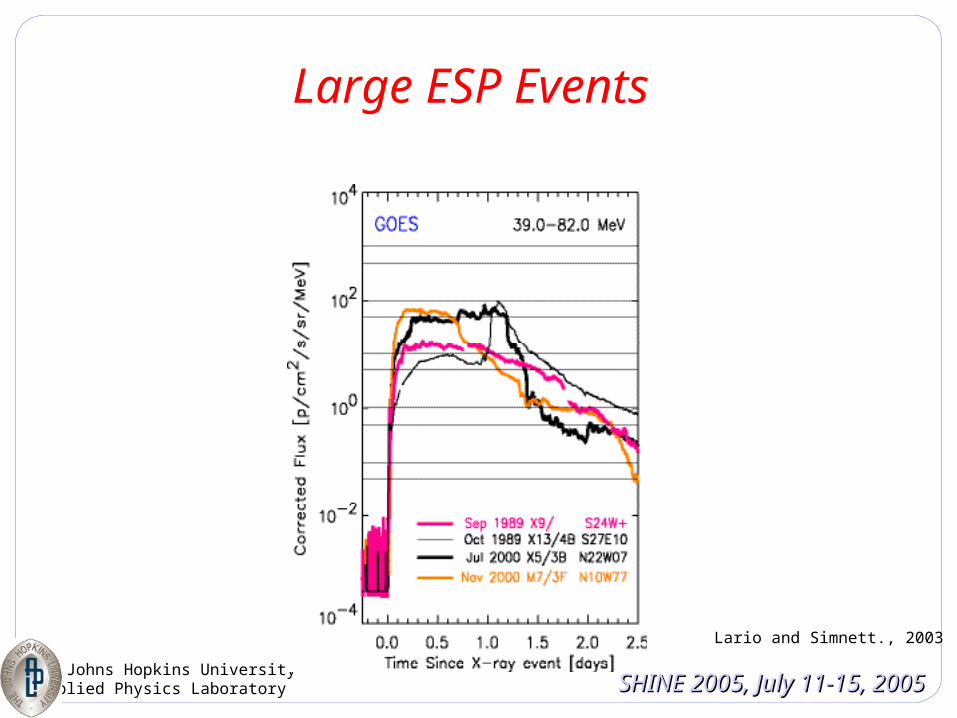
Large ESP Events
Lario and Simnett., 2003
The Johns Hopkins UniversityApplied Physics Laboratory SHINE 2005, July 11-15, 2005SHINE 2005, July 11-15, 2005
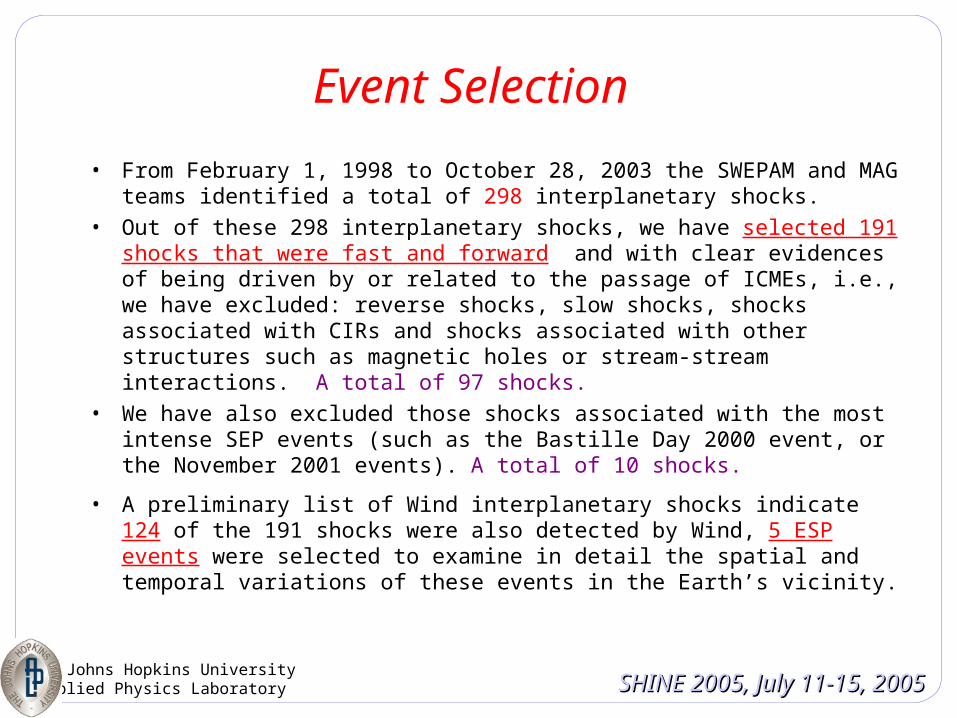
Event Selection
• From February 1, 1998 to October 28, 2003 the SWEPAM and MAG teams identified a total of 298 interplanetary shocks.
• Out of these 298 interplanetary shocks, we have selected 191 shocks that were fast and forward and with clear evidences of being driven by or related to the passage of ICMEs, i.e., we have excluded: reverse shocks, slow shocks, shocks associated with CIRs and shocks associated with other structures such as magnetic holes or stream-stream interactions. A total of 97 shocks.
• We have also excluded those shocks associated with the most intense SEP events (such as the Bastille Day 2000 event, or the November 2001 events). A total of 10 shocks.
• A preliminary list of Wind interplanetary shocks indicate 124 of the 191 shocks were also detected by Wind, 5 ESP events were selected to examine in detail the spatial and temporal variations of these events in the Earth’s vicinity.

The Johns Hopkins UniversityApplied Physics Laboratory SHINE 2005, July 11-15, 2005SHINE 2005, July 11-15, 2005
Classification of the 191 ESP events Classification of the 191 ESP events according to their intensity-time profileaccording to their intensity-time profile
63% IP shocks accelerated >47 keV ions32% IP shocks accelerated >2 MeV ions20% IP shocks accelerated >38 keV e-
The Johns Hopkins UniversityApplied Physics Laboratory SHINE 2005, July 11-15, 2005SHINE 2005, July 11-15, 2005
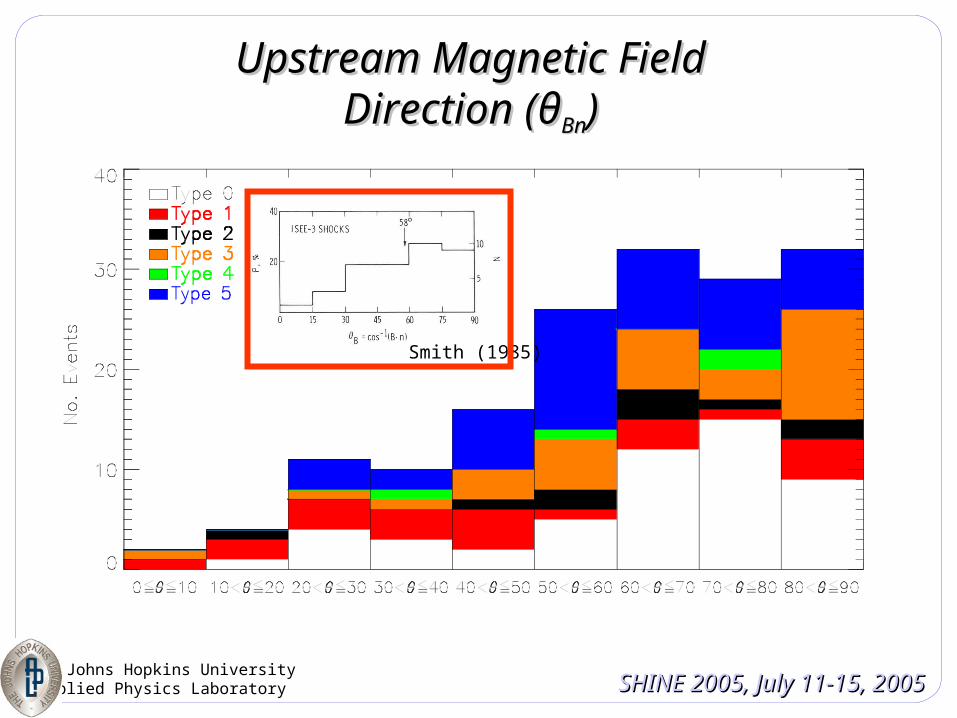
Upstream Magnetic Field Upstream Magnetic Field Direction (Direction (θθBnBn))
Smith (1985)
The Johns Hopkins UniversityApplied Physics Laboratory SHINE 2005, July 11-15, 2005SHINE 2005, July 11-15, 2005Vs
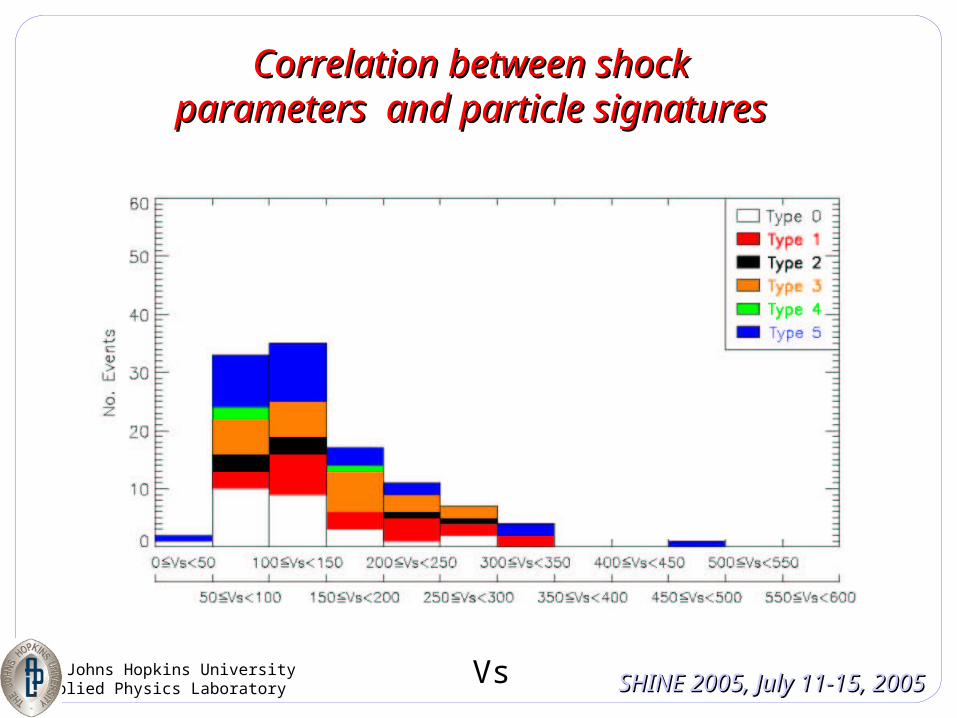
Correlation between shock parameters Correlation between shock parameters and particle signaturesand particle signatures

The Johns Hopkins UniversityApplied Physics Laboratory SHINE 2005, July 11-15, 2005SHINE 2005, July 11-15, 2005MA
Correlation between shock parameters Correlation between shock parameters and particle signaturesand particle signatures

The Johns Hopkins UniversityApplied Physics Laboratory SHINE 2005, July 11-15, 2005SHINE 2005, July 11-15, 2005
rn
Correlation between shock parameters Correlation between shock parameters and particle signaturesand particle signatures

The Johns Hopkins UniversityApplied Physics Laboratory SHINE 2005, July 11-15, 2005SHINE 2005, July 11-15, 2005

The Johns Hopkins UniversityApplied Physics Laboratory SHINE 2005, July 11-15, 2005SHINE 2005, July 11-15, 2005
Correlation between shock parameters Correlation between shock parameters and particle signaturesand particle signatures

The Johns Hopkins UniversityApplied Physics Laboratory SHINE 2005, July 11-15, 2005SHINE 2005, July 11-15, 2005
Correlation between shock parameters Correlation between shock parameters and particle signaturesand particle signatures

The Johns Hopkins UniversityApplied Physics Laboratory SHINE 2005, July 11-15, 2005SHINE 2005, July 11-15, 2005
Magnetic field power spectrum
pc = proton gyrofrequency
Normalized magnetic helicity spectrum
1300-1448 UT
297/2003

The Johns Hopkins UniversityApplied Physics Laboratory SHINE 2005, July 11-15, 2005SHINE 2005, July 11-15, 2005
Ambient, shock and peak spectraAmbient, shock and peak spectra

The Johns Hopkins UniversityApplied Physics Laboratory SHINE 2005, July 11-15, 2005SHINE 2005, July 11-15, 2005
Correlation between ambient and Correlation between ambient and peak spectrapeak spectra
The Johns Hopkins UniversityApplied Physics Laboratory SHINE 2005, July 11-15, 2005SHINE 2005, July 11-15, 2005
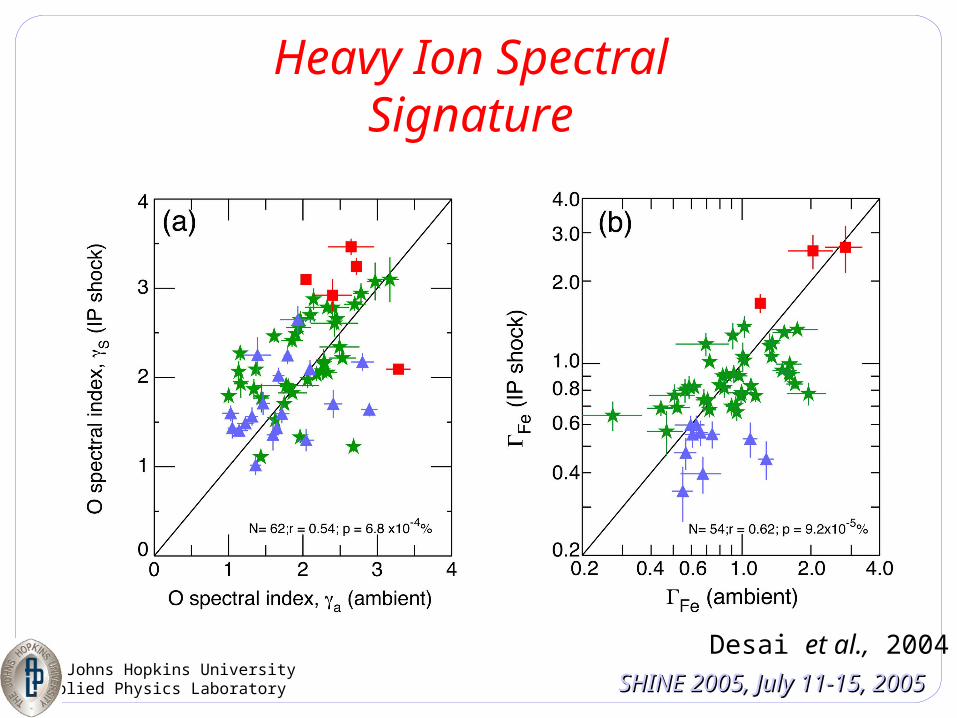
Heavy Ion Spectral Signature
Desai et al., 2004

The Johns Hopkins UniversityApplied Physics Laboratory SHINE 2005, July 11-15, 2005SHINE 2005, July 11-15, 2005
ACE Wind LocationsACE Wind Locations
128 events
-500
-400
-300
-200
-100
0
100
200
300
400
500
Y-GSE (R
E)
250200150100500-50-100
X-GSE (RE)
ACE Wind
#1
#2
#3
#4
#5

The Johns Hopkins UniversityApplied Physics Laboratory SHINE 2005, July 11-15, 2005SHINE 2005, July 11-15, 2005
March 18, 2002 (DOY 77)
#1

The Johns Hopkins UniversityApplied Physics Laboratory SHINE 2005, July 11-15, 2005SHINE 2005, July 11-15, 2005
April 23, 2003 (DOY 113)
#2

The Johns Hopkins UniversityApplied Physics Laboratory SHINE 2005, July 11-15, 2005SHINE 2005, July 11-15, 2005
July 17, 2002 (DOY 198)
#4
The Johns Hopkins UniversityApplied Physics Laboratory SHINE 2005, July 11-15, 2005SHINE 2005, July 11-15, 2005
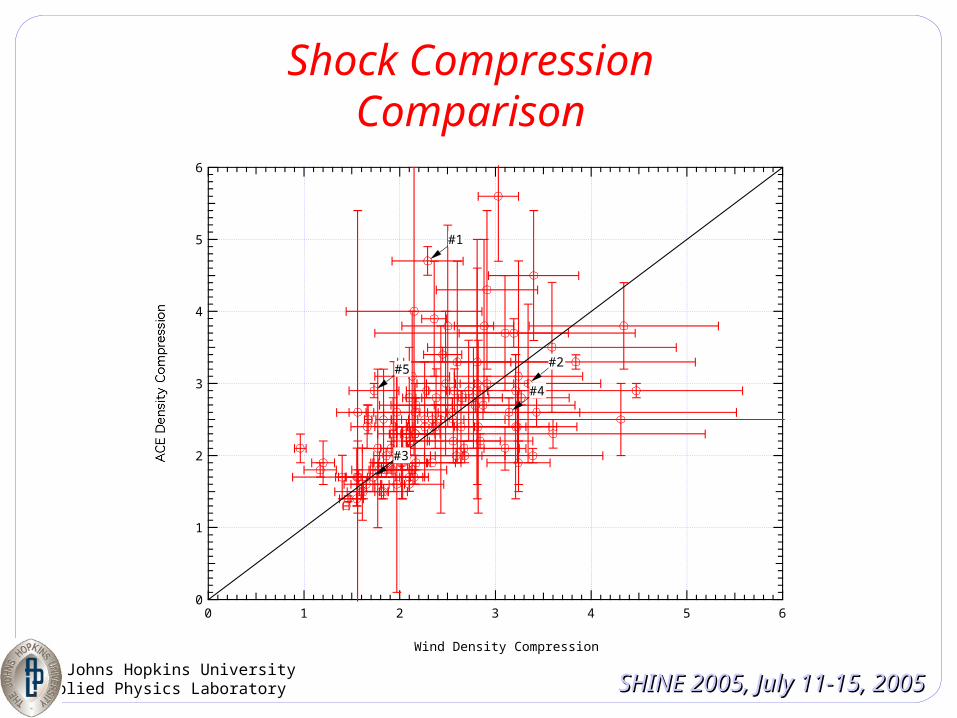
Shock Compression Comparison
6
5
4
3
2
1
0
ACE Density Compression
6543210
Wind Density Compression
#1
#2
#3
#4
#5

The Johns Hopkins UniversityApplied Physics Laboratory SHINE 2005, July 11-15, 2005SHINE 2005, July 11-15, 2005
Shock Speed ComparisonShock Speed Comparison
1000
800
600
400
200
ACE Shock Speed (km/s)
1000800600400200
Wind Shock Speed (km/s)
#1
#2
#3
#4
#5
The Johns Hopkins UniversityApplied Physics Laboratory SHINE 2005, July 11-15, 2005SHINE 2005, July 11-15, 2005
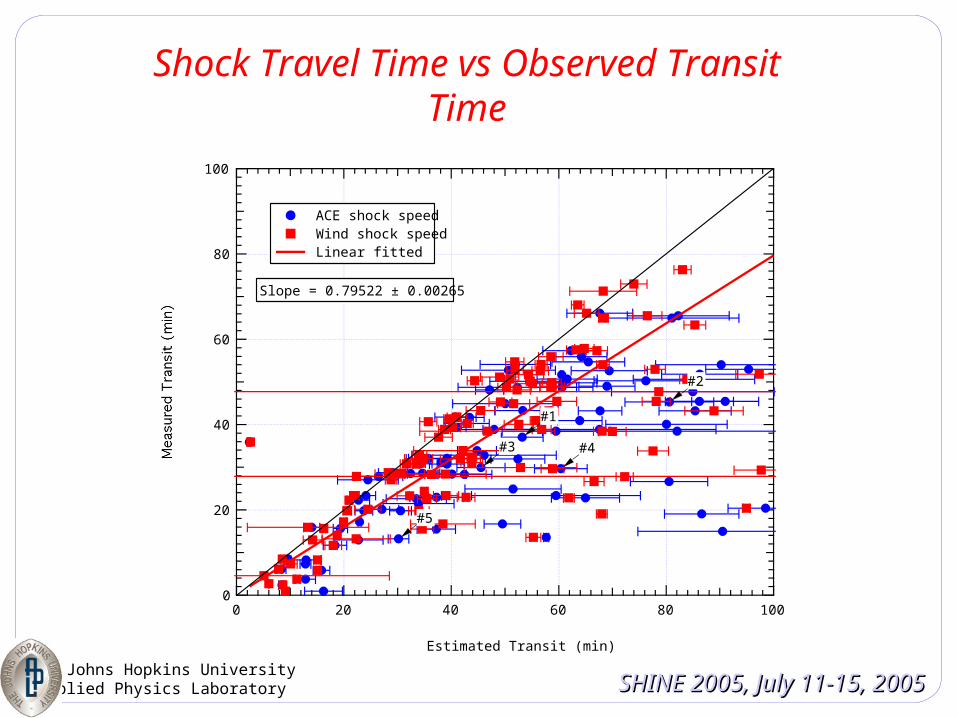
Shock Travel Time vs Observed Transit Time
100
80
60
40
20
0
Measured Transit (min)
100806040200
Estimated Transit (min)
#1
#2
#3 #4
#5
ACE shock speed Wind shock speed Linear fitted
Slope = 0.79522 ± 0.00265

The Johns Hopkins UniversityApplied Physics Laboratory SHINE 2005, July 11-15, 2005SHINE 2005, July 11-15, 2005
Physical Separation vs Inferred SeparationPhysical Separation vs Inferred Separation
500
400
300
200
100
0
Vshock
* Measured Transit Time (R
E)
5004003002001000
Physical Separation (RE)
Slope = 0.80177 ± 0.0312
√X2
GSE+Y2
GSE
GSE X Separation Linear fitted

The Johns Hopkins UniversityApplied Physics Laboratory SHINE 2005, July 11-15, 2005SHINE 2005, July 11-15, 2005
Summary– We classified 191 ESP events detected on ACE according to:
1. Energetic ion and electron time-intensity profile2. Spectral index
– 63% of transient forward IP shock accelerated ions at >47 keV, while only 32% IP shock accelerated ions at >1.9 MeV
– The spectral index of energetic ion:1. Monotonically increased across the shock; or2. Fluctuated across the shock crossing
– Most of the ion spectral index do not follow the diffusive shock theoretical prediction for an equilibrium spectrum (many shock interactions)
– Ion spectra often soften at the shock– We studied 5 ESP events using particles, field, and plasma instruments on
both ACE and Wind– The particle intensity and spectra index were very similar at the two
spacecraft despite the fact that they were in time separate by more than 400 RE

The Johns Hopkins UniversityApplied Physics Laboratory SHINE 2005, July 11-15, 2005SHINE 2005, July 11-15, 2005
Summary (continue)
– The agreement between the calculated transits times using the fitted shock speeds on ACE with the actual measured transit times is good only up to ~30 minutes
– The disagreement between estimated transit time and measured transit time increase when the GSE Y separation were large (> 200 RE)
– This implies a) the shock may not be spherically symmetric at 1 AU, or; b) the shock may not propagate radially, or both
– There is relatively good agreement between the fitted shock speed and density compression ratio for the same shock on Wind and ACE