the journal of deaf studies and deaf education
TRANSCRIPT
The Journal of Deaf Studies and Deaf Education
doi:10.1093/deafed/enn003 13:391-404, 2008. First published 27 Mar 2008; J. Deaf Stud. Deaf Educ.
Denis Burnham, Greg Leigh, William Noble, Caroline Jones, Michael Tyler, Leonid Grebennikov and Alex Varley Reduction on ComprehensionParameters in Television Captioning for Deaf and Hard-of-Hearing Adults: Effects of Caption Rate Versus Text
http://jdsde.oxfordjournals.org/cgi/content/full/13/3/391The full text of this article, along with updated information and services is available online at
References http://jdsde.oxfordjournals.org/cgi/content/full/13/3/391#BIBL
This article cites 17 references, 1 of which can be accessed free at
Reprints http://www.oxfordjournals.org/corporate_services/reprints.html
Reprints of this article can be ordered at
Email and RSS alertinghttp://jdsde.oxfordjournals.org Sign up for email alerts, and subscribe to this journal’s RSS feeds at
image downloadsPowerPoint® Images from this journal can be downloaded with one click as a PowerPoint slide.
Journal informationto subscribe can be found at http://jdsde.oxfordjournals.org Additional information about The Journal of Deaf Studies and Deaf Education, including how
Published on behalf ofhttp://www.oxfordjournals.org Oxford University Press
at University of Wollongong on 12 August 2008 http://jdsde.oxfordjournals.orgDownloaded from

Parameters in Television Captioning for Deaf and
Hard-of-Hearing Adults: Effects of Caption Rate Versus Text
Reduction on Comprehension
Denis Burnham
MARCS Auditory Laboratories, University of
Western Sydney
Greg Leigh
Royal Institute for Deaf and Blind Children and
University of Newcastle
William Noble
University of New England
Caroline Jones
MARCS Auditory Laboratories, University of
Western Sydney, and University of Wollongong
Michael Tyler
Leonid Grebennikov
MARCS Auditory Laboratories, University of
Western Sydney
Alex Varley
Media Access Australia
Caption rate and text reduction are factors that appear toaffect the comprehension of captions by people who are deafor hard of hearing. These 2 factors are confounded in every-day captioning; rate (in words per minute) is slowed by textreduction. In this study, caption rate and text reduction weremanipulated independently in 2 experiments to assess anydifferential effects and possible benefits for comprehensionby deaf and hard-of-hearing adults. Volunteers for the studyincluded adults with a range of reading levels, self-reportedhearing status, and different communication and languagepreferences. Results indicate that caption rate (at 130, 180,230 words per minute) and text reduction (at 84%, 92%, and100% original text) have different effects for different adultusers, depending on hearing status, age, and reading level. Inparticular, reading level emerges as a dominant factor: moreproficient readers show better comprehension than poor read-ers and are better able to benefit from caption rate and, tosome extent, text reduction modifications.
Television captions are a form of assistive text-based
technology intended to make the auditory component
of television accessible to viewers who are deaf or hard
of hearing. Captions are also used as aids in noisy
situations for viewers with normal hearing and for
second-language speakers in educational or informa-
tional settings. In investigations of ideal rates of cap-
tioning, not only rate but also text reduction and
viewer reading ability are important factors. (Other
factors are difficulty level of the written material and
the amount of information that can be obtained from
the video rather than the captions.) The average
captioning rate of U.S. television programs has been
measured as 141 words per minute (wpm; Jensema,
McCann, & Ramsey, 1996). In one U.S. study 145
wpm was judged the ‘‘most comfortable’’ rate by
hearing, hard-of-hearing, and deaf adults, although
caption reading rate reportedly increases with regular
caption use (Jensema, 1998). Where reading speed
data are available, they suggest that the reading speeds
of deaf and hard-of-hearing viewers are typically
slower than those for hearing viewers. For instance,
in the United States, reading speeds of 116 wpm
(range 5 56–167) have been found for deaf
and hard-of-hearing children and 135 wpm (range 5
94–201) for deaf and hard-of-hearing people aged
17–20 years (Shroyer & Birch, 1980). These are lower
than the average captioning rate of U.S. programs
This research was administered by the University of Western Sydney incollaboration with the Australian Caption Centre, Australian Hearing,and the Royal Institute for Deaf and Blind Children. The authors wishto thank Helen Brown, Sharan Westcott, Jim Brown, and Donna-MaeSchwarz at Australian Hearing for arranging for hearing tests for par-ticipants, as required; Chris Mikul, Lydia Venetis, Philip Bilton-Smith,and Gordon Dickinson at the Australian Caption Centre for captioningthe videotapes used in these studies, providing instruction for MARCSAuditory Laboratories research assistants, and providing AUSLANinterpreters where necessary; Kathy Wright at the Deaf Education Net-work, for arranging and providing AUSLAN interpretation as required;and all of the participants for their precious time and cooperation. A.V.was at the Australian Caption Centre at the time the study was con-ducted. No conflicts of interest were reported. Correspondence shouldbe sent to Denis Burnham, MARCS Auditory Laboratories, Universityof Western Sydney, Locked Bag 1797, Penrith South DC, New SouthWales 1797, Australia (e-mail: [email protected]).
! The Author 2008. Published by Oxford University Press. All rights reserved.For Permissions, please email: [email protected]
doi:10.1093/deafed/enn003Advance Access publication on March 27, 2008
(141 wpm, Jensema et al., 1996) and lower than typical
caption rates in Australia, where the Australian
Caption Centre (ACC) standard allows for verbatim
caption rates of around 180 wpm.
In general, hearing status and literacy tend to
covary. In a recent U.S. study, the median reading
comprehension level (scaled scores on the Stanford
Achievement Test, 9th edition) of deaf and hard-of-
hearing students aged 15 years was comparable to the
reading comprehension level of hearing students aged
8–9 years (Karchmer & Mitchell, 2003). In Australia,
reading comprehension levels among deaf and hard-
of-hearing students have previously been shown to be
considerably lower than those for the hearing popula-
tion. Walker and Rickards (1992) found that 58% of
school-age deaf students in their Australian sample
were reading below grade level.
The known literacy difficulties of deaf and hard-of-
hearing people have important implications for televi-
sion captioning. Stewart (1984) showed that just 58%
of a deaf sample understood captions most of the time.
Jelinek Lewis and Jackson (2001) attempted to com-
pare caption comprehension by deaf and hearing stu-
dents with the same range of reading grade level, but
in the final sample, deaf students had a lower standard-
ized reading grade level than hearing students. It was
found that students with higher standardized reading
grade level showed better comprehension of captions
and were also better at generalizing information and
using prior knowledge to answer the test questions.
For viewers with relatively low literacy, such as
many deaf and hard-of-hearing people, the true acces-
sibility of captions remains understudied, although
practical efforts have been made to address the issue.
One practice intended to promote the comprehension
of captions has been to reduce caption rate. Rate re-
duction is a practice that has historically fallen in and
out of favor and has mainly been employed for child-
ren’s programs. From a technical viewpoint, caption
rate is necessarily related to the text structure of the
captions; caption providers reduce caption rate by
simplifying the text syntactically (by shortening sen-
tences and rearranging phrases) and/or semantically
(by eliminating words that are judged less necessary).
In everyday practice, this means that effects of re-
duced caption rate cannot be distinguished from
effects of text reduction, as noted by Baker (1985).
Hence, in practice, it is unclear whether the perceived
advantage of reduced caption rate is a product of the
rate reduction or the adjustments that are made to the
text structure to achieve that rate.
Findings to date regarding text reduction are
equivocal and are limited to deaf and hard-of-hearing
children. Although there is some evidence that text
reduction improves comprehension (Boyd & Vader,
1972; Braverman, 1981; Braverman & Hertzog,
1980), other research on text reduction/simplification
indicates that comprehension is better for unreduced
text, possibly because reduced text tends to undermine
textual cohesion (Ewoldt, 1984; Israelite & Helfrich,
1988), and tends to be inexplicit, thus reducing any
facilitative effects of vocabulary and context (Sundbye,
1987; Yurkowski & Ewoldt, 1986).
The aim of this article was to test for the effects of
caption rate and text reduction on comprehension by
deaf and hard-of-hearing adults independently. Cap-
tion rate and text reduction were manipulated inde-
pendently by varying the amount of time captions
were displayed, thus allowing separate assessment of
the effects and possible benefits of varying these two
parameters. By means of these experimental manipu-
lations and given the range of hearing, signing, and
English reading abilities of the participants who are
studied here, the differential effect of caption rate and
text reduction can be partialled out, to allow more
exact determination of whether previous reduced
rate advantages are due to the rate reduction per se
or due to the adjustments that are made to the text
structure to achieve that reduction (Baker, 1985)
and to provide a guide for future caption production
techniques.
Experiment 1 investigated whether comprehension
of relatively complex text is affected by pure caption
rate variation (with no text reduction) and whether
there is any relationship between comprehension at
different caption rates and reading levels or hearing
status. This differs from and improves on a previous
study by Jensema (1998) in which moving videos of
still posters were taken in order to vary the caption
speed. Thus, this study controlled the caption speed
perfectly, but in an unrepresentative situation. Marry-
ing experimental control and ecological validity will
392 Journal of Deaf Studies and Deaf Education 13:3 Summer 2008

always be an issue in this area, but we have been able
to make a good combination of the two here.
Experiment 2, with a similar group of deaf and hard-
of-hearing adult participants, investigated whether text
reduction (without variation in caption rate, i.e., unac-
companied by greater ‘‘eyeball’’ time) affected compre-
hension for viewers with different reading levels and
hearing status.
In general, comprehension performance was
expected to be related to reading level (better compre-
hension for more proficient readers) and hearing status
(lower comprehension for participants with greater
degrees of hearing loss). It was anticipated that less pro-
ficient readers should have better comprehension at
slower rates and poorer comprehension at faster caption
rates.The question ofwhether therewere anydifferences
between the effects of caption rate and text reductionwas
an open question, as was the effect of text reduction
for different viewers, although there is reason to expect
differences in rate of caption use on the basis of hearing
level and sign language use (see Burnham et al., 2002).
Experiment 1: Effect of Caption Rate on
Comprehension
Method
Design. A 2 (reading level: more vs. less proficient
readers) 3 2 (hearing status: deaf vs. hard of hearing,
identified using self-report data on hearing level) 3 3
(caption rate: 130, 180, or 230 wpm) factorial design,
with repeated measures on the last factor, was
employed. The dependent variable was percent correct
in response to a comprehension questionnaire com-
pleted by participants after viewing the corresponding
captioned television program.
Participants. A total of 45 hard-of-hearing and deaf
adults were recruited from the Sydney region from
among respondents to a television caption-use survey
in 2000 (Burnham et al., 2002; Jones et al., 2008) and
through newspaper advertisements. The former sub-
group was originally recruited through the mailing list
of the ACC newsletter Supertext News. Participants
were reimbursed for their travel expenses.
The group of 45 was partitioned in terms of self-
reported degree of hearing difficulty (deaf and hard of
hearing) and in terms of reading level (less vs. more
proficient). Twenty-two participants, identified for the
purposes of this description as ‘‘deaf,’’ indicated in
response to a question on the original caption-use
survey (readministered to all participants at the time
of testing) that they ‘‘can’t hear’’ in both right and left
ears. This group comprised 16 females and 6 males and
ranged in age from 25 to 82 years, with a mean of 49.5
years (SD 5 17.8 years), and all had grown up in an
English-speaking country. Of this group, 11 used Auslan
(Australian Sign Language) for communication—
seven exclusively and four in addition to auditory–
oral communication (including the use of hearing aids
or devices). Another 11 participants reported the use
of auditory–oral communication with the assistance of
lipreading and/or the use of hearing aids or cochlear
implant. Of the 22 participants identified as deaf, 14
were identified as less proficient readers and 8 as
more proficient readers (see below for description of
reading measure and procedure for grouping partic-
ipants with respect to reading proficiency).
Another 23 participants, identified for the purposes
of this description as ‘‘hard of hearing,’’ indicated in
responses to the caption-use survey that they had some
degree of hearing in at least one ear.Of this group, 21used
a hearing aid or cochlear implant and 2 reported using no
hearing aid or cochlear implant. Four reported some use
of Auslan. The hard-of-hearing group comprised 14
females and 9males and ranged in age from24 to 79 years,
with ameanof 58.6 years (SD5 15.9 years). Twenty-one
participants in this group were monolingual in English,
one had a non-English-speaking background, and one
participant was bilingual in English and another spoken
language. Of the 23 participants identified as hard of
hearing, 8 were identified as less proficient readers and
15 were more proficient readers (see below).
To assess effects of reading level, the participants
were grouped as ‘‘more proficient’’ or ‘‘less proficient’’
readers, above or below the 50th percentile on the
Woodcock Total Reading, Short Scale cluster, respec-
tively. The less proficient readers (n 5 22) were pre-
dominantly those in the deaf group (63.6%, n 5 14)
and more proficient readers (n 5 23) predominantly
those in the hard-of-hearing group (65.2%, n 5 15).
In line with this, standard reading scores were higher
for hard-of-hearing participants (mean 5 105.13,
Caption Rate and Text Reduction 393

SD 5 15.35) than for deaf participants (mean 5
93.91, SD 5 18.49), t(40.8) 5 22.21, p 5 .033.
In order to investigate communication and lan-
guage preferences, participants were also grouped
for later analysis purposes in terms of their commu-
nication and language preferences. Fifteen participants
reported using Auslan to some extent: seven had
‘‘Auslan only’’ as their communication and language
preference and a further eight reported using Auslan
as a supplement or alternative to auditory–oral com-
munication (including the use of hearing aids or devi-
ces). The other 30 participants in the sample reported
they did not use Auslan. The Auslan group (4 males,
11 females) had a mean age of 44.0 years (SD 5 18.5
years); and the non-Auslan users (11 males, 19
females) had a mean age of 59.2 years (SD 5 14.3
years). The Auslan group had lower standard reading
scores (mean 5 87.33, SD 5 14.88) than the non-
Auslan group (mean 5 105.80, SD 5 15.83). In terms
of reading proficiency, 3 of the Auslan group were
classified as more proficient and 12 as less proficient
readers, and of the non-Auslan group, 20 were classi-
fied as more and 10 as less proficient readers.
Materials.
Captionedmaterial and response questionnaires. Three
short television documentaries were selected from the
Australian Broadcasting Corporation’s Stateline series
(‘‘Building Indemnity,’’ ‘‘Fish Fight,’’ and ‘‘Water Con-
servation’’) and copyright clearance was obtained to use
these stories from the national editor of ABC News/
Current Affairs. These were chosen from a total of 30
Stateline stories before arriving at six candidates that were
cut down to the final three as a result of pilot testing—see
below. The criteria for choosing these six candidates were
that (a) stories were from outside the state of New South
Wales (the state in which the study was conducted), in
an effort to ensure that topics would be relatively
unfamiliar to all participants; (b) no offensive, potentially
disturbing, or controversial material was included;
(c) there were minimal talking-head shots (i.e., as much
voice-over as possible); (d) excerpts were not shorter
than 4 min in duration and not longer 10 min (the final
ones chosen were between 5 and 8 min); and (e) there
were similar levels of activity and engagement across
excerpts.
Once the six potential stories were selected, sets of
short-answer comprehension questions were prepared
for each, and the (uncaptioned) materials were piloted
on 40 hearing undergraduates. Questions referred only
to material in which the speakers’ lips were not visible.
On the basis of responses to these questions, the po-
tential list of stories was cut from six to four, and many
of the more difficult questions were excluded or mod-
ified, resulting in a second set of questions, which in-
cluded some multiple-choice questions. These were
then piloted on a total of 12 new participants (including
the first four authors of this article). This revealed
a good spread of scores and allowed the selection of
the final three stories. Based on the results of these
two pilot tests, the questions were equated approxi-
mately for difficulty across the three stories. Neverthe-
less, as all three passages are used in each reading speed
condition, any slight differences between lists are con-
trolled for. A comprehension questionnaire was devised
for each documentary, which included both multiple-
choice and open-ended questions for each of the three
documentaries (6 and 8 of each, respectively for, Doc-
umentary 1, Building Indemnity; 12 and 4 of each, re-
spectively, for Documentary 2, Fish Fight; and 7 and 6
of each, respectively, for Documentary 3, Water Con-
servation). Thus, there was a total of 25 multiple-choice
and 18 open-ended questions. All questions related to
material in which the speaker’s lips were not visible.
Sample multiple-choice and open-ended questions
for each of the three stories are given in Appendix A.
The three stories were each captioned by the ACC
reducing the text such that the reading rate was 120
wpm, with a 10% tolerance (captioners usually cap-
tion right up to this 10% tolerance limit, and indeed
the resultant median caption rate was 129 wpm). At
this 130-wpm level, there was no variation in rate
across the three stories—rates were 129, 129, and
129 for stories 1, 2, and 3, respectively. Two additional
caption rates of 180 wpm (resultant median rates of
179, 180, and 179 wpm for the three stories) and 230
wpm (resultant median rates of 229, 231, and 228
wpm for the three stories) were created by reducing
the presentation time of each caption on the screen
(i.e., increasing the required reading rate for each
word). These rates were chosen as being around
the norm (180 wpm), relatively slower (130 wpm),
394 Journal of Deaf Studies and Deaf Education 13:3 Summer 2008

and relatively faster (230 wpm) as compared with
typical caption rates for Australian documentary-style
programs in English. The videos were recorded on
VHS videotape for presentation during testing. There
were nine documentary–rate combinations. To address
carry-over effects, order of presentation of these doc-
umentary–rate combinations was counterbalanced
across participants in a Latin square design.
Measure of reading level. The Total Reading,
Short Scale cluster (Word Identification and Passage
Comprehension subtests, Woodcock Test kit, Form
G), was used to estimate global reading level.
Measure of functional visual acuity. The ACC cre-
ated a VHS videotape with 18 single-meaning English
words captioned one at a time on a neutral gray back-
ground, with no audio.
Procedure. All participants were offered the services
of an accredited Auslan interpreter for the duration of
the testing session as required. Acceptance of this of-
fer was consistent with stated language and commu-
nication preferences. Testing was conducted in a quiet
room in a ‘‘lounge room’’ environment, with a 63-cm
flat-screen color television positioned between two
1.8 m 3 1.5 m portable acoustic screens in front
of a large couch. Each person first provided biograph-
ical information and informed consent and then par-
ticipated in the functional test of visual acuity. For the
acuity test they were asked to read words presented on
the screen and to say or sign them. Participants were
encouraged to ask to have the television moved closer
or further away from the couch to obtain the most
comfortable viewing distance. When these preliminar-
ies had been completed, they watched the three cap-
tioned documentaries (with the sound turned off).
Immediately after each documentary, each participant
completed a comprehension questionnaire and was in-
vited to indicate whether they agreed/disagreed with
a fixed set of statements regarding the caption speed,
the comprehension questions, and their strategies for
answering them. Participants were also given the op-
tion of making one open-ended comment, which was
coded as broadly positive or broadly negative. Finally,
after viewing all three documentaries, participants
completed the Woodcock Total Reading, Short Scale
cluster. Testing was completed in a single individual
session, which lasted between 1.05 and 1.45 hr.
Results
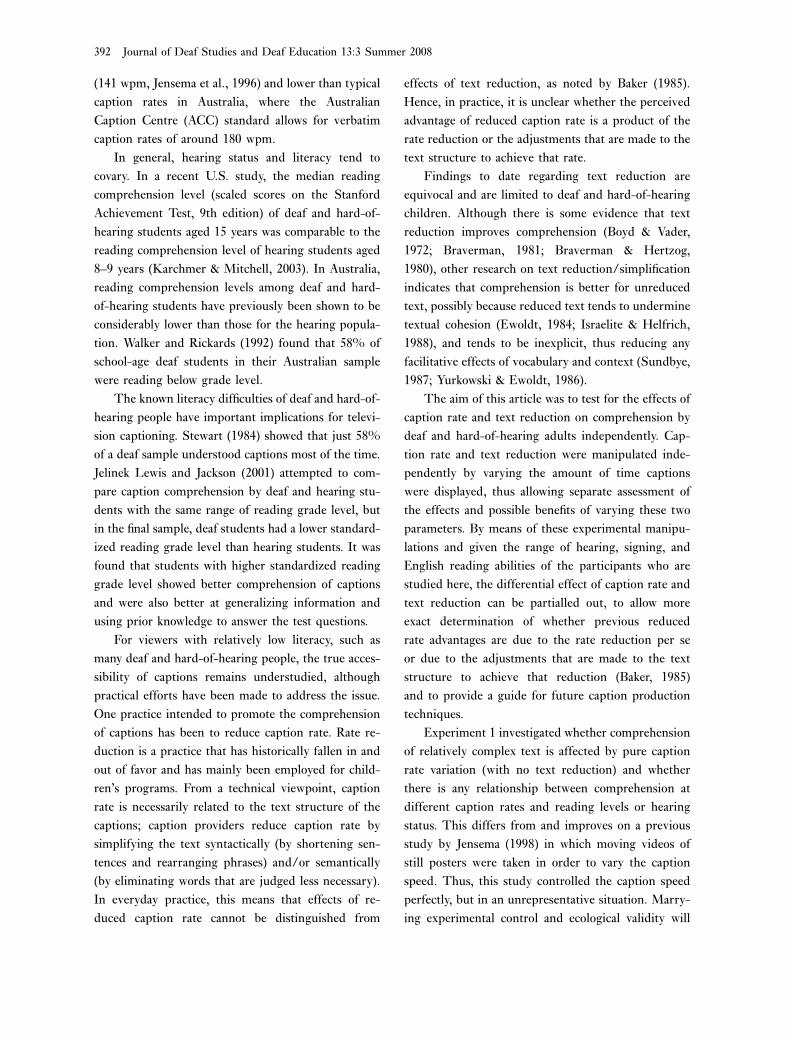
Comprehension accuracy by hearing status and reading
level. Caption comprehension accuracy is shown in
Figure 1 as a function of self-described hearing status
and reading level. The accuracy data across the three
caption rates were analyzed using a 2 3 2 3 (3) anal-
ysis of variance (ANOVA) with hearing status and read-
ing level as between-subjects factors and caption rate as
a repeated-measures factor. There was no significant
main effect of caption rate, F(2, 82) 5 0.52, p 5 .59,
or hearing status, F(1, 41) 5 0.65, p 5 .42. However,
comprehension scores were higher for more proficient
(mean 5 43.6, SD 5 16.7) than less proficient readers
(mean 5 29.3, SD 5 16.5), F(1, 41) 5 8.43, p 5 .006.
There were no two-way interactions, but the three-
way interaction of caption rate 3 hearing status 3
reading level was significant, F(1, 41) 5 3.42, p 5
.04, indicating that the effect of caption rate varied
depending on both hearing status and reading level.
As can be seen in Figure 1, the advantage afforded by
being a more proficient reader differs according to
hearing status and caption speed. Post hoc t tests of
more versus less proficient readers were performed for
all caption rates for both deaf and hearing participants,
using a Games and Howell (1976) adjustment, which
is appropriate to control for Type 1 error when sample
size is unequal (Games, Keselman, & Rogan, 1981).
Among the deaf participants there was a tendency for
better comprehension for more proficient readers than
less proficient readers at 130 and 180 wpm. Among
hard-of-hearing participants, there is no difference
between comprehension scores of the more and less
proficient readers at 130 and 230 wpm, but the
comprehension scores of the more proficient readers
were higher than those of less proficient readers at
180 wpm.
The relationship between age and comprehension
at different caption rates is also of interest. Pearson
product–moment correlations were 2.14 at 130
wpm, .4 at 180 wpm, and 2.27 at 230 wpm. Al-
though these are not significant at any caption rate,
there is a tendency for older participants to have
Caption Rate and Text Reduction 395
better comprehension than younger participants at
the 180-wpm caption rate but not at the faster or
slower rate.
Comprehension accuracy by communication and language
preference. In addition to analyzing comprehension as
a function of self-reported hearing level, data were also
analyzed as a function of the participants’ communi-
cation and language preferences.
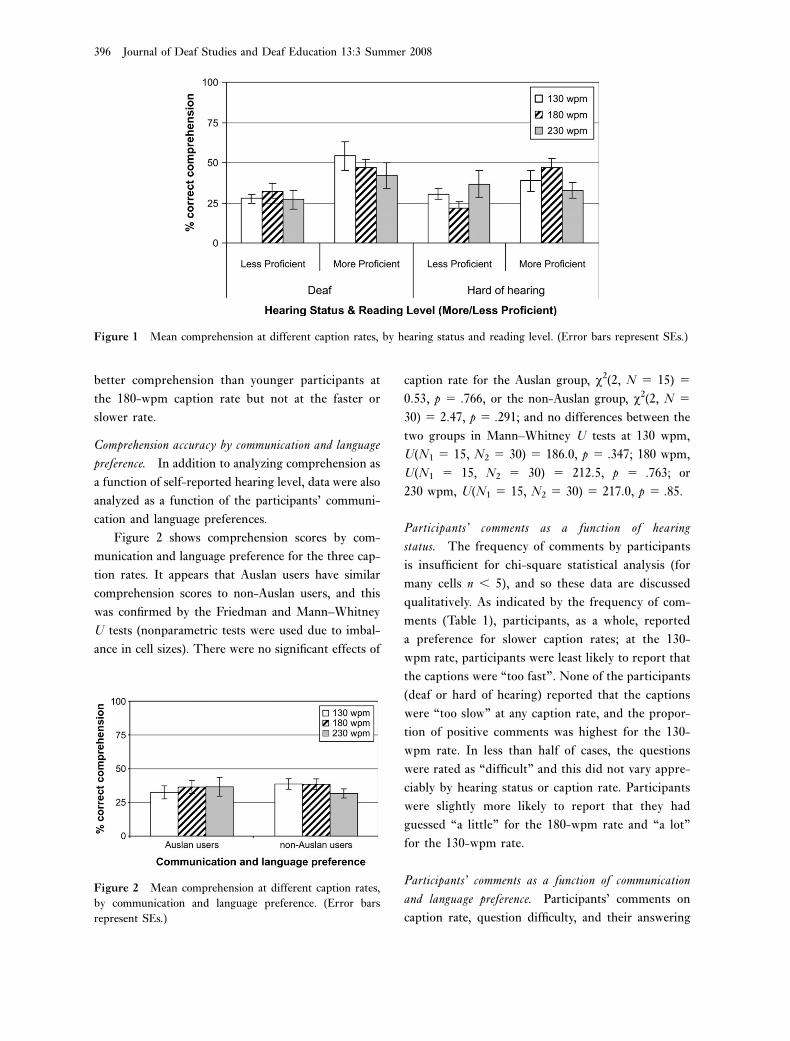
Figure 2 shows comprehension scores by com-
munication and language preference for the three cap-
tion rates. It appears that Auslan users have similar
comprehension scores to non-Auslan users, and this
was confirmed by the Friedman and Mann–Whitney
U tests (nonparametric tests were used due to imbal-
ance in cell sizes). There were no significant effects of
caption rate for the Auslan group, v2(2, N 5 15) 5
0.53, p 5 .766, or the non-Auslan group, v2(2, N 5
30) 5 2.47, p 5 .291; and no differences between the
two groups in Mann–Whitney U tests at 130 wpm,
U(N1 5 15, N2 5 30) 5 186.0, p 5 .347; 180 wpm,
U(N1 5 15, N2 5 30) 5 212.5, p 5 .763; or
230 wpm, U(N1 5 15, N2 5 30) 5 217.0, p 5 .85.
Participants’ comments as a function of hearing
status. The frequency of comments by participants
is insufficient for chi-square statistical analysis (for
many cells n , 5), and so these data are discussed
qualitatively. As indicated by the frequency of com-
ments (Table 1), participants, as a whole, reported
a preference for slower caption rates; at the 130-
wpm rate, participants were least likely to report that
the captions were ‘‘too fast’’. None of the participants
(deaf or hard of hearing) reported that the captions
were ‘‘too slow’’ at any caption rate, and the propor-
tion of positive comments was highest for the 130-
wpm rate. In less than half of cases, the questions
were rated as ‘‘difficult’’ and this did not vary appre-
ciably by hearing status or caption rate. Participants
were slightly more likely to report that they had
guessed ‘‘a little’’ for the 180-wpm rate and ‘‘a lot’’
for the 130-wpm rate.
Participants’ comments as a function of communication
and language preference. Participants’ comments on
caption rate, question difficulty, and their answering
Figure 1 Mean comprehension at different caption rates, by hearing status and reading level. (Error bars represent SEs.)
Figure 2 Mean comprehension at different caption rates,by communication and language preference. (Error barsrepresent SEs.)
396 Journal of Deaf Studies and Deaf Education 13:3 Summer 2008

strategies (Table 2) vary somewhat depending on com-
munication and language preference, although the
numbers in each case are small. Non-Auslan users
were slightly more likely to report that the captions
are too fast. No one reported that the captions were
too slow at any caption rate. More positive comments
were given by both groups for the excerpts with the
slower caption rates. The questions were reported as
difficult by between 16.7% and 40% of participants.
Participants were more likely to report that they
guessed a little in the 180-wpm condition than in
the 130- or 230-wpm conditions.
Discussion
The main finding of this study is that there is an over-
all main effect for reading proficiency: more proficient
readers show greater comprehension of captions than
do less proficient readers. Over and above this, caption
comprehension also depends on caption rate and read-
ing level. For deaf participants, those who are more
proficient readers tend to have better comprehension
across the board, and reading prowess especially assists
comprehension at the slower rates (130 and 180 wpm).
On the other hand, for hard-of-hearing participants, it
is only at the medium speed, 180 wpm, that more
proficient readers show clearly better comprehension
than less proficient readers.
Comments from deaf and hard-of-hearing partic-
ipants indicate a subjective preference for slower cap-
tion rates. The proportion of positive comments was
highest for the slowest (130 wpm) rate, and no partic-
ipants reported that this rate (or any other) was too
slow. For the 130- and 180-wpm rates, however, par-
ticipants were slightly more likely to report that they
had guessed a lot and a little, respectively. This may be
due to increased memory demands in processing and
retaining slower reading material.
Comprehension did not differ as a function of
communication and language preference. Neverthe-
less, non-Auslan users were the most likely to report
that the captions are too fast. This seems odd, as-
suming that non-Auslan users are people who have
English as their first language and may have an ac-
quired rather than lifelong hearing loss. Perhaps age
is a factor here: the non-Auslan users are the oldest
group (mean 59 years of age vs. 44 years for the
Auslan users) and for the fastest and the slowest
rates, correlations between age and comprehension
were small and negative.
Table 1 Frequency of comments (percentage) in Experiment 1 by hearing status and caption speed
Deaf (n 5 22) Hard of hearing (n 5 23)
130 wpm 180 wpm 230 wpm 130 wpm 180 wpm 230 wpm
The captions are too fast 4 (18.2) 5 (22.7) 10 (25.5) 5 (21.7) 5 (21.7) 12 (52.2)The captions are too slow 0 (0) 0 (0) 0 (0) 0 (0) 0 (0) 0 (0)Positive comment 8 (36.4) 5 (22.7) 2 (9.1) 5 (21.7) 2 (8.7) 1 (4.3)The questions are difficult 7 (31.8) 7 (31.8) 8 (36.4) 6 (26.1) 4 (17.4) 2 (8.7)I had to guess a little 5 (22.7) 11 (50.0) 7 (31.8) 5 (21.7) 7 (30.4) 3 (13.0)I had to guess a lot 4 (18.2) 2 (9.1) 1 (4.5) 7 (30.4) 5 (21.7) 4 (17.4)
Table 2 Frequency of comments (percentage) in Experiment 1 by language preference and caption speed
Auslan users (n 5 15) Non-Auslan users (n 5 30)
130 wpm 180 wpm 230 wpm 130 wpm 180 wpm 230 wpm
The captions are too fast 2 (13.3) 2 (13.3) 5 (33.3) 7 (23.3) 7 (23.3) 17 (56.7)The captions are too slow 0 (0) 0 (0) 0 (0) 0 (0) 0 (0) 0 (0)Positive comment 6 (40.0) 4 (26.7) 1 (6.7) 7 (23.3) 3 (10.0) 2 (6.7)The questions are difficult 6 (40.0) 5 (33.3) 5 (33.3) 7 (23.3) 6 (20.0) 5 (16.7)I had to guess a little 3 (20.0) 7 (46.7) 3 (20.0) 7 (23.3) 11 (36.7) 7 (23.3)I had to guess a lot 3 (20.0) 1 (6.7) 0 (0) 8 (26.7) 6 (20.0) 5 (16.7)
Caption Rate and Text Reduction 397
Experiment 2: Effect of Text Reduction on
Captions Comprehension
Experiment 2 investigates the effect of text reduction,
without variation in caption rate, on comprehension
by deaf and hard-of-hearing participants.
Method
Design. A 2 (reading level: more vs. less proficient
readers) 3 2 (hearing status: deaf vs. hard of hearing,
identified using self-report data on hearing level) 3 3
(text reduction—verbatim: 100% of spoken text, mod-
erate: 92% of original text, and strict: 84% of original
text), that is, the same design as in Experiment 1,
except that text reduction was the within subjects vari-
able rather than caption rate. As for Experiment 1,
dependent variable was percent correct in responses
to a comprehension questionnaire completed by par-
ticipants after viewing the corresponding captioned
television program.
Participants. A total of 39 deaf and hard-of-hearing
adults took part in Experiment 2. Of these, 31 had
participated in Experiment 1 and 8 had not. Using
the same criteria as in Experiment 1, 18 were iden-
tified as deaf and 21 as hard of hearing. Of the deaf
participants, seven used Auslan only, four used
Auslan with speech (and a hearing aid), and a further
seven reported the exclusive use of oral com-
munication. Of the hard-of-hearing participants,
16 reported the exclusive use of oral communication
(15 reported the use of a hearing aid or cochlear
implant and 1 used no aid) and 5 acknowledged the
use of some Auslan together with the use of speech
and hearing aid.
The deaf group (4 males, 14 females) ranged in age
from 26 to 82 years (mean 5 49.8 years, SD 5 16.6
years) and the hard-of-hearing group (6 males, 15
females) ranged in age from 20 to 81 years (mean 5
56.7 years, SD 5 19.3 years). All deaf participants and
19 of the hard of hearing had grown up in English-
speaking countries. The hard-of-hearing group in-
cluded one person who was bilingual in English and
another language and one person with a non-English-
speaking background.
To assess effects of reading level, the participants
were assigned to more proficient and less proficient
reader groups, as in Experiment 1. Less proficient read-
ers (n 5 17) predominantly included those who were
classified as deaf (76.5%, n 5 13) and more proficient
readers (n 5 22) predominantly those who were hard
of hearing (77.3%, n5 17). There was more variability
in reading level within the deaf group, but standard
reading scores were higher for the hard-of-hearing
(mean 5 110.3, SD 5 10.2) than for deaf participants
(mean 5 93.1, SD 5 17.6), t(26.4) 5 3.6, p 5 .001.
Materials and procedure. Six documentaries from the
Australian Broadcasting Corporation’s Stateline series
were initially selected. They were selected based on
their potential to be captioned verbatim at approxi-
mately 180 wpm. As for Experiment 1, these were
on topics likely to be unfamiliar to the participants,
and as in Experiment 1, there was a selection process
involved in order to equate difficulty of the passages
and the questions. The final clips chosen were Mari-
time Museum (duration 5 5.00 min), Save the Bilby
(5.30 min), and Huon Supply (7.42 min).
Each of the three documentaries was captioned
with three levels of text reduction: 100%, 92%, and
84% of original text. The 100% condition was verba-
tim captioning, which ACC normally does for docu-
mentaries at approximately 180 wpm. The moderate
text reduction condition (92% mean original text,
range 5 90.7%–92.4%) was achieved by applying
the ACC text reduction standard that would normally
apply if the caption rate were to exceed 190 wpm if
captioned verbatim. Details of these standards used by
the ACC are not available to the public so cannot be
detailed here. In addition to these standards, the mod-
erate text reduction condition was achieved by
substituting contractions (e.g., ‘‘don’t’’ for ‘‘do not’’),
omitting redundant words and phrases (e.g., ‘‘in terms
of,’’ ‘‘I guess that,’’ ‘‘at the end of the day’’), shortening
phrases (e.g., ‘‘in a similar fashion’’ becomes ‘‘simi-
larly’’), and simplifying sentences (e.g., ‘‘It is going
to be the pride of Western Australia’’ becomes ‘‘It will
be the pride of Western Australia’’). Most of this text
reduction was semantic rather than syntactic. The
strict text reduction condition (mean 5 84%, range 5
83.7%–85.5%) was achieved by applying the same
398 Journal of Deaf Studies and Deaf Education 13:3 Summer 2008

strategies as for the 92% condition, but more vigor-
ously. This rate was found to be the greatest reduction
possible with the current materials, while still retaining
the gist of the text.
Caption rate was kept at 180 wpm across all three
conditions with 10% tolerance, by adjusting the pe-
riod of time for which each caption was displayed.1
This process tended to extend the gaps between cap-
tions to some extent in each of the two reduced text
versions. This was deemed to be unproblematic be-
cause a large proportion of the time in each documen-
tary comprised passages where a narrator spoke in the
background and there was no risk of mismatch be-
tween a speaker and the captions. When there were
‘‘talking-head’’ shots, unsynchronized passages were
made as balanced and inconspicuous as possible. For
example, if a character began talking before their ac-
tual appearance on the screen, the caption was held off
screen until the speaker appeared.
A comprehension questionnaire was developed for
each of the three documentaries. As for the compre-
hension questionnaire in Experiment 1, the questions
were designed specifically for the material and
were pilot tested in two waves. Each questionnaire
contained 14 items (Maritime Museum, 7 multiple-
choice, 7 open-ended questions; Save the Bilby, 7, 7;
and Huon Supply, 6, 8), plus there was space for
optional comments at the end of each questionnaire.
(Sample multiple-choice and open-ended questions
for each of the three stories are given in Appendix
B.) Finally, at the end of each documentary, partici-
pants were also invited to agree or disagree with a
fixed set of statements regarding the caption speed,
synchronization, and ease of use. Participants were
also invited to make an open-ended comment which
was coded as broadly positive or broadly negative. To
address carry-over effects, presentation order and re-
duction conditions were counterbalanced between par-
ticipants in a Latin square design.
The Woodcock Total Reading, Short Scale Clus-
ter, and a visual acuity test were used as in Experiment
1. The testing setup and the procedure were the same
as for Experiment 1.
Results
Comprehension accuracy by hearing status and reading
level. Figure 3 shows comprehension accuracy at
the three levels of text reduction, for participants
grouped by hearing status and reading level. As can
be seen for deaf participants, more proficient readers
had higher mean scores than less proficient readers,
especially in the strict text condition. However, a 2 3
2 3 (3) ANOVA with hearing status and reading level
as between-subjects factors and text reduction as a re-
peated measure revealed no significant main effects of
text reduction, F(2, 70) 5 0.563, p 5 .572); reading
level, F(1, 35) 5 1.70, p 5 .20; or hearing status,
Figure 3 Mean comprehension with different text reduction, by hearing status and reading level. (Error bars represent SEs.)
Caption Rate and Text Reduction 399

F(1, 35) 5 0.22, p 5 .65. Neither the two-way inter-
actions nor the three-way interaction was significant.
Comprehension accuracy by communication and lan-
guage preference. Of the 39 participants, 16 were
Auslan users (3 male, 13 female; mean age 5 42.9
years [SD 5 18.0 years]; mean standard reading
score 5 92.13 [SD 5 14.17]), and 23 were non-Auslan
users (7 male, 16 female; mean age 5 61.0 years
[SD 5 14.5 years]; mean standard reading score 5
109.52 [SD 5 14.11]). Figure 4 shows comprehension
accuracy for the different text reduction levels, by
Auslan use. Friedman tests revealed no significant
effects of text reduction for the Auslan group, v2(2,N 5 16) 5 3.460, p 5 .177, or the non-Auslan group,
v2(2, N 5 23) 5 0.681, p 5 .711. There was similarly
no difference between the two groups in Mann–Whitney
U tests for strict text reduction, U(N1 5 16, N2 5
23)5 159.0, p5 .475; moderate text reduction,U(N1 5
16, N2 5 23) 5 128.0, p 5 .110; or verbatim caption-
ing, U(N1 5 16, N2 5 23) 5 169.5, p 5 .679.
Participants’ comments as a function of hearing status.
Owing to the small number of comments, few general-
izations can be made about participants’ subjective
reactions across text reduction conditions. Table 3
summarizes comments by participant hearing status.
The proportion of positive comments is similar for
deaf and hard-of-hearing groups. A minority reported
that the captions were ‘‘too fast/faster than in other
videos’’ (even in strict and moderate text reduction
conditions) and just one person reported that the cap-
tions were too slow (deaf, strict text reduction). A
minority in the deaf group reported that it was ‘‘hard
to remember details, missed some’’ and this was true
in all text reduction conditions.
Participants’ comments as a function of communication
and language preference. Table 4 sets out comments
by communication and language preference. The pro-
portion of positive comments is similar for both
groups. Slightly more non-Auslan users than Auslan
users made positive comments in the strict text re-
duction condition. Participants in both groups were
more inclined to report that captions were ‘‘too fast/
faster than in other videos’’ than ‘‘too slow/slower
than in other videos,’’ even in strict and moderate text
reduction conditions.
Discussion
The results do not support the notion that our isolated
use of text reduction, while keeping rate constant,
improves comprehension in television captions. Al-
though there is a tendency for deaf people who are
more proficient readers to have better comprehension
with greater text reduction, there was no significant
Figure 4 Mean comprehension with different text reduc-tion, by communication and language preference. (Error barsrepresent SEs.)
Table 3 Frequency of comments (percentage) in Experiment 2 by hearing status and text reduction condition
Deaf (n 5 18) Hard of hearing (n 5 21)
Strict Moderate Verbatim Strict Moderate Verbatim
Positive comment 3 (16.7) 5 (27.8) 5 (27.8) 6 (28.6) 3 (14.3) 4 (19.0)Captions are too fast/faster than in other videos 2 (11.1) 0 (0) 1 (5.6) 3 (14.3) 3 (14.3) 4 (19.0)Captions are too slow/slower than in other videos 1 (5.6) 0 (0) 0 (0) 0 (0) 0 (0) 0 (0)Words don’t come up while talking, not captionedword-for-word 0 (0) 0 (0) 1 (5.6) 1 (4.8) 0 (0) 0 (0)Hard to remember details, missed some 5 (27.8) 5 (27.8) 3 (16.7) 1 (4.8) 0 (0) 2 (9.5)
400 Journal of Deaf Studies and Deaf Education 13:3 Summer 2008

difference in comprehension accuracy for texts cap-
tioned verbatim or with moderate or strict reduction.
This is true for both deaf and hard-of-hearing partic-
ipants and more proficient and less proficient readers.
There is also no effect of text reduction on compre-
hension for Auslan users versus non-Auslan users.
General Discussion
One of the main findings of this series of experiments
is that more proficient readers comprehend captions
better than do less proficient readers. In Experiment 1,
more proficient readers showed higher comprehension
than less proficient readers. Although this may seem to
be an obvious finding, it is important to note this given
that the literacy rates of deaf people are low compared
to those of otherwise matched hearing people. Similar
results have also been obtained by Jelinek Lewis and
Jackson (2001), who found that reading grade level
was highly correlated with caption comprehension test
scores, and comprehension test scores of students who
are deaf were consistently below the scores of hearing
students. Given these results both here and in Jelinek,
Lewis, and Jackson (2001) and the fact that commu-
nication preference (Auslan vs. non-Auslan use) had
little effect on comprehension or caption preferences
here, it appears that there should be much more em-
phasis on reading level than communication prefer-
ence in future studies of caption use.
In Experiment 1 for deaf participants there was
a selective rather than a general effect of caption rate
on comprehension: slower rates tended to assist more
proficient readers, but not less proficient readers.
There seem to be two possible reasons for this. First,
even 130 wpm may be insufficiently slow to benefit
viewers with slower reading speeds (deaf participants
did generally have poorer reading speed). This is sup-
ported by the more proficient deaf readers’ better
comprehension at slower caption rates. Slow rates also
elicited the highest proportion of positive comments.
Indeed, Experiment 2 provided additional evidence of
the beneficial effect of a slower caption rate and of text
reduction upon comprehension of captions by deaf
viewers. More proficient readers had better compre-
hension than did less proficient readers with greater
text reduction, although the difference was not statis-
tically significant. Second, rate may not be the only
factor affecting deaf readers’ difficulty with television
captions.
Hard-of-hearing participants appear to be affected
by caption rate and text reduction in a different way to
deaf participants. More proficient hard-of-hearing
readers have better comprehension at 180 than 230
wpm, whereas less proficient readers have better com-
prehension at 230 than 180 wpm. This may be due to
more proficient readers being relatively older and/or
perhaps having relatively greater experience with doc-
umentary captions at around 180 wpm rather than at
faster rates. The reason for the effect with less pro-
ficient readers is unclear. It may be that the less pro-
ficient readers effect their own text reduction by
picking out key words, but this or any other explana-
tion requires further research.
The potential ‘‘audience’’ for captioned materials
(including likely relative reading ability) is clearly
something that needs to be considered. The relative
complexity (reading difficulty) of material that is pre-
sented clearly impacts upon the comprehensibility of
captions for a significant proportion of the target con-
sumer group—people with hearing loss. This presents
Table 4 Frequency of comments (percentage) in Experiment 2 by language preference and caption speed
Auslan (n 5 16) No Auslan (n 5 23)
Strict Moderate Verbatim Strict Moderate Verbatim
Positive comment 2 (12.5) 3 (18.8) 3 (18.8) 7 (30.4) 5 (21.7) 6 (26.1)Captions are too fast/faster than in other videos 3 (18.8) 1 (6.3) 0 (0) 2 (8.7) 2 (8.7) 5 (21.7)Captions are too slow/slower than in other videos 1 (6.3) 0 (0) 0 (0) 0 (0) 0 (0) 0 (0)Words don’t come up while talking, not captionedword-for-word 1 (6.3) 0 (0) 7 (43.8) 0 (0) 0 (0) 0 (0)Hard to remember details, missed some 2 (12.5) 3 (18.8) 0 (0) 4 (17.4) 2 (8.7) 5 (21.7)
Caption Rate and Text Reduction 401

a real issue, for closed captioning of ‘‘free-to-air’’
broadcast material and also for captioning of widely
distributed material for public consumption such as
DVD recordings of popular movies and programs
for which the range of potential consumers and po-
tential reading abilities will be very broad. Unless
there is some consideration of the complexity of the
captions, there will likely be some significant impact
on the comprehension of those captions by a pro-
portion of the target audience. These considerations
would seem to be particularly important in educa-
tional contexts where material may be captioned with
the intention of making curriculum-based informa-
tion available to learners. In this context, the results
of these studies are of particular interest given the
type of material used—video documentaries, with
a need to remember the material. In this case, the
rates of correctly remembered material were quite
low—around 25% for less proficient readers and
50% for more proficient readers. As no comparisons
between different sorts of video material were in-
cluded here, it would be of interest to follow this
up in future studies.
In summary, two experiments were conducted
involving separate manipulation of caption rate and
text reduction unaccompanied by more eyeball time.
There are effects of captions rate, but these are not
straightforward; they depend on hearing status and
reading level. Comprehension does improve as a func-
tion of reading speed, and caption rate reductions
selectively improve comprehension by more proficient
readers: hard-of-hearing more proficient readers
were best at the medium rate, 180 wpm, and deaf
more proficient readers were best at the slowest rate,
130 wpm.
Thus, it may be concluded that the propensity to
benefit from caption rate modifications depends very
much on being a more proficient reader. There are also
indications in the data from Experiment 2 that the
propensity to benefit from text reduction modifica-
tions may depend on being a more proficient reader,
but this requires further research. In this regard it
should be noted that, for the sake of experimental
control caption rate and text reduction (along with
the use of silent presentations) were used here. These
manipulations have advanced our understanding of
these two factors on caption comprehension, but fu-
ture studies may be designed to be somewhat more
ecologically valid. For example, a further study in
which both caption rate and text reduction were
employed in a composite condition would be instruc-
tive. Irrespective of the outcome of such future stud-
ies, it is clear from the current results that reading
proficiency will probably be important in any manip-
ulation involving captions in future studies.
As the results show that the benefits of captions
depend very much on various factors inherent in the
user, two options are open for recommendations for
future caption use: (a) to select caption rates and text
reduction methods that suit the majority of the viewers
under the majority of circumstances or (b) to provide
individual tailoring of caption delivery. With regard to
the first option, the fact that there is no main effect of
caption rate on comprehension and that people tended
to prefer the slower rate (130 wpm) suggest that this is
the rate that should be used. Additionally, as there was
no main effect of text reduction level (down to the
minimum rate of 84% used here), then it could well
be recommended that such a caption reduction rate
would be acceptable for documentaries spoken at a high
rate. Such across-the-board recommendations are of
course the easiest to implement, both in terms of cost
and technology. However, as there are interactions of
various factors (hearing loss, reading level) with caption
rate, if cost were no object then the second, individual
tailoring option noted above could be followed. Recent
advances in digital technology offer the possibility that,
in future, viewers will be able to select from a range
of captioning parameters to suit their own needs (cf.
Kirkland, 1999). If such an individual tailoring approach
is to be adopted, it is then the challenge of future re-
search to determine what these needs are for different
sections of the caption-viewing community (deaf, hard-
of-hearing, and other caption users) and the challenge of
advocates of captioning to ensure the funds for such
options are available, so to increase the accessibility of
captions for all sections of the viewing public.
Funding
Australian Research Council Industry Linkage Grant
(LP0219614 to D.B., G.L., and W.N.).
402 Journal of Deaf Studies and Deaf Education 13:3 Summer 2008

Appendix A: Example Questions for the Three Stories in Experiment 1
Appendix B: Example Questions for the Three Stories in Experiment 2
Note
1. For example, for the 180-wpm condition, the displaytime is 180 wpm; if there were three words in the caption, itwould be presented for 1 s and six words would be presented for2 s. Thus, text-reduced captions were presented for a shorterperiod of time so that the participants still had the same amountof time to read each word, and the caption rate in terms ofnumber of words on the screen to be read in a certain timeperiod remained constant.
References
Baker, R. (1985). Subtitling television for deaf children. Mediain Education Research Series, 3, 1–46.
Boyd, J., & Vader, E. A. (1972). Captioned television for thedeaf. American Annals of the Deaf, 117, 34–37.
Braverman, B. (1981). Television captioning strategies:A systematic research and development approach. AmericanAnnals of the Deaf, 126, 1031–1036.
Braverman, B. B., & Hertzog, M. (1980). The effects of captionrate and language level on comprehension of a captionedvideo presentation. American Annals of the Deaf, 125,943–948.
Burnham, D., Brown, H., Leigh, G., Noble, W., Varley, A.,Green, D., et al. (2002). Survey of television captionusage in Australia in November 2000. Industry Report,MARCS Auditory Laboratories University of WesternSydney. Retrieved January 2008, from http://marcs.uws.edu.au/documents/public/Television_Caption_Usage.pdf.
Ewoldt, C. (1984). Problems with rewritten materials, as exem-plified by ‘‘to build a fire.’’ American Annals of the Deaf, 129,23–28.
Games, P. A., & Howell, J. F. (1976). Pairwise multiple compar-ison procedures with unequal N’s and/or variances: AMonte Carlo study. Journal of Educational Statistics, 1,113–125.
Games, P. A., Keselman, H. J., & Rogan, J. C. (1981). Simul-taneous pairwise multiple comparison procedures for meanswhen sample sizes are unequal. Psychological Bulletin, 90,594–598.
Israelite, N., & Helfrich, M. (1988). Improving text coherencein basal readers: Effects of revisions on the comprehensionof hearing-impaired and normal-hearing readers. VoltaReview, 90, 261–276.
Jelinek Lewis, M. S., & Jackson, D. W. (2001). Television liter-acy: Comprehension of program content using closed
Table A Examples of (a) multiple-choice and (b) open-ended comprehension questions for the stories in Experiment 1
Story Multiple-choice example Open-ended example
BuildingIndemnity
How many years has it taken Greg to build up hisbusiness from nothing? a) 1, b) 4, c) 7, d) 10.
According to Greg Reilly, what isthe great Aussie dream?
Fish Fight What was the name of the program designed to clean up MoretonBay? a) Sunaqua, b) Environment Integration Systems, c) TheHealthy Waterways program, d) Clean Up Moreton Bay.
How much did local councils spendto repair the damage?
WaterConservation
What has Perth’s longstanding water scarcity turned into? a)A crisis, b) a drought, c) a shortage, d) a deficit.
Water runoff has reduced by whatpercentage in the last century?
Table B Examples of (a) multiple-choice and (b) open-ended comprehension questions for the stories in Experiment 2
Story Multiple-choice example Open-ended example
MaritimeMuseum
Architect Steve Goodall grew up doing what? a) Discoveringand diving on old shipwrecks, b) Studying Italian architecture,c) Working on the wharves of a port, d) Boating on the SwanRiver
How high is the new Maritime Museum?
Save theBilby
How many bilbies are going to be released in CurrawinyaNational Park? a) 14, b) 21, c) 40, d) 200
How long has Peter McCrae been savingrare Australian species?
HuonSupply
For how long did Dave Roberts have a contract with ForestryTasmania? a) 6 years, b) 10 years, c) 16 years, d) 20 years.
According to Dave Roberts, what maximumpercentage of timber could be recovered?
Caption Rate and Text Reduction 403

captions for the deaf. Journal of Deaf Studies and Deaf
Education, 6(1), 43–53.Jensema, C. (1998). Viewer reaction to different television
captioning speeds. American Annals of the Deaf, 143,
318–324.Jensema, C., McCann, R., & Ramsey, S. (1996). Closed-
captioned television presentation speed and vocabulary.
American Annals of the Deaf, 141, 284–292.Jones, C., Burnham, D., Leigh, G., Noble, W., Brown, H.,
Varley, A., et al. (2008). The Australian television caption
users survey (2000): Who uses captions, when, and why?
Manuscript in preparation.Karchmer, M. A., & Mitchell, R. E. (2003). Demographic
and achievement characteristics of deaf and hard-of-hearing
students. In M. Marschark & P. E. Spencer (Eds.), Oxford
handbook of deaf studies, language, and education (pp. 21–37).
New York: Oxford University Press.Kirkland, C. E. (1999). Evaluation of captioning features
to inform development of digital television captioning
capabilities. American Annals of the Deaf, 144, 250–
260.Shroyer, E., & Birch, J. (1980). Captions and reading rates of
hearing-impaired students. American Annals of the Deaf,
125, 916–922.Stewart, D. (1984). Captioned television for the deaf. British
Columbia Journal of Special Education, 8, 61–69.Sundbye, N. (1987). Text explicitness and inferential question-
ing: Effects on story understanding and recall. Reading
Research Quarterly, 22, 82–98.Walker, L. M., & Rickards, F. W. (1992). Reading com-
prehension levels of profoundly, prelingually deaf students
in Victoria. Australian Teacher of the Deaf, 32, 32–47.Yurkowski, P., & Ewoldt, C. (1986). A case for the semantic
processing of the deaf reader. American Annals of the Deaf,
131, 243–247.
Received November 10, 2007; revisions received January 30,2008; accepted January 30, 2008.
404 Journal of Deaf Studies and Deaf Education 13:3 Summer 2008