the journal of neuroscience, november 1988, 8(11):...
TRANSCRIPT

The Journal of Neuroscience, November 1988, 8(11): 4400-4410
Korsakoff’s Syndrome: Radiological Neuropsychological Correlates
(CT) Findings and
Arthur P. Shimamura, Terry L. Jernigan, and Larry R. Squire
Veterans Administration Medical Center, San Diego, California 92161, and Department of Psychiatry, University of California, San Diego, La Jolla, California 92093
Quantitative analyses were performed on computer to- mography (CT) scans from 7 patients with Korsakoff’s syn- drome, 7 age-matched alcoholic subjects, and 7 age-matched healthy control subjects. CT values were used to estimate tissue density and fluid volume in specified brain areas. Tissue density was assessed by averaging CT values in small (5 x 5 mm) areas sampled bilaterally in 6 specified areas-thalamus, head of the caudate nucleus, putamen, anterior white matter, posterior white matter, and centrum semiovale. We assessed fluid volume using a semiauto- mated computer algorithm that estimated the proportion of fluid in 7 brain regions-total ventricular space, third ven- tricle, interventricular region, frontal sulci, peri-Sylvian re- gion, medial cerebellum, and vertex. For the patients with Korsakoff’s syndrome, we also assessed the correlation be- tween CT measures and performance on 6 cognitive and 12 memory tests.
Compared with alcoholic subjects and healthy control sub- jects, patients with Korsakoff’s syndrome had lower CT den- sity values bilaterally in the region of the thalamus and had greater estimated fluid bilaterally in the region of the third ventricle. Alcoholic and healthy control subjects did not dif- fer on these measures. Significant cortical atrophy in frontal sulcal and peri-Sylvian areas was detected both in patients with Korsakoff’s syndrome and in alcoholic subjects. For patients with Korsakoff’s syndrome, impairment on behav- ioral tests, and on memory tests in particular, was correlated with low-density values in the thalamus and with high fluid values in the region of the frontal sulci. Damage to dience- phalic and frontal areas may especially contribute to the memory and cognitive impairment exhibited by patients with Korsakoff’s syndrome.
Nemobehavioral studies of amnesic patients have provided use- ful information about the neural organization of learning and memory. Patients with damage to the medial temporal lobe or to the diencephalic midline exhibit a relatively circumscribed deficit in memory (Scoville and Milner, 1957; Mair et al., 1979; Zola-Morgan et al., 1986). The hallmark feature of the memory
Received Feb. 18, 1988; revised Apr. 4, 1988; accepted Apr. 5, 1988. This research was supported by the Medical Research Service of the Veterans
Administration. bv National Institute of Mental Health Grant MH24600. and bv the Office of Naval Research. We thank Joyce Zouzounis and Rim Rivero-F&k for neuropsychological testing and Tom Diamond, David Foster, Paula Shear, and Russell Sprague for computer assistance.
Correspondence should be addressed to Arthur P. Shimamura, VA Medical Center (V116A), 3350 La Jolla Village Drive, San Diego, CA 92 16 1. Copyright 0 1988 Society for Neuroscience 0270-6474/88/114400-l 1$02.00/O
impairment is an inability to remember events, episodes, and facts encountered since the onset of amnesia. Impairment can be so severe that memory is impaired even when testing is conducted only a few minutes after learning. Yet intellectual and language skills are typically preserved. Moreover, certain kinds of learning and memory-notably skill learning, priming, and adaptation-level effects-can be acquired and retained by amnesic patients in an entirely normal fashion (for reviews, see Parkin, 1982; Shimamura, 1986; Squire, 1987; Squire and Zola- Morgan, 1988).
KorsakolI’s syndrome-the most frequently studied etiology of amnesia-develops as a result of nutritional deficiency and many years of chronic alcohol abuse (Talland, 1965; Victor et al., 197 1; Mair et al., 1979; Butters and Cermak, 1980). Neu- ropathological findings suggest that the memory impairment observed in Korsakoff s syndrome is attributable to damage in the diencephalic midline-particularly in the mediodorsal nu- cleus of the thalamus and the mammillary nuclei. In an exten- sive neuropathological study, Victor et al. (197 1) examined post- mortem material from 53 cases with Wemicke-Korsakoffs syndrome. For 26 of these cases, symptoms of Korsakoff s syn- drome had been recognized during life. All of the cases with Korsakoffs syndrome that were subjected to histological anal- ysis showed evidence of damage to the mediodorsal nucleus of the thalamus and mammillary nuclei. Similar results were ob- tained in 2 carefully studied cases by Mair et al. (1979), who found bilateral lesions in the mammillary nuclei, as well as gliosis adjacent to the walls of the third ventricle.
Other investigators have emphasized that neocortical damage is a prominent feature of Korsakoffs syndrome (see Lishman, 1981). In the Victor et al. (1971) study, 29 of 5 1 cases with Wernicke-Korsakoff s syndrome (56.9%) exhibited signs of cor- tical atrophy. Cortical atrophy might account for some of the cognitive deficits observed in patients with Korsakoffs syn- drome, including deficits on tests of attention, problem solving, card sorting, metamemory, and temporal order (Oscar-Berman, 1980; Squire, 1982; Freedman and Oscar-Berman, 1986; Shi- mamura and Squire, 1986b; Janowsky et al., in press; Squire and Zouzounis, in press). Indeed, some of these same cognitive deficits have been observed in patients with circumscribed fron- tal lobe lesions (Moscovitch, 1982; Janowsky et al., in press).
Only a few studies have evaluated structural damage in pa- tients with Korsakoffs syndrome using in viva brain imaging techniques. Two CT studies, each involving a single patient, showed structural abnormalities along the diencephalic midline (McDowell and LeBlanc, 1984; Mensing et al., 1984). In 2 other studies, CT data from patients with Korsakoff s syndrome were

The Journal of Neuroscience, November 1988, 8(11) 4401
used to correlate structural damage with cognitive impairment. In the first study (Carlen et al., 1981) CT data were obtained from 25 patients with Korsakoffs syndrome. Linear measures of sulcal widening and ventricular enlargement were found to be correlated negatively with performance on the Wechsler Adult Intelligence Scale. In the second study (Jacobson and Lishman, 1987) interhemispheric fissure width was correlated with in- tellectual decline but not with the severity of memory impair- ment.
Many questions remain about the structural damage in Kor- sakoff s syndrome and its relationship to cognitive impairment. What subcortical damage can be reliably detected in patients with Korsakoff s syndrome? In what cortical areas can atrophy be detected in patients with Korsakoffs syndrome? Is cortical atrophy in Korsakoffs syndrome comparable to the atrophy seen in chronic alcoholics without severe memory impairment or is it more severe? In particular, is frontal lobe atrophy typ- ically found in patients with Korsakoffs syndrome? Finally, what is the relationship between detectable cortical and sub- cortical damage and cognitive impairment?
The present investigation assessed structural brain changes in 7 patients with Korsakoff s syndrome using quantitative anal- yses of CT scans. We compared these patients to 7 alcoholic subjects and 7 healthy control subjects, who matched the pa- tients with Korsakoffs syndrome with respect to age and edu- cation level. Using a semiautomated, quantitative analysis of CT scans, we obtained estimates of tissue density and fluid volume in various cortical and subcortical brain regions (see Jemigan et al., 1979, 1982; Pfefferbaum et al., 1986). Because these patients with Korsakofl’s syndrome have received exten- sive neuropsychological testing with a variety of memory and other cognitive tests (see Shimamura and Squire, 1986a, b; Squire and Shimamura, 1986), it was possible to perform correlational analyses between behavioral impairment and structural damage. In this way, we assessed the relationship between functional impairment and structural damage.
Materials and Methods Subjects Patients with Korsakoffs syndrome. Seven patients with Korsakoll’s syndrome (5 men, 2 women) participated in the experiment. All patients readily volunteered for CT scans and signed consent forms approved by the local Committee for Research on Human Subjects. The patients lived in supervised facilities in San Diego County and have been studied as a group for several years (see Squire, 1982; Shimamura and Squire, 1986a, b). They averaged 53.9 years of age and 11.3 years of education. Their average Wechsler Adult Intelligence Scale (WAIS) score was 102 (WAIS-Revised = 92.1), and their average Wechsler Memory Scale (WMS) score was 78.4. The WAIS-WMS difference score was 24.4 (range, 16-38). In normal subjects, the WMS score is equivalent to WAIS IQ. Scores on the WMS-Revised were available for 6 of the 7 patients. The index scores were as follows: Attention and Concentration, 86.7; Verbal Memory, 72.0; Nonverbal Memory, 69.7; General Mem- ory, 64.8; Delayed Memory, 55.7. For all 7 patients, recall of a short prose passage was 4.0 segments for immediate recall and 0 segments for delayed (12 min) recall (2 1 segments total). Average scores for copy and delayed recall ( 12 min) of a complex diagram (Rey-Osterreith figure) were 27.1 and 2.7 segments, respectively (36 segments total). Paired- associate memory of 10 unrelated noun-noun pairs on each of 3 suc- cessive trials was 0.4,O. 1, and 0.9. Also, on 5 successive study-test trials (Rey Auditory Verbal Learning Test: Rey, 1964; Lezak, 1983), these oatients averaned 3.2. 4.3. 4.4, 4.3, and 4.5 for free recall of 15 nouns; and 19.3, 23.6, 23.6,‘24.9, and 25.2 correct for yes-no recognition of 15 old nouns and 15 new nouns.
Neuropsychological screening and independent neurological exami- nation indicated that memory impairment was the only remarkable deficit of higher cortical function. The amnesic patients averaged 128
points out ofa possible 144 points on the Dementia Rating Scale (Mattis, 1976) losing most of their points on the memory subportion of the test. All patients could draw a cube and a house in perspective, and none had aphasia or apraxia. Additional neuropsychological data for 6 of these 7 patients, as well as control data for the just-mentioned tests, can be found in Squire and Shimamura (1986).
Alcoholic control subjects. Seven alcoholic control subjects (6 men, 1 woman) participated in the experiment. All were current or former participants in San Diego County alcohol treatment programs. They had an average drinking history of 21 years but had abstained from alcohol for an average of 18 months (range, 2-70 months) prior to participating in the experiment. These subjects were matched to the amnesic patients with respect to age (52.1 years), education (11.9 years), and WAIS-Revised subtest scores: information (19.0 vs 17.6 for amnesic patients) and vocabulary (43.3 vs 44.4 for amnesic patients). For im- mediate and delayed recall (12 min) of a short prose passage, they averaged 6.2 and 5.7 segments, respectively.
Healthy control subjects. Seven healthy control subjects (5 men, 2 women) participated in the experiment. These subjects were employees of the Veterans Administration Medical Center and were matched to the amnesic patients with respect to age (55.7 years), education (12.4 vears). and WAIS-Revised subtest scores: information (20.6 vs 17.6 for amnesic patients) and vocabulary (50.0 vs 44.4 for amnesic patients). For immediate and delayed recall (12 min) of a short prose passage, they averaged 8.4 and 7.6 segments, respectively.
CT scanning and data analysis Head CT scans were conducted on an Ohio Nuclear 2060 body scanner located at the San Diego Veterans Administration Medical Center. Sec- tions were obtained at approximately + 15” to the canthomeatal line. The scanning protocol was as follows: (1) sections through the posterior fossa were 10 mm thick and contiguous; (2) starting at the tops of the petrous pyramids, 6 sections were obtained that were each 5 mm thick and contiguous; (3) higher sections, through the centrum semiovale and vertex regions, were again 10 mm thick and contiguous. Two patients with Korsakoll’s syndrome were scanned using contiguous 10 mm sec- tions for all sections. For all subjects the CT sections began in the posterior fossa and continued through the centrum semiovale to the vertex.
Each CT section produced an image matrix with 256 x 256 pixels. Each pixel represented the CT attenuation value in Hounsfield units (HU) for a volume of brain tissue having a 1 x 1 mm surface area and a thickness of 5 mm (for 5 mm sections) or 10 mm (for 10 mm sections). Quantitative analyses of these image matrices were performed on an image-processing system that included a Columbia Data Products (IBM- XT type) host computer and a Vectrix graphics display system. The method used here is an extension of ones described previously (Gado et al., 1982; Pfefferbaum et al., 1986). The present method differed from the ones described bv Pfefferbaum et al. (1986) nrimarilv in that no spatial filtering was employed. Spatial filtering techniques have been used previously to reduce scanning artifacts, but we decided against them because of the possibility that they might introduce other extra- neous errors into the data.
Two kinds of quantitative CT measures were obtained. First, to es- timate tissue density, mean CT attenuation values were sampled within a 5 x 5 mm area in 6 brain areas (caudate nucleus, putamen, thalamus, white matter of the centrum semiovale, frontal white matter, and pos- terior white matter). Second, estimates of fluid volume were obtained in 7 brain regions (cerebellum, all ventricles, third ventricle, interven- tricular region, Sylvian fissure, frontal sulcal region, vertex sulcal region). All stages of these analyses were conducted blind with coded material so that the experimenter was never aware of the patient’s identity or the subject group to which the patient belonged. The following sections describe the methods in greater detail.
Estimating tissue density We estimated brain tissue density within 6 areas- head of the caudate nucleus, lentiform nucleus (primarily putamen), thalamus, white matter of the centrum semiovale, frontal lobe white matter, and posterior white matter. The experimenter first selected the CT section that best imaged the area to be sampled and displayed it on the image-processing system. In addition, the sections just above and just below this section were displayed at the same time so that the operator could avoid inadvertently including in the tissue density measure other structures lying above or below the brain structure of interest. A 5 x 5 mm area (25 pixels) was
4402 Sbimamura et al. - Korsakoff’s Syndrome
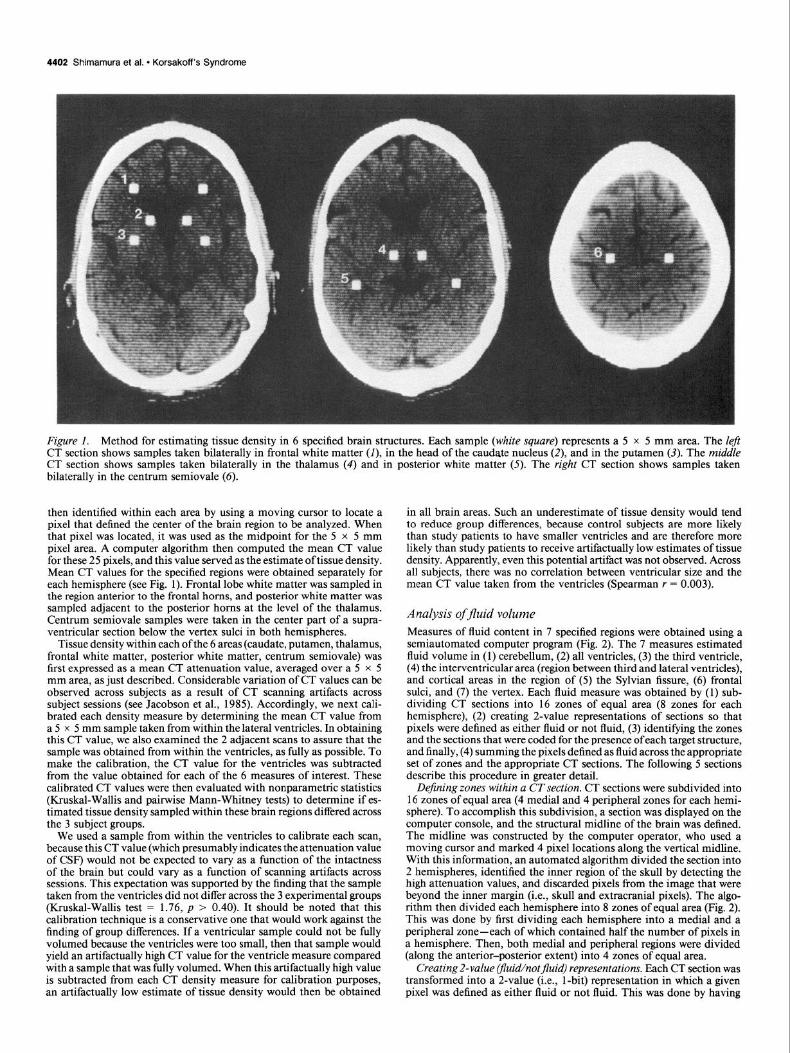
Figure 1. Method for estimating tissue density in 6 specified brain structures. Each sample (white square) represents a 5 x 5 mm area. The Zeji CT section shows samples taken bilaterally in frontal white matter (I), in the head of the caudate nucleus (2) and in the putamen (3). The middle CT section shows samples taken bilaterally in the thalamus (4) and in posterior white matter (5). The right CT section shows samples taken bilaterally in the centrum semiovale (6).
then identified within each area by using a moving cursor to locate a pixel that defined the center of the brain region to be analyzed. When that pixel was located, it was used as the midpoint for the 5 x 5 mm pixel area. A computer algorithm then computed the mean CT value for these 25 pixels, and this value served as the estimate of tissue density. Mean CT values for the specified regions were obtained separately for each hemisphere (see Fig. 1). Frontal lobe white matter was sampled in the region anterior to the frontal horns, and posterior white matter was sampled adjacent to the posterior horns at the level of the thalamus. Centrum semiovale samples were taken in the center part of a supra- ventricular section below the vertex sulci in both hemispheres.
Tissue density within each ofthe 6 areas (caudate, putamen, thalamus, frontal white matter, posterior white matter, centrum semiovale) was first expressed as a mean CT attenuation value, averaged over a 5 x 5 mm area, as just described. Considerable variation of CT values can be observed across subjects as a result of CT scanning artifacts across subject sessions (see Jacobson et al., 1985). Accordingly, we next cali- brated each density measure by determining the mean CT value from a 5 x 5 mm sample taken from within the lateral ventricles. In obtaining this CT value, we also examined the 2 adjacent scans to assure that the sample was obtained from within the ventricles, as fully as possible. To make the calibration, the CT value for the ventricles was subtracted from the value obtained for each of the 6 measures of interest. These calibrated CT values were then evaluated with nonparametric statistics (Kruskal-Wallis and pairwise Mann-Whitney tests) to determine if es- timated tissue density sampled within these brain regions differed across the 3 subject groups.
We used a sample from within the ventricles to calibrate each scan, because this CT value (which presumably indicates the attenuation value of CSF) would not be expected to vary as a function of the intactness of the brain but could vary as a function of scanning artifacts across sessions. This expectation was supported by the finding that the sample taken from the ventricles did not differ across the 3 experimental groups (Kruskal-Wallis test = 1.76, p > 0.40). It should be noted that this calibration technique is a conservative one that would work against the finding of group differences. If a ventricular sample could not be fully volumed because the ventricles were too small, then that sample would yield an artifactually high CT value for the ventricle measure compared with a sample that was fully volumed. When this artifactually high value is subtracted from each CT density measure for calibration purposes, an artifactually low estimate of tissue density would then be obtained
in all brain areas. Such an underestimate of tissue density would tend to reduce group differences, because control subjects are more likely than study patients to have smaller ventricles and are therefore more likely than study patients to receive artifactually low estimates of tissue density. Apparently, even this potential artifact was not observed. Across all subjects, there was no correlation between ventricular size and the mean CT value taken from the ventricles (Spearman r = 0.003).
Analysis ofjluid volume Measures of fluid content in 7 specified regions were obtained using a semiautomated computer program (Fig. 2). The 7 measures estimated fluid volume in (1) cerebellum, (2) all ventricles, (3) the third ventricle, (4) the interventricular area (region between third and lateral ventricles), and cortical areas in the region of (5) the Sylvian fissure, (6) frontal sulci, and (7) the vertex. Each fluid measure was obtained by (1) sub- dividing CT sections into 16 zones of eaual area (8 zones for each hemisphere), (2) creating 2-value representations of sections so that pixels were defined as either fluid or not fluid, (3) identifying the zones and the sections that were coded for the presence ofeach target structure, and finally, (4) summing the pixels defined as fluid across the appropriate set of zones and the appropriate CT sections. The following 5 sections describe this procedure in greater detail.
Dejining zones within a CT section. CT sections were subdivided into 16 zones of equal area (4 medial and 4 peripheral zones for each hemi- sphere). To accomplish this subdivision, a section was displayed on the computer console, and the structural midline of the brain was defined. The midline was constructed by the computer operator, who used a moving cursor and marked 4 pixel locations along the vertical midline. With this information, an automated algorithm divided the section into 2 hemispheres, identified the inner region of the skull by detecting the high attenuation values, and discarded pixels from the image that were beyond the inner margin (i.e., skull and extracranial pixels). The algo- rithm then divided each hemisphere into 8 zones of equal area (Fig. 2). This was done by first dividing each hemisphere into a medial and a peripheral zone-each of which contained half the number of pixels in a hemisphere. Then, both medial and peripheral regions were divided (along the anterior-posterior extent) into 4 zones of equal area.
Creating2-value Ifluid/notjluid) representations. Each CT section was transformed into a 2-value (i.e., l-bit) representation in which a given pixel was defined as either fluid or not fluid. This was done by having

The Journal of Neuroscience, November 1988,8(11) 4403
trained (but blind) operators select a criterion CT value so that the ventricular and sulcal fluid areas that could be visualized in the original scan could still be visualized in the 2-value representation. All pixels below this criterion CT value were then defined as fluid. Care was taken to calibrate the criterion CT value so that the 2-value representation discriminated fluid from tissue as accurately as possible.
Coding sections for target structures. One of us (T.L.J.) viewed each CT image and determined the presence or absence of the 6 target struc- tures needed to derive the 7 fluid measures. All sections that were above the petrous pyramids and were relatively free of significant artifact were coded. Each section was coded for the presence or absence of (1) cer- ebellum, (2) ventricles, (3) specifically the third ventricle, (4) thalamus, (5) Sylvian fissure (which was needed to derive two of the measures of sulcal fluid), and (6) vertex. The sections coded for cerebellum, ventri- cles, third ventricle only, and Sylvian fissure were simply those sections in which the appropriate structure was present. The thalamus code was assigned to those CT sections in which thalamus was present but not
Figure 2. Method for estimating fluid volume. A, CT section taken at the level of the thalamus. B, Two-value repre- sentation of CT section. Each brain pix- el is represented as either fluid (white) or nonfluid (black). C, Division of CT section into 8 zones for each hemi- sphere (4 medial and4 peripheral zones). D, Two-value representation of CT sec- tion superimposed onto zone divisions. To measure fluid volume in defined brain regions, we calculated the pro- portion of fluid pixels in specified zones taken from specified CT sections.
the third ventricle. For the vertex code, one section from each subject was chosen to be as near to the vertex as possible but low enough so that the CT values were not too strongly affected by apical artifacts.
Measures of estimatedfluid volume. To obtain estimates of fluid vol- ume, we summed fluid pixels over a set of specified zones. Each set of zones was assessed twice, once from each hemisphere. The specific zones in CT sections were defined for each of 7 fluid measures in the following manner:
1. To estimate fluid in the cerebellum, pixels identified as fluid in the most posterior medial zone were summed over all CT sections that were coded for the presence of cerebellum. This cerebellar measure included mostly vermal regions. Peripheral zones were omitted because of severe streaking artifacts generally present there.
2. The ventricular measure was the sum of fluid pixels in all 4 medial zones of those sections that were coded for the presence of ventricles. In sections that were also coded for the presence of cerebellum, the most posterior medial zone was not included.

4404 Shimamura et al. - Korsakoff’s Syndrome
3. A measure of fluid in the third ventricle was obtained by summing (1986) for evaluating and characterizing amnesic patients. Tests 1 O-l 2 fluid pixels in the 2 middle zones in the medial half of each section were described in a previous study of patients with Korsakoffs syn- coded for the presence of third ventricle. drome (Shimamura and Squire, 1986a).
4. A measure of interventricular fluid (i.e., fluid superior to the third ventricle and inferior to the lateral ventricles) was obtained by summing fluid pixels in the 2 middle zones in the medial half of each section coded for the presence of thalamus.
5. The final 3 measures provided estimates of sulcal fluid. Sulcu/fluid along the Sylvian Jissure was estimated by summing fluid pixels in the 2 middle zones in the peripheral half of each section coded for the presence of the Sylvian fissure.
6. Frontal sulcaljluid was estimated by summing fluid pixels in the most anterior zone in the peripheral half of each section coded for the presence of the Sylvian fissure. Thus, this measure of frontal sulcal widening was taken at the level of the Sylvian fissure.
7. Vertex sulcalfluid was estimated by summing the fluid from all 4 medial zones in the section coded for vertex. Peripheral zones were omitted because of severe apical artifacts.
The coding scheme determined which CT sections from each subject and how many CT sections from each subject contributed to each fluid measure. For example, for the measure of third ventricle fluid, fluid pixels were obtained from a set of zones in every CT section that had been coded for the presence of the third ventricle. Because the size of the target structures differed between subjects, subjects could also differ in the number of CT sections used to compute their CT fluid measures. As it turned out, for the patients with Korsakoffs syndrome more sec- tions were used in the computation of some of the fluid measures, relative to the other groups. Specifically, the average number of sections per subject used in the third ventricle fluid measure was 2.6, 2.0, and 1.7 sections for patients with Korsakoll’s syndrome, alcoholic subjects, and healthy control subjects, respectively. For both the frontal and the Sylvian fluid measures, the average number of sections per subject was 4.9, 3.9, and 3.6, respectively (for the other 4 measures, the average number of sections contributed per subject was almost identical across groups). Overall, the number of sections used in the 7 different fluid analyses did not differ significantly across groups (F[2, 181 = 1.87, p = 0 1x1
Because of the small number of patients, we did not use sophisticated and potentially more sensitive multivariate analyses. Instead, we used a correlational procedure (Shimamura and Squire, 1986a). We ranked the 7 patients with Korsakofl’s syndrome according to performance on each of the 18 behavioral tests (6 cognitive tests + 12 memory tests) and also ranked them according to CT data using each of the 6 CT density measures and each of the 7 CT fluid measures. Spearman non- parametric correlations were then performed on pairwise tests of each CT measure and each behavioral measure. Because each CT measure was taken twice, once from each hemisphere, we calculated a total of 36 independent correlations (i.e., 18 correlations between the left hemi- spheric CT measure and 18 behavioral tests; and 18 correlations between the right hemispheric CT measure and 18 behavioral tests). The number of positive correlations out of these 36 correlations was used to deter- mine if the number of positive correlations was greater than the number expected by chance @ < 0.05, 2-tailed test). We also calculated the number of positive correlations between each CT measure and the 12 memory tests. Because each hemisphere was measured separately, there were a total of 24 correlations between each CT measure and the mem- ory tests.
Results Figure 3 displays examples of CT images taken at the level of the thalamus from 2 healthy control subjects, 2 alcoholic sub- jects, and 2 patients with Korsakoff s syndrome. For each subject group, the top image shows the section with the highest (best) density value for the thalamus and the bottom image shows the section with the lowest (worst) value. Visual analysis of these sections does not provide strong evidence for group differences and illustrates the power of the quantitative approaches used here.
Statistical analyses ofjluid measures. Each subject contributed a total of 14 data points: 7 different brain regions were measured twice, once in each her&sphere. These data were f&t expressed as the total number of pixels identified as fluid in the specific set of zones defining the 7 regions. To normalize these values, they were divided by the total num- ber of pixels in the hemisphere from which the fluid pixels were derived. Thus, the measures of fluid within each brain region were expressed finally as percentages oftotal pixels within a hemisphere. Nonparametric analyses (Kruskal-Wallis and Mann-Whitney tests) were performed in order to determine if the percentage of fluid in the 7 regions differed across the 3 subject groups.
Estimated tissue density as measured by CT values Table 1 displays the median CT values for the measures of estimated tissue density sampled in the 6 regions of interest. Tests of group differences were assessed with the Kruskal-Wallis and with pairwise Mann-Whitney statistics. The only bilateral density values that yielded significant group differences were from the thalamic sample (p < 0.0 1; Fig. 4). In pairwise Mann- Whitney cornprisons of groups, the patients with Korsakofl’s syndrome had lower thalamic density values bilaterally than either alcoholic subjects (p < 0.01) or healthy control subjects (p < 0.01). The difference between alcoholics and healthy con- trol subjects was not significant (p > 0.2).
Structure/function correlational analyses Extensive neuropsychological data were available for the 7 patients with Korsakoll’s syndrome. Thus, in addition to evaluating possible group differences among the structural measures, we were also able to analyze structure/function correlations within the group of patients with Kor- sakoffs syndrome. Six tests of general cognitive impairment and 12 tests of new learning ability had been administered to these patients. The 6 tests of cognitive ability were (1) Digit symbol substitution test of the WAIS, (2) Wisconsin Card Sort Test (Berg, 1948; Milner, 1963; Heaton, 1981), (3) Dementia Rating Scale (Mattis, 1976), (4) Boston Naming Test (Kaplan et al., 1978), (5) Verbal Fluency Test (Benton and Hamsher, 1976), and (6) Embedded Figures Test (Gottschaldt, 1928; Corkin, 1979).
The 12 tests of new learning ability were (1) Wechsler Memory Scale, (2) Paired-associate learning, (3) Delayed (12 min) diagram recall, (4) Word recall from the Rey Aiditory Verbal Learning Test, and (5) Word recognition from the same test (Rev. 1964; Lezak, 1983). (6) Word, and (7) Face recognition (immediate &sting) irom tde Wanington Recog- nition Test (Warring&n, 1984), a delayed (24-hr) test of (8) Word and (9) Face recomition &mire and Shimamura. 1986). (10) Cued word iecall (36 woids, cueh with 3-letter beginnings of Goids; yes/no rec- ognition, or 2-alternative forced-choice recognition), (11) Word rec- ognition (24 words, 4-alternative forced-choice test), and (12) Sentence recognition (yes/no test with 24 old and 24 new sentences). All tests used different sets of stimuli and were assessed independently of each other. Memory tests l-9 were recommended by Squire and Shimamura
Across all 3 groups, bilateral density values in the caudate nucleus (see Fig. 5) approached statistical significance (p = 0.07). Painvise comparisons showed that the right caudate nucleus values were lower for the Korsakoff group than for either of the other 2 groups (p < 0.02). The only other finding from the CT density measures that reached statistical significance was that alcoholic subjects exhibited lower values in the left posterior white matter than healthy control subjects 0, = 0.05).
Fluid measures Table 2 displays the median estimated percentage fluid for the 7 brain regions obtained from the CT scans of healthy control subjects, alcoholic subjects, and patients with Korsakoff s syn- drome. Kruskal-Wallis analyses showed that the estimated per- centage fluid for the third ventricle measure differed significantly across the 3 subject groups @ < 0.05; Fig. 6). The groups also differed on 2 cortical measures, the frontal sulci and the Sylvian fissure (p < 0.05; Fig. 7). Kruskal-Wallis analyses for the other fluid measures did not approach statistical significance (p > 0.1).

ALC
K
OR
ST
‘OR
ST
Figu
re 3
. E
xam
ples
of C
T se
ctio
ns ta
ken
at th
e le
vel o
f the
thal
amus
fro
m 2
hea
lthy
cont
rol
subj
ects
, (H
C),
2 al
coho
lic s
ubje
cts
(AX
’),
and
2 pa
tient
s w
ith K
orsa
koff
s sy
ndro
me
(KO
R).
The
top
sect
ions
sho
w,
for
each
sub
ject
gro
up,
the
subj
ect
with
the
bes
t sc
ore
on t
he t
hala
mic
de
nsity
mea
sure
. The
bot
tom
sec
tions
sho
w,
for
each
sub
ject
gro
up,
the
subj
ect
with
the
w
orst
sco
re o
n th
e th
alam
ic
dens
ity m
easu
re.

4406 Shimamura et al. - Korsakoff’s Syndrome
HC -
ALC l!l
KOR
Figure 4-thalamus. Estimated tissue density in the thalamus. Bars indicate median scores for healthy control subjects (HC), alcoholic sub- jects (AX), and patients with Korsakoll’s syndome (KOR). Hatch marks represent individual scores.
Figures 6 and 7 also show that fluid measures obtained from the patients with Korsakoff s syndrome were quite variable. This variability parallels the heterogeneity of the behavioral im- pairment associated with Korsakoff s syndrome (see Squire and Shimamura, 1986; Jacobson and Lishman, 1987). Yet, despite this variability, group differences in both diencephalic and cor- tical regions were readily apparent.
In pairwise Mann-Whitney comparisons between groups, pa- tients with Korsakoff s syndrome differed from the other 2 groups on the third ventricle fluid measure (left hemisphere measure, p < 0.08; right hemisphere, p < 0.05) and on the Sylvian fissure fluid measure (left hemisphere, p < 0.05; right hemisphere, p < 0.06). In addition, the patients with Korsakoffs syndrome differed from healthy control subjects, but not from the alcoholic subjects, on the interventricular fluid measure (left and right hemisphere,p < 0.05) and on the left frontal sulcal fluid measure (p < 0.05) but not on the right frontal sulcal measure (p = 0.18). Compared with healthy control subjects, alcoholic subjects ex- hibited a greater percentage of fluid on the left Sylvian fissure measure (p < 0.02) and on the left frontal sulcal measure (p < 0.05). Alcoholic subjects also exhibited somewhat greater fluid on the right frontal sulcal measure (p = 0.09). Thus, for patients with Korsakoff’s syndrome, we detected more fluid in the region of the third ventricle, compared with both alcoholic and healthy control subjects, and more fluid in the interventricular region, compared with healthy control subjects. In addition, patients with Korsakoff s syndrome and alcoholic subjects differed from healthy control subjects on 2 cortical measures-the frontal sul- cal and Sylvian fissure fluid measures.
It should be noted that the fluid measures were based on the proportion of fluid pixels in defined zones relative to the total number of pixels in a hemisphere. Thus, the fluid pixels in defined zones were summed over the number of sections that were coded for that measure. As indicated in Materials and Methods (Coding sections for target structures), the third ven- tricle and Sylvian fissure were present on more sections in pa- tients with Korsakoff s syndrome compared with the other groups as a result of these patients having somewhat larger third ven- tricles and more extended Sylvian fissures. Because fluid pixels were summed over sections, the inclusion of additional sections
HC ALC
f! !l KOR
Figure j-caudate. Estimated tissue density in the head of the caudate nucleus. Bars indicate median scores for healthy control subjects (HC), alcoholic subjects (ALC), and patients with Korsakoff s syndrome (KOR). Hatch marks represent individual scores.
for the patients could have by itself accounted for group differ- ences. Although the experimenter who coded the sections was blind to subject group, it was important to determine if this coding scheme alone accounted for the group differences. Thus, we reanalyzed the fluid data in a way that avoids the problem of differential numbers of sections across subjects. Instead of summing fluid pixels across sections, we calculated for each subject the average number of fluid pixels per section, thereby eliminating any influence of the fact that each subject could contribute a different number of CT sections to the fluid mea- sures. The findings from this reanalysis were identical to the findings from the original analysis in every respect.
We also considered how the results might have been affected by using different numbers of zones to estimate the different fluid measures. For example, those measures that depended on 2 zones in one hemisphere (e.g., the third ventricle, interven- tricular, and Sylvian fissure measures) might be more likely to result in a significant finding than those measures that depended on only 1 zone in one hemisphere (e.g., the frontal sulcal mea- sure). We therefore analyzed the fluid data separately for each
1.6
u 1.0 .- z 0.8
O9 0.6
f
d ALC KOR
Figure 6-third ventricle. Estimated percentage fluid volume in the re- gion of the third ventricle. Bars indicate median scores for healthy control subjects (HC), alcoholic subjects (ALC), and patients with Kor- sakoff s syndrome (KOR). Hatch marks represent individual scores.

1.6 -
1.4 -
1.2 -
1.0 - 0 $ 0.6 -
O” 0.6 -
0.4 -
0.2 -
Frontal Sulci
T I o. HC ALC KOR
1.6 r Sylvian Fissure
1.4 t
”
HC ALC KOR
Figure 7. Estimated percentage fluid volume in the region ofthe frontal sulci (top) and Sylvian fissure (bottom). Bars indicate median scores for healthy control subjects (HC), alcoholic subjects (ML), and patients with Korsakoff s syndrome (KOR). Hatch marks represent individual scores.
zone for those measures that were composed of more than one zone. With one exception, the findings were identical when each zone was analyzed separately. The exception was that for the Sylvian fissure measure, group differences (Korsakoffs vs alco- holics and alcoholics vs healthy controls) were observed only in the more anterior zone of the 2 zones that comprised the Sylvian fissure measure. This result is probably due to the fact that most of the Sylvian fissure lies in the anterior zone.
Correlations between structural abnormalities and behavioral impairment
The 7 patients with Korsakoff s syndrome were ranked accord- ing to each structural (CT) measure (6 density measures and 7 fluid measures in each hemisphere). They were also ranked ac- cording to their performance on I8 behavioral tests (12 memory tests and 6 other cognitive tests) (see Materials and Methods). To calculate the relationship between CT measures and perfor- mance on behavioral tests, we obtained for each CT measure a total of 36 independently assessed Spearman correlations (2 hemisphere CT measures x 18 behavioral tests). Of the 6 CT density measures, only the thalamic density measure produced a significant number of positive correlations with behavioral tests (27136 positive correlations, p < 0.01). Of the 7 fluid measures, only the frontal sulcal measure was correlated with performance on behavioral tests (26136 positive correlations, p < 0.01). None of the other correlations approached statistical significance, including the correlations between behavioral mea- sures and other CT values that were affected in Korsakoh’s
The Journal of Neuroscience, November 1988, 8(11) 4407
Table 1. Measures of estimated tissue density (median CT values)
Healthy Alcoholic Korsakoff controls subjects patients
Region Left Right Left Right Left Right
Thalamus 31.2 30.2 29.2 29.8 27.5” 23.1aJ Putamen 30.4 32.2 30.9 31.1 31.1 30.9 Caudate nucleus 32.6 29.6 30.6 31.0 30.7 27.W Frontal white 24.6 25.4 23.9 24.7 27.5 25.0 Posterior white 28.3 26.2 24.2 23.5 25.6 24.6 Centrum 27.1 25.8 27.2 27.0 26.6 27.8
n Value smaller than that of healthy controls.
b Value smaller than that of alcoholic subjects. (statistics based on Mann-Whitney U tests, p -C 0.05).
syndrome, e.g., the density measure for the caudate nucleus, the third ventricle fluid measure, and the Sylvian fissure fluid mea- sure (p > 0.20).
When the correlations between CT measures and the 12 mem- ory tests were assessed separately, low thalamic CT density and greater fluid in the frontal sulcal region were correlated with memory impairment. Specifically, 18 of 24 positive correlations were observed between the thalamic CT measure and memory tests (median correlation = 0.34, p < 0.02; Fig. 8), and 18 of 24 positive correlations were observed between the frontal sulcal fluid measure and memory tests (median correlation = 0.43, p < 0.02; Fig. 9). Other CT measures that were significantly af- fected in Korsakoff’s syndrome did not correlate with the mem- ory tests (caudate nucleus density measure, 1 l/24 positive cor- relations; median correlation = -0.05; Fig. 8; Sylvian fissure fluid measure, 1 l/24 positive correlations; median correlation = -0.04; Fig. 9).
When the correlations between CT measures and the 6 cog- nitive tests were assessed separately, none of the correlations reached statistical significance. The number of positive corre- lations obtained for the thalamic density measure approached significance (9 of 12 positive correlations, p = 0.07). These analyses may not have produced a significant number ofpositive correlations because they were based on a total of only 12 cor- relations for each structural measure (compared with 24 cor- relations in the case of the memory tests).
Discussion Three important findings emerged from this investigation. First, patients with Korsakoff s syndrome exhibited diencephalic damage as measured by lower CT density values bilaterally in the region of the thalamus and greater estimated fluid bilaterally in the region of the third ventricle. These abnormalities were not detected in the CT scans of alcoholic subjects. Second, sig- nificant atrophy in frontal sulcal and peri-Sylvian areas was detected both in patients with Korsakoffs syndrome and in alcoholic subjects. Except for the finding of decreased tissue density in the right caudate nucleus, patients with KorsakoR’s syndrome did not exhibit significant CT abnormalities in any other brain region. Finally, for patients with Korsakoffs syn- drome, impairment on cognitive tests and on memory tests in particular was correlated with low-density values in the thal- amus and with greater fluid in the region of the frontal sulci.
These findings corroborate and extend previous neuropath- ological and radiological findings from patients with Korsa- koffs syndrome (e.g., Victor et al., 1971; Mair et al., 1979;

4408 Shimamura et al. * Korsakoff’s Syndrome
Table 2. Measures of estimated fluid volume (median percentage fluid)
Region
Healthy Alcoholic Korsakoff controls subjects patients
Left Right Left Right Left Right
Ventricles 3.99 3.57 3.89 3.45 5.96 5.58 Third ventricle 0.36 0.35 0.46 0.42 0.12 0.71a,b Interventricular 0.63 0.62 0.62 0.54 0.96a 0.86a Sylvian fissure 0.11 0.19 0.380 0.37 0.95a,b 0.64a Frontal sulci 0.18 0.19 0.42 0.32 0.m 0.37 Vertex 0.52 0.52 0.39 0.36 0.58 0.58 Cerebellum 0.35 0.35 0.24 0.22 0.45 0.36
a Value greater than that of healthy controls. b Value greater than that of alcoholic subjects. (Statistics based on Mann-Whitney U tests, p < 0.05.)
McDowell and LeBlanc, 1984). The results provide the first quantitative radiological evidence that diencephalic damage oc- curs in patients with Korsakoll’s syndrome and that the damage is greater than in chronic alcoholic subjects. In our sample, no differences between the alcoholic subjects and the healthy con- trol subjects could be demonstrated in the diencephalic region. A recent study of 24 non-Korsakoff alcoholic subjects did report
Thalamus x Memory Correlations
r F
Caudate x Memory Correlations
2 3 4 5 6 7 I I I I I I
- .4 - .6
- .a Md r = -.05
11124 positbe correlations -1.0 I- p > .5
Figure& Frequency distributions ofcorrelations between memory and 2 subcortical density measures. Top, Number of positive correlations (stippled area) and negative correlations (black area) calculated between the thalamic CT density values (one from each hemisphere) and the scores on 12 memory tests (median Spearman correlation [Md r,] = 0.34). Bottom, Number of positive and negative correlations calculated between the caudate CT density values and the scores on 12 memory tests (median Spearman correlation [Md r,] = -0.05).
that CT values in the region of the thalamus were correlated with paired-associate memory performance (Gebhardt et al., 1984). Although data for control subject> were not reported, the memory scores of the alcoholic subjects were quite variable, and some of the subjects appeared to perform quite poorly. One possibility is that thalamic damage is present only in those al- coholic subjects who exhibit memory impairment.
In contrast to the diencephalic findings, alcoholic subjects as well as patients with Korsakoffs syndrome exhibited greater cortical atrophy than healthy control subjects, as indicated by increased fluid in frontal sulcal and peri-Sylvian areas. In ad- dition, in the case of the peri-Sylvian area, patients with Kor- sakoff’s syndrome had marginally greater atrophy than alcoholic subjects. Previous CT studies have also reported cortical atro- phy in chronic alcoholic subjects (see Cala and Mastaglia, 198 1; Lishman, 1981; Jernigan et al., 1982; Wilkinson, 1985).
Findings from the correlational analyses suggested that cog- nitive impairment and memory impairment, in particular, are associated with both thalamic damage and cortical atrophy in frontal cortex. Behavioral test scores were not correlated with any other CT measures. That is, although CT abnormalities were detected in areas other than the thalamic and frontal sulcal region (e.g., in the caudate nucleus and in the peri-Sylvian re- gion), damage in the thalamic region and in the frontal sulcal region best correlated with cognitive test performance. Accord- ingly, damage in these 2 regions may especially contribute to
Frontal Sulcal Fluid x Memory Correlations
1.0 .a .6 .4 .2
Ts 0 - .2 - .4 - .6 - .8
-1.0
1 2 3 4 5 6 7 0
I- 16/24 positive correlations
Sylvian Fissure Fluid x Memory Correlations
1 .o .a .6 .4 .2
rs 0 I:4 2
- .6 - .0
- 1.0
1 2 3 4 5 6 I I I I I I
Md rs = -.04 11124 positive correlations
p > .5
Figure 9. Frequency distributions of correlations between memory and 2 cortical fluid measures. Top, Number of positive correlations (stippled area) and negative correlations (black area) calculated between the fron- tal sulcal fluid CT values and the scores on 12 memory tests (median Spearman correlation [Md r,] = 0.43). Bottom, Number of positive and negative correlations calculated between the Sylvian fissure fluid CT values and the scores on 12 memory tests (median Spearman correlation [Md r,] = -0.04).

The Journal of Neuroscience, November 1988, 8(11) 4409
the impaired memory and cognitive test performance exhibited by patients with Korsakoff s syndrome.
A relationship between diencephalic damage and memory impairment has been previously established in both humans (Victor et al., 197 1; Mair et al., 1979) and nonhuman primates (Aggleton and Mishkin, 1983; Zola-Morgan and Squire, 1985). In comparison, the relationship between frontal atrophy and memory test performance has not been studied extensively. It has been suggested that some of the deficits observed in patients with Korsakoffs syndrome are related to frontal lobe damage (Moscovitch, 1982; Squire, 1982; Schacter, 1987; Shimamura, in press). A direct test of this hypothesis was conducted by Janowsky et al. (in press), who showed that patients with frontal lobe damage were not amnesic but nonetheless did exhibit some deficits that are exhibited by patients with Korsakoff s syndrome but not by other amnesic patients. Specifically, patients with circumscribed frontal lobe damage, as well as patients with Kor- sakoff s syndrome, exhibited deficits in card-sorting, attention, and initiation, and they appeared to have a larger impairment in free recall than would be expected from their level of rec- ognition memory performance (see also Shallice and Evans, 1978; Oscar-Berman, 1980; Smith and Milner, 1984).
In summary, the present findings suggest that diencephalic and cortical damage occur together in patients with Korsakoff s syndrome. This combination of damage may determine the pat- tern of deficits on memory and other cognitive tests that are associated with this syndrome. In alcoholic subjects, cortical atrophy, but not diencephalic damage, was readily detected, even though these subjects did not exhibit severe memory im- pairment. Taken together, these findings are consistent with the view (see Butters, 1985; Lishman et al., 1987) that Korsakoffs syndrome results from 2 separate effects. Nutritional deficiency may result primarily in diencephalic damage, which causes or contributes to the memory impairment. The toxic effect of al- cohol and its metabolites may result in cortical atrophy. These 2 effects in combination may account for the heterogeneity of cognitive impairment associated with Korsakoffs syndrome.
References Aggleton, J. P., and M. Mishkin (1983) Visual recognition impairment
following medial thalamic lesions in monkeys. Neuropsychologia 21: 189-197.
Benton, A. L., and K. deS. Hamsher (1976) Multilingual Aphasia Examination, University of Iowa Press, Iowa City.
Berg, E. A. (1948) A simple objective test for measuring flexibility in thinking. J. Gen. Psychol. 39: 15-22.
Butters, N. (1985) Alcoholic Korsakoff s syndrome: Some unresolved issues concerning etiology, neuropathology, and cognitive deficits. J. Clin. Exp. Neuropsychol. 7: 18 l-2 10.
Butters, N., and L. S. Cermak (1980) Alcoholic Korsakoffs Syndrome: An Information Processing Approach, Academic, New York.
Cala, L. A., and F. L. Mastaglia (198 1) Computerized tomography in chronic alcoholics. Alcohol Clin. Exp. Res. 5: 283-294.
Carlen, P. L., D. A. Wilkinson, G. Wortzman, R. Holgate, J. Cordingley, M. A. Lee, L. Huszar, G. Moddel, R. Singh, L. Kiraly, and J. G. Rankin (198 1) Cerebral atrophy and functional deficits in alcoholics without clinicallv aunarent liver disease. Neuroloav 31: 377-385.
Corkin, S. (1979) Hihden-Figures-Test performance: Lasting effects of unilateral penetrating head injury and transient effects of bilateral cingulotomy. Neuropsychologia 17: 585-605.
Freedman, M., and M. Oscar-Berman (1986) Bilateral frontal lobe disease and selective delayed response deficits in humans. Behav. Neurosci. 100: 337-342.
Gado, M., C. P. Hughes, W. Danziger, D. Chi, G. Jost, and L. Berg (1982) Volumetric measurements of the cerebrospinal fluid spaces in demented subjects and controls. Neuroradiology 144: 535-538.
Gebhardt, C. A., M. A. Naeser, and N. Butters (1984) Computerized measures of CT scans of alcoholics: Thalamic region related to mem- ory. Alcohol 1: 133-140.
Gottschaldt, K. (1928) Uber den einfluss der Erfahrung auf die Wahr- nehmung von Figuren. Psychol. Forschung 8: 18-3 17.
Heaton, R. K. (1981) Wisconsin Card Sorting Test Manual, Psy- chology Assessment .Resources, Odessa, FL. -
Jacobson. R. R.. and W. A. Lishman (1987) Selective memorv loss and global intellectual deficits in alcoholic Kbrsakoll’s syndrome. Psy- chol. Med. 17: 649-655.
Jacobson, R. R., S. W. Turner, R. E. Baldy, and W. A. Lishman (1985) Densitometric analysis of scans: Important sources of artefact. Psy- chol. Med. 15: 879-889.
Janowsky, J. S., A. P. Shimamura, M. Kritchevsky, and L. R. Squire (in press) Cognitive impairment following frontal lobe damage and its relevance to human amnesia. Behav. Neurosci.
Jemigan, T. L., L. M. Zatz, and M. A. Naeser (1979) Semiautomated method for quantitating CSF volume on cranial computed tomog- raphy. Radiology 132: 463466.
Jemiaan. T. L.. L. M. Zatz. A. J. Ahumada. A. Pfefferbaum. J. R. Tiiklenberg, and J. A. Moses (1982) CT measures of cerebrospinal fluid volume in alcoholics and normal volunteers. Psychiatr. Res. 7: 9-17.
Kaplan, E. F., H. Goodglass, and S. Weintraub (1978) The Boston Naming Test, Kaplan and Goodglass, Boston.
Lezak, M. D. (1983) Neuropsychological Assessment (2nd ed.), Oxford U. P., New York.
Lishman, W. A. (198 1) Cerebral disorder in alcoholism: Syndromes of impairment. Brain 104: l-20.
Lishman, W. A., R. R. Jacobson, and C. Acker (1987) Brain damage in alcoholism: Current concepts. Acta Med. Stand. 717: 5-l 7.
Mair, W. G. P., E. K. Warrington, and L. Weiskrantz (1979) Memory disorder in Korsakoff psychosis: A neuropathological and neuro- psychological investigation of two cases. Brain 102: 749-783.
Mattis, S. (1976) Dementia rating scale. In Geriatric Psychiatry, R. Bellack and B. Karasu, eds., pp. 7 1-121, Grune & Stratton, New York.
McDowell, J. R., and H. J. LeBlanc (1984) Computed tomographic findings in Wemicke-Korsakoff syndrome. Arch. Neurol. 41: 453- 454.
Mensing, J. W. A., P. H. Hoogland, and J. L. Slooff (1984) Computed tomography in the diagnosis of Wemicke’s encephalopathy: A radio- logical-neuropathological correlation. Ann. Neurol. 16: 363-365.
Milner, B. (1963) Effects of different brain lesions on card sorting. Arch. Neurol. 9: 100-l 10.
Moscovitch, M. (1982) Multiple dissociations of function in amnesia. In Human Memory and Amnesia, L. Cermak, ed., pp. 337-370, Erl- baum Press, Hillsdale, NJ.
Oscar-Berman, M. (1980) The neuropsychological consequences of long-term chronic alcoholism. Am. Scientist 68: 4 1 O-4 19.
Parkin, A. J. (1982) Residual learning capability in organic amnesia. Cortex 18: 4171140.
Pfefferbaum, A., L. M. Zatz, and T. L. Jemigan (1986) Computer- interactive method for quantifying cerebrospinal fluid and tissue in brain CT scans: Effects of aging. J. Comuuter Assist. Tomoar. 10: - - 571-578.
Rey, A. (1964) L’examen Clinique en Psychologie, Presses Universi- taires de France, Paris.
Schacter, D. L. (1987) Memory, amnesia, and frontal lobe dysfunction: A critique and interpretation. Psychobiology 15: 21-36.
Scoville, W. B., and B. Milner (1957) Loss of recent memory after bilateral hippocampal lesions. J. Neurol. Neurosurg. Psychiatry 20: 11-21.
Shallice, T., and M. E. Evans (1978) The involvement of the frontal lobes in cognitive estimation. Cortex 14: 294-303.
Shimamura, A. P. (1986) Priming effects in amnesia: Evidence for a dissociable memorv function. 0. J. EXD. Psvchol. 38A: 6 19-644.
Shimamura, A. P. (1988) Formsof memory:-Issues and directions. In Brain Organization and Memory: Cells, Systems, and Circuits, J. L. McGaugh, N. M. Weinberger, and G. Lynch, eds., Oxford U. P., New York.
Shimamura, A. P, and L. R. Squire (1986a) Korsakoffs syndrome: The relationship between anterograde amnesia and remote memory impairment. Behav. Neurocsci. 100: 165-170.
Shimamura, A. P., and L. R. Squire (1986b) Memory and metamem-

4410 Shimamura et al. l Korsakoff’s Syndrome
ory: A study of the feeling-of-knowing phenomenon in amnesic pa- tients. J. Exe. Psvchol.: Learn. Mem. Coa. 12: 452-460.
Smith, A., and B. Milner (1984) Differential effects of frontal-lobe lesions on cognitive estimation and spatial memory. Neuropsycho- logia 22: 697-105.
Squire, L. R. (1982) Comparisons between forms of amnesia: Some deficits are unique to Korsakoff s syndrome. J. Exp. Psychol.: Learn. Mem. Cog. 8: 560-571.
Squire, L. R. (1987) Memory and Bruin, Oxford U. P., New York. Squire, L. R., and A. P. Shimamura (1986) Characterizing amnesic
natients for neurobehavioral studv. Behav. Neurosci. 100: 866-877. Squire, L. R., and S. Zola-Morgan (i 988) Memory: Brain systems and
behavior. Trends Neurosci. 21: 170-l 75. Sauire. L. R.. and J. A. Zouzounis (in mess) Self-ratings of memory
dysfunction: Different findings in depressibn and amnesia. J. Cl& Exp. Neuropsychol.
Talland, G. A. (1965) Deranged Memory, Academic, New York. Victor, M., R. D. Adams and G. H. Collins (1971) The Wernicke-
Korsakof Syndrome, Davis, Philadelphia. Warrington, E. K. (1984) Recognition Memory Test, NPER-Nelson,
Windsor. Wilkinson, D. A. (1985) Neuroradiologic investigations of alcoholism.
In Alcohol and the Bruin, R. E. Tarter and D. H. VanThiel, eds., pp. 183-2 15, Plenum, New York.
Zola-Morgan, S., and L. R. Squire (1985) Amnesia in monkeys fol- lowing lesions of the mediodorsal nucleus of the thalamus. Ann. Neu- rol. 17: 558-564.
Zola-Morgan, S., L. R. Squire, and D. G. Amaral (1986) Human amnesia and the medial temporal region: Enduring memory impair- ment following a bilateral lesion limited to field CA1 of the hippo- campus. J. Neurosci. 6: 2950-2967.