the journey to becoming more affordable
TRANSCRIPT

The Journey to BecomingMore Affordable
Greg BeierPresident of Market Operations, Novant Health

2
Can you Transform Your Health Care
System to Survive (or Thrive) at Medicare
Rates?

3
Source: “Beyond Healthcare Reform”
Jeff Goldsmith, President of Health Futures, Inc.
October 2009
“The last time the federal budget was balanced, in
the Balanced Budget Act of 1997, it was done on the
backs of the hospital industry.”
“Learn to run on regular gas! You cannot expect to
shift costs indefinitely…”
“Cost shifting is like heroin – it‟s time to kick the
habit. This means instilling rigorous cost discipline
in collaboration with physicians.”
Lessons Learned…
4
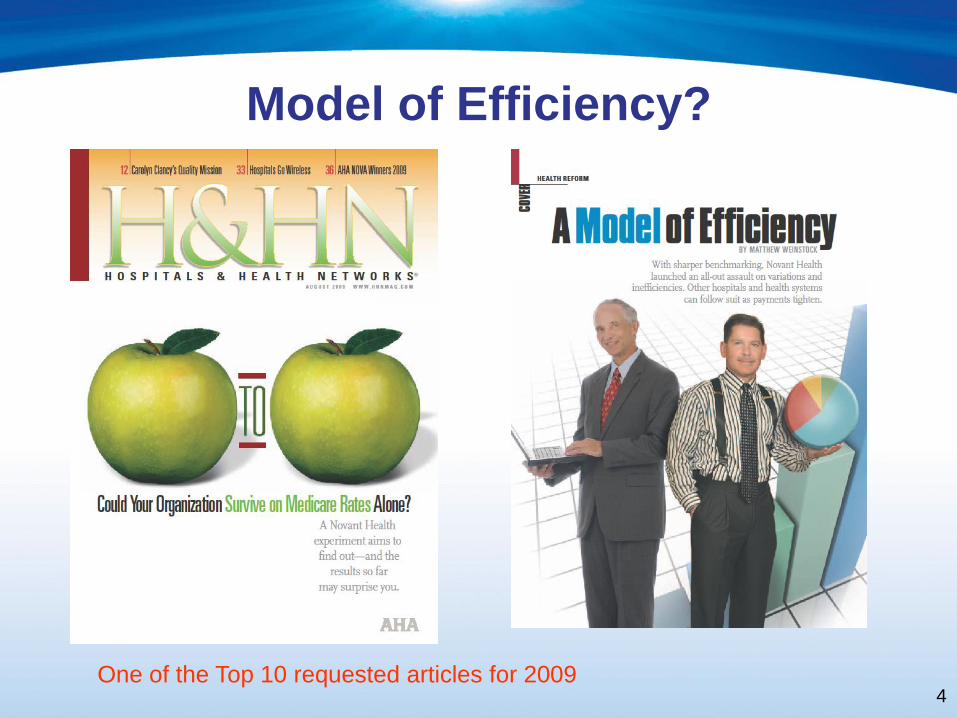
Model of Efficiency?
One of the Top 10 requested articles for 2009

Forsyth 932 60,978 104,752 25,359
Presbyterian 531 49,434 81,939 22,452
Rowan 268 21,588 58,320 9,666
Prince William 170 28,048 68,925 8,543
Thomasville 149 10,125 33,812 3,748
Upstate Carolina 125 7,793 31,609 3,190
Matthews 114 18,488 48,812 6,191
Orthopaedic Hosp 156 5,129 NA 6,889
Huntersville 60 13,292 33,935 5,731
Brunswick 60 8,617 24,223 3,798
Franklin 70 5,127 19,246 2,255
Medical Park 22 5,848 NA 11,416
2009 Acute Care StatisticsLicensed Adjusted Emergency IP and OP
Beds Discharges Visits Surgeries

Six Steps
1) We defined the destination and made it a key element of our strategy
2) We created a structure to support changingour model.
3) We are shining a bright light on every type of variation and identifying promising opportunities.
4) We are engaging all groups in Novant to go on our journey.
5) We are using all tools to change and
take advantage of our promising opportunities.6) We are tracking our progress towards becoming more
affordable.

1) We defined the destination and made it a
key element of our strategy.
• Inspirational
• About the patient and community
• Simple
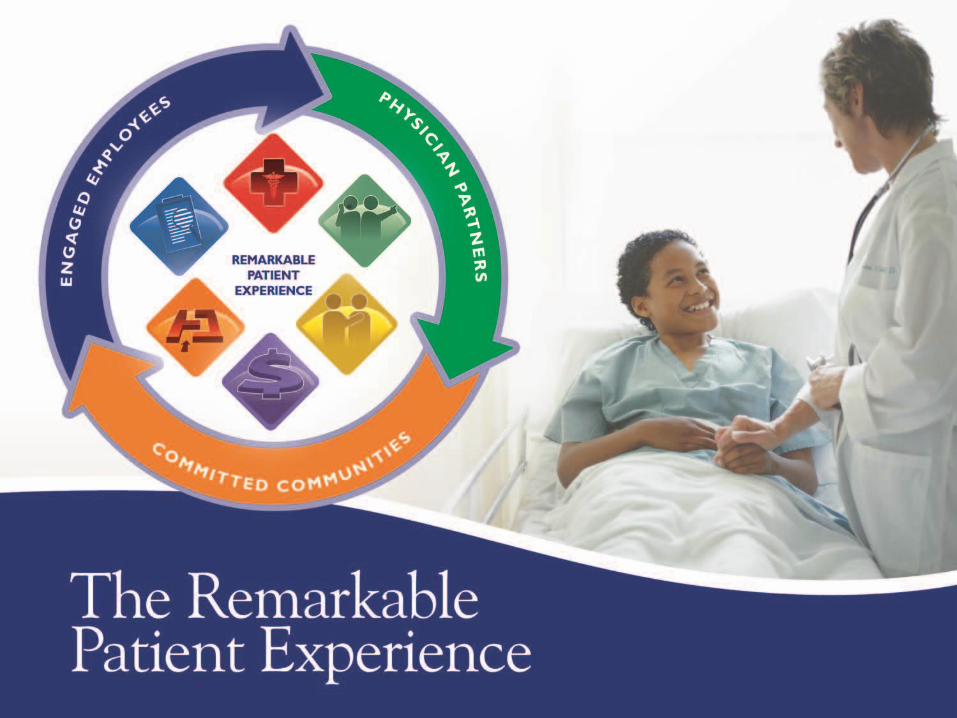
Our goal is to deliver a Remarkable Patient Experience in every dimension, every time.
8

9
Novant Vision Elements
QualityAn integrated system of healthcare services which delivers superior outcomes as
measured against national, state and regional benchmarks, peer databases,
internal standards, and the patient and family experience. Incorporates prevention,
early detection, treatment and ongoing health across all venues of care. Our public
transparency about our outcomes data creates a compelling reason for patients,
communities, physicians and employees to affiliate with Novant and choose us for
their healthcare needs.
AffordabilityCommitment to develop a system of care that provides value, as judged by our
patients and their payers. Novant will compare favorably to a similar group of top
performing health systems. Our sustained financial strength will allow us to grow
strategically and invest to meet the needs of the communities we serve.
SafetyOur patients are safe and free from harm when they are in our care. Our work
environment is one of open communication and timely feedback about the patient‟s
safety and care experience which is guided by the expectation “First, Do No Harm.”
10
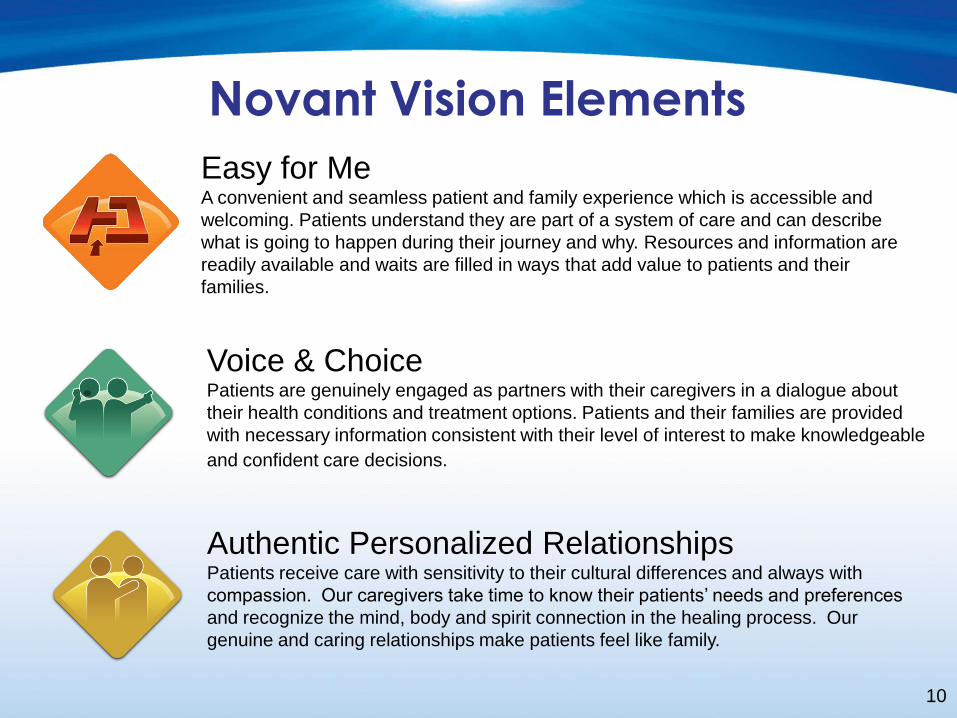
Novant Vision Elements
Easy for MeA convenient and seamless patient and family experience which is accessible and
welcoming. Patients understand they are part of a system of care and can describe
what is going to happen during their journey and why. Resources and information are
readily available and waits are filled in ways that add value to patients and their
families.
Voice & ChoicePatients are genuinely engaged as partners with their caregivers in a dialogue about
their health conditions and treatment options. Patients and their families are provided
with necessary information consistent with their level of interest to make knowledgeable
and confident care decisions.
Authentic Personalized RelationshipsPatients receive care with sensitivity to their cultural differences and always with
compassion. Our caregivers take time to know their patients‟ needs and preferences
and recognize the mind, body and spirit connection in the healing process. Our
genuine and caring relationships make patients feel like family.

Affordability
While Novant must deliver a product that provides value to
our patients, it is critical that we deliver the Remarkable
Patient Experience through a care model and support system
that recognizes the external forces impacting our system and
creates sustained financial performance
• In 2015
– Patients in the communities we serve receive remarkable care through a financially
strong system that is truly integrated and recognized nationally for the value
provided
– Our health care services are known by our patients for their value, when compared
to our competitors
– The overall financial health of our health care system allows us to grow
strategically in terms of new facilities and other services to meet the needs of
patients and communities

2) We created a structure to support changing
our model.
• Matrix Organization
– Optimize care for each community
– Develop the “Novant Way” to execute the Remarkable Patient Experience in a unified low variation model.

13
Greater Charlotte Market PH Charlotte
CMO
(Stephen
Wallenhaupt,
MD)
CAO
(Jacque
Gattis)
CFO
(Fred
Hargett)
Corporate Centers
of Expertise
*this model is not meant to be all inclusive
Physician
Leader(Herb Clegg, MD)
CCO(Sallye Liner, RN)
NMG COO(Michele Grier)
Novant
Market
Operations
President(Greg Beier)
Imaging Leader(Chris Winkle)
Hospital Executive
(Amy Vance)
Ambulatory
Executive
(WendyBurkhart)
Physician
Executive
(Herb Clegg, MD
Michael Hoben,MD/
Yele Aluko,MD)
Market Leader(Mark Billings)
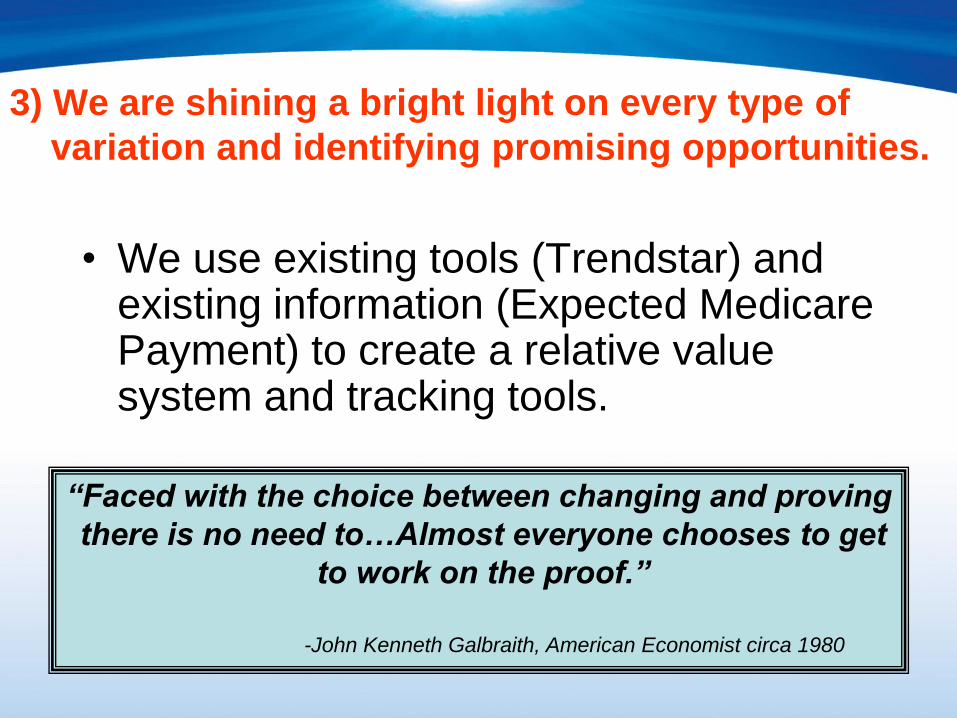
3) We are shining a bright light on every type of
variation and identifying promising opportunities.
• We use existing tools (Trendstar) and existing information (Expected Medicare Payment) to create a relative value system and tracking tools.
“Faced with the choice between changing and proving
there is no need to…Almost everyone chooses to get
to work on the proof.”
-John Kenneth Galbraith, American Economist circa 1980

15
Payor Neutral Revenue
Operating Expense
as % Net Rev & PNR
Net Rev PNR
Net Rev PNR Baseline Baseline
July YTD 2010 July YTD 2010 2008 2008
Presbyterian Main/Orthopedic $406,228 $283,071 89% 120%
Presbyterian Matthews 95,966 62,946 69% 104%
Presbyterian Huntersville 74,949 49,189 70% 109%
Forsyth Medical Center/Medical Park 462,490 325,830 84% 110%
Thomasville Medical Center 38,993 30,236 89% 111%
Brunswick Community Hospital 31,826 25,590 105% 126%
Rowan Regional Medical Center 103,193 76,155 94% 113%
$1,213,645 $853,017 85% 113%
Net Revenue vs.
Payor Neutral Revenue

4) We are engaging all groups in Novant
to go on our journey.
• Board and Physician Leadership own the destination with us and see affordability as part of Remarkable Patient Experience.
• Leaders embrace the accountability for becoming affordable as part of their balanced scorecard
• Physicians partner with us to understand the variation and help us create the Novant approach to clinical care.
• Employees are engaged in learning and helping us transform our process of care to reduce waste and improve quality and safety.

5) We are using all tools to change and
take advantage of our promising
opportunities.
• Management precision 2009 - 2015
• How we support care 2010 – 2015
• Create the Novant Science 2010 - ?
• Transform care processes 2011 - ?

Payor Neutral Revenue helps us ask the
following kinds of questions:
1) Management Precision
– Why does one hospital consume 30% less of PNR for labor in the OR to do hip procedures?
2) How we support delivering the Remarkable Patient Experience
– Why does the % of PNR consumed for pharmacy services vary 20% in similar hospitals?
3) How clinical practice variation impacts affordability
– Why does one team of hospitalists get excellent clinical outcomes with CHF patients and consume 50% less of PNR for imaging services.

19
Examples of Management Precision
• We found several hospitals were consuming a much lower % of PNR for nursing labor than other hospitals in our system. One pay practice was changed and $5.5 million was saved.
• We internally benchmarked what % of PNR was being consumed in leadership structures at each hospital. Nearly $3 million was saved in two hospitals by eliminating a layer of management.

20
Examples of Transforming Support Structure
• High variation in the % of PNR being consumed for Pharmacy led to the creation of a virtual pharmacy. This will result in safer more consistent care and $9 million in savings. Case study to follow…
• High capital cost, as a % of PNR, in our new community hospitals showed the need for a new plan. Square footage will be reduced by 33% for the next hospital we build. In a recently filed CON application it is worth noting the construction cost of Novant‟s 50 bed hospital was $77M and the competing proposal was at $127M.
21
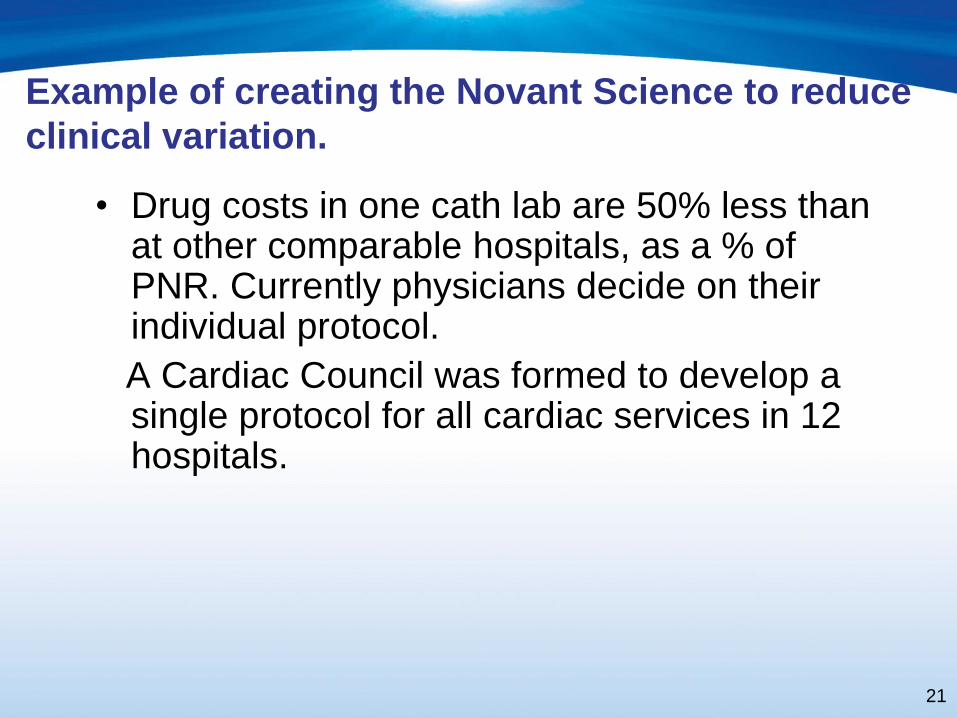
Example of creating the Novant Science to reduce
clinical variation.
• Drug costs in one cath lab are 50% less than at other comparable hospitals, as a % of PNR. Currently physicians decide on their individual protocol.
A Cardiac Council was formed to develop a single protocol for all cardiac services in 12 hospitals.

22
Example of Transforming Care at the Bedside
• Clinical Documentation Team has been launched to transform documentation for care. Expected savings of two hours per nurse per shift. We have approximately 5,000 nurses.

6) We are tracking our progress towards
becoming more affordable.
Net Rev PNR Baseline 24 Month
2010 2010 2008 2010 Improvement
Presbyterian Main/Orthopedic $691,647 $484,264 120% 109% $53,197
Presbyterian Matthews 164,309 108,683 104% 98% 3,488
Presbyterian Huntersville 127,296 83,623 109% 99% 5,531
Forsyth Medical Center/Medical Park 724,408 557,574 110% 102% 39,328
Thomasville Medical Center 67,052 51,896 111% 105% 2,743
Brunswick Community Hospital 53,620 43,649 126% 111% 6,337
Rowan Regional Medical Center 159,307 130,082 113% 104% 11,500
$1,987,639 $1,459,771 113% 105% $122,124
Net Revenue vs. Operating Expense
Payor Neutral Revenue as % of PNR

PNR versus Net Revenue
• Use Net Revenue to Assess…
– Revenue cycle
improvements
– Growth & pricing strategies
over time
– Where you should focus
your marketing & contracting
efforts
– Strategic investments
• Use PNR to Assess…
– Variation in resource
consumption between nursing
units, product lines, physician
groups and hospitals
– Operational improvements
over time
– Where you should focus your
operational improvement
efforts
– Helping to set targets for
budget
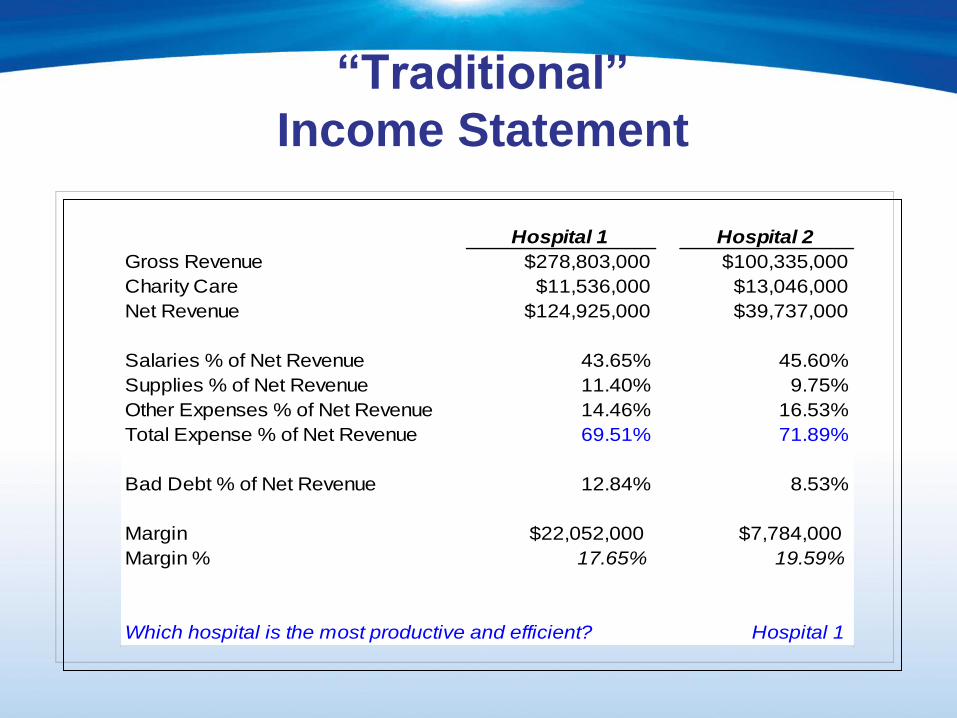
“Traditional”
Income Statement
Hospital 1 Hospital 2
Gross Revenue $278,803,000 $100,335,000
Charity Care $11,536,000 $13,046,000
Net Revenue $124,925,000 $39,737,000
Salaries % of Net Revenue 43.65% 45.60%
Supplies % of Net Revenue 11.40% 9.75%
Other Expenses % of Net Revenue 14.46% 16.53%
Total Expense % of Net Revenue 69.51% 71.89%
Bad Debt % of Net Revenue 12.84% 8.53%
Margin $22,052,000 $7,784,000
Margin % 17.65% 19.59%
Which hospital is the most productive and efficient? Hospital 1
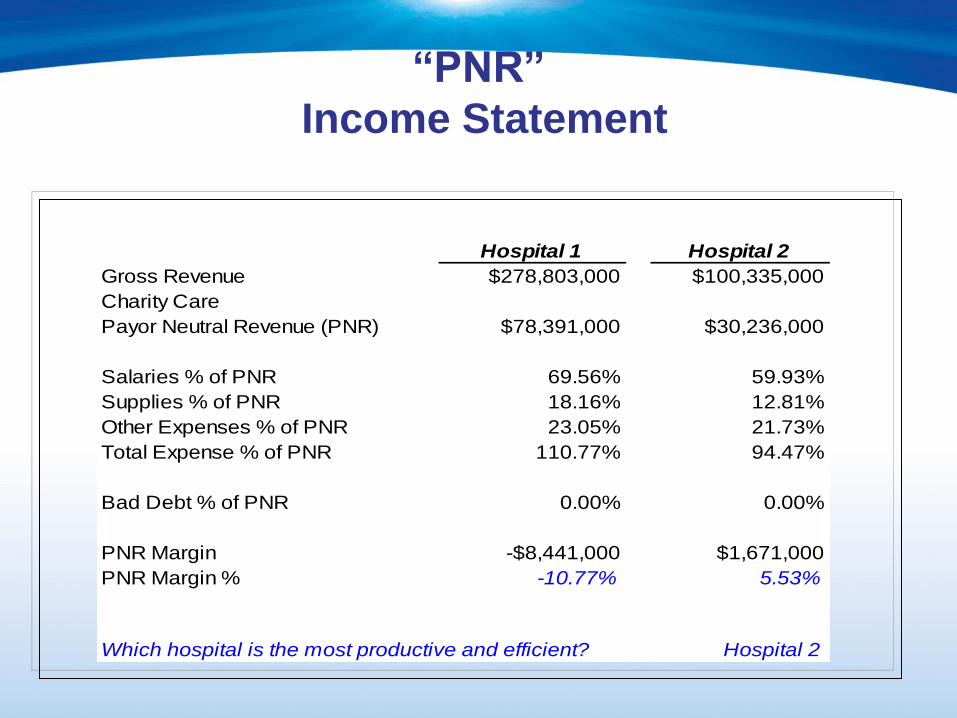
“PNR”
Income Statement
Hospital 1 Hospital 2
Gross Revenue $278,803,000 $100,335,000
Charity Care
Payor Neutral Revenue (PNR) $78,391,000 $30,236,000
Salaries % of PNR 69.56% 59.93%
Supplies % of PNR 18.16% 12.81%
Other Expenses % of PNR 23.05% 21.73%
Total Expense % of PNR 110.77% 94.47%
Bad Debt % of PNR 0.00% 0.00%
PNR Margin -$8,441,000 $1,671,000
PNR Margin % -10.77% 5.53%
Which hospital is the most productive and efficient? Hospital 2

Case Studies
• Pharmacy Transformation
• Physician Facilitated Practice

Novant PharmacyTransformation
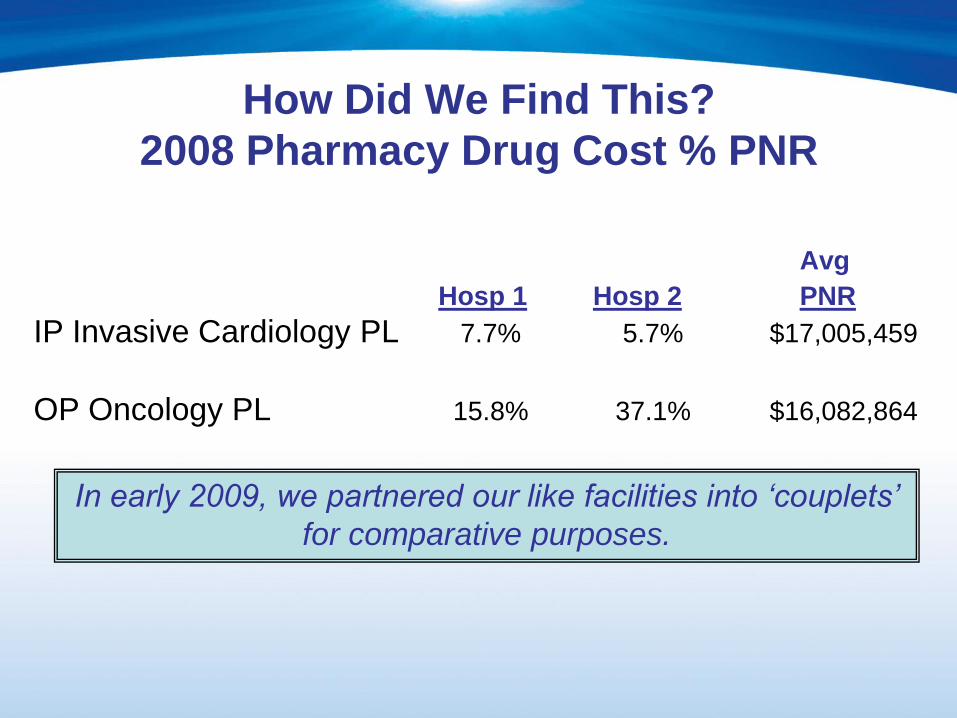
How Did We Find This?
2008 Pharmacy Drug Cost % PNR
Avg
Hosp 1 Hosp 2 PNR
IP Invasive Cardiology PL 7.7% 5.7% $17,005,459
OP Oncology PL 15.8% 37.1% $16,082,864
In early 2009, we partnered our like facilities into „couplets‟
for comparative purposes.

Why Did We Do This?
• Improve safety and quality for patients with increased affordability for all
• Eliminate drug cost differences among facilities or regions
• Reduce high variation in % of PNR across system pharmacies
Physician Involvement
• Physicians involved from the beginning
• Transparent/Inclusive/Collaborative
• Formed System Wide P&T Committee
• Developed sub-specialty committees for
specific areas

Inventory Consolidation
18 Months Into the Process
• 57% of formulary consolidated system-wide end
of 2010
– Eliminate duplications
– Increase drug turn-around
– Enhance system-wide contracts
– Optimize select 340-B Pricing
• Contract optimization – VHA
– Net savings $700k
• Mitigation of drug shortages
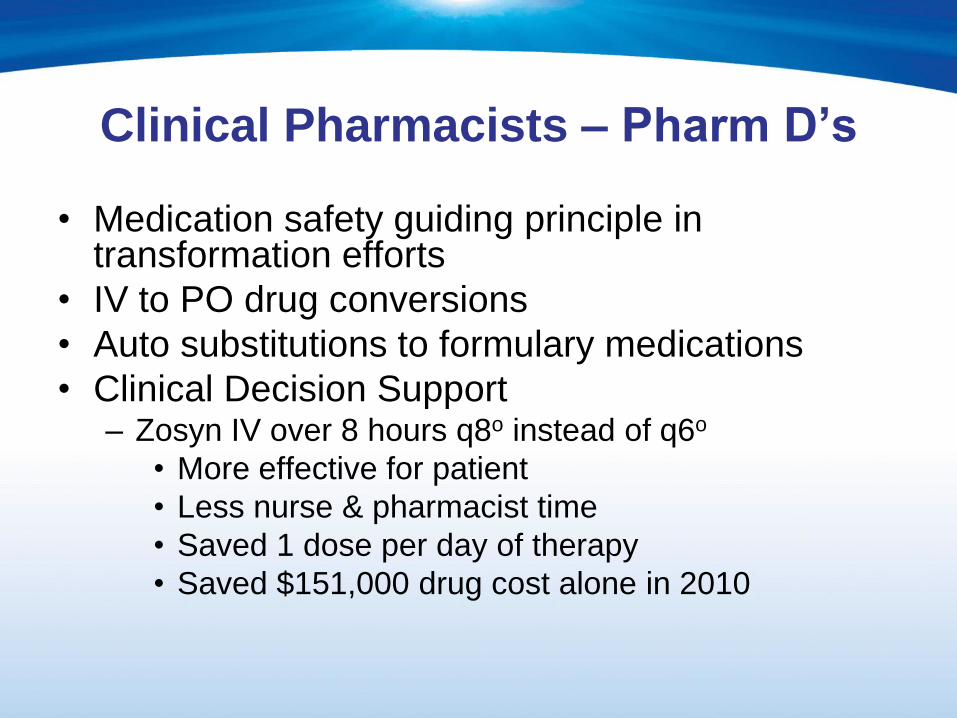
Clinical Pharmacists – Pharm D’s
• Medication safety guiding principle in transformation efforts
• IV to PO drug conversions
• Auto substitutions to formulary medications
• Clinical Decision Support– Zosyn IV over 8 hours q8o instead of q6o
• More effective for patient
• Less nurse & pharmacist time
• Saved 1 dose per day of therapy
• Saved $151,000 drug cost alone in 2010

Pharmacy Personnel
• Improved resource management
• Top of the License– Pharm D‟s
• (Clinical Pharmacists)
– Rph
• (Starts, Revisions, Cancels)
– Pharmacy Tech
• Pyxis Optimization
• Proactive monitoring of drugs for expiration

Where We Are Going
• Software for a „virtual pharmacy‟
– Inventory Control
– Centralized Receiving & Distribution

Savings
• Inventory Consolidation $4M (one-time)
• Medication Turn-Over $2M (annual run rate)
• Optimized Formulary Selection $3 M (annual run rate)

Lessons Learned
• Involve physicians from the beginning
• Culture change process
– Facility operator ownership
– Integration into budget process

Physician Facilitated Practice

Why Did We Do This?
• To improve overall safety & patient care
• To increase affordability for patients &
system
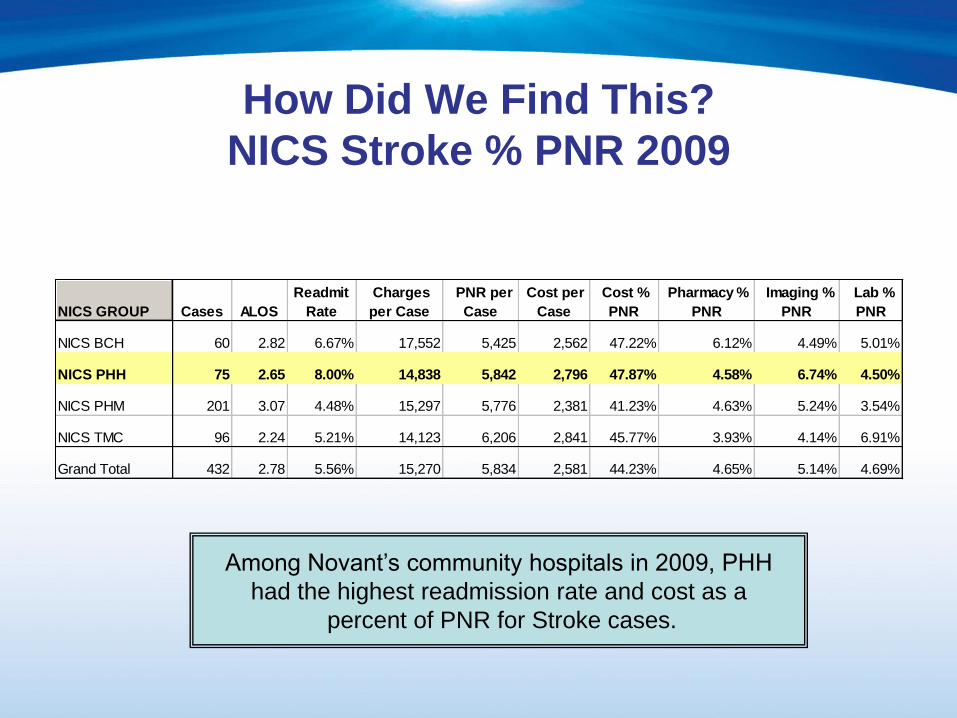
How Did We Find This?
NICS Stroke % PNR 2009
NICS GROUP Cases ALOS
Readmit
Rate
Charges
per Case
PNR per
Case
Cost per
Case
Cost %
PNR
Pharmacy %
PNR
Imaging %
PNR
Lab %
PNR
NICS BCH 60 2.82 6.67% 17,552 5,425 2,562 47.22% 6.12% 4.49% 5.01%
NICS PHH 75 2.65 8.00% 14,838 5,842 2,796 47.87% 4.58% 6.74% 4.50%
NICS PHM 201 3.07 4.48% 15,297 5,776 2,381 41.23% 4.63% 5.24% 3.54%
NICS TMC 96 2.24 5.21% 14,123 6,206 2,841 45.77% 3.93% 4.14% 6.91%
Grand Total 432 2.78 5.56% 15,270 5,834 2,581 44.23% 4.65% 5.14% 4.69%
Among Novant‟s community hospitals in 2009, PHH
had the highest readmission rate and cost as a
percent of PNR for Stroke cases.

PHH Physician Detail
NICS Stroke % PNR 2009
ATTENDING MD Cases ALOS
Readmit
Rate
Charges
per Case
PNR per
Case
Cost per
Case
Cost %
PNR
Pharmacy %
PNR
Imaging %
PNR
Lab %
PNR
Physician 1 14 1.86 14.29% 10,954 5,045 2,010 39.85% 3.17% 5.88% 4.08%
Physician 2 6 3.33 0.00% 14,903 5,994 3,072 51.25% 5.25% 6.68% 2.98%
Physician 3 6 3.17 0.00% 17,938 6,161 3,228 52.40% 4.94% 8.69% 4.14%
Physician 4 8 3.38 12.50% 16,701 5,755 3,288 57.13% 6.12% 7.97% 4.70%
Physician 5 8 2.50 12.50% 15,335 5,614 2,726 48.56% 4.22% 8.02% 4.76%
Physician 6 17 2.65 11.76% 16,519 6,348 2,889 45.50% 4.75% 6.40% 5.52%
Physician 7 16 2.63 0.00% 14,086 5,982 2,910 48.64% 4.45% 5.83% 4.13%
Grand Total 75 2.65 8.00% 14,838 5,842 2,796 47.87% 4.58% 6.74% 4.50%

Get the Data to the Physicians!
• Why Am I Different?
– Research best practices and evidence-based
medicine
– Discuss with specialty physicians and ED
– Present best practice models
That‟s Why I‟m Different!!

Physician Facilitated Practice
• Establish a Physician Facilitated Practice
Committee
– Not an ALOS Committee!
• Review cost and clinical outcomes
– Direct Cost as % of PNR for Pharmacy, Imaging, & Lab
– Average Length of Stay
– Readmission Rates
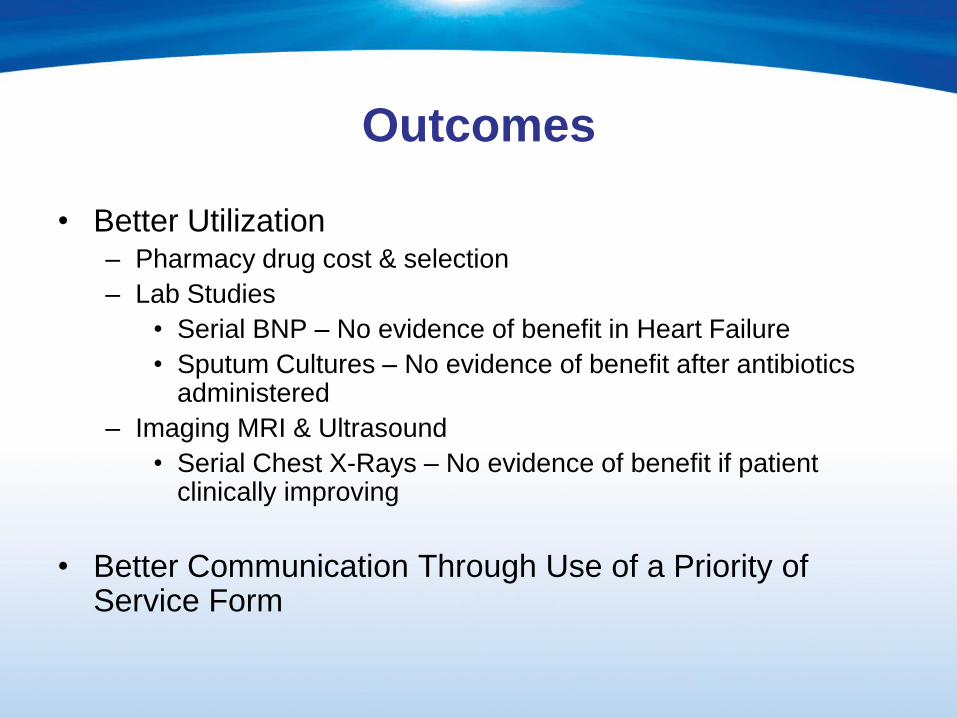
Outcomes
• Better Utilization– Pharmacy drug cost & selection
– Lab Studies
• Serial BNP – No evidence of benefit in Heart Failure
• Sputum Cultures – No evidence of benefit after antibiotics administered
– Imaging MRI & Ultrasound
• Serial Chest X-Rays – No evidence of benefit if patient clinically improving
• Better Communication Through Use of a Priority of Service Form
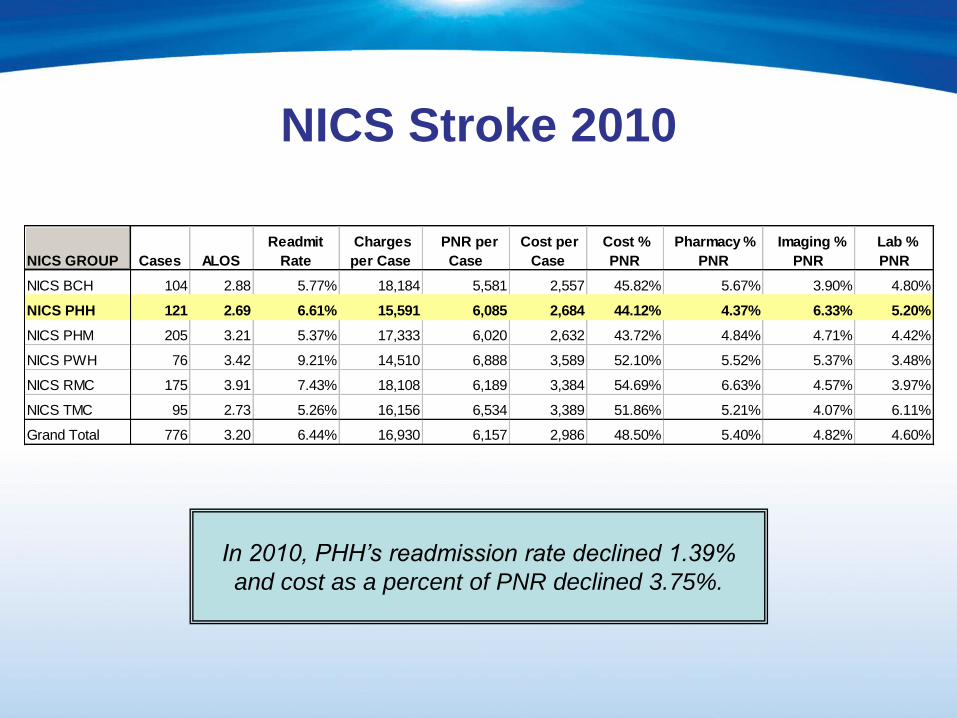
NICS Stroke 2010
In 2010, PHH‟s readmission rate declined 1.39%
and cost as a percent of PNR declined 3.75%.
NICS GROUP Cases ALOS
Readmit
Rate
Charges
per Case
PNR per
Case
Cost per
Case
Cost %
PNR
Pharmacy %
PNR
Imaging %
PNR
Lab %
PNR
NICS BCH 104 2.88 5.77% 18,184 5,581 2,557 45.82% 5.67% 3.90% 4.80%
NICS PHH 121 2.69 6.61% 15,591 6,085 2,684 44.12% 4.37% 6.33% 5.20%
NICS PHM 205 3.21 5.37% 17,333 6,020 2,632 43.72% 4.84% 4.71% 4.42%
NICS PWH 76 3.42 9.21% 14,510 6,888 3,589 52.10% 5.52% 5.37% 3.48%
NICS RMC 175 3.91 7.43% 18,108 6,189 3,384 54.69% 6.63% 4.57% 3.97%
NICS TMC 95 2.73 5.26% 16,156 6,534 3,389 51.86% 5.21% 4.07% 6.11%
Grand Total 776 3.20 6.44% 16,930 6,157 2,986 48.50% 5.40% 4.82% 4.60%

Lessons Learned
• Data to compare with like facilities
• Get the data out soon for discussion
• Collaboration between physicians and
administrative leaders

Remember…
• The most important distance to travel on
this journey is the first six inches.
• Changing our mental-model from
achieving budget to accountability for long
term affordability.

Questions ?