the keystone alliance for sustainable agriculture
DESCRIPTION
The Keystone Alliance for Sustainable Agriculture. What is Field to Market?. A collaborative stakeholder group P roducers, agribusinesses, food and retail companies, conservation associations, universities, and NRCS - PowerPoint PPT PresentationTRANSCRIPT
The Keystone Alliance for Sustainable Agriculture
1
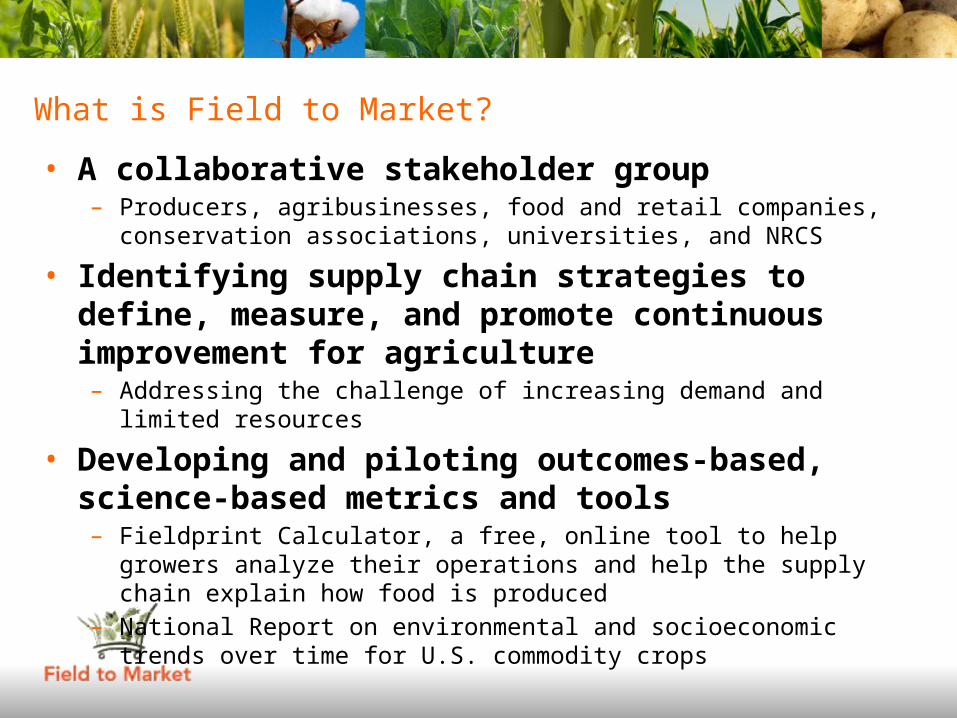
What is Field to Market?
• A collaborative stakeholder group– Producers, agribusinesses, food and retail companies, conservation associations,
universities, and NRCS
• Identifying supply chain strategies to define, measure, and promote continuous improvement for agriculture– Addressing the challenge of increasing demand and limited resources
• Developing and piloting outcomes-based, science-based metrics and tools– Fieldprint Calculator, a free, online tool to help growers analyze their operations
and help the supply chain explain how food is produced– National Report on environmental and socioeconomic trends over time for U.S.
commodity crops

Field to Market Membership

How We Define Sustainable Agriculture• Meeting the needs of the present while
improving the ability of future generations to meet their own needs– Increasing productivity to meet future food and
fiber demands– Improving the environment– Improving human health– Improving the social and economic well-being of
agricultural communities

Big Ideas• Engage the full supply chain
– Include producers
• Focus on commodities crops– Unique supply chains and traceability issues
• Develop science- and outcomes-based measures– Identify the key indicators for sustainability– Measure broad-scale trends and field-scale outcomes
• Scale and implement metrics for sustainability programs
5
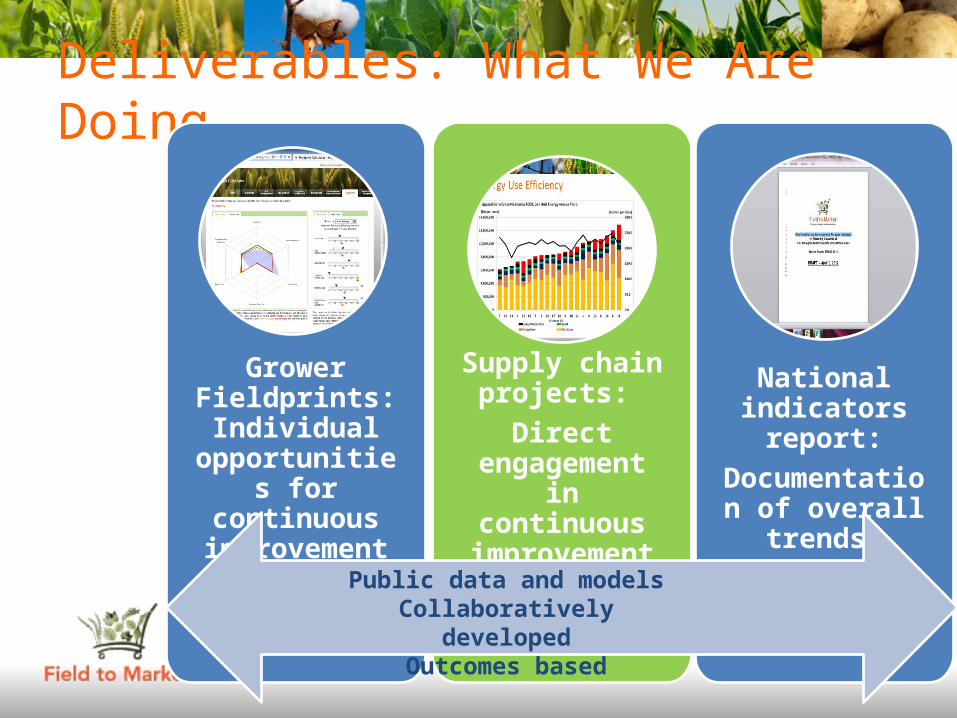
Deliverables: What We Are Doing
National indicators report:
Documentation of overall trends
Supply chain projects:
Direct engagement in continuous improvement
Grower Fieldprints: Individual
opportunities for continuous
improvement
Public data and modelsCollaboratively developed
Outcomes based

The Fieldprint Calculator: Measuring Field Level Outcomes and Identifying Opportunities for Improvement
7
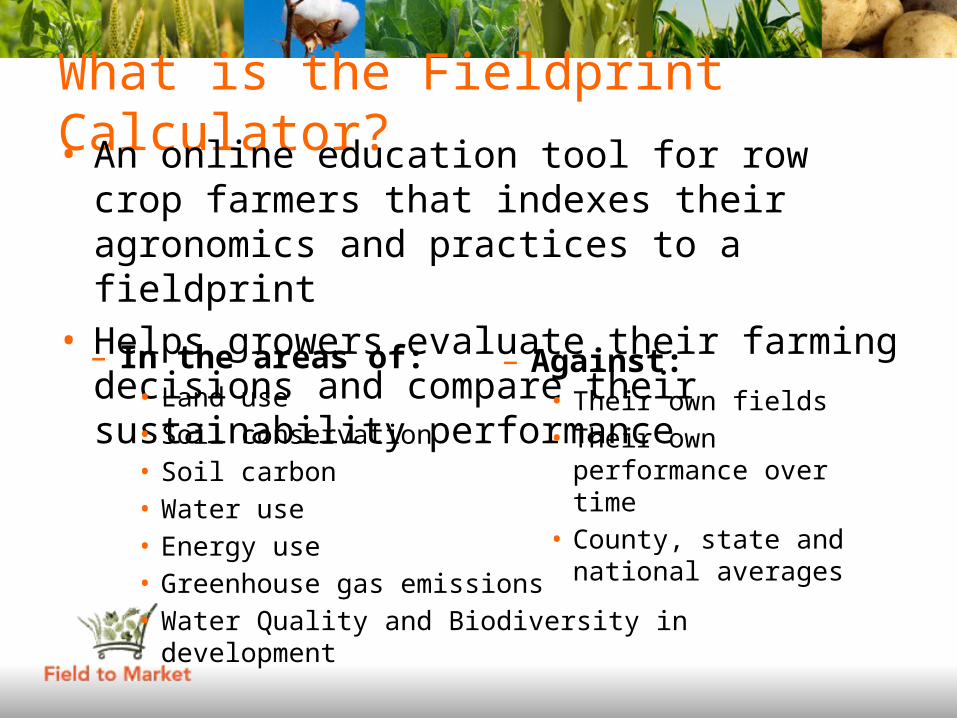
What is the Fieldprint Calculator?• An online education tool for row crop farmers that
indexes their agronomics and practices to a fieldprint• Helps growers evaluate their farming decisions and
compare their sustainability performance
– In the areas of:• Land use• Soil conservation• Soil carbon• Water use• Energy use• Greenhouse gas emissions• Water Quality and Biodiversity in development
– Against:• Their own fields• Their own performance over
time• County, state and national
averages

Fieldprint Calculator Start Page
9
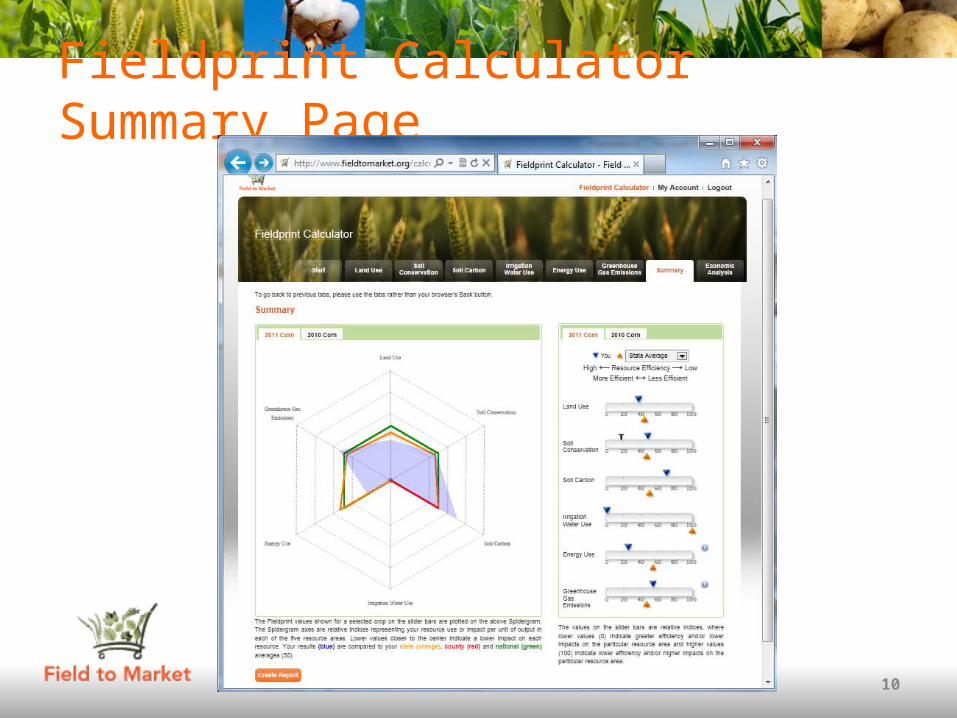
Fieldprint Calculator Summary Page
10
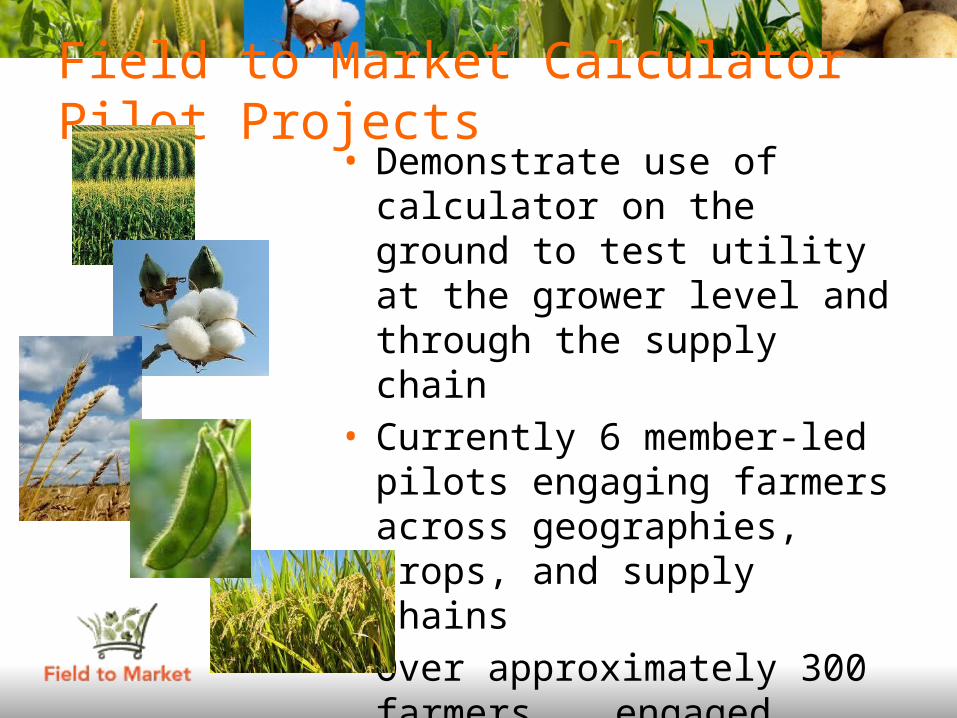
Field to Market Calculator Pilot Projects• Demonstrate use of calculator on
the ground to test utility at the grower level and through the supply chain
• Currently 6 member-led pilots engaging farmers across geographies, crops, and supply chains
• Over approximately 300 farmers engaged
Pilot Feedback“I’ll tell you, I wish I had this tool when I first started my position here at the District. It’s a great way to get to know growers and local operations and to get a conversation started. I’m making more in-roads with the fieldprinting project, than I have with much of the previous outreach I’ve done. If it’s used as nothing more than an outreach tool, it’s a winner.”
– Jared Foster, Van Buren Conservation District/Paw-Paw pilot
National Indicators Report:
The Sustainability Story of U.S. Agriculture
13
Report Objectives Analyze trends over time for environmental and
socioeconomic sustainability indicators Establish a baseline against which to measure future
improvements Create enabling conditions for an informed, multi-
stakeholder discussion of sustainability Advance an outcomes-based, science-based
approach Provide broad-scale context for more local efforts
14
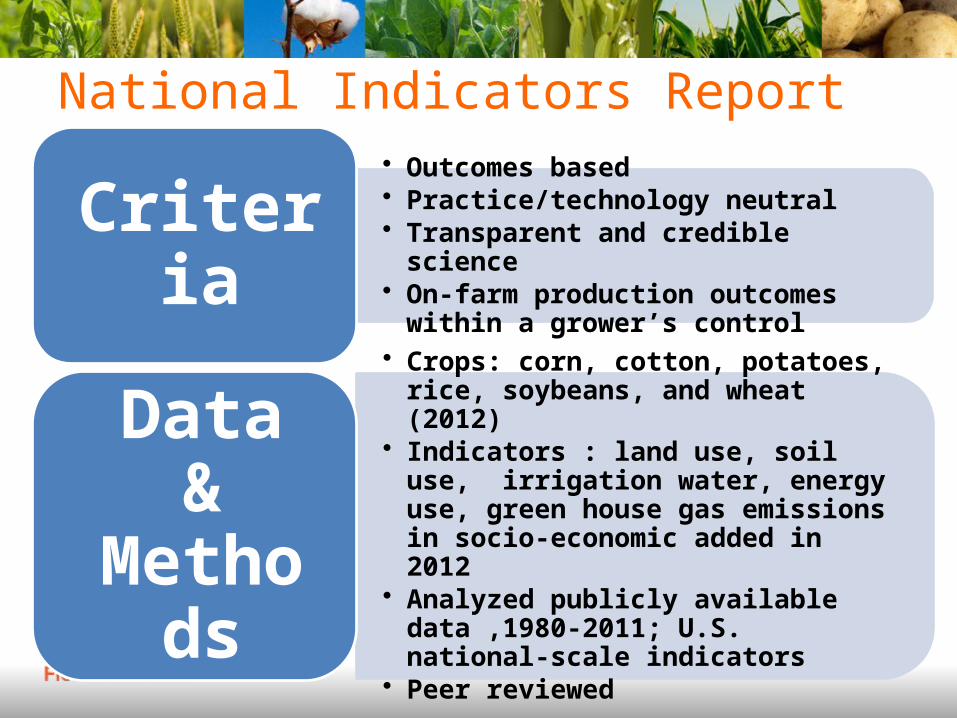
National Indicators Report• Outcomes based• Practice/technology neutral• Transparent and credible science• On-farm production outcomes within a
grower’s control
Criteria
• Crops: corn, cotton, potatoes, rice, soybeans, and wheat (2012)
• Indicators : land use, soil use, irrigation water, energy use, green house gas emissions in socio-economic added in 2012
• Analyzed publicly available data ,1980-2011; U.S. national-scale indicators
• Peer reviewed
Data & Methods
2012 Indicators Report
16
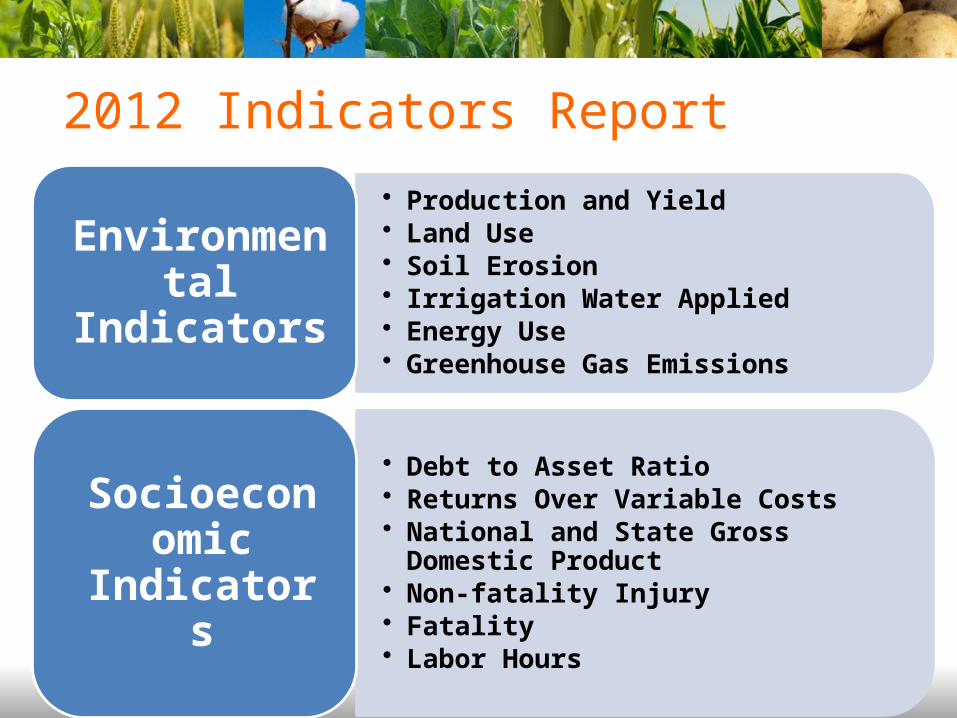
• Production and Yield• Land Use• Soil Erosion• Irrigation Water Applied• Energy Use• Greenhouse Gas Emissions
Environmental Indicators
• Debt to Asset Ratio• Returns Over Variable Costs• National and State Gross Domestic Product• Non-fatality Injury• Fatality• Labor Hours
Socioeconomic Indicators

Summary Results: Environmental Indicators• Resource use/impact per unit of production
(“efficiency”)– Improvement for all six crops on all five environmental
indicators– Driven in part by improvements in yield – Helps track resource uses vs. production/demand concerns
• Total resource use/impact – Variability across crops and indicators (increases, decreases)– Driven in part by overall increases or decreases in production
17
Summary Results: Socioeconomic Indicators
• Improvements (decreases) in debt to asset ratio, fatalities, and non-fatality injuries
• Decreases in labor hours per unit production• Increase in agriculture’s contribution to national GDP• Fluctuation in returns over variable costs, with increases
(improvements) in recent years
18

Sample Results:Resources per bushel, Soybeans
19

A Closer LookSoybean Results: Soil Erosion
20
• Total soil erosion decreased over most of the study period, but has increased more recently (similar for corn)
• Per acre soil erosion decreased during first half of study period, then leveled off (similar for corn, cotton, and wheat)
TOTAL PER ACRE PER BUSHEL

IN SUMMARYU.S. Producers Have a Great Story to Tell…• Efficiency gains over time, along with increased production • Improvements on a number of economic and social indicators
21
• Continued challenges ahead for meeting increased demand within limits of natural resources and social and economic needs
• With the collaboration of U.S. farmers, tools and metrics are emerging to help track and communicate progress and identify opportunities for continued improvement
…As well as opportunities for continued improvement

22
For More Information• www.fieldtomarket.org
– National Report, Calculator, and more!
• Fred Luckey, Chairman– (314) 409-7822; [email protected]
• Julie Shapiro, Facilitator– (970) 513-5830; [email protected]
22