the kidscreen questionnaires
TRANSCRIPT


The KIDSCREEN questionnaires
Quality of life questionnaires for children and adolescents
- Handbook -
THE KIDSCREEN GROUP EUROPE
Ulrike Ravens-Sieberer, Angela Gosch, Michael Erhart, Ursula von Rueden,Jennifer Nickel, Bärbel-Maria Kurth (co-ordinating centre Germany);
Wolfgang Duer, Kristina Fuerth (Austria); Ladislav Czemy (Czech Republic);Pascal Auquier, Marie-Claude Simeoni, Stephane Robitail (France); Yannis Tountas, Christina Dimitrakaki (Greece); Agnes Czimbalmos, Anna Aszmann (Hungary); Jean Kilroe, Celia Keenaghan (Ireland);
Jeanet Bruil, Symone Detmar, Eric Verrips (The Netherlands); Joanna Mazur,Ewa Mierzejewska (Poland); Mick Power, Clare Atherton, Katy Phillips
(United Kingdom); Luis Rajmil, Silvina Berra, Cristian Tebé, Michael Herdman, Jordi Alonso (Spain); Curt Hagquist (Sweden); Thomas Abel, Bernhard Cloetta, Corinna Bisegger, Claudia Farley
(Switzerland); Jacob Bjorner, Stef van Buuren, Michael Rigby, Alan Tennant,John Ware and Elizabeth Waters (Advisory Board)
PABST SCIENCE PUBLISHERSLengerich, Berlin, Bremen, Miami,
Riga, Viernheim, Wien, Zagreb
Acknowledgement:The authors would like to thank all participating families in the KIDSCREEN study and all persons whocontributed to the project. The KIDSCREEN Project was funded by the European Commission (contractNo.: QLG-CT-2000-00751) within the Fifth Framework Program "Quality of Life and Management ofLiving Resources".
Bibliographic information published by Die Deutsche NationalbibliothekDie Deutsche Nationalbibliothek lists this publication in the Deutsche Nationalbibliografie; detailed bib-liographic data is available in the internet at <http://dnb.ddb.de>.
This work is subject to copyright. All rights are reserved, whether the whole or part of the material isconcerned, specifically the rights of translation, reprinting, reuse of illustrations, recitation, broadcast-ing, reproduction on microfilms or in other ways, and storage in data banks. The use of registred names,trademarks, etc. in this publication does not imply, even in the absence of a specific statement, that suchnames are exempt from the relevant protective laws and regulations and therefore free for general use.The authors and the publisher of this volume have taken care that the information and recommendationscontained herein are accurate and compatible with the standards generally accepted by at the time of pub-lication. Nevertheless, it is difficult to ensure that all the information given is entirely accurate for all cir-cumstances. The publisher disclaims any liability, loss, or damage incurred as a consequence, directly orindirectly, of the use and application of any of the content of this volume.
The KIDSCREEN Group Europe
Prof. Dr. Ulrike Ravens-Sieberer Prof. Dr. Ulrike Ravens-Sieberer (Project Coordinator) (Project Coordinator)Research Unit Child and Adolescent Health Bielefeld UniversityRobert Koch-Institute School of Public HealthSeestraße 10 WHO Collaborating Center for Child13353 Berlin, Germany and Adolescent Health PromotionPhone +49-30-4547-3436 33501 Bielefeld, GermanyFax +49-30-4547-3531 E-mail: [email protected]: [email protected]
Internet: htttp://www.kidscreen.org
© 2006 Pabst Science Publishers, 49525 Lengerich, GermanyTypesetting: Armin Vahrenhorst
Printing: KM-Druck, 64823 Groß-Umstadt, Germany
ISBN-10: 3-89967-334-4ISBN-13: 978-3-89967-334-0
Table of contents
Table of contents
Preface ..............................................................................................................................9How to use this Manual ..................................................................................................10Summary Sheet of the KIDSCREEN instruments..........................................................11
1 INTRODUCTION..............................................................................................151.1 Theoretical Background of the KIDSCREEN Project ........................................161.1.1 Health-related Quality of Life as an Outcome Measure ..................................161.1.2 The Need for HRQoL Research in Children and Adolescents ........................171.2 The Rationale for a Child and Parent Measure ..................................................181.3 The Rationale for an international Approach ......................................................191.4 Description of the KIDSCREEN Project ..........................................................20
2 DEVELOPMENT OF THE EUROPEAN KIDSCREEN INSTRUMENTS ................................................................................................23
2.1 Literature Review ................................................................................................242.2 Delphi Study ........................................................................................................252.3 Focus Groups ......................................................................................................252.4 First Item Reduction Procedure ..........................................................................262.5 Translation Procedure ..........................................................................................282.6 Pilot Study: Final Item Reduction ......................................................................292.6.1 Study Design ....................................................................................................292.6.2 Sample ..............................................................................................................302.6.3 Data Analysis....................................................................................................302.7 Survey: Validation of the KIDSCREEN Instruments..........................................322.7.1 Model of Operationalisation ............................................................................322.7.2 Data Requirements Medical Ethics Committee ..............................................332.7.3 Sampling and Administration ..........................................................................352.7.4 Cooperation and Response ..............................................................................362.7.5 Representativeness of the national Results ......................................................36
3 PSYCHOMETRIC ANALYSES AND PROPERTIES OF THEKIDSCREEN INSTRUMENTS ......................................................................45
3.1 Reliability ............................................................................................................463.1.1 Scale Description and Internal Consistency ....................................................463.1.2 Test-Retest Reliability ......................................................................................463.1.3 Discriminatory Power ......................................................................................493.2 Structure: CFA and IRT, DIF ..............................................................................493.2.1 Rasch Measurement Analysis ..........................................................................493.2.2 Differential Item Functioning ..........................................................................493.2.3 Confirmatory Factor Analysis and MAP Analysis ..........................................523.2.4 Inter-Scale Correlation ....................................................................................52
5
Table of contents
3.3 Validity ................................................................................................................543.3.1 Construct Validity ............................................................................................543.3.2 Convergent Validity ..........................................................................................65
4 PSYCHOMETRIC PROPERTIES OF THE KIDSCREEN PROXY INSTRUMENTS AND RELATIONSHIP TO THE KIDSCREEN CHILD AND ADOLESCENT VERSIONS ............................69
4.1 Construction, Reliability and Validity of KIDSCREEN Proxy Instruments ......694.2 Relationship between Child and Parent Data ......................................................71
5 DESCRIPTION OF THE KIDSCREEN INSTRUMENTS ........................755.1 General Description and Aim of the KIDSCREEN Instruments ........................755.2 The KIDSCREEN-52 (long Version) ..................................................................755.3 The KIDSCREEN-27 (short Version)..................................................................765.4 The KIDSCREEN-10 Index ................................................................................765.5 The KIDSCREEN Proxy Versions ......................................................................765.6 The KIDSCREEN Computer Version
6 ADMINISTRATION OF THE KIDSCREEN VERSIONS ..........................796.1 Suggestions for Administration ..........................................................................796.2 Time to Complete ..............................................................................................806.3 Technical Issues ..................................................................................................80
7 SCORING AND INTERPRETATION OF THE KIDSCREEN QUESTIONNAIRES ................................................................81
7.1 Scoring of the KIDSCREEN Questionnaires ......................................................817.2 Interpretation of KIDSCREEN Dimensions........................................................847.3 Interpretation of Differences in Scores................................................................84
8 COPYRIGHT AND COLLABORATION AGREEMENT............................91
9 CONTACT ADDRESSES FOR SUPPORT ....................................................97
10 REFERENCES ..................................................................................................99
List of Figures ..............................................................................................................105List of Tables ................................................................................................................106
APPENDIX ..................................................................................................................109A0 KIDSCREEN Questionnaires (English language, all language versions
are available on disc [A6] or via internet: www.kidscreen.org)........................109A1 Provision of European Norm Data for Children, Adolescents and
Their Parents for Group Level Comparison ......................................................147A2 Provision of European Norm Data for Children and Adolescents for
Individual Diagnostic Use ................................................................................167A3 Provision of European Norm Proxy Data for Individual Diagnostic Use ........185
6
Table of contents
7
A4 Provision of National Norm Data for Individual Diagnostic Use (KIDSCREEN-10 Index) ..................................................................................203
A5 Provision of National Norm Proxy Data for Individual Diagnostic Use (KIDSCREEN-10 Index) ..................................................................................219
APPENDIX CD-ROMA6 KIDSCREEN Questionnaires (Czech, Dutch, English [IE, UK], French,
German [AT, CH, DE], Greek, Hungarian, Polish, Spanish, Swedish)A7 Norm data A7_A Provision of European Norm Data for Children, Adolescents, and Their Parents
for Group Level ComparisonsA7_B Provision of National Norm Data for Children, Adolescents, and Their Parents
for Group Level Comparisons A7_C Provision of European Norm Data for Children, Adolescents, and Their Parents
for Individual Diagnostic UseA7_D Provision of National Norm Data for Children and Adolescents for Individual
Diagnostic Use A7_E Provision of National Norm Proxy Data for Individual Diagnostic Use A8 Define KIDSCREEN Test Scores by Item Thresholds A9 Scoring of the KIDSCREEN Instrument

Preface
Preface
Monitoring the health status of the population is one of the main activities of publichealth research. Health related quality of life (HRQoL) has recently been introduced intoepidemiology to provide a descriptor of perceived health in the population as a basis forplanning, monitoring, and evaluating health-related interventions in the community.Efforts have been made to include quality of life as an outcome parameter in nationalhealth surveys and also to standardise the use of these measures across European coun-tries (e.g. the EURO HIS Project [Nosikov & Gudex, 2003] and the CHILD Health Indi-cator project [Rigby & Köhler, 2002]).The project “Screening For and Promotion of Health-Related Quality of Life in Childrenand Adolescents – a European Public Health perspective” (acronym: KIDSCREEN) wasfunded by the European Commission (EC) under the programme “Research and Techno-logical Development: Activities of a Generic Nature” within the EC 5th Framework Pro-gramme “Quality of Life and Management of Living Resources“ (EC Grant Number:QLG-CT-2000-00751, Ravens-Sieberer et al., 2001). Using a cross-cultural approach, the KIDSCREEN project simultaneously developed aset of standardised questionnaire for children and adolescents to assess their health-relat-ed quality of life (HRQoL). The HRQoL questionnaire can be used both in representa-tive national surveys and also European-wide health surveys. In order to monitor thehealth of children and adolescents within the European community as part of healthreporting. In addition the KIDSCREEN questionnaires can be used within a clinical andresearch context. The KIDSCREEN instruments are– of a generic nature;– applicable in different national and cultural contexts; – comply with international quality standards in instrument development; and – practical (e.g. short and easy to use and score).
In summary, the project developed, tested, and implemented instruments to assess thewell-being and subjective health (HRQoL) of healthy children and those who suffer fromchronic conditions aged between 8 and 18 years, as well as proxy measures for caregiversand parents (Ravens-Siebeer et al., 2005).The KIDSCREEN project included three major phases of survey development, testing,and implementation. In the development phase, literature reviews, expert consultation,and children’s focus groups were carried out Europe-wide to identify dimensions anditems of HRQoL. The testing phase included representative surveys involving all projectpartners together with assessments of determinants of health. During the implementationphase, the KIDSCREEN-52, -27 and -10 versions were made available via modern com-munication technologies accompanied by user guides and manuals.The KIDSCREEN project collaborated closely with the European DISABKIDS projectentitled “Quality of life in children and adolescents with disabilities and their families -assessing patient views and patient needs for comprehensive care” which was also fund-ed by the EC (www.disabkids.org).
9
How to use this Manual
How to use this Manual
The first part of this manual aims to provide a theoretical understanding of the back-ground of the KIDSCREEN project and the KIDSCREEN instrument. It is addressed toresearchers who want to know more about the KIDSCREEN project, the steps in devel-oping the KIDSCREEN instrument and its validation and psychometric properties. ■ Chapter 1 reviews the theoretical background of the KIDSCREEN project, provides
the rationale for a child and parent HRQoL measure, and for an internationalapproach to HRQoL in children and adolescents, and describes the EuropeanKIDSCREEN partners.
■ Chapter 2 presents an overview of the KIDSCREEN questionnaire development,including details about the elements of the literature review, Delphi study, focusgroups, translation, pilot testing and national surveys.
■ Chapter 3 and Chapter 4 outline the psychometric properties of the differentKIDSCREEN versions. The reliability, structure, and validity of the child and adoles-cent versions are described in Chapter 3, and Chapter 4 addresses the parent / proxyversion and the relationship between child and parent data.
The second part of the manual provides practical information about the different versionsof the KIDSCREEN instrument, its administration, scoring, and interpretation. ■ Chapter 5 describes the three different questionnaire versions, the KIDSCREEN-52
(long version), KIDSCREEN-27 (short version) and the KIDSCREEN-10 index, aswell as their scope of application in more detail. The most important results of thevalidation and psychometric properties of the respective versions are outlined as well.
■ Chapter 6 offers some suggestions for the administration of the KIDSCREEN ques-tionnaires and also some requirements that should be followed.
■ Chapter 7 presents the scoring and interpretation guidelines of the KIDSCREENquestionnaire versions. The interpretation of the dimensions as well as the differencesin scores is given.
■ Chapter 8 provides copyright information and the conditions of use of theKIDSCREEN instrument and translations. Contact addresses for support by thenational KIDSCREEN partners are presented in Chapter 9.
■ Chapter 10 includes complete citations for the referenced publications.■ Appendix provides European and national norm data stratified by age and gender.
10

Summary of the KIDSCREEN instruments
Summary Sheet of the KIDSCREENInstrumentsAuthors: The KIDSCREEN Group (2006).Publisher: Pabst Science Publishers.
Origin: The KIDSCREEN generic health-related quality of life measures for childrenand adolescents were developed within the project "Screening and Promotion forHealth-related Quality of Life in Children and Adolescents - A European Public HealthPerspective." The project was funded by the European Commission and took place overthree years (2001-2004). Participants in the project were Austria, Czech Republic,France, Germany, Greece, Hungary, Ireland, Poland, Spain, Sweden, Switzerland, TheNetherlands and the United Kingdom (Acknowledgement: The KIDSCREEN projectwas financed by the European Commission grant number QLG-CT-2000- 00751 with-in the EC 5th Framework-Programme "Quality of Life and Management of LivingResources").Purpose: Designed to assess generic health-related quality of life (HRQoL) in healthyand chronically ill children and adolescents, to identify children at risk in terms of theirsubjective health, and to suggest appropriate early interventions by including the instru-ment in health services research and health reporting.Description: The KIDSCREEN instruments were designed to address generic health-related quality of life. They are based on a comprehensive process of developmentacross different countries. The instruments are designed to assess health-related quali-ty of life in a standardized format as reported by children/adolescents or parents. Apaper and pencil as well as a computer version are available for all three KIDSCREENversions (KIDSCREEN-52, KIDSCREEN-27, KIDSCREEN-10 index).Population: The KIDSCREEN measures are applicable to healthy and chronically illchildren and adolescents from 8 to 18 years. Additionally, proxy versions for parents orother caregivers are available. Development: The KIDSCREEN instruments assess children's and adolescents' sub-jective health and well-being (health-related quality of life - HRQoL). They weredeveloped as self-report measures applicable for healthy and chronically ill childrenand adolescents aged from 8 to 18 years. The KIDSCREEN project used a simultane-ous approach to include 13 European countries in the cross-cultural harmonisation anddevelopment of the measure. The generation of the questionnaire was based on litera-ture reviews, expert consultation, and children's focus groups in all participating coun-tries. This was done to identify dimensions and items of HRQOL which are relevant torespondents in all countries.The KIDSCREEN-52 instrument measures 10 HRQoL dimensions: Physical Well-being (5 items); Psychological Well-being (6 items); Moods & Emotions (7 items);Self-Perception (5 items); Autonomy (5 items); Parent Relations & Home Life (6items); Social Support & Peers (6 items); School Environment (6 items); Social Accep-tance (Bullying) (3 items); and Financial Resources (3 items). It was constructed andpilot tested using the data of more than 3.000 European children and adolescents. In
11

Summary of the KIDSCREEN instruments
addition to common psychometric analyses, Item-Response-Theory Analysis andStructural Equation Modelling were performed to determine the optimal item and scalecharacteristics of the questionnaire. One focus of analyses was to identify items show-ing differential item functioning (DIF). The control of DIF enables comparable meas-urement of the identified quality of life dimensions across the 13 European countries. The KIDSCREEN-27 instrument measures 5 HRQoL dimensions: Physical Well-being(5 items); Psychological Well-being (7 items); Autonomy & Parent Relations (7 items);Social Support & Peers (4 items); School Environment (4 items). It was constructedand pilot-tested using the data of more than 10.000 European children and adolescents.The psychometric analyses resembled those of the KIDSCREEN-52.The KIDSCREEN-10 instrument provides a singular index of global HRQoL coveringphysical, psychological and social facets of HRQoL (10 items). It was constructed inthe same manner as the KIDSCREEN-27.The KIDSCREEN-52, KIDSCREEN-27 and KIDSCREEN-10 were used in represen-tative mail surveys of HRQoL in approximately 1800 children and their parents percountry (total n = 22830) and normative data was produced. The final analysis of theinstruments involving national and cross-cultural analyses confirmed the results of thepilot test. The sub-scales enable true cross-cultural measurement on interval scale lev-el by fulfilling the assumption of the Rasch-model and displaying no DIF. Additional-ly, all three versions are available for parents and primary-care givers.Scoring: The KIDSCREEN instruments can be self-administered or administered.Depending on the version, the instruments consist of 10 to 52 items, which are scoredon a 5-point scale ranging from never / not at all to always. The time frame refers to thelast week. Scores can be calculated for each dimension of the different KIDSCREENinstruments. T-values and percentages are available for each country stratified by ageand gender.Time required: KIDSCREEN-52 approx. 15-20 minutes; KIDSCREEN-27 approx.10-15 minutes; KIDSCREEN-10 index approx. 5 minutes.Reliability: KIDSCREEN-52: Internal consistency values (Cronbach's Alpha) rangesatisfactorily between .76 (Social Acceptance) and .89 (Financial Support) for the dif-ferent dimensions for the self-report version, test-retest reliability at a 2 week intervalvaries between .56 and .77. Item intraclass correlation (ICC) between self-reportedscores and scores from parents filling out the KIDSCREEN-52 proxy-version rangingfrom .45 (Moods & Emotions) and .62 (Physical Wellbeing, School Environment).KIDSCREEN-27: Internal consistency values (Cronbach's Alpha) range satisfactorilybetween .79 (Physical Well-being) and .84 (Psychological Well-being) for the differentdimensions for the self-report version, test-retest reliability at a 2 week interval variesbetween .61 and .74. Item intraclass correlation (ICC) between self-reported scores andscores from parents filling out the KIDSCREEN-27 proxy-version ranging from 0.44(Social Support & Peers) and .61 (Physical Well-Being).KIDSCREEN-10 Index: Internal consistency values (Cronbach's Alpha) reaches .82 forthe self-report version, test-retest reliability at a 2 week interval reaches .55. Item intr-aclass correlation (ICC) between self-reported scores and scores from parents fillingout the KIDSCREEN-10 Index proxy-version reaches.56.
12
Summary of the KIDSCREEN instruments
Validity: Convergent and discriminant validity were shown using information on thechildren's and adolescents' physical (Children with Special Health Care Needs Screen-er for Parents, CSHCN) and mental health (Strength and Difficulties Questionnaire,SDQ). In addition to this, in each country the relationship between national HRQoLinstruments for children and adolescents and the KIDSCREEN versions were analysedand showed overall satisfactory results.Cross cultural applicability: The international, collaborative nature of theKIDSCREEN project provided many challenges in terms of producing an instrumentwhich is conceptually and linguistically appropriate for use in many different countries.By giving each country the opportunity to be involved at the early stages of the instru-ment development (the item construction phase), the KIDSCREEN measures are thefirst truly cross-national HRQoL instrument for use in children and adolescents. TheKIDSCREEN instruments can contribute to European policies by providing informa-tion about the types and distribution of quality of life impairments (nationally as wellas Europe-wide). They enable a better understanding of perceived health in childrenand adolescents and can help to identify populations at risk. In addition, another strength is the cooperation with the DISABKIDS project whichaims at developing disease specific health-related quality of life modules for childrenand adolescents of the age-groups 4-7 and 8-16 with chronic conditions such as asth-ma, cerebral palsy, diabetes mellitus, epilepsy, juvenile arthritis, serious skin diseases,overweight problems and cystic fibrosis. The DISABKIDS modules can be used inaddition to the KIDSCREEN measures. Both projects collaborated closely during theinstrument development phases to ensure a joint methodology and a wide coverage.Languages: Czech, Dutch, English (UK, USA, IE), French, German (AT, CH, D),Greek, Hungarian, Korean (RKO), Polish, Portuguese, Spanish, Swedish (as theybecome available, new translations will be presented on the websitehttp://www.kidscreen.org).Administration / Suggested Uses: All types of epidemiological and paediatric studiesand clinical studies; health services research and health reporting; integrated outcomemeasurement. Administration is recommended for professionals in different fields(public health, epidemiology, medicine) and institutions (schools, hospitals, researchlabs, medical establishments) of the health care system.
References:Ravens-Sieberer, U., Gosch, A., Abel, T., Auquier, P., Bellach, B.-M., Dür, W., Rajmil, L. & the
European KIDSCREEN Group (2001). Quality of life in children and adolescents: a Euro-pean public health perspective. Social and Preventive Medicine, 46, 297-302.
Ravens-Sieberer, U., Gosch, A., Rajmil, L., Erhart, M., Bruil, J., Duer, W., Auquier, P., Power,M., Abel, T., Czemy, L., Mazur, J., Czimbalmos, A., Tountas, Y., Hagquist, C., Kilroe, J. andthe European KIDSCREEN Group. (2005). KIDSCREEN-52 quality-of-life measure forchildren and adolescents. Expert Review of Pharmacoeconomics & Outcomes Research, 5(3), 353-364.
The KIDSCREEN Group Europe. (2006). The KIDSCREEN Questionnaires - Quality of lifequestionnaires for children and adolescents. Handbook. Lengerich: Pabst Science Publishers.
13

Summary of the KIDSCREEN instruments
Other selected bibliographical information:Bisegger, C., Cloetta, B., von Rueden, U., Abel, T., Ravens-Sieberer, U., and the European
KIDSCREEN group. (2005). Health-related quality of life: gender differences in childhoodand adolescence, Soz.-Präventivmed, 50, 281-291.
Detmar, S.B., Bruil, J., Ravens-Sieberer, U., Gosch, A., Bisegger, C., and the EuropeanKIDSCREEN group. (2006). The Use of Focus Groups in the Development of theKIDSCREEN HRQL Questionnaire, Quality of Life Research, Jan 2006, 1 - 9.
Herdman, M., Rajmil, L., Ravens-Sieberer, U., Bullinger, M., Power, M., Alonso, J., and theEuropean KIDSCREEN and DISABKIDS groups (2002). Expert consensus in the develop-ment of a European health-related quality of life measure for children and adolescents: a Del-phi study. Acta Pediatrica 91 (12), 1385-90.
Rajmil, L., Alonso, J., Berra, S., Ravens-Sieberer, U., Gosch, A., Simeoni, M.-C., Auquier, P.,and the KIDSCREEN group. (2006). Use of a children questionnaire of health-related qual-ity of life (KIDSCREEN) as a measure of needs for health care services. Journal of Adoles-cent Health, 38, 511-518.
Rajmil, L., Herdman, M., Fernández de Sanmamed, M.J., Detmar, S., Bruil, J., Ravens-Sieberer,U., Bullinger, M., Simeoni, M.-C., Auquier, P., and the Kidscreen group (2004). GenericHealth-related Quality of Life Instruments in Children and Adolescents: A Qualitative Analy-sis of Content. Journal of Adolescent Health 34, 37-45.
von Rueden, U., Gosch, A., Rajmil, L., Bisegger, C., Ravens-Sieberer, U., and the KIDSCREENGroup. (2005). Socioeconomic determinants of health-related quality of life in childhood andadolescence: results from a European study, Journal of Epidemilology and CommunityHealth. Journal of Epidemilology and Community Health, J Epidemiol Community Health,60(2), 130-5.
See also Internet Site: http://www.kidscreen.org
14
In recent years, health-related quality of life (HRQoL) has become a central researchtheme which is increasingly gaining importance in the field of public health, and also inmedical research as an outcome and evaluation criterion. This development has beendriven by several factors:– the dissatisfaction with the way in which health has been routinely assessed in the
biomedical area; – the scepticism regarding the scope of classical outcome criteria used to evaluate inter-
ventions in medicine; and– the relevance of assessing quality of life in children and adolescents in the communi-
ty and on national level relates to prevention of disease and health promotion in chil-dren and adolescents.
So far, research has shown that including HRQoL in children’s and adolescents’ healthsurveys is feasible if instrument development takes into account the age, maturity andcognitive development of the child. HRQoL instruments can be of benefit for screeningand early detection of possible impairments in children’s well-being and functioning, andfor identifying the social and behavioural determinants of health (e.g. socio-economicfactors and health behaviours, acute and chronic health conditions), which can form thebasis of early interventions.Although several generic instruments to assess HRQoL exist, a few shortcomings arenoted. Most instruments were developed for use mainly in children with a chronic illness(Eiser & Morse, 2001; Harding, 2001) and all instruments have been developed on anational rather than international basis. To date, cross-cultural aspects of health-relatedquality of life in children have not been addressed. An appropriate way to ensure thatmeasures on subjective health perception are suitable for use in cross-cultural research isto develop the measure simultaneously in several countries. In addition, a healthy popu-lation should be involved in the development to ensure appropriateness for use in epi-demiological surveys and preventive health care. This is the approach taken by membersof the KIDSCREEN project, a collaborative effort between researchers in Europe.Since the issue of how to allocate resources within the health care system has become amatter of intense debate, there is an increasing demand to determine the nature and theextent of health care needs and utilisation of health care services. While the debate hasso far mainly been held on a national level, it is now extending to the international lev-el. Taking the large variety of health care systems within the European Union intoaccount, states with different health economics systems have only rarely been includedin studies.To meet these political, scientific, and practical demands, the KIDSCREEN project wasoriented towards three tasks:
15
Introduction1

Chapter 1
– to develop a generic questionnaire for assessing quality of life in healthy and ill chil-dren and adolescents;
– to translate the questionnaire which was used in a pilot test into ten languages and totest the psychometric quality of the instruments in 13 different countries; and
– to assess the value of the instruments by implementing and evaluating them in nation-al health surveys and to continuously monitor, evaluate and improve the health andsubjective well-being in children and adolescents.
1.1 Theoretical Background of the KIDSCREEN Project
1.1.1 Health-related Quality of Life as an Outcome Measure
Over the past century, advances in public health and medicine have increased the aver-age life expectancy in the Western world. These advances, however, have been accom-panied by a significant rise in the percentage of adults living with chronic health condi-tions such as heart disease, cancer, diabetes, arthritis, and mental illness. As a conse-quence, within the field of public health and medicine it was found to be important notonly to focus on issues of quantity of life but also quality of life. In general quality of life (QoL) is a complex, abstract, and multidimensional concept thatis difficult to define and measure. In everyday language it is often used as a synonym forhappiness including factors that contribute to the goodness and meaning of life. QoL isunderstood to be the personal satisfaction (or dissatisfaction) with the cultural or intellec-tual conditions under which an individual lives. In addition to personal happiness and asense of purpose in life, people want social solidarity and healthy communities. In otherwords, QoL is a broad concept or reference point that has relevance to virtually all areasof human function (Evans, 1994). As a result, it has been extensively researched,reviewed, and discussed in the social science, psychology, economic, and medical liter-atures. One of the important domains of QoL is health. Health can also be viewed as a subjec-tive representation of function and well-being, as stated earlier in the WHO definition,which shifted from a purely biological model to a bio-psycho-social model in which thewell-being and quality of life of individuals were assessed. The WHO definition (1948)holds an important expansion of the view of health, which is not only understood bysomatic indicators, but comprises how a person feels, psychologically and physically,and how she or he manages with other persons and copes with everyday life. Health-related quality of life is described as a multidimensional construct covering physical,emotional, mental, social, and behavioural components of well-being and function asperceived by patients and/or other individuals. The WHO Quality of Life Group extendsthis definition and includes the cultural perspective: quality of life is defined as an indi-vidual’s perception of their position in life in the context of the cultural and values sys-tems in which they live, and in relation to their goals, expectations, standards and con-cerns. Meanwhile, researchers in the fields of psychology, medicine and public health havedeveloped useful techniques that have helped to conceptualise and measure these multi-ple domains and how they relate to each. To date, the importance of measuring HRQoLin individuals or groups of patients is well accepted. This is true for adults and increas-ingly for children and adolescents, although the utility of generic HRQoL measurement
16

Introduction
in population health of children and adolescents has only recently begun to be explored.HRQoL questions about perceived health and function are thought to be an importantcomponent of health surveillance and should be routinely included as an indicator.HRQoL measures can aid in identifying subgroups of children and adolescents who areat-risk for health problems, and can assist in determining the burden of a particular dis-ease or disability (Center for Disease Control and Prevention, 2000). Further, it can helpto evaluate health service needs. Results of such an evaluation can be used to influencepublic policy decisions, promoting policies and legislation related to children’s and ado-lescents’ health, and aiding in the allocation of healthcare resources. Monitoring thehealth status of the population allows public health professionals to improve the healthof populations, by tracking health trends, identifying discrepancies in health, and plan-ning health promotion activities and interventions.
1.1.2 The Need for HRQoL Research in Children and Adolescents
Research reflecting the child’s point of view about well-being, perception, and behaviouris currently available only in rudimentary form. Most health-related quality of life meas-ures for children and adolescents have been developed for chronically or severly ill pae-diatric patients (Eiser & Morse, 2001; Harding, 2001; Marra et al., 1996; Spieth & Har-ris, 1996; Rosenbaum & Saigal, 1996). A small but increasing number of generic ques-tionnaires exist which assess HRQoL in both healthy and chronically ill children andadolescents (Rajmil et al., 2004; Bullinger & Ravens-Sieberer, 1995). This paucity ofHRQoL research focused on children has several reasons: First, it can be explained byearlier doubts as to whether children are able to express opinions, attitudes, and feelingsabout their HRQoL reliably. To understand the concept of HRQoL, or to value aspects ofone’s own health and well-being, is determined by age, maturity and the cognitive devel-opment of a child. Recent research has shown that children are able to report on theirwell-being and functioning reliably if the questionnaire is appropriate to the child’s ageand cognitive level (Raat et al, 2002; Rebok et al., 2001; Riley, 2004).Another critical point concerns the dimensions that are relevant and necessary to describethe concept of HRQoL in children and adolescents. Whether children would emphasisethe same dimensions as adults is not clear, but it can be assumed that this is at least part-ly determined by the child’s age. One shortcoming of the theoretical discussion and con-struction of questionnaires is that children are rarely asked to express their point of view.Increasing emphasis is given to considering the child’s point of view as equally or morerelevant than that of experts or the results of literature reviews.Rapid development of instruments measuring quality of life is connected with the expan-sion of outcome assessment approaches, techniques that determine burden of disease andevidence-based methodologies, including clinical trials. The research and theoretical dis-cussion of HRQoL in children and adolescents presented in recent years moved from theapplication of measures used in the adult population, to building and testing new instru-ments designed specifically for children of different ages and developmental competen-cies. There are strong arguments for self-reporting whenever possible, especially inaspects of emotional and social HRQoL. Finally, new studies have led to more advanceddefinitions, conceptualisations and operationalisations of paediatric HRQoL and to deep-er insight into children’s and adolescents’ needs and perceptions of life satisfaction (Varniet al., 1999). The general definition of HRQoL used for adults could be applied to chil-
17
Chapter 1
dren, although specific aspects of physical development and psychosocial functioningshould be considered (Matza et al., 2004). Children should not be regarded as smalladults; their special health needs should be acknowledged. Children are growing in thevarious social environments including family, school, peers, neighbourhoods, and com-munity. Contrary to adults, they often have no choice and limited capability to move fromdisadvantageous environments. Moreover, they are growing and changing all the time, solongitudinal evaluation of HRQoL must account for the baseline level, as well as the nat-ural change over time. When asked what was most important in their lives besides phys-ical functioning, adolescents indicated that they valued social relationships (family andfriends) and general mood, as well as the “sense of self” feelings and need for growingindependence (Edwards et al., 2002). Another trend in the discussion of HRQoL in children and adolescents is concentrated onthe development of generic measures as more universal standards, having higher priori-ty in epidemiological studies. Historically, numerous instruments have been employed toassess disease-specific conditions (Eiser & Morse, 2001), but recent publications foundthe disease-specific approach to be limited (Wallander et al., 2001). The impact of anydisease is better learned through comparing quality of life of people with and without thedisease. Generic measures could be applied in clinical settings together with a disease-specific instrument. Generic HRQoL measures may highlight some aspects of patientwell-being which can be overlooked in a routine consultation, and may help in the eval-uation of drug therapy where unexpected adverse effects are difficult to anticipate. Themain purpose of applying generic measures on a population level is related to monitor-ing of population health, evaluation of the effects of health policies, and allocation ofresources in relation to needs. This is applicable to all ages, including children, whosehealth is vital for the future strength and prosperity of society.
1.2 The Rationale for a Child and Parent MeasureSelf-reports are generally the principal method used to assess a person’s subjective viewof health and well-being. This is true for children and adolescents as well as for adults.However, where children are concerned, problems can occur depending on their lan-guage and reading skills and their overall cognitive abilities to understand and interpretthe questions. A limitation of a long-term view of events and consequences, and a deficitin the ability to pay attention for the time-period needed to answer a questionnaire, canalso occur. Nevertheless, in recent studies it has consistently been shown that childrenand adolescents older than 8 years of age are able to understand questions, and to pro-duce reliable and valid answers about their HRQoL (Riley, 2004). Consequently, infor-mation about the subjective health and well-being of these age-groups should be gatheredby asking the children and adolescents themselves. This is especially important becausehealth-related quality of life studies among adult patients that included proxy ratingshave shown that proxy ratings correlate only sufficiently with ratings provided by thepatients themselves.Few studies have reported an investigation into these questions for children and parentmeasures – those that do have typically done so in the process of developing a newHRQoL measure for children and adolescents. Theunissen et al. (1998) compared theagreement between child self-reports and parent reports on children’s HRQoL in a repre-sentative sample of 1105 Dutch children aged 8-11 years using the Dutch TNO/AZL
18

Introduction
Quality of Life (TACQOL). Correlations between child self-reports and parent reportswere between 0.44 to 0.66 depending on the dimension. Children reported lower HRQoLaccording to physical complaints, motor functioning, autonomy, cognitive functioning,and positive emotions scales in comparison to parental data. In another study comparingself-reported data of children with a chronic condition and parental data, an agreementfor the TACQOL scales was between 0.10 to 0.99. The 416 children between 8 to 15years scored lower on average on the physical complaint, motor functioning, and posi-tive emotions scales. Parents reported lower HRQoL on the social and negative emotionsscales (Koopman et al., 1999). In a study including 300 14-year-old adolescents withvery low birth-weight, Verrips et al. (2000) found a good inter-rater agreement betweenchildren’s and parents’ report on the motor scale of the TACQOL, a satisfactory correla-tion for the autonomy and cognitive scales, but only moderate agreement in the social,body, and mood scales. Other studies investigating the concordance between child and parent reports supportthese findings and show some evidence for greater concordance between the child andparent for physical functioning compared with social and emotional domains, but greaterheterogeneity in the latter measures (Whiteman & Green, 1997). The agreement betweenchild and proxy-reports depends on the observability of the domain (Verrips et al., 2000).It seems to be more difficult for parents of adolescents to gain insight into their child’sassessment of emotional states and social relations, than for them to determine moreobjective aspects of their child’s health such as physical functioning. It can be conclud-ed that children and parents provide different information on HRQoL. Children and par-ents form part of the same psychosocial system, the family, providing information aboutthe child’s health-related quality of life from a somewhat different perspective. Thechild’s subjective view of his or her own HRQoL is estimated to be of great importanceand he or she should be the preferred respondent. However, sometimes it can be neces-sary to get a second opinion from a caregiver or parent (e.g. if the child is severely ill),or even in some situations when data only from caregivers are available. The inclusionof proxy measures can, however, provide additional information and the use of reportsfrom different sources, both from children and parents is recommended (La Greca, 1990;Achenbach, McConnaughy & Howell, 1987). In some situations it is valuable to haveinformation at least from parents as proxy measures for the assessment of the child’s andadolescent’s HRQoL.
1.3 The Rationale for an international ApproachIn the age of increasing European and international collaboration, cross-culturally appli-cable HRQoL instruments are warranted. In epidemiological studies, a cross-culturallyvalid and sensitive HRQoL measure can be used to elicit information about the incidenceand prevalence of HRQoL impairments in specific populations across cultures. To datethe majority of HRQoL questionnaires for children and adolescents have been generatedwithin one country and subsequently translated into other languages (Felder-Puig et al.,2004; Koot et al., 2004; Loonen et al., 2002; Reichenberg et al., 2000; Landgraf et al.,1998). A cross-cultural adaptation of a questionnaire is subject to problems concerning cross-cultural equivalence (Bullinger & Ravens-Sieberer, 1995, Anderson et al., 1993, 1996).Part of the cross-cultural equivalence is the item-translation equivalence. This requires
19

Chapter 1
each item to have the same meaning in the original and target language, i.e. the seman-tic equivalence is more important than the literal equivalence. Another issue is the scaleequivalence, which requires that the different language versions should produce similarresults according to reliability, validity, and responsiveness to change. A third aspect con-cerns the operational equivalence which describes whether different modes of applica-tion (e.g. paper and pencil test, telephone interview) provide similar results. Finally, themetric equivalence demands that scores obtained on scales must reflect the same degreeof HRQoL across countries. To answer these challanges and to provide a cross-culturally equivalent instrument,instrument development should, as defined by the WHOQOL Group, use a simultaneousapproach including a primary consensus on relevant dimensions of HRQoL for certainage groups within each of the different countries. Furthermore, methods to develop ageneric questionnaire and to generate equivalent multi-language versions should include– besides an international conceptualisation of the HRQoL construct – an initial itemselection by the participation of all individual countries, forward and backward transla-tion, and pre-testing in all participating countries. This should be an iterative processinvolving several steps of item refinement.
1.4 Description of the KIDSCREEN Project The KIDSCREEN project started on February 1st, 2001. The three phases of theKIDSCREEN project are demonstrated in Figure 2. The developmental phase of theKIDSCREEN project included a literature search, a Delphi study with experts, and afocus group study with children, adolescents, and their parents. A first KIDSCREENinstrument was developed in English and translated into four languages (DE, ES, FR, andNL) using internationally accepted translation guidelines. This first KIDSCREEN instru-ment was administered in a pilot study. Following this pilot study, a further item reduc-tion process was carried out including extensive psychometric analyses resulting in a 52-item KIDSCREEN research version. Phase 2 consisted of the administration of the ques-tionnaire in national representative samples in order to obtain reference data. Phase 3comprised the instrument implementation.The KIDSCREEN project was co-ordinated by the German study centre, which wasresponsible for the scientific management across all of the work phases and also for allthe participating centres, the time management, the financial management and the reportsbeing written. The project started originally with seven countries (AT-Austria, CH-Switzerland, DE-Germany, ES-Spain, FR-France, NL-The Netherlands, and UK-UnitedKingdom). After the pilot study, when the basic instrument had been developed, theKIDSCREEN project was extended. Three more countries (CZ-Czech Republic, HU-Hungary and PL-Poland) of the Newly Associated States (NAS) joined the KIDSCREENproject and were funded by the EC as well. Also, three additional countries (EL-Greece,IE-Ireland, and SE-Sweden) joined the KIDSCREEN project with independent funding.These six countries translated the KIDSCREEN 52-item research instrument accordingto international translation guidelines and conducted a cognitive debriefing.At the time the reference study started (Phase 2), the project involved thirteen Europeancountries: AT, CH, CZ, DE, EL, ES, FR, HU, IE, NL, PL, SE, and UK. In Figure 1 allparticipating countries are shown.
20
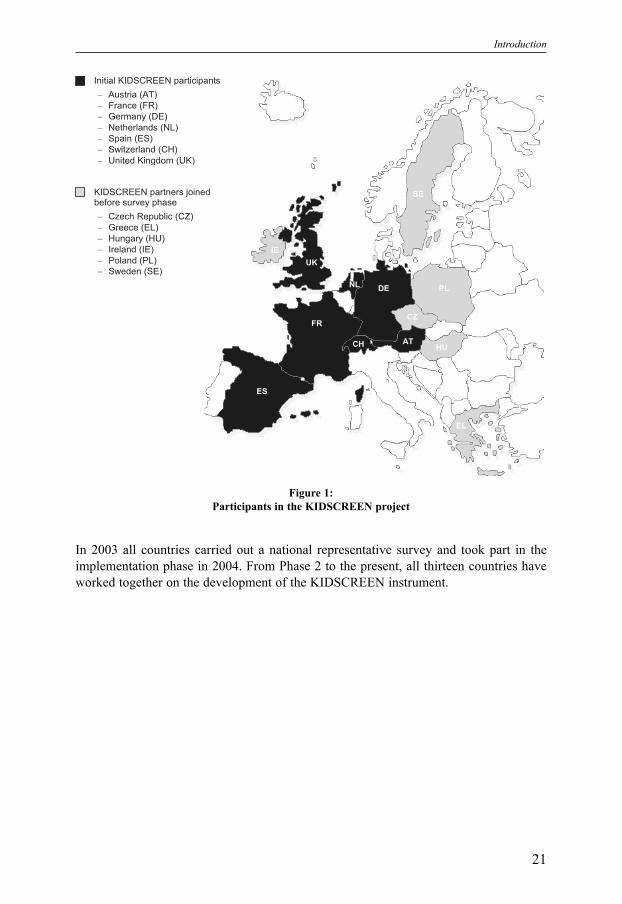
Introduction
In 2003 all countries carried out a national representative survey and took part in theimplementation phase in 2004. From Phase 2 to the present, all thirteen countries haveworked together on the development of the KIDSCREEN instrument.
21
Initial KIDSCREEN participants
− Austria (AT)
− France (FR)
− Germany (DE)
− Netherlands (NL)
− Spain (ES)
− Switzerland (CH)
− United Kingdom (UK)
KIDSCREEN partners joined before survey phase
− Czech Republic (CZ)
− Greece (EL)
− Hungary (HU)
− Ireland (IE)
− Poland (PL)
− Sweden (SE)
FR
ES
DE
CH AT
UK
NL PL
CZ
HU
EL
IE
SE
Figure 1: Participants in the KIDSCREEN project


The KIDSCREEN approach followed a methodology which consisted of several workphases (see Figure 2) which reflected a stepwise instrument development procedure. Inthe instrument development phase, literature review (Chapter 2.1), delphi panel (Chapter2.2) and focus groups (Chapter 2.3) were used to identify relevant items and dimensions.This item pool underwent a first item reduction procedure (Chapter 2.4). Remainingitems were translated and harmonised by comparing items across languages (Chapter2.5). The resulting pilot version was then tested in a pilot study that aimed to collect datafor first psychometric analyses and to perform the final item reduction (Chapter 2.6). Inrepresentative national surveys, the performance, retest-reliability, and the constructvalidity were assessed (Chapter 3.1 and Chapter 3.3).
23
Development of the EuropeanKIDSCREEN Instruments 2
Item Development
1st
Item Reduction & Selection
Translation
Literature Review
Delphi Study
Focus Groups
EUROHIS Guidelines
Card Sort Technique
Cognitive Interviews
Forward Translation
Backward Translation
International Harmonisation
Statistical Analyses:
Validation and Final Item Reduction
Pilot Version
Pilot Study
Survey Study
Figure 2:Steps in the development of the KIDSCREEN instrument

Chapter 2
2.1 Literature Review
In order to acquire an overview of the literature, particularly of instruments that havedealt with HRQoL in children and focused on international or cross-cultural research, acomputer search was conducted using the MEDLINE data bases. Literature publishedfrom 1985 to 2000 was searched (via DIMDI, the German Institute for Medical Docu-mentation and Information in Cologne).To identify relevant studies, the search terms ‘child’ or ‘adolescent’ were used on the firstlevel in association with the terms ‘public health’, ‘health survey’, ‘health reporting’ or‘epidemiology’. On the second level, two paths were integrated in the search. The firstone included the terms ‘quality of life’, ‘health status’, ‘well-being’, ‘adaptation’ or ‘psy-chosocial’. The second path searched for the terms ‘instruments’ or ‘assessments’. Addi-tionally the terms ‘programme’, ‘health promotion’, ‘resources’, ‘cross-cultural’, ‘fami-ly’, ‘risk factors’ or ‘prevention’ were investigated. Conducting the search with the addi-tional terms, the number of abstracts increased to high levels (more than 25.000 hits), so that the references resulting from the added terms had to be excluded for review (Figure 3).The first and the second path were combined and the duplicates deleted. Some articleswhich were not in the pool were added (e.g. from authors of the group) to the abstractsfound during the MEDLINE search. After this procedure 9029 abstracts had to bereviewed with a short evaluation sheet to decide if they were relevant for the assessment.Each of the participating centres was asked to review a certain number of the distributedabstracts. The evaluation was carried out according to pre-specified criteria covering aspects suchas: application, design, assessment period, research aim, usage of QoL instruments, sam-ple characteristics and relevance for the KIDSCREEN project. The results of this reviewshowed that 335 (3.7%) of the 9029 abstracts were rated as relevant, 80 of them as hav-ing major relevance, 127 as moderately relevant, and 123 as having minor relevance (5missing). The articles represented a variety of studies such as cohort studies, instrumentvalidation studies, and epidemiological surveys. The majority of the studies were cross-sectional. Only 11 references dealt with the evaluation of a QoL instrument (includingadult and disease-specific instruments).
24
MEDLINE Human
Title/Abstract, from 1985
(child OR adolescent) AND (public health OR health survey OR health reporting OR epidemiology)
AND (quality of life OR health status OR well-being OR adaptation
OR psychosocial
AND (instruments OR assessments)
AND (program OR health promotion OR resources OR cross-cultural OR family)
AND (risk factors OR preventions)
3.953 abstracts 5.671 abstracts 6.584 abstracts excluded for review
10.878 abstracts excluded for review
Figure 3:Criteria for the MEDLINE search

Development of the European KIDSCREEN Instruments
2.2 Delphi Study
A Delphi exercise was conducted in order to identify the conceptualisation and opera-tionalisation of HRQoL in children and adolescents from an expert perspective. The Del-phi Method is an iterative technique used to achieve group consensus regarding an issueunder investigation. It consists of a series of repeated interviews, usually by means ofquestionnaires, of a group of individuals whose opinions or judgements are of interest.After the initial questioning of each individual, each subsequent interview is accompa-nied by information regarding the preceding round of replies, presented anonymously.The individual is thus encouraged to reconsider and, if appropriate, to change her or hisprevious reply in light of the replies of other members of the group. After three to fiverounds the group position is determined by averaging.The Delphi process for the KIDSCREEN project consisted of three rounds of question-naires administered to a multidisciplinary group of 24 experts from 7 European countries.The first Delphi round consisted primarily of open questions; later versions of the ques-tionnaire were based on expert responses to this round. The questionnaire was dividedinto three broad sections dealing with conceptualisation and operationalisation ofHRQoL, as well as questionnaire construction and content. In the first round, the ques-tionnaire was sent to 24 participants and replies were received from 17 of them. Analy-sis of first round responses was largely qualitative. In the second round, answers werereceived from 19 respondents. In the second and third rounds, consensus was consideredto be reached when at least 90% of experts either agreed or disagreed on a given item, or where median scores were over 6 on a scale of 1-10, and score dispersion was with-in predetermined limits. Responses were received from 20 respondents in the threerounds. It was agreed that the new instrument should be a multidimensional profile measure with30-49 items covering 5 to 8 dimensions, and taking 10-15 minutes to complete. Agree-ment was also reached on 8 specific dimensions to be included in the questionnaire: psy-chological (well-being, self-esteem, body image, cognitive functioning), physical(mobility, energy/vitality), social (social relations, family/home function) and other pos-sible dimensions, such as environment. A more detailed description of the KIDSCREENDelphi procedure and its results can be found in the publication of Herdman et al. (2002).
2.3 Focus GroupsTo include the opinion of children/adolescents and their families about what constitutesHRQoL, focus groups were conducted. In each country, six focus groups were organised,with four to six participants in each group. The groups were divided into separate genderand age groups. Parents’ opinions were obtained by questionnaires. One aim of the focusgroups was to identify dimensions and items by exploring the meaning of quality of lifeand well-being for the participants. A further aim was to estimate the impact of healthproblems and to evaluate the layout and answer categories of available generic quality oflife questionnaires for children and adolescents. A manual of focus group guidelines waswritten to guarantee consistent procedures for the focus group studies in each participat-ing country. The content of the focus group was divided into four parts. The first part was aimed atcollecting issues spontaneously brought up by the subjects themselves in response to
25
Chapter 2
open questions such as, “In your opinion, what is important for you in your everyday lifeto make you feel well?” The second part was slightly more directive; here the child wasasked to express physical, psychological and social aspects related to health status, basedon the results of the literature review (see 2.1) and Delphi procedure (see 2.2). In the thirdand fourth parts, participating children/adolescents were asked to complete a list of itemsfrom existing generic quality of life questionnaires for children and adolescents. The dif-ferent answer categories, time frames and example items from generic QoL question-naires were evaluated to test their feasibility. Two experienced moderators guided thesessions. All sessions were audio-taped, transcribed and content-analysed by the respon-sible centre. The focus group work identified the children/adolescents and family perspective onhealth-related quality of life, functioning, well-being and diseases of children/adoles-cents reflecting the situation in participating European countries. Conducting focusgroups proved to be useful for exploring children’s views of HRQoL and resulted inissues that are relevant for children and adolescents. The documentation of the focusgroup study resulted in a total of 26 dimensions and 2505 statements. A more detaileddescription of the KIDSCREEN focus group approach and its results can be found in thepublication of Detmar, et al. (2006).
2.4 First Item Reduction ProcedureThe 2505 statements formulated by the focus groups underwent a reduction processinvolving a redundancy rating performed by three centres and a card sorting procedure.The whole process of item reduction is presented in Table 1. The first step involved theremoval of redundant and inappropriate items using guidelines from the EUROHIS study(Nosikov & Gudex, 2003) and was performed by three centres (NL, DE, UK). In the sec-ond data reduction step, all participating centres were asked to rate the remaining 1070items for applicability, clarity and importance. As a framework, the card sort technique,common in cognitive psychology, was used. This technique reduced the items while tak-ing into account the dimensions of quality of life that children/adolescents and familiesdeemed to be important by sorting the items into categories within dimensions. In eachdimension the cards were divided into a number of categories according to certain com-mon features and sub-standard items were rejected. In each category, the items wereranked according to how well they represented the dimension. A list of categories with-in dimensions was made. Categories that were very similar or that contained only a fewitems were combined with other categories, and dimensions that were very similar orcontained only a few items were merged with other dimensions. Using this technique, 18categories remained and the best items from each category were selected. The card sorttechnique identified 185 suitable items for the KIDSCREEN pilot measure. To transform the questions into final items for a questionnaire format, an item writingpanel was assembled by the participating centres. The criteria set by the panel was thatitems should: – give rise to answers that inform on respondents’ state or behaviour; – be amenable to a rating scale; – reflect the meaning conveyed in the domain definition; – be applicable to people with a wide range of conditions; – be framed as a question instead of a statement;
26

Development of the European KIDSCREEN Instruments
Tabl
e 1:
Gen
erat
ion
of it
ems a
nd it
em r
educ
tion
step
s of t
he K
IDSC
RE
EN
que
stio
nnai
re
27
Sta
ges
Nu
mb
er o
f It
em
s a
nd
dim
en
sio
ns
Exa
mp
les
of
Sp
an
ish
su
rv
ivin
g i
tem
s E
xa
mp
les
of
dele
ted
ite
ms
Lit
erat
ure
rev
iew
+
Del
ph
i st
ud
y
≅ 3
0-4
9 i
tem
s an
d 8
dim
ensi
on
s (P
sych
olo
gic
al W
ell-
bei
ng,
Sel
f-
este
em
, B
od
y-i
mag
e, C
ogn
itiv
e F
un
ctio
nin
g,
Mob
ilit
y,
En
erg
y/v
ital
ity,
So
cial
Rel
atio
ns,
F
amil
y)
Fo
cus
gro
up
s 8
63 i
tem
s (2
.505
in
to
tal)
in
8 d
imen
sio
ns
(Psy
cho
logic
al W
ell-
bei
ng,
Sel
f-es
teem
, C
ogn
itiv
e F
un
ctio
nin
g,
Mo
bil
ity,
Vit
alit
y,
So
cial
Rel
atio
ns,
F
amil
y F
un
ctio
nin
g,
En
vir
on
men
t)
Item
75
(D
imen
sio
n:
Psy
cho
logic
al w
ell-
bei
ng)
Ten
go
la
sen
saci
ón
de
qu
e h
ago
to
do m
al
I h
ave
th
e fe
elin
g I
do
eve
ryth
ing
ba
dly
Item
red
uct
ion
and
sel
ecti
on
(EU
RO
HIS
)
36
0 i
tem
s fo
r ch
ild
ren
an
d a
dole
scen
ts (
1.0
70 i
n t
ota
l)
Item
rem
ain
ed
Item
60
del
eted
fo
r re
dun
dan
cy:
A v
eces
est
oy v
ago
/a p
orq
ue
no
du
erm
o
So
met
imes
I a
m l
azy
bec
au
se I
don
't s
leep
Item
red
uct
ion
and
sel
ecti
on
(Car
d s
ort
)
18
5 i
tem
s in
7 d
imen
sio
ns
(24
cat
ego
ries
): P
sych
olo
gic
al W
ell-
bei
ng (
emo
tio
ns,
wo
rrie
d, o
pti
mis
m),
Sel
f-p
erce
pti
on
(se
lf-e
stee
m,
ach
ievem
ent,
ap
pea
ran
ce),
So
cial
Rel
atio
ns
(par
ents
, fr
ien
ds,
gir
lfri
end
¬b
oyfr
ien
d),
So
cial
Fu
nct
ion
ing (
auto
no
my,
op
po
rtu
nit
y,
qu
alit
y),
Co
gn
itiv
e/sc
hoo
l F
un
ctio
n (
con
cen
trat
ion
, p
erfo
rman
ce,
teac
her
s),
Ph
ysi
cal
(mo
bil
ity,
energ
y,
rela
xat
ion
, w
elln
ess,
sle
ep,
app
etit
e),
En
vir
on
men
t (h
om
e, n
eigh
bou
rho
od
, fi
nan
ces)
Item
rem
ain
ed
Tra
nsl
atio
n
Bac
ktr
ansl
atio
n
Har
mo
nis
atio
n
18
5 i
tem
s E
ngli
sh:
Do
yo
u f
eel
that
yo
u d
o e
ver
yth
ing b
adly
?
Fo
rwar
d 1
: ¿C
rees
qu
e lo
hac
es t
od
o m
al?
Fo
rwar
d 2
: ¿P
ien
sas
qu
e lo
hac
es t
odo
mal
?
Rec
on
cile
d:
¿T
ien
es l
a se
nsa
ció
n d
e h
acer
lo t
odo
mal
?
Bac
kw
ard
: D
o y
ou
ha
ve t
he
feel
ing
tha
t yo
u d
o e
very
thin
g
wro
ng?
Har
mo
nis
atio
n:
Ch
ange
of
the
Ver
bal
Ten
se
Item
24
71
del
eted
in t
he
har
mo
nis
atio
n:
too
lar
ge
and
co
mp
lica
ted
:
Do
yo
u f
ind
a w
ay t
o g
o o
n e
ven
wh
en
thin
gs
do
no
t w
ork
ou
t th
e w
ay y
ou
wan
t
them
to
?
Pre
-tes
t
(co
gn
itiv
e
inte
rvie
w)
17
7 i
tem
s T
her
e w
ere
no
pro
ble
ms
wit
h t
he
item
It
em 1
48
3 d
elet
ed i
n P
re-T
est:
dee
med
too
co
mp
lex f
or
chil
dre
n:
¿T
e h
as s
enti
do d
eses
per
ado
/a e
imp
ote
nte
?
Ha
ve y
ou
fel
t h
op
eles
s a
nd
po
wer
less
?
Pil
ot
Ver
sio
n
KID
SC
RE
EN
15
9 i
tem
s fo
r ch
ild
ren
ver
sio
n a
nd
16
7 i
tem
s fo
r ad
ole
scen
t ver
sio
n
in 8
dim
ensi
on
s
Fin
al E
ngli
sh:
Ha
ve y
ou
fel
t th
at
you
do
eve
ryth
ing
ba
dly
?
Fin
al I
tem
:¿H
as t
enid
o l
a se
nsa
ció
n d
e h
acer
lo t
odo
mal
?
Pil
ot
Stu
dy
KID
SC
RE
EN
52
ite
ms
for
chil
dre
n a
nd
ado
lesc
ent
ver
sio
n i
n 1
0 d
imen
sio
ns
(Ph
ysi
cal
Wel
l -b
ein
g, P
sych
olo
gic
al W
ell-
bei
ng,
Mo
od
s &
Em
oti
on
s, S
elf -
per
cep
tion
, A
uto
no
my,
Par
ent
Rel
atio
ns
& H
om
e
Lif
e, P
eers
an
d S
oci
al S
upp
ort
, S
cho
ol
En
vir
on
men
t, B
ull
yin
g,
Fin
anci
al R
esou
rces
)
Fin
al D
imen
sio
n:
Moo
ds
& E
mo
tio
ns

Chapter 2
– reflect the discussion that took place in focus groups; and – make use of wording suggested by focus group participants.
A decision to have a five point response scale for frequency and intensity was reached.A decision was also made on answer categories referring to frequency of occurrence andintensity of statement. In the Delphi study, experts were asked about the preferred timeframe. 63.1 % favoured the time frame “last week”, while only 26.3 % preferred the “onemonth” time frame. In addition, results of the focus group study of the KIDSCREENproject supported the one week time frame. Young children especially preferred the “lastweek” as a time frame and stated that it would be difficult for them to remember a longertime period precisely. In adolescents, votes for time frames were not so clear cut, but the“last week” as well as the “in general” time frame were mainly preferred. In the litera-ture the “one week” time frame is found to be the most appropriate for children as well(Eiser & Morse, 2001; Fallowfield, 1994; French & Christie, 1996). Further, it was dis-cussed that a time frame of one week allows examining changes and variations over timebetter than a longer time frame. Based on the Delphi study and on the focus groupsresults the time frame used was “one week” and in some cases “in general.” Consensuswas achieved on an English pilot draft version.
2.5 Translation ProcedureEach participating centre translated the items into the language of the target population,using a standardised translation methodology according to international cross-culturaltranslation guidelines to ensure cross-cultural harmonisation (WHOQol Group, 1993;IQOLA, 1991). The first step employed a forward-backward-forward translation tech-nique. Within each country, the original English pilot draft was translated twice into therespective language by two translators working independently of each other (nationalforward translations). All items of the two independent versions were then compared inorder to generate for each item a single corrected reconciled version (national reconciledforward translations). The items of these national reconciled forward translations werethen back-translated (national backward translation) in order to be subsequently com-pared with the items of the original English pilot draft. This comparison was designed toprovide the final versions for the national questionnaires (national final forward transla-tion). Thereafter, the degree of conceptual equivalence amongst the respective nationalfinal forward translations was checked on an international basis to reach cross-culturalharmonisation. A telephone conference was held to resolve inadequate concepts of trans-lation as well as discrepancies between alternative versions. A pre-test followed by cog-nitive interviews took place in the respective countries to ensure the feasibility of thepilot questionnaire. It was shown that children younger than eight years old could read,understand, and answer all the items without problems. After that, agreement on finalitem formulation was made in a meeting in which all countries participated.
28

Development of the European KIDSCREEN Instruments
2.6 Pilot Study: Final Item Reduction
2.6.1 Study Design
The aim of the international pilot study analysis was the reduction of the item poolreceived from the previous project work. The pilot questionnaire contained the prelimi-nary KIDSCREEN version with 159 items for the children and 167 items for the adoles-cents (8 additional items). Furthermore, a general health item was applied. Within anelaborated card-sorting process, these items had been previously clustered into sevendimensions which constituted the theoretical KIDSCREEN Quality of Life model (seeTable 2).The KIDSCREEN pilot questionnaire was applied together with items covering socio-demographic information and health, selected on the base of international studies, recom-mendations and existing questionnaires. Adolescents also completed the Youth Qualityof Life Instrument (YQOL, Patrick et al., 2002) and health care system utilisation ques-tions. It was agreed to administer the sections of the questionnaire in the same sequencein all countries.The pilot study was carried out in a convenience sample of schools (with the exceptionof NL where the respondents were contacted directly by post). Children and adolescentsbetween 8 and 18 years of age and their parents from different regions (urban vs. rural)and different socio-economic environments were included. In every country the studywas conducted with the consent of the responsible data protection ethical committee.The centres, apart from NL, contacted schools in their country and asked the head teach-ers to cooperate in the pilot study. The procedure during the pilot study in school classeswas similar for children and adolescents. Both groups had to fill in the questionnaireindependently. In school classes with 8-10 year old pupils, two interviewers conductedthe study and answered questions of the children, while in classes of 11-18 year old stu-dents only one interviewer was required. All centres arranged two school hours for eachclass to answer the KIDSCREEN pilot questionnaire. In NL a representative sample wasdrawn from the database of the Regional Health Authorities in Leiden (GGD). Question-naires were sent to a child and his/her parents asking them to fill in the questionnaireindependently from each other.
29
KIDSCREEN domains Content of items
Physical Well-being − mobility, energy and relaxation, health and complaints
Self-Perception − body-image, self-assurance, and self-esteem
Psychological Well-being − positive and negative emotions, worries and stress, life-satisfaction
and optimism
Social Functioning − autonomy, opportunity to finance and to participate in activities
Social Relations − home life and parents, friends, group participation and social support
Cognitive & School Functioning − concentration and learning, achievement and teachers
Personal Environment − physical and home conditions
Table 2:KIDSCREEN Quality of Life model for pilot study
Chapter 2
Younger school pupils took, on average, more than one school hour to complete the ques-tionnaire, and older pupils took about one school hour. The distribution of the parentalquestionnaire differed somewhat by country, but in most countries the children wereasked to give their parent(s) the parental questionnaire together with the stampedaddressed envelope. The parents completed the questionnaire at home and returned itcost-free to the respective centre. At each participating centre the child-parent set ofquestionnaires were matched by special codes.
2.6.2 Sample
The multinational KIDSCREEN pilot study sample used for the item reduction analysisincluded the data of 3977 children and adolescents (see Table 3). Between 48.1% and89.3% of the contacted families (informed by an information sheet together with a writ-ten consent form) agreed to participate in the study. Most of the children and adolescentsof these families were assessed and between 23.6% and 99.4% of their parents sent backthe questionnaire. There were 1460 (36.6%) children between 8 and 11 years and 2470(61.9%) adolescents aged between 12 and 19 years (the age of 47 respondents wasunknown). The average age of all children and adolescents was 12.7 years (SD=2.6years). 1942 (48.8%) of the children and adolescents were male, 2005 (50.3%) werefemale (the gender of 30 respondents was unknown). Distributions by age and gender arefairly good and comparable across countries. The largest sub-sample was the Germansample providing 1326 of the children and adolescents, 491 were from Switzerland, 491from Spain, 450 from France, 445 from the United Kingdom, 412 from Austria, and 362from the Netherlands. For the purpose of analysis the German sample was randomlyreduced, because of its overweight. Despite the similar procedures of data collection in countries, the cooperation rates forfamilies were quite different and ranged between 48.1% (Germany) and 89.3% (Switzer-land). The overall response rate was 56.7%. The response rates for children and adoles-cents ranged between 99.8% and 100%. Related to the responding children and adoles-cents, the response rates of parents were even more different and range between 23.6%(United Kingdom) and 99.4% (Netherlands).
2.6.3 Data Analysis
For the item-reduction analyses, some cases were excluded because, for example, theirage was not within the range of 8 to 18 years or was unknown, or because they hadgreater than 25% missing values in the KIDSCREEN measure. Furthermore, the over-representative German sub-sample was reduced randomly to 2/5 of its size. The finalsample thus consisted of 3019 children and adolescents aged between 8 and 18 years.10% of the children and adolescents were randomly selected for a cross-validation sam-ple.The statistical analyses using the pilot study data for the item reduction was divided into4 major steps, as illustrated in Figure 4: 1) Item reduction with methods descending fromItem-Response Theory (IRT); 2) Item reduction with methods rooted in the Classical TestTheory (CTT); 3) Comparison of the results of both methods including theoretical con-siderations and item reduction of the combined version using methods of Item ResponseTheory; 4) Improving the scales’ predictive validity examining the item functioning
30

Development of the European KIDSCREEN Instruments
31
Pil
ot
Stu
dy s
am
ple
No.
of
AT
CH
DE
ES
FR
NL
UK
Tota
l
Conta
cted
fam
ilie
s542
550
2758
564
751
625
n.i
.*6232
Fam
ilie
s ag
reed
to p
arti
cipat
e
(Coop.
Rat
e)1
412
(76.0
%)
492
(89.4
%)
1326
(48.1
%)
492
(87.2
%)
451
(60.1
%)
362
(57.9
%)
n.i
.*3535
(56.7
%)
Res
ponden
t ch
ildre
n o
r
adole
scen
ts
(Res
p.
Rat
e)2
412
(100%
)
491
(99.8
%)
1326
(100%
)
491
(99.8
%)
451
(100%
)
362
(100%
)
444
(100%
)
3533
(99.9
%)
Res
pondin
g p
aren
ts
(Res
p.
rate
)2
181
(43.9
%)
260
(53.0
%)
865
(65.2
%)
359
(73.1
%)
396
(88.0
%)
360
(99.4
%)
105
(23.6
%)
2526
(63.5
%)
Res
ponden
t ch
ildre
n
(chil
d/t
ota
l ra
te)a
186
(45.1
%)
115
(23.4
%)
475
a
(35.8
%)
200
(40.7
%)
47
(10.4
%)
188
(51.9
%)
249
(56.0
%)
1460
(36.1
%)
Res
ponden
t ad
ole
scen
ts
(adole
scen
t/to
tal
rate
)a
226
(54.9
%)
376
(76.6
)805
a
(60.7
%)
291
(59.3
%)
403
(89.6
%)
174
(48.1
%)
195
(43.8
%)
2470
(62.1
%)
Mea
n a
ge
(SD
)
12.8
(2.8
)
13.3
(2.8
)
12.6
(2.4
)
12.8
(2.8
)
13.2
(1.3
)
12.2
(3.6
)
11.9
(2.4
)
12.7
(2.6
)
Fem
ale
(fem
ale/
tota
l ra
te )
185
b
(44.9
%)
277
c
(56.4
%)
652
d
(49.2
%)
244
(49.7
%)
249
(55.3
%)
179
(49.4
%)
219
e
(49.2
%)
2005
(50.3
%)
* n
.i.:
no i
nfo
rmat
ion
1C
ooper
atio
n r
ate:
num
ber
of
chil
dre
n a
nd p
aren
ts w
ho a
ccep
ted t
o p
arti
cipat
e div
ided
by t
he
num
ber
of
conta
cted
by 1
00.
2R
esponse
rat
e: n
um
ber
of
ques
tionnai
res
fill
ed i
n b
y c
hil
dre
n d
ivid
ed b
y t
hose
who a
ccep
ted t
o p
arti
cipat
e by 1
00.
aag
e of
47 (
3.5
%)
unknow
nb
gen
der
of
3 (
0.7
%)
chil
dre
n a
nd a
dole
scen
ts u
nknow
n
c
gen
der
of
1 (
0.2
%)
chil
dre
n o
r ad
ole
scen
ts u
nknow
n
d
gen
der
of
10 (
0.8
%)
chil
dre
n a
nd a
dole
scen
ts u
nknow
n
e
gen
der
of
2 (
0.5
%)
chil
dre
n a
nd a
dole
scen
ts u
nknow
n
Tabl
e 3:
Nat
iona
l Sam
ples
of t
he K
IDSC
RE
EN
Pilo
t Stu
dy

Chapter 2
across countries, age groups and gender. The analyses were conducted using the pro-grams SPSS 11, LISREL 8.5, Mplus 2.1, Testgraf, Parscale 3 and Winmira 2001.This reduction process led to the construction of a multidimensional research version:The KIDSCREEN-52 questionnaire consisting of 52 items within 10 dimensions, whichwas then validated in national surveys (see Chapter 2.7).
2.7 Survey: Validation of the KIDSCREEN InstrumentsSubsequent to the pilot study, national surveys took place in all participating countries.The aims of the survey study were to: analyse the performance of the research version ofthe KIDSCREEN-52 questionnaire derived from the pilot study questionnaire in a repre-sentative sample of the target population; refine the scale structure, and; assess the retest-reliability as well as the construct validity of the KIDSCREEN instrument.
2.7.1 Model of Operationalisation
The aim of the KIDSCREEN project was not only to develop an instrument to assessHRQoL in children and adolescents and their parents, but also to describe the relation-ship between the KIDSCREEN questionnaire and other relevant determinants. Relevantdeterminants of HRQoL mentioned repeatedly in the literature are, besides age and gen-der, the health status of children and adolescents, the children and adolescent’s mental
32
Item Reduction with two methods
Item reduction using methods of the IRT
Item reduction using methods of the CTT
Comparison of the results
Comparison of the results of both methods
including theoretical considerations
Item reduction of the combined version
using methods of the IRT
Improving the scale structure
Improving the scales predictive validity examining the item functioning across countries, age groups and gender
Research version of the KIDSCREEN-52 questionnaire
(52 items in 10 HRQoL dimensions)
Figure 4:Statistical analyses using the pilot study data for the item reduction
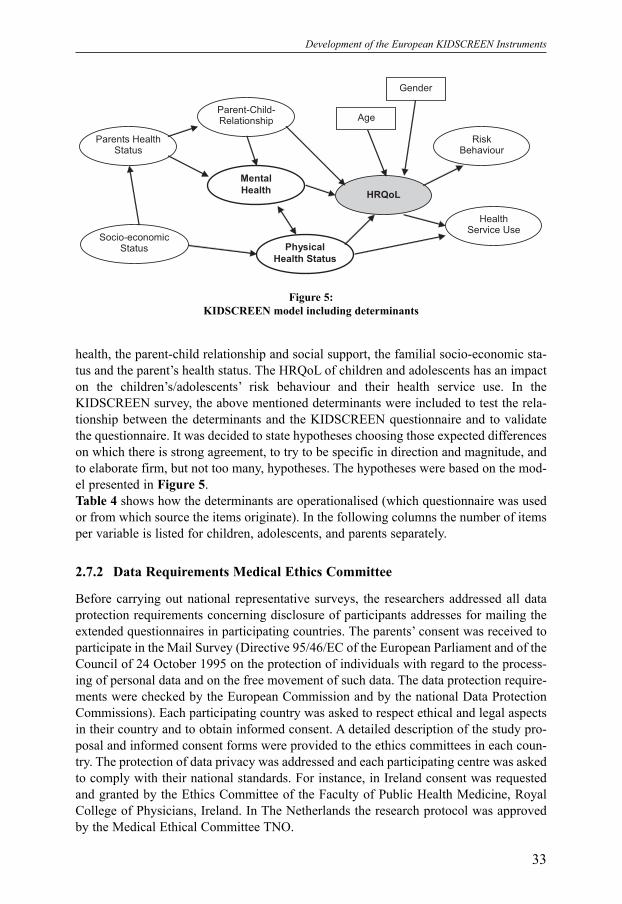
Development of the European KIDSCREEN Instruments
health, the parent-child relationship and social support, the familial socio-economic sta-tus and the parent’s health status. The HRQoL of children and adolescents has an impacton the children’s/adolescents’ risk behaviour and their health service use. In theKIDSCREEN survey, the above mentioned determinants were included to test the rela-tionship between the determinants and the KIDSCREEN questionnaire and to validatethe questionnaire. It was decided to state hypotheses choosing those expected differenceson which there is strong agreement, to try to be specific in direction and magnitude, andto elaborate firm, but not too many, hypotheses. The hypotheses were based on the mod-el presented in Figure 5.Table 4 shows how the determinants are operationalised (which questionnaire was usedor from which source the items originate). In the following columns the number of itemsper variable is listed for children, adolescents, and parents separately.
2.7.2 Data Requirements Medical Ethics Committee
Before carrying out national representative surveys, the researchers addressed all dataprotection requirements concerning disclosure of participants addresses for mailing theextended questionnaires in participating countries. The parents’ consent was received toparticipate in the Mail Survey (Directive 95/46/EC of the European Parliament and of theCouncil of 24 October 1995 on the protection of individuals with regard to the process-ing of personal data and on the free movement of such data. The data protection require-ments were checked by the European Commission and by the national Data ProtectionCommissions). Each participating country was asked to respect ethical and legal aspectsin their country and to obtain informed consent. A detailed description of the study pro-posal and informed consent forms were provided to the ethics committees in each coun-try. The protection of data privacy was addressed and each participating centre was askedto comply with their national standards. For instance, in Ireland consent was requestedand granted by the Ethics Committee of the Faculty of Public Health Medicine, RoyalCollege of Physicians, Ireland. In The Netherlands the research protocol was approvedby the Medical Ethical Committee TNO.
33
Mental
Health
Physical
Health Status
Risk Behaviour
Parent-Child-Relationship
Health Service Use
HRQoL
Socio-economic Status
Parents Health Status
Gender
Age
Figure 5:KIDSCREEN model including determinants

Chapter 2
Variable / Instrument or Item Source Children Adolescents ParentsNo. of items No. of items No. of items
SES (socio-demographic and socio-economic 12 12 17status) (ISSP, 2001, Braun et al., 2003; ISCED 1997; HBSC, Currie et al., 1997)
BMI (weight, height) 2 2 2(Kromeyer-Hauschild et al., 2001)
Health status 4 6 20(CSHCN screener; Bethell et al. 2002b)
Psychosomatic complaints 8 8 -(HBSC, Currie et al., 1998)
Mental health - 25+5 25+5(SDQ Strength and Difficulties Questionnaire, Goodman, 1997)
Risk behaviour (Smoking, Alcohol) 1 4 5(CAGE, Ewing, 1984; ESPAD, Hibell, 2000; HBSC, Currie et al., 1998)
Health services utilisation - 2 7(Eurohis, Nosikov et al., 2003)
Relationship parent/child (Social support) 3 3 5(SAS-Social Support Scale, Weissman, 1996; Oslo 3-item Social Support Scale, Dalgard, 1996)
Emotional Well-being 9 8 -(Items from the CHQ, KINDL, SF-36; Ellert et al., 2001)
DISABKIDS chronic generic items 19 19 -(Bullinger et al., 2002)
YQOL - 13 -(Youth Quality of Life Instrument, Patrick et al., 2002)
CHIP - 11 -(Childhood Health and Illness Profile, Starfield, 1993, 1995, 2000)
Generic Questionnaire1 25 + 25 + 25+(country specific)
Parental health - - 12(SF12 Short Form 12 Health Survey, Ware et al., 1996)
CHQ PF 28 - - 28(Child Health Questionnaire Parent Form, Landgraf et al., 1998)
Total 82 141 151
34
Table 4:Operationalisation of determinants and number of items in the KIDSCREEN survey for
children, adolescents and parents
1 Generic Questionnaires: KINDL Questionnaire for Measuring Health-Related Quality of Life in Children and Adolescents(Ravens-Sieberer et al., 2001, 2003) included in AT, DE, CH (only Children), EL, ES; BFW Berner Well being questionnaire(Grob et al., 1991) included in CH (only adolescents); VSP-A Perceived Health of Adolescents (Siméoni et al., 2000) includ-ed in FR; TACQOL Children's Quality of Life (Vogels et al., 1998) included in NL; Cantril's Ladder (Cantril,1965) includedin CZ, HU, PL; Huebner's Students Life Satisfaction Scale (Huebner,1991a, b) included in CZ, HU, PL; PedsQoL PediatricQuality of Life Inventory (Varni et al., 2001) included in IE, UK

Development of the European KIDSCREEN Instruments
2.7.3 Sampling and Administration
In the survey phase of the KIDSCREEN project, national representative surveys wereconducted in order to obtain reference scores of health-related quality of life for each par-ticipating country. The KIDSCREEN study used two methods of sample selection toobtain responses: six countries (AT, CH, DE, ES, FR, NL) centrally organised the sam-pling, monitoring and evaluation through phone contacts, and six countries (CZ, EL, HU,IE, PL, SE) did it through schools or households. UK combined both telephone andschool sampling methods. In both sampling methods, the combination of telephone andmail survey and school sampling, a second administration of the questionnaire to a sub-sample was carried out within two to four weeks of the first survey in order to check test-retest reliability. The sampling and administration is described in detail in Rajmil et al.(submitted).
Telephone Sampling and Mail SurveyModus Research Institute, a private institute located in Bamberg, Germany, carried outthe sampling by telephone using a Computer Assisted Telephone Interview (CATI) inorder to avoid distortions of the survey and to control the realisation of the quota sample.This method included a supported random-digital-dialling management system (RDD,RLD). The sampling frame included households having a fixed phone. Before the sam-pling, each participating centre was asked to provide more information to support theModus Research Institute in their work about favourable calling times and spokendialects. In the sampling phase, Modus centrally contacted families via telephone calluntil a sample of 2400 children per country was achieved. A short standardised interviewwas carried out to contact families with children and adolescents between 8 and 18 yearsof age. In families with more than one child the “next birthday method” was used toselect the child to be included in the KIDSCREEN survey. Families were asked whetherthey were willing to answer a more comprehensive and extended questionnaire. If theyconsented to participate, the questionnaire and information material were sent to the fam-ilies by each national participating centre. Only home addresses of consenting familieswere collected. The database, which included the addresses of participants, was sent tothe centres under high security norms. The NL used the service of another independentcompany, DIDOC, which bought 6000 addresses from a panel of families with children,in addition to the addresses of participating families recruited by Modus. In the UK, thelargest part of the sample was collected in schools (see below).In the survey phase, the participating centres sent packages with questionnaires for par-ents and children and a postage-paid return envelope to every family, as well as a letterwith information about the KIDSCREEN survey and the consent to participate, whichwas signed and returned together with the questionnaires. In addition, the telephone num-ber of a hotline was provided where parents and children/adolescents could seek moredetailed information about the survey. Two reminders were sent by centres via post-mailin order to increase the response rate.
School Sampling and School or Post Survey In the second approach, the survey was conducted mainly in schools (except in CZ), andquestionnaires were also administrated in schools (except in CZ and PL). In general,schools were randomly selected in each geographical or administrative region. Also, in
35
Chapter 2
EL students were selected at random. In most of the countries, the consent to participatewas obtained before survey administration. Children whose parents agreed to participatefilled in the questionnaires in the schools, and brought the completed parents’ question-naires some days afterwards. In CZ, sites from communities were randomly selected from all regions of the country.The second step combined a random selection of households in the given communitiesusing a local telephone register, with a “random walk” method. In the selected sitestrained research assistants (interviewers) contacted families with children of the request-ed age, giving the standard information, and leaving the questionnaires in the selectedfamilies. They returned back to collect the filled questionnaires after 2–5 days.In EL, questionnaires were accompanied by the parents’ information letter, an informed-consent form, and the information letter for the students. During a 2nd visit in schoolsafter 3-7 days, the questionnaires were collected from the students who had acquired theinformed consent form signed by their parents, while a non-response questionnaire wasadministered to those who declined participation. In PL, meetings were arranged in order to inform parents about the study, and ask forconsent to participate as well as their mail addresses to send them the questionnaires.During these meetings, a short questionnaire was also administrated to parents to collectsocio-demographic variables.
2.7.4 Cooperation and Response
The main indicators used to evaluate the sampling and administration procedures werethe cooperation rate and the response rate. Cooperation was defined as the willingness ofchildren and parents to participate in the study. The cooperation rate was computed as thenumber of children and parents who agreed to participate divided by the number of eli-gible children contacted, multiplied by 100; the eligible contacted children were definedas all children aged between 8 and 18 (and their parents) who were asked to participate.The response rate was computed as the number of questionnaires filled in by children andadolescents divided by the selected cases or addresses, multiplied by 100. Since selectedcases could be reduced by wrong addresses when administration was done by mail, incountries that carried out the questionnaire administration by this way, valid addresseswere used as the denominator of the response rate.Cooperation was higher in countries where sampling was made by schools than thosemade by CATI (Table 5). The cooperation rate was 69% or higher in the former, and itvaried between 42.8 % (UK) and 76.5 % (NL) in the latter. The response rate was veryhigh when administration was conducted in schools, with small variations depending onsome particularities of administration. In the case of mailed surveys, the response rate differed between countries: the lowest rates were found in UK (43.8 %) and in FR (44.9 %), whereas the highest rates were found in the NL (97.4%) and in Germany (73.5 %).
2.7.5 Representativeness of the national Results
Despite the sophisticated sampling method, it was to be anticipated that samples couldbe somewhat biased regarding age and gender of the children and adolescents. In orderto assess the representativeness of each national survey, KIDSCREEN respondents were
36

Development of the European KIDSCREEN Instruments
Sam
plin
gD
ata
colle
ctio
nM
etho
dE
CC
aC
oop.
aC
oop.
Mod
eaVA
aR
ef.a
Q b
ack
Res
p.n
n%
Nn
n%
ATA
ustri
aC
ATI
4433
2425
54.7
mai
l23
9515
4464
.5
CH
Sw
itzer
land
CAT
I43
4924
2355
.7m
ail
2423
1746
72.1
CZ
Cze
ch R
epub
licho
useh
olds
2283
1632
71.5
hous
ehol
ds16
3216
3210
0
DE
Ger
man
yC
ATI
4642
2430
52.3
mai
l24
1318
7377
.6
ELG
reec
esc
hool
s16
5611
9272
.0sc
hool
s11
9211
9210
0
ES S
pain
CAT
I40
0920
5251
.2m
ail
1956
205
924
47.2
FR F
ranc
eC
ATI
4222
2459
58.2
mai
l23
825
1079
45.3
HU
Hun
gary
scho
ols
3622
3560
97.2
scho
ols
3560
3297
92.6
IE Ir
elan
dsc
hool
s80
3847
.25
scho
ols
1265
1265
47.3
NL
The
Net
herla
nds
CAT
I 86
642
649
.2m
ail
1961
1919
97.8
DID
OC
2549
1949
76.5
PLPo
land
scho
ols
2915
2411
82.7
mai
l23
7817
1572
.1
SE. S
wed
ensc
hool
s36
5033
5491
.2sc
hool
s33
5433
5410
0
UK
Uni
ted
Kin
gdom
CAT
I 25
1710
7942
.8m
ail
1062
468
44.1
scho
ols
2210
1526
69.0
scho
ols
1526
1526
100
37
Tabl
e 5:
Sam
plin
g an
d da
ta c
olle
ctio
n: p
roce
dure
s and
res
ults
aEC
C: e
legi
ble
child
ren
cont
acte
d; C
oop.
: coo
pera
tion;
Mod
e: M
ode
of a
dmin
istra
tion;
VA
: val
id a
ddre
sses
; Ref
.: re
fusa
ls c
onfir
med
dur
ing
the
ques
tionn
aire
adm
inis
tratio
n;
Q b
ack:
que
stio
nnai
res
sent
bac
k; C
ATI:
com
pute
r ass
iste
d te
leph
one
inte
rvie
w; D
IDO
C: l
arge
dat
a se
rvic
es in
stitu
te in
the
Net
herla
nds.
Chapter 2
compared not only with the reference population but also with eligible contacted peoplewho did not agree to participate (refusers).The sex and age distribution of children and adolescents included were compared withdata provided from Eurostat (European Statistics) on the distribution of children aged 8-18 years old by sex and age. Eurostat data were used as the population reference. Onesurvey binomial test was used to test whether the proportion of successes on a two-levelcategorical dependent variable significantly differed from a hypothesized population val-ue. For example, in Spain, where 48.6% (Eurostat data) of the children and adolescentsbetween 8 and 18 years old are girls, it was tested whether the proportion of females inthe KIDSCREEN survey (49.1%; n=876) differed significantly from the population val-ue, but the difference was small. The highest educational level of the parents who responded to the KIDSCREEN surveywas compared with the same variable for women and men with at least one child from 8-18 years old in the household, from data provided for Eurostat. The highest educationalqualification was collected and codified according to ISCED categories (InternationalStandard Classification of Education, ISCED 1997) as follows: Low: at most lower sec-ondary (ISCED 0-2); Medium: upper secondary (ISCED 3-4); and High: tertiary (ISCED5-6). A chi-square goodness of fit was used in order to test whether the observed propor-tions from the survey differed significantly from the expected proportions in the refer-ence population. Information from people who did not agree to participate (refusers) was collected in mostof the countries. In AT, CH, DE, ES, FR, and NL, the Modus Institute responsible for thetelephone sampling also carried out telephone interviews with refusers. In CZ and PL,data were collected in schools and households, respectively. The variables collected in allthe countries were the child and responder’s general perceived health, the responder’smarital status and the highest educational level achieved (except for PL, where it wasreplaced with the mother’s highest educational level) and their house’s location accord-ing to the respondent’s description. A chi-square test was carried out to test the distribu-tions’ differences. The distribution of sex and age groups compared with the Eurostat reference populationin each country is shown in Table 6. Most of the national surveys achieved proportionsquite similar to the reference population, even though some groups had 3 or 4 points ofdifference regarding their proportion in the reference. The proportion of some groups inEL and HU exceeded their distribution in the reference population by more than 10points. Regarding the distributions by age groups (data not shown), most of the countrieshad a proportion of children a little higher than the population values from Eurostat,while the proportion of adolescents was lower in most of countries of the KIDSCREENstudy. UK had 13.7 points of difference regarding the reference population, HU showed7.3 point of difference, PL 4.1, and the rest of countries showed differences lower than 3points. Girls participated more frequently than boys in almost all countries. The mostunbalanced surveys were those from HU and EL, with 9 to 11 points of difference regard-ing the reference population (data not shown).The proportion of women and men with low educational level was lower among theKIDSCREEN’s mothers and fathers than in the reference population, whereas in almostall countries, the proportion with high educational level was higher among the partici-pants in the KIDSCREEN study (Table 7).
38

Development of the European KIDSCREEN Instruments
39
F
em
ale
ch
ild
ren
(8
-11
)
Male
ch
ild
ren
(8
-11
)
Fem
ale
ad
ole
scen
ts (
12
-18
)
Male
ad
ole
scen
ts (
12
-18
)
Tota
l
K
IDS
CR
EE
N
Eu
rost
at
dif
KID
SC
RE
EN
E
uro
stat
d
if
K
IDS
CR
EE
N
Eu
rost
at
dif
KID
SC
RE
EN
E
uro
stat
d
if
K
IDS
CR
EE
N
Eu
rost
at
AT
2
77 (
18
.8)
18
82
29
(1
8.0
) 0
.8
2
41 (
16
.3)
19
46
34
(1
8.6
) -2
.3
5
16 (
35
.0)
32
38
29
(3
1.0
) 4
.0
4
41 (
29
.9)
33
78
96
(3
2.3
) -2
.4
1
475
1
044
58
8
CH
b
30
4 (
17
.9)
12
18
56
(1
8.0
) -0
.2
2
76 (
16
.2)
12
76
15
(1
8.9
) -2
.7
6
08 (
35
.7)
20
64
51
(3
0.6
) 5
.2
5
13 (
30
.2)
21
94
05
(3
2.5
) -2
.3
1
701
6
753
27
CZ
2
81 (
17
.7)
24
24
08
(1
7.0
) 0
.7
2
75 (
17
.3)
25
69
75
(1
8.0
) -0
.7
5
07 (
31
.8)
44
98
82
(3
1.5
) 0
.3
5
29 (
33
.2)
47
72
93
(3
3.5
) -0
.2
1
592
1
426
55
8
DE
3
05 (
17
.7)
16
96
73
8 (
16
.9)
0.8
30
5 (
17
.7)
17
86
69
8 (
17
.8)
-0.1
57
9 (
33
.6)
31
93
94
0 (
31
.8)
1.8
53
4 (
31
.0)
33
70
71
0 (
33
.5)
-2.6
17
23
1
004
80
86
EL
-
- -
-
- -
7
01 (
59
.7)
43
90
95
(4
8.6
) 1
1.1
47
3 (
40
.3)
46
40
10
(5
1.4
) -1
1.1
11
74
9
031
05
ES
1
48 (
16
.9)
77
66
14
(1
6.4
) 0
.4
1
73 (
19
.7)
82
68
28
(1
7.5
) 2
.2
2
82 (
32
.2)
15
17
99
9 (
32
.1)
0.0
27
3 (
31
.2)
16
01
02
6 (
33
.9)
-2.7
87
6
47
22
46
7
FR
1
98 (
18
.9)
14
38
88
5 (
17
.3)
1.6
19
6 (
18
.7)
15
10
69
2 (
18
.1)
0.6
34
6 (
33
.0)
26
34
93
7 (
31
.6)
1.4
30
9 (
29
.5)
27
50
57
8 (
33
.0)
-3.5
10
49
8
335
09
2
HU
7
60 (
23
.5)
23
68
65
(1
7.2
) 6
.2
6
18 (
19
.1)
24
75
73
(1
8.0
) 1
.1
1
130
(3
4.9
) 4
364
52
(3
1.8
) 3
.2
7
29 (
22
.5)
45
35
18
(3
3.0
) -1
0.5
32
37
1
374
40
8
NL
3
34 (
17
.7)
39
49
36
(1
8.4
) -0
.6
3
44 (
18
.2)
41
39
29
(1
9.2
) -1
.0
6
30 (
33
.4)
65
45
50
(3
0.4
) 3
.0
5
77 (
30
.6)
68
70
05
(3
1.9
) -1
.3
1
885
2
150
42
0
PL
3
01 (
17
.6)
10
04
77
6 (
15
.6)
1.9
26
4 (
15
.4)
10
56
65
6 (
16
.5)
-1.1
63
8 (
37
.2)
21
31
71
5 (
33
.2)
4.0
51
2 (
29
.9)
22
28
71
2 (
34
.7)
-4.9
17
15
6
421
85
9
SE
-
- -
-
- -
1
609
(4
9.0
) 3
739
29
(4
8.6
) 0
.4
1
674
(5
1.0
) 3
956
28
(5
1.4
) -0
.4
3
283
7
695
57
UK
4
55 (
24
.2)
15
42
33
2 (
18
.3)
6.0
50
6 (
27
.0)
16
21
85
6 (
19
.2)
7.7
45
5 (
24
.2)
25
61
63
1 (
30
.4)
-6.1
46
1 (
24
.6)
27
08
14
9 (
32
.1)
-7.5
18
77
8
433
96
8
Tabl
e 6:
Sam
plin
g an
d da
ta c
olle
ctio
n: p
roce
dure
s and
res
ults
a
aIE
was
exc
lude
d fr
om th
e re
pres
enta
tiven
ess
anal
ysis
bec
ause
this
was
not
the
aim
of t
he s
ampl
ing.
bC
ensu
s da
ta fo
r Sw
itzer
land
in th
e ye
ar 2
000,
in 1
9 ou
t of 2
6 ca
nton
s w
here
sam
plin
g w
as c
arrie
d ou
t.

Chapter 2
Tabl
e 7:
Edu
catio
nal l
evel
of m
othe
rs a
nd fa
ther
s ans
wer
ing
KID
SCR
EE
N c
ompa
red
with
ref
eren
ce d
ata
(Eur
osta
t) fo
rw
omen
and
men
40
M
oth
ers
Fa
thers
K
IDS
CR
EE
N
Eu
rost
at
Dif
fere
nce
K
IDS
CR
EE
N
Eu
rost
at
Dif
fere
nce
n
%
n
%
p
n
%
n
%
p
AT
Au
stria
Lo
w
167
1
1.2
1
44
.9
24.3
1
05
.37
8
112
7
.8
72.3
1
3.8
3
7.4
28
Med
ium
1
110
7
4.5
3
51
.6
59.1
6
0.3
36
1
081
7
5.5
3
43
.4
65.7
2
1.0
30
Hig
h
212
1
4.2
9
8.7
1
6.6
4
.946
2
39
1
6.7
1
07
.2
20.5
1
0.1
26
To
tal
1489
595
.2
1
70
.66
0*
1
432
523
.0
6
8.5
84
*
CH
Sw
itzer
lan
d
Lo
w
217
1
3.6
7
0
15.7
4
.459
1
22
8
.2
42
1
1.6
1
5.0
71
Med
ium
1
110
6
9.6
3
33
7
4.7
5
.570
7
26
4
8.7
2
45
6
7.3
7
7.0
31
Hig
h
268
1
6.8
4
3
9.6
8
6.1
90
6
44
4
3.2
7
7
21.2
3
39
.49
8
To
tal
1595
446
96.2
19
*
1492
364
431
.60
1*
CZ
Czech
Rep
ub
lic
Lo
w
58
3
.7
99.6
1
1.0
%
1853
.702
4
0
2.7
5
0.6
6
.1
29.0
58
Med
ium
1
170
7
5.1
7
17
.9
79.1
%
1087
91
.98
3
1093
7
3.1
6
56
.5
79.4
7
.642
Hig
h
330
2
1.2
9
0.4
1
0.0
%
6953
2.0
57
3
63
2
4.3
1
19
.4
14.4
9
9.8
25
To
tal
1558
908
.0
1
801
77
.74
1*
1
496
826
.5
1
36
.52
4*
DE
Ger
ma
ny
Lo
w
396
2
3.3
1
208
.5
20.9
4
.749
4
75
2
9.4
7
09
.5
13.6
2
97
.45
5
Med
ium
1
018
5
9.9
3
526
.5
60.9
0
.303
7
29
4
5.2
3
039
.5
58.3
4
7.4
88
Hig
h
286
1
6.8
1
053
.2
18.2
1
.761
4
10
2
5.4
1
468
.2
28.1
4
.301
To
tal
1700
5788
.3
6
.813
a
1614
5217
.2
3
49
.24
4*
EL
Gree
ce
Lo
w
369
3
6.9
4
79
5
9.6
8
6.8
26
3
77
3
8.7
2
33
5
3.3
3
8.9
19
Med
ium
3
65
3
6.5
2
53
3
1.5
7
.829
2
87
2
9.5
1
27
2
9.0
0
.073
Hig
h
267
2
6.7
7
2
9.0
3
47
.39
9
310
3
1.8
7
7
17.6
1
12
.02
2
To
tal
1001
803
.0
4
42
.08
7*
9
74
437
.0
1
51
.01
4*

Development of the European KIDSCREEN Instruments
41
ES
Sp
ain
Lo
w
478
5
6.6
2
042
.4
63.9
6
.918
4
34
5
5.4
1
811
.2
60.7
3
.631
Med
ium
1
55
1
8.4
5
79
.5
18.1
0
.027
1
41
1
8.0
5
27
.4
17.7
0
.046
Hig
h
211
2
5.0
5
75
.8
18.0
2
2.9
25
2
09
2
6.7
6
47
.4
21.7
8
.957
To
tal
844
3197
.8
2
9.8
70
*
784
2986
.0
1
2.6
35
b
FR
Fra
nce
Lo
w
326
3
2.0
1
838
.0
37.6
8
.633
3
70
3
8.2
1
452
.9
34.0
4
.923
Med
ium
2
19
2
1.5
2
011
.1
41.2
9
5.9
37
1
86
1
9.2
1
940
.8
45.5
1
46
.98
4
Hig
h
474
4
6.5
1
034
.2
21.2
3
08
.89
6
413
4
2.6
8
76
.2
20.5
2
30
.61
5
To
tal
1019
4883
.3
4
13
.46
6*
9
69
4269
.9
3
82
.52
2*
HU
Hu
nga
ry
Lo
w
564
2
9.7
2
34
.7
27.3
6
009
5.8
61
7
63
4
4.0
1
36
.4
18.3
6
29
.20
2
Med
ium
8
37
4
4.0
4
97
.0
57.9
6
199
8.5
31
5
48
3
1.6
5
09
.4
68.2
3
40
.35
2
Hig
h
500
2
6.3
1
26
.9
14.8
8
799
1.4
45
4
23
2
4.4
1
01
.2
13.6
1
50
.42
4
To
tal
1901
858
.6
2
100
85
.83
6*
1
734
747
.0
1
119
.977*
NL
Neth
erla
nd
s
Lo
w
358
2
0.0
3
67
.9
35.5
1
20
.01
9
439
2
5.1
2
76
.8
29.8
%
3608
4.6
84
Med
ium
1
035
5
7.9
4
65
.3
44.9
6
7.9
60
7
60
4
3.5
3
86
.6
41.7
%
7778
7.6
26
Hig
h
394
2
2.0
2
04
.1
19.7
5
.114
5
48
3
1.4
2
63
.9
28.5
%
5931
2.5
14
To
tal
1787
1037
.2
1
93
.09
3*
1
747
927
.3
1
731
84
.82
4*
PL
Pola
nd
Lo
w
538
3
2.2
3
08
5
0.1
1
07
.50
0
734
5
0.4
2
86
6
1.7
3
0.0
68
Med
ium
8
21
4
9.1
2
34
3
8.1
5
2.8
77
5
21
3
5.8
1
20
2
5.9
5
4.9
08
Hig
h
314
1
8.8
7
3
11.9
6
6.3
28
2
42
1
6.6
5
8
12.5
1
9.7
80
To
tal
1673
615
.0
2
26
.70
5*
1
456
464
.0
1
04
.75
6*
UK
Un
ited
Kin
gd
om
Lo
w
167
1
3.6
8
47
.6
20.4
2
7.2
10
2
00
1
7.9
4
90
.7
14.6
8
.244
Med
ium
4
71
3
8.4
2
351
.4
56.5
7
0.4
73
3
19
2
8.5
1
911
.1
56.8
1
58
.06
3
Hig
h
587
4
7.9
9
64
.7
23.2
3
23
.84
5
600
5
3.6
9
60
.3
28.6
2
45
.98
2
To
tal
1225
4163
.8
4
21
.52
8*
1
119
3362
.1
4
12
.28
9*
* p<
0.00
1; a
0.03
32; b
0.00
18

Chapter 2
Participants in the KIDSCREEN study were more likely to declare good perceived healthregarding the target child and themselves, to be married, to have higher educational lev-el, and to live in big cities (Table 8), compared to people who refused to participate inthe study.In spite of the different sampling procedures, the data looked promising at the nationallevel. The distribution of children by sex and age was quite similar to the reference pop-ulation, except for EL and HU where some differences within countries were found.When compared to the reference population from Eurostat, the KIDSCREEN’s mothersand fathers had higher levels of educational attainment. Similarly, when compared withrefusers, participants more frequently declared a high educational level, better generalperceived health, to be married and to live in cities. These results coincide with otherEuropean studies. The use of post-stratification weights attempts to remove bias in the sample due to non-response and non-coverage errors. Since gender, age and parents’ educational level areassociated with HRQoL, those variables were used as post-stratification weight in orderto match more precisely the true population distribution. After weighting using severaltechniques (basically survey and re-sampling methods), there were not significant differ-ences in mean scores for KIDSCREEN scales (data not shown). Nevertheless, the use ofthe weight variable taking into account gender and age for the national representativescores might be recommended.
42

Development of the European KIDSCREEN Instruments
Country Refusals KIDSCREEN Total p nstudy
AT Austria Child's health: good, very good or excellent 83.1 98.8 96.0 0.000 1858Responder's health: good, very good or excellent 82.9 95.5 93.3 0.000 1845Responder's marital status: married 64.3 87.7 83.7 0.000 1854Responder's educational level: high 33.8 14.9 18.0 0.000 1813
medium 63.5 74.5 72.8Home in big city or suburbs 18.2 18.9 18.8 0.753 1825CH SwitzerlandChild's health: good, very good or excellent 98.0 99.0 98.8 0.065 2219Responder's health: good, very good or excellent 90.5 95.4 94.3 0.000 2216Responder's marital status: married 85.8 85.2 85.4 0.748 2216Responder's educational level: high 6.0 22.1 18.4 0.000 2111
medium 50.2 66.1 62.5Home in big city or suburbs 12.1 16.5 15.5 0.018 2197CZ Czech RepublicChild's health: good, very good or excellent 89.5 94.9 94.0 0.000 1947Responder's health: good, very good or excellent 88.6 88.6 1602Responder's marital status: married 63.7 84.0 80.5 0.000 1939Responder's educational level: high 19.5 23.1 22.5 0.000 1941
medium 67.7 73.8 72.7Home in big city or suburbs 23.0 21.3 21.6 0.489 1947DE GermanyChild's health: good, very good or excellent 98.1 97.4 97.5 0.442 2112Responder's health: good, very good or excellent 90.1 90.3 90.2 0.911 2106Responder's marital status: married 74.9 84.2 82.6 0.000 2114Responder's educational level: high 29.3 19.1 20.7 2074
medium 65.9 58.7 59.9Home in big city or suburbs 41.6 22.8 26.0 0.000 2103ES SpainChild's health: good, very good or excellent 96.7 98.2 97.8 0.084 1272Responder's health: good, very good or excellent 82.9 91.3 89.0 0.000 1261Responder's marital status: married 89.8 90.6 90.4 0.646 1269Responder's educational level: high 20.1 25.7 24.2 0.114 1245
medium 20.7 20.0 20.2Home in big city or suburbs 49.4 29.0 34.8 0.000 1253FR FranceChild's health: good, very good or excellent 84.8 97.5 94.4 0.000 1388Responder's health: good, very good or excellent 82.2 94.1 91.2 0.000 1388Responder's marital status: married 75.4 85.7 83.2 0.000 1389Responder's educational level: high 22.0 45.4 39.7 0.000 1392
mediumHome in big city or suburbs 43.2 37.5 38.9 0.066 1375NL NetherlandsChild's health: good, very good or excellent 95.0 96.8 96.6 0.128 2171Responder's health: good, very good or excellent 93.8 90.4 90.8 0.074 2167Responder's marital status: married 90.4 89.8 89.9 0.824 2081Responder's educational level: high 1.4 24.3 22.0 0.000 2022
medium 41.0 56.0 54.4Home in big city or suburbs 49.2 46.7 47.0 0.441 2167PL PolandChild's health: good, very good or excellent 91.2 94.3 93.8 0.029 2066Responder's health: good, very good or excellent 80.1 78.7 78.9 0.056 2058Responder's marital status: married 90.3 88.0 88.4 0.221 2062Responder's educational level: high 17.1 18.8 18.5 0.000 2019
medium 25.1 49.1 45.0Home in big city or suburbs 44.1 40.8 41.3 0.246 2056
43
Table 8: Characteristics of participants and people who refused to participate in the KIDSCREEN study


The statistical analyses of the KIDSCREEN survey included three different issues. Thefirst issue was to confirm and test the KIDSCREEN-52. Each scale was tested to deter-mine if the items fulfilled the assumptions of the Rasch model (item fit) and displayedno differential item functioning (DIF) across countries, age-groups and gender. Further-more, an analysis determined how well the structure of the instrument fit the data: con-firmatory factor analysis (CFA) as well as the multitrait analysis (MAP) was conductedto explore if the inter-item correlation could be reasonably explained by the specified 10-dimensional questionnaire structure. For each scale the internal consistency reliability(Cronbach’s alpha) and the test-retest reliability was calculated. Scale mean, standarddeviation, floor and ceiling effect were calculated as well. The second issue of the statis-tical analyses was the reduction of the KIDSCREEN-52 to a shorter instrument using thefirst half of the data set. The parallel application of two different item-reduction strate-gies led to the development of two different short versions which were compared, com-bined, and further reduced to benefit from both methods’ advantages. The first strategy included exploratory factor analysis, nonparametric IRT analyses fol-lowed by Rasch measurement analyses and examination of DIF aimed to develop a shorthealth profile. The second strategy started with Rasch measurement analyses, accompa-nied by nonparametric IRT analyses and the analysis of DIF, aimed to develop a generalindex of HRQoL. The combined instrument was further reduced due to the results of newRasch measurement and DIF analyses per dimension. These analyses resulted in the 5-dimensional KIDSCREEN-27 questionnaire. In a further step, the KIDSCREEN-27 shorthealth profile was reduced using Rasch measurement analyses, accompanied by nonpara-metric IRT analyses and the analysis of DIF, aimed to develop a general index ofHRQoL, the KIDSCREEN-10 HRQoL Index. These two new KIDSCREEN versionswere then confirmed and tested in the same way as the KIDSCREEN-52 using the sec-ond half as well as the entire dataset.The third issue of the statistical analyses included the validation of the threeKIDSCREEN versions. Construct validity was assessed by examining the correlationwith other generic measures of HRQoL and measures of psychosomatic health com-plaints. Furthermore, it was tested whether groups with theoretically expected differentHRQoL displayed different average KIDSCREEN scores in the theoretically expectedmanner. Comparisons included groups with different socioeconomic status, differentphysical and mental health status, different social support and different quality of rela-tionships with parents, etc. The results of these analyses will be summarized in the fol-lowing chapters.
45
Psychometric Analyses and Properties of the KIDSCREENInstruments
3
Chapter 3
3.1 Reliability
3.1.1 Scale Description and Internal Consistency
The internal consistency of the KIDSCREEN dimensions was calculated using Cron-bach’s alpha. Alpha coefficients of 0.7 or higher were considered to be acceptable. Table9 shows the scale descriptives and the internal consistency of the KIDSCREEN-52, theKIDSCREEN-27 and KIDSCREEN-10 index instruments for children and adolescentsand their parents.For the KIDSCREEN-52, mean scores varied around 50 (SD=10) due to T-value stan-dardisation. A ceiling and floor effect was defined as the percentage of individuals withthe best and worst results respectively. No major floor effect was found, except for Finan-cial Resources (floor effect = 1.83%). A ceiling effect was observed in Parent Relation &Home Life and Financial Resources, as around 15% and 25%, respectively, of the chil-dren and adolescents had the highest score. A more severe ceiling effect was observed inthe Social Acceptance (Bullying) dimension (ceiling effect = 49.10%). The percentage ofmissing cases was very low, ranging from 1.37 to 2.85%. The internal consistency relia-bility was good-to-excellent for all the domains, ranging from 0.77 to 0.89.For the KIDSCREEN-27, mean scores varied around 50 (SD = 10) due to T-value stan-dardization. No major floor effect was found, regardless of the dimension. However, ceil-ing effect was observed in the Peers & Social Support, as around 15% of the children andadolescents had the highest score. The percentage of missing cases was very low, rang-ing from 1.72 to 3.83%. The internal consistency reliability was good-to-excellent for allthe domains, ranging from 0.80 to 0.84.No major floor or ceiling effect was found for the KIDSCREEN-10 index. The percent-age of missing cases was low (4.5%). The internal consistency reliability was good-to-excellent (0.82).The KIDSCREEN-52 parent version presented similar results to the KIDSCREEN-52child and adolescent version (data not shown). No major floor effect was found, exceptfor Financial Resources (floor effect = 1.58%). However, ceiling effect was observed forthe Social Acceptance (Bullying) dimension (ceiling effect = 45.39%). The percentage ofmissing cases was moderate, ranging from 1.23 to 3.80%. The internal consistency reli-ability was good-to-excellent for all the domains, ranging from 0.77 to 0.90.
3.1.2 Test-Retest Reliability
The test-retest reliability of the KIDSCREEN questionnaires was assessed in a sub-sam-ple of 559 children and adolescents on two separate occasions approximately two weeksapart (Table 10). Their health status was declared unchanged from both the point of viewof children and adolescents and their parents between the two assessments. IntraclassCorrelation Coefficients (ICC) were computed between scale scores for the two assess-ments, and paired comparisons of KIDSCREEN dimension scores of these two assess-ments were also performed. A coefficient of 0.6 or higher was considered as evidence ofadequate test-retest stability. The ICC between scale scores for the two assessments ranged from 0.56 to 0.77 for theKIDSCREEN-52, from 0.61 to 0.74 for the KIDSCREEN-27 and achieved the value of0.55 for the KIDSCREEN-10 index. The scores of all scales increased between the two
46

Psychometric Analyses and Properties of the KIDSCREEN Instruments
item
sn
Mea
n SD
%
%
%
Cro
nbac
h’s
T-va
lue
Mis
sing
Floo
rC
eilin
gal
pha
KID
SCR
EE
N-5
2 D
imen
sion
sPh
ysic
al W
ell-b
eing
521
266
49.9
49.
882.
470.
065.
240.
80Ps
ycho
logi
cal W
ell-b
eing
6
2148
849
.92
9.87
1.45
0.08
9.64
0.89
Moo
ds &
Em
otio
ns
721
386
49.8
39.
701.
920.
048.
240.
86Se
lf-Pe
rcep
tion
521
484
50.1
710
.18
1.47
0.10
11.5
90.
79A
uton
omy
521
505
50.1
110
.14
1.37
0.18
11.2
90.
84Pa
rent
Rel
atio
n &
Hom
e Li
fe6
2132
850
.13
10.1
62.
180.
1315
.45
0.89
Fina
ncia
l Res
ourc
es3
2118
350
.19
10.2
12.
851.
8324
.46
0.89
Soci
al S
uppo
rt &
Pee
rs6
2128
349
.88
9.95
2.39
0.29
7.45
0.85
Scho
ol E
nviro
nmen
t6
2129
950
.05
10.1
42.
630.
194.
900.
87So
cial
Acc
epta
nce
(Bul
lyin
g)3
2149
650
.13
10.1
61.
410.
3249
.10
0.77
KID
SCR
EE
N-2
7 D
imen
sion
sPh
ysic
al W
ell-b
eing
521
266
49.9
49.
882.
470.
065.
240.
80Ps
ycho
logi
cal W
ell-b
eing
721
374
49.7
79.
561.
970.
015.
630.
84A
uton
omy
& P
aren
t rel
atio
n 7
2096
949
.99
9.94
3.83
0.02
6.36
0.81
Soci
al S
uppo
rt &
Pee
rs4
2143
049
.94
10.0
21.
720.
3714
.87
0.81
Scho
ol E
nviro
nmen
t4
2134
050
.01
10.0
62.
130.
227.
650.
81K
IDSC
RE
EN
-10
inde
xG
ener
al H
RQ
oLin
dex
1020
823
49.8
59.
584.
500
1.97
0.82
47
Tabl
e 9:
Scal
e de
scri
ptio
n an
d in
tern
al c
onsi
sten
cy o
f KID
SCR
EE
N c
hild
and
ado
lesc
ent v
ersi
on
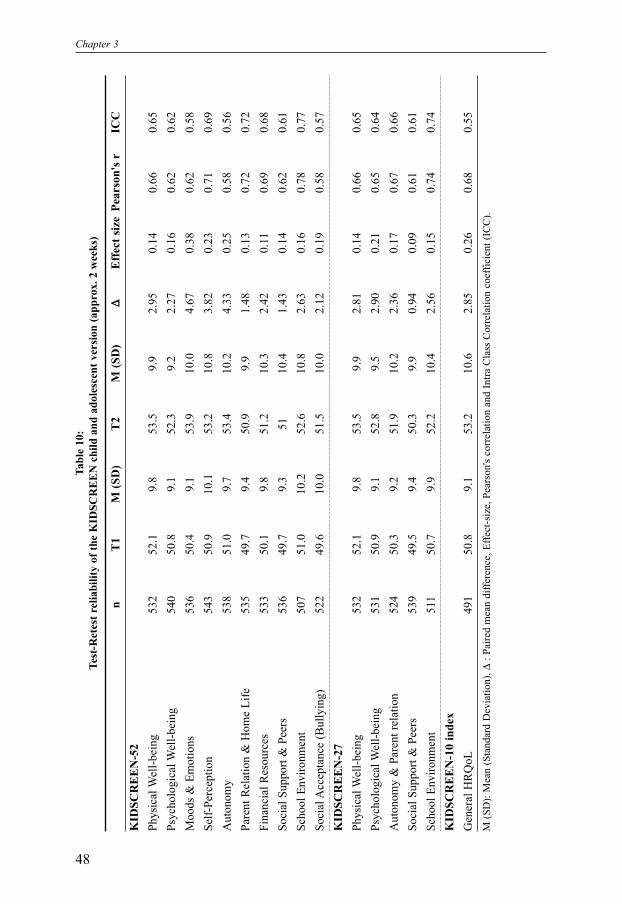
Chapter 3
nT
1M
(SD
)T
2M
(SD
)∆
Effe
ct si
zePe
arso
n's r
ICC
KID
SCR
EE
N-5
2 Ph
ysic
al W
ell-b
eing
532
52.1
9.8
53.5
9.9
2.95
0.14
0.66
0.65
Psyc
holo
gica
l Wel
l-bei
ng54
050
.89.
152
.39.
22.
270.
160.
620.
62M
oods
& E
mot
ions
536
50.4
9.1
53.9
10.0
4.67
0.38
0.62
0.58
Self-
Perc
eptio
n54
350
.910
.153
.210
.83.
820.
230.
710.
69A
uton
omy
538
51.0
9.7
53.4
10.2
4.33
0.25
0.58
0.56
Pare
nt R
elat
ion
& H
ome
Life
535
49.7
9.4
50.9
9.9
1.48
0.13
0.72
0.72
Fina
ncia
l Res
ourc
es53
350
.19.
851
.210
.32.
420.
110.
690.
68So
cial
Sup
port
& P
eers
536
49.7
9.3
5110
.41.
430.
140.
620.
61Sc
hool
Env
ironm
ent
507
51.0
10.2
52.6
10.8
2.63
0.16
0.78
0.77
Soci
al A
ccep
tanc
e (B
ully
ing)
522
49.6
10.0
51.5
10.0
2.12
0.19
0.58
0.57
KID
SCR
EE
N-2
7 Ph
ysic
al W
ell-b
eing
532
52.1
9.8
53.5
9.9
2.81
0.14
0.66
0.65
Psyc
holo
gica
l Wel
l-bei
ng53
150
.99.
152
.89.
52.
900.
210.
650.
64A
uton
omy
& P
aren
t rel
atio
n 52
450
.39.
251
.910
.22.
360.
170.
670.
66So
cial
Sup
port
& P
eers
539
49.5
9.4
50.3
9.9
0.94
0.09
0.61
0.61
Scho
ol E
nviro
nmen
t51
150
.79.
952
.210
.42.
560.
150.
740.
74K
IDSC
RE
EN
-10
inde
xG
ener
al H
RQ
oL49
150
.89.
153
.210
.62.
850.
260.
680.
55
48
Tabl
e 10
:Te
st-R
etes
t rel
iabi
lity
of th
e K
IDSC
RE
EN
chi
ld a
nd a
dole
scen
t ver
sion
(app
rox.
2 w
eeks
)
M (S
D):
Mea
n (S
tand
ard
Dev
iatio
n), ∆
: Pai
red
mea
n di
ffere
nce,
Effe
ct-s
ize,
Pea
rson
's co
rrel
atio
n an
d In
tra C
lass
Cor
rela
tion
coef
ficie
nt (I
CC
).
Psychometric Analyses and Properties of the KIDSCREEN Instruments
49
assessments with the questionnaire, especially for the dimensions Moods & Emotions,Self-Perception, Autonomy (in the KIDSCREEN-52), and Psychological Well-being (inthe KIDSCREEN-27 and KIDSCREEN-10 indices).
3.1.3 Discriminatory Power
The discriminatory power of a scale deals with the ability of a scale to discriminateamong people and spread them out as much as possible along a continuum. To be mosteffective in this regard, the entire range of the scale should be used, with an equal num-ber of people at each level. One index of discriminating ability is Ferguson’s δ (Fergu-son, 1949). The value ranges between 0, when all subjects get the same score, and 1.0,when the subjects are equally divided among all possible scores. A score of 0.70 is report-ed to be acceptable.The results for the KIDSCREEN instruments are satisfactory on whole sample and bycountry (Table 11). For the KIDSCREEN-52, δ ranged between 0.84 and 0.99 on inter-national data and across countries except for the dimension Social Acceptance (Bully-ing), where δ ranged from 0.57 to 0.86. The results are good for the KIDSCREEN-27 (δ:0.81 to 0.99) and the KIDSCREEN-10 indices (δ: 0.96 to 0.98).
3.2 Structure: CFA and IRT, DIF
3.2.1 Rasch Measurement Analysis
The development of the KIDSCREEN was based on the probabilistic partial credit mod-el which belongs to the family of Rasch models. The partial credit model (PCM) tries toexplain the actual behaviour of the responders in the testing situation by the estimatedperson parameter and the location of the item-answer-category-thresholds. The PCMassumes all items of a scale to be the indicators of a single unidimensional latent trait. Itfurthermore assumes the item-answer-characteristic curves (which describe how changesin the latent trait level relate to changes in the probability of a specific response) toresemble a logistic-function with equal slopes. These assumptions were tested for everyitem by calculating the infit mean square, an itemfit statistic which is based on the resid-uals between the theoretical expected item-response and the actual response. An item iswell functioning if the infit mean-square is between 0.80 and 1.20.All items except one displayed an infit mean square between 0.80 and 1.20 and thus ful-filled the strong assumptions of the partial credit model (see Table 12). The actualresponse to the items could be reasonably explained by the estimated features of theitems and the estimated person parameter values. The sum score gives sufficient infor-mation about the response to the single items. Only one item displayed an infit meansquare slightly above 1.20 but apart from this, it showed reasonable psychometric prop-erties.
3.2.2 Differential Item Functioning
Comparable assessment of HRQoL across different cultural and sociodemographicgroups demands that the items of an instrument function in the same way regardless of

Chapter 3
50
Tota
lAT
CH
CZ
DE
EL
ES
FRH
UIE
NL
PLSE
UK
KID
SCR
EE
N-5
2 Ph
ysic
al W
ell-b
eing
0.97
0.96
0.95
0.97
0.95
0.97
0.97
0.98
0.97
0.97
0.96
0.97
0.97
0.97
Psyc
holo
gica
l Wel
l-bei
ng0.
960.
930.
930.
960.
930.
970.
950.
970.
970.
940.
940.
980.
960.
97M
oods
& E
mot
ions
0.96
0.95
0.95
0.96
0.96
0.97
0.96
0.92
0.97
0.95
0.95
0.96
0.96
0.97
Self-
Perc
eptio
n0.
970.
950.
940.
970.
960.
980.
960.
970.
980.
910.
950.
970.
970.
97A
uton
omy
0.97
0.94
0.94
0.96
0.94
0.99
0.95
0.98
0.98
0.97
0.93
0.98
0.96
0.97
Pare
nt R
elat
ion
&
0.95
0.94
0.93
0.97
0.95
0.98
0.94
0.98
0.96
0.90
0.91
0.97
0.92
0.96
Hom
e Li
feFi
nanc
ial R
esou
rces
0.94
0.84
0.87
0.97
0.86
0.95
0.93
0.99
0.96
0.89
0.89
0.98
0.89
0.94
Soci
al S
uppo
rt &
Pee
rs0.
970.
960.
960.
970.
960.
980.
940.
990.
970.
960.
950.
980.
960.
97Sc
hool
Env
ironm
ent
0.98
0.98
0.97
0.98
0.98
0.97
0.98
0.98
0.99
0.98
0.97
0.98
0.97
0.98
Soci
al A
cc. (
Bul
lyin
g)0.
730.
760.
750.
790.
720.
570.
760.
670.
570.
770.
770.
760.
580.
86K
IDSC
RE
EN
-27
Phys
ical
Wel
l-bei
ng0.
970.
960.
950.
970.
950.
970.
970.
980.
970.
970.
960.
970.
970.
97Ps
ycho
logi
cal W
ell-b
eing
0.98
0.94
0.94
0.96
0.95
0.97
0.96
0.97
0.97
0.95
0.95
0.97
0.97
0.97
Aut
onom
y &
Par
ent
0.98
0.96
0.95
0.98
0.96
0.98
0.96
0.99
0.98
0.97
0.95
0.98
0.96
0.98
rela
tion
Soci
al S
uppo
rt &
Pee
rs0.
950.
880.
880.
930.
900.
940.
900.
960.
960.
920.
810.
950.
920.
95Sc
hool
Env
ironm
ent
0.95
0.96
0.94
0.97
0.96
0.96
0.96
0.97
0.98
0.96
0.95
0.98
0.96
0.97
KID
SCR
EE
N-1
0 in
dex
Gen
eral
HR
QoL
inde
x0.
970.
970.
960.
970.
960.
980.
970.
980.
980.
970.
960.
980.
970.
98
N=2
1183
-215
05
Tabl
e 11
:D
iscr
imin
ator
y po
wer
on w
hole
sam
ple
and
by c
ount
ry
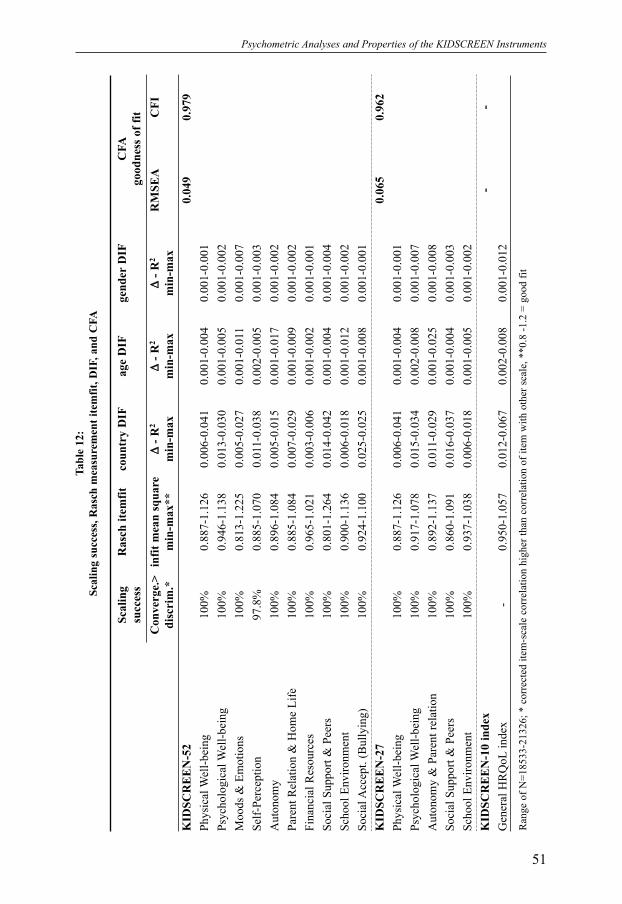
Psychometric Analyses and Properties of the KIDSCREEN Instruments
Scal
ing
Ras
ch it
emfit
coun
try
DIF
age
DIF
gend
erD
IFC
FAsu
cces
sgo
odne
ss o
f fit
Con
verg
e.>
infit
mea
n sq
uare
∆
- R2
∆- R
2∆
- R2
RM
SEA
CFI
disc
rim
.*m
in-m
ax**
min
-max
min
-max
min
-max
KID
SCR
EE
N-5
20.
049
0.97
9Ph
ysic
al W
ell-b
eing
100%
0.88
7-1.
126
0.00
6-0.
041
0.00
1-0.
004
0.00
1-0.
001
Psyc
holo
gica
l Wel
l-bei
ng10
0%0.
946-
1.13
80.
013-
0.03
00.
001-
0.00
50.
001-
0.00
2M
oods
& E
mot
ions
100%
0.81
3-1.
225
0.00
5-0.
027
0.00
1-0.
011
0.00
1-0.
007
Self-
Perc
eptio
n97
.8%
0.88
5-1.
070
0.01
1-0.
038
0.00
2-0.
005
0.00
1-0.
003
Aut
onom
y10
0%0.
896-
1.08
40.
005-
0.01
50.
001-
0.01
70.
001-
0.00
2Pa
rent
Rel
atio
n &
Hom
e Li
fe10
0%0.
885-
1.08
40.
007-
0.02
90.
001-
0.00
90.
001-
0.00
2Fi
nanc
ial R
esou
rces
100%
0.96
5-1.
021
0.00
3-0.
006
0.00
1-0.
002
0.00
1-0.
001
Soci
al S
uppo
rt &
Pee
rs10
0%0.
801-
1.26
40.
014-
0.04
20.
001-
0.00
40.
001-
0.00
4Sc
hool
Env
ironm
ent
100%
0.90
0-1.
136
0.00
6-0.
018
0.00
1-0.
012
0.00
1-0.
002
Soci
al A
ccep
t. (B
ully
ing)
100%
0.92
4-1.
100
0.02
5-0.
025
0.00
1-0.
008
0.00
1-0.
001
KID
SCR
EE
N-2
70.
065
0.96
2Ph
ysic
al W
ell-b
eing
100%
0.88
7-1.
126
0.00
6-0.
041
0.00
1-0.
004
0.00
1-0.
001
Psyc
holo
gica
l Wel
l-bei
ng10
0%0.
917-
1.07
80.
015-
0.03
40.
002-
0.00
80.
001-
0.00
7A
uton
omy
& P
aren
t rel
atio
n10
0%0.
892-
1.13
70.
011-
0.02
90.
001-
0.02
50.
001-
0.00
8So
cial
Sup
port
& P
eers
100%
0.86
0-1.
091
0.01
6-0.
037
0.00
1-0.
004
0.00
1-0.
003
Scho
ol E
nviro
nmen
t10
0%0.
937-
1.03
80.
006-
0.01
80.
001-
0.00
50.
001-
0.00
2K
IDSC
RE
EN
-10
inde
x-
-G
ener
al H
RQ
oLin
dex
-0.
950-
1.05
70.
012-
0.06
70.
002-
0.00
80.
001-
0.01
2
51
Tabl
e 12
:Sc
alin
g su
cces
s, R
asch
mea
sure
men
t ite
mfit
, DIF
, and
CFA
Ran
ge o
f N=1
8533
-213
26; *
cor
rect
ed it
em-s
cale
cor
rela
tion
high
er th
an c
orre
latio
n of
item
with
oth
er s
cale
, **0
.8 -1
.2 =
goo
d fit
Chapter 3
the culture, age, or gender of the respondents. In recent years, test developers, researchersand the public have increasingly been confronted with the problem that tests or test-itemsactually function differently for different groups of people (Differential Item Function-ing, DIF). The logistic regression approach for DIF-detection was applied to identifyitems displaying DIF across countries, age and gender groups (8-11 years vs. 12-18years). This model-based approach is designed to identify both uniform and non-uniformDIF. In this approach, every item serves as the dependent variable in ordinal regressionmodels. At first, the goodness of fit of a logistic regression model, with the total scorebeing the only covariate, was compared with the goodness of fit of a model where thetotal score, the group-membership and the group-membership * total score interactionwere the covariates. The significance of the chi2-differences as well as the difference inthe pseudo-R2 were investigated. While the first value indicates significant uniform (dif-ferent locations on the latent trait) and nonuniform (different slopes) DIF, the second sta-tistic gives an impression about the DIF-effect size. The total DIF-effect should be lessthan ∆-R2 = 0.020 respective ∆-R2 = 0.035. Most items displayed negligible DIF (Table12). Only a few items displayed sizeable DIF, which from theoretical considerations canbe attributed to the fact that they measure secondary aspects which are relevant for thetrait to be measured but vary across the groups to be compared.
3.2.3 Confirmatory Factor Analysis and MAP Analysis
The structure of an instrument should be reasonable in terms of presenting the theoreti-cal expected dimensions of the construct to be measured. Furthermore, the model of thequestionnaire should be confirmed in empirical investigations. Confirmatory factoranalyses were conducted by specifying a structural equation model according to thescale-structure of the instrument. The goodness of fit of the specified model was testedusing the RMSEA statistic (Root Mean Square Error of Approximation) and the CFI-sta-tistic (Comparative Fit Index). Both measures can tell how well the observed inter-item-correlation can be explained by the specified model. A Multitrait Analysis Program(MAP) analysis was conducted to assess if the items of a particular scale display highercorrelation with their own scale (corrected for overlap) than their correlations with otherscales. The results of the MAP analysis as well as the confirmatory factor analysis con-firmed the structure of the multi-scale KIDSCREEN instruments.
3.2.4 Inter-Scale Correlation
The scales of an instrument should assess separate concepts, and therefore should avoidredundancy. However, the scales of the KIDSCREEN HRQoL instrument should not betotally unrelated, otherwise it is questionable if they all assess aspects of the constructHRQoL or aspects not belonging to that construct. The examination of the inter-scale cor-relation reveals redundancy between the scales and furthermore explores the internalstructure of a test-battery. A scale is considered to be redundant if the shared variancewith another scale exceeds 50% (Pearson r>0.71). Inter-scale correlation ranged fromr=0.10 to r=0.62 for the KIDSCREEN-52 (Table 13) and from r=0.36 to r=0.59 for theKIDSCREEN-27 (Table 14). The scales thus measure separate aspects of the HRQoLconstruct. From the results of these analyses, none of the KIDSCREEN scales could beconsidered as being either redundant or unrelated to HRQoL.
52

Psychometric Analyses and Properties of the KIDSCREEN Instruments
53
KIDSCREEN-52
Ph
ysi
cal
Wel
l-b
eing
Psy
cho
logic
al W
ell-
bei
ng
Mo
od
s &
Em
oti
on
s
Sel
f-P
erce
pti
on
Au
tono
my
Par
ent
Rel
atio
n &
Ho
me
Lif
e
Fin
anci
al R
esou
rces
So
cial
Su
pp
ort
& P
eers
Sch
ool
En
vir
on
men
t
So
cial
Acc
. (B
ull
yin
g)
Physical Well-being
Psychological Well-being 0.57
Moods & Emotions 0.44 0.62
Self-Perception 0.46 0.52 0.55
Autonomy 0.40 0.52 0.45 0.43
Parent Relation & Home Life 0.40 0.58 0.50 0.50 0.50
Financial Resources 0.26 0.33 0.29 0.29 0.39 0.40
Social Support & Peers 0.38 0.51 0.35 0.30 0.47 0.40 0.31
School Environment 0.42 0.55 0.46 0.47 0.39 0.52 0.32 0.35
Social Acc. (Bullying) 0.10 0.17 0.31 0.21 0.14 0.18 0.20 0.23 0.13
Table 13:Inter-scale correlation for KIDSCREEN-52
Range of N=20729-21196
KIDSCREEN-27
P
hy
sica
l W
ell-
bei
ng
Psy
cho
logic
al W
ell-
bei
ng
Au
tono
my
& P
aren
t re
lati
on
So
cial
Su
pp
ort
& P
eers
Sch
ool
En
vir
on
men
t
Physical Well-being
Psychological Well-being 0.57
Autonomy & Parent relation 0.42 0.59
Social Support & Peers 0.36 0.50 0.44
School Environment 0.43 0.57 0.53 0.37
Table 14:Inter-scale-correlation for KIDSCREEN-27
Range of N=20491-20993
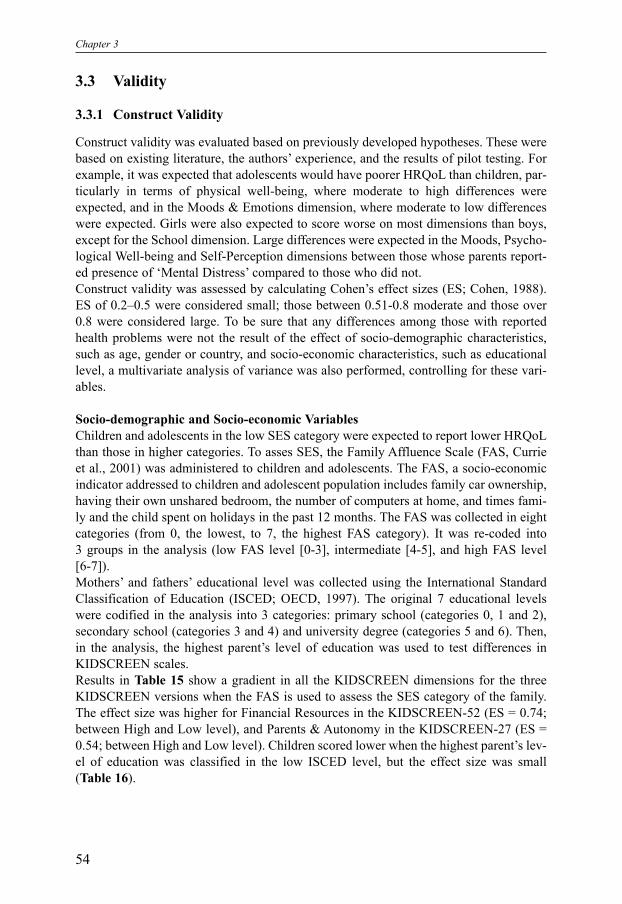
Chapter 3
3.3 Validity
3.3.1 Construct Validity
Construct validity was evaluated based on previously developed hypotheses. These werebased on existing literature, the authors’ experience, and the results of pilot testing. Forexample, it was expected that adolescents would have poorer HRQoL than children, par-ticularly in terms of physical well-being, where moderate to high differences wereexpected, and in the Moods & Emotions dimension, where moderate to low differenceswere expected. Girls were also expected to score worse on most dimensions than boys,except for the School dimension. Large differences were expected in the Moods, Psycho-logical Well-being and Self-Perception dimensions between those whose parents report-ed presence of ‘Mental Distress’ compared to those who did not.Construct validity was assessed by calculating Cohen’s effect sizes (ES; Cohen, 1988).ES of 0.2–0.5 were considered small; those between 0.51-0.8 moderate and those over0.8 were considered large. To be sure that any differences among those with reportedhealth problems were not the result of the effect of socio-demographic characteristics,such as age, gender or country, and socio-economic characteristics, such as educationallevel, a multivariate analysis of variance was also performed, controlling for these vari-ables.
Socio-demographic and Socio-economic VariablesChildren and adolescents in the low SES category were expected to report lower HRQoLthan those in higher categories. To asses SES, the Family Affluence Scale (FAS, Currieet al., 2001) was administered to children and adolescents. The FAS, a socio-economicindicator addressed to children and adolescent population includes family car ownership,having their own unshared bedroom, the number of computers at home, and times fami-ly and the child spent on holidays in the past 12 months. The FAS was collected in eightcategories (from 0, the lowest, to 7, the highest FAS category). It was re-coded into 3 groups in the analysis (low FAS level [0-3], intermediate [4-5], and high FAS level [6-7]). Mothers’ and fathers’ educational level was collected using the International StandardClassification of Education (ISCED; OECD, 1997). The original 7 educational levelswere codified in the analysis into 3 categories: primary school (categories 0, 1 and 2),secondary school (categories 3 and 4) and university degree (categories 5 and 6). Then,in the analysis, the highest parent’s level of education was used to test differences inKIDSCREEN scales. Results in Table 15 show a gradient in all the KIDSCREEN dimensions for the threeKIDSCREEN versions when the FAS is used to assess the SES category of the family.The effect size was higher for Financial Resources in the KIDSCREEN-52 (ES = 0.74;between High and Low level), and Parents & Autonomy in the KIDSCREEN-27 (ES =0.54; between High and Low level). Children scored lower when the highest parent’s lev-el of education was classified in the low ISCED level, but the effect size was small(Table 16).
54

Psychometric Analyses and Properties of the KIDSCREEN Instruments
Fam
ily A
fflue
ncea
Low
Med
ium
Hig
hEf
fect
siz
ecEf
fect
siz
ec
Mea
n T-
valu
eM
ean
T-va
lue
Mea
n T-
valu
eLo
w v
s. Lo
w v
s. (S
D)
(SD
)(S
D)
Med
ium
Hig
hK
IDSC
RE
EN
-52
Phys
ical
Wel
l-bei
ng48
.1(1
0.08
)50
.29
(9.7
1)51
.68
(9.7
4)0.
220.
36Ps
ycho
logi
cal W
ell-b
eing
47.6
(10.
13)
50.1
2(9
.69)
51.3
9(9
.54)
0.26
0.39
Moo
ds &
Em
otio
ns47
.85
(9.5
5)49
.83
(9.4
2)50
.95
(9.3
9)0.
210.
33Se
lf-Pe
rcep
tion
48.0
9(1
0.07
)50
.28
(9.9
9)51
.49
(9.9
1)0.
220.
34A
uton
omy
47.9
9(1
0.49
)50
.07
(10.
14)
51.1
3(9
.82)
0.21
0.31
Pare
nt R
elat
ion
& H
ome
Life
47.4
8(1
0.37
)50
.03
(10.
03)
50.9
1(9
.61)
0.25
0.34
Fina
ncia
l Res
ourc
es45
.21
(10.
34)
49.8
8(9
.92)
52.8
6(9
.56)
0.45
0.74
Soci
al S
uppo
rt &
Pee
rs47
.83
(10.
19)
49.6
7(9
.79)
50.7
9(9
.87)
0.18
0.30
Scho
ol E
nviro
nmen
t47
.71
(10.
13)
50.0
6(1
0.17
)51
.06
(10.
12)
0.23
0.33
Soci
al A
ccep
tanc
e (B
ully
ing)
49.0
1(1
0.57
)49
.75
(10.
16)
50.0
1(1
0.02
)0.
070.
10K
IDSC
RE
EN
-27
Phys
ical
Wel
l-bei
ng48
.1(1
0.08
)50
.29
(9.7
1)51
.68
(9.7
4)0.
220.
36Ps
ycho
logi
cal W
ell-b
eing
47.2
5(9
.29)
49.8
6(9
.43)
51.2
9(9
.27)
0.28
0.43
Aut
onom
y &
Par
ent r
elat
ion
46.3
5(9
.54)
49.8
6(9
.75)
51.7
)(9
.78
0.35
0.54
Soci
al S
uppo
rt &
Pee
rs47
.95
(10.
44)
49.7
7(9
.92)
50.8
(9.7
6)0.
180.
28Sc
hool
Env
ironm
ent
47.5
1(1
0.01
)50
.01
(10.
02)
51.0
5(1
0.07
)0.
250.
35K
IDSC
RE
EN
-10
inde
xG
ener
al H
RQ
oLin
dex
47.1
5(8
.92)
49.9
3(9
.51)
51.3
7(9
.7)
0.29
0.44
55
Tabl
e 15
:D
iffer
ence
s in
KID
SCR
EE
N d
imen
sion
scor
es b
y fa
mily
affl
uenc
e
a R
ange
of N
179
19 -
1737
0; c
Effe
ct s
ize
(con
vent
ion)
: 0.2
0=sm
all;
0.50
=mod
erat
e; 0
.80=
larg
e; e
ffect
siz
e is
cal
cula
ted
divi
ding
the
mea
ns d
iffer
ence
by
the
over
all s
tand
ard
devi
atio
n.

Chapter 3
56
Hig
hest
par
ents
leve
l L
owM
ediu
mH
igh
Effe
ct s
izec
Effe
ct s
izec
of e
duca
tionb
Mea
n T-
valu
eM
ean
T-va
lue
Mea
n T-
valu
eLo
w v
s. Lo
w v
s. (S
D)
(SD
)(S
D)
Med
ium
Hig
hK
IDSC
RE
EN
-52
Phys
ical
Wel
l-bei
ng48
.71
(9.6
8)51
.38
(9.8
6)50
.38
(9.8
1)0.
270.
17Ps
ycho
logi
cal W
ell-b
eing
49.3
2 (9
.9)
50.8
7 (9
.59)
49.8
4 (9
.64)
0.16
0.05
Moo
ds &
Em
otio
ns49
.07
(9.4
6)50
.15
(9.5
)50
.14
(9.3
)0.
110.
11Se
lf-Pe
rcep
tion
49.1
3 (9
.89)
50.6
8 (1
0.15
)50
.46
(9.8
3)0.
160.
13A
uton
omy
49.7
9 (1
0.46
)51
.22
(9.7
4)49
.22
(10.
14)
0.14
-0.0
6Pa
rent
Rel
atio
n &
Hom
e Li
fe49
.12
(10.
45)
49.9
7 (9
.82)
49.8
8 (9
.77)
0.09
0.08
Fina
ncia
l Res
ourc
es47
.49
(10.
46)
49.8
7 (1
0.19
)50
.53
(10.
06)
0.23
0.30
Soci
al S
uppo
rt &
Pee
rs49
.23
(10.
26)
49.7
(9
.59)
49.4
2 (1
0.03
)0.
050.
02Sc
hool
Env
ironm
ent
49.0
8 (1
0.12
)50
.19
(10.
04)
50.3
6 (1
0.09
)0.
110.
13So
cial
Acc
epta
nce
(Bul
lyin
g)49
.32
(10.
48)
49.1
2 (1
0.25
)50
.35
(9.6
3)-0
.02
0.10
KID
SCR
EE
N-2
7Ph
ysic
al W
ell-b
eing
48.7
1 (9
.68)
51.3
8 (9
.86)
50.3
8 (9
.81)
0.27
0.17
Psyc
holo
gica
l Wel
l-bei
ng49
.13
(9.5
3)50
.43
(9.3
6)49
.85
(9.1
9)0.
140.
08A
uton
omy
& P
aren
t rel
atio
n48
.62
(10.
25)
50.1
8 (9
.62)
49.7
3 (9
.71)
0.16
0.11
Soci
al S
uppo
rt &
Pee
rs49
.39
(10.
45)
49.5
(9
.6)
49.5
6 (1
0.12
)0.
010.
02Sc
hool
Env
ironm
ent
48.7
6 (1
0.04
)50
.12
(9.9
6)50
.35
(9.9
5)0.
140.
16K
IDSC
RE
EN
-10
inde
xG
ener
al H
RQ
oLin
dex
48.8
(9
.5)
50.4
8 (9
.41)
49.9
3 (9
.69)
0.18
0.12
Tabl
e 16
:D
iffer
ence
s in
KID
SCR
EE
N d
imen
sion
scor
es b
y hi
ghes
t par
ent's
leve
l of e
duca
tion
bR
ange
of N
154
44 -
1493
3; c
Effe
ct s
ize
(con
vent
ion)
: 0.2
0=sm
all;
0.50
=mod
erat
e; 0
.80=
larg
e; e
ffect
siz
e is
cal
cula
ted
divi
ding
the
mea
ns d
iffer
ence
by
the
over
all s
tand
ard
devi
atio
n.

Psychometric Analyses and Properties of the KIDSCREEN Instruments
Health Status Children and adolescents with special health care needs were expected to show lowerHRQoL especially in domains like Physical and Psychological Well-being and in Moods& Emotions (Bruil, 1999; Verrips et al, 1998).To assess special health care needs, the Children with Special Health Care Needs Screen-er (CSHCN, Bethell et al., 2002a,b) was included in all participating countries as a validmeasure of physical chronic health status. The CSHCN screener has been field-tested inseveral studies and 12-20% children in population-based samples were identified as hav-ing special health care needs (Bethell et al., 2002a, 2002b, Davidoff, 2004). The CSHCNcontains five question sequences: Each question is followed by two additional questions,asking about the presence and duration of any health conditions. The five questionsaddress the use or need of prescription medication; the use or need of medical, mentalhealth or educational services; functional limitations; use and need of specialized thera-pies (Occupational Therapy, Physiotherapy, Speech Therapy, etc.); and treatment orcounselling for emotional or developmental problems. This list of questions indicatesthat the CSHCN is health consequence-based rather than using diagnosis-specific crite-ria. If parents agree that their child meets one of the five conditions, they are asked twofollow-up questions to determine if the consequence is attributable to a medical, behav-ioural, or other health condition lasting or expected to last at least 12 months. In Table 17, results (means, standard deviations, and effect sizes) are shown for the threeKIDSCREEN questionnaires. It illustrates that children with special health care needs
57
CSHCN Healthy CSHCN (+)Mean T-value (SD) Mean T-value (SD) Effect sizea
KIDSCREEN-52Physical Well-being 51.01 (9.77) 46.96 (10.02) 0.41Psychological Well-being 50.54 (9.63) 47.67 (9.84) 0.30Moods & Emotions 50.27 (9.40 47.78 (9.46) 0.26Self-Perception 50.57 (10.01) 48.84 (10.00) 0.17Autonomy 50.33 (10.08 48.80 (9.87) 0.15Parent Relation & Home Life 50.05 (9.89) 47.92 (9.94) 0.21Financial Resources 49.98 (10.19) 48.06 (10.55) 0.19Social Support & Peers 49.85 (9.83) 47.06 (10.06) 0.28School Environment 50.33 (10.07) 48.32 (10.19) 0.20Social Acceptance (Bullying) 49.93 (9.91) 47.22 (11.10) 0.27KIDSCREEN-27Physical Well-being 51.01 (9.77) 46.96 (10.02) 0.41Psychological Well-being 50.29 (9.30) 47.59 (9.24) 0.29Autonomy & Parent relation 49.98 (9.80) 47.87 (9.44) 0.22Social Support & Peers 49.83 (9.88) 47.11 (10.29) 0.27School Environment 50.30 (9.96) 47.86 (10.03) 0.24KIDSCREEN-10 indexGeneral HRQoL index 50.33 (9.58) 47.38 (8.84) 0.31Range of N 15400 - 15967a Effect size (convention): 0.20=small; 0.50=moderate; 0.80=large; effect size is calculated dividing the adjust-ed means difference by the overall standard deviation. Multivariate analysis included age
Table 17:Differences in KIDSCREEN dimension scores by health care needs (CSHCN)

Chapter 3
reported a lower Physical and Psychological Well-being in comparison to healthy chil-dren. The differences between both groups were significant with small to moderate effectsizes.
Psychosomatic Complaints Psychosomatic health complaints, like headache, stomachache, backache, dizziness, irri-tability/bad temper, feeling nervous, feeling low or having sleeping difficulties, are aserious health problem not only for adults but also in adolescents and children. From the-oretical considerations it was hypothesized that children and adolescents suffering frompsychosomatic health complaints display decreased HRQoL values, especially in theKIDSCREEN dimensions of Psychological Well-being and Moods & Emotions. Theimpact of psychosomatic health complaints on the other HRQoL aspects should be low-er but still considerable. The Health Behaviour in School-aged Children (HBSC) psycho-somatic complaints symptom checklist (Currie et al., 2001) is a self-administered briefscreening instrument which asks children and adolescents about the frequency of occur-rence of eight psychosomatic health complaints. Items are added together to generate anindex of psychosomatic health complaints score. The symptom checklist was included asa screening instrument in all countries. The correlation between the KIDSCREEN scalesand the psychosomatic health complaints index is presented in Table 18.Table 18 shows that the more frequently children and adolescents suffer from psychoso-matic health complaints, the lower their HRQoL scores in the KIDSCREEN-52, -27 and
58
Table 18:Correlation between KIDSCREEN scales and the Psychosomatic Health Complaints Index
Psychosomatic Health Complaints index
rKIDSCREEN-52Physical Well-being -0.42Psychological Well-being -0.47Moods & Emotions -0.53Self-Perception -0.45Autonomy -0.37Parent Relation & Home Life -0.41Financial Resources -0.23Social Support & Peers -0.25School Environment -0.38Social Acceptance (Bullying) -0.20KIDSCREEN-27Physical Well-being -0.42Psychological Well-being -0.52Autonomy & Parent relation -0.40Social Support & Peers -0.25School Environment -0.39KIDSCREEN-10 indexGeneral HRQoL index -0.52Range of N=20503-21008. All correlations are significant at p<0.001; thehighest correlations coefficients are marked in bold.

Psychometric Analyses and Properties of the KIDSCREEN Instruments
-10 index versions. The correlations were highest for the KIDSCREEN dimensionsMoods & Emotions and Psychological Well-being and for the HRQoL index. Thestrength of these correlations can be classified as a large effect size. Sizeable correlationscan be observed for the other dimensions.
Mental Health and Behaviour ProblemsFrom theoretical considerations it was hypothesized that children and adolescents withmental health problems display decreased HRQoL values, especially in theKIDSCREEN dimensions Psychological Well-being and Moods & Emotions. The impactof mental health status on the other HRQoL aspects should be lower but still consider-able.The Strength and Difficulties Questionnaire (SDQ, Goodman, 1997) is a brief behaviour-al screening questionnaire for 3-16 year-old children and teenagers that asks about theirsymptoms and positive attitudes. Several validated versions for researchers, clinicians,and educationalists are available. Positive or negative attributes are assessed with thehelp of 25 items concerning the following dimensions: emotional symptoms, conductproblems, hyperactivity/inattention, peer relationship problems and prosocial behaviour.Items are added to generate a total difficulties score. The SDQ was included as a screen-ing instrument of mental health in all countries. The results (means, standard deviation,effect sizes) for the parents SDQ assessment of their children are presented in Table 19.Table 19 shows that children and adolescents with mental health problems displayed sig-nificant and sizeable lower HRQoL values in all scales of the KIDSCREEN-52, -27 and-10 index versions. As hypothesised, the effect was highest for the KIDSCREEN dimen-sions Psychological Well-being and Moods & Emotions. The effect can be classified asmoderate / large. Similar large effects can be found for the Social Acceptance (Bullying)dimension of the KIDSCREEN-52 and the General HRQoL-index.
Health Care UtilisationSome factors are known to determine the use of health care services, such as age, gen-der, characteristics of the health care system and health insurance status, family compo-sition, and the need for services. The use of health care services was collected to checkthe relationship between HRQoL and the curative use of services. Two variables werecollected from parents and adapted according to the European group recommendationsaddressed to develop common instruments for health interview surveys (Eurohis;Nosikov, 2003): visits to a health professional in the past 4 weeks (yes/no) and hospital-isation in the past 12 months (yes/no). An answer was considered “yes” when the visitwas due to accidents or injuries, acute illness, or long-term disabilities. Visits due to acheck-up were excluded. The main hypothesis was that those children reporting the worststatus on physical and emotional symptoms and on functioning use more curative healthcare services. Table 20 shows the mean standardised differences comparing the dimen-sions of who reported at least one visit to a health care professional in the past 4 weeks.Table 21 presents the mean standardised differences comparing the dimensions of chil-dren who were hospitalised in the past 12 months with children who were not.Children who used healthcare services scored lower in all the KIDSCREEN dimensionsand the KIDSCREEN-10 index, although the effect size was low.
59

Chapter 3
SDQ
Par
ents
Hea
lthy
Bor
derl
ine
Not
icea
ble
(n=1
3678
)(n
=117
0)(n
=105
5)M
ean
T-va
lue
(SD
)M
ean
T-va
lue
(SD
)M
ean
T-va
lue
(SD
)Ef
fect
siz
ea
KID
SCR
EE
N-5
2Ph
ysic
al W
ell-b
eing
51.1
0(9
.75)
48.0
6(9
.50)
46.9
5(1
0.74
)0.
42Ps
ycho
logi
cal W
ell-b
eing
50.9
5(9
.43)
46.8
0(9
.97)
45.1
9(1
0.26
)0.
59M
oods
& E
mot
ions
50.8
4(9
.28)
45.8
2(8
.61)
43.9
2(9
.15)
0.73
Self-
Perc
eptio
n50
.92
(9.9
3)47
.39
(9.5
6)46
.83
(10.
13)
0.41
Aut
onom
y50
.63
(9.9
8)47
.79
(10.
14)
47.4
2(1
0.11
)0.
32Pa
rent
Rel
atio
n &
Hom
e Li
fe50
.51
(9.6
9)46
.17
(9.8
0)44
.96
(10.
41)
0.56
Fina
ncia
l Res
ourc
es50
.46
(10.
03)
46.3
2(1
0.14
)44
.71
(11.
10)
0.56
Soci
al S
uppo
rt &
Pee
rs50
.17
(9.6
9)46
.52
(9.7
4)44
.79
(10.
83)
0.54
Scho
ol E
nviro
nmen
t50
.83
(9.9
8)46
.42
(9.8
1)45
.19
(10.
04)
0.56
Soci
al A
ccep
tanc
e (B
ully
ing)
50.4
2(9
.62)
46.1
1(1
1.03
)43
.31
(11.
91)
0.70
KID
SCR
EE
N-2
7Ph
ysic
al W
ell-b
eing
51.1
0(9
.75)
48.0
6(9
.50)
46.9
5(1
0.74
)0.
42Ps
ycho
logi
cal W
ell-b
eing
50.7
7(9
.18)
46.1
0(8
.79)
44.4
6(8
.94)
0.68
Aut
onom
y &
Par
ent r
elat
ion
50.4
4(9
.71)
46.1
5(8
.95)
44.9
4(9
.00)
0.56
Soci
al S
uppo
rt &
Pee
rs50
.18
(9.7
0)46
.41
(10.
11)
44.6
8(1
1.12
)0.
55Sc
hool
Env
ironm
ent
50.7
9(9
.85)
46.0
9(9
.59)
44.6
3(9
.79)
0.62
KID
SCR
EE
N-1
0 in
dex
Gen
eral
HR
QoL
inde
x50
.77
(9.4
9)45
.98
(8.3
9)44
.38
(8.3
6)0.
67
60
Tabl
e 19
:D
iffer
ence
s in
KID
SCR
EE
N d
imen
sion
scor
es b
y m
enta
l hea
lth st
atus
(SD
Q)
Ran
ge o
f N=1
5371
-159
73; a
Effe
ct si
ze (c
onve
ntio
n): 0
.20=
smal
l; 0.
50=m
oder
ate;
0.8
0=la
rge;
effe
ct si
ze is
cal
cula
ted
divi
ding
the
adju
sted
mea
ns d
iffer
ence
by
the
over
all s
tan-
dard
dev
iatio
n. E
ffect
siz
es in
the
SDQ
col
umn
are
for c
ompa
rison
s be
twee
n th
e hi
ghes
t and
low
est c
ateg
orie
s. E
ffect
siz
es o
f "m
oder
ate"
or g
reat
er a
re s
how
n in
bol
d.
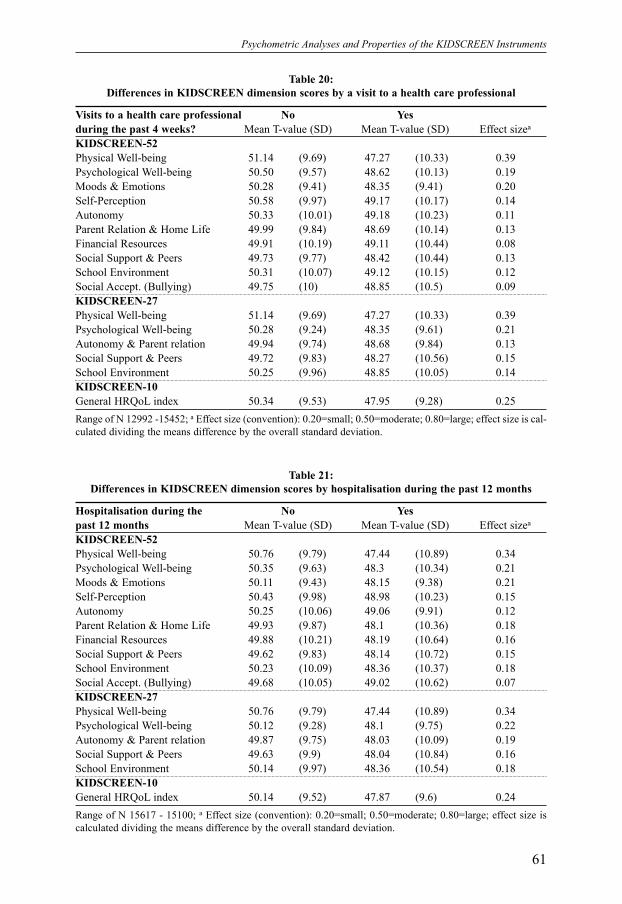
Psychometric Analyses and Properties of the KIDSCREEN Instruments
61
Visits to a health care professional No Yesduring the past 4 weeks? Mean T-value (SD) Mean T-value (SD) Effect sizea
KIDSCREEN-52Physical Well-being 51.14 (9.69) 47.27 (10.33) 0.39Psychological Well-being 50.50 (9.57) 48.62 (10.13) 0.19Moods & Emotions 50.28 (9.41) 48.35 (9.41) 0.20Self-Perception 50.58 (9.97) 49.17 (10.17) 0.14Autonomy 50.33 (10.01) 49.18 (10.23) 0.11Parent Relation & Home Life 49.99 (9.84) 48.69 (10.14) 0.13Financial Resources 49.91 (10.19) 49.11 (10.44) 0.08Social Support & Peers 49.73 (9.77) 48.42 (10.44) 0.13School Environment 50.31 (10.07) 49.12 (10.15) 0.12Social Accept. (Bullying) 49.75 (10) 48.85 (10.5) 0.09KIDSCREEN-27Physical Well-being 51.14 (9.69) 47.27 (10.33) 0.39Psychological Well-being 50.28 (9.24) 48.35 (9.61) 0.21Autonomy & Parent relation 49.94 (9.74) 48.68 (9.84) 0.13Social Support & Peers 49.72 (9.83) 48.27 (10.56) 0.15School Environment 50.25 (9.96) 48.85 (10.05) 0.14KIDSCREEN-10General HRQoL index 50.34 (9.53) 47.95 (9.28) 0.25
Table 20:Differences in KIDSCREEN dimension scores by a visit to a health care professional
Range of N 12992 -15452; a Effect size (convention): 0.20=small; 0.50=moderate; 0.80=large; effect size is cal-culated dividing the means difference by the overall standard deviation.
Hospitalisation during the No Yespast 12 months Mean T-value (SD) Mean T-value (SD) Effect sizea
KIDSCREEN-52Physical Well-being 50.76 (9.79) 47.44 (10.89) 0.34Psychological Well-being 50.35 (9.63) 48.3 (10.34) 0.21Moods & Emotions 50.11 (9.43) 48.15 (9.38) 0.21Self-Perception 50.43 (9.98) 48.98 (10.23) 0.15Autonomy 50.25 (10.06) 49.06 (9.91) 0.12Parent Relation & Home Life 49.93 (9.87) 48.1 (10.36) 0.18Financial Resources 49.88 (10.21) 48.19 (10.64) 0.16Social Support & Peers 49.62 (9.83) 48.14 (10.72) 0.15School Environment 50.23 (10.09) 48.36 (10.37) 0.18Social Accept. (Bullying) 49.68 (10.05) 49.02 (10.62) 0.07KIDSCREEN-27Physical Well-being 50.76 (9.79) 47.44 (10.89) 0.34Psychological Well-being 50.12 (9.28) 48.1 (9.75) 0.22Autonomy & Parent relation 49.87 (9.75) 48.03 (10.09) 0.19Social Support & Peers 49.63 (9.9) 48.04 (10.84) 0.16School Environment 50.14 (9.97) 48.36 (10.54) 0.18KIDSCREEN-10General HRQoL index 50.14 (9.52) 47.87 (9.6) 0.24
Table 21:Differences in KIDSCREEN dimension scores by hospitalisation during the past 12 months
Range of N 15617 - 15100; a Effect size (convention): 0.20=small; 0.50=moderate; 0.80=large; effect size iscalculated dividing the means difference by the overall standard deviation.

Chapter 3
Social Support and FamilySocial support refers to any process through which a social relationship might promotehealth and well-being (Cohen, 2000; Helgeson, 2003). Children and adolescents withpoor social support were expected to show lower HRQoL especially in domains likePeers & Social Support, Parent Relation & Home Life, and Psychological Well-being.These first two dimensions include social support aspects and relationships between per-ceived social support in their definition. Psychological Well-being (both positive andnegative emotions) was described in recent research (Helsen, 2000). To assess the level of social support, the Oslo 3-Item Social Support Scale was adapted(Brevik & Dalgard, 1996; ECHI project). This scale contains one question about thenumber of people who can provide a sense of security and support to the child and twoquestions about emotional and instrumental support from those people. The total scorecalculated by summarising those three items ranged from 0 to 11. Values less than 6 arerecognised in the literature as “poor social support” (Dowrick, 1998). Comparable dataabout social support were collected in ten participating KIDSCREEN countries, where7.3% of children and adolescents reported poor social support (from 3.6% to 11.0% indifferent countries), with more boys than girls and more adolescents than younger chil-dren reporting this.In Table 22, results are shown (means, standard deviations, and effect sizes) for the threeKIDSCREEN questionnaires.
62
Table 22:Differences in KIDSCREEN dimension scores by level of social support
Social Support Scale Moderate or strong Poorsocial support social support
Mean T-value (SD) Mean T-value (SD) Effect sizea
KIDSCREEN-52Physical Well-being 50.73 (9.85) 45.25 (9.53) 0.57Psychological Well-being 50.66 (9.56) 41.91 (10.23) 0.88Moods & Emotions 50.01 (9.27) 42.07 (9.04) 0.87Self-Perception 50.61 (9.98) 44.34 (9.87) 0.63Autonomy 50.61 (9.99) 43.03 (10.13) 0.75Parent Relation & Home Life 50.64 (9.62) 40.04 (10.02) 1.08Financial Resources 50.57 (9.91) 41.90 (10.63) 0.84Social Support & Peers 50.46 (9.63) 41.72 (9.61) 0.91School Environment 50.42 (10.10) 43.12 (9.89) 0.73Social Accept. (Bullying) 50.08 (10.00) 43.25 (12.12) 0.62KIDSCREEN-27Physical Well-being 50.73 (9.85) 45.25 (9.53) 0.57Psychological Well-being 50.29 (9.22) 41.60 (8.99) 0.95Autonomy & Parent relation 50.54 (9.64) 40.67 (8.30) 1.10Social Support & Peers 50.54 (9.66) 41.60 (10.05) 0.91School Environment 50.36 (9.98) 42.81 (9.60) 0.77KIDSCREEN-10 indexGeneral HRQoL index 50.43 (9.40) 41.60 (7.44) 1.04Range of N=16549 to 17162 for combined sample of 10 countries (FR, IE, SE excluded)a Effect size (convention): 0.20=small; 0.50=medium; 0.80=large; effect size is calculated dividing the adjust-ed means difference by the overall standard deviation. An effect size of moderate or greater is indicated in bold.

Psychometric Analyses and Properties of the KIDSCREEN Instruments
Children with poor social support reported much lower scores in all dimensions relatedto family and social relations as well as lower psychological well-being in comparison tostrongly supported children. The differences between both groups were significant withmostly large effect sizes for all questionnaires and dimensions under study.Additionally, parent-child relations were tested from the parent’s perspective. In thequestionnaire for adults, five items were adapted with some extension from the SocialAdjustment Scale (SAS, published in McDowell & Newell, 1996). This short unit cov-ers parental role areas, both in feelings and performance. Time frame and response cate-gories were adjusted to the standard KIDSCREEN form; one-week recall and fiveresponses by frequency (3 items) or intensity (2 items). For eleven KIDSCREEN coun-tries, an alpha internal consistency coefficient of 0.80 was reported. The total score cal-culated by summarising those five items ranged from 0 to 20, with values less than 12assumed as poor family relations. In the combined international KIDSCREEN sample5.1% of the parents reported poor relations with their child. Table 23 shows results forthe three KIDSCREEN questionnaires.Children and adolescents whose parents reported worse relations with them had muchlower scores in the Parent Relation & Home Life dimension. For Psychological Well-being and School Environment, relatively high mean differences were also observed. Thedifferences between both groups were significant in all dimensions with large effect sizesfor the dimensions related to parents and moderate effect sizes in other dimensions,
63
Table 23:Differences in KIDSCREEN dimension scores by parent-child relations
Parent-child relations Moderate or strong Poorrelations relations
Mean T-value (SD) Mean T-value (SD) Effect sizea
KIDSCREEN-52Physical Well-being 50.90 (9.83) 45.36 (9.48) 0.57Psychological Well-being 50.64 (9.58) 43.27 (9.28) 0.78Moods & Emotions 50.28 (9.42) 45.22 (8.80) 0.56Self-Perception 50.72 (9.98) 44.42 (8.88) 0.67Autonomy 50.47 (10.01) 44.84 (9.60) 0.57Parent Relation & Home Life 50.34 (9.68) 40.20 (9.08) 1.08Financial Resources 50.05 (10.17) 44.27 (10.27) 0.57Social Support & Peers 49.79 (9.87) 44.95 (9.54) 0.50School Environment 50.48 (10.09) 43.71 (8.54) 0.72Social Acceptance (Bullying) 49.68 (10.08) 48.67 (10.28) 0.10KIDSCREEN-27Physical Well-being 50.90 (9.83) 45.36 (9.48) 0.57Psychological Well-being 50.35 (9.29) 43.78 (8.46) 0.74Autonomy & Parent Relation 50.17 (9.70) 41.98 (7.92) 0.93Social Support & Peers 49.81 (9.92) 44.63 (9.81) 0.53School Environment 50.39 (9.96) 43.53 (8.63) 0.74KIDSCREEN-10 indexGeneral HRQoL index 50.37 (9.51) 43.08 (7.50) 0.85Range of N 15312 - 15875 for 11 countries a Effect size (convention): 0.20=small; 0.50=moderate; 0.80=large; effect size is calculated dividing the adjust-ed means difference by the overall standard deviation. An effect size of moderate or greater is indicated in bold.
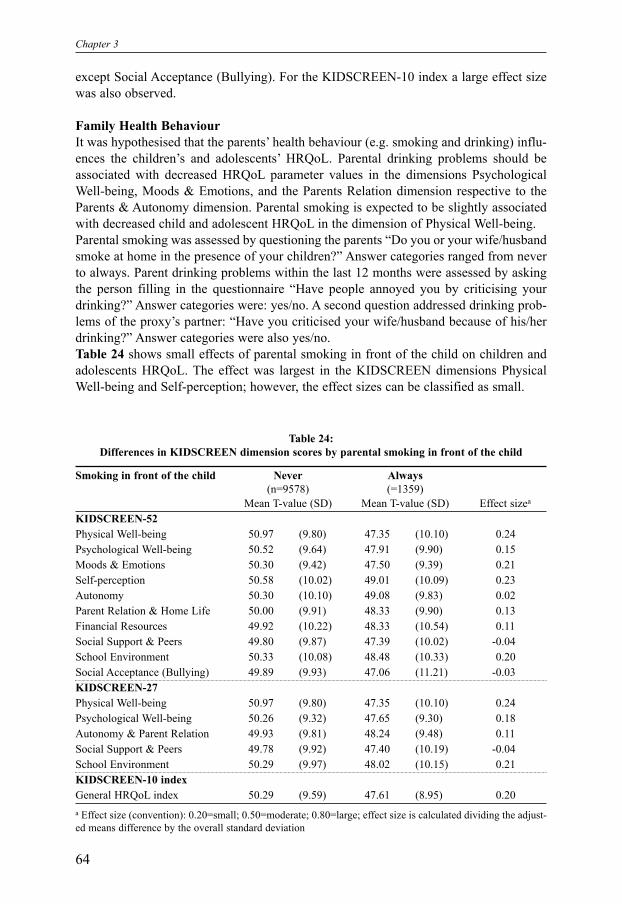
Chapter 3
except Social Acceptance (Bullying). For the KIDSCREEN-10 index a large effect sizewas also observed.
Family Health BehaviourIt was hypothesised that the parents’ health behaviour (e.g. smoking and drinking) influ-ences the children’s and adolescents’ HRQoL. Parental drinking problems should beassociated with decreased HRQoL parameter values in the dimensions PsychologicalWell-being, Moods & Emotions, and the Parents Relation dimension respective to theParents & Autonomy dimension. Parental smoking is expected to be slightly associatedwith decreased child and adolescent HRQoL in the dimension of Physical Well-being.Parental smoking was assessed by questioning the parents “Do you or your wife/husbandsmoke at home in the presence of your children?” Answer categories ranged from neverto always. Parent drinking problems within the last 12 months were assessed by askingthe person filling in the questionnaire “Have people annoyed you by criticising yourdrinking?” Answer categories were: yes/no. A second question addressed drinking prob-lems of the proxy’s partner: “Have you criticised your wife/husband because of his/herdrinking?” Answer categories were also yes/no.Table 24 shows small effects of parental smoking in front of the child on children andadolescents HRQoL. The effect was largest in the KIDSCREEN dimensions PhysicalWell-being and Self-perception; however, the effect sizes can be classified as small.
64
Table 24:Differences in KIDSCREEN dimension scores by parental smoking in front of the child
Smoking in front of the child Never Always (n=9578) (=1359)
Mean T-value (SD) Mean T-value (SD) Effect sizea
KIDSCREEN-52Physical Well-being 50.97 (9.80) 47.35 (10.10) 0.24Psychological Well-being 50.52 (9.64) 47.91 (9.90) 0.15Moods & Emotions 50.30 (9.42) 47.50 (9.39) 0.21Self-perception 50.58 (10.02) 49.01 (10.09) 0.23Autonomy 50.30 (10.10) 49.08 (9.83) 0.02Parent Relation & Home Life 50.00 (9.91) 48.33 (9.90) 0.13Financial Resources 49.92 (10.22) 48.33 (10.54) 0.11Social Support & Peers 49.80 (9.87) 47.39 (10.02) -0.04School Environment 50.33 (10.08) 48.48 (10.33) 0.20Social Acceptance (Bullying) 49.89 (9.93) 47.06 (11.21) -0.03KIDSCREEN-27Physical Well-being 50.97 (9.80) 47.35 (10.10) 0.24Psychological Well-being 50.26 (9.32) 47.65 (9.30) 0.18Autonomy & Parent Relation 49.93 (9.81) 48.24 (9.48) 0.11Social Support & Peers 49.78 (9.92) 47.40 (10.19) -0.04School Environment 50.29 (9.97) 48.02 (10.15) 0.21KIDSCREEN-10 indexGeneral HRQoL index 50.29 (9.59) 47.61 (8.95) 0.20a Effect size (convention): 0.20=small; 0.50=moderate; 0.80=large; effect size is calculated dividing the adjust-ed means difference by the overall standard deviation

Psychometric Analyses and Properties of the KIDSCREEN Instruments
Table 25 shows that children and adolescents who reported that both parents have prob-lems with their drinking display significantly and sizeably lower HRQoL values in theKIDSCREEN dimensions of Moods & Emotions and Parent Relation & Home Life, andAutonomy & Parent Relation, and the KIDSCREEN-10 index. The effect sizes can beclassified as moderate.
3.3.2 Convergent Validity
Convergent validity was assessed through the comparison of KIDSCREEN dimensionscores to other known and validated questionnaires measuring similar concepts. Pearsoncorrelation coefficients were computed to analyse convergent and discriminant validitybetween KIDSCREEN dimensions and similar dimensions or overall scores on othersimilar instruments. Correlation coefficients of KIDSCREEN dimensions measuringsimilar attributes (i.e. Psychological Well-being, Moods & Emotions) to the Satisfactiondomain of the Child Health Questionnaire (CHIP-AE, Starfield et al., 1995) and dimen-sions measuring different attributes such as Financial Resources were calculated. Con-vergent validity was considered to be demonstrated when correlations between compara-ble dimensions were significantly higher than correlations between theoretically differ-ent dimensions. Correlation coefficients between 0.1 and 0.3 were considered low, thosebetween 0.31 to 0.5 moderate, and those over 0.5 were considered high.
Youth Quality of Life Instrument-Surveillance VersionThe Youth Quality of Life Instrument-Surveillance Version (YQOL-S, Topolski,Edwards & Patrick, 2001) is a 13-item generic quality of life questionnaire designed toassess quality of life among adolescents aged 11-18. The questionnaire is self-adminis-tered. The YQOL-S scores are transformed to a 0-100 scale for easy interpretability, withhigher scores indicating better QoL. The YQOL-S was included in the adolescent ques-tionnaire of all countries. The results of the YQOL-S Perceptual scale are shown in Table26.
Child Health Questionnaire The Child Health Questionnaire (CHQ) is a multidimensional generic instrument toassess the quality of life of children, which has been developed from the Medical Out-come Study (MOS, Landgraf et al., 1996). It aims to document the physical, emotional,and social well-being of children and adolescents, describing the impact of disease andhealth benefits of treatment on the child’s everyday functioning. The CHQ parent formPF-28 obtains two summary scores, one for overall physical health and one for overallpsychological health. The CHQ-PF28 was included in the parent questionnaire of allcountries. The results are shown in Table 26.
Child Health and Illness ProfileThe CHIP-AE (Starfield et al., 1995) is a generic measure of health status - rather thanHRQoL - assessed from the perspective of adolescents, aged 11-17 years. The CHIP-AEassesses five domains of health. In this study, only the questions concerning the domainSatisfaction were administered. The CHIP-AE was included in the adolescent question-naire of all countries. The results are shown in Table 26.
65
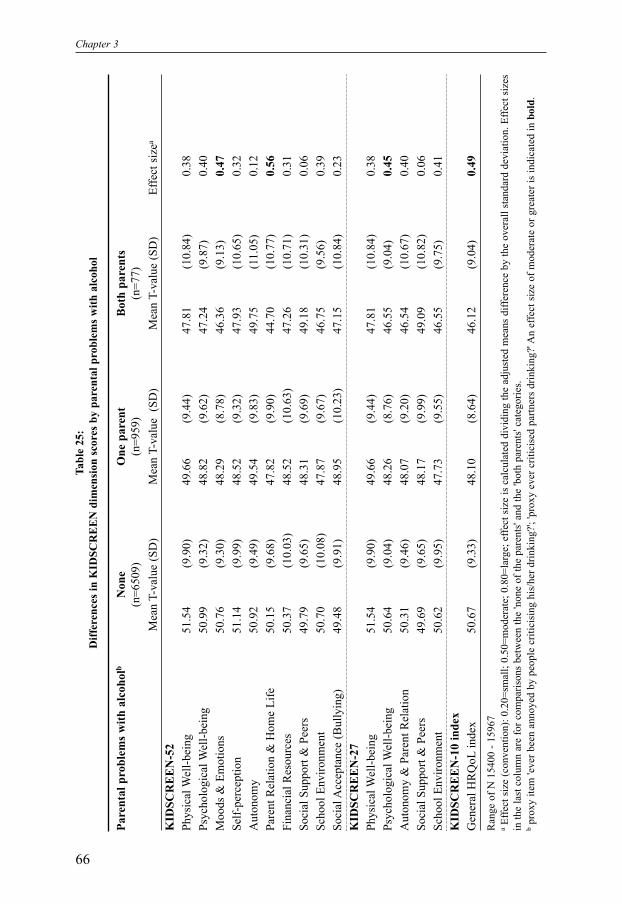
Chapter 3
66
Pare
ntal
pro
blem
s with
alc
ohol
bN
one
One
par
ent
Bot
h pa
rent
s(n
=650
9)(n
=959
)(n
=77)
Mea
n T-
valu
e (S
D)
Mea
n T-
valu
e (S
D)
Mea
n T-
valu
e (S
D)
Effe
ct s
izea
KID
SCR
EE
N-5
2Ph
ysic
al W
ell-b
eing
51.5
4 (9
.90)
49.6
6 (9
.44)
47.8
1 (1
0.84
)0.
38Ps
ycho
logi
cal W
ell-b
eing
50.9
9 (9
.32)
48.8
2 (9
.62)
47.2
4 (9
.87)
0.40
Moo
ds &
Em
otio
ns50
.76
(9.3
0)48
.29
(8.7
8)46
.36
(9.1
3)0.
47Se
lf-pe
rcep
tion
51.1
4 (9
.99)
48.5
2 (9
.32)
47.9
3 (1
0.65
)0.
32A
uton
omy
50.9
2 (9
.49)
49.5
4 (9
.83)
49.7
5 (1
1.05
)0.
12Pa
rent
Rel
atio
n &
Hom
e Li
fe50
.15
(9.6
8)47
.82
(9.9
0)44
.70
(10.
77)
0.56
Fina
ncia
l Res
ourc
es50
.37
(10.
03)
48.5
2 (1
0.63
)47
.26
(10.
71)
0.31
Soci
al S
uppo
rt &
Pee
rs49
.79
(9.6
5)48
.31
(9.6
9)49
.18
(10.
31)
0.06
Scho
ol E
nviro
nmen
t50
.70
(10.
08)
47.8
7 (9
.67)
46.7
5 (9
.56)
0.39
Soci
al A
ccep
tanc
e (B
ully
ing)
49.4
8 (9
.91)
48.9
5 (1
0.23
)47
.15
(10.
84)
0.23
KID
SCR
EE
N-2
7Ph
ysic
al W
ell-b
eing
51.5
4 (9
.90)
49.6
6 (9
.44)
47.8
1 (1
0.84
)0.
38Ps
ycho
logi
cal W
ell-b
eing
50.6
4 (9
.04)
48.2
6 (8
.76)
46.5
5 (9
.04)
0.45
Aut
onom
y &
Par
ent R
elat
ion
50.3
1 (9
.46)
48.0
7 (9
.20)
46.5
4 (1
0.67
)0.
40So
cial
Sup
port
& P
eers
49.6
9 (9
.65)
48.1
7 (9
.99)
49.0
9 (1
0.82
)0.
06Sc
hool
Env
ironm
ent
50.6
2 (9
.95)
47.7
3 (9
.55)
46.5
5 (9
.75)
0.41
KID
SCR
EE
N-1
0 in
dex
Gen
eral
HR
QoL
inde
x50
.67
(9.3
3)48
.10
(8.6
4)46
.12
(9.0
4)0.
49
Tabl
e 25
:D
iffer
ence
s in
KID
SCR
EE
N d
imen
sion
scor
es b
y pa
rent
al p
robl
ems w
ith a
lcoh
ol
Ran
ge o
f N 1
5400
- 15
967
aEf
fect
siz
e (c
onve
ntio
n): 0
.20=
smal
l; 0.
50=m
oder
ate;
0.8
0=la
rge;
effe
ct s
ize
is c
alcu
late
d di
vidi
ng th
e ad
just
ed m
eans
diff
eren
ce b
y th
e ov
eral
l sta
ndar
d de
viat
ion.
Effe
ct s
izes
in th
e la
st c
olum
n ar
e fo
r com
paris
ons
betw
een
the
'non
e of
the
pare
nts'
and
the
'bot
h pa
rent
s' ca
tego
ries.
bpr
oxy
item
'eve
r bee
n an
noye
d by
peo
ple
criti
cisi
ng h
is/h
er d
rinki
ng?';
'pro
xy e
ver c
ritic
ised
par
tner
s dr
inki
ng?'
An
effe
ct s
ize
of m
oder
ate
or g
reat
er is
indi
cate
d in
bol
d.

Psychometric Analyses and Properties of the KIDSCREEN Instruments
Strong correlation between the YQOL-S perceptual scale and the KIDSCREEN wereobserved for the dimensions Psychological Well-being, Parent Relations & Home Life,and the KIDSCREEN-10 index. Only low correlations were found between theKIDSCREEN scales and the CHQ Physical Functioning scale. Correlations between theKIDSCREEN and the CHQ Mental Health scale were highest for the KIDSCREENdimensions Psychological Well-being, Moods & Emotions, and the KIDSCREEN-10index; the effect sizes of these associations can be classified as moderate. The correlationbetween the KIDSCREEN and the CHIP Satisfaction domain was largest for the dimen-sions Physical Well-being, Psychological Well-being, Self-Perception and theKIDSCREEN-10 index, and can be classified as a strong association.
67
YQOL-S CHQ scores CHIP-AEPerceptual Physical Psychological3 Satisfaction
scale1 Functioning2 (Mental Health) domain4
r r r rKIDSCREEN-52Physical Well-being 0.41 0.25 0.25 0.59Psychological Well-being 0.61 0.12 0.34 0.58Moods & Emotions 0.56 0.12 0.33 0.52Self-perception 0.51 0.11 0.27 0.57Autonomy 0.40 0.08 0.25 0.44Parent Relation & Home Life 0.60 0.09 0.31 0.48Financial Resources 0.37 0.07 0.23 0.37Social Support & Peers 0.37 0.11 0.24 0.40School Environment 0.47 0.09 0.26 0.45Social Acceptance (Bullying) 0.24 0.06 0.16 0.24KIDSCREEN-27Physical Well-being 0.41 0.25 0.25 0.59Psychological Well-being 0.63 0.13 0.36 0.62Autonomy & Parent Relation 0.54 0.09 0.31 0.51Social Support & Peers 0.37 0.11 0.24 0.39School Environment 0.48 0.09 0.28 0.46KIDSCREEN-10 indexGeneral HRQoL index 0.61 0.15 0.35 0.63
Table 26:Convergent validity of the KIDSCREEN, Pearson correlation coefficients of the KIDSCREEN
dimensions and other HRQoL instruments
1 Range N= 10726-10867; 2 Range N=15310-15729; 3 Range N=15403-15835; 4 Range N=11682-11831. Allcorrelations are significant p=0.001; the highest correlations coefficients for each analysed questionnaires aremarked in bold.

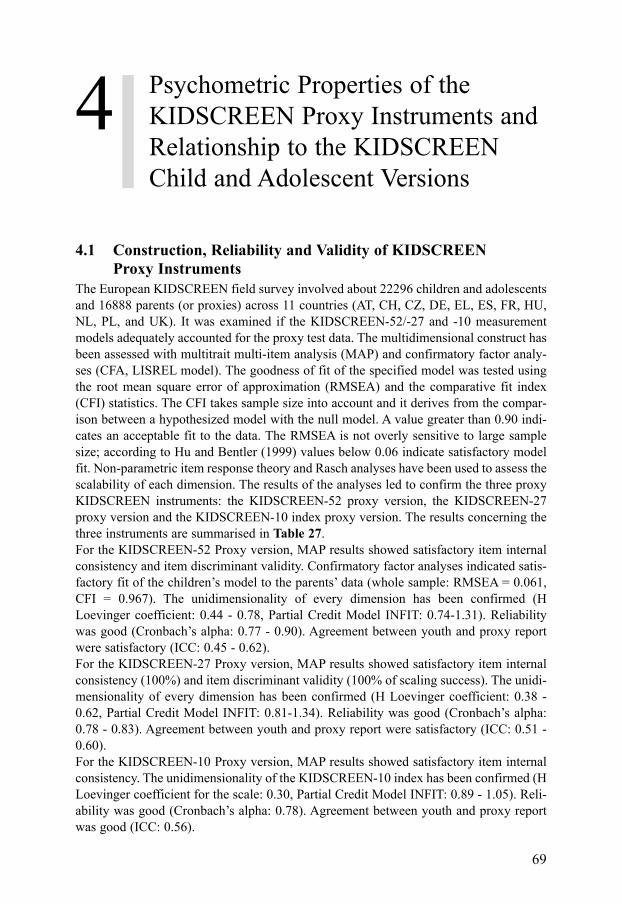
4.1 Construction, Reliability and Validity of KIDSCREEN Proxy Instruments
The European KIDSCREEN field survey involved about 22296 children and adolescentsand 16888 parents (or proxies) across 11 countries (AT, CH, CZ, DE, EL, ES, FR, HU,NL, PL, and UK). It was examined if the KIDSCREEN-52/-27 and -10 measurementmodels adequately accounted for the proxy test data. The multidimensional construct hasbeen assessed with multitrait multi-item analysis (MAP) and confirmatory factor analy-ses (CFA, LISREL model). The goodness of fit of the specified model was tested usingthe root mean square error of approximation (RMSEA) and the comparative fit index(CFI) statistics. The CFI takes sample size into account and it derives from the compar-ison between a hypothesized model with the null model. A value greater than 0.90 indi-cates an acceptable fit to the data. The RMSEA is not overly sensitive to large samplesize; according to Hu and Bentler (1999) values below 0.06 indicate satisfactory modelfit. Non-parametric item response theory and Rasch analyses have been used to assess thescalability of each dimension. The results of the analyses led to confirm the three proxyKIDSCREEN instruments: the KIDSCREEN-52 proxy version, the KIDSCREEN-27proxy version and the KIDSCREEN-10 index proxy version. The results concerning thethree instruments are summarised in Table 27.For the KIDSCREEN-52 Proxy version, MAP results showed satisfactory item internalconsistency and item discriminant validity. Confirmatory factor analyses indicated satis-factory fit of the children’s model to the parents’ data (whole sample: RMSEA = 0.061,CFI = 0.967). The unidimensionality of every dimension has been confirmed (HLoevinger coefficient: 0.44 - 0.78, Partial Credit Model INFIT: 0.74-1.31). Reliabilitywas good (Cronbach’s alpha: 0.77 - 0.90). Agreement between youth and proxy reportwere satisfactory (ICC: 0.45 - 0.62).For the KIDSCREEN-27 Proxy version, MAP results showed satisfactory item internalconsistency (100%) and item discriminant validity (100% of scaling success). The unidi-mensionality of every dimension has been confirmed (H Loevinger coefficient: 0.38 -0.62, Partial Credit Model INFIT: 0.81-1.34). Reliability was good (Cronbach’s alpha:0.78 - 0.83). Agreement between youth and proxy report were satisfactory (ICC: 0.51 -0.60). For the KIDSCREEN-10 Proxy version, MAP results showed satisfactory item internalconsistency. The unidimensionality of the KIDSCREEN-10 index has been confirmed (HLoevinger coefficient for the scale: 0.30, Partial Credit Model INFIT: 0.89 - 1.05). Reli-ability was good (Cronbach’s alpha: 0.78). Agreement between youth and proxy reportwas good (ICC: 0.56).
69
Psychometric Properties of theKIDSCREEN Proxy Instruments andRelationship to the KIDSCREENChild and Adolescent Versions
4
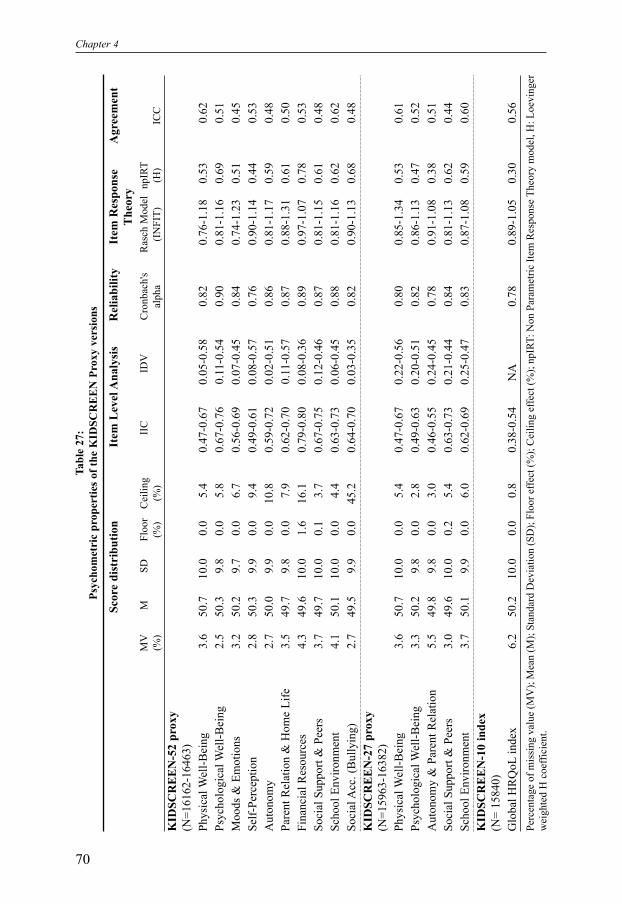
Chapter 4
Scor
e di
stri
butio
nIt
em L
evel
Ana
lysi
sR
elia
bilit
yIt
em R
espo
nse
Agr
eem
ent
The
ory
MV
MSD
Floo
rC
eilin
gII
CID
VC
ronb
ach'
sR
asch
Mod
el
npIR
T(%
)(%
)(%
)al
pha
(IN
FIT)
(H)
ICC
KID
SCR
EE
N-5
2 pr
oxy
(N
=161
62-1
6463
)Ph
ysic
al W
ell-B
eing
3.6
50.7
10.0
0.0
5.4
0.47
-0.6
70.
05-0
.58
0.82
0.76
-1.1
80.
530.
62Ps
ycho
logi
cal W
ell-B
eing
2.5
50.3
9.8
0.0
5.8
0.67
-0.7
60.
11-0
.54
0.90
0.81
-1.1
60.
690.
51M
oods
& E
mot
ions
3.2
50.2
9.7
0.0
6.7
0.56
-0.6
90.
07-0
.45
0.84
0.74
-1.2
30.
510.
45Se
lf-Pe
rcep
tion
2.8
50.3
9.9
0.0
9.4
0.49
-0.6
10.
08-0
.57
0.76
0.90
-1.1
40.
440.
53A
uton
omy
2.7
50.0
9.9
0.0
10.8
0.59
-0.7
20.
02-0
.51
0.86
0.81
-1.1
70.
590.
48Pa
rent
Rel
atio
n &
Hom
e Li
fe3.
549
.79.
80.
07.
90.
62-0
.70
0.11
-0.5
70.
870.
88-1
.31
0.61
0.50
Fina
ncia
l Res
ourc
es4.
349
.610
.01.
616
.10.
79-0
.80
0.08
-0.3
60.
890.
97-1
.07
0.78
0.53
Soci
al S
uppo
rt &
Pee
rs3.
749
.710
.00.
13.
70.
67-0
.75
0.12
-0.4
60.
870.
81-1
.15
0.61
0.48
Scho
ol E
nviro
nmen
t4.
150
.110
.00.
04.
40.
63-0
.73
0.06
-0.4
50.
880.
81-1
.16
0.62
0.62
Soci
al A
cc. (
Bul
lyin
g)2.
749
.59.
90.
045
.20.
64-0
.70
0.03
-0.3
50.
820.
90-1
.13
0.68
0.48
KID
SCR
EE
N-2
7 pr
oxy
(N
=159
63-1
6382
)Ph
ysic
al W
ell-B
eing
3.6
50.7
10.0
0.0
5.4
0.47
-0.6
70.
22-0
.56
0.80
0.85
-1.3
40.
530.
61Ps
ycho
logi
cal W
ell-B
eing
3.3
50.2
9.8
0.0
2.8
0.49
-0.6
30.
20-0
.51
0.82
0.86
-1.1
30.
470.
52A
uton
omy
& P
aren
t Rel
atio
n5.
549
.89.
80.
03.
00.
46-0
.55
0.24
-0.4
50.
780.
91-1
.08
0.38
0.51
Soci
al S
uppo
rt &
Pee
rs3.
049
.610
.00.
25.
40.
63-0
.73
0.21
-0.4
40.
840.
81-1
.13
0.62
0.44
Scho
ol E
nviro
nmen
t3.
750
.19.
90.
06.
00.
62-0
.69
0.25
-0.4
70.
830.
87-1
.08
0.59
0.60
KID
SCR
EE
N-1
0 in
dex
(N
= 15
840)
Glo
bal H
RQ
oLin
dex
6.2
50.2
10.0
0.0
0.8
0.38
-0.5
4N
A0.
780.
89-1
.05
0.30
0.56
70
Tabl
e 27
:Ps
ycho
met
ric
prop
ertie
s of t
he K
IDSC
RE
EN
Pro
xy v
ersi
ons
Perc
enta
ge o
f mis
sing
val
ue (M
V);
Mea
n (M
); St
anda
rd D
evia
tion
(SD
); Fl
oor e
ffect
(%);
Cei
ling
effe
ct (%
); np
IRT:
Non
Par
amet
ric It
em R
espo
nse
Theo
ry m
odel
, H: L
oevi
nger
wei
ghte
d H
coe
ffici
ent.

Psychometric Properties of the KIDSCREEN Proxy Instruments
These promising tools enable the exploration of the relationship between self-reportedand proxy HRQoL measurements in European children and adolescents. Furthermore,they enable the study of opportunities, restrictions, and uses of proxy scores in additionto self-reports.
4.2 Relationship between Child and Parent DataMultitrait-multimethod (MTMM) analysis of the children-proxy correlations between thedifferent versions of the KIDSCREEN instruments was used to evaluate the degree ofconvergence and discrimination between children and proxy scores (Sneeuw et al, 1998).The MTMM matrices are presented in Table 28 and Table 29.The MTMM matrix showed positive correlations between the proxy instrument scoresand the scale scores of the children’s version in KIDSCREEN-52, and convergent valid-ity was achieved. All correlation coefficients representing a monotrait-heteromethodwere significantly different and higher than 0 for all of the ten dimensions (r ranged from0.48 to 0.64, p<0.001). All coefficients representing a monotrait-heteromethod are high-er than other correlations of this trait, with other coefficients measured by other methods(heterotrait-heteromethods). All heterotrait triangles presented about the same pattern.The average correlation between children and proxy scores on corresponding measureswas calculated as well as the average off-diagonal correlation (i.e. correlations betweenchildren and proxy scores on different HRQoL domains). The average correlationbetween children and proxy scores for corresponding domains (average r = 0.46) washigher than that for diverging domains (average r = 0.25).The MTMM matrix of the KIDSCREEN-27 showed positive correlations between theproxy instrument scores and the scale scores of the children and adolescent’s version.Convergent validity was achieved. All correlation coefficients representing a monotrait-heteromethod were significantly different and higher than 0 for all of the 5 dimensions (rranged from 0.47 to 0.61, p<0.001). All coefficients representing a monotrait-het-eromethod were higher than other correlations of this trait, with other coefficients meas-ured by other methods (heterotrait-heteromethods). All heterotrait triangles presentedabout the same pattern. The average correlation between children and proxy scores forcorresponding domains (average r = 0.55) was higher than that for diverging domains(average r = 0.31). The correlation between the self report and the proxy version of the KIDSCREEN-10index achieved the value of 0.57.
71

Chapter 4
72
Ch
ild
ren
Pa
ren
ts
Physical Well-being
Psychological Well-being
Moods & Emotions
Self-Perception
Autonomy
Parent Relation & Home
Life
Financial Resources
Social Support & Peers
School Environment
Social Acceptance
(Bullying)
Physical Well-being
Psychological Well-being
Moods & Emotions
Self-Perception
Autonomy
Parent Relation & Home
Life
Financial Resources
Social Support & Peers
School Environment
Social Acceptance
(Bullying)
Phy
sica
l W
ell-
bei
ng
1
.00
Psy
cho
log
ical
Wel
l-bei
ng
0
.59
1
.00
Mo
od
s &
Em
oti
on
s 0
.45
0
.66
1
.00
Sel
f-P
erce
pti
on
0
.46
0
.52
0
.55
1
.00
Au
ton
om
y
0.4
0
0.5
2
0.4
3
0.4
1
1.0
0
Par
ent
Rel
atio
n &
Ho
me
Lif
e 0
.40
0.5
8
0.5
0
0.4
9
0.5
0
1.0
0
Fin
anci
al R
eso
urc
es
0.2
6
0.3
3
0.2
8
0.2
8
0.3
9
0.3
9
1.0
0
So
cial
Su
pp
ort
& P
eers
0
.38
0
.50
0
.35
0
.28
0
.47
0
.39
0
.32
1
.00
Sch
oo
l E
nvir
onm
ent
0.4
2
0.5
5
0.4
5
0.4
4
0.3
9
0.5
1
0.3
2
0.3
4
1.0
0
Children
So
cial
Acc
epta
nce
(B
ull
yin
g)
0.1
1
0.1
7
0.3
2
0.2
2
0.1
3
0.1
6
0.1
9
0.2
2
0.1
2
1.0
0
Phy
sica
l W
ell-
bei
ng
0.6
1
0.4
1
0.3
0
0.3
4
0.3
1
0.3
0
0.2
0
0.2
9
0.3
0
0.0
6
1
.00
Psy
cholo
gic
al W
ell-
bei
ng
0.3
7
0.5
2
0.3
8
0.3
4
0.3
5
0.4
1
0.2
6
0.3
3
0.3
6
0.1
2
0
.58
1
.00
Mo
od
s &
Em
oti
on
s 0
.27
0
.35
0
.46
0
.31
0
.21
0
.31
0
.15
0
.21
0
.28
0
.21
0.3
7
0.5
7
1.0
0
Sel
f-P
erce
pti
on
0
.33
0
.36
0
.34
0
.55
0
.26
0
.33
0
.20
0
.20
0
.29
0
.13
0.4
1
0.4
7
0.4
8
1.0
0
Au
ton
om
y
0.2
3
0.3
0
0.2
1
0.2
0
0.4
9
0.2
4
0.2
3
0.2
8
0.1
8
0.0
3
0
.32
0
.42
0
.24
0
.31
1
.00
Par
ent
Rel
atio
n &
Ho
me
Lif
e 0
.25
0
.35
0
.28
0
.29
0
.29
0
.51
0
.23
0
.24
0
.31
0
.08
0.3
9
0.6
1
0.4
6
0.4
8
0.4
0
1.0
0
Fin
anci
al R
eso
urc
es
0.1
9
0.2
5
0.1
6
0.1
9
0.2
5
0.2
4
0.5
3
0.2
1
0.2
4
0.0
6
0
.29
0
.36
0
.18
0
.28
0
.37
0
.35
1
.00
So
cial
Su
pp
ort
& P
eers
0
.24
0
.33
0
.21
0
.17
0
.31
0
.24
0
.21
0
.50
0
.20
0
.16
0.3
9
0.5
2
0.3
1
0.2
9
0.4
7
0.4
3
0.3
3
1.0
0
Sch
oo
l E
nvir
onm
ent
0.2
8
0.3
7
0.3
1
0.2
9
0.2
4
0.3
5
0.2
5
0.2
3
0.6
4
0.0
9
0
.38
0
.51
0
.42
0
.39
0
.27
0
.47
0
.33
0
.33
1
.00
Parents
So
cial
Acc
epta
nce
(B
ull
yin
g)
0.0
6
0.0
8
0.1
8
0.0
7
0.0
2
0.0
5
0.0
9
0.1
5
0.0
4
0.4
8
0
.13
0
.20
0
.39
0
.24
0
.08
0
.17
0
.11
0
.23
0
.15
1
.00
Tabl
e 28
:M
TM
M P
ears
on c
orre
latio
ns b
etw
een
the
child
and
par
ent r
epor
ts fo
rth
e K
IDSC
RE
EN
-52
vers
ion
Ran
ge N
=156
30-2
2133
. In
bold
: dia
gona
l val
idity
: mon
otra
it-he
tero
met
hod.
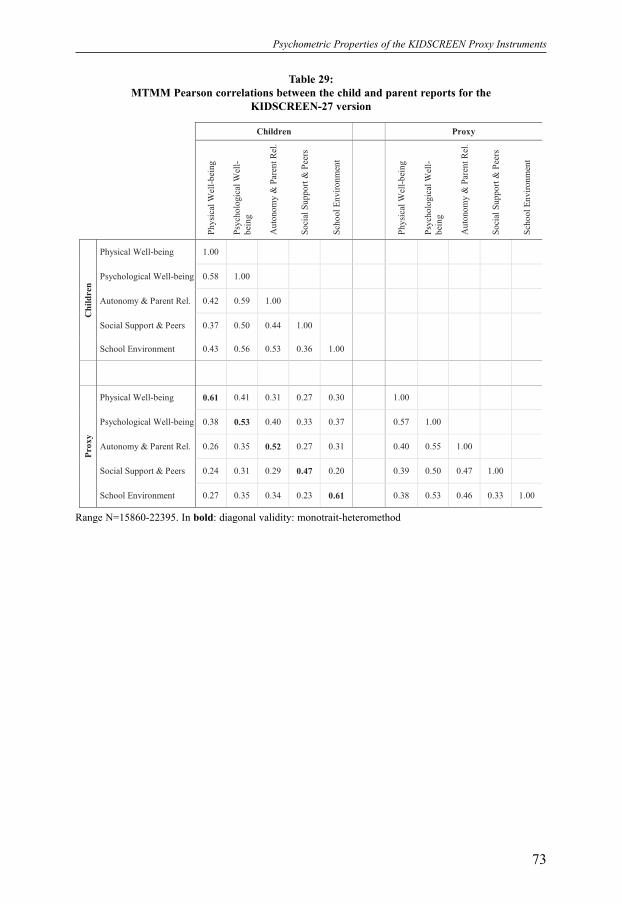
Psychometric Properties of the KIDSCREEN Proxy Instruments
73
Table 29:MTMM Pearson correlations between the child and parent reports for the
KIDSCREEN-27 version
Children Proxy
Ph
ysi
cal
Wel
l-b
eing
Psy
cho
logic
al W
ell-
bei
ng
Au
tono
my
& P
aren
t R
el.
So
cial
Su
pp
ort
& P
eers
Sch
ool
En
vir
on
men
t
Ph
ysi
cal
Wel
l-b
eing
Psy
cho
logic
al W
ell-
bei
ng
Au
tono
my
& P
aren
t R
el.
So
cial
Su
pp
ort
& P
eers
Sch
ool
En
vir
on
men
t
Physical Well-being 1.00
Psychological Well-being 0.58 1.00
Autonomy & Parent Rel. 0.42 0.59 1.00
Social Support & Peers 0.37 0.50 0.44 1.00
Ch
ild
ren
School Environment 0.43 0.56 0.53 0.36 1.00
Physical Well-being 0.61 0.41 0.31 0.27 0.30
1.00
Psychological Well-being 0.38 0.53 0.40 0.33 0.37
0.57 1.00
Autonomy & Parent Rel. 0.26 0.35 0.52 0.27 0.31
0.40 0.55 1.00
Social Support & Peers 0.24 0.31 0.29 0.47 0.20
0.39 0.50 0.47 1.00
Pro
xy
School Environment 0.27 0.35 0.34 0.23 0.61
0.38 0.53 0.46 0.33 1.00
Range N=15860-22395. In bold: diagonal validity: monotrait-heteromethod


5.1 General Description and Aim of the KIDSCREEN Instruments
The KIDSCREEN instruments assess relevant dimensions of health-related quality oflife in children and adolescents aged 8-18 years. The KIDSCREEN instruments are afamily of generic measures, are applicable in different national and cultural contexts,comply with quality standards in instrument development, and are practical (i.e. shortand easy to use). The instruments result in a profile describing HRQoL (KIDSCREEN-52 and KIDSCREEN-27) and a global HRQoL score (KIDSCREEN-10 index) respec-tively and fulfil the assumptions of the Rasch model. The measures are available in Eng-lish (British and Irish English), German (Austrian, German, and Swiss versions), Dutch,French, Spanish, Polish, Czech, Hungarian, Greek and Swedish. Other language versionsare in preparation (e.g. American English, Flanders (Belgium), Italian, Korean, Norwe-gian, Portuguese (Portugal, Brazil), Spanish (Chile, Colombia)) and will be provided atthe project website (http://www.kidscreen.org). The KIDSCREEN instruments can beused in representative mail and telephone surveys with children and parents to obtain ref-erence data. The cross-cultural KIDSCREEN instruments can be used for research pur-poses in health services and health monitoring. It is expected that the instruments willcontribute to a better understanding of perceived health in children and adolescents inEurope and will contribute to planning, carrying out and evaluating innovations in thehealth care field.
5.2 The KIDSCREEN-52 (long Version)The KIDSCREEN-52 allows detailed profile information for the following ten Rasch-scaled HRQoL dimensions: Physical Well-being, Psychological Well-being, Moods &Emotions, Self-Perception, Autonomy, Parent Relation & Home Life, FinancialResources, Social Support & Peers, School Environment, Social Acceptance (Bullying).Definitions of dimensions and interpretation guidelines for low and high scores of theKIDSCREEN dimensions are given in Chapter 7 in this manual.The KIDSCREEN-52 was constructed for research purposes and should be used ifhealth-related quality of life is the main objective of investigation. Its use is recommend-ed when more detailed insight is needed into how the HRQoL of children vary in the dif-ferent dimensions.Cronbach’s alphas were calculated for the ten KIDSCREEN dimensions and range satis-factorily between 0.76 (Social Acceptance) and 0.89 (Financial Support). Convergentand discriminant validity were tested using information about the children’s and adoles-cents’ physical (Children with Special Health Care Needs screener for parents, CSHCN,Bethell et al., 2002b) and mental health (Strength and Difficulties Questionnaire, SDQ,Goodman et al., 2000). For example, correlations up to 0.55 were found when correlat-
75
Description of the KIDSCREENinstruments 5

Chapter 5
ing the KIDSCREEN dimensions with the frequency of physical complaints. In additionto this, in each country the relationship between national HRQoL instruments for chil-dren and adolescents and the KIDSCREEN versions were analysed and showed overallsatisfactory results.
5.3 The KIDSCREEN-27 (short Version)The KIDSCREEN-27 was developed as a shorter version of the KIDSCREEN-52 with aminimum of information loss and with good psychometric properties. It can be used inbroader epidemiological studies and also as a short screening instrument among childrenwith a chronic illness for whom disease-specific issues are of importance. TheKIDSCREEN-27 represents the original ten dimensions merged into 5 dimensions,allowing detailed profile information for Physical Well-being, Psychological Well-being,Autonomy & Parent Relation, Social Support & Peers, School Environment. It should beaccepted for the short version that different dimensions of the longer research versionmeasure the same constructs. Definitions of dimensions and interpretation guidelines forlow and high scores of the KIDSCREEN dimensions are given in Chapter 7 in this man-ual.The KIDSCREEN-27 fulfils specific validity requirements, e.g. it detects socioeconom-ic, mental and physical health status differences in the same way as the KIDSCREEN-52: It predicts health care utilisation and health behaviour. Gender and age differencescould be also detected. An indicator for the convergent and discriminant validity is that,a correlation with the parent-child relation, but not with the parental health status, can befound. Thus the validity of the short version can be demonstrated in the same way as forthe KIDSCREEN-52.
5.4 The KIDSCREEN-10 IndexFor the development of the KIDSCREEN-10 index, items were derived from the 27-itemversion. The good internal consistency reliability (Cronbach’s alpha = 0.82) and the goodtest-retest reliability/stability (r = 0.73; ICC = 0.72) enable a precise and stable HRQoLmeasurement. Additional statistical analyses show that the KIDSCREEN-10 index is ableto differentiate between groups. Children and adolescents with a low score on the fami-ly affluence scale (FAS, effect size d = 0.47), with behavioural problems (SDQ, effectsize d = 1.30) and with a high number of psychosomatic complaints (d = 1.69) displayeda significantly lower health-related quality of life in comparison to the respective com-parison group. The KIDSCREEN-10 index results in one global HRQoL score and is rec-ommended for use in large (epidemiological) surveys. Interpretation for low and highscores of the global KIDSCREEN-10 index is given in Chapter 7.
5.5 The KIDSCREEN Proxy VersionsThe three different KIDSCREEN versions have led to three KIDSCREEN proxy ques-tionnaires, in which parents or caregivers are asked to assess the degree of HRQoL in dif-ferent dimensions from the perspective of the child and adolescent. The KIDSCREENproxy versions correspond in scale structure with the child and adolescent versions. Theyconsist of similar items, but ask the parent to answer how they think their child feels.
76

Description of the KIDSCREEN instruments
Proxy measures of HRQoL are in general a useful and practical alternative for assessinga youth’s HRQoL, especially if a self-report can be considered to be unreliable or impos-sible to obtain in certain situations: for example when the child or adolescent lacks thelinguistic and cognitive skills required to complete a questionnaire or he/she has a dra-matic clinical condition. In such cases, proxy ratings can be the only information avail-able and should be considered a substitute for children’s HRQoL measure. However,when children’s self-report and proxy ratings are both available, the proxy report shouldbe considered as complementary information. In this case, the relationships between selfand proxy report should be explored further and can give valuable information about dif-ferent points of view.
5.6 The KIDSCREEN Computer VersionTo improve health-related quality of life assessment of children and adolescents is amajor goal of the KIDSCREEN project. The KIDSCREEN computer version emergedfrom the desire to develop a computer-assisted, child-friendly and economical methodfor measuring health-related quality of life in children and adolescents, and one whichwas adapted to the particular stage of development and age of the respondents. The KIDSCREEN computer program is based on the paper-and-pencil versions of theKIDSCREEN health questionnaires. All three KIDSCREEN child and adolescent ver-sions (KIDSCREEN-52, KIDSCREEN-27 and KIDSCREEN-10 Index) can be adminis-tered in 13 several European languages: Czech, Dutch, English (UK, IRL), French, Ger-man (D, CH, A), Greek, Hungarian, Spanish, Polish and Swedish.
Time requiredThe time required for completing the KIDSCREEN computer program ranges between10 and 20 minutes, depending on the age of the child or adolescent. There is no time lim-it for completing the questionnaire. The questionnaire is designed such that all questionshave to be answered before the questionnaire can be closed and the data analysed.
Data analysisThe data analysis in the KIDSCREEN computer program is presented as a profile. Itemsare automatically recoded by the program. The scores on the various sub-scales are dis-played as a diagram. Reference values for the profile are graphically displayed for theindividual items. In addition the child's answers to the questions are automatically storedas text files and can therefore be opened using virtually any word or data processing pro-gram. An SPSS syntax can be provided upon written request.
System requirementsThe KIDSCREEN computer program is suitable for the operating systems Windows 95or higher, as well as for MacOS 8 or higher. If these requirements are fulfilled, the pro-gram will start automatically when the disc of the KIDSCREEN computer version isplaced in the computer's CD-ROM drive. For the completion of the KIDSCREEN ques-tionnaires a keyboard and mouse are required.
The KIDSCREEN computer version software is distributed via the KIDSCREEN webpage: www.kidscreen.org. This page consists of general information and a user section
77
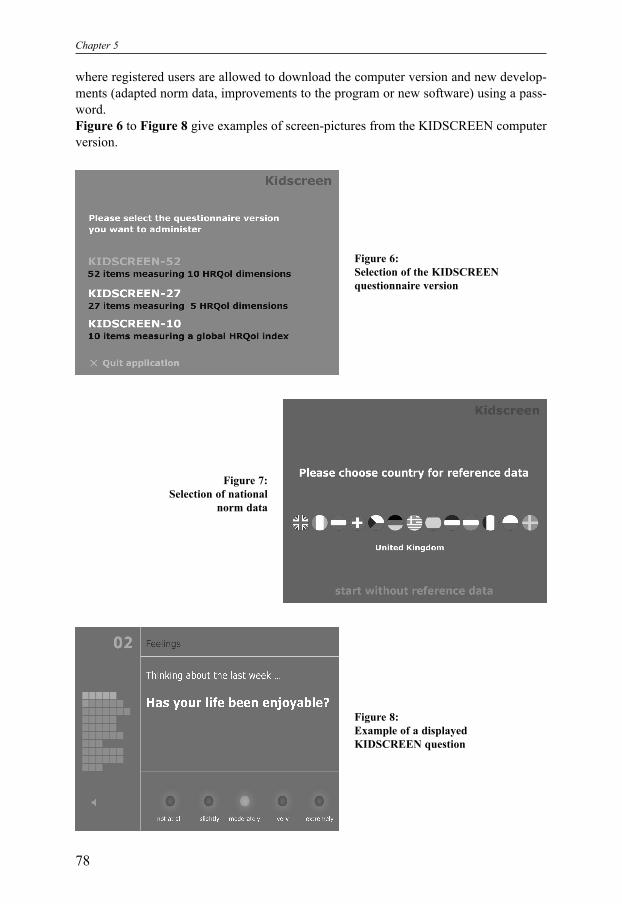
Chapter 5
where registered users are allowed to download the computer version and new develop-ments (adapted norm data, improvements to the program or new software) using a pass-word.Figure 6 to Figure 8 give examples of screen-pictures from the KIDSCREEN computerversion.
78
Figure 6:Selection of the KIDSCREEN questionnaire version
Figure 8:Example of a displayed KIDSCREEN question
Figure 7:Selection of national
norm data

The KIDSCREEN instruments were developed to gain information about children’s andadolescents’ well-being and health-related quality of life. In the development phase, itwas of great importance to include items of relevance and importance for children andadolescents that reflect their reality, environment, and language. In addition, it wasimportant to use answer categories with time frames which are understandable, manage-able, and easy to answer for the wide age range of children (8-18 years of age). The threedifferent versions are designed to be administered to children and adolescents and to aparent or caregiver who has day-to-day contact with the child in question. The questionnaires can be completed at home, in a classroom, and in other settings. TheKIDSCREEN instruments can also be administered by telephone, face-to-face inter-views, mailed questionnaires or via internet. However one should bear in mind that thereference data provided with this manual are sampled via mailed questionnaires.
6.1 Suggestions for Administration An administrator of the KIDSCREEN instrument should be experienced in administer-ing questionnaires to children and adolescents. In the case of questionnaires administeredby an interviewer, the willingness of children and adolescents to answer the questionnairehonestly should be encouraged (Bortz & Döring, 2002).National ethical aspects and safety regulations (e.g. data protection) should be followedwhen administering the KIDSCREEN instruments. Families must be informed about theaims of the study and have to be given information about the questionnaire either in writ-ten form or by telephone. In many countries, an informed written consent by parents andtheir child is obligatory. In addition, the families have to be assured that their data willbe handled confidentially. If possible, anonymity of data should be guaranteed; other-wise, for example, in clinical studies one should be aware that observed differences withthe reference group might occur solely because of answering the questions not anony-mously. In addition, the child should be able to read (primary school level) and write ade-quately in order to be able to fill in the questionnaire themselves, without discussion withothers. If both the self-assessment and the parent/proxy version are administered, theimportance of answering the questionnaire independently from each other should bepointed out.Children and adolescents should be informed that the questionnaire is not an exam andthat there are no wrong answers. Children and adolescents should be assured that theirsubjective opinion of their state of health is important. They should be encouraged toanswer each question and multiple responses should be discouraged. They should also beassured that the answers they provide will not be known by their parents, caregivers, orother significant individuals. The children and adolescents should feel safe and relaxedwhile completing the KIDSCREEN questionnaire.
79
Administration of the KIDSCREENversions6
Chapter 6
6.2 Time to Complete
The three KIDSCREEN versions require different amounts of time to be completed bychildren and adolescents. Overall, for younger children or children and adolescents withreduced reading abilities, it will take longer to complete the questionnaire. There shouldbe no time restriction for completion of the questionnaire. – The KIDSCREEN-52 requires 15-20 minutes to be filled in. – The KIDSCREEN-27 requires 10-15 minutes to be filled in.– The KIDSCREEN-10 index version requires approximately 5 minutes to be complet-
ed.– The proxy versions require approximately the same amount of time to be completed.
6.3 Technical Issues For researchers who decide to use the KIDSCREEN instrument or to include it in theirstudy, the subsequent requirements apply:– The whole KIDSCREEN instrument (KIDSCREEN-52, KIDSCREEN-27, or
KIDSCREEN-10 index) should be used as opposed to selecting certain items. The useof single dimensions or scales is permitted.
– The items should appear in the same order as in this manual and on the standardforms.
– No other items e.g. taken from other instruments should be inserted between theKIDSCREEN items.
– The KIDSCREEN versions and items shall not be modified, shortened, condensed,adapted, or transformed in any manner or form, including but not limited to anyminor or significant change in wordings, without the prior written agreement of theKIDSCREEN group.
– The answer categories have to contain the same wording and number of answer box-es; for children, larger answer boxes may be used.
– The original layout of the questionnaire should be used (for example, use 12 pt font).– Additional graphics should not be included.
The national reference data of this manual will not be applicable if these guidelines arenot adhered to. Questionnaires can be downloaded after registration from the “MembersOnly” area of the KIDSCREEN website (http://www.kidscreen.org).
80

7.1 Scoring of the KIDSCREEN Questionnaires
The items of the KIDSCREEN versions fulfil the assumptions of the Rasch model (uni-dimensionality, homogeneity of items and persons, sufficiency of the sum score). Thus,they can be scored as Rasch scales (see excursus below). To make the interpretation moreapplicable, the scores of the Rasch scales are translated into T-values.Two methods for scoring the KIDSCREEN items are provided: – The first way can be chosen if data have to be handled “by hand” or with any appro-
priate software.– The second possibility is applicable if the statistical software package SPSS is avail-
able.
For both alternatives, the first step is to recode negatively formulated items. Most of theitems are formulated positively and in concordance is the scoring, which means a higherscore reflects a higher HRQoL. However, some items are formulated negatively and as aconsequence the scoring has to be recoded. A list of the items to be recoded is given inTable 30.
Steps for scoring “by hand”:1. Code the response choices according to the rules specified in the file “item variable
names KIDSCREEN-xx.pdf”2. Recode the negatively formulated items (see Table 30) to have scorings from 1 to 5
with higher values indicating a higher HRQoL. 3. Sum up the item scores of the respective scale (scale raw scores). Note: Only values
from persons with complete data, with every item of the scale answered, can besummed up.
4. Search and display/print out the corresponding SPSS syntax stored in Appendix A9(on the disc; also stored as pdf and txt documents) and transform the scale raw scoreby hand (using the information stored in the corresponding SPSS syntax respectivelyword document) into Rasch person parameter estimates [e.g. “(15 = 0.134)”] and T-values [e.g. “(((…0.134…- 1.2203) / 1.45408) * 10 + 50)” = 42.53]
Steps for scoring with the use of the SPSS program (for SPSS syntax, see AppendixA9 on the disc):1. Code the response choices according to the rules specified in the file “item variable
names KIDSCREEN-xx.pdf” and enter them into the file “KIDSCREEN-xx datamask SELFREPORT.sav” or “KIDSCREEN-xx data mask PROXY.sav”
81
Scoring and Interpretation of theKIDSCREEN Questionnaires7

Chapter 7
2. Recode the negatively formulated items to have scorings from 1 to 5 with higher val-ues indicating a higher HRQoL using the SPSS syntax “transform_KIDSCREEN-xx_rawdata.SPS”.
3. Sum up the items of the respective scale using the SPSS syntax “SELFREPORT inter-national T-values RASCH KIDSCREEN-xx.SPS” respectively “PROXY internation-al T-values RASCH KIDSCREEN-xx.SPS”. Note: Only for cases without missingdata the item-scores can be summed up (for scoring despite missing values seebelow).
4. Exchange the resulting scale values for the provided Rasch person parameter esti-mates using the SPSS syntax.
5. Transform the resulting Rasch person parameter estimates into z-values and then intoT-values using the SPSS syntax. The values are based on data from the internationalsurvey sample from twelve European countries.
Either of these methods leads to T-values with scale means around 50 and standard devi-ations around 10 with higher values indicating higher HRQoL.
Excursus: The Rasch model assumes that both persons and items can be ordered on the samecontinuum (unidimensional latent trait). The location of a person is specified by one parameter,the person location (e.g. individual HRQoL parameter value). The location of an item is speci-fied by one or more parameters, usually called threshold parameters. Both types of parameters
82
Instrument Domain No. Item
KIDSCREEN-52 Physical Well-being 1 In general, how would you say your health is?
Moods & Emotions 1 Have you felt that you do everything badly?
2 Have you felt sad?
3 Have you felt so bad that you didn’t want to do anything?
4 Have you felt that everything in your life goes wrong?
5 Have you felt fed up?
6 Have you felt lonely?
7 Have you felt under pressure?
Self-Perception 3 Have you been worried about the way you look?
4 Have you felt jealous of the way other girls and boys look?
5 Would you like to change something about your body?
Social Acceptance (Bullying) 1 Have you been afraid of other girls and boys?
2 Have other girls and boys made fun of you?
3 Have other girls and boys bullied you?
KIDSCREEN-27 Physical Well-being 1 In general, how would you say your health is?
Psychological Well-being 4 Have you felt sad?
5 Have you felt so bad that you didn’t want to do anything?
6 Have you felt lonely?
KIDSCREEN-10 index 3 Have you felt sad?
4 Have you felt lonely?
Table 30:KIDSCREEN items to be recoded into values between 1-5
(higher values indicating a better HRQoL)

Scoring and Interpretation of the KIDSCREEN Questionnaires
are estimated using Rasch analysis applied to a reference data set. If the Rasch model fits, thedifferences between the person estimates can be interpreted on an interval scale. The item thresh-old parameters define how the probability on each response category of the item varies with thecontinuum. The mean of the continuum is usually set to 0 and its standard deviation to 1. Underthe Rasch model, the person-parameter value is a non-linear transformation of the sum score. Inthe middle area of the continuum, the person parameter values and the sum score have an almostlinear relation, but at the extremes the person parameter value varies faster than the person’s sumscore.
It is possible to score the KIDSCREEN scales despite the occurrence of missing values.If one item per scale (except the 3-item scales KIDSCREEN-52 Social Acceptance andFinancial Resources) is left unanswered, the psychometric information issued from theremaining items can be used to estimate the respondent’s trait parameter value. Remem-ber that this can only be done by using the SPSS program. If more than one item per scaleis left unanswered, the calculation of scores is not possible at all.
Steps for scoring the self-reports despite missing values with the use of the SPSSprogram (for SPSS syntax, see Appendix A9 on the disc):1. Code the response choices according to the rules specified in the file “item variable
names KIDSCREEN-xx.pdf” and enter them into the file “KIDSCREEN-xx datamask SELFREPORT.sav” or “KIDSCREEN-xx data mask PROXY.sav”
2. Recode the negative formulated items to have scorings from 1 to 5 with higher val-ues indicating a higher HRQoL using the SPSS syntax “transform_KIDSCREEN-xx_rawdata.SPS”.
3. Sum up the items of the respective scale using the SPSS syntax “Missing Value SELFREPORT KIDSCREEN-xx.SPS”. Note: The syntax does this automatically ifonly one item per scale is left unanswered.
4. Exchange the resulting scale values for the provided Rasch person parameter esti-mates using the SPSS syntax for missing values.
5. Transform the resulting Rasch person parameter estimates into z-values and then intoT-values using the SPSS syntax for missing values. The values are based on data fromthe international survey sample from twelve European countries.
These steps lead to T-values with scale means of 50 and a standard deviation of 10 withhigher values indicating higher HRQoL.
Excursus: If a given set of items fulfil the Rasch model assumptions, the estimation of the item’slocation on the unidimensional latent trait is independent from the actual sample. Additionally,the estimation of the person’s location on the latent trait is independent of the actual selection ofitems (specific objectivity [Rasch, 1977]). This desirable feature of the Rasch model allows forscore estimation despite missing values and leads to results superior to other procedures treatingmissing values (Huisman & Goudriaan, 2001).
Note: Although it is possible to calculate a scale score if at least all but one items of the scaleare answered, regardless of how many items have been left unanswered in other scales, it isstrongly recommended to check for the reasons of high missing answer rates. If there are doubtsabout the reliability of any answers, none of the scores should be calculated. As a general rule,
83
Chapter 7
no values should be calculated if the responder has left more than 25% of all KIDSCREEN itemsunanswered.
7.2 Interpretation of KIDSCREEN DimensionsFor the interpretation of the KIDSCREEN scores, the content of the scales has to be con-sidered. The basic information about the scales is given by their definitions. In additionto the scale definitions, interpretations for very low or very high scores of every scale areprovided in Table 31. These characteristics specify the range of the dimension by itsextreme ends. Rasch model person parameter estimates (see excursus above) offer a further possibilityfor interpreting KIDSCREEN scores: The particular person parameter is interpreted inrelation to the location of the answer categories of the items on the latent trait continu-um.
7.3 Interpretation of Differences in ScoresThe KIDSCREEN scores can be interpreted in three basic ways:– Comparison between group scores on KIDSCREEN scales and the reference popula-
tion– Interpretation of the person parameter estimates using the Rasch model– Interpretation of the KIDSCREEN profile
The first possibility for interpretation can be convenient for many purposes. The groupscore on a particular KIDSCREEN scale can be compared with the average score of theadequate reference population on that scale. Specific reference populations are availableby country, gender and two age groups in the reference tables in the Appendices (e.g.KIDSCREEN scores of a group of 10 to 11 year old girls can be compared with thescores of the female children in the reference tables). Scores in a defined range aroundthe mean can be judged as average scores. Groups with scores below this threshold haveto be rated as groups with low HRQoL in the specific aspect of the respective scale. Agroup with such results would require special attention to detect the reasons for this lowmean. The HRQoL of a group with a higher value than the given threshold can be ratedas high.Thresholds for classifying test-values as e.g. “normal” or “noticeable” have to be consid-ered which may be dependent on the context of a study. As a guiding principle, the sug-gested thresholds can be recommended to be fixed at a value of the mean, plus or minushalf a standard deviation. For the whole international survey sample the resulting rangewould be 45 to 55 (50 +/- 0.5*10). For age groups, gender and/or country specific groups,the range can be computed by applying the provided values in the Appendices. Therationale for this recommendation lies in statistical considerations. A group with a meanof the defined threshold shows a difference of medium effect size relative to the popula-tion mean. Such a difference reaches statistical significance if a sample size of 50 isexceeded. In the range from mean minus half a standard deviation to mean plus half astandard deviation, 38% of persons of a normal distributed sample are included. Belowthis threshold, 31% of the persons with the lowest values can be found, above this thresh-old the 31% highest values are located. As a rule of thumb the sample is divided in three
84

Scoring and Interpretation of the KIDSCREEN Questionnaires
85
KID
SCR
EE
N-5
2di
men
sion
sD
efin
ition
Low
Sco
reH
igh
Scor
e
Phys
ical
W
ell-b
eing
Psyc
holo
gica
l W
ell-b
eing
Moo
ds &
Em
otio
ns
Self-
Perc
eptio
n
This
dim
ensi
on e
xplo
res
the
leve
l of t
he c
hild
's/ad
oles
cent
's ph
ysic
al a
ctiv
ity, e
nerg
yan
d fit
ness
. Lev
el o
f phy
sica
l act
ivity
is e
xam
ined
with
refe
renc
e to
the
child
's/ad
o-le
scen
t's a
bilit
y to
get
aro
und
the
hom
e an
d sc
hool
, and
to p
lay
or d
o ph
ysic
ally
dem
andi
ng a
ctiv
ities
suc
h as
spo
rts, s
ince
a c
hild
's/ad
oles
cent
's im
pairm
ent d
oes
also
affe
ct p
hysi
cal a
ctiv
ity. T
he d
imen
sion
als
o lo
oks
at th
e ch
ild's/
adol
esce
nt's
capa
city
for l
ivel
y or
ene
rget
ic p
lay.
In a
dditi
on, t
he e
xten
t to
whi
ch a
chi
ld o
r ado
lesc
ent f
eels
unw
ell a
nd c
ompl
ains
of p
oor h
ealth
is e
xam
ined
.
This
dim
ensi
on e
xam
ines
the
psyc
holo
gica
l wel
l-bei
ng o
f the
chi
ld/a
dole
scen
t inc
lud-
ing
posi
tive
emot
ions
and
sat
isfa
ctio
n w
ith li
fe. I
t spe
cific
ally
reve
als
the
posi
tive
perc
eptio
ns a
nd e
mot
ions
exp
erie
nced
by
the
indi
vidu
al. T
he q
uest
ions
look
at h
owm
uch
a ch
ild/a
dole
scen
t exp
erie
nces
pos
itive
feel
ings
suc
h as
hap
pine
ss, j
oy, a
ndch
eerf
ulne
ss. I
t als
o re
flect
s th
e pe
rson
's vi
ew o
f the
ir sa
tisfa
ctio
n w
ith li
fe s
o fa
r.
This
dim
ensi
on c
over
s ho
w m
uch
the
child
/ado
lesc
ent e
xper
ienc
es d
epre
ssiv
e m
oods
and
emot
ions
and
stre
ssfu
l fee
lings
. It s
peci
fical
ly re
veal
s fe
elin
gs s
uch
as lo
nelin
ess,
sadn
ess,
suffi
cien
cy/in
suffi
cien
cy a
nd re
sign
atio
n. F
urth
erm
ore,
this
dim
ensi
on ta
kes
into
acc
ount
how
dis
tress
ing
thes
e fe
elin
gs a
re p
erce
ived
to b
e. T
his
dim
ensi
on s
how
sa
high
sco
re in
QoL
if th
ese
nega
tive
feel
ings
are
rare
.
This
dim
ensi
on e
xplo
res
the
child
's/ad
oles
cent
's pe
rcep
tion
of s
elf.
It in
clud
esw
heth
er th
e ap
pear
ance
of t
he b
ody
is v
iew
ed p
ositi
vely
or n
egat
ivel
y. B
ody
imag
e is
expl
ored
by
ques
tions
con
cern
ing
satis
fact
ion
with
look
s as
wel
l as
with
clo
thes
and
othe
r per
sona
l acc
esso
ries.
The
dim
ensi
on e
xam
ines
how
sec
ure
and
satis
fied
the
child
/ado
lesc
ent f
eels
abo
ut h
im/h
erse
lf as
wel
l as
his/
her a
ppea
ranc
e. T
his
dim
ensi
onre
flect
s th
e va
lue
som
ebod
y as
sign
s to
him
/her
self
and
the
perc
eptio
n of
how
pos
i-tiv
ely
othe
rs v
alue
him
/her
.
Phys
ical
ly e
xhau
sted
,ph
ysic
ally
unw
ell,
feel
ing
unfit
, hav
ing
low
ene
rgy
No
plea
sure
in li
fe,
diss
atis
fact
ion
with
life
Feel
s de
pres
sed,
unha
ppy,
in
a ba
dm
ood
Neg
ativ
e bo
dyim
age,
sel
f-re
ject
ion,
unha
ppy/
diss
atis
fied
with
sel
f, ha
ving
low
self-
este
em, f
eelin
gun
com
forta
ble
with
his/
her a
ppea
ranc
e
Phys
ical
ly fi
t, ac
tive,
heal
thy,
ene
rget
ic
Hap
py, v
iew
s lif
e po
s-iti
vely
, sat
isfie
d w
ithlif
e, p
leas
ed, c
heer
ful
Feel
ing
good
, fee
ling
in a
goo
d m
ood
Self-
conf
iden
t, sa
tis-
fied
with
him
/her
self,
posi
tive
body
imag
e,ha
ppy
with
him
/her
-se
lf, h
avin
g go
od s
elf-
este
em, c
omfo
rtabl
ew
ith h
is/h
er a
ppea
r-an
ce
Tabl
e 31
:In
terp
reta
tion
of K
IDSC
RE
EN
dim
ensi
ons
cont
inue
d...
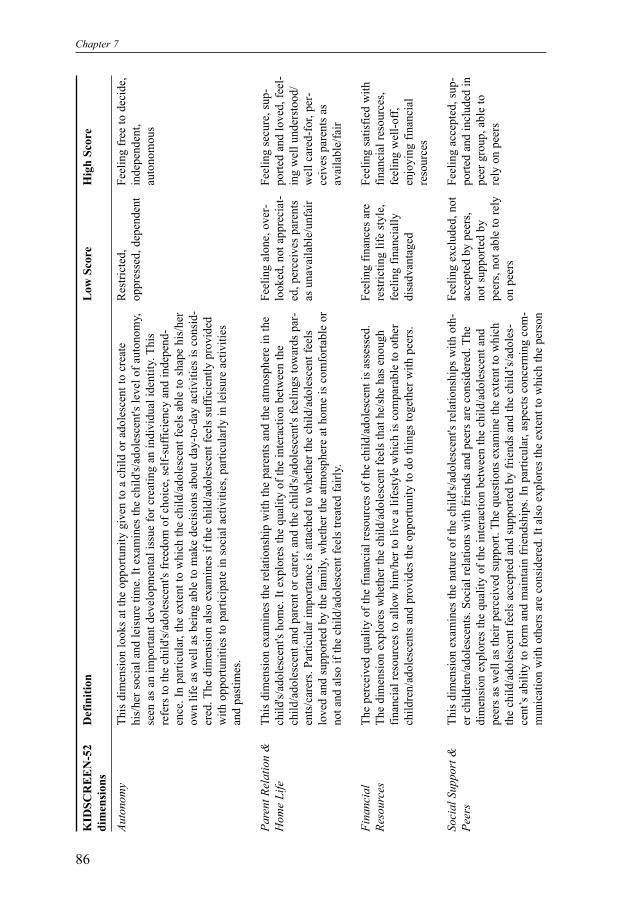
Chapter 7
86
KID
SCR
EE
N-5
2di
men
sion
sD
efin
ition
Low
Sco
reH
igh
Scor
e
Auto
nom
y
Pare
nt R
elat
ion
&H
ome
Life
Fina
ncia
lRe
sour
ces
Soci
al S
uppo
rt &
Peer
s
This
dim
ensi
on lo
oks
at th
e op
portu
nity
giv
en to
a c
hild
or a
dole
scen
t to
crea
tehi
s/he
r soc
ial a
nd le
isur
e tim
e. It
exa
min
es th
e ch
ild's/
adol
esce
nt's
leve
l of a
uton
omy,
seen
as
an im
porta
nt d
evel
opm
enta
l iss
ue fo
r cre
atin
g an
indi
vidu
al id
entit
y. T
his
refe
rs to
the
child
's/ad
oles
cent
's fr
eedo
m o
f cho
ice,
sel
f-su
ffici
ency
and
inde
pend
-en
ce. I
n pa
rticu
lar,
the
exte
nt to
whi
ch th
e ch
ild/a
dole
scen
t fee
ls a
ble
to s
hape
his
/her
own
life
as w
ell a
s be
ing
able
to m
ake
deci
sion
s ab
out d
ay-to
-day
act
iviti
es is
con
sid-
ered
. The
dim
ensi
on a
lso
exam
ines
if th
e ch
ild/a
dole
scen
t fee
ls s
uffic
ient
ly p
rovi
ded
with
opp
ortu
nitie
s to
par
ticip
ate
in s
ocia
l act
iviti
es, p
artic
ular
ly in
leis
ure
activ
ities
and
past
imes
.
This
dim
ensi
on e
xam
ines
the
rela
tions
hip
with
the
pare
nts
and
the
atm
osph
ere
in th
ech
ild's/
adol
esce
nt's
hom
e. It
exp
lore
s th
e qu
ality
of t
he in
tera
ctio
n be
twee
n th
ech
ild/a
dole
scen
t and
par
ent o
r car
er, a
nd th
e ch
ild's/
adol
esce
nt's
feel
ings
tow
ards
par
-en
ts/c
arer
s. Pa
rticu
lar i
mpo
rtanc
e is
atta
ched
to w
heth
er th
e ch
ild/a
dole
scen
t fee
lslo
ved
and
supp
orte
d by
the
fam
ily, w
heth
er th
e at
mos
pher
e at
hom
e is
com
forta
ble
orno
t and
als
o if
the
child
/ado
lesc
ent f
eels
trea
ted
fairl
y.
The
perc
eive
d qu
ality
of t
he fi
nanc
ial r
esou
rces
of t
he c
hild
/ado
lesc
ent i
s as
sess
ed.
The
dim
ensi
on e
xplo
res
whe
ther
the
child
/ado
lesc
ent f
eels
that
he/
she
has
enou
ghfin
anci
al re
sour
ces
to a
llow
him
/her
to li
ve a
life
styl
e w
hich
is c
ompa
rabl
e to
oth
erch
ildre
n/ad
oles
cent
s an
d pr
ovid
es th
e op
portu
nity
to d
o th
ings
toge
ther
with
pee
rs.
This
dim
ensi
on e
xam
ines
the
natu
re o
f the
chi
ld's/
adol
esce
nt's
rela
tions
hips
with
oth
-er
chi
ldre
n/ad
oles
cent
s. So
cial
rela
tions
with
frie
nds
and
peer
s ar
e co
nsid
ered
. The
dim
ensi
on e
xplo
res
the
qual
ity o
f the
inte
ract
ion
betw
een
the
child
/ado
lesc
ent a
ndpe
ers
as w
ell a
s th
eir p
erce
ived
sup
port.
The
que
stio
ns e
xam
ine
the
exte
nt to
whi
chth
e ch
ild/a
dole
scen
t fee
ls a
ccep
ted
and
supp
orte
d by
frie
nds
and
the
child
’s/a
dole
s-ce
nt’s
abi
lity
to fo
rm a
nd m
aint
ain
frie
ndsh
ips.
In p
artic
ular
, asp
ects
con
cern
ing
com
-m
unic
atio
n w
ith o
ther
s ar
e co
nsid
ered
. It a
lso
expl
ores
the
exte
nt to
whi
ch th
e pe
rson
Res
trict
ed,
oppr
esse
d, d
epen
dent
Feel
ing
alon
e, o
ver-
look
ed, n
ot a
ppre
ciat
-ed
, per
ceiv
es p
aren
tsas
una
vaila
ble/
unfa
ir
Feel
ing
finan
ces
are
rest
rictin
g lif
e st
yle,
feel
ing
finan
cial
lydi
sadv
anta
ged
Feel
ing
excl
uded
, not
acce
pted
by
peer
s,no
t sup
porte
d by
peer
s, no
t abl
e to
rely
on p
eers
Feel
ing
free
to d
ecid
e,in
depe
nden
t,au
tono
mou
s
Feel
ing
secu
re, s
up-
porte
d an
d lo
ved,
feel
-in
g w
ell u
nder
stoo
d/w
ell c
ared
-for
, per
-ce
ives
par
ents
as
avai
labl
e/fa
ir
Feel
ing
satis
fied
with
finan
cial
reso
urce
s,fe
elin
g w
ell-o
ff,en
joyi
ng fi
nanc
ial
reso
urce
s
Feel
ing
acce
pted
, sup
-po
rted
and
incl
uded
inpe
er g
roup
, abl
e to
rely
on
peer
s

Scoring and Interpretation of the KIDSCREEN Questionnaires
87
Scho
ol E
nviro
nmen
t
Soci
al A
ccep
tanc
e(B
ully
ing)
expe
rienc
es p
ositi
ve g
roup
feel
ings
and
how
muc
h he
/she
feel
s pa
rt of
a g
roup
and
resp
ecte
d by
pee
rs a
nd fr
iend
s.
This
dim
ensi
on e
xplo
res
a ch
ild's/
adol
esce
nt's
perc
eptio
n of
his
/her
cog
nitiv
e ca
paci
-ty
, lea
rnin
g an
d co
ncen
tratio
n, a
nd h
is/h
er fe
elin
gs a
bout
sch
ool.
It in
clud
es th
ech
ild's/
adol
esce
nt's
satis
fact
ion
with
his
/her
abi
lity
and
perf
orm
ance
at s
choo
l. G
ener
-al
feel
ings
abo
ut s
choo
l, su
ch a
s w
heth
er s
choo
l is
an e
njoy
able
pla
ce to
be,
are
als
oco
nsid
ered
. In
addi
tion,
the
dim
ensi
on e
xplo
res
the
child
's vi
ew o
f the
rela
tions
hip
with
his
/her
teac
hers
. For
exa
mpl
e, q
uest
ions
incl
ude
whe
ther
the
child
/ado
lesc
ent
gets
alo
ng w
ell w
ith h
is/h
er te
ache
rs a
nd w
heth
er th
e te
ache
rs a
re p
erce
ived
as
bein
gin
tere
sted
in th
e st
uden
t as
a pe
rson
.
This
dim
ensi
on c
over
s th
e as
pect
of f
eelin
g re
ject
ed b
y pe
ers
in s
choo
l. It
expl
ores
both
the
feel
ing
of b
eing
reje
cted
by
othe
rs a
s w
ell a
s th
e fe
elin
g of
anx
iety
tow
ards
peer
s. A
stud
ent i
s be
ing
bulli
ed w
hen
anot
her s
tude
nt o
r a g
roup
of s
tude
nts
say
ordo
nas
ty a
nd u
nple
asan
t thi
ngs
to h
im o
r her
. It i
s al
so b
ully
ing
whe
n a
stud
ent i
ste
ased
repe
ated
ly in
a w
ay h
e or
she
doe
sn't
like.
But
it is
not
bul
lyin
g w
hen
two
stu-
dent
s of
abo
ut th
e sa
me
stre
ngth
qua
rrel
or f
ight
. Thi
s de
finiti
on is
fairl
y st
anda
rd a
ndha
s be
en u
sed
over
a n
umbe
r of y
ears
in th
e H
BSC
stu
dies
(Cur
ie e
t al.,
199
8, 2
001)
.Th
is d
imen
sion
sho
ws
a hi
gh s
core
in Q
oLif
thes
e ne
gativ
e fe
elin
gs a
re ra
re.
Dis
likin
g sc
hool
and/
or te
ache
rs, n
eg-
ativ
e fe
elin
gs a
bout
scho
ol, n
ot d
oing
wel
l
Feel
ing
torm
ente
d by
peer
s, bu
llied
, fee
ling
reje
cted
by
peer
s
Feel
ing
happ
y at
scho
ol a
nd d
oing
wel
l,en
joyi
ng s
choo
l life
Not
feel
ing
bulli
ed,
feel
ing
resp
ecte
d an
dac
cept
ed b
y pe
ers
Phys
ical
Wel
l-bei
ng
Psyc
holo
gica
l Wel
l-be
ing
This
dim
ensi
on e
xplo
res
the
leve
l of t
he c
hild
's/ad
oles
cent
's ph
ysic
al a
ctiv
ity, e
nerg
yan
d fit
ness
as
wel
l as
the
exte
nt to
whi
ch a
chi
ld o
r ado
lesc
ent f
eels
unw
ell a
nd c
om-
plai
ns o
f poo
r hea
lth.
This
dim
ensi
on e
xam
ines
the
psyc
holo
gica
l wel
l-bei
ng o
f the
chi
ld/a
dole
scen
t inc
lud-
ing
posi
tive
emot
ions
and
sat
isfa
ctio
n w
ith li
fe a
s w
ell a
s th
e ab
senc
e of
feel
ings
suc
has
lone
lines
s an
d sa
dnes
s.
Phys
ical
ly e
xhau
sted
,ph
ysic
ally
unw
ell,
feel
ing
unfit
, hav
ing
low
ene
rgy
No
plea
sure
in li
fe,
feel
ing
depr
esse
d,fe
elin
g un
happ
y, h
av-
ing
a lo
w s
elf-
este
em
Phys
ical
ly fi
t, ac
tive,
heal
thy,
ene
rget
ic
Hap
py, v
iew
ing
life
posi
tivel
y, s
atis
fied
with
life
, em
otio
nally
bala
nced
KID
SCR
EE
N-2
7di
men
sion
sD
efin
ition
Low
Sco
reH
igh
Scor
e
cont
inue
d...

Chapter 7
88
Auto
nom
y &
Par
ent
Rela
tion
Soci
al S
uppo
rt &
Peer
s
Scho
ol
This
dim
ensi
on e
xplo
res
the
qual
ity o
f the
inte
ract
ion
betw
een
child
/ado
lesc
ent a
ndpa
rent
or c
arer
as
wel
l as
whe
ther
the
child
/ado
lesc
ent f
eels
love
d an
d su
ppor
ted
byth
e fa
mily
. It a
lso
exam
ines
the
child
's/ad
oles
cent
's pe
rcei
ved
leve
l of a
uton
omy
asw
ell a
s th
e pe
rcei
ved
qual
ity o
f the
fina
ncia
l res
ourc
es o
f the
chi
ld/a
dole
scen
t.
Soci
al re
latio
ns w
ith fr
iend
s an
d pe
ers
are
cons
ider
ed. T
he d
imen
sion
exp
lore
s th
equ
ality
of t
he in
tera
ctio
n be
twee
n th
e ch
ild/a
dole
scen
ts a
nd p
eers
as
wel
l as
thei
r per
-ce
ived
sup
port.
This
dim
ensi
on e
xplo
res
a ch
ild's/
adol
esce
nt's
perc
eptio
n of
his
/her
cog
nitiv
e ca
paci
-ty
, lea
rnin
g an
d co
ncen
tratio
n an
d hi
s/he
r fee
lings
abo
ut s
choo
l. In
add
ition
, the
dim
ensi
on e
xplo
res
the
child
's vi
ew o
f the
rela
tions
hip
with
his
/her
teac
hers
.
Feel
ing
rest
ricte
d,fe
elin
g ov
erlo
oked
,no
t app
reci
ated
, fee
l-in
g fin
ance
s ar
ere
stric
ting
life
styl
e
Feel
ing
excl
uded
, not
acce
pted
by
peer
s
Dis
likin
g sc
hool
,ne
gativ
e fe
elin
gsab
out s
choo
l, no
tdo
ing
wel
l
Feel
ing
posi
tive
abou
tth
e re
latio
nshi
p w
ithpa
rent
s an
d ha
ving
enou
gh a
ge-a
ppro
pri-
ate
free
dom
to c
hoos
e(th
ings
for y
ours
elf i
nth
e re
latio
nshi
p, g
ood
bala
nce
betw
een
par-
ents
), fe
elin
g sa
tisfie
dw
ith fi
nanc
ial
reso
urce
s, fe
elin
gw
ell-o
ff
Feel
ing
acce
pted
, sup
-po
rted
and
incl
uded
inpe
er g
roup
Feel
ing
happ
y at
scho
ol a
nd d
oing
wel
l
KID
SCR
EE
N-2
7di
men
sion
sD
efin
ition
Low
Sco
reH
igh
Scor
e
This
uni
dim
ensi
onal
mea
sure
repr
esen
ts a
glo
bal s
core
for t
he d
imen
sion
s of
the
long
er K
IDSC
REE
N v
ersi
ons.
Feel
ing
unha
ppy,
unfit
and
dis
satis
fied
with
rega
rds
to fa
mi-
ly li
fe, p
eers
and
scho
ol li
fe
Feel
ing
happ
y, fi
t and
satis
fied
with
rega
rds
to fa
mily
life
, pee
rsan
d sc
hool
life
KID
SCR
EE
N-1
0 in
dex

Scoring and Interpretation of the KIDSCREEN Questionnaires
groups of approximately the same size. (Example: A mean of 49.3 for a group of Euro-pean boys aged between 8 and 11 years according to the international T-value in the Self-Perception scale is situated lower than the threshold of the mean of the reference group(55.5) minus half a standard deviation of this group (9.7 / 2 = 4.9). Therefore, such agroup has a low health-related quality of life regarding this aspect with a negative bodyimage and feelings of self rejection (see table A-1 in Appendix A7_A (on disc) and Table31 above).For individual diagnostic each raw scale score (item scores summed up) observed in aparticular KIDSCREEN scale can be interpreted as percentage ranks and T-values choos-ing the appropriate table from Appendix A7_D and A7_E.The second and third propositions suggest more sophisticated possibilities for workingwith KIDSCREEN scales and can be recommended for special requirements. Of course,experienced researchers may choose to apply additional methods as convenient for theirpurposes.The second way to interpret KIDSCREEN scores uses the strength of the Rasch modelusing person parameter estimates. As mentioned previously, the particular person param-eter, that is their position on the latent trait continuum, is interpreted in relation to the
89
10
30
40
20
50
60
70
not at all / slightly fit and well
very / extremely fit and wellvery often / always full of energy
never / seldom full of energy
never / seldom felt sad
very often / always felt sad
never / seldom felt lonely
very often / always felt lonely
very often / always fun with friends
never / seldom fun with friends
very often / always parents treat fairly
never / seldom parents treat fairly
very often / always able to pay attention
never / seldom able to pay attention
seldom / quite often able to do thingsseldom / quite often time for yourself
not at all / slightly got on well at school
Population norm:
mean=50, SD=10
Figure 9:Ruler with response category thresholds and the t-value distribution

Chapter 7
location of the answer categories of the items on the latent trait continuum. Thus a par-ticular person parameter value, for example a T-value of 58 in the KIDSCREEN-10 index(see Figure 6), can be interpreted that the child or adolescent is most likely “feelingextremely fit and well” and “always full of energy”. A low T-value of 25 would mean thatthe child or adolescent feels “not at all fit and well” and had “never had fun with friends”in the last week. For the interpretation of KIDSCREEN values based upon the Raschmodel, the latent trait continua of the KIDSCREEN scales with the threshold marks ofthe answer categories are provided in the Appendix A8 (on disc).A third possibility for working with KIDSCREEN scales is to interpret a responder’s pro-file over all KIDSCREEN-52 or KIDSCREEN-27 subscales instead of looking at singlescale scores. This enables clinicians and researchers to gain a concise summary of aresponder’s individual HRQoL. This method is facilitated by the use of T-values and per-centiles. The individual profiles can be described in terms of their average level, in termsof the dispersion across the different dimensions (in relation of the average dispersion)and concerning the shape of the profile. Furthermore, the individual profile can be com-pared with the profiles of specific populations (e.g. diagnosis groups) if such data areavailable. Or the individual profile can be compared with a taxonomy of empiricallyidentified profile types (e.g. Cluster-analysis; Latent-class-analysis; Topological Artifi-cial neural network) to be developed in the future. In the Appendices, both tables withreference data for the European data set are provided as well as tables with referenceswhich are calculated on the basis of the country data.
90

The KIDSCREEN Group holds the copyright for all KIDSCREEN instruments:KIDSCREEN-52, KIDSCREEN-27 and KIDSCREEN-10 index child and adolescentversions as well as parent/proxy versions.Researchers using KIDSCREEN instruments shall not modify, abridge, condense, adapt,recast or transform the KIDSCREEN instruments in any manner or form without the pri-or written agreement of the KIDSCREEN Group. This includes but is not limited to anyminor or significant change in wordings or organisation in the KIDSCREEN question-naires. Researchers interested in using one of the KIDSCREEN instruments shall nottranslate KIDSCREEN without the prior written agreement of the KIDSCREEN Group.Researchers shall not reproduce the KIDSCREEN instruments except for the limited pur-pose of generating sufficient copies for use in registered investigations and shall in noevent distribute copies of the KIDSCREEN instruments to third parties by sale, rental,lease, lending, or any other means. The KIDSCREEN Group will decide whether or notto institute legal proceedings against the infringing party.In case of publication of study results, the potential user shall cite: (1) Ravens-Sieberer, U., Gosch, A., Rajmil, L., Erhart, M., Bruil, J., Duer, W., Auquier, P., Power,
M., Abel, T., Czemy, L., Mazur, J., Czimbalmos, A., Tountas, Y., Hagquist, C., Kilroe, J. and theEuropean KIDSCREEN Group. (2005). KIDSCREEN-52 quality-of-life measure for childrenand adolescents. Expert Review of Pharmacoeconomics & Outcomes Research, 5 (3), 353-364.
(2) The KIDSCREEN Group Europe. (2006). The KIDSCREEN Questionnaires – Quality of lifequestionnaires for children and adolescents. Handbook. Lengerich: Pabst Science Publishers.
in the reference section of the publication (new publications may be added and older onesdeleted).
Researchers and other potential users interested in using and/or translating one of theKIDSCREEN instruments are asked to fill in the collaboration form (see below), sign itand send it back to the German study centre per post or fax. After registration, the inter-ested party will receive practical information (e.g. payment of fees, available transla-tions) and a password to login to the “Members only” folder of the KIDSCREEN web-site (www.kidscreen.org). On the website, the potential user will find downloads such asthe International KIDSCREEN Manual, the KIDSCREEN questionnaires and referencescores.Contact person for copyright and collaboration agreement is
Prof. Dr. Ulrike Ravens-SiebererProject Coordinatorwww.kidscreen.org
91
Copyright and Collaboration agreement8

Chapter 8
I. COLLABORATION between the KIDSCREEN Group and
Name (Title): _________________________________________________________________
Institution: ____________________________________Dept: __________________________
Street Address:_________________________________________________________________
City: ____________________________State:_______________Zip (Postal) Code:__________
Country______________________________________________________________________
Phone Number: (___)________________________ Fax:_______________________________
E-mail:_______________________________________________________________________
SUMMARY of the STUDY
_____________________________________________________________________________Title of the study:
_____________________________________________________________________________Type of Research:
_____________________________________________________________________________Objectives/ Design:
_____________________________________________________________________________Study population: (including the number of cases, age, illnesses/diseases)
_____________________________________________________________________________Measurement points:
_____________________________________________________________________________Other Instruments:
_____________________________________________________________________________Name of funder:
_____________________________________________________________________________Timeframe: Beginning of Study:
Expected end of Study:_____________________________________________________________________________
Questionnaire Version(s) planned to be included:
❑ KIDSCREEN-52 child & adolescent version ❑ KIDSCREEN-52 parent version❑ KIDSCREEN-27 child & adolescent version ❑ KIDSCREEN-27 parent version❑ KIDSCREEN-10 index child & adolescent version ❑ KIDSCREEN-10 index parent version
Language Version(s) planned to be included:_________________________________________
92

Copyright and Collaboration agreement
KIDSCREEN USER AGREEMENT
IMPORTANT REMARK: THE KIDSCREEN INSTRUMENTS MAY BE USED IN THEABOVE MENTIONED INVESTIGATIONS WHEN THE FOLLOWING AGREEMENTIS COMPLETED AND SIGNED BY "USER".
The KIDSCREEN Group distributes the KIDSCREEN instruments and translations are sofar available in Czech, Dutch, English (UK), French, German (AT, CH, DE), Greek, Hun-garian, Polish, Spanish, Swedish language.
The User (Include name) ____________________ wishes to use the KIDSCREEN instru-ments. Therefore, User and KIDSCREEN group agree as follows:
1. KIDSCREEN obligations
The KIDSCREEN Group shall deliver the original KIDSCREEN instruments and/or the transla-tions requested by "User" subject to the following conditions: The translations requested are available, the present agreement is duly completed and signed by"User", and payment of fee for the KIDSCREEN Manual Questionnaires is received.
2. "User"'s obligations
2.1 No modification "User" shall not modify, abridge, condense, adapt, recast or transform the KIDSCREEN instru-ments in any manner or form, including but not limited to any minor or significant change inwordings or organisation in KIDSCREEN, without the prior written agreement of KIDSCREENGroup
2.2 No translation "User" shall not translate KIDSCREEN, without the prior written agreement of the KIDSCREENGroup.
2.3 No reproduction "User" shall not reproduce the KIDSCREEN instruments except for the limited purpose of gen-erating sufficient copies for use in investigations stated hereunder and shall in no event distrib-ute copies of the DISABKIDS instruments to third parties by sale, rental, lease, lending, or anyothers means.
2.4 Publication In case of publication of study results, "User" shall cite (1) Ravens-Sieberer, U., Gosch, A., Rajmil, L., Erhart, M., Bruil, J., Duer, W., Auquier, P., Pow-
er, M., Abel, T., Czemy, L., Mazur, J., Czimbalmos, A., Tountas, Y., Hagquist, C., Kilroe, J.and the European KIDSCREEN Group. (2005). KIDSCREEN-52 quality-of-life measure forchildren and adolescents. Expert Review of Pharmacoeconomics & Outcomes Research, 5(3), 353-364,
(2) The KIDSCREEN Group Europe. (2006). The KIDSCREEN Questionnaires - Quality of lifequestionnaires for children and adolescents. Handbook. Lengerich: Pabst Science Publishers.
in reference section of the publication. (New publications may be added and older ones deleted).
93
Chapter 8
94
2.5 Provision of data All data, results and reports obtained by, or prepared in connection with the KIDSCREEN instru-ments shall remain the User's property. However, KIDSCREEN Group may request the User toshare data, results and reports obtained through the use of the KIDSCREEN. KIDSCREENGroup shall ensure the anonymisation of such data at three levels, by the removal of: any patientidentification, any university or company identification and any treatment information (whereavailable). KIDSCREEN Group will classify and reorganise such anonymous data and therefore,shall hold all intellectual property rights regarding these data when and if submitted to the datapool. KIDSCREEN Group may provide such reorganised data to third parties, for analysis ineducation, research, consulting, and specifically for the evaluation of cross-cultural equivalenceand development of reference values for this KIDSCREEN instruments or for any other similarproject.
2.6 Payment
2.6.1 Royalty fees (Authors) The use of the KIDSCREEN questionnaires is tied to obtaining the KIDSCREEN Manual. TheManual and all questionnaires in all existing languages as of January, 1, 2006 is available for 50 € (plus 10 € handling and shipping in Europe; 20 € handling and shipping elsewhere).
2.6.2 Distribution fees (KIDSCREEN Group) The use of the KIDSCREEN instruments in studies will be subject to a distribution fee at a latertimepoint, but not as long as it's development phase is formally completed.
3. Copyright Infringement
The KIDSCREEN instruments were developed by the KIDSCREEN Group (Project Co-ordina-tion Prof. Dr. Ulrike Ravens-Sieberer MPH, Robert Koch Institute, Research Unit PsychosocialHealth, Seestr. 10, 13353 Berlin, Germany or Prof. Dr. Ulrike Ravens-Sieberer MPH, BielefeldUniversity, School of Public Health, WHO-Collaborating Center for Child and AdolescentHealth Promotion, 33501 Bielefeld, Germany).The KIDSCREEN Group holds copyright overthe KIDSCREEN instruments and all its present and future translations. Each new translationwill be made available to third parties once it is available, through KIDSCREEN Group, underthe conditions described in the present document. If, at any time during the term of this agreement, " User " learns of any infringement by a thirdparty of any Intellectual Property Rights in connection with the KIDSCREEN instruments, "User " shall promptly notify KIDSCREEN Group. The KIDSCREEN Group will decide to insti-tute or not proceedings against the infringing party.
4. Confidentiality
All and any information related to the KIDSCREEN instruments including but not limited to thefollowing: information concerning clinical investigations, creations, systems, materials, soft-ware, data and know-how, translations, improvements ideas, specifications, documents, records,notebooks, drawings, and any repositories or representation of such information, whether oral orin writing or software stored, are herein referred to as confidential information. In considerationof the disclosure of any such confidential information to the other, each party agrees to hold suchconfidential information in confidence and not divulge it, in whole or in part, to any third partyexcept for the purpose specified in this agreement.
Copyright and Collaboration agreement
95
5. Use of name
It is agreed that KIDSCREEN Group shall not disclose, whether by the public press or otherwise,the name of "User' or institution", to any third party to this agreement except to the copyrightholder(s) of the KIDSCREEN instruments.
6. Liability
6.1 In case of breach of contract In the event of total or partial breach by KIDSCREEN Group of any of its obligations hereunder,the KIDSCREEN Group's liability shall be limited to the direct loss or damage (excluding lossof profit and operating losses) suffered by "User" as a result of such breach and shall not includeany other damages and particular consequential damages.
6.2 In the scope of the use of the "Questionnaire" Under no circumstances may the KIDSCREEN Group be held liable for direct or consequentialdamage resulting from the use of the KIDSCREEN.
6.3 In the event of non-renewal of this Agreement In the event of non-renewal of this Agreement by KIDSCREEN Group for any cause or failureby KIDSCREEN Group to conclude a new agreement with "User" upon the expiry of this Agree-ment, KIDSCREEN Group will have no liability for payment of any damages and/or indemnityto "User".
7. Term and termination
This agreement shall be effective as the date of its signature by "User" and shall at least or untilthe term of the study above mentioned in SUMMARY OF THE STUDY. Either party may terminate this Agreement immediately upon providing written notice to the oth-er party in the event of: (a) the other party's unexcused failure to fulfil any of its material obliga-tions under this Agreement or (b) upon the insolvency or bankruptcy of, or the filing of a peti-tion in bankruptcy or similar arrangement by the other party. Upon expiration or termination ofthis Agreement KIDSCREEN Group may retain in its possession confidential information itacquired from KIDSCREEN instruments while under contract. The obligations which by theirterms survive provisions of this Agreement, shall survive termination.
8. Assignment
This Agreement and any of the rights and obligations of "User" are personal to the "User" andcannot be assigned or transferred by "User" to any third party or by operation of law, except withthe written consent of KIDSCREEN Group notified to "User".
9. Separate Agreement
This Agreement holds for the above mentioned study only. The use of the KIDSCREEN instru-ments in any additional study of the "User" will require a separate agreement without additionalfees, unless significant updates have been added to the user manual (new edition, etc.).

Chapter 8
96
10. Entire Agreement, Modification, Enforceability
The entire agreement hereto is contained herein and this Agreement cancels and supersedes allprior agreements, oral or written, between the parties hereto with the respect to the subject mat-ter hereto. This Agreement or any of its terms may not be changed or amended except by written documentand the failure by either party hereto to enforce any or all of the provision(s) of this Agreementshall not be deemed a waiver or an amendment of the same and shall not prevent future enforce-ment thereof. If any one or more of the provisions or clauses of this Agreement are adjudged by a court to beinvalid or unenforceable, this shall in no way prejudice or affect the binding nature of this Agree-ment as a whole, or the validity or enforceability of each/and every other provision of this Agree-ment.
11. Governing law
This Agreement shall be governed by and construed in accordance with the laws of the European Union.
DE. Germany Prof. Dr. Ulrike Ravens-SiebererRobert Koch-Institute Child and Adolescent HealthSeestraße 1013353 BerlinPhone: +49-30-4547-3436Fax: +49-30-4547-3531e-mail: [email protected]
AT. AustriaDr. Wolfgang DuerLudwig Boltzmann-Institute for Sociology of Health and MedicineUniversity of ViennaRooseveltplatz 21090 ViennaPhone: +43-1-4277-48284Fax: +43-1-4277-48290e-mail: [email protected]
CH. SwitzerlandProf. Dr. Thomas AbelSocial and Behavioural Health ResearchDepartment of Social and Preventive MedicineUniversity of BernNiesenweg 63012 BernPhone: +41-31-631-3512Fax: +41-31-631-3430e-mail: [email protected]
CZ. Czech Republic Dr. Ladislav CsémyPrague Psychiatric CentreUstavni 91181 03 Praha 8Phone: +420-2-66003-272Fax: +420-2-66003-270e-mail: [email protected]
ES. SpainProf. Dr. Luis RajmilAgència d'Avaluació de Tecnologiai Recerca Mèdiques. Recinte Parc SanitariPere Virgili. Esteve Terradas 30. EdificiMestral. 1ª Planta 08023 BarcelonaPhone: +34 93 259 4223 or +34 93 2594200 Fax: + 34 93 259 4201e-mail: [email protected]
FR. France Prof. Dr. Pascal AuquierDepartment of Public HealthUniversity Hospital of Marseille27, Bd Jean Moulin13385 MARSEILLE CEDEX 05Phone: +33-49132-4474Fax: +33-49179-7520e-mail: [email protected]
EL. Greece Prof. Dr. Yannis TountasInstitute of Social and Preventive Medicine 25 Alexandroupoleos Street11527 AthensPhone: 0030 -210-74 82015e-mail: [email protected]
97
Contact Addresses for support9

Chapter 9
HU. Hungary Dr. Agnes CzimbalmosHealth Promotion and Development CentreChild Health DepartmentAndrássy 821062 BudapestPhone: +36 1-428-8238Fax: +36-1-428-8241e-mail: [email protected]
IE. IrelandDr. Celia KeenaghanPopulation Health Children and YoungPeople's TeamHealth Services Executive3rd Floor, Bridgewater HouseRockwood Parade, SligoPhone: + 353 719174780Fax: + 353 719138335e-mail: [email protected]
NL. The Netherlands Dr. Symone DetmarTNO Quality of LifeChild Health, Prevention and PhysicalActivityP.O. Box 22152301 CE LeidenPhone.: +31-71-518-1832Fax: +31-71-518-1920e-mail: [email protected]
PL. Poland Dr. Joanna MazurDepartment of EpidemiologyNational Research Institute of Mother &Child Ul. Kasprzaka 17a01-211 WarsawPhone: + 48 22 32 77 325Fax: + 48 22 32 77 325e-mail: [email protected]
SE. Sweden Prof. Dr. Curt HagquistKarlstad UniversitySE-651 88 KarlstadPhone: +46-54-7002536Fax: +46-54-7002523e-mail: [email protected]
UK. United Kingdom Prof. Dr. Mick PowerDepartment of PsychiatryUniversity of EdinburghRoyal Edinburgh HospitalEdinburgh EH10 5HFPhone: +44-131-537-6578 or /79Fax: +44-131-447-6760e-mail: [email protected]
98
Achenbach, T.M., McConaughy, S.H. & Howell, C.T. (1987). Child/adolescent behavioural andemotional problems: Implications of cross-informant correlations for situational specificity.Psychological Bulletin, 101 (2), 213-232.
Anderson, R.T., Aaronson, N.K. & Wilkin, D. (1993). Critical review of the international assess-ments of health-related quality of life. Quality of Life Research, 2 (6), 369-395.
Anderson, R.T., Aaronson, N.K., Leplege, A.P. & Wilkin, D. (1996). International Use and Appli-cation of Generic Health-related Quality of Life Instruments. In B. Spilker (Ed.). Quality of lifeand pharmacoeconomics in clinical trials. Philadelphia: Lippincott-Raven Publishers.
Bentler, P.M. (1999). Comparative fit indexes in structural models. Psychological Bulletin, 107,238-246.
Bethell, C.D., Read, D., Neff, J., Blumberg, S.J., Stein, R.E., Sharp, V. & Newacheck, P.W.(2002a). Comparison of the children with special health care needs screener to the question-naire for identifying children with chronic conditions-revised. Ambulatory Pediatrics, 2 (1),49-57.
Bethell, C.D., Read, D., Stein, R.E., Blumberg, S.J., Wells, N. & Newacheck, P.W. (2002b) Iden-tifying children with special health care needs: development and evaluation of a short screen-ing instrument. Ambulatory Pediatrics, 2 (1), 38-48.
Braun, M. & Mohler, P.P. (2003). Background variables. In J. Harkness, F.J.R. van de Vijver & P.P.Mohler (Eds.). Cross-Cultural Survey Methods. Hoboken NJ: Wiley.
Brevik, J.I. & Dalgard, O. (1996). The Health Profile Inventory. Oslo.Bortz, J. & Döring, N. (2002). Forschungsmethoden und Evaluation für Human- und Sozialwis-
senschaftler (3rd ed.). Berlin: Springer-Lehrbuch.Browne, M.W. & Cuddeck, R. (1993). Alternative ways of assessing model fit. In K.A. Bollen &
J.S. Long (Eds.). Testing structural equation models. Thousand Oaks, CA: Sage.Bruil, J. (1999). Development of a quality of life instrument for children with a chronic illness.
Doctoral dissertation University Leiden.Bullinger, M., Power, M.J., Aaronson, N.K., Cella, D.F. & Anderson, R.T. (1996). Creating and
Evaluating Cross-Cultural Instruments. In B. Spilker (Ed.). Quality of life and pharmacoeco-nomics in clinical trials. Philadelphia: Lippincott-Raven Publishers.
Bullinger, M. & Ravens-Sieberer, U. (1995). Health related QoL assessment in children: a reviewof the literature. European review of applied psychology, 45 (4), 245-254.
Bullinger, M., Schmidt, S., Petersen, C. & The-DISABKIDS-Group. (2002). Assessing quality oflife of children with chronic health conditions and disabilities: A European approach. Interna-tional Journal of Rehabilitation Research, 25, 197-206.
Cantril, H. (1965). The pattern of human concerns. New Brunswick, NJ: Rutgers University Press.Center for Disease Control and Prevention. (2000). Measuring healthy days: Population assess-
ment of health-related quality of life. Atlanta: CDC: Author.Cohen, J. (1988). Statistical power analysis for the behavioral sciences. (2nd ed.). Hillsdale:
Lawrence Erlbaum.
99
References10

Chapter 10
Cohen, S., Underwood, L.G. & Gottlieb, B.H. (2000). Social support measurement and interven-tion. A guide for health and social scientists. Oxford: Oxford University Press.
Currie, C., Elton, R.A., Todd, J. & Platt, S. (1997). Indicators of socioeconomic status for adoles-cents: the WHO Health Behaviour in School-aged Children Survey. Health EducationResearch, 12 (3), 385-397.
Currie, C. et al. (1998). Health Behaviour in School-aged Children: a WHO Cross-National Sur-vey (HBSC): Research Protocol for the 1997/98 Survey. Edingburgh: Research Unit in Healthand Behavioural Change, University of Edinburgh.
Currie, C., Samdal, O., Boyce, W. & Smith, R. (eds.) (2001). Health Behaviour in School-agedChildren: a WHO Cross-National Study (HBSC): Research Protocol for the 2001/2002 Survey.Child and Adolescent Health Research Unit, University of Edinburgh.
Dalgard, O. (1996). Community health profile: a tool for psychiatric prevention. In D.R. Trent &C.A. Reed (Eds.). Promotion of Mental Health (Volume 5). Aldershot: Avebury Press.
Davidoff, A.J. (2004). Identifying children with special health care needs in the National HealthInterview Survey: a new resource for policy analysis. Health Services Research, 39, 53-71.
Detmar, S.B., Bruil, J., Ravens-Sieberer, U., Gosch, A., Bisegger, C., & The European KidscreenGroup (2006). A focus group approach in constructing the KIDSCREEN HRQOL question-naire for children and adolescents. Quality of Life Research. Jan 2006, 1 - 9.
Dowrick, C., Casey, P. & Dalgard, O. (1998). The outcome of depression international network(ODIN): Background, methods and field trials. British Journal of Psychiatry, 172, 359-336.
Edwards, T.C., Huebner, C.E., Connell, F.A. & Patrickm, D.L. (2002). Adolescent quality of life,part I: conceptual and measurement model. Journal of Adolescence, 25 (3), 275-286.
Eiser, C. & Morse, R. (2001). Quality-of-life measures in chronic diseases of childhood. HealthTechnology Assessment, 5 (4), 1-157.
Ellert, U., Thomas, C., Ravens-Sieberer, U., Kosinksi, M., Björner, J.B., Dewey, J. & Ware, J.E.(2001). Using Item Response Theory to improve Qol Measures for Children - First Resultsfrom the Child Dynamic Assessment Project. Quality of Life Research, 10, 203.
Eurostat. European statistics. http://epp.eurostat.cec.eu.int/portal/page?_pageid=1090,1&_dad=portal&_schema=PORTAL.
Evans, D.R. (1994). Enhancing Quality of Life in the Population at Large. Social IndicatorsResearch, 33, 47-88.
Ewing, J.A. (1984). Detecting Alcoholism: The CAGE Questionnaire. JAMA, 252,1905-1907.Fallowfield, L. (1994). An overview of quality of life measurements. In M.R. Trimble & W.E. Dod-
son (eds.). Epilepsy and quality of life. New York: Raven Press.Felder-Puig, R., Frey, E., Proksch, K., Varni, J.W., Gadner, H. & Topf, R.(2004).Validation of the
German version of the Pediatric Quality of Life Inventory (PedsQL) in childhood cancerpatients off treatment and children with epilepsy. Quality of Life Research, 13 (1), 223-234.
Ferguson, G.A. (1949). On the theory of test development. Psychometrika, 14, 61-68.French, D. & Christie, M. (1996). Developing outcome measures for children: "Quality of life"
assessment for pediatric asthma. In A. Huchinson, E. McColl, M. Christie & C. Riccalton(eds.). Health outcome measures in primary and out-patient care. Australia: Harwood Acade-mic Publishers.
Goodman, R. (1997) The Strengths and Difficulties Questionnaire: a research note. Journal ofChild Psychology and Psychiatry, and allied Disciplines, 38 (5), 581-586.
Goodman, R, Ford, T, Simmons, H, Getward, R, & Meltzer, H. (2000). Using the Strengths andDifficulties Questionnaire (SDQ) to screen for child psychiatric disorders in a community sam-ple. Journal of Psychiatry, 177, 534-539.
100

References
Grob, A., Lüthi, R., Kaiser, F.G., Flammer, A., Mackinnon, A., & Wearing, A.J. (1991). BernerFragebogen zum Wohlbefinden Jugendlicher (BFW). Diagnostica, 37, 66-75.
Harding, L. (2001). Children's quality of life assessment: A review of generic and health-relatedquality of life measures completed by children and adolescents. Clinical Psychology & Psy-chotherapy, 8, 79-96.
Helgeson, V.S. (2003). Social support and quality of life. Quality of Life Research, 12 (suppl. 1),25-31.
Helsen, M., Vollebergh, W. & Meeus, W. (2000). Social Support from Parents and Friends andEmotional Problems in Adolescence. Journal of Youth and Adolescence, 29 (3), 319-335.
Herdman, M., Rajmil, L., Ravens-Sieberer, U., Bullinger, M., Power, M., Alonso, J. & The Euro-pean Kidscreen and Disabkids Groups (2002). Expert consensus in the development of a Euro-pean health-related quality of life measure for children and adolescents: a Delphi study. ActaPediatrica, 91 (12), 1385-1390.
Hibell, B., Andersson, B., Ahlström, S., Balakireva, O., Bjarnason, T., Kokkevi, A. & Morgan. M.(2000). The 1999 ESPAD Report. Alcohol and Other Drug Use Among Students in 30 Euro-pean Countries. The Swedish Council for Information on Alcohol and Other Drugs (CAN) andThe Pompidou Group at the Council of Europe. Stockholm, Sweden. The Swedish Council forInformation on Alcohol and Other Drugs (CAN). Modin Tryck AB: Stockholm (ISBN 91-7278-080-0).
Hu, L. & Bentler, P.M. (1999). Cutoff criteria for fit indexes in covariance structure analysis: Con-ventional criteria versus new alternatives. Structural Equation Modeling, 6 (1), 1-55.
Huebner, E.S. (1991a). Initial development of the Students' Life Satisfaction Scale. School Psy-chology International, 12, 231-240.
Huebner, E.S. (1991b). Further validation of the Students' Life Satisfaction Scale: The independ-ence of satisfaction and affect ratings. Journal of Psychoeducational Assessment, 9, 363-368.
Huisman, M. & Goudriaan, H. (2001). Handling missing item responses due to item nonresponseand incomplete design. In, J. Bethlehem & S. van Buuren (Eds.): SSS'01 Symposium Statisti-cal Software 2001. Missing values. Proceedings of a Symposium on incomplete data (pp. 57-73). Amsterdam: Section Statistical Programming, VVS/Candiesnten BV.
International Quality of Life Assessment (IQOLA) Project. http://www.iqola.orgISCED 1997 International Standard Classification of Education. http://www.unesco.org/educa-
tion/information/nfsunesco/doc/isced_1997.htmISSP (International Social Survey Programme) www.issp.orgKoopman, H.M., Theunissen, N.C., Vogels, A.G.C., Zwinderman, K.A.H., Verloove-Vanhorick,
S.P. & Wit, J.M. (1999). Health related quality of life of children with a chronic illness. Parentversus child report. Gedrag en Gezondheid, 27, 118-24.
Koopman, H.M., Bruil, J., Detmar, S.B., Baars, R.M., & Wit, J.M. (2003). Afdeling Kinderge-neeskunde LUMC, J. Bruil & S. Detmar TNO Preventie en Gezondheid Afdeling Jeugd, Hetmeten van de Gezondheidsgerelateerde Kwaliteit van Leven van kinderen met een chronischeziekte, [Measurement of HRQOL in children with a chronic illness]. Tijdschrift voor kinderge-neeskunde, 3 (71), 82-88.
Koot, R.W., de Heer, K., Oort, F.J., Hulshof, M.C., Bosch, D.A. & de Haes, J.C. (2004). Qualityof life after brachytherapy in patients with glioblastoma multiforme. European Journal of Can-cer, 40 (7), 1013-1020.
101
Chapter 10
Koponen, P. & Aromaa, A. (2000). Survey Design and Methodology in National Health Interviewand Health Examination Surveys. Review of literature, European survey experiences and rec-ommendations. Available in: http://europa.eu.int/comm/health/ph_projects/2000/monitoring/fp_monitoring_2000_annexe14_04_en.pdf.
Kromeyer-Hauschild, K., Wabitsch, M., Kunze, D., Geller, F., Geiß, H.C., Hesse, V. et al. (2001).Perzentile für den Bodymass-Index für das Kindes- und Jugendalter unter Heranziehung ver-schiedener deutscher Stichproben. Monatsschrift für Kinderheilkunde, 149, 807-818.
La Greca, A. (ed). (1990). Through the eyes of the child: obtaining self-reports from children andadolescents. Boston: Allyn and Bacon.
Landgraft, J.M., Abetz, L. & Ware, J.E. (1996). The Child Health Questionnaire user's manual.First edition. Boston: The Health Institute. New England Medical Center.
Landgraf, J.M., Maunsell, E., Speechley, K.N., Bullinger, M., Campbell, S., Abetz, L. & Ware, J.E.(1998). Canadian-French, German and UK versions of the Child Health Questionnaire:methodology and preliminary item scaling results. Quality of Life Research, 7 (5), 433-445.
Loonen, H.J., Derkx, B.H., Koopman, H.M. & Heymans, H.S. (2002). Are parents able to rate thesymptoms and quality of life of their offspring with IBD? Inflammatory Bowel Diseases, 8 (4),270-276.
Marra, C.A., Levine, M., McKerrow, R. & Carleton, B.C. (1996). Overview of health-related qual-ity-of-life measures for pediatric patients: application in the assessment of pharmacotherapeu-tic and pharmacoeconomic outcomes. Pharmacotherapy, 16 (5), 879-888.
Matza, L.S., Swensen, A.R., Flood, E.M., Secnik, K. & Leidy, N.K. (2004). Assessment of health-related quality of life in children: a review of conceptual, methodological, and regulatoryissues. Value Health, 7 (1), 79-92.
Mazur, J. & Mierzejewska, E. (2003). Jakosc zycia zwiazana ze zdrowiem dzieci i mlodziezy -koncepcje metody badawcze i wybrane zastosowania. Medycyna Wieku Rozwojowego.(Health-related quality of life (HRQL) in children and adolescents - concepts, study methodsand selected applications. Developmental Period Medicine, VII (1 Pt 2), 35-48.
McDowell, I. & Newell, C. (1996). Measuring Health. A Guide to Rating Scales and Question-naires. Oxford University Press, New York.
Nosikov, A. & Gudex, C. (2003). EUROHIS: Developing Common Instruments for Health Sur-veys. Biomedical and Health Research, 57. Amsterdam: IOS Press.
Patrick, D.L., Edwards, T.C., & Topolski, T.D. (2002). Adolescent quality of life, part II: Initial val-idation of a new instrument. Journal of Adolescence, 25 (3), 287-300.
Raat, H., Bonsel, G.J., Essink-Bot M.L., Landgraf J.M. & Gemke R.J. (2002). Reliability and valid-ity of comprehensive health status measures in children: The Child Health Questionnaire inrelation to the Health Utilities Index. Journal of Clinical Epidemiology, 55, 67 - 76.
Rajmil, L., Berra, S., Erhart, M., Tebe, C., Bisegger, C., Duer, W., von Rueden, U., Alonso, J.,Ravens-Sieberer, U. & The Kidscreen Group. Survey methods and representativeness of Euro-pean national surveys of the KIDSCREEN study. Submitted to Value in Health.
Rajmil, L., Herdman, M., Fernández de Sanmamed, M.J., Detmar, S., Bruil, J., Ravens-Sieberer,U., Bullinger, M., Simeoni, M.-C., Auquier, P., & The Kidscreen Group (2004). GenericHealth-related Quality of Life Instruments in Children and Adolescents: A Qualitative Analy-sis of Content. Journal of Adolescent Health, 34, 37-45.
Rasch, G. (1977). On specific objectivity: An attempt at formalizing the request for generality andvalidity of scientific statements. Danish Yearbook of Philosophy, 14, 58-94.
102

References
Ravens-Sieberer, U., & Bullinger, M. (1998). Assessing health-related quality of life in chronical-ly ill children with the German KINDL: first psychometric and content analytical results. Qual-ity of Life Research, 7, 399-407.
Ravens-Sieberer, U., Gosch, A., Abel, T., Auquier, P., Bellach, B.-M., Dür, W., Rajmil, L. & TheEuropean Kidscreen Group (2001). Quality of life in children and adolescents: a European pub-lic health perspective. Social and Preventive Medicine, 46, 297-302.
Ravens-Sieberer, U. (2001). The revised KINDL-R: Final results on reliability, validity and respon-siveness of a modular HRQOL instrument for children and adolescents. 8. Conference of theInternational Society for Quality of Life Research (ISOQOL). Quality of Life Research, 10 (3),199.
Ravens-Sieberer, U. (2003). Der Kindl-R Fragebogen zur Erfassung der gesundheitsbezogenenLebensqualität bei Kindern und Jugendlichen - Revidierte Form. In: J. Schumacher, A.Klaiberg, & E. Brähler (Hrsg.), Diagnostische Verfahren zu Lebensqualität und Wohlbefinden(S. 184-188). Göttingen: Hogrefe.
Rigby, M. & Köhler, L. (Eds.) (2002). Child Health Indicators of Life and Development (CHILD)Report to the European Commission. Luxembourg: European Commission. http://europa.eu.int/comm/health/ph_projects/2000/monitoring/fp_monitoring_2000_exs_08_en.pdf.
Riley, A.W. (2004). Evidence that school-age children can self-report on their health. AmbulatoryPediatrics, 4 (4 Suppl), 371-376.
Rebok, G., Riley, A., Forrest, C., Starfield, B., Green, B., Robertson, J. & Tambor, E. (2001). Ele-mentary school-aged children's report of their health: a cognitive testing study. Quality of LifeResearch, 10 (1), 59-70.
Reichenberg, K. & Broberg, A.G. (2000). Quality of life in childhood asthma: use of the PaediatricAsthma Quality of Life Questionnaire in a Swedish sample of children 7 to 9 years old. ActaPaediatrica, 89 (8), 989-995.
Rosenbaum, P.L. & Saigal, S. (1996). Measuring health-related quality of life in pediatric popula-tions: conceptual issues. In B. Spilker (Ed.). Quality of life and pharmacoeconomics in clini-cal trials. Philadelphia: Lippincott-Raven Publishers.
Simeoni, M.C., Auquier, P., Antoniotti, S., Sapin, C. & San Marco, J.L. (2000). Validation of aFrench health-related quality of life instrument for adolescents: the VSP-A. Quality of LifeResearch, 9 (4), 393-403.
Smith, R.M., Schumaker, R.E. & Bush, M.J. (1998). Using item mean squares to evaluate fit to theRasch model. Journal of Outcome Measurement, 2, 66-78.
Sneeuw, K.C.A., Aaronson, N.K., Sprangers, M.A.G., Detmar, S.B., Wever, L.D.V. & Schornage,J.H. (1998). Comparison of Patient and Proxy EORTC QLQ-C30 Ratings in Assessing theQuality of Life of Cancer Patients. Journal of Clinical Epidemiology, 51 (7), 617-631.
Spieth, L.E. & Harris, C. V. (1996). Assessment of health-related quality of life in children and ado-lescents: an integrative review. Journal of Pediatric Psychology, 21 (2), 175-193.
Starfield, B., Bergner, M., Ensminger, M., Riley, A., Ryan, S., Green, B., Skinner, A. & Kim, S.(1993). Adolescent health status measurement: The development of CHIP. Pediatrics, 91, 430-435.
Starfield, B., Riley, A.W., Green, B.F., Ensminger, M.E., Ryan, S.A., Kelleher, K., Kim-Harris, S.,Johnston, D. & Vogel-Crawford, K. (1995). The adolescent CHIP: A population-based meas-ure of health. Medical Care, 33, 553-566.
Starfield, B., Riley, A., Ensminger, M., Green, B., Ryan, S., Kim-Harris, S., Johnston, D. & Vogel,K. (1994/1997/2000). Manual for the Child Health and Illness Profile-Adolescent Edition(CHIP-AETM). Baltimore, MD: The Johns Hopkins University.
103
Chapter 10
Theunissen, N.C., Vogels, T.G., Koopman, H.M., Verrips, G.H., Zwinderman, K.A., Verloove-Van-horick, S.P. & Wit, J.M. (1998). The proxy problem: child report versus parent report in health-related quality of life research. Quality of Life Research, 7 (5), 387-397.
Topolski T, Edwards T.C. & Patrick D.L. (2004). Toward Youth Self-Report of Health and Quali-ty of Life in Population Monitoring. Ambulatory Pediatrics (Supplement), 4 (4 Suppl), 387-394.
Varni, J.W., Seid, M. & Rode, C.A. (1999). The PedsQL: measurement model for the pediatricquality of life inventory. Medical Care, 37 (2), 126-139.
Varni, J.W., Seid, M. & Kurtin, P.S. (2001). PedsQL 4.0: reliability and validity of the PediatricQuality of Life Inventory version 4.0 generic core scales in healthy and patient populations.Medical Care, 39 (8), 800-12.
Verrips, G.H., Vogels, A.G.C., Verloove-Vanhorick, S.P., Fekkes, M., Koopman, H.M., Kamphuis,R.P., Theunissen, N.C.M. & Wit, J.M. (1998). Health-Related Quality of Life Measure forChildren - the TACQOL. J Applied Therapeutics, 1, 357-360.
Verrips, G.H.W., Vogels, A.G.C., den Ouden, A.L., Paneth, N. & Verloove-Vanhorick, S.P. (2000).Measuring health-related quality of life in adolescents: agreement between raters and betweenmethods of administration. Child: Care, Health and Development, 26 (6), 457-469.
Vogels, T., Verrips, G.H., Verloove-Vanhorick, S.P., Fekkes, M., Kamphuis, R.P., Koopman, H.M.,Theunissen, N.C. & Wit, J.M. (1998). Measuring health-related quality of life in children: thedevelopment of the TACQOL parent form. Quality of Life Research, 7 (5), 457-465.
Wallander, J.L., Schmitt, M. & Koot, H.M. (2004). Quality of life measurement in children andadolescents: issues, instruments, and applications. Journal of Clinical Psychology, 57 (4), 571-585.
Ware, J.E., Harris, W.J., Gandek, B., Rogers, B.W. & Reese, P.R. (1997). MAP-R for Windows:Multitrait/Multi-item Analysis Program - Revised User's Guide. Boston, MA: Health Assess-ment Lab.
Ware, J.E., Kosinski, M. & Keller, S.D. (1996). A 12-Item Short-Form Health Survey: Construc-tion of scales and preliminary tests of reliability and validity. Medical Care, 34 (3), 220-233.
Weissman, M.M. (1996). SAS-Social Support Scale. In: I. McDowell & C. Newell (eds.).Measur-ing Health. A Guide to Rating Scales and Questionnaires. New York: Oxford University Press.
Whiteman, D. & Green, A. (1997). Wherein lies the truth? Assessment of agreement between par-ent proxy and child respondents. International Journal of Epidemiology, 26 (4), 855-859.
WHO, Constitution of the World Health Organization. 1948, Genf: WHO.WHOQOL Group (1993). Study protocol for the World Health Organisation project to develop a
quality of life assessment instrument (WHOQOL). Quality of Life Research, 2, 153-159.
104
List of Figures
List of Figures
Figure 1: Participants in the KIDSCREEN project ........................................................21Figure 2: Steps in the development of the KIDSCREEN instrument ............................22Figure 3: Criteria for the MEDLINE search ..................................................................24Figure 4: Statistical analyses using the pilot study data for the item reduction ............32Figure 5: KIDSCREEN model including determinants..................................................33Figure 6: Selection of the KIDSCREEN questionnaire version ....................................78Figure 7: Selection of national norm data ......................................................................78Figure 8: Example of a displayed KIDSCREEN question ............................................78Figure 9: Ruler with response category thresholds and the t-value distribution ............89
105

List of Tables
List of Tables
Table 1: Generation of items and item reduction steps of the KIDSCREEN questionnaire ............................................................................27
Table 2: KIDSCREEN Quality of Life model for pilot study.......................................29Table 3: National Samples of the KIDSCREEN Pilot Study........................................31Table 4: Operationalisation of determinants and number of items in the
KIDSCREEN survey for children, adolescents and parents ..........................34Table 5: Sampling and data collection: procedures and results a ................................37Table 6: Sampling and data collection: procedures and results a ................................39Table 7: Educational level of mothers and fathers answering KIDSCREEN
compared with reference data (Eurostat) for women and men ......................40Table 8: Characteristics of participants and people who refused to participate
in the KIDSCREEN study ..............................................................................43Table 9: Scale description and internal consistency of KIDSCREEN child
and adolescent version ....................................................................................47Table 10: Test-Retest reliability of the KIDSCREEN child and adolescent
version (approx. 2 weeks) ..............................................................................48Table 11: Discriminatory power on whole sample and by country ................................50Table 12: Scaling success, Rasch measurement itemfit, DIF, and CFA ........................51Table 13: Inter-scale correlation for KIDSCREEN-52 ..................................................53Table 14: Inter-scale-correlation for KIDSCREEN-27 ..................................................53Table 15: Differences in KIDSCREEN dimension scores by family affluence ............55Table 16: Differences in KIDSCREEN dimension scores by highest parent's
level of education ............................................................................................56Table 17: Differences in KIDSCREEN dimension scores by health care needs
(CSHCN) ........................................................................................................57Table 18: Correlation between KIDSCREEN scales and the Psychosomatic
Health Complaints Index ................................................................................58Table 19: Differences in KIDSCREEN dimension scores by mental health
status (SDQ) ....................................................................................................60Table 20: Differences in KIDSCREEN dimension scores by a visit to a health
care professional..............................................................................................61Table 21: Differences in KIDSCREEN dimension scores by hospitalisation
during the past 12 months ..............................................................................61Table 22: Differences in KIDSCREEN dimension scores by level of social support ....62Table 23: Differences in KIDSCREEN dimension scores by parent-child relations......63Table 24: Differences in KIDSCREEN dimension scores by parental smoking
in front of the child..........................................................................................64Table 25: Differences in KIDSCREEN dimension scores by parental problems
with alcohol ....................................................................................................66Table 26: Convergent validity of the KIDSCREEN, Pearson correlation coefficients
of the KIDSCREEN dimensions and other HRQoL instruments. ..................67Table 27: Psychometric properties of the KIDSCREEN Proxy versions ......................70
106
List of Tables
107
Table 28: MTMM Pearson correlations between the child and parent reports for the KIDSCREEN-52 items version ..........................................................72
Table 29: MTMM Pearson correlations between the child and parent reports for the KIDSCREEN-27..................................................................................73
Table 30: KIDSCREEN items to be recoded into values between 1-5 (higher values indicating a better HRQoL) ....................................................82
Table 31: Interpretation of KIDSCREEN dimensions ....................................................85


The KIDSCREEN Health Related Quality of Life Questionnaires
The KIDSCREEN Health Related Qualityof Life Questionnaires
Appendix A0
On the following pages, the KIDSCREEN questionnaires are printed using the Englishversion. All language versions are available on the CD-ROM that is included in this man-ual and/or via internet: www.kidscreen.org
The questionnaires are presented in the following sequence:
Self report versionKIDSCREEN-52 HRQoL Questionnaire ......................................................................111KIDSCREEN-27 HRQoL Questionnaire ......................................................................119KIDSCREEN-10 Index Questionnaire..........................................................................125
Proxy report versionKIDSCREEN-52-PROXY HRQoL Questionnaire ......................................................129KIDSCREEN-27-PROXY HRQoL Questionnaire ......................................................137KIDSCREEN-10-PROXY Index Questionnaire ..........................................................143
109

The KIDSCREEN Health Related Quality of Life Questionnaires
111
Appendix A0
112
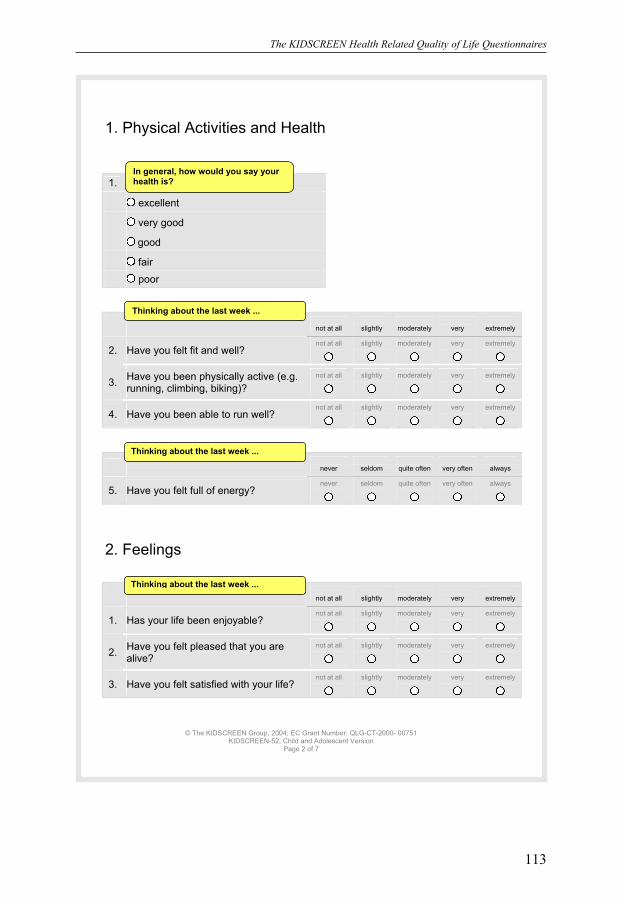
The KIDSCREEN Health Related Quality of Life Questionnaires
113
© The KIDSCREEN Group, 2004; EC Grant Number: QLG-CT-2000- 00751 KIDSCREEN-52, Child and Adolescent Version
Page 2 of 7
1. Physical Activities and Health
1.
excellent
very good
good
fair
poor
not at all
slightly
moderately
very
extremely
2. Have you felt fit and well? not at all
slightly
moderately
very
extremely
3. Have you been physically active (e.g. running, climbing, biking)?
not at all
slightly
moderately
very
extremely
4. Have you been able to run well? not at all
slightly
moderately
very
extremely
never
seldom
quite often
very often
always
5. Have you felt full of energy? never
seldom
quite often
very often
always
2. Feelings
not at all
slightly
moderately
very
extremely
1. Has your life been enjoyable? not at all
slightly
moderately
very
extremely
2. Have you felt pleased that you are alive?
not at all
slightly
moderately
very
extremely
3. Have you felt satisfied with your life? not at all
slightly
moderately
very
extremely
Thinking about the last week ...
Thinking about the last week ...
In general, how would you say your health is?
Thinking about the last week ...

Appendix A0
114
© The KIDSCREEN Group, 2004; EC Grant Number: QLG-CT-2000- 00751 KIDSCREEN-52, Child and Adolescent Version
Page 3 of 7
never
seldom
quite often
very often
always
4. Have you been in a good mood? never
seldom
quite often
very often
always
5. Have you felt cheerful? never
seldom
quite often
very often
always
6. Have you had fun? never
seldom
quite often
very often
always
3. General Mood
never
seldom
quite often
very often
always
1. Have you felt that you do everything badly?
never
seldom
quite often
very often
always
2. Have you felt sad? never
seldom
quite often
very often
always
3. Have you felt so bad that you didn’t want to do anything?
never
seldom
quite often
very often
always
4. Have you felt that everything in your life goes wrong?
never
seldom
quite often
very often
always
5. Have you felt fed up? never
seldom
quite often
very often
always
6. Have you felt lonely? never
seldom
quite often
very often
always
7. Have you felt under pressure? never
seldom
quite often
very often
always
Thinking about the last week ...
Thinking about the last week ...

The KIDSCREEN Health Related Quality of Life Questionnaires
115
© The KIDSCREEN Group, 2004; EC Grant Number: QLG-CT-2000- 00751 KIDSCREEN-52, Child and Adolescent Version
Page 4 of 7
4. About Yourself
never
seldom
quite often
very often
always
1. Have you been happy with the way you are?
never
seldom
quite often
very often
always
2. Have you been happy with your clothes?
never
seldom
quite often
very often
always
3. Have you been worried about the way you look?
never
seldom
quite often
very often
always
4. Have you felt jealous of the way other girls and boys look?
never
seldom
quite often
very often
always
5. Would you like to change something about your body?
never
seldom
quite often
very often
always
5. Free Time
never
seldom
quite often
very often
always
1. Have you had enough time for yourself?
never
seldom
quite often
very often
always
2. Have you been able to do the things that you want to do in your free time?
never
seldom
quite often
very often
always
3. Have you had enough opportunity to be outside?
never
seldom
quite often
very often
always
4. Have you had enough time to meet friends?
never
seldom
quite often
very often
always
5. Have you been able to choose what to do in your free time?
never
seldom
quite often
very often
always
Thinking about the last week ...
Thinking about the last week ...

Appendix A0
116
© The KIDSCREEN Group, 2004; EC Grant Number: QLG-CT-2000- 00751 KIDSCREEN-52, Child and Adolescent Version
Page 5 of 7
6. Family and Home Life
not at all
slightly
moderately
very
extremely
1. Have your parent(s) understood you? not at all
slightly
moderately
very
extremely
2. Have you felt loved by your parent(s)?not at all
slightly
moderately
very
extremely
never
seldom
quite often
very often
always
3. Have you been happy at home? never
seldom
quite often
very often
always
4. Have your parent(s) had enough time for you?
never
seldom
quite often
very often
always
5. Have your parent(s) treated you fairly?never
seldom
quite often
very often
always
6. Have you been able talk to your parent(s) when you wanted to?
never
seldom
quite often
very often
always
7. Money Matters
never
seldom
quite often
very often
always
1. Have you had enough money to do the same things as your friends?
never
seldom
quite often
very often
always
2. Have you had enough money for your expenses?
never
seldom
quite often
very often
always
not at all
slightly
moderately
very
extremely
3. Do you have enough money to do things with your friends?
not at all
slightly
moderately
very
extremely
Thinking about the last week ...
Thinking about the last week ...
Thinking about the last week ...
Thinking about the last week ...

The KIDSCREEN Health Related Quality of Life Questionnaires
117
© The KIDSCREEN Group, 2004; EC Grant Number: QLG-CT-2000- 00751 KIDSCREEN-52, Child and Adolescent Version
Page 6 of 7
8. Friends
never
seldom
quite often
very often
always
1. Have you spent time with your friends?
never
seldom
quite often
very often
always
2. Have you done things with other girls and boys?
never
seldom
quite often
very often
always
3. Have you had fun with your friends? never
seldom
quite often
very often
always
4. Have you and your friends helped each other?
never
seldom
quite often
very often
always
5. Have you been able to talk about everything with your friends?
never
seldom
quite often
very often
always
6. Have you been able to rely on your friends?
never
seldom
quite often
very often
always
9. School and Learning
not at all
slightly
moderately
very
extremely
1. Have you been happy at school? not at all
slightly
moderately
very
extremely
2. Have you got on well at school? not at all
slightly
moderately
very
extremely
3. Have you been satisfied with your teachers?
not at all
slightly
moderately
very
extremely
Thinking about the last week ...
Thinking about the last week ...
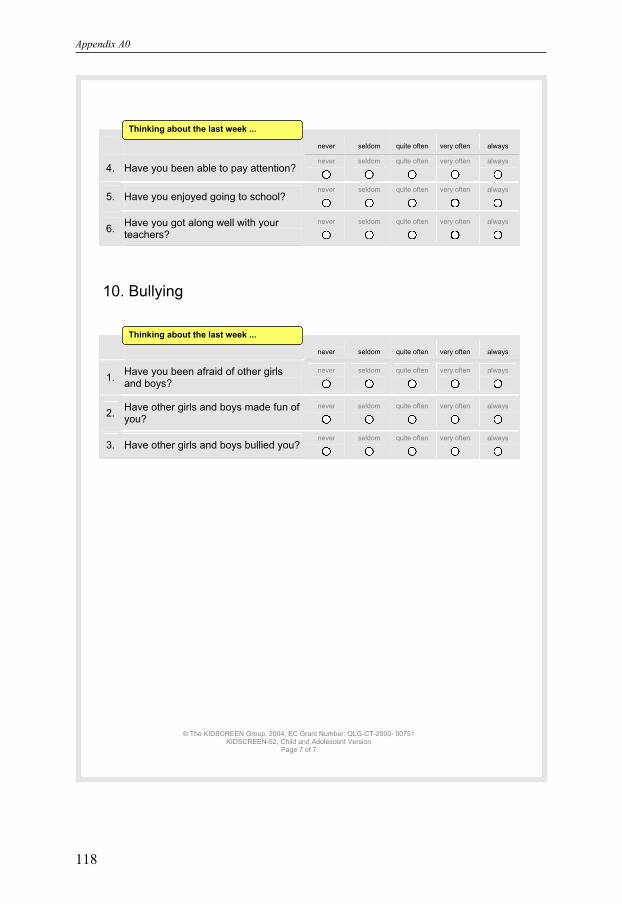
Appendix A0
118
© The KIDSCREEN Group, 2004; EC Grant Number: QLG-CT-2000- 00751 KIDSCREEN-52, Child and Adolescent Version
Page 7 of 7
never
seldom
quite often
very often
always
4. Have you been able to pay attention? never
seldom
quite often
very often
always
5. Have you enjoyed going to school? never
seldom
quite often
very often
always
6. Have you got along well with your teachers?
never
seldom
quite often
very often
always
10. Bullying
never
seldom
quite often
very often
always
1. Have you been afraid of other girls and boys?
never
seldom
quite often
very often
always
2. Have other girls and boys made fun of you?
never
seldom
quite often
very often
always
3. Have other girls and boys bullied you?never
seldom
quite often
very often
always
Thinking about the last week ...
Thinking about the last week ...

The KIDSCREEN Health Related Quality of Life Questionnaires
119
Appendix A0
120

The KIDSCREEN Health Related Quality of Life Questionnaires
121
© The KIDSCREEN Group, 2004; EC Grant Number: QLG-CT-2000- 00751 KIDSCREEN-27, Child and Adolescent Version
Page 2 of 4
1. Physical Activities and Health
1.
excellent
very good
good
fair
poor
not at all
slightly
moderately
very
extremely
2. Have you felt fit and well? not at all
slightly
moderately
very
extremely
3. Have you been physically active (e. g. running, climbing, biking)?
not at all
slightly
moderately
very
extremely
4. Have you been able to run well? not at all
slightly
moderately
very
extremely
never
seldom
quite often
very often
always
5. Have you felt full of energy? never
seldom
quite often
very often
always
2. General Mood and Feelings about Yourself
not at all
slightly
moderately
very
extremely
1. Has your life been enjoyable? not at all
slightly
moderately
very
extremely
never
seldom
quite often
very often
always
2. Have you been in a good mood? never
seldom
quite often
very often
always
3. Have you had fun? never
seldom
quite often
very often
always
Thinking about the last week...
Thinking about the last week...
Thinking about the last week...
In general, how would you say your health is?
Thinking about the last week...

Appendix A0
122
© The KIDSCREEN Group, 2004; EC Grant Number: QLG-CT-2000- 00751 KIDSCREEN-27, Child and Adolescent Version
Page 3 of 4
never
seldom
quite often
very often
always
4. Have you felt sad? never
seldom
quite often
very often
always
5. Have you felt so bad that you didn’t want to do anything?
never
seldom
quite often
very often
always
6. Have you felt lonely? never
seldom
quite often
very often
always
7. Have you been happy with the way you are?
never
seldom
quite often
very often
always
3. Family and Free Time
never
seldom
quite often
very often
always
1. Have you had enough time for yourself?
never
seldom
quite often
very often
always
2. Have you been able to do the things that you want to do in your free time?
never
seldom
quite often
very often
always
3. Have your parent(s) had enough time for you?
never
seldom
quite often
very often
always
4. Have your parent(s) treated you fairly?never
seldom
quite often
very often
always
5. Have you been able talk to your parent(s) when you wanted to?
never
seldom
quite often
very often
always
6. Have you had enough money to do the same things as your friends?
never
seldom
quite often
very often
always
7. Have you had enough money for your expenses?
never
seldom
quite often
very often
always
Thinking about the last week...
Thinking about the last week...
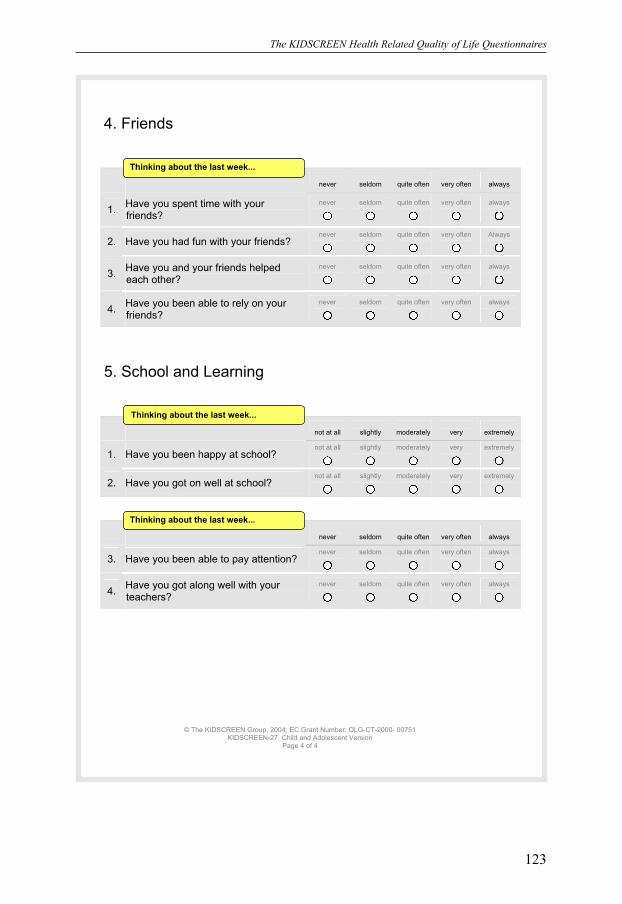
The KIDSCREEN Health Related Quality of Life Questionnaires
123
© The KIDSCREEN Group, 2004; EC Grant Number: QLG-CT-2000- 00751 KIDSCREEN-27, Child and Adolescent Version
Page 4 of 4
4. Friends
never
seldom
quite often
very often
always
1. Have you spent time with your friends?
never
seldom
quite often
very often
always
2. Have you had fun with your friends? never
seldom
quite often
very often
Always
3. Have you and your friends helped each other?
never
seldom
quite often
very often
always
4. Have you been able to rely on your friends?
never
seldom
quite often
very often
always
5. School and Learning
not at all
slightly
moderately
very
extremely
1. Have you been happy at school? not at all
slightly
moderately
very
extremely
2. Have you got on well at school? not at all
slightly
moderately
very
extremely
never
seldom
quite often
very often
always
3. Have you been able to pay attention? never
seldom
quite often
very often
always
4. Have you got along well with your teachers?
never
seldom
quite often
very often
always
Thinking about the last week...
Thinking about the last week...
Thinking about the last week...


The KIDSCREEN Health Related Quality of Life Questionnaires
125

Appendix A0
126
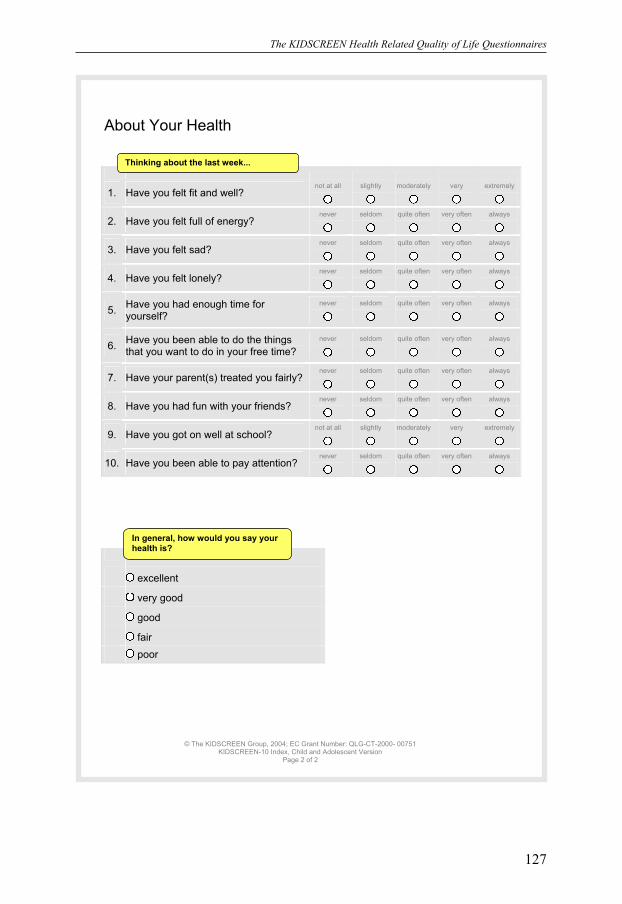
The KIDSCREEN Health Related Quality of Life Questionnaires
127
© The KIDSCREEN Group, 2004; EC Grant Number: QLG-CT-2000- 00751 KIDSCREEN-10 Index, Child and Adolescent Version
Page 2 of 2
About Your Health
1. Have you felt fit and well? not at all
slightly
moderately
very
extremely
2. Have you felt full of energy? never
seldom
quite often
very often
always
3. Have you felt sad? never
seldom
quite often
very often
always
4. Have you felt lonely? never
seldom
quite often
very often
always
5. Have you had enough time for yourself?
never
seldom
quite often
very often
always
6. Have you been able to do the things that you want to do in your free time?
never
seldom
quite often
very often
always
7. Have your parent(s) treated you fairly?never
seldom
quite often
very often
always
8. Have you had fun with your friends? never
seldom
quite often
very often
always
9. Have you got on well at school? not at all
slightly
moderately
very
extremely
10. Have you been able to pay attention? never
seldom
quite often
very often
always
excellent
very good
good
fair
poor
In general, how would you say your health is?
Thinking about the last week...

The KIDSCREEN Health Related Quality of Life Questionnaires
129
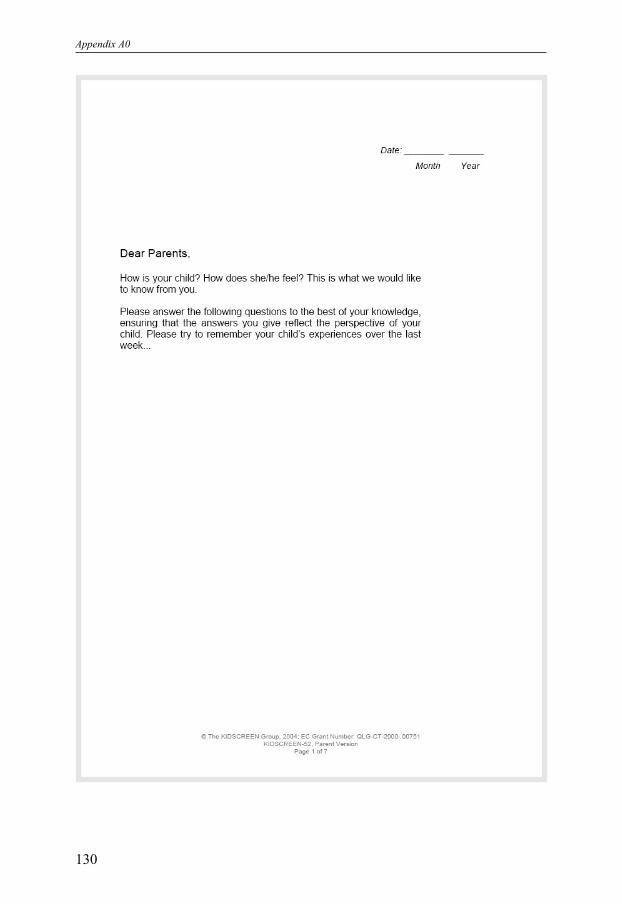
Appendix A0
130

The KIDSCREEN Health Related Quality of Life Questionnaires
131
© The KIDSCREEN Group, 2004; EC Grant Number: QLG-CT-2000- 00751 KIDSCREEN-52, Parent Version
Page 2 of 7
1. Physical Activities and Health
1.
excellent
very good
good
fair
poor
not at all
slightly
moderately
very
extremely
2. Has your child felt fit and well? not at all
slightly
moderately
very
extremely
3. Has your child been physically active (e.g. running, climbing, biking)?
not at all
slightly
moderately
very
extremely
4. Has your child been able to run well? not at all
slightly
moderately
very
extremely
never
seldom
quite often
very often
always
5. Has your child felt full of energy? never
seldom
quite often
very often
always
2. Feelings
not at all
slightly
moderately
very
extremely
1. Has your child felt that life was enjoyable?
not at all
slightly
moderately
very
extremely
2. Has your child felt pleased that he/she is alive?
not at all
slightly
moderately
very
extremely
3. Has your child felt satisfied with his/her life?
not at all
slightly
moderately
very
extremely
In general, how would your child rate her/his health?
Thinking about the last week ...
Thinking about the last week ...
Thinking about the last week ...

Appendix A0
132
© The KIDSCREEN Group, 2004; EC Grant Number: QLG-CT-2000- 00751 KIDSCREEN-52, Parent Version
Page 3 of 7
never
seldom
quite often
very often
always
4. Has your child been in a good mood? never
seldom
quite often
very often
always
5. Has your child felt cheerful? never
seldom
quite often
very often
always
6. Has your child had fun? never
seldom
quite often
very often
always
3. General Mood
never
seldom
quite often
very often
always
1. Has your child felt that he/she does everything badly?
never
seldom
quite often
very often
always
2. Has your child felt sad? never
seldom
quite often
very often
always
3. Has your child felt so bad that he/she didn’t want to do anything?
never
seldom
quite often
very often
always
4. Has your child felt that everything in his/her life goes wrong?
never
seldom
quite often
very often
always
5. Has your child felt fed up? never
seldom
quite often
very often
always
6. Has your child felt lonely? never
seldom
quite often
very often
always
7. Has your child felt under pressure? never
seldom
quite often
very often
always
Thinking about the last week ...
Thinking about the last week ...

The KIDSCREEN Health Related Quality of Life Questionnaires
133
© The KIDSCREEN Group, 2004; EC Grant Number: QLG-CT-2000- 00751 KIDSCREEN-52, Parent Version
Page 4 of 7
4. About Your Child
never
seldom
quite often
very often
always
1. Has your child been happy with the way he/she is?
never
seldom
quite often
very often
always
2. Has your child been happy with his/her clothes?
never
seldom
quite often
very often
always
3. Has your child been worried about the way he/she looks?
never
seldom
quite often
very often
always
4. Has your child felt jealous of the way other girls and boys look?
never
seldom
quite often
very often
always
5. Has your child wanted to change something about his/her body?
never
seldom
quite often
very often
always
5. Free Time
never
seldom
quite often
very often
always
1. Has your child had enough time for him/herself?
never
seldom
quite often
very often
always
2. Has your child been able to do the things that he/she wants to do in his/her free time?
never
seldom
quite often
very often
always
3. Has your child had enough opportunity to be outside?
never
seldom
quite often
very often
always
4. Has your child had enough time to meet friends?
never
seldom
quite often
very often
always
5. Has your child been able to choose what to do in his/her free time?
never
seldom
quite often
very often
always
Thinking about the last week ...
Thinking about the last week ...

Appendix A0
134
© The KIDSCREEN Group, 2004; EC Grant Number: QLG-CT-2000- 00751 KIDSCREEN-52, Parent Version
Page 5 of 7
6. Family and Home Life
not at all
slightly
moderately
very
extremely
1. Has your child felt understood by his/her parent(s)?
not at all
slightly
moderately
very
extremely
2. Has your child felt loved by his/her parent(s)?
not at all
slightly
moderately
very
extremely
never
seldom
quite often
very often
always
3. Has your child been happy at home? never
seldom
quite often
very often
always
4. Has your child felt that his/her parent(s) had enough time for him/her?
never
seldom
quite often
very often
always
5. Has your child felt that his/her parent(s) treated him/her fairly?
never
seldom
quite often
very often
always
6. Has your child been able to talk to his/her parent(s) when he/she wanted to?
never
seldom
quite often
very often
always
Thinking about the last week ...
Thinking about the last week ...

The KIDSCREEN Health Related Quality of Life Questionnaires
135
© The KIDSCREEN Group, 2004; EC Grant Number: QLG-CT-2000- 00751 KIDSCREEN-52, Parent Version
Page 6 of 7
7. Money matters
never
seldom
quite often
very often
always
1. Has your child had enough money to do the same things as his/her friends?
never
seldom
quite often
very often
always
2. Has your child felt that he/she had enough money for his/her expenses?
never
seldom
quite often
very often
always
not at all
slightly
moderately
very
extremely
3. Does your child feel that he/she has enough money to do things with his/her friends?
not at all
slightly
moderately
very
extremely
8. Friends
never
seldom
quite often
very often
always
1. Has your child spent time with his/her friends?
never
seldom
quite often
very often
always
2. Has your child done things with other girls and boys?
never
seldom
quite often
very often
always
3. Has your child had fun with his/her friends?
never
seldom
quite often
very often
always
4. Have your child and his/her friends helped each other?
never
seldom
quite often
very often
always
5. Has your child been able to talk about everything with his/her friends?
never
seldom
quite often
very often
always
6. Has your child been able to rely on his/her friends?
never
seldom
quite often
very often
always
Thinking about the last week ...
Thinking about the last week ...
Thinking about the last week ...

Appendix A0
136
© The KIDSCREEN Group, 2004; EC Grant Number: QLG-CT-2000- 00751 KIDSCREEN-52, Parent Version
Page 7 of 7
9. School and Learning
not at all
slightly
moderately
very
extremely
1. Has your child been happy at school? not at all
slightly
moderately
very
extremely
2. Has your child got on well at school? not at all
slightly
moderately
very
extremely
3. Has your child been satisfied with his/her teachers?
not at all
slightly
moderately
very
extremely
never
seldom
quite often
very often
always
4. Has your child been able to pay attention?
never
seldom
quite often
very often
always
5. Has your child enjoyed going to school?
never
seldom
quite often
very often
always
6. Has your child got along well with his/her teachers?
never
seldom
quite often
very often
always
10. Bullying
never
seldom
quite often
very often
always
1. Has your child been afraid of other girls and boys?
never
seldom
quite often
very often
always
2. Have other girls and boys made fun of your child?
never
seldom
quite often
very often
always
3. Have other girls and boys bullied your child?
never
seldom
quite often
very often
always
Thinking about the last week ...
Thinking about the last week ...
Thinking about the last week ...

The KIDSCREEN Health Related Quality of Life Questionnaires
137

Appendix A0
138

The KIDSCREEN Health Related Quality of Life Questionnaires
139
© The KIDSCREEN Group, 2004; EC Grant Number: QLG-CT-2000- 00751 KIDSCREEN-27, Parent Version
Page 2 of 4
1. Physical Activities and Health
1.
excellent
very good
good
fair
poor
not at all slightly moderately very extremely
2. Has your child felt fit and well? not at all
slightly
moderately
very
extremely
3. Has your child been physically active (e.g. running, climbing, biking)?
not at all
slightly
moderately
very
extremely
4. Has your child been able to run well? not at all
slightly
moderately
very
extremely
never seldom quite often very often always
5. Has your child felt full of energy? never
seldom
quite often
very often
always
2. General Mood and Your Child’s Feelings
not at all slightly moderately very extremely
1. Has your child felt that life was enjoyable?
not at all
slightly
moderately
very
extremely
never seldom quite often very often always
2. Has your child been in a good mood? never
seldom
quite often
very often
always
3. Has your child had fun? never
seldom
quite often
very often
always
Thinking about the last week ...
Thinking about the last week...
Thinking about the last week...
In general, how would your child rate her/his health?
Thinking about the last week ...

Appendix A0
140
© The KIDSCREEN Group, 2004; EC Grant Number: QLG-CT-2000- 00751 KIDSCREEN-27, Parent Version
Page 3 of 4
never
seldom
quite often
very often
always
4. Has your child felt sad? never
seldom
quite often
very often
always
5. Has your child felt so bad that he/she didn’t want to do anything?
never
seldom
quite often
very often
always
6. Has your child felt lonely? never
seldom
quite often
very often
always
7. Has your child been happy with the way he/she is?
never
seldom
quite often
very often
always
3. Family and Your Child’s Free Time
never
seldom
quite often
very often
always
1. Has your child had enough time for him/herself?
never
seldom
quite often
very often
always
2. Has your child been able to do the things that he/she wants to do in his/her free time?
never
seldom
quite often
very often
always
3. Has your child felt that his/her parent(s) had enough time for him/her?
never
seldom
quite often
very often
always
4. Has your child felt that his/her parent(s) treated him/her fairly?
never
seldom
quite often
very often
always
5. Has your child been able to talk to his/her parent(s) when he/she wanted to?
never
seldom
quite often
very often
always
6. Has your child had enough money to do the same things as his/her friends?
never
seldom
quite often
very often
always
7. Has your child felt that he/she had enough money for his/her expenses?
never
seldom
quite often
very often
always
Thinking about the last week...
Thinking about the last week...

The KIDSCREEN Health Related Quality of Life Questionnaires
141
© The KIDSCREEN Group, 2004; EC Grant Number: QLG-CT-2000- 00751 KIDSCREEN-27, Parent Version
Page 4 of 4
4. Friends
never
seldom
quite often
very often
always
1. Has your child spent time with his/her friends?
never
seldom
quite often
very often
always
2. Has your child had fun with his/her friends?
never
seldom
quite often
very often
Always
3. Have your child and his/her friends helped each other?
never
seldom
quite often
very often
always
4. Has your child been able to rely on his/her friends?
never
seldom
quite often
very often
always
5. School and Learning
not at all
slightly
moderately
very
extremely
1. Has your child been happy at school? not at all
slightly
moderately
very
extremely
2. Has your child got on well at school? not at all
slightly
moderately
very
extremely
never
seldom
quite often
very often
always
3. Has your child been able to pay attention?
never
seldom
quite often
very often
always
4. Has your child got along well with his/her teachers?
never
seldom
quite often
very often
always
Thinking about the last week...
Thinking about the last week...
Thinking about the last week...


The KIDSCREEN Health Related Quality of Life Questionnaires
143

Appendix A0
144
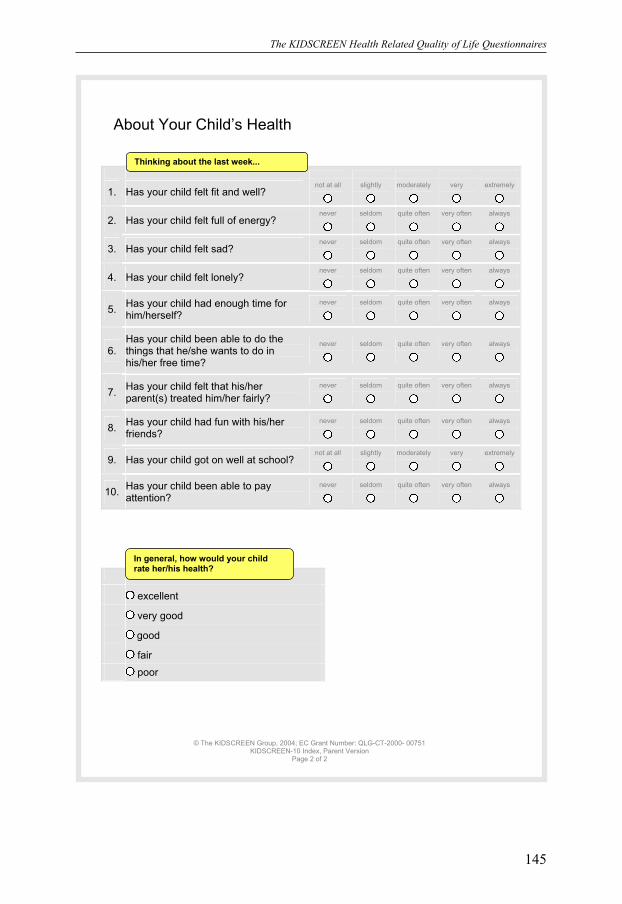
The KIDSCREEN Health Related Quality of Life Questionnaires
145
© The KIDSCREEN Group, 2004; EC Grant Number: QLG-CT-2000- 00751 KIDSCREEN-10 Index, Parent Version
Page 2 of 2
About Your Child’s Health
1. Has your child felt fit and well? not at all
slightly
moderately
very
extremely
2. Has your child felt full of energy? never
seldom
quite often
very often
always
3. Has your child felt sad? never
seldom
quite often
very often
always
4. Has your child felt lonely? never
seldom
quite often
very often
always
5. Has your child had enough time for him/herself?
never
seldom
quite often
very often
always
6. Has your child been able to do the things that he/she wants to do in his/her free time?
never
seldom
quite often
very often
always
7. Has your child felt that his/her parent(s) treated him/her fairly?
never
seldom
quite often
very often
always
8. Has your child had fun with his/her friends?
never
seldom
quite often
very often
always
9. Has your child got on well at school? not at all
slightly
moderately
very
extremely
10. Has your child been able to pay attention?
never
seldom
quite often
very often
always
excellent
very good
good
fair
poor
In general, how would your child rate her/his health?
Thinking about the last week...

Provision of European Norm Data for Children, Adolescents and Their Parents for Group Level Comparison
147
KIDSCREEN Health Related Quality ofLife Questionnaires
Appendix A1:Provision of European Norm Data for Children, Adolescents andTheir Parents for Group Level Comparison
Table A1-1: European Normdata KIDSCREEN children 8-11. ................................148Table A1-2: European Normdata KIDSCREEN adolescent 12-18. ..........................150Table A1-3: European Normdata KIDSCREEN females & males. ..........................152Table A1-4: European Normdata KIDSCREEN children & adolscents 8-18. ..........154Table A1-5: European Normdata KIDSCREEN females & males, children
& adolescents age 8-18 (self report & proxy report). ............................156Table A1-6: European Normdata proxy KIDSCREEN children 8-11. ......................158Table A1-7: European Normdata proxy KIDSCREEN adolescent 12-18. ................160Table A1-8: European Normdata proxy KIDSCREEN females & males. ................162Table A1-9: European Normdata proxy KIDSCREEN children
& adolscents 8-18. ..................................................................................164

Appendix A1
148
Fem
ale
Mal
e
Per
cen
tile
s P
erce
nti
les
Sca
le
n
Mea
n
sd
10
2
5
50
7
5
90
n
M
ean
sd
1
0
25
5
0
75
9
0
KID
SC
RE
EN
-52
Ph
ysi
cal
Wel
l-b
ein
g
T
2990
5
3,0
1
9,9
5
40,4
5
47,0
8
52,4
3
59,3
6
64,3
0
2854
5
4,4
7
9,9
0
42,5
3
47,0
8
55,6
0
59,3
6
64,3
0
S
2
990
7
5,1
6
17,4
8
50,0
0
66,6
7
77,7
8
88,8
9
94,4
4
2854
7
7,8
0
17,1
7
55,5
6
66,6
7
83,3
3
88,8
9
94,4
4
Psy
cholo
gic
al W
ell-
bei
ng
T
3
034
5
3,5
0
9,4
6
41,5
3
47,1
2
54,4
9
61,5
5
68,4
9
2884
5
3,2
7
9,3
3
41,5
3
47,1
2
54,4
9
57,6
0
68,4
9
S
3
034
8
2,6
7
15,2
8
62,5
0
75,0
0
87,5
0
95,8
3
100
,00
2
884
8
2,4
5
15,2
4
62,5
0
75,0
0
87,5
0
91,6
7
100
,00
Mood
s &
Em
oti
on
s T
2
994
5
1,9
4
9,9
7
40,0
0
45,4
4
51,3
4
57,4
0
70,9
1
2849
5
2,3
4
9,9
7
41,2
1
45,4
4
51,3
4
57,4
0
70,9
1
S
2
994
8
1,7
9
15,6
5
60,7
1
75,0
0
85,7
1
92,8
6
100
,00
2
849
8
2,4
6
15,0
2
64,2
9
75,0
0
85,7
1
92,8
6
100
,00
Sel
f-P
ercep
tion
T
3035
5
3,5
9
9,8
1
41,8
3
46,0
9
52,1
9
60,1
1
69,7
8
2876
5
5,4
0
9,5
7
43,1
7
47,7
8
55,3
8
60,1
1
69,7
8
S
3
035
8
0,8
3
17,6
7
55,0
0
70,0
0
85,0
0
95,0
0
100
,00
2
876
8
4,2
2
15,4
5
60,0
0
75,0
0
90,0
0
95,0
0
100
,00
Au
ton
om
y
T
3036
5
1,2
3
9,8
3
38,9
8
45,1
7
50,7
7
56,2
7
68,7
5
2886
5
1,9
4
9,4
8
40,5
4
45,1
7
50,7
7
56,2
7
68,7
5
S
3
036
7
5,4
3
20,0
0
45,0
0
65,0
0
80,0
0
90,0
0
100
,00
2
886
7
7,1
6
18,6
2
50,0
0
65,0
0
80,0
0
90,0
0
100
,00
Par
ent
Rel
atio
n &
Hom
e L
ife
T
3017
5
2,9
4
9,2
8
41,1
0
47,5
0
51,8
1
58,5
3
65,8
7
2867
5
2,3
4
9,0
8
41,1
0
45,7
2
51,8
1
58,5
3
65,8
7
S
3
017
8
4,4
9
16,0
6
62,5
0
79,1
7
87,5
0
95,8
3
100
,00
2
867
8
3,7
1
15,8
0
62,5
0
75,0
0
87,5
0
95,8
3
100
,00
Soci
al S
upp
ort
& P
eers
T
2
999
5
0,9
4
10,2
5
39,4
9
43,6
0
50,2
4
58,1
4
62,6
6
2833
5
0,3
0
9,8
2
39,4
9
43,6
0
50,2
4
54,9
3
62,6
6
S
2
999
7
5,2
8
19,2
3
50,0
0
62,5
0
79,1
7
91,6
7
95,8
3
2833
7
4,4
1
18,7
6
50,0
0
62,5
0
79,1
7
87,5
0
95,8
3
Sch
ool
En
vir
on
men
t T
2
999
5
5,7
2
10,2
0
42,3
5
48,6
1
56,4
0
61,8
7
73,8
0
2863
5
3,2
7
10,5
8
39,5
3
45,3
4
52,2
3
58,8
8
65,9
4
S
2
999
7
7,5
2
18,3
4
50,0
0
66,6
7
83,3
3
91,6
7
100
,00
2
863
7
2,6
6
20,3
1
41,6
7
58,3
3
75,0
0
87,5
0
95,8
3
Bu
llyin
g
T
3044
4
7,5
3
10,6
5
33,1
3
38,2
9
48,0
7
58,8
5
58,8
5
2898
4
7,6
2
10,4
2
33,1
3
38,2
9
48,0
7
58,8
5
58,8
5
S
3
044
8
5,0
6
18,8
2
58,3
3
75,0
0
91,6
7
100
,00
1
00
,00
2
898
8
5,3
5
18,0
7
58,3
3
75,0
0
91,6
7
100
,00
1
00
,00
Fin
anci
al R
esou
rces
T
2
898
4
9,1
3
10,4
2
35,1
2
41,9
2
49,2
8
56,3
5
62,8
6
2774
4
8,6
1
10,4
7
35,1
2
41,9
2
49,2
8
56,3
5
62,8
6
S
2
898
6
8,8
4
28,1
6
25,0
0
50,0
0
75,0
0
91,6
7
100
,00
2
774
6
7,5
1
28,4
4
25,0
0
50,0
0
75,0
0
91,6
7
100
,00
Tabl
e A1-
1:E
urop
ean
Nor
mda
ta K
IDSC
RE
EN
chi
ldre
n 8-
11

Provision of European Norm Data for Children, Adolescents and Their Parents for Group Level Comparison
149
KID
SC
RE
EN
-2
7
Ph
ysi
cal
Wel
l-b
ein
g
T
2990
5
3,0
1
9,9
5
40,4
5
47,0
8
52,4
3
59,3
6
64,3
0
2854
5
4,4
7
9,9
0
42,5
3
47,0
8
55,6
0
59,3
6
64,3
0
S
2
990
7
5,9
7
16,8
6
50,0
0
65,0
0
80,0
0
90,0
0
95,0
0
2854
7
8,3
8
16,7
3
55,0
0
70,0
0
80,0
0
90,0
0
95,0
0
Psy
cholo
gic
al
T
3015
5
2,7
0
10,0
7
40,3
9
46,5
3
50,6
1
59,5
1
64,3
5
2854
5
3,4
0
9,7
9
41,7
5
46,5
3
53,0
7
59,5
1
64,3
5
S
3
015
8
1,2
1
14,6
4
60,7
1
75,0
0
82,1
4
92,8
6
96,4
3
2854
8
2,4
4
13,7
1
64,2
9
75,0
0
85,7
1
92,8
6
96,4
3
Au
ton
om
y &
Par
ents
T
2
888
5
1,7
3
10,4
6
39,4
7
45,2
5
51,2
1
55,7
5
63,9
9
2762
5
1,4
0
10,1
6
40,5
9
44,0
3
49,4
7
55,7
5
63,9
9
S
2
888
7
6,9
5
17,9
3
50,0
0
67,8
6
82,1
4
89,2
9
96,4
3
2762
7
6,5
9
17,3
3
53,5
7
64,2
9
78,5
7
89,2
9
96,4
3
Soci
al S
upp
ort
& P
eers
T
3
031
5
1,2
0
10,1
3
37,8
6
44,4
0
49,7
9
57,8
3
66,3
4
2866
5
0,7
8
9,9
2
37,8
6
44,4
0
49,7
9
57,8
3
66,3
4
S
3
031
7
9,0
3
19,1
2
50,0
0
68,7
5
81,2
5
93,7
5
100
,00
2
866
7
8,4
3
18,8
2
50,0
0
68,7
5
81,2
5
93,7
5
100
,00
Sch
ool
En
vir
on
men
t T
3
019
5
5,1
3
10,1
7
42,9
4
48,0
9
54,4
0
62,8
4
71,0
0
2879
5
2,8
9
10,4
2
40,7
2
45,3
8
51,0
8
58,1
6
71,0
0
S
3
019
7
8,7
2
17,8
7
56,2
5
68,7
5
81,2
5
93,7
5
100
,00
2
879
7
4,4
9
19,5
2
50,0
0
62,5
0
75,0
0
87,5
0
100
,00
KID
SC
RE
EN
-10
Gen
eral
HR
Qo
L I
nd
ex
T
2937
5
3,8
2
10,8
0
41,2
4
46,9
4
53,1
1
59,8
5
66,8
6
2772
5
4,0
0
10,6
6
42,2
7
46,9
4
53,1
1
59,8
5
66,8
6
S
2
937
7
9,4
7
13,6
5
60,0
0
72,5
0
82,5
0
90,0
0
95,0
0
2772
7
9,8
6
13,0
6
62,5
0
72,5
0
82,5
0
90,0
0
95,0
0
T=
inte
rnat
iona
l T-v
alue
s ba
sed
on R
asch
per
son
para
met
erS
= Su
msc
ore
trans
form
ed in
to v
alue
s be
twee
n 0
-100

Appendix A1
150
Fem
ale
Mal
e
Per
cen
tile
s P
erce
nti
les
Sca
le
n
Mea
n
sd
10
2
5
50
7
5
90
n
M
ean
sd
1
0
25
5
0
75
9
0
KID
SC
RE
EN
-52
Ph
ysi
cal
Wel
l-b
ein
g
T
8077
4
6,8
3
9,1
5
36,5
5
40,4
5
47,0
8
52,4
3
59,3
6
7139
5
0,5
4
9,8
1
38,4
7
44,7
3
49,6
3
55,6
0
64,3
0
S
8
077
6
3,3
5
19,2
8
38,8
9
50,0
0
66,6
7
77,7
8
88,8
9
7139
7
0,6
7
18,6
2
44,4
4
61,1
1
72,2
2
83,3
3
94,4
4
Psy
cholo
gic
al W
ell-
bei
ng
T
8
179
4
7,8
2
10,0
6
35,5
0
41,5
3
47,1
2
54,4
9
61,5
5
7181
4
9,6
9
9,6
7
38,3
7
43,2
5
49,3
4
54,4
9
61,5
5
S
8
179
7
2,4
7
19,6
1
45,8
3
62,5
0
75,0
0
87,5
0
95,8
3
7181
7
6,2
7
17,7
4
54,1
7
66,6
7
79,1
7
87,5
0
95,8
3
Mood
s &
Em
oti
on
s T
8
156
4
7,5
9
9,7
3
35,6
5
41,2
1
47,1
5
54,0
2
62,0
6
7178
5
0,9
9
9,7
4
38,8
6
43,9
1
49,0
9
57,4
0
62,0
6
S
8
156
7
4,2
0
18,6
3
46,4
3
64,2
9
78,5
7
89,2
9
96,4
3
7178
8
0,4
2
15,9
3
57,1
4
71,4
3
82,1
4
92,8
6
96,4
3
Sel
f-P
ercep
tion
T
8176
4
5,7
0
9,0
0
36,4
3
40,5
2
44,5
8
49,7
6
55,3
8
7189
5
1,2
0
9,3
2
40,5
2
44,5
8
49,7
6
55,3
8
69,7
8
S
8
176
6
3,7
8
21,9
6
35,0
0
50,0
0
65,0
0
80,0
0
90,0
0
7189
7
6,7
0
18,1
9
50,0
0
65,0
0
80,0
0
90,0
0
100
,00
Au
ton
om
y
T
8180
4
8,0
1
9,9
3
35,6
1
42,0
6
46,8
5
53,2
2
60,5
2
7191
5
0,9
6
9,9
8
38,9
8
43,5
9
50,7
7
56,2
7
68,7
5
S
8
180
6
8,4
7
22,0
2
35,0
0
55,0
0
70,0
0
85,0
0
95,0
0
7191
7
4,7
1
20,1
7
45,0
0
60,0
0
80,0
0
90,0
0
100
,00
Par
ent
Rel
atio
n &
Hom
e L
ife
T
8104
4
8,3
6
10,3
8
35,6
6
41,1
0
47,5
0
54,6
5
65,8
7
7127
4
9,6
7
9,7
5
38,3
3
42,5
5
49,5
0
54,6
5
65,8
7
S
8
104
7
5,4
6
21,1
3
45,8
3
62,5
0
79,1
7
91,6
7
100
,00
7
127
7
8,5
3
18,7
1
54,1
7
66,6
7
83,3
3
91,6
7
100
,00
Soci
al S
upp
ort
& P
eers
T
8
114
5
0,1
7
9,9
5
38,1
5
43,6
0
50,2
4
54,9
3
62,6
6
7154
4
9,3
0
9,9
8
38,1
5
43,6
0
48,3
5
54,9
3
62,6
6
S
8
114
7
4,0
5
19,5
3
45,8
3
62,5
0
79,1
7
87,5
0
95,8
3
7154
7
2,4
8
19,5
9
45,8
3
62,5
0
75,0
0
87,5
0
95,8
3
Sch
ool
En
vir
on
men
t
T
8063
4
8,4
0
8,9
5
38,1
5
42,3
5
48,6
1
54,2
2
58,8
8
7096
4
8,0
8
9,5
5
36,7
7
42,3
5
46,9
4
54,2
2
58,8
8
S
8063
6
3,4
1
19,8
9
37,5
0
50,0
0
66,6
7
79,1
7
87,5
0
7096
6
2,5
4
21,0
4
33,3
3
50,0
0
62,5
0
79,1
7
87,5
0
Bu
llyin
g
T
8
160
5
1,3
1
9,4
7
38,2
9
42,2
0
58,8
5
58,8
5
58,8
5
7184
5
0,5
3
9,7
6
38,2
9
42,2
0
58,8
5
58,8
5
58,8
5
S
8160
9
0,8
0
15,0
5
75,0
0
83,3
3
100
,00
1
00
,00
1
00
,00
7
184
8
9,8
1
15,9
2
75,0
0
83,3
3
100
,00
1
00
,00
1
00
,00
Fin
anci
al R
esou
rces
T
8154
5
0,0
8
9,8
1
37,4
7
41,9
2
49,2
8
56,3
5
62,8
6
7150
5
0,8
0
9,7
7
37,4
7
44,1
8
49,2
8
62,8
6
62,8
6
S
8154
7
1,6
6
26,1
4
33,3
3
50,0
0
75,0
0
91,6
7
100
,00
7
150
7
3,5
1
25,7
2
33
,33
5
8,3
3
75,0
0
100
,00
1
00
,00
Tabl
e A1-
2:
Eur
opea
n N
orm
data
KID
SCR
EE
N a
dole
scen
ts 1
2-18

Provision of European Norm Data for Children, Adolescents and Their Parents for Group Level Comparison
151
KID
SC
RE
EN
-2
7
Ph
ysi
cal
Wel
l-b
ein
g
T
8077
4
6,8
3
9,1
5
36,5
5
40,4
5
47,0
8
52,4
3
59,3
6
7139
5
0,5
4
9,8
1
38,4
7
44,7
3
49,6
3
55,6
0
64,3
0
S
8077
6
4,8
8
18,7
1
40,0
0
55,0
0
65,0
0
80,0
0
90,0
0
7139
7
2,0
5
17,9
6
50,0
0
60,0
0
75,0
0
85,0
0
95,0
0
Psy
cholo
gic
al
T
8142
4
7,3
0
9,5
8
35,4
9
40,3
9
46,5
3
53,0
7
59,5
1
7156
5
0,5
7
9,7
0
39,1
0
44,8
0
50,6
1
55,9
6
64,3
5
S
8142
7
2,3
5
17,6
4
46,4
3
60,7
1
75,0
0
85,7
1
92,8
6
7156
7
8,1
2
15,5
7
57,1
4
71,4
3
82,1
4
89,2
9
96,4
3
Au
ton
om
y &
Par
ents
T
8045
4
8,5
3
9,7
5
37,1
6
41,7
2
47,9
3
53,2
5
59,0
6
7067
5
0,4
0
9,7
9
39,4
7
44,0
3
49,4
7
55,7
5
63,9
9
S
8045
7
1,2
1
19,2
7
42,8
6
57,1
4
75,0
0
85,7
1
92,8
6
7067
7
4,9
9
17,7
5
50,0
0
64,2
9
78,5
7
89,2
9
96,4
3
Soci
al S
upp
ort
& P
eers
T
8161
5
0,0
7
9,9
7
37,8
6
44,4
0
49,7
9
57,8
3
66,3
4
7188
4
9,1
0
9,9
3
37,8
6
42,0
9
49,7
9
57
,83
6
6,3
4
S
8161
7
7,0
6
19,6
6
50,0
0
68,7
5
81,2
5
93,7
5
100
,00
7
188
7
5,4
0
19,7
5
50
,00
6
2,5
0
81,2
5
93,7
5
100
,00
Sch
ool
En
vir
on
men
t
T
8102
4
8,5
4
9,1
5
38,6
8
42,9
4
48,0
9
54,4
0
62,8
4
7130
4
8,3
2
9,6
8
36,7
4
42,9
4
48,0
9
54,4
0
62,8
4
S
8102
6
6,5
7
19,3
2
43,7
5
56,2
5
68,7
5
81,2
5
93,7
5
7130
6
5,8
7
20,4
7
37,5
0
56,2
5
68,7
5
81,2
5
93,7
5
KID
SC
RE
EN
-10
Gen
eral
HR
Qo
L I
nd
ex
T
7938
4
7,2
1
8,9
8
37,4
2
41,2
4
45,6
7
51,3
6
59,8
5
6970
4
9,9
7
9,4
0
39,2
8
43,3
5
48,2
9
55,0
7
62,9
4
S
7938
6
9,7
2
15,3
4
50,0
0
60,0
0
70,0
0
80,0
0
90,0
0
6970
7
4,4
3
14,0
9
55,0
0
65,0
0
75,0
0
85,0
0
92,5
0
T=
inte
rnat
iona
l T-v
alue
s ba
sed
on R
asch
per
son
para
met
erS
= Su
msc
ore
trans
form
ed in
to v
alue
s be
twee
n 0
-100

Appendix A1
152
Chil
dre
n 8
-11
A
dole
scen
ts 1
2-1
8
Per
cen
tile
s P
erce
nti
les
Sca
le
n
Mea
n
sd
10
2
5
50
7
5
90
n
M
ean
sd
1
0
25
5
0
75
9
0
KID
SC
RE
EN
-52
Ph
ysi
cal
Wel
l-b
ein
g
T
5848
5
3,7
2
9,9
6
40,4
5
47,0
8
52,4
3
59,3
6
64,3
0
1523
9
48,5
7
9,6
4
36,5
5
42,5
3
47,0
8
55,6
0
59,3
6
S
5848
7
6,4
3
17,3
9
50,0
0
66,6
7
77,7
8
88,8
9
94,4
4
1523
9
66,7
9
19,3
2
38
,89
5
5,5
6
66,6
7
83,3
3
88,8
9
Psy
cholo
gic
al W
ell-
bei
ng
T
5926
5
3,3
8
9,4
0
41,5
3
47,1
2
54,4
9
61,5
5
68,4
9
1538
5
48,7
0
9,9
2
36,9
1
41,5
3
49,3
4
54
,49
6
1,5
5
S
5926
8
2,5
5
15,2
7
62,5
0
75,0
0
87,5
0
95,8
3
100
,00
1
538
5
74,2
5
18,8
5
50,0
0
62,5
0
79,1
7
87,5
0
95,8
3
Mood
s &
Em
oti
on
s
T
5850
5
2,1
5
9,9
7
40,0
0
45,4
4
51,3
4
57,4
0
70,9
1
1535
8
49,1
8
9,8
9
37,7
6
42,5
0
49,0
9
54,0
2
62,0
6
S
5850
8
2,1
3
15,3
4
60,7
1
75,0
0
85,7
1
92,8
6
100
,00
1
535
8
77,1
1
17,7
0
53,5
7
67,8
6
82,1
4
89,2
9
96,4
3
Sel
f-P
ercep
tion
T
5918
5
4,4
8
9,7
4
43,1
7
47,7
8
52,1
9
60,1
1
69,7
8
1538
8
48,2
8
9,5
6
37,8
5
41,8
3
47
,78
5
2,1
9
60,1
1
S
5918
8
2,4
8
16,7
1
60,0
0
75,0
0
85,0
0
95,0
0
100
,00
1
538
8
69,8
2
21,2
9
40,0
0
55,0
0
75,0
0
85,0
0
95,0
0
Au
ton
om
y
T
5
930
5
1,5
7
9,6
7
40,5
4
45,1
7
50,7
7
56,2
7
68,7
5
1539
6
49,4
0
10,0
6
37,3
5
42,0
6
48,7
0
56,2
7
68,7
5
S
5930
7
6,2
7
19,3
7
50,0
0
65,0
0
80,0
0
90,0
0
100
,00
1
539
6
71,4
0
21,4
0
40,0
0
55,0
0
75,0
0
90,0
0
100
,00
Par
ent
Rel
atio
n &
Hom
e L
ife
T
5892
5
2,6
5
9,1
8
41,1
0
45,7
2
51,8
1
58,5
3
65,8
7
1525
6
48,9
8
10,1
1
36,9
8
42,5
5
49,5
0
54,6
5
65,8
7
S
5892
8
4,1
0
15,9
4
62,5
0
75,0
0
87,5
0
95,8
3
100
,00
1
525
6
76,9
0
20,0
9
50,0
0
66,6
7
83,3
3
91,6
7
100
,00
Soci
al S
upp
ort
& P
eers
T
5840
5
0,6
2
10,0
5
39,4
9
43,6
0
50,2
4
54,9
3
62,6
6
1529
0
49,7
6
9,9
7
38,1
5
43,6
0
48,3
5
54,9
3
62,6
6
S
5840
7
4,8
5
19,0
2
50,0
0
62,5
0
79,1
7
87,5
0
95,8
3
1529
0
73,3
2
19,5
7
45
,83
6
2,5
0
75,0
0
87,5
0
95,8
3
Sch
ool
En
vir
on
men
t
T
5869
5
4,5
2
10,4
6
40,9
2
46,9
4
54,2
2
61,8
7
73,8
0
1518
2
48,2
5
9,2
4
36,7
7
42,3
5
48,6
1
54,2
2
58,8
8
S
5869
7
5,1
3
19,4
9
45,8
3
62,5
0
79,1
7
91,6
7
100
,00
1
518
2
63,0
1
20,4
5
33,3
3
50,0
0
66,6
7
79,1
7
87,5
0
Bu
llyin
g
T
5950
4
7,5
8
10,5
4
33,1
3
38,2
9
48,0
7
58,8
5
58,8
5
1536
8
50,9
4
9,6
2
38,2
9
42
,20
5
8,8
5
58,8
5
58,8
5
S
5950
8
5,2
1
18,4
5
58,3
3
75,0
0
91,6
7
100
,00
1
00
,00
1
536
8
90,3
2
15,4
9
75,0
0
83,3
3
100
,00
1
00
,00
1
00
,00
Fin
anci
al R
esou
rces
T
5679
4
8,8
8
10,4
5
35,1
2
41,9
2
49,2
8
56,3
5
62,8
6
1532
7
50,4
2
9,8
0
37,4
7
44,1
8
49,2
8
62,8
6
62,8
6
S
5679
6
8,1
8
28,3
1
25,0
0
50,0
0
75,0
0
91,6
7
100
,00
1
532
7
72,5
3
25,9
6
33,3
3
58,3
3
75,0
0
100
,00
1
00
,00
Tabl
e A1-
3:E
urop
ean
Nor
mda
ta K
IDSC
RE
EN
fem
ales
& m
ales

Provision of European Norm Data for Children, Adolescents and Their Parents for Group Level Comparison
153
KID
SC
RE
EN
-2
7
Ph
ysi
cal
Wel
l-b
ein
g
T
5848
5
3,7
2
9,9
6
40,4
5
47,0
8
52,4
3
59,3
6
64,3
0
1523
9
48,5
7
9,6
4
36,5
5
42,5
3
47,0
8
55,6
0
59,3
6
S
5848
7
7,1
3
16,8
4
55,0
0
65,0
0
80,0
0
90,0
0
95,0
0
1523
9
68,2
4
18,7
1
45
,00
5
5,0
0
70,0
0
80,0
0
90,0
0
Psy
cholo
gic
al
T
5876
5
3,0
4
9,9
4
41,7
5
46,5
3
53,0
7
59,5
1
64,3
5
1532
3
48,8
3
9,7
8
36,6
6
41,7
5
48,4
5
53,0
7
59,5
1
S
5876
8
1,8
1
14,2
0
64,2
9
75,0
0
85,7
1
92,8
6
96,4
3
1532
3
75,0
6
16,9
5
50
,00
6
4,2
9
78,5
7
85,7
1
92,8
6
Au
ton
om
y &
Par
ents
T
5657
5
1,5
7
10,3
2
39,4
7
44,0
3
49,4
7
55,7
5
63,9
9
1513
5
49,4
1
9,8
1
38,3
3
42,8
6
47,9
3
55,7
5
63,9
9
S
5657
7
6,7
6
17,6
5
50,0
0
64,2
9
78,5
7
89,2
9
96,4
3
1513
5
72,9
8
18,6
6
46
,43
6
0,7
1
75,0
0
89,2
9
96,4
3
Soci
al S
upp
ort
& P
eers
T
5905
5
1,0
0
10,0
4
37,8
6
44,4
0
49,7
9
57,8
3
66,3
4
1537
2
49,6
2
9,9
6
37,8
6
42,0
9
49,7
9
57,8
3
66,3
4
S
5905
7
8,7
4
18,9
9
50,0
0
68,7
5
81,2
5
93,7
5
100
,00
1
537
2
76,2
9
19,7
1
50,0
0
62,5
0
81,2
5
93,7
5
100
,00
Sch
ool
En
vir
on
men
t
T
5905
5
4,0
3
10,3
6
40,7
2
45,3
8
54,4
0
62,8
4
71,0
0
1525
5
48,4
4
9,4
1
36,7
4
42,9
4
48,0
9
54,4
0
62,8
4
S
5905
7
6,6
4
18,8
2
50,0
0
62,5
0
81,2
5
93,7
5
100
,00
1
525
5
66,2
5
19,8
7
37,5
0
56,2
5
68,7
5
81,2
5
93,7
5
KID
SC
RE
EN
-10
Gen
eral
HR
Qo
L I
nd
ex
T
5715
5
3,9
0
10,7
3
42,2
7
46,9
4
53,1
1
59,8
5
66,8
6
1493
2
48,5
1
9,2
8
38,3
4
42,2
7
46,9
4
53
,11
5
9,8
5
S
5715
7
9,6
5
13,3
8
62,5
0
72,5
0
82,5
0
90,0
0
95,0
0
1493
2
71,9
3
14,9
5
52
,50
6
2,5
0
72,5
0
82,5
0
90,0
0
T=
inte
rnat
iona
l T-v
alue
s ba
sed
on R
asch
per
son
para
met
erS
= Su
msc
ore
trans
form
ed in
to v
alue
s be
twee
n 0
-100
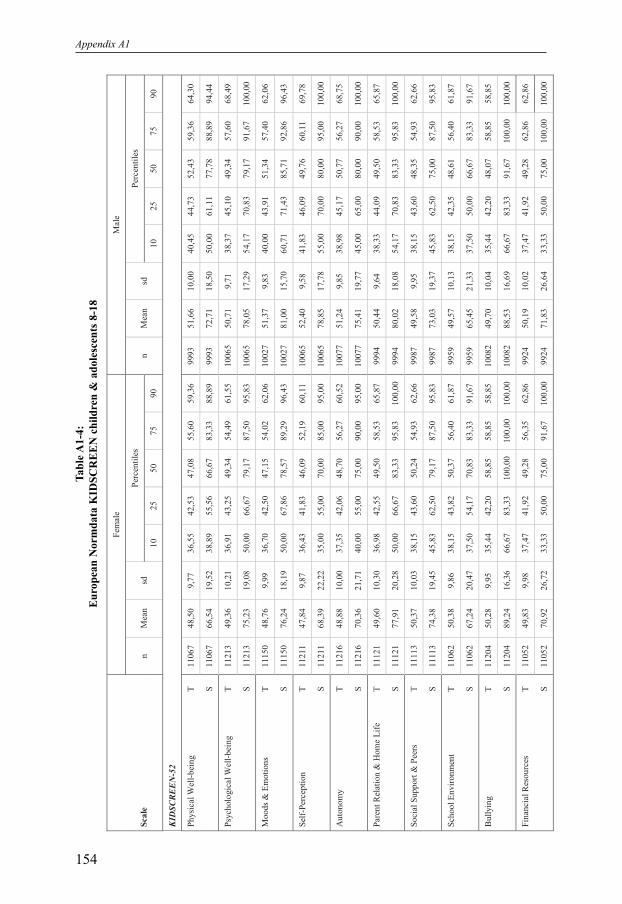
Appendix A1
154
Fem
ale
Mal
e
Per
cen
tile
s P
erce
nti
les
Sca
le
n
Mea
n
sd
10
2
5
50
7
5
90
n
M
ean
sd
1
0
25
5
0
75
9
0
KID
SC
RE
EN
-52
Ph
ysi
cal
Wel
l-b
ein
g
T
1106
7
48,5
0
9,7
7
36,5
5
42,5
3
47,0
8
55,6
0
59,3
6
9993
5
1,6
6
10,0
0
40,4
5
44,7
3
52,4
3
59,3
6
64,3
0
S
1106
7
66,5
4
19,5
2
38,8
9
55,5
6
66,6
7
83,3
3
88,8
9
9993
7
2,7
1
18,5
0
50
,00
6
1,1
1
77,7
8
88,8
9
94,4
4
Psy
cholo
gic
al W
ell-
bei
ng
T
1121
3
49,3
6
10,2
1
36,9
1
43,2
5
49,3
4
54,4
9
61,5
5
1006
5
50,7
1
9,7
1
38,3
7
45,1
0
49,3
4
57,6
0
68,4
9
S
1121
3
75,2
3
19,0
8
50,0
0
66,6
7
79,1
7
87,5
0
95,8
3
1006
5
78,0
5
17,2
9
54,1
7
70,8
3
79,1
7
91,6
7
100
,00
Mood
s &
Em
oti
on
s
T
1115
0
48,7
6
9,9
9
36,7
0
42,5
0
47,1
5
54,0
2
62,0
6
1002
7
51,3
7
9,8
3
40,0
0
43,9
1
51,3
4
57,4
0
62,0
6
S
1115
0
76,2
4
18,1
9
50,0
0
67,8
6
78,5
7
89,2
9
96,4
3
1002
7
81,0
0
15,7
0
60,7
1
71,4
3
85,7
1
92,8
6
96,4
3
Sel
f-P
ercep
tion
T
1121
1
47,8
4
9,8
7
36,4
3
41,8
3
46,0
9
52,1
9
60,1
1
1006
5
52,4
0
9,5
8
41,8
3
46,0
9
49,7
6
60,1
1
69,7
8
S
1121
1
68,3
9
22,2
2
35,0
0
55,0
0
70,0
0
85,0
0
95,0
0
1006
5
78,8
5
17,7
8
55,0
0
70,0
0
80,0
0
95,0
0
100
,00
Au
ton
om
y
T
1
121
6
48,8
8
10,0
0
37,3
5
42,0
6
48,7
0
56,2
7
60,5
2
1007
7
51,2
4
9,8
5
38,9
8
45,1
7
50,7
7
56,2
7
68,7
5
S
1121
6
70,3
6
21,7
1
40,0
0
55,0
0
75,0
0
90,0
0
95,0
0
1007
7
75,4
1
19,7
7
45,0
0
65,0
0
80,0
0
90,0
0
100
,00
Par
ent
Rel
atio
n &
Hom
e L
ife
T
1112
1
49,6
0
10,3
0
36,9
8
42,5
5
49,5
0
58,5
3
65,8
7
9994
5
0,4
4
9,6
4
38,3
3
44,0
9
49,5
0
58,5
3
65,8
7
S
1112
1
77,9
1
20,2
8
50,0
0
66,6
7
83,3
3
95,8
3
100
,00
9
994
8
0,0
2
18,0
8
54,1
7
70,8
3
83,3
3
95,8
3
100
,00
Soci
al S
upp
ort
& P
eers
T
1111
3
50,3
7
10,0
3
38,1
5
43,6
0
50,2
4
54,9
3
62,6
6
9987
4
9,5
8
9,9
5
38,1
5
43,6
0
48,3
5
54,9
3
62,6
6
S
1111
3
74,3
8
19,4
5
45,8
3
62,5
0
79,1
7
87,5
0
95,8
3
9987
7
3,0
3
19,3
7
45
,83
6
2,5
0
75,0
0
87,5
0
95,8
3
Sch
ool
En
vir
on
men
t
T
1106
2
50,3
8
9,8
6
38,1
5
43,8
2
50,3
7
56,4
0
61,8
7
9959
4
9,5
7
10,1
3
38,1
5
42,3
5
48,6
1
56,4
0
61,8
7
S
1106
2
67,2
4
20,4
7
37,5
0
54,1
7
70,8
3
83,3
3
91,6
7
9959
6
5,4
5
21,3
3
37
,50
5
0,0
0
66,6
7
83,3
3
91,6
7
Bu
llyin
g
T
1120
4
50,2
8
9,9
5
35,4
4
42,2
0
58,8
5
58,8
5
58,8
5
1008
2
49,7
0
10,0
4
35,4
4
42,2
0
48,0
7
58,8
5
58,8
5
S
1120
4
89,2
4
16,3
6
66,6
7
83,3
3
100
,00
1
00
,00
1
00
,00
1
008
2
88,5
3
16,6
9
66,6
7
83,3
3
91,6
7
100
,00
1
00
,00
Fin
anci
al R
esou
rces
T
1105
2
49,8
3
9,9
8
37,4
7
41,9
2
49,2
8
56,3
5
62,8
6
9924
5
0,1
9
10,0
2
37,4
7
41,9
2
49,2
8
62,8
6
62,8
6
S
1105
2
70,9
2
26,7
2
33,3
3
50,0
0
75,0
0
91,6
7
100
,00
9
924
7
1,8
3
26,6
4
33,3
3
50,0
0
75,0
0
100
,00
1
00
,00
Tabl
e A1-
4:
Eur
opea
n N
orm
data
KID
SCR
EE
N c
hild
ren
& a
dole
scen
ts 8
-18
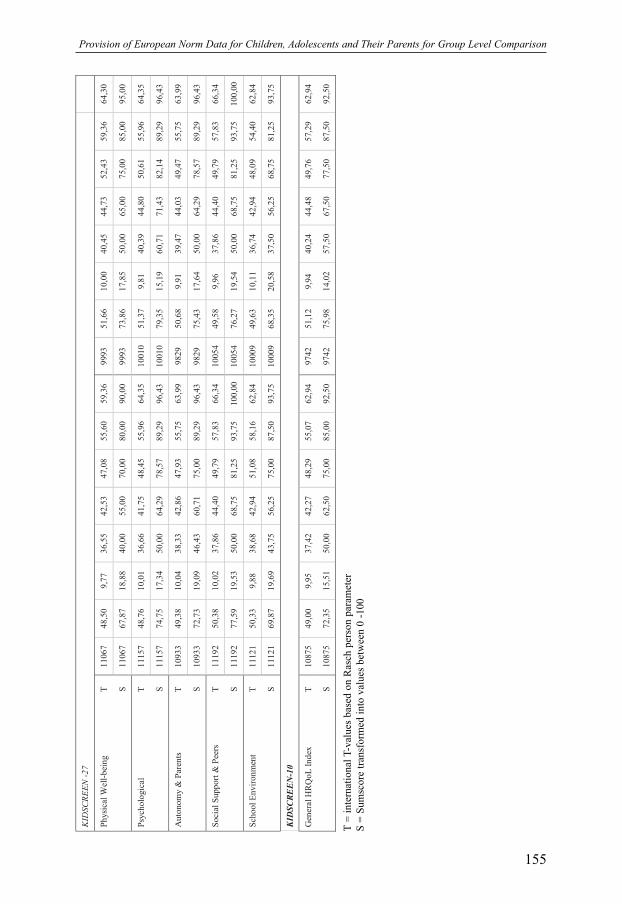
Provision of European Norm Data for Children, Adolescents and Their Parents for Group Level Comparison
155
KID
SC
RE
EN
-2
7
Ph
ysi
cal
Wel
l-b
ein
g
T
1106
7
48,5
0
9,7
7
36,5
5
42,5
3
47,0
8
55,6
0
59,3
6
9993
5
1,6
6
10,0
0
40,4
5
44,7
3
52,4
3
59,3
6
64,3
0
S
1106
7
67,8
7
18,8
8
40,0
0
55,0
0
70,0
0
80,0
0
90,0
0
9993
7
3,8
6
17,8
5
50
,00
6
5,0
0
75,0
0
85,0
0
95,0
0
Psy
cholo
gic
al
T
1115
7
48,7
6
10,0
1
36,6
6
41,7
5
48,4
5
55,9
6
64,3
5
1001
0
51,3
7
9,8
1
40,3
9
44,8
0
50,6
1
55,9
6
64,3
5
S
1115
7
74,7
5
17,3
4
50,0
0
64,2
9
78,5
7
89,2
9
96,4
3
1001
0
79,3
5
15,1
9
60,7
1
71,4
3
82,1
4
89,2
9
96,4
3
Au
ton
om
y &
Par
ents
T
1093
3
49,3
8
10,0
4
38,3
3
42,8
6
47,9
3
55,7
5
63,9
9
9829
5
0,6
8
9,9
1
39,4
7
44,0
3
49,4
7
55,7
5
63,9
9
S
1093
3
72,7
3
19,0
9
46,4
3
60,7
1
75,0
0
89,2
9
96,4
3
9829
7
5,4
3
17,6
4
50
,00
6
4,2
9
78,5
7
89,2
9
96,4
3
Soci
al S
upp
ort
& P
eers
T
1119
2
50,3
8
10,0
2
37,8
6
44,4
0
49,7
9
57,8
3
66,3
4
1005
4
49,5
8
9,9
6
37,8
6
44,4
0
49,7
9
57,8
3
66,3
4
S
1119
2
77,5
9
19,5
3
50,0
0
68,7
5
81,2
5
93,7
5
100
,00
1
005
4
76,2
7
19,5
4
50,0
0
68,7
5
81,2
5
93,7
5
100
,00
Sch
ool
En
vir
on
men
t
T
1112
1
50,3
3
9,8
8
38,6
8
42,9
4
51,0
8
58,1
6
62,8
4
1000
9
49,6
3
10,1
1
36,7
4
42,9
4
48,0
9
54,4
0
62,8
4
S
1112
1
69,8
7
19,6
9
43,7
5
56,2
5
75,0
0
87,5
0
93,7
5
1000
9
68,3
5
20,5
8
37,5
0
56,2
5
68,7
5
81,2
5
93,7
5
KID
SC
RE
EN
-10
Gen
eral
HR
Qo
L I
nd
ex
T
1087
5
49,0
0
9,9
5
37,4
2
42,2
7
48,2
9
55,0
7
62,9
4
9742
5
1,1
2
9,9
4
40,2
4
44,4
8
49,7
6
57,2
9
62,9
4
S
1087
5
72,3
5
15,5
1
50,0
0
62,5
0
75,0
0
85,0
0
92,5
0
9742
7
5,9
8
14,0
2
57
,50
6
7,5
0
77,5
0
87,5
0
92,5
0
T=
inte
rnat
iona
l T-v
alue
s ba
sed
on R
asch
per
son
para
met
erS
= Su
msc
ore
trans
form
ed in
to v
alue
s be
twee
n 0
-100
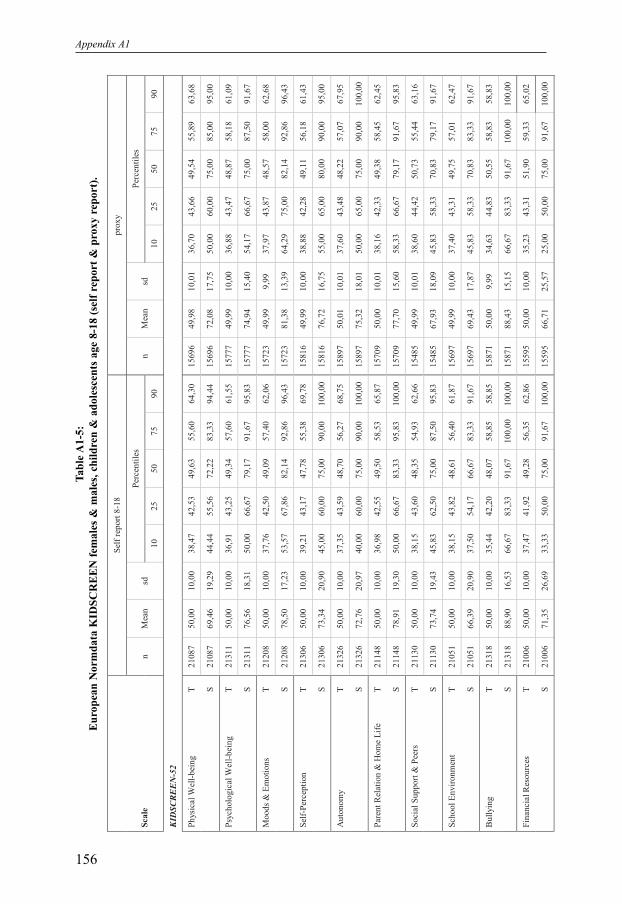
Appendix A1
156
Sel
f re
port
8-1
8
pro
xy
Per
cen
tile
s P
erce
nti
les
Sca
le
n
Mea
n
sd
10
2
5
50
7
5
90
n
M
ean
sd
1
0
25
5
0
75
9
0
KID
SC
RE
EN
-52
Ph
ysi
cal
Wel
l-b
ein
g
T
2108
7
50,0
0
10,0
0
38,4
7
42,5
3
49,6
3
55,6
0
64,3
0
1569
6
49,9
8
10,0
1
36,7
0
43,6
6
49
,54
5
5,8
9
63,6
8
S
2108
7
69,4
6
19,2
9
44,4
4
55,5
6
72,2
2
83,3
3
94,4
4
1569
6
72,0
8
17,7
5
50,0
0
60,0
0
75,0
0
85,0
0
95,0
0
Psy
cholo
gic
al W
ell-
bei
ng
T
2131
1
50,0
0
10,0
0
36,9
1
43,2
5
49,3
4
57,6
0
61,5
5
1577
7
49,9
9
10,0
0
36,8
8
43,4
7
48,8
7
58,1
8
61,0
9
S
2131
1
76,5
6
18,3
1
50,0
0
66,6
7
79,1
7
91,6
7
95,8
3
1577
7
74,9
4
15,4
0
54,1
7
66,6
7
75,0
0
87,5
0
91,6
7
Mood
s &
Em
oti
on
s
T
2120
8
50,0
0
10,0
0
37,7
6
42,5
0
49,0
9
57,4
0
62,0
6
1572
3
49,9
9
9,9
9
37,9
7
43,8
7
48,5
7
58,0
0
62,6
8
S
2120
8
78,5
0
17,2
3
53,5
7
67,8
6
82,1
4
92,8
6
96,4
3
1572
3
81,3
8
13,3
9
64,2
9
75,0
0
82,1
4
92,8
6
96,4
3
Sel
f-P
ercep
tion
T
2130
6
50,0
0
10,0
0
39,2
1
43,1
7
47,7
8
55,3
8
69,7
8
1581
6
49,9
9
10,0
0
38,8
8
42,2
8
49,1
1
56,1
8
61,4
3
S
2130
6
73,3
4
20,9
0
45,0
0
60,0
0
75,0
0
90,0
0
100
,00
1
581
6
76,7
2
16,7
5
55,0
0
65,0
0
80,0
0
90,0
0
95,0
0
Au
ton
om
y
T
2
132
6
50,0
0
10,0
0
37,3
5
43,5
9
48,7
0
56,2
7
68,7
5
1589
7
50,0
1
10,0
1
37,6
0
43,4
8
48,2
2
57,0
7
67,9
5
S
2132
6
72,7
6
20,9
7
40,0
0
60,0
0
75,0
0
90,0
0
100
,00
1
589
7
75,3
2
18,0
1
50,0
0
65,0
0
75,0
0
90,0
0
100
,00
Par
ent
Rel
atio
n &
Hom
e L
ife
T
2114
8
50,0
0
10,0
0
36,9
8
42,5
5
49,5
0
58,5
3
65,8
7
1570
9
50,0
0
10,0
1
38,1
6
42,3
3
49,3
8
58
,45
6
2,4
5
S
2114
8
78,9
1
19,3
0
50,0
0
66,6
7
83,3
3
95,8
3
100
,00
1
570
9
77,7
0
15,6
0
58,3
3
66,6
7
79,1
7
91,6
7
95,8
3
Soci
al S
upp
ort
& P
eers
T
2113
0
50,0
0
10,0
0
38,1
5
43,6
0
48,3
5
54,9
3
62,6
6
1548
5
49,9
9
10,0
1
38,6
0
44,4
2
50,7
3
55,4
4
63,1
6
S
2113
0
73,7
4
19,4
3
45,8
3
62,5
0
75,0
0
87,5
0
95,8
3
1548
5
67,9
3
18,0
9
45,8
3
58,3
3
70,8
3
79,1
7
91,6
7
Sch
ool
En
vir
on
men
t
T
2105
1
50,0
0
10,0
0
38,1
5
43,8
2
48,6
1
56,4
0
61,8
7
1569
7
49,9
9
10,0
0
37,4
0
43,3
1
49,7
5
57,0
1
62,4
7
S
2105
1
66,3
9
20,9
0
37,5
0
54,1
7
66,6
7
83,3
3
91,6
7
1569
7
69,4
3
17,8
7
45,8
3
58,3
3
70,8
3
83,3
3
91,6
7
Bu
llyin
g
T
2131
8
50,0
0
10,0
0
35,4
4
42,2
0
48,0
7
58,8
5
58,8
5
1587
1
50,0
0
9,9
9
34,6
3
44,8
3
50,5
5
58,8
3
58,8
3
S
2131
8
88,9
0
16,5
3
66,6
7
83,3
3
91,6
7
100
,00
1
00
,00
1
587
1
88,4
3
15,1
5
66,6
7
83,3
3
91,6
7
100
,00
1
00
,00
Fin
anci
al R
esou
rces
T
2100
6
50,0
0
10,0
0
37,4
7
41,9
2
49,2
8
56,3
5
62,8
6
1559
5
50,0
0
10,0
0
35,2
3
43,3
1
51,9
0
59,3
3
65,0
2
S
2100
6
71,3
5
26,6
9
33,3
3
50,0
0
75,0
0
91,6
7
100
,00
1
559
5
66,7
1
25,5
7
25,0
0
50,0
0
75,0
0
91,6
7
100
,00
Tabl
e A1-
5:E
urop
ean
Nor
mda
ta K
IDSC
RE
EN
fem
ales
& m
ales
, chi
ldre
n &
ado
lesc
ents
age
8-1
8 (s
elf r
epor
t & p
roxy
rep
ort).

Provision of European Norm Data for Children, Adolescents and Their Parents for Group Level Comparison
157
KID
SC
RE
EN
-2
7
Ph
ysi
cal
Wel
l-b
ein
g
T
2108
7
50,0
0
10,0
0
38,4
7
42,5
3
49,6
3
55,6
0
64,3
0
1569
6
49,9
8
10,0
1
36,7
0
43,6
6
49
,54
5
5,8
9
63,6
8
S
2108
7
70,7
1
18,6
4
45,0
0
60,0
0
75,0
0
85,0
0
95,0
0
1569
6
72,0
8
17,7
5
50,0
0
60,0
0
75,0
0
85,0
0
95,0
0
Psy
cholo
gic
al
T
2119
9
50,0
0
10,0
0
37,8
7
43,2
1
48,4
5
55,9
6
64,3
5
1567
9
49,9
9
10,0
0
38,1
8
44,2
7
49,3
7
55,6
7
63,0
8
S
2119
9
76,9
3
16,5
2
53,5
7
67,8
6
78,5
7
89,2
9
96,4
3
1567
9
77,1
6
13,0
3
60,7
1
71,4
3
78,5
7
85,7
1
92,8
6
Au
ton
om
y &
Par
ents
T
2079
2
50,0
0
10,0
0
38,3
3
42,8
6
49,4
7
55,7
5
63,9
9
1545
6
50,0
0
10,0
1
39,0
5
43,7
9
49,1
0
56,0
1
62,9
5
S
2079
2
74,0
1
18,4
7
46,4
3
60,7
1
78,5
7
89,2
9
96,4
3
1545
6
73,4
0
15,6
1
53,5
7
64,2
9
75,0
0
85,7
1
92,8
6
Soci
al S
upp
ort
& P
eers
T
2127
7
50,0
0
10,0
0
37,8
6
44,4
0
49,7
9
57,8
3
66,3
4
1562
7
50,0
0
10,0
1
37,0
6
42,9
1
49,1
4
56,1
3
63,6
9
S
2127
7
76,9
7
19,5
5
50,0
0
68,7
5
81,2
5
93,7
5
100
,00
1
562
7
69,0
5
18,2
8
43,7
5
56,2
5
68,7
5
81,2
5
93,7
5
Sch
ool
En
vir
on
men
t
T
2116
0
50,0
0
10,0
0
38,6
8
42,9
4
48,0
9
54,4
0
62,8
4
1574
8
49,9
9
10,0
0
38,1
4
44,3
8
51,4
2
55,4
0
63,6
8
S
2116
0
69,1
5
20,1
3
43,7
5
56,2
5
68,7
5
81,2
5
93,7
5
1574
8
70,8
9
17,3
5
50,0
0
62,5
0
75,0
0
81,2
5
93,7
5
KID
SC
RE
EN
-10
Gen
eral
HR
Qo
L I
nd
ex
T
2064
7
50,0
0
10,0
0
38,3
4
43,3
5
48,2
9
55,0
7
62,9
4
1536
1
49,9
9
10,0
0
38,7
6
43,3
0
48,5
8
54,8
9
62,8
5
S
2064
7
74,0
7
14,9
4
52,5
0
65,0
0
75,0
0
85,0
0
92,5
0
1536
1
74,8
8
12,0
3
60,0
0
67,5
0
75,0
0
82,5
0
90,0
0
T=
inte
rnat
iona
l T-v
alue
s ba
sed
on R
asch
per
son
para
met
erS
= Su
msc
ore
trans
form
ed in
to v
alue
s be
twee
n 0
-100

Appendix A1
158
Fem
ale
Mal
e
Per
cen
tile
s P
erce
nti
les
Sca
le
n
Mea
n
sd
10
2
5
50
7
5
90
n
M
ean
sd
1
0
25
5
0
75
9
0
KID
SC
RE
EN
-52
Ph
ysi
cal
Wel
l-b
ein
g
T
2721
5
2,1
0
9,4
6
41,0
8
46,5
0
52,6
8
59,3
8
63,6
8
2605
5
3,2
0
9,4
9
41,0
8
46,5
0
52,6
8
59,3
8
63,6
8
S
2721
7
5,9
3
15,8
6
55,0
0
65,0
0
75,0
0
90,0
0
95,0
0
2605
7
7,5
9
15,8
8
55,0
0
70,0
0
80,0
0
90,0
0
95,0
0
Psy
cholo
gic
al W
ell-
bei
ng
T
2738
5
2,2
9
9,4
2
41,2
2
45,9
5
52,1
2
58,1
8
64,4
1
2601
5
1,4
5
9,4
9
39,0
5
45,9
5
52,1
2
58,1
8
64,4
1
S
2738
7
8,5
0
13,8
1
62,5
0
70,8
3
79,1
7
87,5
0
95,8
3
2601
7
7,2
7
14,0
1
58,3
3
70,8
3
79,1
7
87,5
0
95,8
3
Mood
s &
Em
oti
on
s
T
2735
5
1,6
8
9,5
2
39,8
1
46,1
2
51,2
8
58,0
0
62,6
8
2599
5
1,2
1
9,7
3
39,8
1
43,8
7
51,2
8
58,0
0
62,6
8
S
2735
8
3,7
7
12,2
6
67,8
6
78,5
7
85,7
1
92,8
6
96,4
3
2599
8
3,0
9
12,5
7
67,8
6
75,0
0
85,7
1
92,8
6
96,4
3
Sel
f-P
ercep
tion
T
2739
5
1,5
1
9,8
4
40,5
1
44,2
5
49,1
1
56,1
8
70,9
8
2614
5
4,3
3
9,7
9
42,2
8
46,4
8
52,2
7
61,4
3
70,9
8
S
2739
7
9,4
9
15,3
3
60,0
0
70,0
0
80,0
0
90,0
0
100
,00
2
614
8
3,8
8
13,4
2
65
,00
7
5,0
0
85,0
0
95,0
0
100
,00
Au
ton
om
y
T
2
758
5
0,2
1
9,1
4
39,5
1
43,4
8
50,9
5
57,0
7
61,0
1
2626
5
0,4
8
8,9
2
39,5
1
45,7
2
50,9
5
57,0
7
61,0
1
S
2758
7
6,0
9
16,3
2
55,0
0
65,0
0
80,0
0
90,0
0
95,0
0
2626
7
6,7
0
15,9
0
55,0
0
70,0
0
80,0
0
90,0
0
95,0
0
Par
ent
Rel
atio
n &
Hom
e L
ife
T
2727
5
1,7
3
9,4
3
40,2
0
44,5
4
52,1
2
58,4
5
62,4
5
2596
5
1,1
7
9,3
2
40,2
0
44,5
4
52,1
2
58,4
5
62,4
5
S
2727
8
0,5
5
13,9
2
62,5
0
70,8
3
83,3
3
91,6
7
95,8
3
2596
7
9,7
7
13,9
5
62,5
0
70,8
3
83,3
3
91,6
7
95,8
3
Soci
al S
upp
ort
& P
eers
T
2689
5
0,6
4
9,3
4
38,6
0
44,4
2
50,7
3
55,4
4
63,1
6
2556
5
0,0
9
9,4
9
38,6
0
44,4
2
50,7
3
55
,44
6
0,3
7
S
2689
6
9,2
4
16,7
3
45,8
3
58,3
3
70,8
3
79,1
7
91,6
7
2556
6
8,2
7
17,2
1
45,8
3
58,3
3
70,8
3
79,1
7
87,5
0
Sch
ool
En
vir
on
men
t
T
2748
5
4,8
2
9,6
4
41,2
8
47,5
2
54,5
2
62,4
7
66,0
8
2610
5
2,1
9
10,1
4
39,2
9
45,3
9
52,0
9
59,6
0
66,0
8
S
2748
7
7,8
1
15,7
8
54,1
7
66,6
7
79,1
7
91,6
7
95,8
3
2610
7
3,2
0
17,3
2
50,0
0
62,5
0
75,0
0
87,5
0
95,8
3
Bu
llyin
g
T
2750
4
8,3
7
10,1
4
34,6
3
39,3
4
50,5
5
58,8
3
58,8
3
2628
4
7,5
8
10,5
2
34,6
3
39
,34
5
0,5
5
58,8
3
58,8
3
S
2750
8
6,2
5
15,6
3
66,6
7
75,0
0
91,6
7
100
,00
1
00
,00
2
628
8
4,9
8
16,4
8
66,6
7
75,0
0
91,6
7
100
,00
1
00
,00
Fin
anci
al R
esou
rces
T
2642
5
0,7
9
10,3
4
37,9
5
43,3
1
51,9
0
59,3
3
65,0
2
2501
4
9,8
2
10,2
2
35,2
3
43,3
1
51,9
0
55,3
9
65,0
2
S
2642
6
8,5
2
26,1
5
33,3
3
50,0
0
75,0
0
91,6
7
100
,00
2
501
6
6,2
8
26,1
0
25
,00
5
0,0
0
75,0
0
83,3
3
100
,00
Tabl
e A1-
6:E
urop
ean
Nor
mda
ta p
roxy
KID
SCR
EE
N c
hild
ren
8-11

Provision of European Norm Data for Children, Adolescents and Their Parents for Group Level Comparison
159
KID
SC
RE
EN
-2
7
Ph
ysi
cal
Wel
l-b
ein
g
T
2721
5
2,1
0
9,4
6
41,0
8
46,5
0
52,6
8
59,3
8
63,6
8
2605
5
3,2
0
9,4
9
41,0
8
46,5
0
52,6
8
59,3
8
63,6
8
S
2721
7
5,9
3
15,8
6
55,0
0
65,0
0
75,0
0
90,0
0
95,0
0
2605
7
7,5
9
15,8
8
55,0
0
70,0
0
80,0
0
90,0
0
95,0
0
Psy
cholo
gic
al
T
2720
5
1,9
0
9,5
6
40,0
7
46,6
7
52,3
8
55,6
7
63,0
8
2587
5
1,5
4
9,5
8
40,0
7
44,2
7
52,3
8
55,6
7
63,0
8
S
2720
7
9,7
9
11,7
0
64,2
9
75,0
0
82,1
4
85,7
1
92,8
6
2587
7
9,3
3
11,8
7
64,2
9
71,4
3
82,1
4
85,7
1
92,8
6
Au
ton
om
y &
Par
ents
T
2644
5
1,0
3
9,8
3
40,6
1
43,7
9
49,1
0
56,0
1
62,9
5
2493
5
0,4
5
9,4
6
39,0
5
43,7
9
49,1
0
56,0
1
62,9
5
S
2644
7
5,1
5
14,6
3
57,1
4
64,2
9
75,0
0
85,7
1
92,8
6
2493
7
4,4
5
14,6
1
53,5
7
64,2
9
75,0
0
85,7
1
92,8
6
Soci
al S
upp
ort
& P
eers
T
2714
5
0,6
6
9,3
1
39,9
7
45,9
4
52,5
9
56,1
3
63,6
9
2583
5
0,2
0
9,4
7
39,9
7
45,9
4
49,1
4
56
,13
6
3,6
9
S
2714
7
0,3
7
16,8
7
50,0
0
62,5
0
75,0
0
81,2
5
93,7
5
2583
6
9,5
9
17,3
1
50,0
0
62,5
0
68,7
5
81,2
5
93,7
5
Sch
ool
En
vir
on
men
t
T
2750
5
4,3
0
9,4
5
41,2
4
47,6
9
55,4
0
59,3
4
70,6
7
2612
5
1,5
3
10,0
8
38,1
4
44,3
8
51,4
2
59,3
4
63,6
8
S
2750
7
8,1
9
15,1
9
56,2
5
68,7
5
81,2
5
87,5
0
100
,00
2
612
7
3,4
6
16,9
9
50
,00
6
2,5
0
75,0
0
87,5
0
93,7
5
KID
SC
RE
EN
-10
Gen
eral
HR
Qo
L I
nd
ex
T
2685
5
2,1
9
9,7
6
40,2
0
44,9
6
50,5
6
57,3
0
66,2
5
2539
5
1,6
1
9,7
9
40,2
0
44,9
6
50,5
6
57,3
0
66,2
5
S
2685
7
7,6
9
10,9
3
62,5
0
70,0
0
77,5
0
85,0
0
92,5
0
2539
7
6,9
9
11,3
2
62,5
0
70,0
0
77,5
0
85,0
0
92,5
0
T=
inte
rnat
iona
l T-v
alue
s ba
sed
on R
asch
per
son
para
met
erS
= Su
msc
ore
trans
form
ed in
to v
alue
s be
twee
n 0
-100
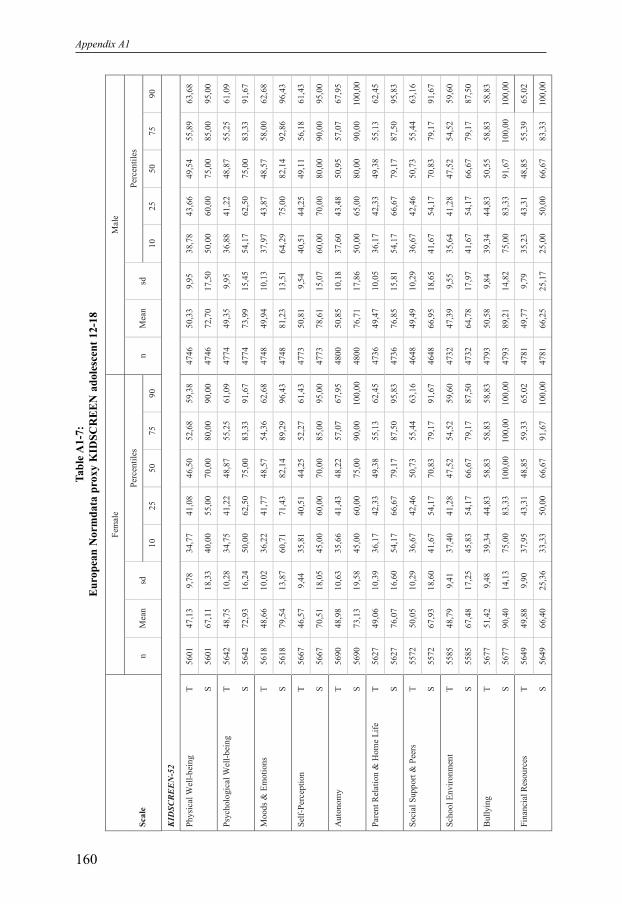
Appendix A1
160
Fem
ale
Mal
e
Per
cen
tile
s P
erce
nti
les
Sca
le
n
Mea
n
sd
10
2
5
50
7
5
90
n
M
ean
sd
1
0
25
5
0
75
9
0
KID
SC
RE
EN
-52
Ph
ysi
cal
Wel
l-b
ein
g
T
5601
4
7,1
3
9,7
8
34,7
7
41,0
8
46,5
0
52,6
8
59,3
8
4746
5
0,3
3
9,9
5
38,7
8
43,6
6
49,5
4
55,8
9
63,6
8
S
5601
6
7,1
1
18,3
3
40,0
0
55,0
0
70,0
0
80,0
0
90,0
0
4746
7
2,7
0
17,5
0
50,0
0
60,0
0
75,0
0
85,0
0
95,0
0
Psy
cholo
gic
al W
ell-
bei
ng
T
5642
4
8,7
5
10,2
8
34,7
5
41,2
2
48,8
7
55,2
5
61,0
9
4774
4
9,3
5
9,9
5
36,8
8
41,2
2
48,8
7
55
,25
6
1,0
9
S
5642
7
2,9
3
16,2
4
50,0
0
62,5
0
75,0
0
83,3
3
91,6
7
4774
7
3,9
9
15,4
5
54,1
7
62,5
0
75,0
0
83,3
3
91,6
7
Mood
s &
Em
oti
on
s
T
5618
4
8,6
6
10,0
2
36,2
2
41,7
7
48,5
7
54,3
6
62,6
8
4748
4
9,9
4
10,1
3
37,9
7
43,8
7
48,5
7
58,0
0
62,6
8
S
5618
7
9,5
4
13,8
7
60,7
1
71,4
3
82,1
4
89,2
9
96,4
3
4748
8
1,2
3
13,5
1
64,2
9
75,0
0
82,1
4
92,8
6
96,4
3
Sel
f-P
ercep
tion
T
5667
4
6,5
7
9,4
4
35,8
1
40,5
1
44,2
5
52,2
7
61,4
3
4773
5
0,8
1
9,5
4
40,5
1
44,2
5
49,1
1
56,1
8
61,4
3
S
5667
7
0,5
1
18,0
5
45,0
0
60,0
0
70,0
0
85,0
0
95,0
0
4773
7
8,6
1
15,0
7
60,0
0
70,0
0
80,0
0
90,0
0
95,0
0
Au
ton
om
y
T
5
690
4
8,9
8
10,6
3
35,6
6
41,4
3
48,2
2
57,0
7
67,9
5
4800
5
0,8
5
10,1
8
37,6
0
43,4
8
50,9
5
57,0
7
67,9
5
S
5690
7
3,1
3
19,5
8
45,0
0
60,0
0
75,0
0
90,0
0
100
,00
4
800
7
6,7
1
17,8
6
50
,00
6
5,0
0
80,0
0
90,0
0
100
,00
Par
ent
Rel
atio
n &
Hom
e L
ife
T
5627
4
9,0
6
10,3
9
36,1
7
42,3
3
49,3
8
55,1
3
62,4
5
4736
4
9,4
7
10,0
5
36,1
7
42,3
3
49,3
8
55,1
3
62,4
5
S
5627
7
6,0
7
16,6
0
54,1
7
66,6
7
79,1
7
87,5
0
95,8
3
4736
7
6,8
5
15,8
1
54,1
7
66,6
7
79,1
7
87,5
0
95,8
3
Soci
al S
upp
ort
& P
eers
T
5572
5
0,0
5
10,2
9
36,6
7
42,4
6
50,7
3
55,4
4
63,1
6
4648
4
9,4
9
10,2
9
36,6
7
42,4
6
50,7
3
55,4
4
63,1
6
S
5572
6
7,9
3
18,6
0
41,6
7
54,1
7
70,8
3
79,1
7
91,6
7
4648
6
6,9
5
18,6
5
41,6
7
54,1
7
70,8
3
79,1
7
91,6
7
Sch
ool
En
vir
on
men
t
T
5585
4
8,7
9
9,4
1
37,4
0
41,2
8
47,5
2
54,5
2
59,6
0
4732
4
7,3
9
9,5
5
35,6
4
41,2
8
47,5
2
54,5
2
59,6
0
S
5585
6
7,4
8
17,2
5
45,8
3
54,1
7
66,6
7
79,1
7
87,5
0
4732
6
4,7
8
17,9
7
41,6
7
54,1
7
66,6
7
79,1
7
87,5
0
Bu
llyin
g
T
5677
5
1,4
2
9,4
8
39,3
4
44,8
3
58,8
3
58,8
3
58,8
3
4793
5
0,5
8
9,8
4
39,3
4
44,8
3
50,5
5
58,8
3
58,8
3
S
5677
9
0,4
0
14,1
3
75,0
0
83,3
3
100
,00
1
00
,00
1
00
,00
4
793
8
9,2
1
14,8
2
75,0
0
83,3
3
91,6
7
100
,00
1
00
,00
Fin
anci
al R
esou
rces
T
5649
4
9,8
8
9,9
0
37,9
5
43,3
1
48,8
5
59,3
3
65,0
2
4781
4
9,7
7
9,7
9
35,2
3
43,3
1
48,8
5
55,3
9
65,0
2
S
5649
6
6,4
0
25,3
6
33,3
3
50,0
0
66,6
7
91,6
7
100
,00
4
781
6
6,2
5
25,1
7
25
,00
5
0,0
0
66,6
7
83,3
3
100
,00
Tabl
e A1-
7:E
urop
ean
Nor
mda
ta p
roxy
KID
SCR
EE
N a
dole
scen
t 12-
18

Provision of European Norm Data for Children, Adolescents and Their Parents for Group Level Comparison
161
KID
SC
RE
EN
-2
7
Ph
ysi
cal
Wel
l-b
ein
g
T
5601
4
7,1
3
9,7
8
34,7
7
41,0
8
46,5
0
52,6
8
59,3
8
4746
5
0,3
3
9,9
5
38,7
8
43,6
6
49,5
4
55,8
9
63,6
8
S
5601
6
7,1
1
18,3
3
40,0
0
55,0
0
70,0
0
80,0
0
90,0
0
4746
7
2,7
0
17,5
0
50,0
0
60,0
0
75,0
0
85,0
0
95,0
0
Psy
cholo
gic
al
T
5609
4
8,3
6
10,0
8
36,3
8
42,0
8
46,6
7
55,6
7
63,0
8
4741
4
9,9
8
10,0
5
38,1
8
44,2
7
49,3
7
55,6
7
63,0
8
S
5609
7
4,9
0
13,7
2
57,1
4
67,8
6
75,0
0
85,7
1
92,8
6
4741
7
7,1
4
13,0
6
60,7
1
71,4
3
78,5
7
85,7
1
92,8
6
Au
ton
om
y &
Par
ents
T
5587
4
9,2
2
10,2
0
37,4
9
42,1
8
49,1
0
56,0
1
62,9
5
4709
5
0,1
0
10,1
1
39,0
5
43,7
9
49,1
0
56,0
1
62,9
5
S
5587
7
1,9
9
16,3
3
50,0
0
60,7
1
75,0
0
85,7
1
92,8
6
4709
7
3,5
0
15,6
4
53,5
7
64,2
9
75,0
0
85,7
1
92,8
6
Soci
al S
upp
ort
& P
eers
T
5610
4
9,9
6
10,3
1
37,0
6
42,9
1
49,1
4
56,1
3
63,6
9
4699
4
9,5
3
10,3
0
37,0
6
42,9
1
49,1
4
56,1
3
63,6
9
S
5610
6
8,9
0
18,8
4
43,7
5
56,2
5
68,7
5
81,2
5
93,7
5
4699
6
8,1
5
18,8
5
43,7
5
56,2
5
68,7
5
81,2
5
93,7
5
Sch
ool
En
vir
on
men
t
T
5608
4
9,2
3
9,6
4
38,1
4
41,2
4
47,6
9
55,4
0
63,6
8
4756
4
7,5
6
9,7
5
35,3
5
41,2
4
47,6
9
55
,40
5
9,3
4
S
5608
6
9,7
0
16,8
9
50,0
0
56,2
5
68,7
5
81,2
5
93,7
5
4756
6
6,6
4
17,6
8
43,7
5
56,2
5
68,7
5
81,2
5
87,5
0
KID
SC
RE
EN
-10
Gen
eral
HR
Qo
L I
nd
ex
T
5487
4
8,5
5
10,1
1
36,0
3
41,7
1
48,5
8
54,8
9
62,8
5
4627
4
9,5
4
9,7
7
38,7
6
43,3
0
48,5
8
54,8
9
62,8
5
S
5487
7
2,9
4
12,6
1
55,0
0
65,0
0
75,0
0
82,5
0
90,0
0
4627
7
4,3
8
11,8
2
60,0
0
67,5
0
75,0
0
82,5
0
90,0
0
T=
inte
rnat
iona
l T-v
alue
s ba
sed
on R
asch
per
son
para
met
erS
= Su
msc
ore
trans
form
ed in
to v
alue
s be
twee
n 0
-100

Appendix A1
162
Chil
dre
n 8
-11
A
dole
scen
ts 1
2-1
8
Per
cen
tile
s P
erce
nti
les
Sca
le
n
Mea
n
sd
10
2
5
50
7
5
90
n
M
ean
sd
1
0
25
5
0
75
9
0
KID
SC
RE
EN
-52
Ph
ysi
cal
Wel
l-b
ein
g
T
5331
5
2,6
5
9,4
9
41,0
8
46,5
0
52,6
8
59,3
8
63,6
8
1036
5
48,6
0
9,9
9
36,7
0
41,0
8
49,5
4
55,8
9
63,6
8
S
5331
7
6,7
5
15,8
9
55,0
0
65,0
0
80,0
0
90,0
0
95,0
0
1036
5
69,6
7
18,1
7
45
,00
6
0,0
0
70,0
0
85,0
0
90,0
0
Psy
cholo
gic
al W
ell-
bei
ng
T
5344
5
1,8
8
9,4
6
39,0
5
45,9
5
52,1
2
58,1
8
64,4
1
1043
3
49,0
3
10,1
4
34,7
5
41,2
2
48,8
7
55,2
5
61,0
9
S
5344
7
7,9
1
13,9
2
58,3
3
70,8
3
79,1
7
87,5
0
95,8
3
1043
3
73,4
2
15,9
0
50
,00
6
2,5
0
75,0
0
83,3
3
91,6
7
Mood
s &
Em
oti
on
s
T
5339
5
1,4
6
9,6
2
39,8
1
43,8
7
51,2
8
58,0
0
62,6
8
1038
4
49,2
4
10,1
0
36,2
2
41,7
7
48,5
7
54,3
6
62,6
8
S
5339
8
3,4
4
12,4
1
67,8
6
75,0
0
85,7
1
92,8
6
96,4
3
1038
4
80,3
1
13,7
4
60
,71
7
1,4
3
82,1
4
89,2
9
96,4
3
Sel
f-P
ercep
tion
T
5358
5
2,8
9
9,9
1
40,5
1
46,4
8
52,2
7
61,4
3
70,9
8
1045
8
48,5
1
9,7
2
37,3
3
42,2
8
46
,48
5
2,2
7
61,4
3
S
5358
8
1,6
3
14,5
9
60,0
0
75,0
0
85,0
0
95,0
0
100
,00
1
045
8
74,2
1
17,2
3
50,0
0
65,0
0
75,0
0
85,0
0
95,0
0
Au
ton
om
y
T
5
389
5
0,3
4
9,0
3
39,5
1
43,4
8
50,9
5
57,0
7
61,0
1
1050
8
49,8
4
10,4
7
37,6
0
43,4
8
48,2
2
57,0
7
67,9
5
S
5389
7
6,4
0
16,1
1
55,0
0
65,0
0
80,0
0
90,0
0
95,0
0
1050
8
74,7
7
18,8
9
50
,00
6
5,0
0
75,0
0
90,0
0
100
,00
Par
ent
Rel
atio
n &
Hom
e L
ife
T
5328
5
1,4
6
9,3
8
40,2
0
44,5
4
52,1
2
58,4
5
62,4
5
1038
1
49,2
5
10,2
3
36,1
7
42,3
3
49,3
8
55,1
3
62,4
5
S
5328
8
0,1
8
13,9
3
62,5
0
70,8
3
83,3
3
91,6
7
95,8
3
1038
1
76,4
3
16,2
4
54
,17
6
6,6
7
79,1
7
87,5
0
95,8
3
Soci
al S
upp
ort
& P
eers
T
5250
5
0,3
8
9,4
2
38,6
0
44,4
2
50,7
3
55,4
4
63,1
6
1023
5
49,8
0
10,2
9
36,6
7
42,4
6
50,7
3
55,4
4
63,1
6
S
5250
6
8,7
7
16,9
7
45,8
3
58,3
3
70,8
3
79,1
7
91,6
7
1023
5
67,4
9
18,6
2
41
,67
5
4,1
7
70,8
3
79,1
7
91,6
7
Sch
ool
En
vir
on
men
t
T
5363
5
3,5
4
9,9
7
41,2
8
47,5
2
52,0
9
59,6
0
66,0
8
1033
4
48,1
5
9,5
0
35,6
4
41,2
8
47,5
2
54,5
2
59,6
0
S
5363
7
5,5
7
16,7
0
54,1
7
66,6
7
75,0
0
87,5
0
95,8
3
1033
4
66,2
4
17,6
3
41
,67
5
4,1
7
66,6
7
79,1
7
87,5
0
Bu
llyin
g
T
5383
4
7,9
8
10,3
3
34,6
3
39,3
4
50,5
5
58,8
3
58,8
3
1048
8
51,0
4
9,6
5
39,3
4
44
,83
5
8,8
3
58,8
3
58,8
3
S
5383
8
5,6
3
16,0
6
66,6
7
75,0
0
91,6
7
100
,00
1
00
,00
1
048
8
89,8
6
14,4
5
75,0
0
83,3
3
100
,00
1
00
,00
1
00
,00
Fin
anci
al R
esou
rces
T
5147
5
0,3
2
10,2
9
37,4
0
43,3
1
51,9
0
59,3
3
65,0
2
1044
8
49,8
4
9,8
5
35,2
3
43,3
1
48,8
5
55,3
9
65,0
2
S
5147
6
7,4
5
26,1
4
31,6
7
50,0
0
75,0
0
91,6
7
100
,00
1
044
8
66,3
5
25,2
7
25,0
0
50,0
0
66,6
7
83,3
3
100
,00
Tabl
e A1-
8:E
urop
ean
Nor
mda
ta p
roxy
KID
SCR
EE
N fe
mal
es &
mal
es

Provision of European Norm Data for Children, Adolescents and Their Parents for Group Level Comparison
163
KID
SC
RE
EN
-27
Ph
ysi
cal
Wel
l-b
ein
g
T
5331
5
2,6
5
9,4
9
41,0
8
46,5
0
52,6
8
59,3
8
63,6
8
1036
5
48,6
0
9,9
9
36,7
0
41,0
8
49,5
4
55,8
9
63,6
8
S
5331
7
6,7
5
15,8
9
55,0
0
65,0
0
80,0
0
90,0
0
95,0
0
1036
5
69,6
7
18,1
7
45
,00
6
0,0
0
70,0
0
85,0
0
90,0
0
Psy
cholo
gic
al
T
5312
5
1,7
2
9,5
7
40,0
7
46,6
7
52,3
8
55,6
7
63,0
8
1036
7
49,1
0
10,1
0
36,3
8
42,0
8
49,3
7
55,6
7
63,0
8
S
5312
7
9,5
7
11,7
8
64,2
9
75,0
0
82,1
4
85,7
1
92,8
6
1036
7
75,9
3
13,4
7
57
,14
6
7,8
6
78,5
7
85,7
1
92,8
6
Au
ton
om
y &
Par
ents
T
5142
5
0,7
6
9,6
6
39,0
5
43,7
9
49,1
0
56,0
1
62,9
5
1031
4
49,6
3
10,1
6
37,4
9
43,7
9
49,1
0
56,0
1
62,9
5
S
5142
7
4,8
2
14,6
3
53,5
7
64,2
9
75,0
0
85,7
1
92,8
6
1031
4
72,6
9
16,0
3
50
,00
6
4,2
9
75,0
0
85,7
1
92,8
6
Soci
al S
upp
ort
& P
eers
T
5302
5
0,4
4
9,3
9
39,9
7
45,9
4
52,5
9
56,1
3
63,6
9
1032
5
49,7
7
10,3
0
37,0
6
42,9
1
49,1
4
56,1
3
63,6
9
S
5302
7
0,0
0
17,0
9
50,0
0
62,5
0
75,0
0
81,2
5
93,7
5
1032
5
68,5
6
18,8
4
43
,75
5
6,2
5
68,7
5
81,2
5
93,7
5
Sch
ool
En
vir
on
men
t
T
5367
5
2,9
5
9,8
6
38,1
4
47,6
9
51,4
2
59,3
4
63,6
8
1038
1
48,4
7
9,7
3
35,3
5
41,2
4
47,6
9
55,4
0
59,3
4
S
5367
7
5,8
9
16,2
6
50,0
0
68,7
5
75,0
0
87,5
0
93,7
5
1038
1
68,3
0
17,3
3
43
,75
5
6,2
5
68,7
5
81,2
5
87,5
0
KID
SC
RE
EN
-10
Gen
eral
HR
Qo
L I
nd
ex
T
5229
5
1,9
1
9,7
8
40,2
0
44,9
6
50,5
6
57,3
0
66,2
5
1013
2
49,0
0
9,9
8
37,3
7
41,7
1
48,5
8
54,8
9
62,8
5
S
5229
7
7,3
6
11,1
2
62,5
0
70,0
0
77,5
0
85,0
0
92,5
0
1013
2
73,6
0
12,2
8
57
,50
6
5,0
0
75,0
0
82,5
0
90,0
0
T=
inte
rnat
iona
l T-v
alue
s ba
sed
on R
asch
per
son
para
met
erS
= Su
msc
ore
trans
form
ed in
to v
alue
s be
twee
n 0
-100
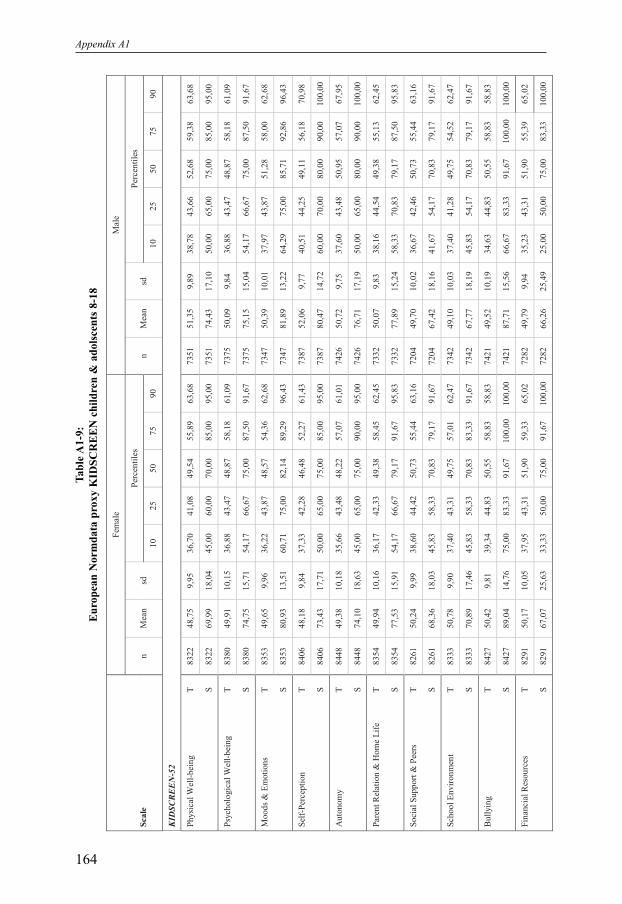
Appendix A1
164
Fem
ale
Mal
e
Per
cen
tile
s P
erce
nti
les
Sca
le
n
Mea
n
sd
10
2
5
50
7
5
90
n
M
ean
sd
1
0
25
5
0
75
9
0
KID
SC
RE
EN
-52
Ph
ysi
cal
Wel
l-b
ein
g
T
8322
4
8,7
5
9,9
5
36,7
0
41,0
8
49,5
4
55,8
9
63,6
8
7351
5
1,3
5
9,8
9
38,7
8
43,6
6
52,6
8
59,3
8
63,6
8
S
8322
6
9,9
9
18,0
4
45,0
0
60,0
0
70,0
0
85,0
0
95,0
0
7351
7
4,4
3
17,1
0
50,0
0
65,0
0
75,0
0
85,0
0
95,0
0
Psy
cholo
gic
al W
ell-
bei
ng
T
8380
4
9,9
1
10,1
5
36,8
8
43,4
7
48,8
7
58,1
8
61,0
9
7375
5
0,0
9
9,8
4
36,8
8
43,4
7
48,8
7
58
,18
6
1,0
9
S
8380
7
4,7
5
15,7
1
54,1
7
66,6
7
75,0
0
87,5
0
91,6
7
7375
7
5,1
5
15,0
4
54,1
7
66,6
7
75,0
0
87,5
0
91,6
7
Mood
s &
Em
oti
on
s
T
8353
4
9,6
5
9,9
6
36,2
2
43,8
7
48,5
7
54,3
6
62,6
8
7347
5
0,3
9
10,0
1
37,9
7
43,8
7
51,2
8
58,0
0
62,6
8
S
8353
8
0,9
3
13,5
1
60,7
1
75,0
0
82,1
4
89,2
9
96,4
3
7347
8
1,8
9
13,2
2
64,2
9
75,0
0
85,7
1
92,8
6
96,4
3
Sel
f-P
ercep
tion
T
8406
4
8,1
8
9,8
4
37,3
3
42,2
8
46,4
8
52,2
7
61,4
3
7387
5
2,0
6
9,7
7
40,5
1
44,2
5
49,1
1
56,1
8
70,9
8
S
8406
7
3,4
3
17,7
1
50,0
0
65,0
0
75,0
0
85,0
0
95,0
0
7387
8
0,4
7
14,7
2
60,0
0
70,0
0
80,0
0
90,0
0
100
,00
Au
ton
om
y
T
8
448
4
9,3
8
10,1
8
35,6
6
43,4
8
48,2
2
57,0
7
61,0
1
7426
5
0,7
2
9,7
5
37,6
0
43,4
8
50,9
5
57,0
7
67,9
5
S
8448
7
4,1
0
18,6
3
45,0
0
65,0
0
75,0
0
90,0
0
95,0
0
7426
7
6,7
1
17,1
9
50,0
0
65,0
0
80,0
0
90,0
0
100
,00
Par
ent
Rel
atio
n &
Hom
e L
ife
T
8354
4
9,9
4
10,1
6
36,1
7
42,3
3
49,3
8
58,4
5
62,4
5
7332
5
0,0
7
9,8
3
38,1
6
44,5
4
49,3
8
55,1
3
62,4
5
S
8354
7
7,5
3
15,9
1
54,1
7
66,6
7
79,1
7
91,6
7
95,8
3
7332
7
7,8
9
15,2
4
58,3
3
70,8
3
79,1
7
87,5
0
95,8
3
Soci
al S
upp
ort
& P
eers
T
8261
5
0,2
4
9,9
9
38,6
0
44,4
2
50,7
3
55,4
4
63,1
6
7204
4
9,7
0
10,0
2
36,6
7
42,4
6
50,7
3
55,4
4
63,1
6
S
8261
6
8,3
6
18,0
3
45,8
3
58,3
3
70,8
3
79,1
7
91,6
7
7204
6
7,4
2
18,1
6
41,6
7
54,1
7
70,8
3
79,1
7
91,6
7
Sch
ool
En
vir
on
men
t
T
8333
5
0,7
8
9,9
0
37,4
0
43,3
1
49,7
5
57,0
1
62,4
7
7342
4
9,1
0
10,0
3
37,4
0
41,2
8
49,7
5
54,5
2
62,4
7
S
8333
7
0,8
9
17,4
6
45,8
3
58,3
3
70,8
3
83,3
3
91,6
7
7342
6
7,7
7
18,1
9
45,8
3
54,1
7
70,8
3
79,1
7
91,6
7
Bu
llyin
g
T
8427
5
0,4
2
9,8
1
39,3
4
44,8
3
50,5
5
58,8
3
58,8
3
7421
4
9,5
2
10,1
9
34,6
3
44,8
3
50,5
5
58,8
3
58,8
3
S
8427
8
9,0
4
14,7
6
75,0
0
83,3
3
91,6
7
100
,00
1
00
,00
7
421
8
7,7
1
15,5
6
66,6
7
83,3
3
91,6
7
100
,00
1
00
,00
Fin
anci
al R
esou
rces
T
8291
5
0,1
7
10,0
5
37,9
5
43,3
1
51,9
0
59,3
3
65,0
2
7282
4
9,7
9
9,9
4
35,2
3
43,3
1
51,9
0
55,3
9
65,0
2
S
8291
6
7,0
7
25,6
3
33,3
3
50,0
0
75,0
0
91,6
7
100
,00
7
282
6
6,2
6
25,4
9
25
,00
5
0,0
0
75,0
0
83,3
3
100
,00
Tabl
e A1-
9:E
urop
ean
Nor
mda
ta p
roxy
KID
SCR
EE
N c
hild
ren
& a
dols
cent
s 8-1
8
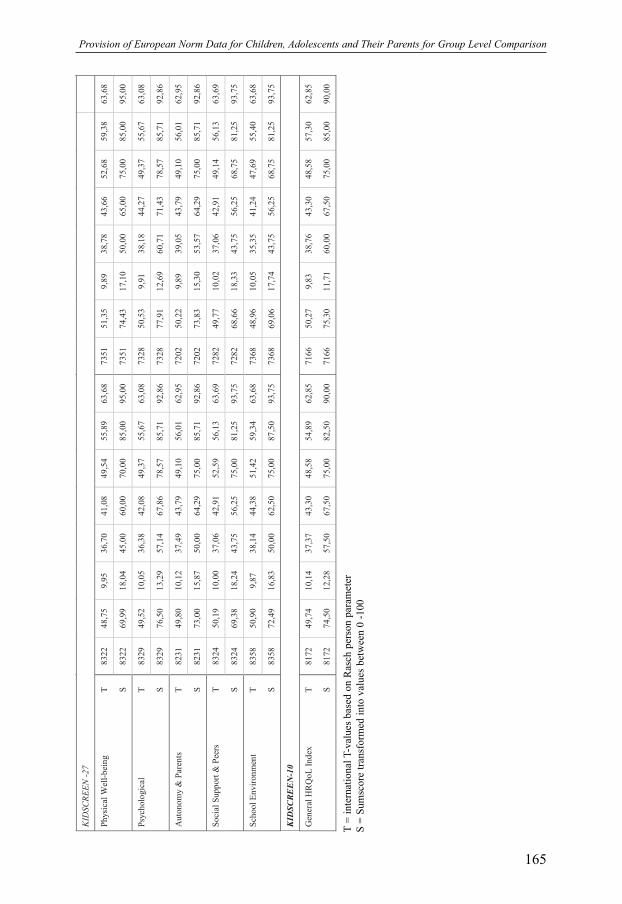
Provision of European Norm Data for Children, Adolescents and Their Parents for Group Level Comparison
165
KID
SC
RE
EN
-2
7
Ph
ysi
cal
Wel
l-b
ein
g
T
8322
4
8,7
5
9,9
5
36,7
0
41,0
8
49,5
4
55,8
9
63,6
8
7351
5
1,3
5
9,8
9
38,7
8
43,6
6
52,6
8
59,3
8
63,6
8
S
8322
6
9,9
9
18,0
4
45,0
0
60,0
0
70,0
0
85,0
0
95,0
0
7351
7
4,4
3
17,1
0
50,0
0
65,0
0
75,0
0
85,0
0
95,0
0
Psy
cholo
gic
al
T
8329
4
9,5
2
10,0
5
36,3
8
42,0
8
49,3
7
55,6
7
63,0
8
7328
5
0,5
3
9,9
1
38,1
8
44,2
7
49,3
7
55,6
7
63,0
8
S
8329
7
6,5
0
13,2
9
57,1
4
67,8
6
78,5
7
85,7
1
92,8
6
7328
7
7,9
1
12,6
9
60,7
1
71,4
3
78,5
7
85,7
1
92,8
6
Au
ton
om
y &
Par
ents
T
8231
4
9,8
0
10,1
2
37,4
9
43,7
9
49,1
0
56,0
1
62,9
5
7202
5
0,2
2
9,8
9
39,0
5
43,7
9
49,1
0
56,0
1
62,9
5
S
8231
7
3,0
0
15,8
7
50,0
0
64,2
9
75,0
0
85,7
1
92,8
6
7202
7
3,8
3
15,3
0
53,5
7
64,2
9
75,0
0
85,7
1
92,8
6
Soci
al S
upp
ort
& P
eers
T
8324
5
0,1
9
10,0
0
37,0
6
42,9
1
52,5
9
56,1
3
63,6
9
7282
4
9,7
7
10,0
2
37,0
6
42,9
1
49,1
4
56,1
3
63,6
9
S
8324
6
9,3
8
18,2
4
43,7
5
56,2
5
75,0
0
81,2
5
93,7
5
7282
6
8,6
6
18,3
3
43,7
5
56,2
5
68,7
5
81,2
5
93,7
5
Sch
ool
En
vir
on
men
t
T
8358
5
0,9
0
9,8
7
38,1
4
44,3
8
51,4
2
59,3
4
63,6
8
7368
4
8,9
6
10,0
5
35,3
5
41,2
4
47,6
9
55,4
0
63,6
8
S
8358
7
2,4
9
16,8
3
50,0
0
62,5
0
75,0
0
87,5
0
93,7
5
7368
6
9,0
6
17,7
4
43,7
5
56,2
5
68,7
5
81,2
5
93,7
5
KID
SC
RE
EN
-10
Gen
eral
HR
Qo
L I
nd
ex
T
8172
4
9,7
4
10,1
4
37,3
7
43,3
0
48,5
8
54,8
9
62,8
5
7166
5
0,2
7
9,8
3
38,7
6
43,3
0
48,5
8
57,3
0
62,8
5
S
8172
7
4,5
0
12,2
8
57,5
0
67,5
0
75,0
0
82,5
0
90,0
0
7166
7
5,3
0
11,7
1
60,0
0
67,5
0
75,0
0
85,0
0
90,0
0
T=
inte
rnat
iona
l T-v
alue
s ba
sed
on R
asch
per
son
para
met
erS
= Su
msc
ore
trans
form
ed in
to v
alue
s be
twee
n 0
-100


Provision of European Norm Data for Children and Adolescents for Individual Diagnostic Use
167
KIDSCREEN Health Related Quality ofLife Questionnaires
Appendix A2:Provision of European Norm Data for Children and Adolescents forIndividual Diagnostic Use
Table A2-1: European reference population (13 countries). Individual norm data for KIDSCREEN-52: Physical Well-being ....................................169
Table A2-2: European reference population (13 countries). Individual norm data for KIDSCREEN-52: Psychological Well-being............................170
Table A2-3: European reference population (13 countries). Individual norm data for KIDSCREEN-52: Moods & Emotions ....................................171
Table A2-4: European reference population (13 countries). Individual norm data for KIDSCREEN-52: Self-Perception ............................................172
Table A2-5: European reference population (13 countries). Individual norm data for KIDSCREEN-52: Autonomy....................................................173
Table A2-6: European reference population (13 countries). Individual norm data for KIDSCREEN-52: Parent Relations & Home Life....................174
Table A2-7: European reference population (13 countries). Individual norm data for KIDSCREEN-52: Social Support & Peers ..............................175
Table A2-8: European reference population (13 countries). Individual norm data for KIDSCREEN-52: School Environment....................................176
Table A2-9: European reference population (13 countries). Individual norm data for KIDSCREEN-52: Social Acceptance ......................................177
Table A2-10: European reference population (13 countries). Individual norm data for KIDSCREEN-52: Financial Resources ....................................178
Table A2-11: European reference population (13 countries). Individual norm data for KIDSCREEN-27: Physical Well-being ....................................179
Table A2-12: European reference population (13 countries). Individual norm data for KIDSCREEN-27: Psychological Well-being............................180
Table A2-13: European reference population (13 countries). Individual norm data for KIDSCREEN-27: Parent Relations & Autonomy ....................181
Table A2-14: European reference population (13 countries). Individual norm data for KIDSCREEN-27: Social Support & Peers ..............................182
Table A2-15: European reference population (13 countries). Individual norm data for KIDSCREEN-27: School Environment....................................183
Table A2-16: European reference population (13 countries). Individual norm data for KIDSCREEN-10 Index ............................................................184

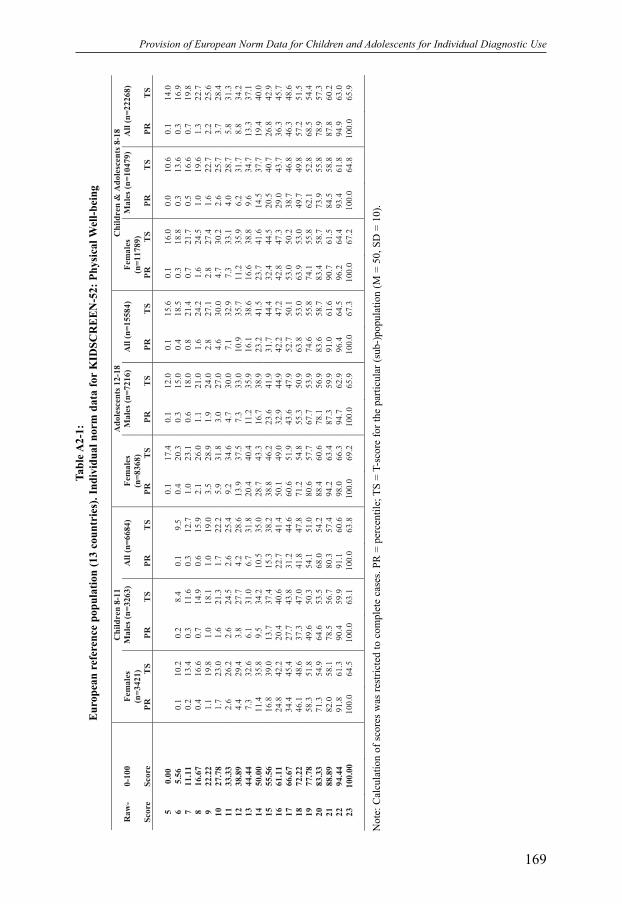
Provision of European Norm Data for Children and Adolescents for Individual Diagnostic Use
169
C
hil
dren
8-1
1
Ad
ole
scen
ts 1
2-1
8
Ch
ild
ren
& A
do
lesc
en
ts 8
-18
Ra
w-
0-1
00
F
em
ale
s
(n=
342
1)
Ma
les
(n=
326
3)
All
(n
=6
684
) F
em
ale
s
(n=
836
8)
Ma
les
(n=
721
6)
All
(n
=1
558
4)
Fem
ale
s
(n=
117
89
)
Ma
les
(n=
104
79
) A
ll (
n=
2226
8)
Sco
re
Sco
re
P
R
TS
P
R
TS
P
R
TS
P
R
TS
P
R
TS
P
R
TS
P
R
TS
P
R
TS
P
R
TS
5
0.0
0
0
.1
17.4
0
.1
12.0
0
.1
15.6
0
.1
16.0
0
.0
10.6
0
.1
14.0
6
5.5
6
0
.1
10.2
0
.2
8.4
0
.1
9.5
0
.4
20.3
0
.3
15.0
0
.4
18.5
0
.3
18.8
0
.3
13.6
0
.3
16.9
7
11.1
1
0
.2
13.4
0
.3
11.6
0
.3
12.7
1
.0
23.1
0
.6
18.0
0
.8
21.4
0
.7
21.7
0
.5
16.6
0
.7
19.8
8
16.6
7
0
.4
16.6
0
.7
14.9
0
.6
15.9
2
.1
26.0
1
.1
21.0
1
.6
24.2
1
.6
24.5
1
.0
19.6
1
.3
22.7
9
22.2
2
1
.1
19.8
1
.0
18.1
1
.0
19.0
3
.5
28.9
1
.9
24.0
2
.8
27.1
2
.8
27.4
1
.6
22.7
2
.2
25.6
10
2
7.7
8
1
.7
23.0
1
.6
21.3
1
.7
22.2
5
.9
31.8
3
.0
27.0
4
.6
30.0
4
.7
30.2
2
.6
25.7
3
.7
28.4
11
3
3.3
3
2
.6
26.2
2
.6
24.5
2
.6
25.4
9
.2
34.6
4
.7
30.0
7
.1
32.9
7
.3
33.1
4
.0
28.7
5
.8
31.3
12
3
8.8
9
4
.4
29.4
3
.8
27.7
4
.2
28.6
1
3.9
3
7.5
7
.3
33.0
1
0.9
3
5.7
1
1.2
3
5.9
6
.2
31.7
8
.8
34.2
13
4
4.4
4
7
.3
32.6
6
.1
31.0
6
.7
31.8
2
0.4
4
0.4
1
1.2
3
5.9
1
6.1
3
8.6
1
6.6
3
8.8
9
.6
34.7
1
3.3
3
7.1
14
5
0.0
0
1
1.4
3
5.8
9
.5
34.2
1
0.5
3
5.0
2
8.7
4
3.3
1
6.7
3
8.9
2
3.2
4
1.5
2
3.7
4
1.6
1
4.5
3
7.7
1
9.4
4
0.0
15
5
5.5
6
1
6.8
3
9.0
1
3.7
3
7.4
1
5.3
3
8.2
3
8.8
4
6.2
2
3.6
4
1.9
3
1.7
4
4.4
3
2.4
4
4.5
2
0.5
4
0.7
2
6.8
4
2.9
16
6
1.1
1
2
4.8
4
2.2
2
0.4
4
0.6
2
2.7
4
1.4
5
0.1
4
9.0
3
2.9
4
4.9
4
2.2
4
7.2
4
2.8
4
7.3
2
9.0
4
3.7
3
6.3
4
5.7
17
6
6.6
7
3
4.4
4
5.4
2
7.7
4
3.8
3
1.2
4
4.6
6
0.6
5
1.9
4
3.6
4
7.9
5
2.7
5
0.1
5
3.0
5
0.2
3
8.7
4
6.8
4
6.3
4
8.6
18
7
2.2
2
4
6.1
4
8.6
3
7.3
4
7.0
4
1.8
4
7.8
7
1.2
5
4.8
5
5.3
5
0.9
6
3.8
5
3.0
6
3.9
5
3.0
4
9.7
4
9.8
5
7.2
5
1.5
19
7
7.7
8
5
8.3
5
1.8
4
9.6
5
0.3
5
4.1
5
1.0
8
0.6
5
7.7
6
7.7
5
3.9
7
4.6
5
5.8
7
4.1
5
5.8
6
2.1
5
2.8
6
8.5
5
4.4
20
8
3.3
3
7
1.3
5
4.9
6
4.6
5
3.5
6
8.0
5
4.2
8
8.4
6
0.6
7
8.1
5
6.9
8
3.6
5
8.7
8
3.4
5
8.7
7
3.9
5
5.8
7
8.9
5
7.3
21
8
8.8
9
8
2.0
5
8.1
7
8.5
5
6.7
8
0.3
5
7.4
9
4.2
6
3.4
8
7.3
5
9.9
9
1.0
6
1.6
9
0.7
6
1.5
8
4.5
5
8.8
8
7.8
6
0.2
22
9
4.4
4
9
1.8
6
1.3
9
0.4
5
9.9
9
1.1
6
0.6
9
8.0
6
6.3
9
4.7
6
2.9
9
6.4
6
4.5
9
6.2
6
4.4
9
3.4
6
1.8
9
4.9
6
3.0
23
1
00
.00
100
.0
64.5
1
00
.0
63.1
1
00
.0
63.8
1
00
.0
69.2
1
00
.0
65.9
1
00
.0
67.3
1
00
.0
67.2
1
00
.0
64.8
1
00
.0
65.9
Tabl
e A2-
1:
Eur
opea
n re
fere
nce
popu
latio
n (1
3 co
untr
ies)
. Ind
ivid
ual n
orm
dat
a fo
rK
IDSC
RE
EN
-52:
Phy
sica
l Wel
l-bei
ng
Not
e: C
alcu
latio
n of
sco
res
was
rest
ricte
d to
com
plet
e ca
ses.
PR =
per
cent
ile; T
S =
T-sc
ore
for t
he p
artic
ular
(sub
-)po
pula
tion
(M =
50,
SD
= 1
0).

Appendix A2
170
C
hil
dren
8-1
1
Ad
ole
scen
ts 1
2-1
8
Ch
ild
ren
& A
do
lesc
en
ts 8
-18
Ra
w-
0-1
00
F
em
ale
s
(n=
346
6)
Ma
les
(n=
328
9)
All
(n
=6
755
) F
em
ale
s
(n=
847
8)
Ma
les
(n=
726
2)
All
(n
=1
574
0)
Fem
ale
s
(n=
119
44
)
Ma
les
(n=
105
51
) A
ll (
n=
2249
5)
Sco
re
Sco
re
P
R
TS
P
R
TS
P
R
TS
P
R
TS
P
R
TS
P
R
TS
P
R
TS
P
R
TS
P
R
TS
6
0.0
0
0
.0
-3.8
0
.1
-3.3
0
.0
-3.5
0
.1
13.2
0
.1
6.9
0
.1
10.7
0
.1
10.6
0
.1
4.7
0
.1
8.1
7
4.1
7
0
.1
-1.1
0
.1
-0.6
0
.1
-0.8
0
.1
15.4
0
.2
9.2
0
.2
13.0
0
.1
12.8
0
.2
7.1
0
.1
10.4
8
8.3
3
0
.1
1.6
0
.2
2.1
0
.2
1.9
0
.3
17.5
0
.3
11.6
0
.3
15.2
0
.3
14.9
0
.3
9.5
0
.3
12.7
9
12.5
0
0
.3
4.4
0
.3
4.8
0
.3
4.6
0
.9
19.6
0
.5
13.9
0
.7
17.4
0
.7
17.1
0
.5
11.9
0
.6
15.0
10
1
6.6
7
0
.3
7.1
0
.5
7.6
0
.4
7.3
1
.4
21.7
0
.8
16.3
1
.1
19.6
1
.1
19.3
0
.7
14.4
0
.9
17.3
11
2
0.8
3
0
.4
9.8
0
.6
10.3
0
.5
10.0
2
.1
23.8
1
.2
18.7
1
.7
21.8
1
.6
21.5
1
.0
16.8
1
.3
19.5
12
2
5.0
0
0
.5
12.5
0
.8
13.0
0
.7
12.7
3
.1
26.0
1
.7
21.0
2
.5
24.0
2
.3
23.7
1
.5
19.2
1
.9
21.8
13
2
9.1
7
0
.9
15.2
0
.9
15.7
0
.9
15.5
4
.3
28.1
2
.4
23.4
3
.5
26.2
3
.3
25.9
2
.0
21.6
2
.7
24.1
14
3
3.3
3
1
.2
18.0
1
.5
18.4
1
.4
18.2
5
.6
30.2
3
.1
25.7
4
.5
28.4
4
.3
28.1
2
.6
24.0
3
.5
26.4
15
3
7.5
0
1
.9
20.7
2
.0
21.1
2
.0
20.9
7
.5
32.3
4
.3
28.1
6
.0
30.6
5
.9
30.3
3
.6
26.5
4
.8
28.7
16
4
1.6
7
2
.6
23.4
2
.8
23.8
2
.7
23.6
9
.6
34.5
5
.6
30.5
7
.7
32.8
7
.6
32.4
4
.7
28.9
6
.2
30.9
17
4
5.8
3
3
.7
26.1
3
.5
26.5
3
.6
26.3
1
2.4
3
6.6
7
.4
32.8
1
0.0
3
5.1
9
.8
34.6
6
.1
31.3
8
.1
33.2
18
5
0.0
0
4
.8
28.9
4
.8
29.2
4
.8
29.0
1
5.9
3
8.7
1
0.1
3
5.2
1
3.2
3
7.3
1
2.7
3
6.8
8
.4
33.7
1
0.7
3
5.5
19
5
4.1
7
6
.6
31.6
6
.5
31.9
6
.6
31.7
2
0.0
4
0.8
1
2.9
3
7.5
1
6.8
3
9.5
1
6.1
3
9.0
1
0.9
3
6.1
1
3.7
3
7.8
20
5
8.3
3
8
.8
34.3
8
.7
34.6
8
.7
34.4
2
4.4
4
3.0
1
6.7
3
9.9
2
0.8
4
1.7
1
9.9
4
1.2
1
4.2
3
8.6
1
7.2
4
0.1
21
6
2.5
0
1
1.6
3
7.0
1
1.9
3
7.3
1
1.7
3
7.2
3
0.4
4
5.1
2
1.6
4
2.3
2
6.3
4
3.9
2
4.9
4
3.4
1
8.6
4
1.0
2
1.9
4
2.3
22
6
6.6
7
1
6.2
3
9.7
1
6.3
4
0.0
1
6.2
3
9.9
3
6.4
4
7.2
2
7.6
4
4.6
3
2.3
4
6.1
3
0.5
4
5.6
2
4.0
4
3.4
2
7.5
4
4.6
23
7
0.8
3
2
1.8
4
2.5
2
2.1
4
2.7
2
2.0
4
2.6
4
3.3
4
9.3
3
4.9
4
7.0
3
9.4
4
8.3
3
7.0
4
7.7
3
0.9
4
5.8
3
4.2
4
6.9
24
7
5.0
0
2
9.7
4
5.2
3
0.0
4
5.4
2
9.9
4
5.3
5
3.3
5
1.4
4
5.4
4
9.3
4
9.6
5
0.5
4
6.5
4
9.9
4
0.6
4
8.3
4
3.7
4
9.2
25
7
9.1
7
3
9.1
4
7.9
3
9.9
4
8.1
3
9.5
4
8.0
6
2.4
5
3.6
5
5.2
5
1.7
5
9.1
5
2.7
5
5.7
5
2.1
5
0.4
5
0.7
5
3.2
5
1.5
26
8
3.3
3
4
8.9
5
0.6
5
0.8
5
0.8
4
9.8
5
0.7
7
1.3
5
5.7
6
5.1
5
4.0
6
8.4
5
4.9
6
4.8
5
4.3
6
0.7
5
3.1
6
2.9
5
3.8
27
8
7.5
0
6
3.2
5
3.3
6
4.3
5
3.5
6
3.7
5
3.4
8
1.8
5
7.8
7
7.1
5
6.4
7
9.7
5
7.2
7
6.4
5
6.5
7
3.1
5
5.5
7
4.9
5
6.0
28
9
1.6
7
7
4.8
5
6.1
7
5.8
5
6.2
7
5.3
5
6.1
8
8.3
5
9.9
8
5.7
5
8.8
8
7.1
5
9.4
8
4.4
5
8.7
8
2.6
5
7.9
8
3.6
5
8.3
29
9
5.8
3
8
5.0
5
8.8
8
6.4
5
8.9
8
5.7
5
8.9
9
3.5
6
2.1
9
1.7
6
1.1
9
2.7
6
1.6
9
1.1
6
0.9
9
0.0
6
0.4
9
0.6
6
0.6
30
1
00
.00
100
.0
61.5
1
00
.0
61.7
1
00
.0
61.6
1
00
.0
64.2
1
00
.0
63.5
1
00
.0
63.8
1
00
.0
63.1
1
00
.0
62.8
1
00
.0
62.9
Tabl
e A2-
2:E
urop
ean
refe
renc
e po
pula
tion
(13
coun
trie
s). I
ndiv
idua
l nor
m d
ata
for
KID
SCR
EE
N-5
2: P
sych
olog
ical
Wel
l-bei
ng
Not
e: C
alcu
latio
n of
sco
res
was
rest
ricte
d to
com
plet
e ca
ses.
PR =
per
cent
ile; T
S =
T-sc
ore
for t
he p
artic
ular
(sub
-)po
pula
tion
(M =
50,
SD
= 1
0).

Provision of European Norm Data for Children and Adolescents for Individual Diagnostic Use
171
C
hil
dren
8-1
1
Ad
ole
scen
ts 1
2-1
8
Ch
ild
ren
& A
do
lesc
en
ts 8
-18
Ra
w-
0-1
00
F
em
ale
s
(n=
342
7)
Ma
les
(n=
325
7)
All
(n
=6
684
) F
em
ale
s
(n=
844
8)
Ma
les
(n=
725
8)
All
(n
=1
570
6)
Fem
ale
s
(n=
118
75
)
Ma
les
(n=
105
15
) A
ll (
n=
2239
0)
Sco
re
Sco
re
P
R
TS
P
R
TS
P
R
TS
P
R
TS
P
R
TS
P
R
TS
P
R
TS
P
R
TS
P
R
TS
7
0.0
0
0
.1
-1.8
0
.1
-4.0
0
.1
-2.8
0
.0
10.5
0
.0
-0.5
0
.0
6.7
0
.1
8.3
0
.0
-1.5
0
.1
4.6
8
3.5
7
0
.1
0.5
0
.1
-1.6
0
.1
-0.5
0
.1
12.4
0
.1
1.8
0
.1
8.7
0
.1
10.3
0
.1
0.8
0
.1
6.7
9
7.1
4
0
.1
2.7
0
.2
0.7
0
.2
1.8
0
.1
14.3
0
.1
4.0
0
.1
10.7
0
.1
12.2
0
.1
3.1
0
.1
8.8
10
1
0.7
1
0
.1
5.0
0
.3
3.1
0
.2
4.1
0
.3
16.2
0
.1
6.2
0
.2
12.8
0
.2
14.2
0
.2
5.4
0
.2
10.8
11
1
4.2
9
0
.2
7.3
0
.3
5.4
0
.3
6.4
0
.5
18.1
0
.2
8.5
0
.4
14.8
0
.4
16.1
0
.2
7.6
0
.3
12.9
12
1
7.8
6
0
.4
9.5
0
.5
7.8
0
.4
8.7
1
.1
20.0
0
.3
10.7
0
.7
16.8
0
.9
18.1
0
.4
9.9
0
.6
15.0
13
2
1.4
3
0
.6
11.8
0
.6
10.1
0
.6
11.0
1
.6
22.0
0
.4
13.0
1
.1
18.8
1
.3
20.0
0
.5
12.2
0
.9
17.1
14
2
5.0
0
0
.8
14.1
0
.8
12.4
0
.8
13.3
2
.2
23.9
0
.7
15.2
1
.5
20.8
1
.8
22.0
0
.7
14.4
1
.3
19.1
15
2
8.5
7
1
.2
16.3
1
.0
14.8
1
.1
15.6
2
.9
25.8
1
.0
17.5
2
.0
22.8
2
.4
24.0
1
.0
16.7
1
.7
21.2
16
3
2.1
4
1
.4
18.6
1
.3
17.1
1
.3
17.9
4
.0
27.7
1
.5
19.7
2
.8
24.8
3
.2
25.9
1
.4
19.0
2
.4
23.3
17
3
5.7
1
1
.9
20.9
1
.6
19.5
1
.8
20.2
5
.1
29.6
2
.0
22.0
3
.7
26.8
4
.2
27.9
1
.9
21.3
3
.1
25.3
18
3
9.2
9
2
.5
23.1
1
.8
21.8
2
.2
22.5
6
.7
31.5
2
.7
24.2
4
.9
28.9
5
.5
29.8
2
.5
23.5
4
.1
27.4
19
4
2.8
6
3
.2
25.4
2
.3
24.1
2
.8
24.8
8
.6
33.4
3
.5
26.4
6
.3
30.9
7
.0
31.8
3
.1
25.8
5
.2
29.5
20
4
6.4
3
4
.2
27.7
3
.3
26.5
3
.7
27.1
1
0.5
3
5.3
4
.6
28.7
7
.8
32.9
8
.7
33.8
4
.2
28.1
6
.6
31.5
21
5
0.0
0
5
.6
29.9
4
.6
28.8
5
.1
29.4
1
3.2
3
7.3
6
.1
30.9
9
.9
34.9
1
1.0
3
5.7
5
.6
30.3
8
.5
33.6
22
5
3.5
7
7
.4
32.2
5
.8
31.2
6
.6
31.7
1
6.4
3
9.2
7
.8
33.2
1
2.4
3
6.9
1
3.8
3
7.7
7
.2
32.6
1
0.7
3
5.7
23
5
7.1
4
9
.1
34.5
7
.5
33.5
8
.3
34.0
2
0.0
4
1.1
1
0.6
3
5.4
1
5.7
3
8.9
1
6.9
3
9.6
9
.6
34.9
1
3.5
3
7.7
24
6
0.7
1
1
1.3
3
6.7
1
0.3
3
5.9
1
0.8
3
6.3
2
4.1
4
3.0
1
3.5
3
7.7
1
9.2
4
0.9
2
0.4
4
1.6
1
2.5
3
7.2
1
6.7
3
9.8
25
6
4.2
9
1
4.6
3
9.0
1
3.2
3
8.2
1
3.9
3
8.6
2
9.0
4
4.9
1
6.8
3
9.9
2
3.4
4
3.0
2
4.9
4
3.5
1
5.7
3
9.4
2
0.6
4
1.9
26
6
7.8
6
1
8.3
4
1.2
1
7.6
4
0.5
1
7.9
4
0.9
3
4.6
4
6.8
2
1.4
4
2.2
2
8.5
4
5.0
2
9.9
4
5.5
2
0.2
4
1.7
2
5.3
4
3.9
27
7
1.4
3
2
3.4
4
3.5
2
2.4
4
2.9
2
2.9
4
3.2
4
1.0
4
8.7
2
7.0
4
4.4
3
4.5
4
7.0
3
5.9
4
7.5
2
5.6
4
4.0
3
1.1
4
6.0
28
7
5.0
0
2
9.8
4
5.8
2
9.2
4
5.2
2
9.5
4
5.5
4
8.6
5
0.7
3
3.8
4
6.7
4
1.8
4
9.0
4
3.2
4
9.4
3
2.4
4
6.2
3
8.1
4
8.1
29
7
8.5
7
3
7.5
4
8.0
3
6.8
4
7.6
3
7.2
4
7.8
5
7.0
5
2.6
4
1.6
4
8.9
4
9.9
5
1.0
5
1.4
5
1.4
4
0.1
4
8.5
4
6.1
5
0.1
30
8
2.1
4
4
6.8
5
0.3
4
5.5
4
9.9
4
6.1
5
0.1
6
5.5
5
4.5
5
1.0
5
1.2
5
8.8
5
3.0
6
0.1
5
3.3
4
9.3
5
0.8
5
5.0
5
2.2
31
8
5.7
1
5
7.1
5
2.6
5
6.0
5
2.2
5
6.6
5
2.4
7
4.0
5
6.4
6
0.7
5
3.4
6
7.9
5
5.0
6
9.1
5
5.3
5
9.3
5
3.1
6
4.5
5
4.3
32
8
9.2
9
6
7.5
5
4.8
6
6.7
5
4.6
6
7.1
5
4.7
8
2.2
5
8.3
7
1.3
5
5.7
7
7.2
5
7.1
7
8.0
5
7.3
6
9.9
5
5.3
7
4.2
5
6.3
33
9
2.8
6
7
9.0
5
7.1
7
7.6
5
6.9
7
8.3
5
7.0
8
9.6
6
0.2
8
2.0
5
7.9
8
6.1
5
9.1
8
6.5
5
9.2
8
0.7
5
7.6
8
3.8
5
8.4
34
9
6.4
3
8
9.0
5
9.4
8
8.3
5
9.3
8
8.7
5
9.3
9
5.1
6
2.1
9
1.4
6
0.2
9
3.4
6
1.1
9
3.4
6
1.2
9
0.4
5
9.9
9
2.0
6
0.5
35
1
00
.00
100
.0
61.6
1
00
.0
61.6
1
00
.0
61.6
1
00
.0
64.0
1
00
.0
62.4
1
00
.0
63.1
1
00
.0
63.1
1
00
.0
62.2
1
00
.0
62.5
Tabl
e A2-
3:E
urop
ean
refe
renc
e po
pula
tion
(13
coun
trie
s). I
ndiv
idua
l nor
m d
ata
for
KID
SCR
EE
N-5
2: M
oods
& E
mot
ions
Not
e: C
alcu
latio
n of
sco
res
was
rest
ricte
d to
com
plet
e ca
ses.
PR =
per
cent
ile; T
S =
T-sc
ore
for t
he p
artic
ular
(sub
-)po
pula
tion
(M =
50,
SD
= 1
0).

Appendix A2
172
C
hil
dren
8-1
1
Ad
ole
scen
ts 1
2-1
8
Ch
ild
ren
& A
do
lesc
en
ts 8
-18
Ra
w-
0-1
00
F
em
ale
s
(n=
346
3)
Ma
les
(n=
328
5)
All
(n
=6
748
) F
em
ale
s
(n=
848
0)
Ma
les
(n=
727
1)
All
(n
=1
575
1)
Fem
ale
s
(n=
119
43
)
Ma
les
(n=
105
56
) A
ll (
n=
2249
9)
Sco
re
Sco
re
P
R
TS
P
R
TS
P
R
TS
P
R
TS
P
R
TS
P
R
TS
P
R
TS
P
R
TS
P
R
TS
5
0.0
0
0
.1
5.5
0
.0
1.7
0
.2
21.6
0
.1
8.3
0
.1
17.9
0
.2
19.8
0
.0
5.9
0
.1
15.5
6
5.0
0
0
.1
8.3
0
.0
-0.7
0
.1
4.6
0
.9
23.9
0
.2
11.0
0
.5
20.2
0
.6
22.0
0
.1
8.7
0
.4
17.8
7
10.0
0
0
.2
11.1
0
.1
2.5
0
.1
7.6
1
.8
26.1
0
.2
13.7
1
.1
22.6
1
.3
24.2
0
.2
11.5
0
.8
20.2
8
15.0
0
0
.4
13.8
0
.2
5.8
0
.3
10.5
2
.8
28.4
0
.4
16.5
1
.7
24.9
2
.1
26.4
0
.4
14.3
1
.3
22.5
9
20.0
0
0
.9
16.6
0
.4
9.0
0
.7
13.5
4
.7
30.6
0
.8
19.2
2
.9
27.2
3
.6
28.7
0
.7
17.1
2
.2
24.9
10
2
5.0
0
1
.5
19.4
0
.6
12.2
1
.1
16.4
7
.4
32.9
1
.4
21.9
4
.7
29.5
5
.7
30.9
1
.1
19.9
3
.6
27.3
11
3
0.0
0
2
.2
22.1
0
.9
15.4
1
.6
19.3
1
0.6
3
5.1
2
.1
24.6
6
.7
31.8
8
.1
33.1
1
.7
22.7
5
.1
29.6
12
3
5.0
0
3
.2
24.9
1
.2
18.6
2
.2
22.3
1
4.3
3
7.4
3
.4
27.4
9
.3
34.1
1
1.1
3
5.3
2
.7
25.5
7
.1
32.0
13
4
0.0
0
4
.5
27.7
1
.9
21.8
3
.3
25.2
1
8.9
3
9.6
5
.5
30.1
1
2.7
3
6.5
1
4.7
3
7.5
4
.4
28.3
9
.9
34.4
14
4
5.0
0
5
.8
30.4
2
.8
25.0
4
.3
28.2
2
4.4
4
1.9
8
.0
32.8
1
6.8
3
8.8
1
9.0
3
9.8
6
.4
31.1
1
3.1
3
6.7
15
5
0.0
0
8
.4
33.2
4
.6
28.2
6
.6
31.1
3
0.7
4
4.1
1
1.3
3
5.6
2
1.8
4
1.1
2
4.3
4
2.0
9
.2
33.9
1
7.2
3
9.1
16
5
5.0
0
1
1.8
3
6.0
6
.6
31.4
9
.3
34.0
3
7.8
4
6.4
1
5.4
3
8.3
2
7.5
4
3.4
3
0.3
4
4.2
1
2.7
3
6.7
2
2.0
4
1.5
17
6
0.0
0
1
5.9
3
8.7
1
0.3
3
4.6
1
3.2
3
7.0
4
5.7
4
8.6
2
0.8
4
1.0
3
4.2
4
5.7
3
7.1
4
6.4
1
7.5
3
9.5
2
7.9
4
3.8
18
6
5.0
0
2
0.8
4
1.5
1
4.4
3
7.8
1
7.7
3
9.9
5
4.3
5
0.9
2
8.2
4
3.7
4
2.3
4
8.0
4
4.6
4
8.7
2
3.9
4
2.3
3
4.9
4
6.2
19
7
0.0
0
2
7.0
4
4.3
2
0.3
4
1.0
2
3.8
4
2.9
6
2.7
5
3.2
3
6.2
4
6.5
5
0.5
5
0.4
5
2.4
5
0.9
3
1.3
4
5.1
4
2.5
4
8.5
20
7
5.0
0
3
6.3
4
7.0
2
8.0
4
4.2
3
2.2
4
5.8
7
1.4
5
5.4
4
5.8
4
9.2
5
9.6
5
2.7
6
1.2
5
3.1
4
0.3
4
7.9
5
1.4
5
0.9
21
8
0.0
0
4
6.0
4
9.8
3
8.2
4
7.4
4
2.2
4
8.8
7
9.5
5
7.7
5
7.0
5
1.9
6
9.1
5
5.0
6
9.8
5
5.3
5
1.1
5
0.7
6
1.0
5
3.3
22
8
5.0
0
5
6.5
5
2.6
4
9.1
5
0.7
5
2.9
5
1.7
8
5.4
5
9.9
6
7.7
5
4.7
7
7.2
5
7.3
7
7.0
5
7.5
6
1.9
5
3.5
6
9.9
5
5.6
23
9
0.0
0
6
8.8
5
5.3
6
2.4
5
3.9
6
5.7
5
4.6
9
1.0
6
2.2
7
8.2
5
7.4
8
5.1
5
9.6
8
4.6
5
9.8
7
3.3
5
6.3
7
9.3
5
8.0
24
9
5.0
0
8
2.4
5
8.1
7
7.8
5
7.1
8
0.2
5
7.6
9
5.6
6
4.4
8
8.0
6
0.1
9
2.1
6
2.0
9
1.8
6
2.0
8
4.8
5
9.1
8
8.5
6
0.4
25
1
00
.00
100
.0
60.9
1
00
.0
60.3
1
00
.0
60.5
1
00
.0
66.7
1
00
.0
62.8
1
00
.0
64.3
1
00
.0
64.2
1
00
.0
61.9
1
00
.0
62.7
Tabl
e A2-
4:E
urop
ean
refe
renc
e po
pula
tion
(13
coun
trie
s). I
ndiv
idua
l nor
m d
ata
for
KID
SCR
EE
N-5
2: S
elf-P
erce
ptio
n
Not
e: C
alcu
latio
n of
sco
res
was
rest
ricte
d to
com
plet
e ca
ses.
PR =
per
cent
ile; T
S =
T-sc
ore
for t
he p
artic
ular
(sub
-)po
pula
tion
(M =
50,
SD
= 1
0).
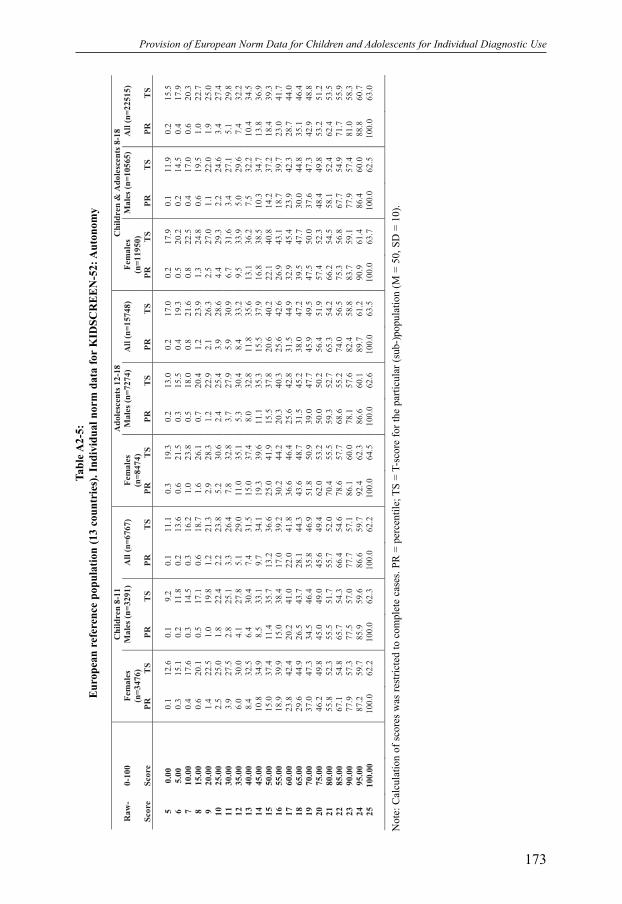
Provision of European Norm Data for Children and Adolescents for Individual Diagnostic Use
173
C
hil
dren
8-1
1
Ad
ole
scen
ts 1
2-1
8
Ch
ild
ren
& A
do
lesc
en
ts 8
-18
Ra
w-
0-1
00
F
em
ale
s
(n=
347
6)
Ma
les
(n=
329
1)
All
(n
=6
767
) F
em
ale
s
(n=
847
4)
Ma
les
(n=
727
4)
All
(n
=1
574
8)
Fem
ale
s
(n=
119
50
)
Ma
les
(n=
105
65
) A
ll (
n=
2251
5)
Sco
re
Sco
re
P
R
TS
P
R
TS
P
R
TS
P
R
TS
P
R
TS
P
R
TS
P
R
TS
P
R
TS
P
R
TS
5
0.0
0
0
.1
12.6
0
.1
9.2
0
.1
11.1
0
.3
19.3
0
.2
13.0
0
.2
17.0
0
.2
17.9
0
.1
11.9
0
.2
15.5
6
5.0
0
0
.3
15.1
0
.2
11.8
0
.2
13.6
0
.6
21.5
0
.3
15.5
0
.4
19.3
0
.5
20.2
0
.2
14.5
0
.4
17.9
7
10.0
0
0
.4
17.6
0
.3
14.5
0
.3
16.2
1
.0
23.8
0
.5
18.0
0
.8
21.6
0
.8
22.5
0
.4
17.0
0
.6
20.3
8
15.0
0
0
.6
20.1
0
.5
17.1
0
.6
18.7
1
.6
26.1
0
.7
20.4
1
.2
23.9
1
.3
24.8
0
.6
19.5
1
.0
22.7
9
20.0
0
1
.4
22.5
1
.0
19.8
1
.2
21.3
2
.9
28.3
1
.2
22.9
2
.1
26.3
2
.5
27.0
1
.1
22.0
1
.9
25.0
10
2
5.0
0
2
.5
25.0
1
.8
22.4
2
.2
23.8
5
.2
30.6
2
.4
25.4
3
.9
28.6
4
.4
29.3
2
.2
24.6
3
.4
27.4
11
3
0.0
0
3
.9
27.5
2
.8
25.1
3
.3
26.4
7
.8
32.8
3
.7
27.9
5
.9
30.9
6
.7
31.6
3
.4
27.1
5
.1
29.8
12
3
5.0
0
6
.0
30.0
4
.1
27.8
5
.1
29.0
1
1.0
3
5.1
5
.3
30.4
8
.4
33.2
9
.5
33.9
5
.0
29.6
7
.4
32.2
13
4
0.0
0
8
.4
32.5
6
.4
30.4
7
.4
31.5
1
5.0
3
7.4
8
.0
32.8
1
1.8
3
5.6
1
3.1
3
6.2
7
.5
32.2
1
0.4
3
4.5
14
4
5.0
0
1
0.8
3
4.9
8
.5
33.1
9
.7
34.1
1
9.3
3
9.6
1
1.1
3
5.3
1
5.5
3
7.9
1
6.8
3
8.5
1
0.3
3
4.7
1
3.8
3
6.9
15
5
0.0
0
1
5.0
3
7.4
1
1.4
3
5.7
1
3.2
3
6.6
2
5.0
4
1.9
1
5.5
3
7.8
2
0.6
4
0.2
2
2.1
4
0.8
1
4.2
3
7.2
1
8.4
3
9.3
16
5
5.0
0
1
8.9
3
9.9
1
5.0
3
8.4
1
7.0
3
9.2
3
0.2
4
4.2
2
0.3
4
0.3
2
5.6
4
2.6
2
6.9
4
3.1
1
8.7
3
9.7
2
3.0
4
1.7
17
6
0.0
0
2
3.8
4
2.4
2
0.2
4
1.0
2
2.0
4
1.8
3
6.6
4
6.4
2
5.6
4
2.8
3
1.5
4
4.9
3
2.9
4
5.4
2
3.9
4
2.3
2
8.7
4
4.0
18
6
5.0
0
2
9.6
4
4.9
2
6.5
4
3.7
2
8.1
4
4.3
4
3.6
4
8.7
3
1.5
4
5.2
3
8.0
4
7.2
3
9.5
4
7.7
3
0.0
4
4.8
3
5.1
4
6.4
19
7
0.0
0
3
7.0
4
7.3
3
4.5
4
6.4
3
5.8
4
6.9
5
1.8
5
0.9
3
9.0
4
7.7
4
5.9
4
9.5
4
7.5
5
0.0
3
7.6
4
7.3
4
2.9
4
8.8
20
7
5.0
0
4
6.2
4
9.8
4
5.0
4
9.0
4
5.6
4
9.4
6
2.0
5
3.2
5
0.0
5
0.2
5
6.4
5
1.9
5
7.4
5
2.3
4
8.4
4
9.8
5
3.2
5
1.2
21
8
0.0
0
5
5.8
5
2.3
5
5.5
5
1.7
5
5.7
5
2.0
7
0.4
5
5.5
5
9.3
5
2.7
6
5.3
5
4.2
6
6.2
5
4.5
5
8.1
5
2.4
6
2.4
5
3.5
22
8
5.0
0
6
7.1
5
4.8
6
5.7
5
4.3
6
6.4
5
4.6
7
8.6
5
7.7
6
8.6
5
5.2
7
4.0
5
6.5
7
5.3
5
6.8
6
7.7
5
4.9
7
1.7
5
5.9
23
9
0.0
0
7
7.9
5
7.3
7
7.5
5
7.0
7
7.7
5
7.1
8
6.1
6
0.0
7
8.1
5
7.6
8
2.4
5
8.8
8
3.7
5
9.1
7
7.9
5
7.4
8
1.0
5
8.3
24
9
5.0
0
8
7.2
5
9.7
8
5.9
5
9.6
8
6.6
5
9.7
9
2.4
6
2.3
8
6.6
6
0.1
8
9.7
6
1.2
9
0.9
6
1.4
8
6.4
6
0.0
8
8.8
6
0.7
25
1
00
.00
100
.0
62.2
1
00
.0
62.3
1
00
.0
62.2
1
00
.0
64.5
1
00
.0
62.6
1
00
.0
63.5
1
00
.0
63.7
1
00
.0
62.5
1
00
.0
63.0
Tabl
e A2-
5:E
urop
ean
refe
renc
e po
pula
tion
(13
coun
trie
s). I
ndiv
idua
l nor
m d
ata
for
KID
SCR
EE
N-5
2: A
uton
omy
Not
e: C
alcu
latio
n of
sco
res
was
rest
ricte
d to
com
plet
e ca
ses.
PR =
per
cent
ile; T
S =
T-sc
ore
for t
he p
artic
ular
(sub
-)po
pula
tion
(M =
50,
SD
= 1
0).

Appendix A2
174
C
hil
dren
8-1
1
Ad
ole
scen
ts 1
2-1
8
Ch
ild
ren
& A
do
lesc
en
ts 8
-18
Ra
w-
0-1
00
F
em
ale
s
(n=
344
3)
Ma
les
(n=
326
8)
All
(n
=6
711
) F
em
ale
s
(n=
840
2)
Ma
les
(n=
720
8)
All
(n
=1
561
0)
Fem
ale
s
(n=
118
45
)
Ma
les
(n=
104
76
) A
ll (
n=
2232
1)
Sco
re
Sco
re
P
R
TS
P
R
TS
P
R
TS
P
R
TS
P
R
TS
P
R
TS
P
R
TS
P
R
TS
P
R
TS
6
0.0
0
0
.2
14.8
0
.2
8.3
0
.2
12.2
0
.1
11.9
0
.1
5.8
0
.1
9.3
7
4.1
7
0
.0
-0.5
0
.0
-0.4
0
.4
16.8
0
.3
10.5
0
.3
14.3
0
.3
13.9
0
.2
8.1
0
.2
11.5
8
8.3
3
0
.1
2.3
0
.1
2.1
0
.1
2.2
0
.6
18.8
0
.4
12.8
0
.5
16.4
0
.4
16.0
0
.3
10.4
0
.4
13.6
9
12.5
0
0
.2
4.9
0
.2
4.8
0
.2
4.8
0
.9
20.7
0
.5
15.0
0
.7
18.4
0
.7
18.0
0
.4
12.7
0
.6
15.8
10
1
6.6
7
0
.3
7.5
0
.4
7.4
0
.3
7.5
1
.5
22.7
0
.7
17.2
1
.2
20.5
1
.2
20.1
0
.6
15.0
0
.9
17.9
11
2
0.8
3
0
.4
10.1
0
.6
10.1
0
.5
10.1
2
.2
24.6
1
.0
19.4
1
.6
22.5
1
.7
22.1
0
.8
17.3
1
.3
20.1
12
2
5.0
0
0
.6
12.7
0
.7
12.7
0
.6
12.7
3
.1
26.6
1
.5
21.6
2
.4
24.6
2
.4
24.1
1
.2
19.6
1
.8
22.2
13
2
9.1
7
0
.9
15.3
0
.9
15.3
0
.9
15.3
4
.4
28.5
2
.3
23.9
3
.4
26.6
3
.4
26.2
1
.8
21.9
2
.7
24.4
14
3
3.3
3
1
.6
17.9
1
.1
18.0
1
.3
18.0
6
.0
30.5
3
.0
26.1
4
.6
28.7
4
.7
28.2
2
.4
24.2
3
.6
26.5
15
3
7.5
0
2
.0
20.5
1
.6
20.6
1
.8
20.6
8
.0
32.4
4
.2
28.3
6
.2
30.8
6
.3
30.3
3
.4
26.5
4
.9
28.7
16
4
1.6
7
2
.7
23.1
2
.3
23.3
2
.5
23.2
1
0.0
3
4.4
5
.7
30.5
8
.1
32.8
7
.9
32.3
4
.7
28.8
6
.4
30.8
17
4
5.8
3
3
.5
25.7
3
.1
25.9
3
.3
25.8
1
2.7
3
6.4
7
.4
32.7
1
0.3
3
4.9
1
0.0
3
4.4
6
.1
31.1
8
.2
33.0
18
5
0.0
0
5
.0
28.3
4
.9
28.5
5
.0
28.4
1
5.7
3
8.3
1
0.2
3
5.0
1
3.2
3
6.9
1
2.6
3
6.4
8
.6
33.4
1
0.7
3
5.1
19
5
4.1
7
7
.0
30.9
6
.5
31.2
6
.8
31.1
1
9.2
4
0.3
1
3.2
3
7.2
1
6.4
3
9.0
1
5.7
3
8.4
1
1.1
3
5.7
1
3.5
3
7.3
20
5
8.3
3
9
.2
33.5
8
.9
33.8
9
.0
33.7
2
3.2
4
2.2
1
7.1
3
9.4
2
0.4
4
1.1
1
9.1
4
0.5
1
4.6
3
8.0
1
7.0
3
9.4
21
6
2.5
0
1
1.5
3
6.1
1
2.5
3
6.5
1
2.0
3
6.3
2
7.9
4
4.2
2
1.6
4
1.6
2
5.0
4
3.1
2
3.1
4
2.5
1
8.8
4
0.3
2
1.1
4
1.6
22
6
6.6
7
1
5.1
3
8.7
1
6.3
3
9.1
1
5.7
3
8.9
3
3.3
4
6.1
2
6.5
4
3.8
3
0.2
4
5.2
2
8.0
4
4.6
2
3.3
4
2.6
2
5.8
4
3.7
23
7
0.8
3
1
9.3
4
1.3
2
1.0
4
1.8
2
0.1
4
1.5
3
8.9
4
8.1
3
2.9
4
6.1
3
6.1
4
7.2
3
3.2
4
6.6
2
9.2
4
4.9
3
1.3
4
5.9
24
7
5.0
0
2
4.8
4
3.9
2
7.1
4
4.4
2
5.9
4
4.2
4
5.7
5
0.0
4
0.7
4
8.3
4
3.4
4
9.3
3
9.6
4
8.6
3
6.5
4
7.3
3
8.1
4
8.0
25
7
9.1
7
3
1.6
4
6.6
3
4.3
4
7.0
3
2.9
4
6.8
5
2.3
5
2.0
4
8.5
5
0.5
5
0.6
5
1.3
4
6.3
5
0.7
4
4.1
4
9.6
4
5.3
5
0.2
26
8
3.3
3
4
0.5
4
9.2
4
3.8
4
9.7
4
2.1
4
9.4
6
0.1
5
3.9
5
6.8
5
2.7
5
8.6
5
3.4
5
4.4
5
2.7
5
2.8
5
1.9
5
3.6
5
2.3
27
8
7.5
0
5
0.4
5
1.8
5
4.0
5
2.3
5
2.2
5
2.0
6
8.9
5
5.9
6
6.0
5
4.9
6
7.6
5
5.5
6
3.6
5
4.8
6
2.2
5
4.2
6
2.9
5
4.5
28
9
1.6
7
6
2.9
5
4.4
6
6.6
5
5.0
6
4.7
5
4.7
7
8.7
5
7.9
7
6.1
5
7.2
7
7.5
5
7.5
7
4.1
5
6.8
7
3.1
5
6.5
7
3.6
5
6.6
29
9
5.8
3
7
8.0
5
7.0
8
0.9
5
7.6
7
9.4
5
7.3
8
7.9
5
9.8
8
6.0
5
9.4
8
7.0
5
9.6
8
5.0
5
8.9
8
4.4
5
8.8
8
4.7
5
8.8
30
1
00
.00
100
.0
59.6
1
00
.0
60.2
1
00
.0
59.9
1
00
.0
61.8
1
00
.0
61.6
1
00
.0
61.6
1
00
.0
60.9
1
00
.0
61.1
1
00
.0
60.9
Tabl
e A2-
6:E
urop
ean
refe
renc
e po
pula
tion
(13
coun
trie
s). I
ndiv
idua
l nor
m d
ata
for
KID
SCR
EE
N-5
2: P
aren
t Rel
atio
ns &
Hom
e L
ife
Not
e: C
alcu
latio
n of
sco
res
was
rest
ricte
d to
com
plet
e ca
ses.
PR =
per
cent
ile; T
S =
T-sc
ore
for t
he p
artic
ular
(sub
-)po
pula
tion
(M =
50,
SD
= 1
0).
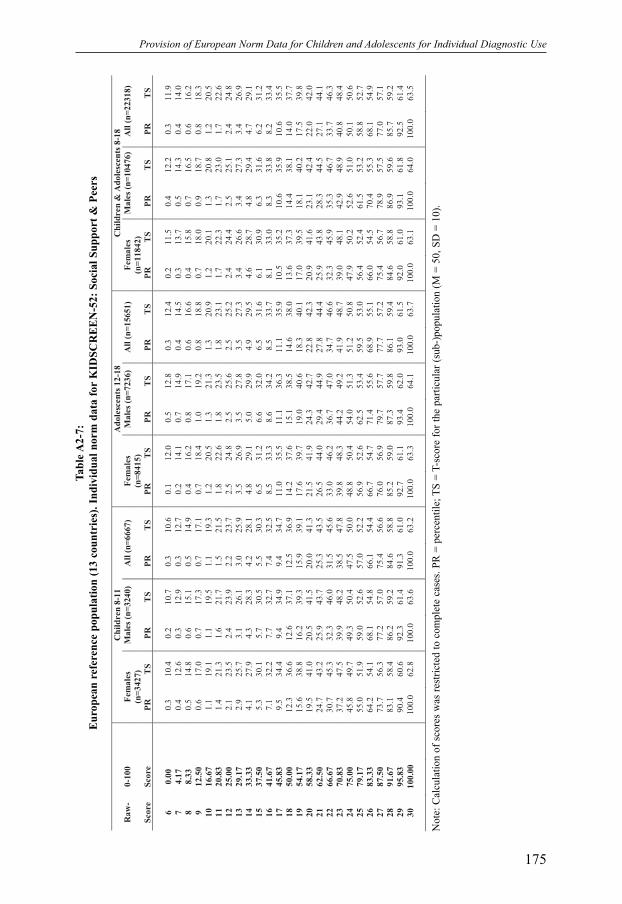
Provision of European Norm Data for Children and Adolescents for Individual Diagnostic Use
175
C
hil
dren
8-1
1
Ad
ole
scen
ts 1
2-1
8
Ch
ild
ren
& A
do
lesc
en
ts 8
-18
Ra
w-
0-1
00
F
em
ale
s
(n=
342
7)
Ma
les
(n=
324
0)
All
(n
=6
667
) F
em
ale
s
(n=
841
5)
Ma
les
(n=
723
6)
All
(n
=1
565
1)
Fem
ale
s
(n=
118
42
)
Ma
les
(n=
104
76
) A
ll (
n=
2231
8)
Sco
re
Sco
re
P
R
TS
P
R
TS
P
R
TS
P
R
TS
P
R
TS
P
R
TS
P
R
TS
P
R
TS
P
R
TS
6
0.0
0
0
.3
10.4
0
.2
10.7
0
.3
10.6
0
.1
12.0
0
.5
12.8
0
.3
12.4
0
.2
11.5
0
.4
12.2
0
.3
11.9
7
4.1
7
0
.4
12.6
0
.3
12.9
0
.3
12.7
0
.2
14.1
0
.7
14.9
0
.4
14.5
0
.3
13.7
0
.5
14.3
0
.4
14.0
8
8.3
3
0
.5
14.8
0
.6
15.1
0
.5
14.9
0
.4
16.2
0
.8
17.1
0
.6
16.6
0
.4
15.8
0
.7
16.5
0
.6
16.2
9
12.5
0
0
.6
17.0
0
.7
17.3
0
.7
17.1
0
.7
18.4
1
.0
19.2
0
.8
18.8
0
.7
18.0
0
.9
18.7
0
.8
18.3
10
1
6.6
7
1
.1
19.1
1
.1
19.5
1
.1
19.3
1
.2
20.5
1
.3
21.3
1
.3
20.9
1
.2
20.1
1
.3
20.8
1
.2
20.5
11
2
0.8
3
1
.4
21.3
1
.6
21.7
1
.5
21.5
1
.8
22.6
1
.8
23.5
1
.8
23.1
1
.7
22.3
1
.7
23.0
1
.7
22.6
12
2
5.0
0
2
.1
23.5
2
.4
23.9
2
.2
23.7
2
.5
24.8
2
.5
25.6
2
.5
25.2
2
.4
24.4
2
.5
25.1
2
.4
24.8
13
2
9.1
7
2
.9
25.7
3
.1
26.1
3
.0
25.9
3
.5
26.9
3
.5
27.8
3
.5
27.3
3
.4
26.6
3
.4
27.3
3
.4
26.9
14
3
3.3
3
4
.1
27.9
4
.3
28.3
4
.2
28.1
4
.8
29.1
5
.0
29.9
4
.9
29.5
4
.6
28.7
4
.8
29.4
4
.7
29.1
15
3
7.5
0
5
.3
30.1
5
.7
30.5
5
.5
30.3
6
.5
31.2
6
.6
32.0
6
.5
31.6
6
.1
30.9
6
.3
31.6
6
.2
31.2
16
4
1.6
7
7
.1
32.2
7
.7
32.7
7
.4
32.5
8
.5
33.3
8
.6
34.2
8
.5
33.7
8
.1
33.0
8
.3
33.8
8
.2
33.4
17
4
5.8
3
9
.5
34.4
9
.4
34.9
9
.4
34.7
1
1.0
3
5.5
1
1.1
3
6.3
1
1.1
3
5.9
1
0.5
3
5.2
1
0.6
3
5.9
1
0.6
3
5.5
18
5
0.0
0
1
2.3
3
6.6
1
2.6
3
7.1
1
2.5
3
6.9
1
4.2
3
7.6
1
5.1
3
8.5
1
4.6
3
8.0
1
3.6
3
7.3
1
4.4
3
8.1
1
4.0
3
7.7
19
5
4.1
7
1
5.6
3
8.8
1
6.2
3
9.3
1
5.9
3
9.1
1
7.6
3
9.7
1
9.0
4
0.6
1
8.3
4
0.1
1
7.0
3
9.5
1
8.1
4
0.2
1
7.5
3
9.8
20
5
8.3
3
1
9.5
4
1.0
2
0.5
4
1.5
2
0.0
4
1.3
2
1.5
4
1.9
2
4.3
4
2.7
2
2.8
4
2.3
2
0.9
4
1.6
2
3.1
4
2.4
2
2.0
4
2.0
21
6
2.5
0
2
4.7
4
3.2
2
5.9
4
3.7
2
5.3
4
3.5
2
6.5
4
4.0
2
9.4
4
4.9
2
7.8
4
4.4
2
5.9
4
3.8
2
8.3
4
4.5
2
7.1
4
4.1
22
6
6.6
7
3
0.7
4
5.3
3
2.3
4
6.0
3
1.5
4
5.6
3
3.0
4
6.2
3
6.7
4
7.0
3
4.7
4
6.6
3
2.3
4
5.9
3
5.3
4
6.7
3
3.7
4
6.3
23
7
0.8
3
3
7.2
4
7.5
3
9.9
4
8.2
3
8.5
4
7.8
3
9.8
4
8.3
4
4.2
4
9.2
4
1.9
4
8.7
3
9.0
4
8.1
4
2.9
4
8.9
4
0.8
4
8.4
24
7
5.0
0
4
5.8
4
9.7
4
9.3
5
0.4
4
7.5
5
0.0
4
8.8
5
0.4
5
4.0
5
1.3
5
1.2
5
0.8
4
7.9
5
0.2
5
2.6
5
1.0
5
0.1
5
0.6
25
7
9.1
7
5
5.0
5
1.9
5
9.0
5
2.6
5
7.0
5
2.2
5
6.9
5
2.6
6
2.5
5
3.4
5
9.5
5
3.0
5
6.4
5
2.4
6
1.5
5
3.2
5
8.8
5
2.7
26
8
3.3
3
6
4.2
5
4.1
6
8.1
5
4.8
6
6.1
5
4.4
6
6.7
5
4.7
7
1.4
5
5.6
6
8.9
5
5.1
6
6.0
5
4.5
7
0.4
5
5.3
6
8.1
5
4.9
27
8
7.5
0
7
3.7
5
6.3
7
7.2
5
7.0
7
5.4
5
6.6
7
6.0
5
6.9
7
9.7
5
7.7
7
7.7
5
7.2
7
5.4
5
6.7
7
8.9
5
7.5
7
7.0
5
7.1
28
9
1.6
7
8
3.1
5
8.4
8
6.2
5
9.2
8
4.6
5
8.8
8
5.2
5
9.0
8
7.3
5
9.8
8
6.1
5
9.4
8
4.6
5
8.8
8
6.9
5
9.6
8
5.7
5
9.2
29
9
5.8
3
9
0.4
6
0.6
9
2.3
6
1.4
9
1.3
6
1.0
9
2.7
6
1.1
9
3.4
6
2.0
9
3.0
6
1.5
9
2.0
6
1.0
9
3.1
6
1.8
9
2.5
6
1.4
30
1
00
.00
100
.0
62.8
1
00
.0
63.6
1
00
.0
63.2
1
00
.0
63.3
1
00
.0
64.1
1
00
.0
63.7
1
00
.0
63.1
1
00
.0
64.0
1
00
.0
63.5
Tabl
e A2-
7:E
urop
ean
refe
renc
e po
pula
tion
(13
coun
trie
s). I
ndiv
idua
l nor
m d
ata
for
KID
SCR
EE
N-5
2: S
ocia
l Sup
port
& P
eers
Not
e: C
alcu
latio
n of
sco
res
was
rest
ricte
d to
com
plet
e ca
ses.
PR =
per
cent
ile; T
S =
T-sc
ore
for t
he p
artic
ular
(sub
-)po
pula
tion
(M =
50,
SD
= 1
0).
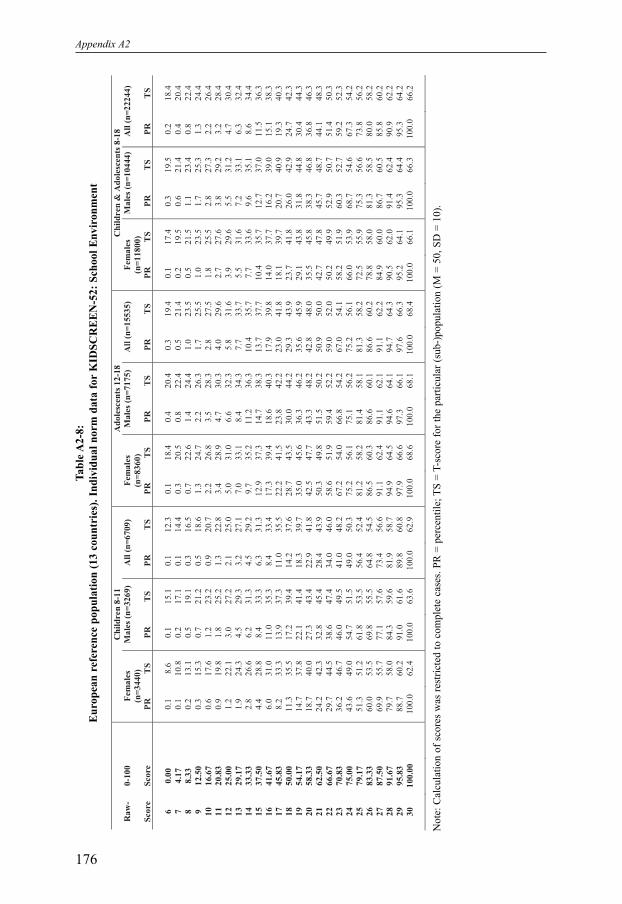
Appendix A2
176
C
hil
dren
8-1
1
Ad
ole
scen
ts 1
2-1
8
Ch
ild
ren
& A
do
lesc
en
ts 8
-18
Ra
w-
0-1
00
F
em
ale
s
(n=
344
0)
Ma
les
(n=
326
9)
All
(n
=6
709
) F
em
ale
s
(n=
836
0)
Ma
les
(n=
717
5)
All
(n
=1
553
5)
Fem
ale
s
(n=
118
00
)
Ma
les
(n=
104
44
) A
ll (
n=
2224
4)
Sco
re
Sco
re
P
R
TS
P
R
TS
P
R
TS
P
R
TS
P
R
TS
P
R
TS
P
R
TS
P
R
TS
P
R
TS
6
0.0
0
0
.1
8.6
0
.1
15.1
0
.1
12.3
0
.1
18.4
0
.4
20.4
0
.3
19.4
0
.1
17.4
0
.3
19.5
0
.2
18.4
7
4.1
7
0
.1
10.8
0
.2
17.1
0
.1
14.4
0
.3
20.5
0
.8
22.4
0
.5
21.4
0
.2
19.5
0
.6
21.4
0
.4
20.4
8
8.3
3
0
.2
13.1
0
.5
19.1
0
.3
16.5
0
.7
22.6
1
.4
24.4
1
.0
23.5
0
.5
21.5
1
.1
23.4
0
.8
22.4
9
12.5
0
0
.3
15.3
0
.7
21.2
0
.5
18.6
1
.3
24.7
2
.2
26.3
1
.7
25.5
1
.0
23.5
1
.7
25.3
1
.3
24.4
10
1
6.6
7
0
.6
17.6
1
.2
23.2
0
.9
20.7
2
.2
26.8
3
.5
28.3
2
.8
27.5
1
.8
25.5
2
.8
27.3
2
.2
26.4
11
2
0.8
3
0
.9
19.8
1
.8
25.2
1
.3
22.8
3
.4
28.9
4
.7
30.3
4
.0
29.6
2
.7
27.6
3
.8
29.2
3
.2
28.4
12
2
5.0
0
1
.2
22.1
3
.0
27.2
2
.1
25.0
5
.0
31.0
6
.6
32.3
5
.8
31.6
3
.9
29.6
5
.5
31.2
4
.7
30.4
13
2
9.1
7
1
.9
24.3
4
.5
29.3
3
.2
27.1
7
.0
33.1
8
.4
34.3
7
.7
33.7
5
.5
31.6
7
.2
33.1
6
.3
32.4
14
3
3.3
3
2
.8
26.6
6
.2
31.3
4
.5
29.2
9
.7
35.2
1
1.2
3
6.3
1
0.4
3
5.7
7
.7
33.6
9
.6
35.1
8
.6
34.4
15
3
7.5
0
4
.4
28.8
8
.4
33.3
6
.3
31.3
1
2.9
3
7.3
1
4.7
3
8.3
1
3.7
3
7.7
1
0.4
3
5.7
1
2.7
3
7.0
1
1.5
3
6.3
16
4
1.6
7
6
.0
31.0
1
1.0
3
5.3
8
.4
33.4
1
7.3
3
9.4
1
8.6
4
0.3
1
7.9
3
9.8
1
4.0
3
7.7
1
6.2
3
9.0
1
5.1
3
8.3
17
4
5.8
3
8
.2
33.3
1
3.9
3
7.3
1
1.0
3
5.5
2
2.2
4
1.5
2
3.8
4
2.2
2
3.0
4
1.8
1
8.1
3
9.7
2
0.7
4
0.9
1
9.3
4
0.3
18
5
0.0
0
1
1.3
3
5.5
1
7.2
3
9.4
1
4.2
3
7.6
2
8.7
4
3.5
3
0.0
4
4.2
2
9.3
4
3.9
2
3.7
4
1.8
2
6.0
4
2.9
2
4.7
4
2.3
19
5
4.1
7
1
4.7
3
7.8
2
2.1
4
1.4
1
8.3
3
9.7
3
5.0
4
5.6
3
6.3
4
6.2
3
5.6
4
5.9
2
9.1
4
3.8
3
1.8
4
4.8
3
0.4
4
4.3
20
5
8.3
3
1
8.7
4
0.0
2
7.3
4
3.4
2
2.9
4
1.8
4
2.5
4
7.7
4
3.3
4
8.2
4
2.8
4
8.0
3
5.5
4
5.8
3
8.3
4
6.8
3
6.8
4
6.3
21
6
2.5
0
2
4.2
4
2.3
3
2.8
4
5.4
2
8.4
4
3.9
5
0.3
4
9.8
5
1.5
5
0.2
5
0.9
5
0.0
4
2.7
4
7.8
4
5.7
4
8.7
4
4.1
4
8.3
22
6
6.6
7
2
9.7
4
4.5
3
8.6
4
7.4
3
4.0
4
6.0
5
8.6
5
1.9
5
9.4
5
2.2
5
9.0
5
2.0
5
0.2
4
9.9
5
2.9
5
0.7
5
1.4
5
0.3
23
7
0.8
3
3
6.2
4
6.7
4
6.0
4
9.5
4
1.0
4
8.2
6
7.2
5
4.0
6
6.8
5
4.2
6
7.0
5
4.1
5
8.2
5
1.9
6
0.3
5
2.7
5
9.2
5
2.3
24
7
5.0
0
4
3.6
4
9.0
5
4.7
5
1.5
4
9.0
5
0.3
7
5.2
5
6.1
7
5.1
5
6.2
7
5.2
5
6.1
6
6.0
5
3.9
6
8.7
5
4.6
6
7.3
5
4.2
25
7
9.1
7
5
1.3
5
1.2
6
1.8
5
3.5
5
6.4
5
2.4
8
1.2
5
8.2
8
1.4
5
8.1
8
1.3
5
8.2
7
2.5
5
5.9
7
5.3
5
6.6
7
3.8
5
6.2
26
8
3.3
3
6
0.0
5
3.5
6
9.8
5
5.5
6
4.8
5
4.5
8
6.5
6
0.3
8
6.6
6
0.1
8
6.6
6
0.2
7
8.8
5
8.0
8
1.3
5
8.5
8
0.0
5
8.2
27
8
7.5
0
6
9.9
5
5.7
7
7.1
5
7.6
7
3.4
5
6.6
9
1.1
6
2.4
9
1.1
6
2.1
9
1.1
6
2.2
8
4.9
6
0.0
8
6.7
6
0.5
8
5.8
6
0.2
28
9
1.6
7
7
9.7
5
8.0
8
4.3
5
9.6
8
1.9
5
8.7
9
4.9
6
4.5
9
4.6
6
4.1
9
4.7
6
4.3
9
0.5
6
2.0
9
1.4
6
2.4
9
0.9
6
2.2
29
9
5.8
3
8
8.7
6
0.2
9
1.0
6
1.6
8
9.8
6
0.8
9
7.9
6
6.6
9
7.3
6
6.1
9
7.6
6
6.3
9
5.2
6
4.1
9
5.3
6
4.4
9
5.3
6
4.2
30
1
00
.00
100
.0
62.4
1
00
.0
63.6
1
00
.0
62.9
1
00
.0
68.6
1
00
.0
68.1
1
00
.0
68.4
1
00
.0
66.1
1
00
.0
66.3
1
00
.0
66.2
Tabl
e A2-
8:E
urop
ean
refe
renc
e po
pula
tion
(13
coun
trie
s). I
ndiv
idua
l nor
m d
ata
for
KID
SCR
EE
N-5
2: S
choo
l Env
iron
men
t
Not
e: C
alcu
latio
n of
sco
res
was
rest
ricte
d to
com
plet
e ca
ses.
PR =
per
cent
ile; T
S =
T-sc
ore
for t
he p
artic
ular
(sub
-)po
pula
tion
(M =
50,
SD
= 1
0).

Provision of European Norm Data for Children and Adolescents for Individual Diagnostic Use
177
C
hil
dren
8-1
1
Ad
ole
scen
ts 1
2-1
8
Ch
ild
ren
& A
do
lesc
en
ts 8
-18
Ra
w-
0-1
00
F
em
ale
s
(n=
348
3)
Ma
les
(n=
330
7)
All
(n
=6
790
) F
em
ale
s
(n=
845
7)
Ma
les
(n=
726
7)
All
(n
=1
572
4)
Fem
ale
s
(n=
119
40
)
Ma
les
(n=
105
74
) A
ll (
n=
2251
4)
Sco
re
Sco
re
P
R
TS
P
R
TS
P
R
TS
P
R
TS
P
R
TS
P
R
TS
P
R
TS
P
R
TS
P
R
TS
3
0.0
0
0
.5
4.5
0
.3
2.7
0
.4
3.7
0
.2
-8.6
0
.4
-6.6
0
.3
-7.6
0
.3
-3.5
0
.4
-2.9
0
.3
-3.2
4
8.3
3
0
.7
8.9
0
.5
7.3
0
.6
8.2
0
.3
-3.2
0
.6
-1.3
0
.4
-2.3
0
.5
1.6
0
.6
2.1
0
.5
1.8
5
16.6
7
1
.2
13.4
0
.8
11.9
1
.0
12.7
0
.7
2.2
0
.8
3.9
0
.7
3.0
0
.9
6.6
0
.8
7.1
0
.8
6.8
6
25.0
0
1
.9
17.8
1
.5
16.5
1
.7
17.2
1
.2
7.6
1
.4
9.2
1
.3
8.4
1
.4
11.6
1
.4
12.0
1
.4
11.8
7
33.3
3
3
.5
22.3
2
.8
21.1
3
.1
21.7
1
.8
13.0
2
.0
14.4
1
.9
13.7
2
.3
16.6
2
.2
17.0
2
.3
16.8
8
41.6
7
4
.7
26.7
4
.2
25.7
4
.4
26.3
2
.7
18.4
2
.8
19.7
2
.7
19.0
3
.3
21.6
3
.2
22.0
3
.2
21.8
9
50.0
0
7
.7
31.2
7
.3
30.4
7
.6
30.8
4
.1
23.8
4
.2
24.9
4
.1
24.3
5
.1
26.6
5
.2
27.0
5
.1
26.8
10
5
8.3
3
1
1.5
3
5.6
1
1.1
3
5.0
1
1.3
3
5.3
5
.9
29.2
6
.1
30.2
6
.0
29.7
7
.6
31.6
7
.7
32.0
7
.6
31.8
11
6
6.6
7
1
6.7
4
0.0
1
7.1
3
9.6
1
6.9
3
9.8
9
.2
34.6
9
.7
35.4
9
.5
35.0
1
1.4
3
6.6
1
2.0
3
7.0
1
1.7
3
6.8
12
7
5.0
0
2
6.7
4
4.5
2
6.7
4
4.2
2
6.7
4
4.3
1
6.0
4
0.0
1
6.9
4
0.7
1
6.4
4
0.3
1
9.1
4
1.6
1
9.9
4
2.0
1
9.5
4
1.8
13
8
3.3
3
4
0.2
4
8.9
4
0.5
4
8.8
4
0.4
4
8.9
2
6.9
4
5.4
2
8.4
4
5.9
2
7.6
4
5.7
3
0.8
4
6.6
3
2.2
4
6.9
3
1.4
4
6.8
14
9
1.6
7
6
0.6
5
3.4
6
0.2
5
3.4
6
0.4
5
3.4
4
5.7
5
0.8
4
9.6
5
1.2
4
7.5
5
1.0
5
0.0
5
1.6
5
2.9
5
1.9
5
1.4
5
1.8
15
1
00
.00
100
.0
57.8
1
00
.0
58.0
1
00
.0
57.9
1
00
.0
56.2
1
00
.0
56.5
1
00
.0
56.3
1
00
.0
56.6
1
00
.0
56.9
1
00
.0
56.8
Tabl
e A2-
9:E
urop
ean
refe
renc
e po
pula
tion
(13
coun
trie
s). I
ndiv
idua
l nor
m d
ata
for
KID
SCR
EE
N-5
2: S
ocia
l Acc
epta
nce
Not
e: C
alcu
latio
n of
sco
res
was
rest
ricte
d to
com
plet
e ca
ses.
PR =
per
cent
ile; T
S =
T-sc
ore
for t
he p
artic
ular
(sub
-)po
pula
tion
(M =
50,
SD
= 1
0).

Appendix A2
178
C
hil
dren
8-1
1
Ad
ole
scen
ts 1
2-1
8
Ch
ild
ren
& A
do
lesc
en
ts 8
-18
Ra
w-
0-1
00
F
em
ale
s
(n=
333
4)
Ma
les
(n=
317
4)
All
(n
=6
508
) F
em
ale
s
(n=
844
9)
Ma
les
(n=
723
9)
All
(n
=1
568
8)
Fem
ale
s
(n=
117
83
)
Ma
les
(n=
104
13
) A
ll (
n=
2219
6)
Sco
re
Sco
re
P
R
TS
P
R
TS
P
R
TS
P
R
TS
P
R
TS
P
R
TS
P
R
TS
P
R
TS
P
R
TS
3
0.0
0
2
.4
24.9
2
.8
25.8
2
.6
25.3
1
.5
22.6
1
.4
21.2
1
.4
22.0
1
.8
23.3
1
.8
22.8
1
.8
23.1
4
8.3
3
3
.8
27.9
4
.6
28.7
4
.2
28.3
2
.8
25.8
2
.2
24.5
2
.5
25.2
3
.1
26.4
2
.9
26.0
3
.0
26.2
5
16.6
7
6
.6
30.9
7
.7
31.7
7
.1
31.3
4
.7
29.0
4
.0
27.8
4
.4
28.4
5
.2
29.6
5
.2
29.1
5
.2
29.4
6
25.0
0
1
0.9
3
3.9
1
2.4
3
4.6
1
1.6
3
4.3
8
.6
32.2
7
.7
31.0
8
.2
31.7
9
.3
32.7
9
.2
32.3
9
.2
32.5
7
33.3
3
1
5.9
3
6.9
1
7.0
3
7.6
1
6.4
3
7.2
1
2.4
3
5.4
1
1.4
3
4.3
1
1.9
3
4.9
1
3.4
3
5.8
1
3.1
3
5.4
1
3.3
3
5.6
8
41.6
7
2
0.7
3
9.9
2
1.5
4
0.5
2
1.1
4
0.2
1
7.5
3
8.6
1
5.3
3
7.5
1
6.5
3
8.1
1
8.4
3
9.0
1
7.2
3
8.6
1
7.8
3
8.8
9
50.0
0
2
9.0
4
2.9
2
9.0
4
3.4
2
9.0
4
3.2
2
5.7
4
1.7
2
3.1
4
0.8
2
4.5
4
1.3
2
6.6
4
2.1
2
4.9
4
1.7
2
5.8
4
1.9
10
5
8.3
3
3
4.8
4
5.9
3
6.3
4
6.4
3
5.6
4
6.1
3
2.8
4
4.9
2
9.5
4
4.1
3
1.3
4
4.5
3
3.4
4
5.2
3
1.6
4
4.8
3
2.6
4
5.0
11
6
6.6
7
4
3.3
4
8.9
4
5.0
4
9.3
4
4.2
4
9.1
4
0.8
4
8.1
3
7.6
4
7.3
3
9.3
4
7.8
4
1.5
4
8.4
3
9.9
4
8.0
4
0.7
4
8.2
12
7
5.0
0
5
4.5
5
1.9
5
6.7
5
2.3
5
5.6
5
2.1
5
4.0
5
1.3
5
0.7
5
0.6
5
2.5
5
1.0
5
4.1
5
1.5
5
2.5
5
1.1
5
3.4
5
1.3
13
8
3.3
3
6
4.1
5
4.9
6
6.6
5
5.2
6
5.3
5
5.0
6
4.4
5
4.5
6
1.3
5
3.8
6
3.0
5
4.2
6
4.3
5
4.6
6
2.9
5
4.3
6
3.7
5
4.5
14
9
1.6
7
7
6.5
5
7.9
7
7.6
5
8.2
7
7.0
5
8.0
7
6.1
5
7.7
7
3.3
5
7.1
7
4.8
5
7.4
7
6.2
5
7.7
7
4.6
5
7.4
7
5.4
5
7.6
15
1
00
.00
100
.0
60.9
1
00
.0
61.1
1
00
.0
61.0
1
00
.0
60.9
1
00
.0
60.4
1
00
.0
60.6
1
00
.0
60.9
1
00
.0
60.5
1
00
.0
60.7
Tabl
e A2-
10:
Eur
opea
n re
fere
nce
popu
latio
n (1
3 co
untr
ies)
. Ind
ivid
ual n
orm
dat
a fo
rK
IDSC
RE
EN
-52:
Fin
anci
al R
esou
rces
Not
e: C
alcu
latio
n of
sco
res
was
rest
ricte
d to
com
plet
e ca
ses.
PR =
per
cent
ile; T
S =
T-sc
ore
for t
he p
artic
ular
(sub
-)po
pula
tion
(M =
50,
SD
= 1
0).

Provision of European Norm Data for Children and Adolescents for Individual Diagnostic Use
179
C
hil
dren
8-1
1
Ad
ole
scen
ts 1
2-1
8
Ch
ild
ren
& A
do
lesc
en
ts 8
-18
Ra
w-
0-1
00
F
em
ale
s
(n=
342
1)
Ma
les
(n=
326
3)
All
(n
=6
684
) F
em
ale
s
(n=
836
8)
Ma
les
(n=
721
6)
All
(n
=1
558
4)
Fem
ale
s
(n=
117
89
)
Ma
les
(n=
104
79
) A
ll (
n=
2226
8)
Sco
re
Sco
re
P
R
TS
P
R
TS
P
R
TS
P
R
TS
P
R
TS
P
R
TS
P
R
TS
P
R
TS
P
R
TS
5
0.0
0
0
.1
17.4
0
.1
12.0
0
.1
15.6
0
.1
16.0
0
.0
10.6
0
.1
14.0
6
5.5
6
0
.1
10.2
0
.2
8.4
0
.1
9.5
0
.4
20.3
0
.3
15.0
0
.4
18.5
0
.3
18.8
0
.3
13.6
0
.3
16.9
7
11.1
1
0
.2
13.4
0
.3
11.6
0
.3
12.7
1
.0
23.1
0
.6
18.0
0
.8
21.4
0
.7
21.7
0
.5
16.6
0
.7
19.8
8
16.6
7
0
.4
16.6
0
.7
14.9
0
.6
15.9
2
.1
26.0
1
.1
21.0
1
.6
24.2
1
.6
24.5
1
.0
19.6
1
.3
22.7
9
22.2
2
1
.1
19.8
1
.0
18.1
1
.0
19.0
3
.5
28.9
1
.9
24.0
2
.8
27.1
2
.8
27.4
1
.6
22.7
2
.2
25.6
10
2
7.7
8
1
.7
23.0
1
.6
21.3
1
.7
22.2
5
.9
31.8
3
.0
27.0
4
.6
30.0
4
.7
30.2
2
.6
25.7
3
.7
28.4
11
3
3.3
3
2
.6
26.2
2
.6
24.5
2
.6
25.4
9
.2
34.6
4
.7
30.0
7
.1
32.9
7
.3
33.1
4
.0
28.7
5
.8
31.3
12
3
8.8
9
4
.4
29.4
3
.8
27.7
4
.2
28.6
1
3.9
3
7.5
7
.3
33.0
1
0.9
3
5.7
1
1.2
3
5.9
6
.2
31.7
8
.8
34.2
13
4
4.4
4
7
.3
32.6
6
.1
31.0
6
.7
31.8
2
0.4
4
0.4
1
1.2
3
5.9
1
6.1
3
8.6
1
6.6
3
8.8
9
.6
34.7
1
3.3
3
7.1
14
5
0.0
0
1
1.4
3
5.8
9
.5
34.2
1
0.5
3
5.0
2
8.7
4
3.3
1
6.7
3
8.9
2
3.2
4
1.5
2
3.7
4
1.6
1
4.5
3
7.7
1
9.4
4
0.0
15
5
5.5
6
1
6.8
3
9.0
1
3.7
3
7.4
1
5.3
3
8.2
3
8.8
4
6.2
2
3.6
4
1.9
3
1.7
4
4.4
3
2.4
4
4.5
2
0.5
4
0.7
2
6.8
4
2.9
16
6
1.1
1
2
4.8
4
2.2
2
0.4
4
0.6
2
2.7
4
1.4
5
0.1
4
9.0
3
2.9
4
4.9
4
2.2
4
7.2
4
2.8
4
7.3
2
9.0
4
3.7
3
6.3
4
5.7
17
6
6.6
7
3
4.4
4
5.4
2
7.7
4
3.8
3
1.2
4
4.6
6
0.6
5
1.9
4
3.6
4
7.9
5
2.7
5
0.1
5
3.0
5
0.2
3
8.7
4
6.8
4
6.3
4
8.6
18
7
2.2
2
4
6.1
4
8.6
3
7.3
4
7.0
4
1.8
4
7.8
7
1.2
5
4.8
5
5.3
5
0.9
6
3.8
5
3.0
6
3.9
5
3.0
4
9.7
4
9.8
5
7.2
5
1.5
19
7
7.7
8
5
8.3
5
1.8
4
9.6
5
0.3
5
4.1
5
1.0
8
0.6
5
7.7
6
7.7
5
3.9
7
4.6
5
5.8
7
4.1
5
5.8
6
2.1
5
2.8
6
8.5
5
4.4
20
8
3.3
3
7
1.3
5
4.9
6
4.6
5
3.5
6
8.0
5
4.2
8
8.4
6
0.6
7
8.1
5
6.9
8
3.6
5
8.7
8
3.4
5
8.7
7
3.9
5
5.8
7
8.9
5
7.3
21
8
8.8
9
8
2.0
5
8.1
7
8.5
5
6.7
8
0.3
5
7.4
9
4.2
6
3.4
8
7.3
5
9.9
9
1.0
6
1.6
9
0.7
6
1.5
8
4.5
5
8.8
8
7.8
6
0.2
22
9
4.4
4
9
1.8
6
1.3
9
0.4
5
9.9
9
1.1
6
0.6
9
8.0
6
6.3
9
4.7
6
2.9
9
6.4
6
4.5
9
6.2
6
4.4
9
3.4
6
1.8
9
4.9
6
3.0
23
1
00
.00
100
.0
64.5
1
00
.0
63.1
1
00
.0
63.8
1
00
.0
69.2
1
00
.0
65.9
1
00
.0
67.3
1
00
.0
67.2
1
00
.0
64.8
1
00
.0
65.9
Tabl
e A2-
11:
Eur
opea
n re
fere
nce
popu
latio
n (1
3 co
untr
ies)
. Ind
ivid
ual n
orm
dat
a fo
rK
IDSC
RE
EN
-27:
Phy
sica
l Wel
l-bei
ng
Not
e: C
alcu
latio
n of
sco
res
was
rest
ricte
d to
com
plet
e ca
ses.
PR =
per
cent
ile; T
S =
T-sc
ore
for t
he p
artic
ular
(sub
-)po
pula
tion
(M =
50,
SD
= 1
0).
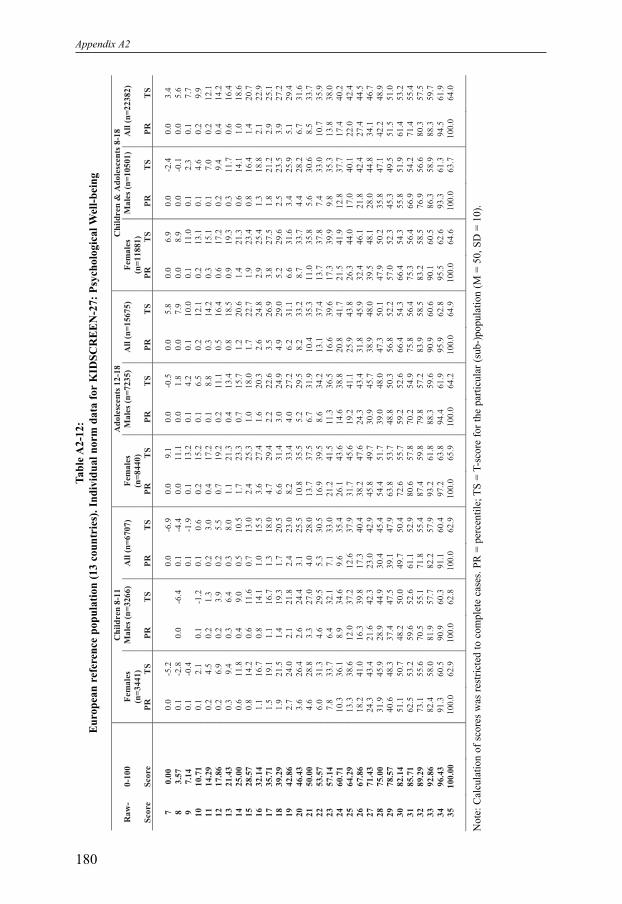
Appendix A2
180
C
hil
dren
8-1
1
Ad
ole
scen
ts 1
2-1
8
Ch
ild
ren
& A
do
lesc
en
ts 8
-18
Ra
w-
0-1
00
F
em
ale
s
(n=
344
1)
Ma
les
(n=
326
6)
All
(n
=6
707
) F
em
ale
s
(n=
844
0)
Ma
les
(n=
723
5)
All
(n
=1
567
5)
Fem
ale
s
(n=
118
81
)
Ma
les
(n=
105
01
) A
ll (
n=
2238
2)
Sco
re
Sco
re
P
R
TS
P
R
TS
P
R
TS
P
R
TS
P
R
TS
P
R
TS
P
R
TS
P
R
TS
P
R
TS
7
0.0
0
0
.0
-5.2
0
.0
-6.9
0
.0
9.1
0
.0
-0.5
0
.0
5.8
0
.0
6.9
0
.0
-2.4
0
.0
3.4
8
3.5
7
0
.1
-2.8
0
.0
-6.4
0
.1
-4.4
0
.0
11.1
0
.0
1.8
0
.0
7.9
0
.0
8.9
0
.0
-0.1
0
.0
5.6
9
7.1
4
0
.1
-0.4
0
.1
-1.9
0
.1
13.2
0
.1
4.2
0
.1
10.0
0
.1
11.0
0
.1
2.3
0
.1
7.7
10
1
0.7
1
0
.1
2.1
0
.1
-1.2
0
.1
0.6
0
.2
15.2
0
.1
6.5
0
.2
12.1
0
.2
13.1
0
.1
4.6
0
.2
9.9
11
1
4.2
9
0
.2
4.5
0
.2
1.3
0
.2
3.0
0
.4
17.2
0
.1
8.8
0
.3
14.2
0
.3
15.1
0
.1
7.0
0
.2
12.1
12
1
7.8
6
0
.2
6.9
0
.2
3.9
0
.2
5.5
0
.7
19.2
0
.2
11.1
0
.5
16.4
0
.6
17.2
0
.2
9.4
0
.4
14.2
13
2
1.4
3
0
.3
9.4
0
.3
6.4
0
.3
8.0
1
.1
21.3
0
.4
13.4
0
.8
18.5
0
.9
19.3
0
.3
11.7
0
.6
16.4
14
2
5.0
0
0
.6
11.8
0
.4
9.0
0
.5
10.5
1
.7
23.3
0
.7
15.7
1
.2
20.6
1
.4
21.3
0
.6
14.1
1
.0
18.6
15
2
8.5
7
0
.8
14.2
0
.6
11.6
0
.7
13.0
2
.4
25.3
1
.0
18.0
1
.7
22.7
1
.9
23.4
0
.8
16.4
1
.4
20.7
16
3
2.1
4
1
.1
16.7
0
.8
14.1
1
.0
15.5
3
.6
27.4
1
.6
20.3
2
.6
24.8
2
.9
25.4
1
.3
18.8
2
.1
22.9
17
3
5.7
1
1
.5
19.1
1
.1
16.7
1
.3
18.0
4
.7
29.4
2
.2
22.6
3
.5
26.9
3
.8
27.5
1
.8
21.2
2
.9
25.1
18
3
9.2
9
1
.9
21.5
1
.4
19.3
1
.7
20.5
6
.6
31.4
3
.0
24.9
4
.9
29.0
5
.2
29.6
2
.5
23.5
3
.9
27.2
19
4
2.8
6
2
.7
24.0
2
.1
21.8
2
.4
23.0
8
.2
33.4
4
.0
27.2
6
.2
31.1
6
.6
31.6
3
.4
25.9
5
.1
29.4
20
4
6.4
3
3
.6
26.4
2
.6
24.4
3
.1
25.5
1
0.8
3
5.5
5
.2
29.5
8
.2
33.2
8
.7
33.7
4
.4
28.2
6
.7
31.6
21
5
0.0
0
4
.6
28.8
3
.3
27.0
4
.0
28.0
1
3.7
3
7.5
6
.7
31.9
1
0.4
3
5.3
1
1.0
3
5.8
5
.6
30.6
8
.5
33.7
22
5
3.5
7
6
.0
31.3
4
.6
29.5
5
.3
30.5
1
6.9
3
9.5
8
.6
34.2
1
3.1
3
7.4
1
3.7
3
7.8
7
.4
33.0
1
0.7
3
5.9
23
5
7.1
4
7
.8
33.7
6
.4
32.1
7
.1
33.0
2
1.2
4
1.5
1
1.3
3
6.5
1
6.6
3
9.6
1
7.3
3
9.9
9
.8
35.3
1
3.8
3
8.0
24
6
0.7
1
1
0.3
3
6.1
8
.9
34.6
9
.6
35.4
2
6.1
4
3.6
1
4.6
3
8.8
2
0.8
4
1.7
2
1.5
4
1.9
1
2.8
3
7.7
1
7.4
4
0.2
25
6
4.2
9
1
3.3
3
8.6
1
2.0
3
7.2
1
2.6
3
7.9
3
1.7
4
5.6
1
9.2
4
1.1
2
5.9
4
3.8
2
6.3
4
4.0
1
7.0
4
0.1
2
2.0
4
2.4
26
6
7.8
6
1
8.2
4
1.0
1
6.3
3
9.8
1
7.3
4
0.4
3
8.2
4
7.6
2
4.3
4
3.4
3
1.8
4
5.9
3
2.4
4
6.1
2
1.8
4
2.4
2
7.4
4
4.5
27
7
1.4
3
2
4.3
4
3.4
2
1.6
4
2.3
2
3.0
4
2.9
4
5.8
4
9.7
3
0.9
4
5.7
3
8.9
4
8.0
3
9.5
4
8.1
2
8.0
4
4.8
3
4.1
4
6.7
28
7
5.0
0
3
1.9
4
5.9
2
8.9
4
4.9
3
0.4
4
5.4
5
4.4
5
1.7
3
9.0
4
8.0
4
7.3
5
0.1
4
7.9
5
0.2
3
5.8
4
7.1
4
2.2
4
8.9
29
7
8.5
7
4
0.6
4
8.3
3
7.4
4
7.5
3
9.1
4
7.9
6
3.8
5
3.7
4
8.8
5
0.3
5
6.8
5
2.2
5
7.0
5
2.3
4
5.3
4
9.5
5
1.5
5
1.0
30
8
2.1
4
5
1.1
5
0.7
4
8.2
5
0.0
4
9.7
5
0.4
7
2.6
5
5.7
5
9.2
5
2.6
6
6.4
5
4.3
6
6.4
5
4.3
5
5.8
5
1.9
6
1.4
5
3.2
31
8
5.7
1
6
2.5
5
3.2
5
9.6
5
2.6
6
1.1
5
2.9
8
0.6
5
7.8
7
0.2
5
4.9
7
5.8
5
6.4
7
5.3
5
6.4
6
6.9
5
4.2
7
1.4
5
5.4
32
8
9.2
9
7
3.1
5
5.6
7
0.5
5
5.1
7
1.8
5
5.4
8
7.4
5
9.8
7
9.8
5
7.2
8
3.9
5
8.5
8
3.2
5
8.5
7
6.9
5
6.6
8
0.3
5
7.5
33
9
2.8
6
8
2.4
5
8.0
8
1.9
5
7.7
8
2.2
5
7.9
9
3.2
6
1.8
8
8.3
5
9.6
9
0.9
6
0.6
9
0.1
6
0.5
8
6.3
5
8.9
8
8.3
5
9.7
34
9
6.4
3
9
1.3
6
0.5
9
0.9
6
0.3
9
1.1
6
0.4
9
7.2
6
3.8
9
4.4
6
1.9
9
5.9
6
2.8
9
5.5
6
2.6
9
3.3
6
1.3
9
4.5
6
1.9
35
1
00
.00
100
.0
62.9
1
00
.0
62.8
1
00
.0
62.9
1
00
.0
65.9
1
00
.0
64.2
1
00
.0
64.9
1
00
.0
64.6
1
00
.0
63.7
1
00
.0
64.0
Tabl
e A2-
12:
Eur
opea
n re
fere
nce
popu
latio
n (1
3 co
untr
ies)
. Ind
ivid
ual n
orm
dat
a fo
rK
IDSC
RE
EN
-27:
Psy
chol
ogic
al W
ell-b
eing
Not
e: C
alcu
latio
n of
sco
res
was
rest
ricte
d to
com
plet
e ca
ses.
PR =
per
cent
ile; T
S =
T-sc
ore
for t
he p
artic
ular
(sub
-)po
pula
tion
(M =
50,
SD
= 1
0).
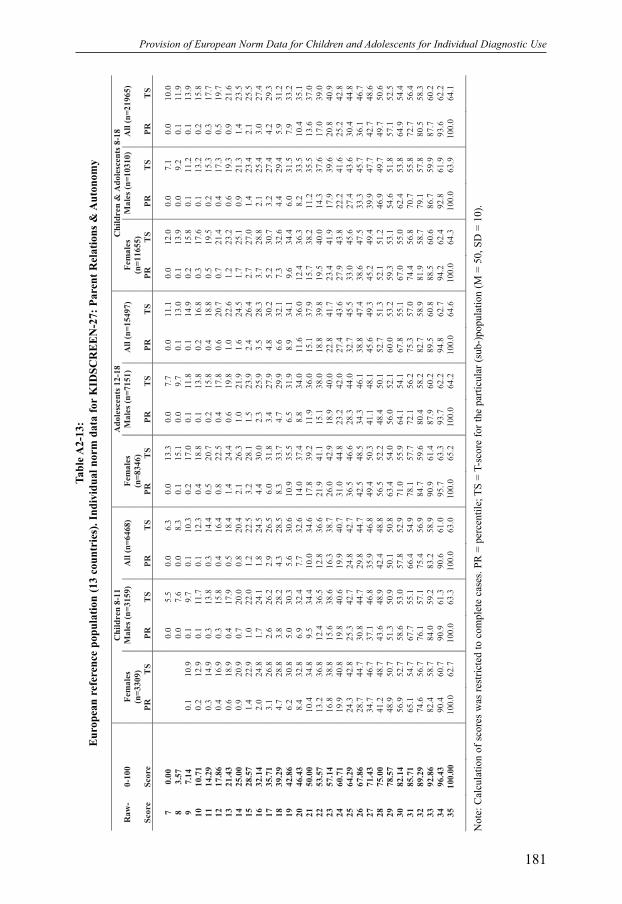
Provision of European Norm Data for Children and Adolescents for Individual Diagnostic Use
181
C
hil
dren
8-1
1
Ad
ole
scen
ts 1
2-1
8
Ch
ild
ren
& A
do
lesc
en
ts 8
-18
Ra
w-
0-1
00
F
em
ale
s
(n=
330
9)
Ma
les
(n=
315
9)
All
(n
=6
468
) F
em
ale
s
(n=
834
6)
Ma
les
(n=
715
1)
All
(n
=1
549
7)
Fem
ale
s
(n=
116
55
)
Ma
les
(n=
103
10
) A
ll (
n=
2196
5)
Sco
re
Sco
re
P
R
TS
P
R
TS
P
R
TS
P
R
TS
P
R
TS
P
R
TS
P
R
TS
P
R
TS
P
R
TS
7
0.0
0
0
.0
5.5
0
.0
6.3
0
.0
13.3
0
.0
7.7
0
.0
11.1
0
.0
12.0
0
.0
7.1
0
.0
10.0
8
3.5
7
0
.0
7.6
0
.0
8.3
0
.1
15.1
0
.0
9.7
0
.1
13.0
0
.1
13.9
0
.0
9.2
0
.1
11.9
9
7.1
4
0
.1
10.9
0
.1
9.7
0
.1
10.3
0
.2
17.0
0
.1
11.8
0
.1
14.9
0
.2
15.8
0
.1
11.2
0
.1
13.9
10
1
0.7
1
0
.2
12.9
0
.1
11.7
0
.1
12.3
0
.4
18.8
0
.1
13.8
0
.2
16.8
0
.3
17.6
0
.1
13.2
0
.2
15.8
11
1
4.2
9
0
.3
14.9
0
.3
13.8
0
.3
14.4
0
.5
20.7
0
.2
15.8
0
.4
18.8
0
.5
19.5
0
.2
15.3
0
.3
17.7
12
1
7.8
6
0
.4
16.9
0
.3
15.8
0
.4
16.4
0
.8
22.5
0
.4
17.8
0
.6
20.7
0
.7
21.4
0
.4
17.3
0
.5
19.7
13
2
1.4
3
0
.6
18.9
0
.4
17.9
0
.5
18.4
1
.4
24.4
0
.6
19.8
1
.0
22.6
1
.2
23.2
0
.6
19.3
0
.9
21.6
14
2
5.0
0
0
.9
20.9
0
.7
20.0
0
.8
20.4
2
.1
26.3
1
.0
21.9
1
.6
24.5
1
.7
25.1
0
.9
21.3
1
.4
23.5
15
2
8.5
7
1
.4
22.9
1
.0
22.0
1
.2
22.5
3
.2
28.1
1
.5
23.9
2
.4
26.4
2
.7
27.0
1
.4
23.4
2
.1
25.5
16
3
2.1
4
2
.0
24.8
1
.7
24.1
1
.8
24.5
4
.4
30.0
2
.3
25.9
3
.5
28.3
3
.7
28.8
2
.1
25.4
3
.0
27.4
17
3
5.7
1
3
.1
26.8
2
.6
26.2
2
.9
26.5
6
.0
31.8
3
.4
27.9
4
.8
30.2
5
.2
30.7
3
.2
27.4
4
.2
29.3
18
3
9.2
9
4
.7
28.8
3
.8
28.2
4
.3
28.5
8
.3
33.7
4
.7
29.9
6
.6
32.1
7
.3
32.6
4
.4
29.4
5
.9
31.2
19
4
2.8
6
6
.2
30.8
5
.0
30.3
5
.6
30.6
1
0.9
3
5.5
6
.5
31.9
8
.9
34.1
9
.6
34.4
6
.0
31.5
7
.9
33.2
20
4
6.4
3
8
.4
32.8
6
.9
32.4
7
.7
32.6
1
4.0
3
7.4
8
.8
34.0
1
1.6
3
6.0
1
2.4
3
6.3
8
.2
33.5
1
0.4
3
5.1
21
5
0.0
0
1
0.4
3
4.8
9
.5
34.4
1
0.0
3
4.6
1
7.8
3
9.2
1
1.9
3
6.0
1
5.1
3
7.9
1
5.7
3
8.2
1
1.2
3
5.5
1
3.6
3
7.0
22
5
3.5
7
1
3.2
3
6.8
1
2.4
3
6.5
1
2.8
3
6.6
2
1.9
4
1.1
1
5.1
3
8.0
1
8.8
3
9.8
1
9.5
4
0.0
1
4.3
3
7.6
1
7.0
3
9.0
23
5
7.1
4
1
6.8
3
8.8
1
5.6
3
8.6
1
6.3
3
8.7
2
6.0
4
2.9
1
8.9
4
0.0
2
2.8
4
1.7
2
3.4
4
1.9
1
7.9
3
9.6
2
0.8
4
0.9
24
6
0.7
1
1
9.9
4
0.8
1
9.8
4
0.6
1
9.9
4
0.7
3
1.0
4
4.8
2
3.2
4
2.0
2
7.4
4
3.6
2
7.9
4
3.8
2
2.2
4
1.6
2
5.2
4
2.8
25
6
4.2
9
2
4.3
4
2.8
2
5.3
4
2.7
2
4.8
4
2.7
3
6.5
4
6.6
2
8.3
4
4.0
3
2.7
4
5.5
3
3.0
4
5.6
2
7.4
4
3.6
3
0.4
4
4.8
26
6
7.8
6
2
8.7
4
4.7
3
0.8
4
4.7
2
9.8
4
4.7
4
2.5
4
8.5
3
4.3
4
6.1
3
8.8
4
7.4
3
8.6
4
7.5
3
3.3
4
5.7
3
6.1
4
6.7
27
7
1.4
3
3
4.7
4
6.7
3
7.1
4
6.8
3
5.9
4
6.8
4
9.4
5
0.3
4
1.1
4
8.1
4
5.6
4
9.3
4
5.2
4
9.4
3
9.9
4
7.7
4
2.7
4
8.6
28
7
5.0
0
4
1.2
4
8.7
4
3.6
4
8.9
4
2.4
4
8.8
5
6.5
5
2.2
4
8.4
5
0.1
5
2.7
5
1.3
5
2.1
5
1.2
4
6.9
4
9.7
4
9.7
5
0.6
29
7
8.5
7
4
8.9
5
0.7
5
1.3
5
0.9
5
0.1
5
0.8
6
3.4
5
4.0
5
6.0
5
2.1
6
0.0
5
3.2
5
9.3
5
3.1
5
4.6
5
1.8
5
7.1
5
2.5
30
8
2.1
4
5
6.9
5
2.7
5
8.6
5
3.0
5
7.8
5
2.9
7
1.0
5
5.9
6
4.1
5
4.1
6
7.8
5
5.1
6
7.0
5
5.0
6
2.4
5
3.8
6
4.9
5
4.4
31
8
5.7
1
6
5.1
5
4.7
6
7.7
5
5.1
6
6.4
5
4.9
7
8.1
5
7.7
7
2.1
5
6.2
7
5.3
5
7.0
7
4.4
5
6.8
7
0.7
5
5.8
7
2.7
5
6.4
32
8
9.2
9
7
4.6
5
6.7
7
6.1
5
7.1
7
5.4
5
6.9
8
4.7
5
9.6
8
0.4
5
8.2
8
2.7
5
8.9
8
1.9
5
8.7
7
9.1
5
7.8
8
0.5
5
8.3
33
9
2.8
6
8
2.4
5
8.7
8
4.0
5
9.2
8
3.2
5
8.9
9
0.9
6
1.4
8
7.9
6
0.2
8
9.5
6
0.8
8
8.5
6
0.6
8
6.7
5
9.9
8
7.7
6
0.2
34
9
6.4
3
9
0.4
6
0.7
9
0.9
6
1.3
9
0.6
6
1.0
9
5.7
6
3.3
9
3.7
6
2.2
9
4.8
6
2.7
9
4.2
6
2.4
9
2.8
6
1.9
9
3.6
6
2.2
35
1
00
.00
100
.0
62.7
1
00
.0
63.3
1
00
.0
63.0
1
00
.0
65.2
1
00
.0
64.2
1
00
.0
64.6
1
00
.0
64.3
1
00
.0
63.9
1
00
.0
64.1
Tabl
e A2-
13:
Eur
opea
n re
fere
nce
popu
latio
n (1
3 co
untr
ies)
. Ind
ivid
ual n
orm
dat
a fo
rK
IDSC
RE
EN
-27:
Par
ent R
elat
ions
& A
uton
omy
Not
e: C
alcu
latio
n of
sco
res
was
rest
ricte
d to
com
plet
e ca
ses.
PR =
per
cent
ile; T
S =
T-sc
ore
for t
he p
artic
ular
(sub
-)po
pula
tion
(M =
50,
SD
= 1
0).
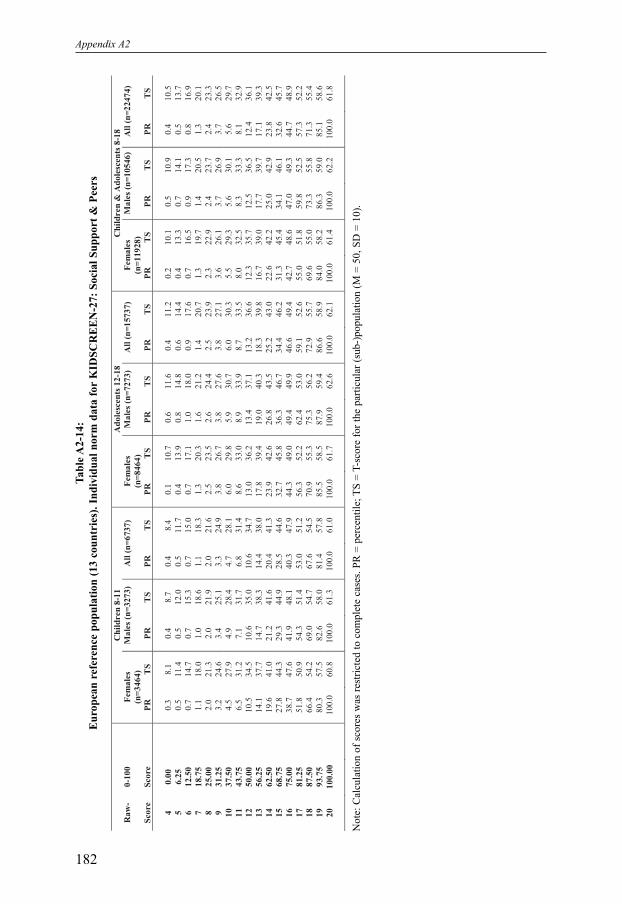
Appendix A2
182
C
hil
dren
8-1
1
Ad
ole
scen
ts 1
2-1
8
Ch
ild
ren
& A
do
lesc
en
ts 8
-18
Ra
w-
0-1
00
F
em
ale
s
(n=
346
4)
Ma
les
(n=
327
3)
All
(n
=6
737
) F
em
ale
s
(n=
846
4)
Ma
les
(n=
727
3)
All
(n
=1
573
7)
Fem
ale
s
(n=
119
28
)
Ma
les
(n=
105
46
) A
ll (
n=
2247
4)
Sco
re
Sco
re
P
R
TS
P
R
TS
P
R
TS
P
R
TS
P
R
TS
P
R
TS
P
R
TS
P
R
TS
P
R
TS
4
0.0
0
0
.3
8.1
0
.4
8.7
0
.4
8.4
0
.1
10.7
0
.6
11.6
0
.4
11.2
0
.2
10.1
0
.5
10.9
0
.4
10.5
5
6.2
5
0
.5
11.4
0
.5
12.0
0
.5
11.7
0
.4
13.9
0
.8
14.8
0
.6
14.4
0
.4
13.3
0
.7
14.1
0
.5
13.7
6
12.5
0
0
.7
14.7
0
.7
15.3
0
.7
15.0
0
.7
17.1
1
.0
18.0
0
.9
17.6
0
.7
16.5
0
.9
17.3
0
.8
16.9
7
18.7
5
1
.1
18.0
1
.0
18.6
1
.1
18.3
1
.3
20.3
1
.6
21.2
1
.4
20.7
1
.3
19.7
1
.4
20.5
1
.3
20.1
8
25.0
0
2
.0
21.3
2
.0
21.9
2
.0
21.6
2
.5
23.5
2
.6
24.4
2
.5
23.9
2
.3
22.9
2
.4
23.7
2
.4
23.3
9
31.2
5
3
.2
24.6
3
.4
25.1
3
.3
24.9
3
.8
26.7
3
.8
27.6
3
.8
27.1
3
.6
26.1
3
.7
26.9
3
.7
26.5
10
3
7.5
0
4
.5
27.9
4
.9
28.4
4
.7
28.1
6
.0
29.8
5
.9
30.7
6
.0
30.3
5
.5
29.3
5
.6
30.1
5
.6
29.7
11
4
3.7
5
6
.5
31.2
7
.1
31.7
6
.8
31.4
8
.6
33.0
8
.9
33.9
8
.7
33.5
8
.0
32.5
8
.3
33.3
8
.1
32.9
12
5
0.0
0
1
0.5
3
4.5
1
0.6
3
5.0
1
0.6
3
4.7
1
3.0
3
6.2
1
3.4
3
7.1
1
3.2
3
6.6
1
2.3
3
5.7
1
2.5
3
6.5
1
2.4
3
6.1
13
5
6.2
5
1
4.1
3
7.7
1
4.7
3
8.3
1
4.4
3
8.0
1
7.8
3
9.4
1
9.0
4
0.3
1
8.3
3
9.8
1
6.7
3
9.0
1
7.7
3
9.7
1
7.1
3
9.3
14
6
2.5
0
1
9.6
4
1.0
2
1.2
4
1.6
2
0.4
4
1.3
2
3.9
4
2.6
2
6.8
4
3.5
2
5.2
4
3.0
2
2.6
4
2.2
2
5.0
4
2.9
2
3.8
4
2.5
15
6
8.7
5
2
7.8
4
4.3
2
9.3
4
4.9
2
8.5
4
4.6
3
2.7
4
5.8
3
6.3
4
6.7
3
4.4
4
6.2
3
1.3
4
5.4
3
4.1
4
6.1
3
2.6
4
5.7
16
7
5.0
0
3
8.7
4
7.6
4
1.9
4
8.1
4
0.3
4
7.9
4
4.3
4
9.0
4
9.4
4
9.9
4
6.6
4
9.4
4
2.7
4
8.6
4
7.0
4
9.3
4
4.7
4
8.9
17
8
1.2
5
5
1.8
5
0.9
5
4.3
5
1.4
5
3.0
5
1.2
5
6.3
5
2.2
6
2.4
5
3.0
5
9.1
5
2.6
5
5.0
5
1.8
5
9.8
5
2.5
5
7.3
5
2.2
18
8
7.5
0
6
6.4
5
4.2
6
9.0
5
4.7
6
7.6
5
4.5
7
0.9
5
5.3
7
5.3
5
6.2
7
2.9
5
5.7
6
9.6
5
5.0
7
3.3
5
5.8
7
1.3
5
5.4
19
9
3.7
5
8
0.3
5
7.5
8
2.6
5
8.0
8
1.4
5
7.8
8
5.5
5
8.5
8
7.9
5
9.4
8
6.6
5
8.9
8
4.0
5
8.2
8
6.3
5
9.0
8
5.1
5
8.6
20
1
00
.00
100
.0
60.8
1
00
.0
61.3
1
00
.0
61.0
1
00
.0
61.7
1
00
.0
62.6
1
00
.0
62.1
1
00
.0
61.4
1
00
.0
62.2
1
00
.0
61.8
Tabl
e A2-
14:
Eur
opea
n re
fere
nce
popu
latio
n (1
3 co
untr
ies)
. Ind
ivid
ual n
orm
dat
a fo
rK
IDSC
RE
EN
-27:
Soc
ial S
uppo
rt &
Pee
rs
Not
e: C
alcu
latio
n of
sco
res
was
rest
ricte
d to
com
plet
e ca
ses.
PR =
per
cent
ile; T
S =
T-sc
ore
for t
he p
artic
ular
(sub
-)po
pula
tion
(M =
50,
SD
= 1
0).

Provision of European Norm Data for Children and Adolescents for Individual Diagnostic Use
183
C
hil
dren
8-1
1
Ad
ole
scen
ts 1
2-1
8
Ch
ild
ren
& A
do
lesc
en
ts 8
-18
Ra
w-
0-1
00
F
em
ale
s
(n=
346
0)
Ma
les
(n=
328
7)
All
(n
=6
747
) F
em
ale
s
(n=
840
0)
Ma
les
(n=
720
8)
All
(n
=1
560
8)
Fem
ale
s
(n=
118
60
)
Ma
les
(n=
104
95
) A
ll (
n=
2235
5)
Sco
re
Sco
re
P
R
TS
P
R
TS
P
R
TS
P
R
TS
P
R
TS
P
R
TS
P
R
TS
P
R
TS
P
R
TS
4
0.0
0
0
.2
6.6
0
.1
12.7
0
.2
10.0
0
.2
16.0
0
.4
18.0
0
.3
16.9
0
.2
14.9
0
.3
17.0
0
.2
15.9
5
6.2
5
0
.2
10.1
0
.2
15.9
0
.2
13.3
0
.5
19.2
0
.9
21.0
0
.7
20.1
0
.4
18.1
0
.7
20.0
0
.5
19.0
6
12.5
0
0
.4
13.5
0
.6
19.0
0
.5
16.6
1
.1
22.4
1
.7
24.1
1
.4
23.2
0
.9
21.2
1
.4
23.0
1
.1
22.1
7
18.7
5
0
.6
17.0
1
.3
22.2
1
.0
19.9
2
.3
25.6
3
.1
27.1
2
.7
26.4
1
.8
24.4
2
.6
26.1
2
.1
25.2
8
25.0
0
1
.2
20.5
2
.4
25.3
1
.8
23.2
4
.1
28.9
5
.4
30.2
4
.7
29.5
3
.2
27.5
4
.4
29.1
3
.8
28.3
9
31.2
5
2
.1
23.9
4
.2
28.5
3
.2
26.4
6
.5
32.1
7
.9
33.3
7
.1
32.7
5
.2
30.7
6
.7
32.1
5
.9
31.4
10
3
7.5
0
3
.5
27.4
7
.1
31.6
5
.2
29.7
1
0.5
3
5.3
1
1.8
3
6.3
1
1.1
3
5.8
8
.5
33.8
1
0.3
3
5.2
9
.3
34.5
11
4
3.7
5
6
.3
30.9
1
0.4
3
4.8
8
.3
33.0
1
6.1
3
8.5
1
7.4
3
9.4
1
6.7
3
8.9
1
3.3
3
7.0
1
5.2
3
8.2
1
4.2
3
7.6
12
5
0.0
0
1
0.1
3
4.3
1
6.0
3
7.9
1
3.0
3
6.3
2
4.4
4
1.8
2
5.5
4
2.4
2
5.0
4
2.1
2
0.3
4
0.1
2
2.5
4
1.2
2
1.3
4
0.7
13
5
6.2
5
1
5.2
3
7.8
2
2.3
4
1.1
1
8.7
3
9.5
3
4.1
4
5.0
3
4.9
4
5.5
3
4.5
4
5.2
2
8.6
4
3.3
3
1.0
4
4.3
2
9.7
4
3.8
14
6
2.5
0
2
2.4
4
1.2
3
0.0
4
4.2
2
6.1
4
2.8
4
5.5
4
8.2
4
6.3
4
8.6
4
5.9
4
8.4
3
8.8
4
6.4
4
1.2
4
7.3
3
9.9
4
6.8
15
6
8.7
5
3
1.4
4
4.7
3
9.4
4
7.4
3
5.3
4
6.1
5
8.4
5
1.4
5
8.6
5
1.6
5
8.5
5
1.5
5
0.5
4
9.6
5
2.6
5
0.3
5
1.5
4
9.9
16
7
5.0
0
4
3.2
4
8.2
5
2.8
5
0.5
4
7.8
4
9.4
7
2.3
5
4.7
7
2.5
5
4.7
7
2.4
5
4.7
6
3.8
5
2.7
6
6.3
5
3.4
6
5.0
5
3.0
17
8
1.2
5
5
5.9
5
1.6
6
5.8
5
3.7
6
0.7
5
2.7
8
2.5
5
7.9
8
2.0
5
7.8
8
2.3
5
7.8
7
4.7
5
5.9
7
6.9
5
6.4
7
5.8
5
6.1
18
8
7.5
0
7
0.5
5
5.1
7
7.1
5
6.8
7
3.8
5
5.9
9
0.2
6
1.1
8
9.6
6
0.8
8
9.9
6
1.0
8
4.5
5
9.0
8
5.7
5
9.4
8
5.0
5
9.2
19
9
3.7
5
8
3.6
5
8.6
8
7.3
6
0.0
8
5.4
5
9.2
9
6.0
6
4.3
9
5.2
6
3.9
9
5.6
6
4.1
9
2.4
6
2.2
9
2.7
6
2.4
9
2.5
6
2.3
20
1
00
.00
100
.0
62.0
1
00
.0
63.1
1
00
.0
62.5
1
00
.0
67.6
1
00
.0
66.9
1
00
.0
67.3
1
00
.0
65.4
1
00
.0
65.5
1
00
.0
65.4
Tabl
e A2-
15:
Eur
opea
n re
fere
nce
popu
latio
n (1
3 co
untr
ies)
. Ind
ivid
ual n
orm
dat
a fo
rK
IDSC
RE
EN
-27:
Sch
ool E
nvir
onm
ent
Not
e: C
alcu
latio
n of
sco
res
was
rest
ricte
d to
com
plet
e ca
ses.
PR =
per
cent
ile; T
S =
T-sc
ore
for t
he p
artic
ular
(sub
-)po
pula
tion
(M =
50,
SD
= 1
0).

Appendix A2
184
C
hil
dre
n 8
-11
A
do
lesc
ents
12
-18
C
hil
dre
n &
Ad
ole
scen
ts 8
-18
Ra
w-
0-1
00
F
ema
les
(n=
336
4)
Ma
les
(n=
317
6)
All
(n
=6
540
) F
ema
les
(n=
823
5)
Ma
les
(n=
704
4)
All
(n
=1
527
9)
Fem
ale
s
(n=
115
99
)
Ma
les
(n=
102
20
) A
ll (
n=
2181
9)
Sco
re
Sco
re
P
R
TS
P
R
TS
P
R
TS
P
R
TS
P
R
TS
P
R
TS
P
R
TS
P
R
TS
P
R
TS
10
0
.00
11
2
.50
12
5
.00
0.0
8
.0
0.0
5
.4
0.0
6
.7
0.0
3
.8
13
7
.50
0.0
9
.6
0.0
7
.1
0.0
8
.3
0.0
5
.5
14
1
0.0
0
0
.0
11.3
0
.0
4.3
0
.0
8.8
0
.0
9.9
0
.0
2.9
0
.0
7.2
15
1
2.5
0
0
.1
12.9
0
.0
6.0
0
.0
10.5
0
.0
11.5
0
.0
4.6
0
.0
8.9
16
1
5.0
0
0
.0
2.5
0
.0
1.6
0
.1
14.5
0
.0
7.8
0
.0
12.1
0
.1
13.1
0
.0
6.4
0
.0
10.5
17
1
7.5
0
0
.0
4.3
0
.0
3.4
0
.1
16.2
0
.1
9.6
0
.1
13.8
0
.1
14.8
0
.0
8.2
0
.1
12.2
18
2
0.0
0
0
.1
6.2
0
.1
4.4
0
.1
5.3
0
.2
17.8
0
.1
11.4
0
.1
15.5
0
.2
16.4
0
.1
10.0
0
.1
13.9
19
2
2.5
0
0
.1
8.0
0
.1
6.3
0
.1
7.2
0
.3
19.4
0
.1
13.2
0
.2
17.2
0
.3
18.0
0
.1
11.8
0
.2
15.6
20
2
5.0
0
0
.2
9.8
0
.2
8.2
0
.2
9.0
0
.6
21.1
0
.2
14.9
0
.4
18.8
0
.4
19.6
0
.1
13.6
0
.3
17.2
21
2
7.5
0
0
.2
11.7
0
.2
10.1
0
.2
10.9
0
.8
22.7
0
.3
16.7
0
.6
20.5
0
.6
21.2
0
.3
15.4
0
.5
18.9
22
3
0.0
0
0
.3
13.5
0
.3
12.0
0
.3
12.8
1
.3
24.3
0
.4
18.5
0
.9
22.2
1
.0
22.8
0
.4
17.2
0
.7
20.6
23
3
2.5
0
0
.4
15.4
0
.4
13.9
0
.4
14.7
1
.7
26.0
0
.7
20.3
1
.3
23.9
1
.4
24.4
0
.6
19.0
1
.0
22.3
24
3
5.0
0
0
.6
17.2
0
.4
15.8
0
.5
16.6
2
.5
27.6
1
.0
22.1
1
.8
25.5
1
.9
26.0
0
.9
20.7
1
.4
23.9
25
3
7.5
0
0
.6
19.1
0
.7
17.7
0
.6
18.4
3
.5
29.3
1
.5
23.9
2
.6
27.2
2
.6
27.6
1
.2
22.5
2
.0
25.6
26
4
0.0
0
1
.1
20.9
0
.8
19.7
1
.0
20.3
4
.6
30.9
2
.2
25.6
3
.5
28.9
3
.6
29.3
1
.8
24.3
2
.7
27.3
27
4
2.5
0
1
.3
22.8
1
.1
21.6
1
.2
22.2
6
.1
32.5
3
.0
27.4
4
.6
30.6
4
.7
30.9
2
.4
26.1
3
.6
29.0
28
4
5.0
0
1
.6
24.6
1
.7
23.5
1
.7
24.1
8
.0
34.2
3
.8
29.2
6
.0
32.2
6
.1
32.5
3
.1
27.9
4
.7
30.6
29
4
7.5
0
2
.5
26.4
2
.1
25.4
2
.4
25.9
1
0.3
3
5.8
4
.9
31.0
7
.8
33.9
8
.0
34.1
4
.0
29.7
6
.2
32.3
30
5
0.0
0
3
.6
28.3
2
.9
27.3
3
.3
27.8
1
3.0
3
7.4
6
.4
32.8
1
0.0
3
5.6
1
0.3
3
5.7
5
.3
31.5
8
.0
34.0
31
5
2.5
0
5
.0
30.1
4
.0
29.2
4
.5
29.7
1
6.2
3
9.1
8
.5
34.5
1
2.7
3
7.3
1
3.0
3
7.3
7
.1
33.3
1
0.2
3
5.7
32
5
5.0
0
6
.2
32.0
5
.1
31.1
5
.7
31.6
2
0.3
4
0.7
1
1.0
3
6.3
1
6.1
3
8.9
1
6.2
3
8.9
9
.2
35.0
1
2.9
3
7.3
33
5
7.5
0
7
.8
33.8
7
.0
33.0
7
.4
33.4
2
4.1
4
2.3
1
3.9
3
8.1
1
9.4
4
0.6
1
9.4
4
0.5
1
1.8
3
6.8
1
5.8
3
9.0
34
6
0.0
0
1
0.6
3
5.7
8
.7
34.9
9
.7
35.3
2
8.6
4
4.0
1
7.4
3
9.9
2
3.4
4
2.3
2
3.4
4
2.2
1
4.7
3
8.6
1
9.3
4
0.7
35
6
2.5
0
1
3.7
3
7.5
1
1.7
3
6.9
1
2.7
3
7.2
3
3.7
4
5.6
2
1.9
4
1.7
2
8.3
4
4.0
2
7.9
4
3.8
1
8.7
4
0.4
2
3.6
4
2.4
36
6
5.0
0
1
6.7
3
9.4
1
5.2
3
8.8
1
6.0
3
9.1
3
9.8
4
7.2
2
6.7
4
3.5
3
3.7
4
5.6
3
3.1
4
5.4
2
3.1
4
2.2
2
8.4
4
4.0
37
6
7.5
0
2
0.5
4
1.2
1
9.5
4
0.7
2
0.0
4
1.0
4
5.3
4
8.9
3
2.1
4
5.2
3
9.2
4
7.3
3
8.1
4
7.0
2
8.2
4
4.0
3
3.4
4
5.7
38
7
0.0
0
2
4.8
4
3.0
2
4.5
4
2.6
2
4.6
4
2.8
5
1.9
5
0.5
3
8.0
4
7.0
4
5.5
4
9.0
4
4.1
4
8.6
3
3.8
4
5.8
3
9.2
4
7.4
39
7
2.5
0
2
9.5
4
4.9
2
9.6
4
4.5
2
9.6
4
4.7
5
8.1
5
2.2
4
4.4
4
8.8
5
1.8
5
0.7
4
9.8
5
0.2
3
9.8
4
7.6
4
5.1
4
9.0
40
7
5.0
0
3
5.4
4
6.7
3
5.0
4
6.4
3
5.2
4
6.6
6
4.4
5
3.8
5
1.7
5
0.6
5
8.5
5
2.3
5
6.0
5
1.8
4
6.5
4
9.4
5
1.5
5
0.7
41
7
7.5
0
4
2.5
4
8.6
4
2.7
4
8.3
4
2.6
4
8.5
7
1.4
5
5.4
5
9.6
5
2.4
6
5.9
5
4.0
6
3.0
5
3.4
5
4.3
5
1.1
5
8.9
5
2.4
42
8
0.0
0
4
9.4
5
0.4
4
9.3
5
0.2
4
9.3
5
0.3
7
7.1
5
7.1
6
6.8
5
4.1
7
2.3
5
5.7
6
9.1
5
5.0
6
1.3
5
2.9
6
5.4
5
4.1
43
8
2.5
0
5
7.3
5
2.3
5
6.8
5
2.1
5
7.0
5
2.2
8
2.4
5
8.7
7
2.9
5
5.9
7
8.0
5
7.4
7
5.1
5
6.7
6
7.9
5
4.7
7
1.7
5
5.7
44
8
5.0
0
6
5.1
5
4.1
6
5.2
5
4.1
6
5.1
5
4.1
8
6.9
6
0.3
7
9.6
5
7.7
8
3.5
5
9.0
8
0.6
5
8.3
7
5.1
5
6.5
7
8.0
5
7.4
45
8
7.5
0
7
1.9
5
6.0
7
3.0
5
6.0
7
2.4
5
6.0
9
0.9
6
2.0
8
5.1
5
9.5
8
8.2
6
0.7
8
5.4
5
9.9
8
1.3
5
8.3
8
3.5
5
9.1
46
9
0.0
0
7
9.5
5
7.8
8
0.1
5
7.9
7
9.8
5
7.8
9
3.8
6
3.6
9
0.0
6
1.3
9
2.0
6
2.4
8
9.6
6
1.5
8
6.9
6
0.1
8
8.4
6
0.8
47
9
2.5
0
8
6.0
5
9.6
8
6.4
5
9.8
8
6.2
5
9.7
9
6.2
6
5.2
9
3.4
6
3.1
9
4.9
6
4.1
9
3.2
6
3.1
9
1.3
6
1.9
9
2.3
6
2.4
48
9
5.0
0
9
1.7
6
1.5
9
1.7
6
1.7
9
1.7
6
1.6
9
8.2
6
6.9
9
6.5
6
4.8
9
7.5
6
5.7
9
6.3
6
4.7
9
5.0
6
3.7
9
5.7
6
4.1
49
9
7.5
0
9
6.0
6
3.3
9
5.8
6
3.6
9
5.9
6
3.5
9
9.4
6
8.5
9
8.5
6
6.6
9
9.0
6
7.4
9
8.4
6
6.3
9
7.6
6
5.5
9
8.0
6
5.8
50
1
00
.00
100
.0
65.2
1
00
.0
65.5
1
00
.0
65.3
1
00
.0
70.1
1
00
.0
68.4
1
00
.0
69.1
1
00
.0
67.9
1
00
.0
67.2
1
00
.0
67.5
Tabl
e A2-
16:
Eur
opea
n re
fere
nce
popu
latio
n (1
3 co
untr
ies)
. Ind
ivid
ual n
orm
dat
a fo
rK
IDSC
RE
EN
-10
Inde
x
Not
e: C
alcu
latio
n of
sco
res
was
rest
ricte
d to
com
plet
e ca
ses.
PR =
per
cent
ile; T
S =
T-sc
ore
for t
he p
artic
ular
(sub
-)po
pula
tion
(M =
50,
SD
= 1
0).

Provision of European Norm Proxy Data for Individual Diagnostic Use
185
KIDSCREEN Health Related Quality ofLife Questionnaires
Appendix A3:Provision of European Norm Proxy Data for Individual Diagnostic Use
Table A3-1: European reference population (11 countries). Individual norm data for KIDSCREEN-52 PROXY: Physical Well-being ......................187
Table A3-2: European reference population (11 countries). Individual norm data for KIDSCREEN-52 PROXY: Psychological Well-being ............188
Table A3-3: European reference population (11 countries). Individual norm data for KIDSCREEN-52 PROXY: Moods & Emotions ......................189
Table A3-4: European reference population (11 countries). Individual norm data for KIDSCREEN-52 PROXY: Self-Perception..............................190
Table A3-5: European reference population (11 countries). Individual norm data for KIDSCREEN-52 PROXY: Autonomy......................................191
Table A3-6: European reference population (11 countries). Individual norm data for KIDSCREEN-52 PROXY: Parent Relations & Home Life ....192
Table A3-7: European reference population (11 countries). Individual norm data for KIDSCREEN-52 PROXY: Social Support & Peers ................193
Table A3-8: European reference population (11 countries). Individual norm data for KIDSCREEN-52 PROXY: School Environment ....................194
Table A3-9: European reference population (11 countries). Individual norm data for KIDSCREEN-52 PROXY: Social Acceptance ........................195
Table A3-10: European reference population (11 countries). Individual norm data for KIDSCREEN-52 PROXY: Financial Resources ......................196
Table A3-11: European reference population (11 countries). Individual norm data for KIDSCREEN-27 PROXY: Physical Well-being ......................197
Table A3-12: European reference population (11 countries). Individual norm data for KIDSCREEN-27 PROXY: Psychological Well-being ............198
Table A3-13: European reference population (11 countries). Individual norm data for KIDSCREEN-27 PROXY: Parent Relations & Autonomy......199
Table A3-14: European reference population (11 countries). Individual norm data for KIDSCREEN-27 PROXY: Social Support & Peers ................200
Table A3-15: European reference population (11 countries). Individual norm data for KIDSCREEN-27 PROXY: School Environment ....................201
Table A3-16: European reference population (11 countries). Individual norm data for KIDSCREEN-10-PROXY Index ..............................................202

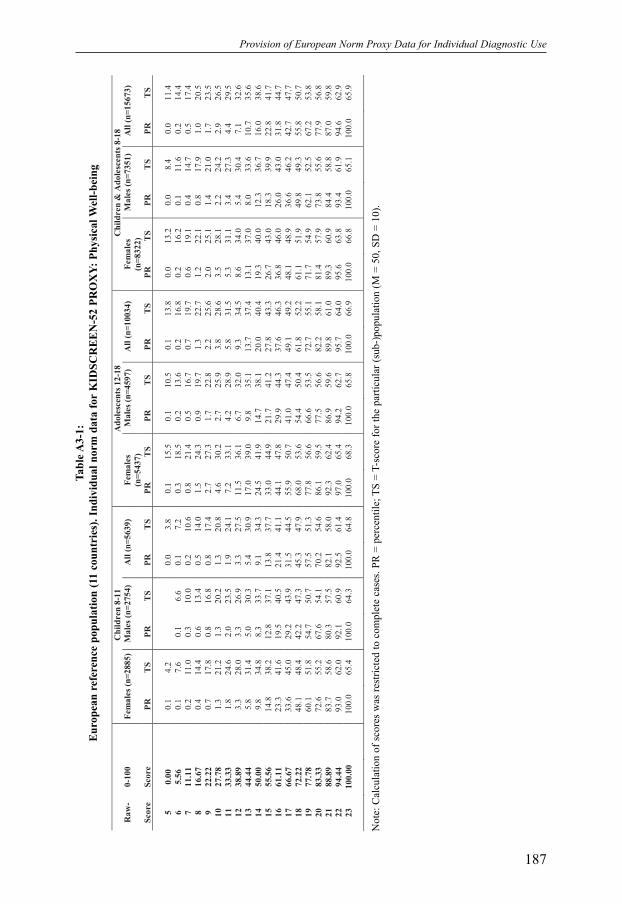
Provision of European Norm Proxy Data for Individual Diagnostic Use
187
C
hil
dren
8-1
1
Ad
ole
scen
ts 1
2-1
8
Ch
ild
ren
& A
do
lesc
en
ts 8
-18
Ra
w-
0-1
00
F
em
ale
s (n
=288
5)
Ma
les
(n=
275
4)
All
(n
=5
639
) F
em
ale
s
(n=
543
7)
Ma
les
(n=
459
7)
All
(n
=1
003
4)
Fem
ale
s
(n=
832
2)
Ma
les
(n=
735
1)
All
(n
=1
567
3)
Sco
re
Sco
re
P
R
TS
P
R
TS
P
R
TS
P
R
TS
P
R
TS
P
R
TS
P
R
TS
P
R
TS
P
R
TS
5
0.0
0
0
.1
4.2
0
.0
3.8
0
.1
15.5
0
.1
10.5
0
.1
13.8
0
.0
13.2
0
.0
8.4
0
.0
11.4
6
5.5
6
0
.1
7.6
0
.1
6.6
0
.1
7.2
0
.3
18.5
0
.2
13.6
0
.2
16.8
0
.2
16.2
0
.1
11.6
0
.2
14.4
7
11.1
1
0
.2
11.0
0
.3
10.0
0
.2
10.6
0
.8
21.4
0
.5
16.7
0
.7
19.7
0
.6
19.1
0
.4
14.7
0
.5
17.4
8
16.6
7
0
.4
14.4
0
.6
13.4
0
.5
14.0
1
.5
24.3
0
.9
19.7
1
.3
22.7
1
.2
22.1
0
.8
17.9
1
.0
20.5
9
22.2
2
0
.7
17.8
0
.8
16.8
0
.8
17.4
2
.7
27.3
1
.7
22.8
2
.2
25.6
2
.0
25.1
1
.4
21.0
1
.7
23.5
10
2
7.7
8
1
.3
21.2
1
.3
20.2
1
.3
20.8
4
.6
30.2
2
.7
25.9
3
.8
28.6
3
.5
28.1
2
.2
24.2
2
.9
26.5
11
3
3.3
3
1
.8
24.6
2
.0
23.5
1
.9
24.1
7
.2
33.1
4
.2
28.9
5
.8
31.5
5
.3
31.1
3
.4
27.3
4
.4
29.5
12
3
8.8
9
3
.3
28.0
3
.3
26.9
3
.3
27.5
1
1.5
3
6.1
6
.7
32.0
9
.3
34.5
8
.6
34.0
5
.4
30.4
7
.1
32.6
13
4
4.4
4
5
.8
31.4
5
.0
30.3
5
.4
30.9
1
7.0
3
9.0
9
.8
35.1
1
3.7
3
7.4
1
3.1
3
7.0
8
.0
33.6
1
0.7
3
5.6
14
5
0.0
0
9
.8
34.8
8
.3
33.7
9
.1
34.3
2
4.5
4
1.9
1
4.7
3
8.1
2
0.0
4
0.4
1
9.3
4
0.0
1
2.3
3
6.7
1
6.0
3
8.6
15
5
5.5
6
1
4.8
3
8.2
1
2.8
3
7.1
1
3.8
3
7.7
3
3.0
4
4.9
2
1.7
4
1.2
2
7.8
4
3.3
2
6.7
4
3.0
1
8.3
3
9.9
2
2.8
4
1.7
16
6
1.1
1
2
3.3
4
1.6
1
9.5
4
0.5
2
1.4
4
1.1
4
4.1
4
7.8
2
9.9
4
4.3
3
7.6
4
6.3
3
6.8
4
6.0
2
6.0
4
3.0
3
1.8
4
4.7
17
6
6.6
7
3
3.6
4
5.0
2
9.2
4
3.9
3
1.5
4
4.5
5
5.9
5
0.7
4
1.0
4
7.4
4
9.1
4
9.2
4
8.1
4
8.9
3
6.6
4
6.2
4
2.7
4
7.7
18
7
2.2
2
4
8.1
4
8.4
4
2.2
4
7.3
4
5.3
4
7.9
6
8.0
5
3.6
5
4.4
5
0.4
6
1.8
5
2.2
6
1.1
5
1.9
4
9.8
4
9.3
5
5.8
5
0.7
19
7
7.7
8
6
0.1
5
1.8
5
4.7
5
0.7
5
7.5
5
1.3
7
7.8
5
6.6
6
6.6
5
3.5
7
2.7
5
5.1
7
1.7
5
4.9
6
2.1
5
2.5
6
7.2
5
3.8
20
8
3.3
3
7
2.6
5
5.2
6
7.6
5
4.1
7
0.2
5
4.6
8
6.1
5
9.5
7
7.5
5
6.6
8
2.2
5
8.1
8
1.4
5
7.9
7
3.8
5
5.6
7
7.9
5
6.8
21
8
8.8
9
8
3.7
5
8.6
8
0.3
5
7.5
8
2.1
5
8.0
9
2.3
6
2.4
8
6.9
5
9.6
8
9.8
6
1.0
8
9.3
6
0.9
8
4.4
5
8.8
8
7.0
5
9.8
22
9
4.4
4
9
3.0
6
2.0
9
2.1
6
0.9
9
2.5
6
1.4
9
7.0
6
5.4
9
4.2
6
2.7
9
5.7
6
4.0
9
5.6
6
3.8
9
3.4
6
1.9
9
4.6
6
2.9
23
1
00
.00
100
.0
65.4
1
00
.0
64.3
1
00
.0
64.8
1
00
.0
68.3
1
00
.0
65.8
1
00
.0
66.9
1
00
.0
66.8
1
00
.0
65.1
1
00
.0
65.9
Tabl
e A3-
1:
Eur
opea
n re
fere
nce
popu
latio
n (1
1 co
untr
ies)
. Ind
ivid
ual n
orm
dat
a fo
rK
IDSC
RE
EN
-52
PRO
XY:
Phy
sica
l Wel
l-bei
ng
Not
e: C
alcu
latio
n of
sco
res
was
rest
ricte
d to
com
plet
e ca
ses.
PR =
per
cent
ile; T
S =
T-sc
ore
for t
he p
artic
ular
(sub
-)po
pula
tion
(M =
50,
SD
= 1
0).
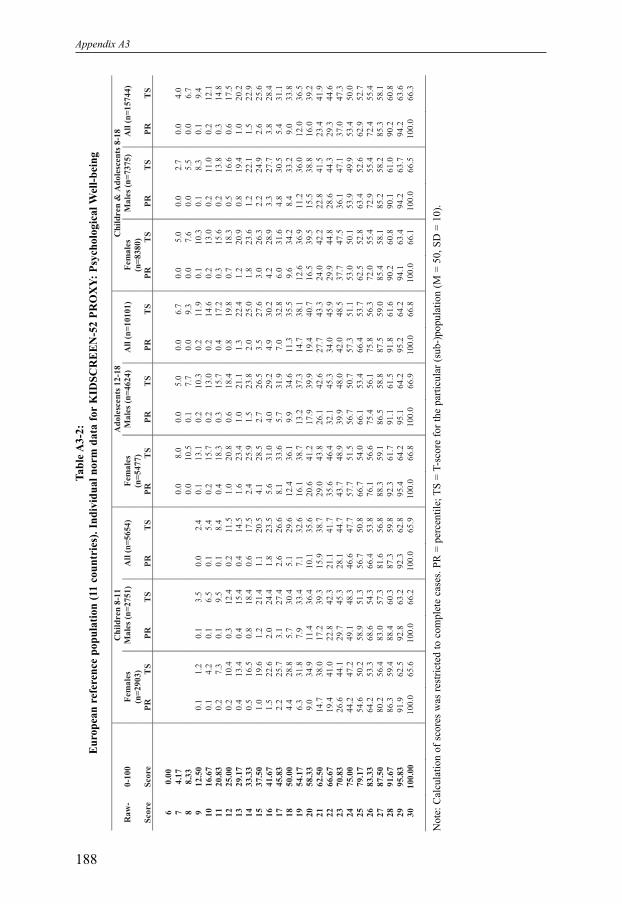
Appendix A3
188
C
hil
dren
8-1
1
Ad
ole
scen
ts 1
2-1
8
Ch
ild
ren
& A
do
lesc
en
ts 8
-18
Ra
w-
0-1
00
F
em
ale
s
(n=
290
3)
Ma
les
(n=
275
1)
All
(n
=5
654
) F
em
ale
s
(n=
547
7)
Ma
les
(n=
462
4)
All
(n
=1
010
1)
Fem
ale
s
(n=
838
0)
Ma
les
(n=
737
5)
All
(n
=1
574
4)
Sco
re
Sco
re
P
R
TS
P
R
TS
P
R
TS
P
R
TS
P
R
TS
P
R
TS
P
R
TS
P
R
TS
P
R
TS
6
0.0
0
7
4.1
7
0
.0
8.0
0
.0
5.0
0
.0
6.7
0
.0
5.0
0
.0
2.7
0
.0
4.0
8
8.3
3
0
.0
10.5
0
.1
7.7
0
.0
9.3
0
.0
7.6
0
.0
5.5
0
.0
6.7
9
12.5
0
0
.1
1.2
0
.1
3.5
0
.0
2.4
0
.1
13.1
0
.2
10.3
0
.2
11.9
0
.1
10.3
0
.1
8.3
0
.1
9.4
10
1
6.6
7
0
.1
4.2
0
.1
6.5
0
.1
5.4
0
.2
15.7
0
.2
13.0
0
.2
14.6
0
.2
13.0
0
.2
11.0
0
.2
12.1
11
2
0.8
3
0
.2
7.3
0
.1
9.5
0
.1
8.4
0
.4
18.3
0
.3
15.7
0
.4
17.2
0
.3
15.6
0
.2
13.8
0
.3
14.8
12
2
5.0
0
0
.2
10.4
0
.3
12.4
0
.2
11.5
1
.0
20.8
0
.6
18.4
0
.8
19.8
0
.7
18.3
0
.5
16.6
0
.6
17.5
13
2
9.1
7
0
.4
13.4
0
.4
15.4
0
.4
14.5
1
.6
23.4
1
.0
21.1
1
.3
22.4
1
.2
20.9
0
.8
19.4
1
.0
20.2
14
3
3.3
3
0
.5
16.5
0
.8
18.4
0
.6
17.5
2
.4
25.9
1
.5
23.8
2
.0
25.0
1
.8
23.6
1
.2
22.1
1
.5
22.9
15
3
7.5
0
1
.0
19.6
1
.2
21.4
1
.1
20.5
4
.1
28.5
2
.7
26.5
3
.5
27.6
3
.0
26.3
2
.2
24.9
2
.6
25.6
16
4
1.6
7
1
.5
22.6
2
.0
24.4
1
.8
23.5
5
.6
31.0
4
.0
29.2
4
.9
30.2
4
.2
28.9
3
.3
27.7
3
.8
28.4
17
4
5.8
3
2
.2
25.7
3
.1
27.4
2
.6
26.6
8
.1
33.6
5
.7
31.9
7
.0
32.8
6
.0
31.6
4
.8
30.5
5
.4
31.1
18
5
0.0
0
4
.4
28.8
5
.7
30.4
5
.1
29.6
1
2.4
3
6.1
9
.9
34.6
1
1.3
3
5.5
9
.6
34.2
8
.4
33.2
9
.0
33.8
19
5
4.1
7
6
.3
31.8
7
.9
33.4
7
.1
32.6
1
6.1
3
8.7
1
3.2
3
7.3
1
4.7
3
8.1
1
2.6
3
6.9
1
1.2
3
6.0
1
2.0
3
6.5
20
5
8.3
3
9
.0
34.9
1
1.4
3
6.4
1
0.1
3
5.6
2
0.6
4
1.2
1
7.9
3
9.9
1
9.4
4
0.7
1
6.5
3
9.5
1
5.5
3
8.8
1
6.0
3
9.2
21
6
2.5
0
1
4.7
3
8.0
1
7.2
3
9.3
1
5.9
3
8.7
2
9.0
4
3.8
2
6.1
4
2.6
2
7.7
4
3.3
2
4.0
4
2.2
2
2.8
4
1.5
2
3.4
4
1.9
22
6
6.6
7
1
9.4
4
1.0
2
2.8
4
2.3
2
1.1
4
1.7
3
5.6
4
6.4
3
2.1
4
5.3
3
4.0
4
5.9
2
9.9
4
4.8
2
8.6
4
4.3
2
9.3
4
4.6
23
7
0.8
3
2
6.6
4
4.1
2
9.7
4
5.3
2
8.1
4
4.7
4
3.7
4
8.9
3
9.9
4
8.0
4
2.0
4
8.5
3
7.7
4
7.5
3
6.1
4
7.1
3
7.0
4
7.3
24
7
5.0
0
4
4.2
4
7.2
4
9.1
4
8.3
4
6.6
4
7.7
5
7.7
5
1.5
5
6.7
5
0.7
5
7.3
5
1.1
5
3.0
5
0.1
5
3.9
4
9.9
5
3.4
5
0.0
25
7
9.1
7
5
4.6
5
0.2
5
8.9
5
1.3
5
6.7
5
0.8
6
6.7
5
4.0
6
6.1
5
3.4
6
6.4
5
3.7
6
2.5
5
2.8
6
3.4
5
2.6
6
2.9
5
2.7
26
8
3.3
3
6
4.2
5
3.3
6
8.6
5
4.3
6
6.4
5
3.8
7
6.1
5
6.6
7
5.4
5
6.1
7
5.8
5
6.3
7
2.0
5
5.4
7
2.9
5
5.4
7
2.4
5
5.4
27
8
7.5
0
8
0.2
5
6.4
8
3.0
5
7.3
8
1.6
5
6.8
8
8.3
5
9.1
8
6.5
5
8.8
8
7.5
5
9.0
8
5.4
5
8.1
8
5.2
5
8.2
8
5.3
5
8.1
28
9
1.6
7
8
6.3
5
9.4
8
8.4
6
0.3
8
7.3
5
9.8
9
2.3
6
1.7
9
1.1
6
1.5
9
1.8
6
1.6
9
0.2
6
0.8
9
0.1
6
1.0
9
0.2
6
0.8
29
9
5.8
3
9
1.9
6
2.5
9
2.8
6
3.2
9
2.3
6
2.8
9
5.4
6
4.2
9
5.1
6
4.2
9
5.2
6
4.2
9
4.1
6
3.4
9
4.2
6
3.7
9
4.2
6
3.6
30
1
00
.00
100
.0
65.6
1
00
.0
66.2
1
00
.0
65.9
1
00
.0
66.8
1
00
.0
66.9
1
00
.0
66.8
1
00
.0
66.1
1
00
.0
66.5
1
00
.0
66.3
Tabl
e A3-
2:E
urop
ean
refe
renc
e po
pula
tion
(11
coun
trie
s). I
ndiv
idua
l nor
m d
ata
for
KID
SCR
EE
N-5
2 PR
OX
Y: P
sych
olog
ical
Wel
l-bei
ng
Not
e: C
alcu
latio
n of
sco
res
was
rest
ricte
d to
com
plet
e ca
ses.
PR =
per
cent
ile; T
S =
T-sc
ore
for t
he p
artic
ular
(sub
-)po
pula
tion
(M =
50,
SD
= 1
0).

Provision of European Norm Proxy Data for Individual Diagnostic Use
189
C
hil
dren
8-1
1
Ad
ole
scen
ts 1
2-1
8
Ch
ild
ren
& A
do
lesc
en
ts 8
-18
Ra
w-
0-1
00
F
em
ale
s
(n=
289
7)
Ma
les
(n=
274
0)
All
(n
=5
637
) F
em
ale
s
(n=
545
6)
Ma
les
(n=
460
7)
All
(n
=1
006
3)
Fem
ale
s
(n=
835
3)
Ma
les
(n=
734
7)
All
(n
=1
570
0)
Sco
re
Sco
re
P
R
TS
P
R
TS
P
R
TS
P
R
TS
P
R
TS
P
R
TS
P
R
TS
P
R
TS
P
R
TS
7
0.0
0
8
3.5
7
9
7.1
4
10
1
0.7
1
0
.1
-8.0
0
.0
-8.9
0
.0
-3.9
0
.0
-2.9
11
1
4.2
9
0
.1
-5.2
0
.0
-6.0
0
.0
-1.2
0
.0
-0.2
12
1
7.8
6
0
.1
-4.1
0
.1
-2.3
0
.0
-3.2
0
.0
3.2
0
.0
4.7
0
.0
3.3
0
.0
1.5
0
.0
2.5
13
2
1.4
3
0
.1
-1.1
0
.1
0.5
0
.0
-0.3
0
.0
8.2
0
.1
5.9
0
.1
7.3
0
.0
5.9
0
.1
4.2
0
.0
5.2
14
2
5.0
0
0
.2
1.8
0
.1
3.4
0
.1
2.6
0
.1
10.8
0
.2
8.5
0
.1
9.9
0
.1
8.6
0
.1
6.9
0
.1
7.8
15
2
8.5
7
0
.2
4.7
0
.2
6.3
0
.2
5.5
0
.3
13.4
0
.3
11.2
0
.3
12.5
0
.3
11.2
0
.2
9.6
0
.3
10.5
16
3
2.1
4
0
.5
7.6
0
.4
9.1
0
.5
8.4
0
.5
16.0
0
.5
13.8
0
.5
15.1
0
.5
13.9
0
.5
12.3
0
.5
13.2
17
3
5.7
1
0
.6
10.5
0
.7
12.0
0
.6
11.2
1
.0
18.5
0
.6
16.4
0
.8
17.7
0
.8
16.5
0
.7
15.0
0
.8
15.8
18
3
9.2
9
1
.0
13.4
0
.9
14.8
0
.9
14.1
1
.5
21.1
1
.1
19.1
1
.3
20.3
1
.3
19.2
1
.0
17.7
1
.2
18.5
19
4
2.8
6
1
.1
16.3
1
.2
17.7
1
.1
17.0
2
.0
23.7
1
.6
21.7
1
.8
22.9
1
.7
21.8
1
.4
20.4
1
.6
21.2
20
4
6.4
3
1
.5
19.3
1
.6
20.5
1
.5
19.9
2
.9
26.3
2
.3
24.4
2
.6
25.5
2
.4
24.4
2
.0
23.1
2
.2
23.9
21
5
0.0
0
2
.3
22.2
2
.5
23.4
2
.4
22.8
4
.0
28.9
3
.4
27.0
3
.7
28.1
3
.4
27.1
3
.1
25.8
3
.2
26.5
22
5
3.5
7
3
.2
25.1
3
.6
26.2
3
.4
25.7
5
.9
31.4
5
.0
29.7
5
.5
30.7
4
.9
29.7
4
.5
28.5
4
.7
29.2
23
5
7.1
4
4
.4
28.0
4
.7
29.1
4
.5
28.5
8
.7
34.0
7
.1
32.3
8
.0
33.3
7
.2
32.4
6
.2
31.2
6
.7
31.9
24
6
0.7
1
5
.7
30.9
6
.9
31.9
6
.3
31.4
1
2.4
3
6.6
9
.5
35.0
1
1.0
3
5.9
1
0.0
3
5.0
8
.5
33.9
9
.3
34.5
25
6
4.2
9
7
.8
33.8
9
.5
34.8
8
.6
34.3
1
6.3
3
9.2
1
3.4
3
7.6
1
5.0
3
8.5
1
3.3
3
7.7
1
2.0
3
6.7
1
2.7
3
7.2
26
6
7.8
6
1
1.1
3
6.8
1
2.5
3
7.6
1
1.8
3
7.2
2
1.8
4
1.8
1
8.0
4
0.2
2
0.1
4
1.1
1
8.1
4
0.3
1
5.9
3
9.4
1
7.1
3
9.9
27
7
1.4
3
1
5.3
3
9.7
1
7.7
4
0.5
1
6.5
4
0.1
2
8.7
4
4.3
2
4.2
4
2.9
2
6.7
4
3.7
2
4.1
4
3.0
2
1.8
4
2.1
2
3.0
4
2.5
28
7
5.0
0
2
2.8
4
2.6
2
5.3
4
3.3
2
4.1
4
3.0
3
8.2
4
6.9
3
2.9
4
5.5
3
5.8
4
6.3
3
2.9
4
5.6
3
0.1
4
4.8
3
1.6
4
5.2
29
7
8.5
7
3
1.2
4
5.5
3
3.2
4
6.2
3
2.2
4
5.8
4
7.5
4
9.5
4
2.6
4
8.2
4
5.3
4
8.9
4
1.8
4
8.2
3
9.1
4
7.5
4
0.6
4
7.9
30
8
2.1
4
4
1.8
4
8.4
4
3.6
4
9.0
4
2.7
4
8.7
5
8.3
5
2.1
5
2.5
5
0.8
5
5.6
5
1.5
5
2.5
5
0.9
4
9.2
5
0.2
5
1.0
5
0.6
31
8
5.7
1
5
4.1
5
1.3
5
6.3
5
1.9
5
5.2
5
1.6
6
8.4
5
4.7
6
3.4
5
3.5
6
6.1
5
4.1
6
3.4
5
3.5
6
0.7
5
2.9
6
2.2
5
3.2
32
8
9.2
9
6
7.9
5
4.3
6
9.9
5
4.7
6
8.9
5
4.5
7
8.9
5
7.2
7
4.9
5
6.1
7
7.1
5
6.7
7
5.1
5
6.2
7
3.0
5
5.6
7
4.1
5
5.9
33
9
2.8
6
8
1.0
5
7.2
8
3.0
5
7.6
8
2.0
5
7.4
8
7.9
5
9.8
8
4.8
5
8.8
8
6.5
5
9.3
8
5.5
5
8.8
8
4.2
5
8.3
8
4.9
5
8.6
34
9
6.4
3
9
2.2
6
0.1
9
2.2
6
0.4
9
2.2
6
0.2
9
4.8
6
2.4
9
2.9
6
1.4
9
3.9
6
1.9
9
3.9
6
1.5
9
2.6
6
1.0
9
3.3
6
1.2
35
1
00
.00
100
.0
63.0
1
00
.0
63.3
1
00
.0
63.1
1
00
.0
65.0
1
00
.0
64.1
1
00
.0
64.5
1
00
.0
64.1
1
00
.0
63.7
1
00
.0
63.9
Tabl
e A3-
3:E
urop
ean
refe
renc
e po
pula
tion
(11
coun
trie
s). I
ndiv
idua
l nor
m d
ata
for
KID
SCR
EE
N-5
2 PR
OX
Y: M
oods
& E
mot
ions
Not
e: C
alcu
latio
n of
sco
res
was
rest
ricte
d to
com
plet
e ca
ses.
PR =
per
cent
ile; T
S =
T-sc
ore
for t
he p
artic
ular
(sub
-)po
pula
tion
(M =
50,
SD
= 1
0).

Appendix A3
190
C
hil
dren
8-1
1
Ad
ole
scen
ts 1
2-1
8
Ch
ild
ren
& A
do
lesc
en
ts 8
-18
Ra
w-
0-1
00
F
em
ale
s
(n=
290
3)
Ma
les
(n=
276
0)
All
(n
=5
663
) F
em
ale
s
(n=
550
3)
Ma
les
(n=
462
7)
All
(n
=1
013
0)
Fem
ale
s
(n=
840
6)
Ma
les
(n=
738
7)
All
(n
=1
579
3)
Sco
re
Sco
re
P
R
TS
P
R
TS
P
R
TS
P
R
TS
P
R
TS
P
R
TS
P
R
TS
P
R
TS
P
R
TS
5
0.0
0
6
5.0
0
0
.0
13.9
0
.0
1.3
0
.0
10.0
0
.0
11.3
0
.0
-1.3
0
.0
7.1
7
10.0
0
0
.3
16.6
0
.1
4.6
0
.2
12.9
0
.2
14.2
0
.0
2.1
0
.1
10.1
8
15.0
0
0
.1
7.5
0
.0
4.1
0
.5
19.4
0
.1
7.9
0
.3
15.8
0
.3
17.0
0
.1
5.5
0
.2
13.1
9
20.0
0
0
.1
10.8
0
.1
2.4
0
.1
7.5
1
.0
22.2
0
.3
11.2
0
.7
18.7
0
.7
19.8
0
.2
8.9
0
.5
16.1
10
2
5.0
0
0
.4
14.1
0
.1
6.1
0
.2
11.0
2
.0
25.0
0
.4
14.5
1
.3
21.6
1
.4
22.6
0
.3
12.3
0
.9
19.1
11
3
0.0
0
0
.6
17.4
0
.1
9.9
0
.4
14.4
3
.5
27.7
0
.7
17.8
2
.2
24.5
2
.5
25.4
0
.5
15.7
1
.5
22.1
12
3
5.0
0
1
.2
20.7
0
.3
13.6
0
.8
17.8
5
.1
30.5
1
.2
21.1
3
.3
27.4
3
.7
28.3
0
.8
19.1
2
.4
25.1
13
4
0.0
0
2
.1
23.9
0
.8
17.3
1
.5
21.3
7
.6
33.3
2
.0
24.5
5
.1
30.3
5
.7
31.1
1
.5
22.5
3
.8
28.0
14
4
5.0
0
3
.5
27.2
1
.8
21.0
2
.7
24.7
1
1.3
3
6.0
3
.3
27.8
7
.6
33.2
8
.6
33.9
2
.7
25.9
5
.8
31.0
15
5
0.0
0
5
.4
30.5
2
.8
24.8
4
.2
28.2
1
6.3
3
8.8
5
.5
31.1
1
1.4
3
6.1
1
2.5
3
6.7
4
.5
29.3
8
.8
34.0
16
5
5.0
0
8
.6
33.8
4
.6
28.5
6
.6
31.6
2
2.7
4
1.6
9
.3
34.4
1
6.6
3
9.0
1
7.8
3
9.6
7
.5
32.7
1
3.0
3
7.0
17
6
0.0
0
1
2.8
3
7.1
7
.1
32.2
1
0.1
3
5.1
3
1.1
4
4.4
1
4.1
3
7.7
2
3.3
4
1.9
2
4.8
4
2.4
1
1.5
3
6.1
1
8.6
4
0.0
18
6
5.0
0
2
0.0
4
0.3
1
2.2
3
6.0
1
6.2
3
8.5
4
1.0
4
7.1
2
1.7
4
1.0
3
2.2
4
4.8
3
3.7
4
5.2
1
8.1
3
9.5
2
6.4
4
3.0
19
7
0.0
0
2
9.0
4
3.6
1
9.3
3
9.7
2
4.3
4
1.9
5
1.2
4
9.9
3
1.9
4
4.4
4
2.4
4
7.7
4
3.5
4
8.0
2
7.2
4
2.9
3
5.9
4
6.0
20
7
5.0
0
4
0.3
4
6.9
2
8.5
4
3.4
3
4.6
4
5.4
6
2.6
5
2.7
4
3.6
4
7.7
5
3.9
5
0.6
5
4.8
5
0.8
3
7.9
4
6.3
4
6.9
4
8.9
21
8
0.0
0
5
2.0
5
0.2
3
9.5
4
7.2
4
6.0
4
8.8
7
3.3
5
5.4
5
6.3
5
1.0
6
5.5
5
3.5
6
5.9
5
3.7
5
0.0
4
9.7
5
8.5
5
1.9
22
8
5.0
0
6
4.0
5
3.5
5
3.9
5
0.9
5
9.1
5
2.3
8
2.1
5
8.2
6
8.3
5
4.3
7
5.8
5
6.4
7
5.8
5
6.5
6
2.9
5
3.1
6
9.8
5
4.9
23
9
0.0
0
7
6.8
5
6.7
6
8.8
5
4.6
7
2.9
5
5.7
8
9.5
6
1.0
8
0.9
5
7.6
8
5.6
5
9.3
8
5.1
5
9.3
7
6.3
5
6.5
8
1.0
5
7.9
24
9
5.0
0
8
8.4
6
0.0
8
4.1
5
8.3
8
6.3
5
9.1
9
5.3
6
3.8
9
0.4
6
0.9
9
3.0
6
2.2
9
2.9
6
2.1
8
8.0
5
9.9
9
0.6
6
0.9
25
1
00
.00
100
.0
63.3
1
00
.0
62.1
1
00
.0
62.6
1
00
.0
66.5
1
00
.0
64.2
1
00
.0
65.1
1
00
.0
65.0
1
00
.0
63.3
1
00
.0
63.9
Tabl
e A3-
4:E
urop
ean
refe
renc
e po
pula
tion
(11
coun
trie
s). I
ndiv
idua
l nor
m d
ata
for
KID
SCR
EE
N-5
2 PR
OX
Y: S
elf-P
erce
ptio
n
Not
e: C
alcu
latio
n of
sco
res
was
rest
ricte
d to
com
plet
e ca
ses.
PR =
per
cent
ile; T
S =
T-sc
ore
for t
he p
artic
ular
(sub
-)po
pula
tion
(M =
50,
SD
= 1
0).
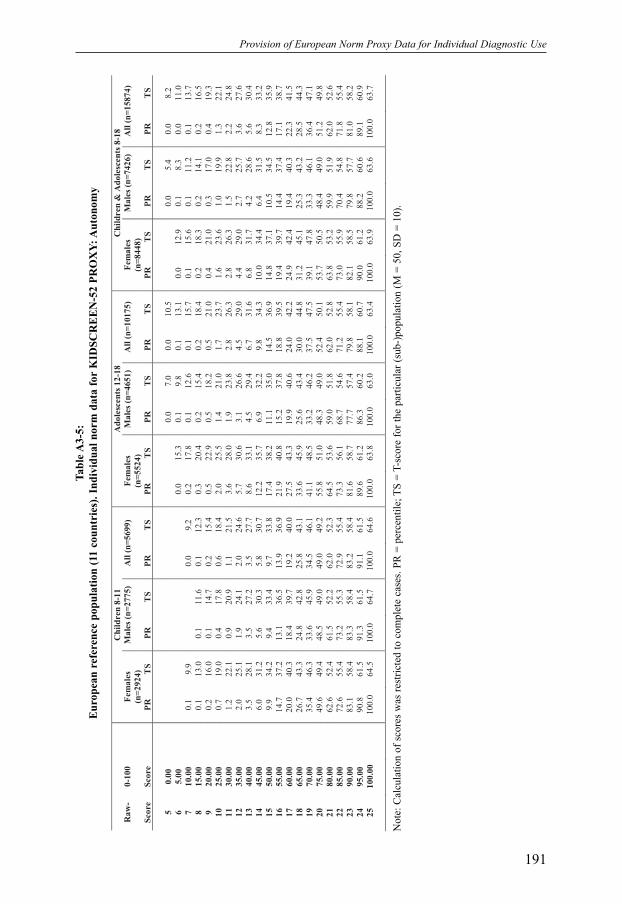
Provision of European Norm Proxy Data for Individual Diagnostic Use
191
C
hil
dren
8-1
1
Ad
ole
scen
ts 1
2-1
8
Ch
ild
ren
& A
do
lesc
en
ts 8
-18
Ra
w-
0-1
00
F
em
ale
s
(n=
292
4)
Ma
les
(n=
277
5)
All
(n
=5
699
) F
em
ale
s
(n=
552
4)
Ma
les
(n=
465
1)
All
(n
=1
017
5)
Fem
ale
s
(n=
844
8)
Ma
les
(n=
742
6)
All
(n
=1
587
4)
Sco
re
Sco
re
P
R
TS
P
R
TS
P
R
TS
P
R
TS
P
R
TS
P
R
TS
P
R
TS
P
R
TS
P
R
TS
5
0.0
0
0
.0
7.0
0
.0
10.5
0
.0
5.4
0
.0
8.2
6
5.0
0
0
.0
15.3
0
.1
9.8
0
.1
13.1
0
.0
12.9
0
.1
8.3
0
.0
11.0
7
10.0
0
0
.1
9.9
0
.0
9.2
0
.2
17.8
0
.1
12.6
0
.1
15.7
0
.1
15.6
0
.1
11.2
0
.1
13.7
8
15.0
0
0
.1
13.0
0
.1
11.6
0
.1
12.3
0
.3
20.4
0
.2
15.4
0
.2
18.4
0
.2
18.3
0
.2
14.1
0
.2
16.5
9
20.0
0
0
.2
16.0
0
.1
14.7
0
.2
15.4
0
.5
22.9
0
.5
18.2
0
.5
21.0
0
.4
21.0
0
.3
17.0
0
.4
19.3
10
2
5.0
0
0
.7
19.0
0
.4
17.8
0
.6
18.4
2
.0
25.5
1
.4
21.0
1
.7
23.7
1
.6
23.6
1
.0
19.9
1
.3
22.1
11
3
0.0
0
1
.2
22.1
0
.9
20.9
1
.1
21.5
3
.6
28.0
1
.9
23.8
2
.8
26.3
2
.8
26.3
1
.5
22.8
2
.2
24.8
12
3
5.0
0
2
.0
25.1
1
.9
24.1
2
.0
24.6
5
.7
30.6
3
.1
26.6
4
.5
29.0
4
.4
29.0
2
.7
25.7
3
.6
27.6
13
4
0.0
0
3
.5
28.1
3
.5
27.2
3
.5
27.7
8
.6
33.1
4
.5
29.4
6
.7
31.6
6
.8
31.7
4
.2
28.6
5
.6
30.4
14
4
5.0
0
6
.0
31.2
5
.6
30.3
5
.8
30.7
1
2.2
3
5.7
6
.9
32.2
9
.8
34.3
1
0.0
3
4.4
6
.4
31.5
8
.3
33.2
15
5
0.0
0
9
.9
34.2
9
.4
33.4
9
.7
33.8
1
7.4
3
8.2
1
1.1
3
5.0
1
4.5
3
6.9
1
4.8
3
7.1
1
0.5
3
4.5
1
2.8
3
5.9
16
5
5.0
0
1
4.7
3
7.2
1
3.1
3
6.5
1
3.9
3
6.9
2
1.9
4
0.8
1
5.2
3
7.8
1
8.8
3
9.5
1
9.4
3
9.7
1
4.4
3
7.4
1
7.1
3
8.7
17
6
0.0
0
2
0.0
4
0.3
1
8.4
3
9.7
1
9.2
4
0.0
2
7.5
4
3.3
1
9.9
4
0.6
2
4.0
4
2.2
2
4.9
4
2.4
1
9.4
4
0.3
2
2.3
4
1.5
18
6
5.0
0
2
6.7
4
3.3
2
4.8
4
2.8
2
5.8
4
3.1
3
3.6
4
5.9
2
5.6
4
3.4
3
0.0
4
4.8
3
1.2
4
5.1
2
5.3
4
3.2
2
8.5
4
4.3
19
7
0.0
0
3
5.4
4
6.3
3
3.6
4
5.9
3
4.5
4
6.1
4
1.1
4
8.5
3
3.2
4
6.2
3
7.5
4
7.5
3
9.1
4
7.8
3
3.3
4
6.1
3
6.4
4
7.1
20
7
5.0
0
4
9.6
4
9.4
4
8.5
4
9.0
4
9.0
4
9.2
5
5.8
5
1.0
4
8.3
4
9.0
5
2.4
5
0.1
5
3.7
5
0.5
4
8.4
4
9.0
5
1.2
4
9.8
21
8
0.0
0
6
2.6
5
2.4
6
1.5
5
2.2
6
2.0
5
2.3
6
4.5
5
3.6
5
9.0
5
1.8
6
2.0
5
2.8
6
3.8
5
3.2
5
9.9
5
1.9
6
2.0
5
2.6
22
8
5.0
0
7
2.6
5
5.4
7
3.2
5
5.3
7
2.9
5
5.4
7
3.3
5
6.1
6
8.7
5
4.6
7
1.2
5
5.4
7
3.0
5
5.9
7
0.4
5
4.8
7
1.8
5
5.4
23
9
0.0
0
8
3.1
5
8.4
8
3.3
5
8.4
8
3.2
5
8.4
8
1.6
5
8.7
7
7.7
5
7.4
7
9.8
5
8.1
8
2.1
5
8.5
7
9.8
5
7.7
8
1.0
5
8.2
24
9
5.0
0
9
0.8
6
1.5
9
1.3
6
1.5
9
1.1
6
1.5
8
9.6
6
1.2
8
6.3
6
0.2
8
8.1
6
0.7
9
0.0
6
1.2
8
8.2
6
0.6
8
9.1
6
0.9
25
1
00
.00
100
.0
64.5
1
00
.0
64.7
1
00
.0
64.6
1
00
.0
63.8
1
00
.0
63.0
1
00
.0
63.4
1
00
.0
63.9
1
00
.0
63.6
1
00
.0
63.7
Tabl
e A3-
5:E
urop
ean
refe
renc
e po
pula
tion
(11
coun
trie
s). I
ndiv
idua
l nor
m d
ata
for
KID
SCR
EE
N-5
2 PR
OX
Y: A
uton
omy
Not
e: C
alcu
latio
n of
sco
res
was
rest
ricte
d to
com
plet
e ca
ses.
PR =
per
cent
ile; T
S =
T-sc
ore
for t
he p
artic
ular
(sub
-)po
pula
tion
(M =
50,
SD
= 1
0).
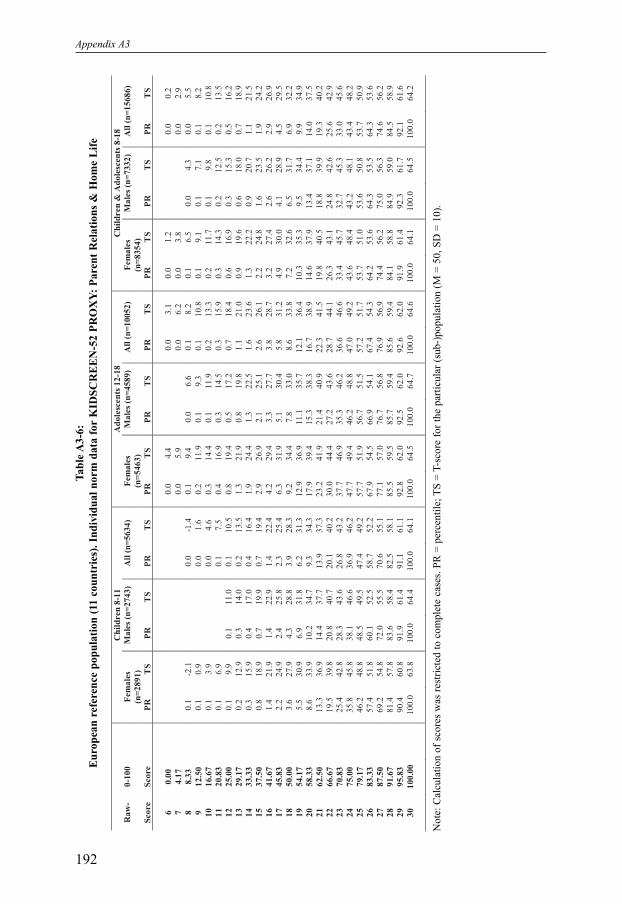
Appendix A3
192
C
hil
dren
8-1
1
Ad
ole
scen
ts 1
2-1
8
Ch
ild
ren
& A
do
lesc
en
ts 8
-18
Ra
w-
0-1
00
F
em
ale
s
(n=
289
1)
Ma
les
(n=
274
3)
All
(n
=5
634
) F
em
ale
s
(n=
546
3)
Ma
les
(n=
458
9)
All
(n
=1
005
2)
Fem
ale
s
(n=
835
4)
Ma
les
(n=
733
2)
All
(n
=1
568
6)
Sco
re
Sco
re
P
R
TS
P
R
TS
P
R
TS
P
R
TS
P
R
TS
P
R
TS
P
R
TS
P
R
TS
P
R
TS
6
0.0
0
0
.0
4.4
0
.0
3.1
0
.0
1.2
0
.0
0.2
7
4.1
7
0
.0
5.9
0
.0
6.2
0
.0
3.8
0
.0
2.9
8
8.3
3
0
.1
-2.1
0
.0
-1.4
0
.1
9.4
0
.0
6.6
0
.1
8.2
0
.1
6.5
0
.0
4.3
0
.0
5.5
9
12.5
0
0
.1
0.9
0
.0
1.6
0
.2
11.9
0
.1
9.3
0
.1
10.8
0
.1
9.1
0
.1
7.1
0
.1
8.2
10
1
6.6
7
0
.1
3.9
0
.0
4.6
0
.3
14.4
0
.1
11.9
0
.2
13.3
0
.2
11.7
0
.1
9.8
0
.1
10.8
11
2
0.8
3
0
.1
6.9
0
.1
7.5
0
.4
16.9
0
.3
14.5
0
.3
15.9
0
.3
14.3
0
.2
12.5
0
.2
13.5
12
2
5.0
0
0
.1
9.9
0
.1
11.0
0
.1
10.5
0
.8
19.4
0
.5
17.2
0
.7
18.4
0
.6
16.9
0
.3
15.3
0
.5
16.2
13
2
9.1
7
0
.2
12.9
0
.3
14.0
0
.2
13.5
1
.3
21.9
0
.8
19.8
1
.1
21.0
0
.9
19.6
0
.6
18.0
0
.7
18.9
14
3
3.3
3
0
.3
15.9
0
.4
17.0
0
.4
16.4
1
.9
24.4
1
.3
22.5
1
.6
23.6
1
.3
22.2
0
.9
20.7
1
.1
21.5
15
3
7.5
0
0
.8
18.9
0
.7
19.9
0
.7
19.4
2
.9
26.9
2
.1
25.1
2
.6
26.1
2
.2
24.8
1
.6
23.5
1
.9
24.2
16
4
1.6
7
1
.4
21.9
1
.4
22.9
1
.4
22.4
4
.2
29.4
3
.3
27.7
3
.8
28.7
3
.2
27.4
2
.6
26.2
2
.9
26.9
17
4
5.8
3
2
.2
24.9
2
.4
25.8
2
.3
25.4
6
.3
31.9
5
.1
30.4
5
.8
31.2
4
.9
30.0
4
.1
28.9
4
.5
29.5
18
5
0.0
0
3
.6
27.9
4
.3
28.8
3
.9
28.3
9
.2
34.4
7
.8
33.0
8
.6
33.8
7
.2
32.6
6
.5
31.7
6
.9
32.2
19
5
4.1
7
5
.5
30.9
6
.9
31.8
6
.2
31.3
1
2.9
3
6.9
1
1.1
3
5.7
1
2.1
3
6.4
1
0.3
3
5.3
9
.5
34.4
9
.9
34.9
20
5
8.3
3
8
.6
33.9
1
0.2
3
4.7
9
.3
34.3
1
7.9
3
9.4
1
5.3
3
8.3
1
6.7
3
8.9
1
4.6
3
7.9
1
3.4
3
7.1
1
4.0
3
7.5
21
6
2.5
0
1
3.3
3
6.9
1
4.4
3
7.7
1
3.9
3
7.3
2
3.2
4
1.9
2
1.4
4
0.9
2
2.3
4
1.5
1
9.8
4
0.5
1
8.8
3
9.9
1
9.3
4
0.2
22
6
6.6
7
1
9.5
3
9.8
2
0.8
4
0.7
2
0.1
4
0.2
3
0.0
4
4.4
2
7.2
4
3.6
2
8.7
4
4.1
2
6.3
4
3.1
2
4.8
4
2.6
2
5.6
4
2.9
23
7
0.8
3
2
5.4
4
2.8
2
8.3
4
3.6
2
6.8
4
3.2
3
7.7
4
6.9
3
5.3
4
6.2
3
6.6
4
6.6
3
3.4
4
5.7
3
2.7
4
5.3
3
3.0
4
5.6
24
7
5.0
0
3
5.8
4
5.8
3
8.1
4
6.6
3
6.9
4
6.2
4
7.7
4
9.4
4
6.2
4
8.8
4
7.0
4
9.2
4
3.6
4
8.4
4
3.2
4
8.1
4
3.4
4
8.2
25
7
9.1
7
4
6.2
4
8.8
4
8.5
4
9.5
4
7.4
4
9.2
5
7.7
5
1.9
5
6.7
5
1.5
5
7.2
5
1.7
5
3.7
5
1.0
5
3.6
5
0.8
5
3.7
5
0.9
26
8
3.3
3
5
7.4
5
1.8
6
0.1
5
2.5
5
8.7
5
2.2
6
7.9
5
4.5
6
6.9
5
4.1
6
7.4
5
4.3
6
4.2
5
3.6
6
4.3
5
3.5
6
4.3
5
3.6
27
8
7.5
0
6
9.2
5
4.8
7
2.0
5
5.5
7
0.6
5
5.1
7
7.1
5
7.0
7
6.7
5
6.8
7
6.9
5
6.9
7
4.4
5
6.2
7
5.0
5
6.3
7
4.6
5
6.2
28
9
1.6
7
8
1.4
5
7.8
8
3.6
5
8.4
8
2.5
5
8.1
8
5.5
5
9.5
8
5.7
5
9.4
8
5.6
5
9.4
8
4.1
5
8.8
8
4.9
5
9.0
8
4.5
5
8.9
29
9
5.8
3
9
0.4
6
0.8
9
1.9
6
1.4
9
1.1
6
1.1
9
2.8
6
2.0
9
2.5
6
2.0
9
2.6
6
2.0
9
1.9
6
1.4
9
2.3
6
1.7
9
2.1
6
1.6
30
1
00
.00
100
.0
63.8
1
00
.0
64.4
1
00
.0
64.1
1
00
.0
64.5
1
00
.0
64.7
1
00
.0
64.6
1
00
.0
64.1
1
00
.0
64.5
1
00
.0
64.2
Tabl
e A3-
6:E
urop
ean
refe
renc
e po
pula
tion
(11
coun
trie
s). I
ndiv
idua
l nor
m d
ata
for
KID
SCR
EE
N-5
2 PR
OX
Y: P
aren
t Rel
atio
ns &
Hom
e L
ife
Not
e: C
alcu
latio
n of
sco
res
was
rest
ricte
d to
com
plet
e ca
ses.
PR =
per
cent
ile; T
S =
T-sc
ore
for t
he p
artic
ular
(sub
-)po
pula
tion
(M =
50,
SD
= 1
0).
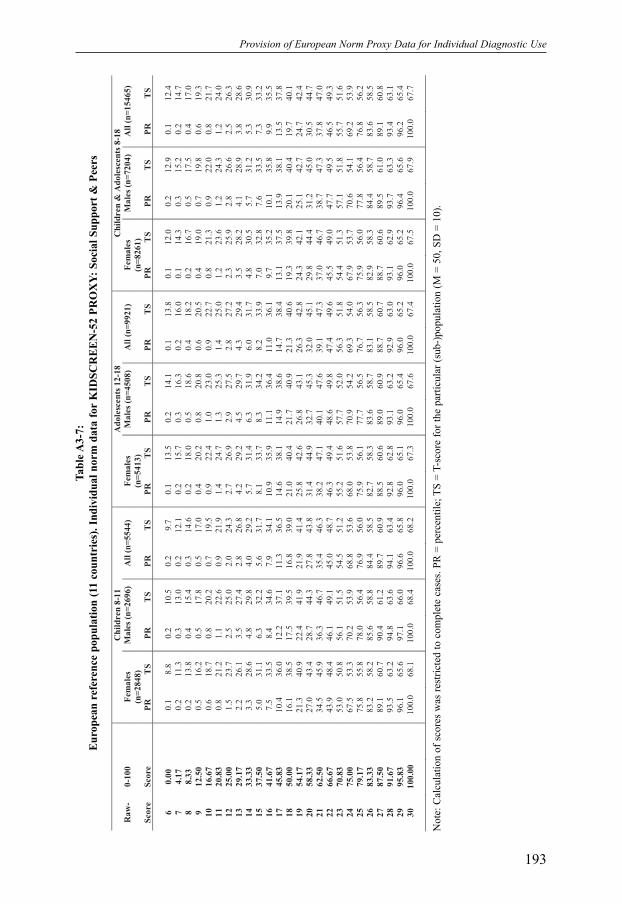
Provision of European Norm Proxy Data for Individual Diagnostic Use
193
C
hil
dren
8-1
1
Ad
ole
scen
ts 1
2-1
8
Ch
ild
ren
& A
do
lesc
en
ts 8
-18
Ra
w-
0-1
00
F
em
ale
s
(n=
284
8)
Ma
les
(n=
269
6)
All
(n
=5
544
) F
em
ale
s
(n=
541
3)
Ma
les
(n=
450
8)
All
(n
=9
921
) F
em
ale
s
(n=
826
1)
Ma
les
(n=
720
4)
All
(n
=1
546
5)
Sco
re
Sco
re
P
R
TS
P
R
TS
P
R
TS
P
R
TS
P
R
TS
P
R
TS
P
R
TS
P
R
TS
P
R
TS
6
0.0
0
0
.1
8.8
0
.2
10.5
0
.2
9.7
0
.1
13.5
0
.2
14.1
0
.1
13.8
0
.1
12.0
0
.2
12.9
0
.1
12.4
7
4.1
7
0
.2
11.3
0
.3
13.0
0
.2
12.1
0
.2
15.7
0
.3
16.3
0
.2
16.0
0
.1
14.3
0
.3
15.2
0
.2
14.7
8
8.3
3
0
.2
13.8
0
.4
15.4
0
.3
14.6
0
.2
18.0
0
.5
18.6
0
.4
18.2
0
.2
16.7
0
.5
17.5
0
.4
17.0
9
12.5
0
0
.5
16.2
0
.5
17.8
0
.5
17.0
0
.4
20.2
0
.8
20.8
0
.6
20.5
0
.4
19.0
0
.7
19.8
0
.6
19.3
10
1
6.6
7
0
.6
18.7
0
.8
20.2
0
.7
19.5
0
.9
22.4
1
.0
23.0
0
.9
22.7
0
.8
21.3
0
.9
22.0
0
.8
21.7
11
2
0.8
3
0
.8
21.2
1
.1
22.6
0
.9
21.9
1
.4
24.7
1
.3
25.3
1
.4
25.0
1
.2
23.6
1
.2
24.3
1
.2
24.0
12
2
5.0
0
1
.5
23.7
2
.5
25.0
2
.0
24.3
2
.7
26.9
2
.9
27.5
2
.8
27.2
2
.3
25.9
2
.8
26.6
2
.5
26.3
13
2
9.1
7
2
.2
26.1
3
.5
27.4
2
.8
26.8
4
.2
29.2
4
.5
29.7
4
.3
29.4
3
.5
28.2
4
.1
28.9
3
.8
28.6
14
3
3.3
3
3
.3
28.6
4
.8
29.8
4
.0
29.2
5
.7
31.4
6
.3
31.9
6
.0
31.7
4
.8
30.5
5
.7
31.2
5
.3
30.9
15
3
7.5
0
5
.0
31.1
6
.3
32.2
5
.6
31.7
8
.1
33.7
8
.3
34.2
8
.2
33.9
7
.0
32.8
7
.6
33.5
7
.3
33.2
16
4
1.6
7
7
.5
33.5
8
.4
34.6
7
.9
34.1
1
0.9
3
5.9
1
1.1
3
6.4
1
1.0
3
6.1
9
.7
35.2
1
0.1
3
5.8
9
.9
35.5
17
4
5.8
3
1
0.4
3
6.0
1
2.2
3
7.1
1
1.3
3
6.5
1
4.6
3
8.1
1
4.9
3
8.6
1
4.7
3
8.4
1
3.1
3
7.5
1
3.9
3
8.1
1
3.5
3
7.8
18
5
0.0
0
1
6.1
3
8.5
1
7.5
3
9.5
1
6.8
3
9.0
2
1.0
4
0.4
2
1.7
4
0.9
2
1.3
4
0.6
1
9.3
3
9.8
2
0.1
4
0.4
1
9.7
4
0.1
19
5
4.1
7
2
1.3
4
0.9
2
2.4
4
1.9
2
1.9
4
1.4
2
5.8
4
2.6
2
6.8
4
3.1
2
6.3
4
2.8
2
4.3
4
2.1
2
5.1
4
2.7
2
4.7
4
2.4
20
5
8.3
3
2
7.0
4
3.4
2
8.7
4
4.3
2
7.8
4
3.8
3
1.4
4
4.9
3
2.7
4
5.3
3
2.0
4
5.1
2
9.8
4
4.4
3
1.2
4
5.0
3
0.5
4
4.7
21
6
2.5
0
3
4.5
4
5.9
3
6.3
4
6.7
3
5.4
4
6.3
3
8.2
4
7.1
4
0.1
4
7.6
3
9.1
4
7.3
3
7.0
4
6.7
3
8.7
4
7.3
3
7.8
4
7.0
22
6
6.6
7
4
3.9
4
8.4
4
6.1
4
9.1
4
5.0
4
8.7
4
6.3
4
9.4
4
8.6
4
9.8
4
7.4
4
9.6
4
5.5
4
9.0
4
7.7
4
9.5
4
6.5
4
9.3
23
7
0.8
3
5
3.0
5
0.8
5
6.1
5
1.5
5
4.5
5
1.2
5
5.2
5
1.6
5
7.7
5
2.0
5
6.3
5
1.8
5
4.4
5
1.3
5
7.1
5
1.8
5
5.7
5
1.6
24
7
5.0
0
6
7.5
5
3.3
7
0.2
5
3.9
6
8.8
5
3.6
6
8.0
5
3.8
7
0.9
5
4.2
6
9.3
5
4.0
6
7.9
5
3.7
7
0.6
5
4.1
6
9.2
5
3.9
25
7
9.1
7
7
5.8
5
5.8
7
8.0
5
6.4
7
6.9
5
6.0
7
5.9
5
6.1
7
7.7
5
6.5
7
6.7
5
6.3
7
5.9
5
6.0
7
7.8
5
6.4
7
6.8
5
6.2
26
8
3.3
3
8
3.2
5
8.2
8
5.6
5
8.8
8
4.4
5
8.5
8
2.7
5
8.3
8
3.6
5
8.7
8
3.1
5
8.5
8
2.9
5
8.3
8
4.4
5
8.7
8
3.6
5
8.5
27
8
7.5
0
8
9.1
6
0.7
9
0.4
6
1.2
8
9.7
6
0.9
8
8.5
6
0.6
8
9.0
6
0.9
8
8.7
6
0.7
8
8.7
6
0.6
8
9.5
6
1.0
8
9.1
6
0.8
28
9
1.6
7
9
3.5
6
3.2
9
4.8
6
3.6
9
4.1
6
3.4
9
2.8
6
2.8
9
3.1
6
3.2
9
2.9
6
3.0
9
3.1
6
2.9
9
3.7
6
3.3
9
3.4
6
3.1
29
9
5.8
3
9
6.1
6
5.6
9
7.1
6
6.0
9
6.6
6
5.8
9
6.0
6
5.1
9
6.0
6
5.4
9
6.0
6
5.2
9
6.0
6
5.2
9
6.4
6
5.6
9
6.2
6
5.4
30
1
00
.00
100
.0
68.1
1
00
.0
68.4
1
00
.0
68.2
1
00
.0
67.3
1
00
.0
67.6
1
00
.0
67.4
1
00
.0
67.5
1
00
.0
67.9
1
00
.0
67.7
Tabl
e A3-
7:E
urop
ean
refe
renc
e po
pula
tion
(11
coun
trie
s). I
ndiv
idua
l nor
m d
ata
for
KID
SCR
EE
N-5
2 PR
OX
Y: S
ocia
l Sup
port
& P
eers
Not
e: C
alcu
latio
n of
sco
res
was
rest
ricte
d to
com
plet
e ca
ses.
PR =
per
cent
ile; T
S =
T-sc
ore
for t
he p
artic
ular
(sub
-)po
pula
tion
(M =
50,
SD
= 1
0).

Appendix A3
194
C
hil
dren
8-1
1
Ad
ole
scen
ts 1
2-1
8
Ch
ild
ren
& A
do
lesc
en
ts 8
-18
Ra
w-
0-1
00
F
em
ale
s
(n=
290
8)
Ma
les
(n=
275
7)
All
(n
=5
665
) F
em
ale
s
(n=
542
5)
Ma
les
(n=
458
5)
All
(n
=1
001
0)
Fem
ale
s
(n=
833
3)
Ma
les
(n=
734
2)
All
(n
=1
567
5)
Sco
re
Sco
re
P
R
TS
P
R
TS
P
R
TS
P
R
TS
P
R
TS
P
R
TS
P
R
TS
P
R
TS
P
R
TS
6
0.0
0
0
.1
10.9
0
.0
14.1
0
.0
12.5
0
.0
9.4
0
.0
12.7
0
.0
11.1
7
4.1
7
0
.1
3.5
0
.0
7.0
0
.1
13.3
0
.1
16.4
0
.1
14.9
0
.1
11.7
0
.1
15.0
0
.1
13.4
8
8.3
3
0
.1
6.2
0
.1
9.5
0
.1
15.7
0
.4
18.8
0
.3
17.3
0
.1
14.1
0
.3
17.3
0
.2
15.8
9
12.5
0
0
.1
8.8
0
.1
14.5
0
.1
12.0
0
.3
18.1
0
.6
21.1
0
.5
19.6
0
.2
16.5
0
.5
19.6
0
.3
18.1
10
1
6.6
7
0
.2
11.4
0
.3
16.9
0
.2
14.5
0
.7
20.6
1
.0
23.4
0
.8
22.0
0
.5
18.9
0
.8
21.9
0
.6
20.4
11
2
0.8
3
0
.2
14.1
0
.7
19.4
0
.5
17.1
1
.0
23.0
1
.8
25.7
1
.4
24.4
0
.8
21.3
1
.4
24.2
1
.1
22.8
12
2
5.0
0
0
.5
16.7
1
.1
21.8
0
.8
19.6
1
.8
25.4
2
.9
28.0
2
.3
26.7
1
.3
23.7
2
.2
26.4
1
.7
25.1
13
2
9.1
7
0
.7
19.3
1
.5
24.2
1
.1
22.1
2
.8
27.8
4
.3
30.3
3
.5
29.1
2
.1
26.1
3
.3
28.7
2
.6
27.4
14
3
3.3
3
1
.2
22.0
2
.3
26.7
1
.7
24.6
4
.2
30.3
6
.0
32.7
5
.0
31.4
3
.1
28.5
4
.6
31.0
3
.8
29.8
15
3
7.5
0
2
.0
24.6
3
.6
29.1
2
.8
27.1
6
.1
32.7
9
.2
35.0
7
.5
33.8
4
.6
30.8
7
.1
33.3
5
.8
32.1
16
4
1.6
7
2
.9
27.2
5
.5
31.5
4
.2
29.6
8
.7
35.1
1
2.4
3
7.3
1
0.4
3
6.2
6
.7
33.2
9
.8
35.6
8
.1
34.4
17
4
5.8
3
5
.0
29.9
7
.9
33.9
6
.4
32.1
1
2.7
3
7.5
1
6.8
3
9.6
1
4.6
3
8.5
1
0.0
3
5.6
1
3.5
3
7.9
1
1.6
3
6.8
18
5
0.0
0
7
.5
32.5
1
2.4
3
6.4
9
.9
34.6
1
9.0
4
0.0
2
4.2
4
1.9
2
1.4
4
0.9
1
5.0
3
8.0
1
9.8
4
0.2
1
7.2
3
9.1
19
5
4.1
7
1
0.2
3
5.1
1
6.6
3
8.8
1
3.3
3
7.1
2
5.7
4
2.4
3
1.6
4
4.3
2
8.4
4
3.3
2
0.2
4
0.4
2
6.0
4
2.5
2
2.9
4
1.4
20
5
8.3
3
1
4.2
3
7.8
2
1.2
4
1.2
1
7.6
3
9.6
3
3.1
4
4.8
3
9.5
4
6.6
3
6.1
4
5.6
2
6.5
4
2.8
3
2.6
4
4.8
2
9.4
4
3.8
21
6
2.5
0
1
9.2
4
0.4
2
8.0
4
3.7
2
3.5
4
2.1
4
1.9
4
7.2
4
8.4
4
8.9
4
4.9
4
8.0
3
3.9
4
5.2
4
0.7
4
7.1
3
7.1
4
6.1
22
6
6.6
7
2
5.2
4
3.0
3
6.2
4
6.1
3
0.5
4
4.6
5
0.6
4
9.7
5
6.2
5
1.2
5
3.2
5
0.4
4
1.7
4
7.6
4
8.7
4
9.4
4
4.9
4
8.4
23
7
0.8
3
3
3.5
4
5.7
4
5.2
4
8.5
3
9.1
4
7.1
5
9.9
5
2.1
6
4.9
5
3.5
6
2.2
5
2.7
5
0.6
4
9.9
5
7.5
5
1.6
5
3.8
5
0.8
24
7
5.0
0
4
5.0
4
8.3
5
7.1
5
1.0
5
0.9
4
9.6
7
1.1
5
4.5
7
5.3
5
5.8
7
3.0
5
5.1
6
1.9
5
2.3
6
8.5
5
3.9
6
5.0
5
3.1
25
7
9.1
7
5
4.3
5
0.9
6
5.5
5
3.4
5
9.7
5
2.1
7
8.0
5
6.9
8
2.1
5
8.2
7
9.9
5
7.5
6
9.7
5
4.7
7
5.9
5
6.2
7
2.6
5
5.4
26
8
3.3
3
6
4.0
5
3.5
7
3.2
5
5.8
6
8.5
5
4.6
8
4.9
5
9.4
8
8.2
6
0.5
8
6.4
5
9.8
7
7.6
5
7.1
8
2.6
5
8.5
7
9.9
5
7.8
27
8
7.5
0
7
4.3
5
6.2
8
1.0
5
8.2
7
7.6
5
7.2
9
0.6
6
1.8
9
2.7
6
2.8
9
1.5
6
2.2
8
4.9
5
9.5
8
8.3
6
0.8
8
6.5
6
0.1
28
9
1.6
7
8
3.3
5
8.8
8
7.0
6
0.7
8
5.1
5
9.7
9
5.0
6
4.2
9
5.4
6
5.1
9
5.2
6
4.6
9
0.9
6
1.9
9
2.3
6
3.1
9
1.5
6
2.4
29
9
5.8
3
9
1.2
6
1.4
9
3.0
6
3.1
9
2.1
6
2.2
9
7.5
6
6.6
9
7.8
6
7.4
9
7.6
6
6.9
9
5.3
6
4.3
9
6.0
6
5.4
9
5.6
6
4.7
30
1
00
.00
100
.0
64.1
1
00
.0
65.5
1
00
.0
64.7
1
00
.0
69.0
1
00
.0
69.7
1
00
.0
69.3
1
00
.0
66.7
1
00
.0
67.7
1
00
.0
67.1
Tabl
e A3-
8:E
urop
ean
refe
renc
e po
pula
tion
(11
coun
trie
s). I
ndiv
idua
l nor
m d
ata
for
KID
SCR
EE
N-5
2 PR
OX
Y: S
choo
l Env
iron
men
t
Not
e: C
alcu
latio
n of
sco
res
was
rest
ricte
d to
com
plet
e ca
ses.
PR =
per
cent
ile; T
S =
T-sc
ore
for t
he p
artic
ular
(sub
-)po
pula
tion
(M =
50,
SD
= 1
0).

Provision of European Norm Proxy Data for Individual Diagnostic Use
195
C
hil
dren
8-1
1
Ad
ole
scen
ts 1
2-1
8
Ch
ild
ren
& A
do
lesc
en
ts 8
-18
Ra
w-
0-1
00
F
em
ale
s
(n=
291
9)
Ma
les
(n=
277
4)
All
(n
=5
693
) F
em
ale
s
(n=
550
8)
Ma
les
(n=
464
7)
All
(n
=1
015
5)
Fem
ale
s
(n=
842
7)
Ma
les
(n=
742
1)
All
(n
=1
584
8)
Sco
re
Sco
re
P
R
TS
P
R
TS
P
R
TS
P
R
TS
P
R
TS
P
R
TS
P
R
TS
P
R
TS
P
R
TS
3
0.0
0
0
.1
-6.3
0
.0
-4.2
0
.1
-13
.5
0.0
-1
0.0
0
.0
-11
.8
0.1
-1
0.4
0
.0
-6.4
0
.0
-8.4
4
8.3
3
0
.1
-0.8
0
.1
2.9
0
.1
1.1
0
.2
-7.6
0
.1
-4.4
0
.1
-6.1
0
.2
-4.7
0
.1
-1.1
0
.1
-2.9
5
16.6
7
0
.3
4.6
0
.4
8.0
0
.3
6.3
0
.3
-1.8
0
.3
1.2
0
.3
-0.3
0
.3
0.9
0
.3
4.3
0
.3
2.6
6
25.0
0
0
.9
10.0
1
.2
13.1
1
.0
11.6
0
.6
4.1
0
.6
6.8
0
.6
5.4
0
.7
6.6
0
.8
9.7
0
.8
8.1
7
33.3
3
1
.4
15.4
1
.8
18.2
1
.6
16.8
1
.0
9.9
1
.1
12.4
1
.1
11.2
1
.2
12.2
1
.3
15.0
1
.2
13.6
8
41.6
7
2
.2
20.8
2
.9
23.3
2
.5
22.1
1
.5
15.8
2
.0
18.0
1
.7
16.9
1
.8
17.9
2
.3
20.4
2
.0
19.1
9
50.0
0
5
.0
26.2
6
.0
28.4
5
.4
27.3
3
.3
21.7
4
.4
23.6
3
.8
22.6
3
.9
23.5
5
.0
25.8
4
.4
24.6
10
5
8.3
3
7
.6
31.6
9
.3
33.5
8
.4
32.6
5
.3
27.5
6
.1
29.3
5
.6
28.4
6
.1
29.2
7
.3
31.1
6
.6
30.1
11
6
6.6
7
1
1.4
3
7.0
1
4.8
3
8.6
1
3.1
3
7.8
8
.4
33.4
9
.7
34.9
9
.0
34.1
9
.4
34.8
1
1.6
3
6.5
1
0.5
3
5.6
12
7
5.0
0
2
6.3
4
2.4
3
0.0
4
3.8
2
8.1
4
3.1
1
8.0
3
9.2
2
0.9
4
0.5
1
9.3
3
9.8
2
0.9
4
0.5
2
4.3
4
1.8
2
2.5
4
1.1
13
8
3.3
3
4
2.7
4
7.8
4
6.2
4
8.9
4
4.4
4
8.4
2
9.9
4
5.1
3
3.4
4
6.1
3
1.5
4
5.6
3
4.3
4
6.1
3
8.2
4
7.2
3
6.1
4
6.7
14
9
1.6
7
6
2.3
5
3.2
6
5.1
5
4.0
6
3.7
5
3.6
4
7.9
5
1.0
5
1.4
5
1.7
4
9.5
5
1.3
5
2.9
5
1.8
5
6.5
5
2.6
5
4.6
5
2.2
15
1
00
.00
100
.0
58.7
1
00
.0
59.1
1
00
.0
58.9
1
00
.0
56.8
1
00
.0
57.3
1
00
.0
57.0
1
00
.0
57.4
1
00
.0
57.9
1
00
.0
57.7
Tabl
e A3-
9:E
urop
ean
refe
renc
e po
pula
tion
(11
coun
trie
s). I
ndiv
idua
l nor
m d
ata
for
KID
SCR
EE
N-5
2 PR
OX
Y: S
ocia
l Acc
epta
nce
Not
e: C
alcu
latio
n of
sco
res
was
rest
ricte
d to
com
plet
e ca
ses.
PR =
per
cent
ile; T
S =
T-sc
ore
for t
he p
artic
ular
(sub
-)po
pula
tion
(M =
50,
SD
= 1
0).

Appendix A3
196
C
hil
dren
8-1
1
Ad
ole
scen
ts 1
2-1
8
Ch
ild
ren
& A
do
lesc
en
ts 8
-18
Ra
w-
0-1
00
F
em
ale
s
(n=
279
8)
Ma
les
(n=
264
8)
All
(n
=5
446
) F
em
ale
s
(n=
549
3)
Ma
les
(n=
463
4)
All
(n
=1
012
7)
Fem
ale
s
(n=
829
1)
Ma
les
(n=
728
2)
All
(n
=1
557
3)
Sco
re
Sco
re
P
R
TS
P
R
TS
P
R
TS
P
R
TS
P
R
TS
P
R
TS
P
R
TS
P
R
TS
P
R
TS
3
0.0
0
1
.8
23.7
2
.5
24.5
2
.1
24.1
1
.2
23.8
1
.4
23.6
1
.3
23.7
1
.4
23.8
1
.8
24.0
1
.6
23.9
4
8.3
3
3
.0
26.9
3
.7
27.7
3
.3
27.3
2
.5
27.1
2
.8
26.9
2
.6
27.0
2
.7
27.0
3
.1
27.2
2
.9
27.1
5
16.6
7
5
.2
30.1
5
.9
30.9
5
.5
30.5
4
.5
30.4
4
.8
30.3
4
.6
30.3
4
.7
30.3
5
.2
30.5
4
.9
30.4
6
25.0
0
9
.3
33.3
1
0.7
3
4.1
1
0.0
3
3.7
9
.9
33.6
1
0.2
3
3.6
1
0.1
3
3.6
9
.7
33.6
1
0.4
3
3.8
1
0.0
3
3.7
7
33.3
3
1
3.8
3
6.5
1
4.9
3
7.3
1
4.3
3
6.9
1
4.8
3
6.9
1
4.6
3
6.9
1
4.7
3
6.9
1
4.4
3
6.8
1
4.7
3
7.0
1
4.6
3
6.9
8
41.6
7
1
9.1
3
9.7
2
0.2
4
0.5
1
9.7
4
0.1
2
0.7
4
0.2
1
9.8
4
0.2
2
0.3
4
0.2
2
0.2
4
0.1
2
0.0
4
0.3
2
0.1
4
0.2
9
50.0
0
3
0.3
4
2.9
3
2.1
4
3.7
3
1.2
4
3.3
3
3.4
4
3.5
3
2.3
4
3.5
3
2.9
4
3.5
3
2.3
4
3.3
3
2.2
4
3.6
3
2.3
4
3.4
10
5
8.3
3
3
7.5
4
6.1
3
9.6
4
6.9
3
8.5
4
6.5
4
1.2
4
6.8
4
0.4
4
6.8
4
0.9
4
6.8
4
0.0
4
6.6
4
0.1
4
6.9
4
0.0
4
6.7
11
6
6.6
7
4
6.0
4
9.3
4
9.6
5
0.1
4
7.7
4
9.7
5
0.1
5
0.1
5
0.1
5
0.1
5
0.1
5
0.1
4
8.7
4
9.8
4
9.9
5
0.1
4
9.3
5
0.0
12
7
5.0
0
6
1.5
5
2.5
6
5.8
5
3.3
6
3.6
5
2.9
6
5.8
5
3.4
6
6.4
5
3.4
6
6.1
5
3.4
6
4.3
5
3.1
6
6.2
5
3.4
6
5.2
5
3.2
13
8
3.3
3
7
0.4
5
5.7
7
5.2
5
6.5
7
2.7
5
6.1
7
5.1
5
6.7
7
6.1
5
6.8
7
5.6
5
6.7
7
3.5
5
6.4
7
5.8
5
6.7
7
4.6
5
6.5
14
9
1.6
7
7
9.9
5
8.9
8
4.1
5
9.7
8
1.9
5
9.3
8
4.8
6
0.0
8
5.5
6
0.1
8
5.1
6
0.0
8
3.1
5
9.6
8
5.0
6
0.0
8
4.0
5
9.8
15
1
00
.00
100
.0
62.1
1
00
.0
62.9
1
00
.0
62.5
1
00
.0
63.3
1
00
.0
63.4
1
00
.0
63.3
1
00
.0
62.9
1
00
.0
63.2
1
00
.0
63.0
Tabl
e A3-
10:
Eur
opea
n re
fere
nce
popu
latio
n (1
1 co
untr
ies)
. Ind
ivid
ual n
orm
dat
a fo
rK
IDSC
RE
EN
-52
PRO
XY:
Fin
anci
al R
esou
rces
Not
e: C
alcu
latio
n of
sco
res
was
rest
ricte
d to
com
plet
e ca
ses.
PR =
per
cent
ile; T
S =
T-sc
ore
for t
he p
artic
ular
(sub
-)po
pula
tion
(M =
50,
SD
= 1
0).
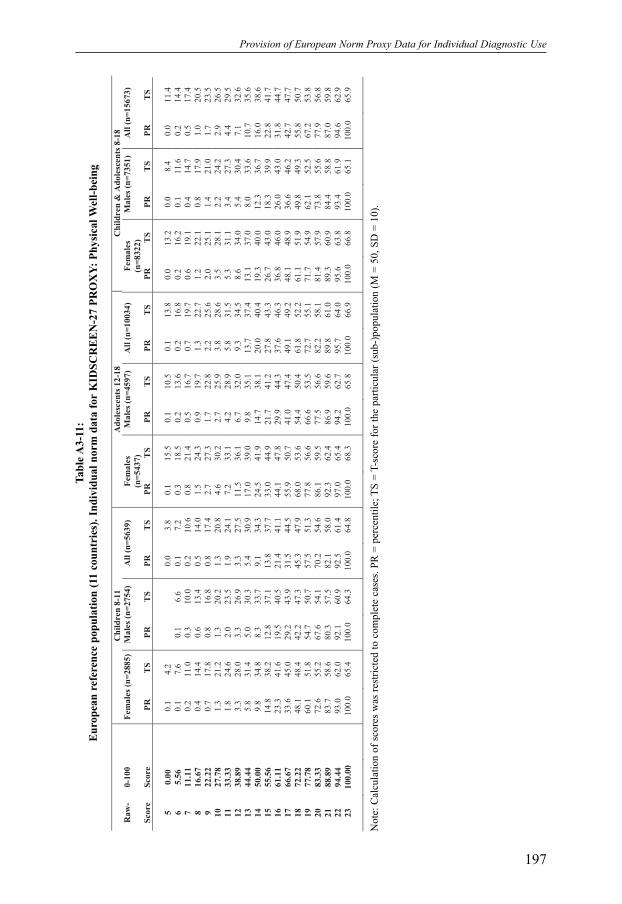
Provision of European Norm Proxy Data for Individual Diagnostic Use
197
C
hil
dren
8-1
1
Ad
ole
scen
ts 1
2-1
8
Ch
ild
ren
& A
do
lesc
en
ts 8
-18
Ra
w-
0-1
00
F
em
ale
s (n
=288
5)
Ma
les
(n=
275
4)
All
(n
=5
639
) F
em
ale
s
(n=
543
7)
Ma
les
(n=
459
7)
All
(n
=1
003
4)
Fem
ale
s
(n=
832
2)
Ma
les
(n=
735
1)
All
(n
=1
567
3)
Sco
re
Sco
re
P
R
TS
P
R
TS
P
R
TS
P
R
TS
P
R
TS
P
R
TS
P
R
TS
P
R
TS
P
R
TS
5
0.0
0
0
.1
4.2
0
.0
3.8
0
.1
15.5
0
.1
10.5
0
.1
13.8
0
.0
13.2
0
.0
8.4
0
.0
11.4
6
5.5
6
0
.1
7.6
0
.1
6.6
0
.1
7.2
0
.3
18.5
0
.2
13.6
0
.2
16.8
0
.2
16.2
0
.1
11.6
0
.2
14.4
7
11.1
1
0
.2
11.0
0
.3
10.0
0
.2
10.6
0
.8
21.4
0
.5
16.7
0
.7
19.7
0
.6
19.1
0
.4
14.7
0
.5
17.4
8
16.6
7
0
.4
14.4
0
.6
13.4
0
.5
14.0
1
.5
24.3
0
.9
19.7
1
.3
22.7
1
.2
22.1
0
.8
17.9
1
.0
20.5
9
22.2
2
0
.7
17.8
0
.8
16.8
0
.8
17.4
2
.7
27.3
1
.7
22.8
2
.2
25.6
2
.0
25.1
1
.4
21.0
1
.7
23.5
10
2
7.7
8
1
.3
21.2
1
.3
20.2
1
.3
20.8
4
.6
30.2
2
.7
25.9
3
.8
28.6
3
.5
28.1
2
.2
24.2
2
.9
26.5
11
3
3.3
3
1
.8
24.6
2
.0
23.5
1
.9
24.1
7
.2
33.1
4
.2
28.9
5
.8
31.5
5
.3
31.1
3
.4
27.3
4
.4
29.5
12
3
8.8
9
3
.3
28.0
3
.3
26.9
3
.3
27.5
1
1.5
3
6.1
6
.7
32.0
9
.3
34.5
8
.6
34.0
5
.4
30.4
7
.1
32.6
13
4
4.4
4
5
.8
31.4
5
.0
30.3
5
.4
30.9
1
7.0
3
9.0
9
.8
35.1
1
3.7
3
7.4
1
3.1
3
7.0
8
.0
33.6
1
0.7
3
5.6
14
5
0.0
0
9
.8
34.8
8
.3
33.7
9
.1
34.3
2
4.5
4
1.9
1
4.7
3
8.1
2
0.0
4
0.4
1
9.3
4
0.0
1
2.3
3
6.7
1
6.0
3
8.6
15
5
5.5
6
1
4.8
3
8.2
1
2.8
3
7.1
1
3.8
3
7.7
3
3.0
4
4.9
2
1.7
4
1.2
2
7.8
4
3.3
2
6.7
4
3.0
1
8.3
3
9.9
2
2.8
4
1.7
16
6
1.1
1
2
3.3
4
1.6
1
9.5
4
0.5
2
1.4
4
1.1
4
4.1
4
7.8
2
9.9
4
4.3
3
7.6
4
6.3
3
6.8
4
6.0
2
6.0
4
3.0
3
1.8
4
4.7
17
6
6.6
7
3
3.6
4
5.0
2
9.2
4
3.9
3
1.5
4
4.5
5
5.9
5
0.7
4
1.0
4
7.4
4
9.1
4
9.2
4
8.1
4
8.9
3
6.6
4
6.2
4
2.7
4
7.7
18
7
2.2
2
4
8.1
4
8.4
4
2.2
4
7.3
4
5.3
4
7.9
6
8.0
5
3.6
5
4.4
5
0.4
6
1.8
5
2.2
6
1.1
5
1.9
4
9.8
4
9.3
5
5.8
5
0.7
19
7
7.7
8
6
0.1
5
1.8
5
4.7
5
0.7
5
7.5
5
1.3
7
7.8
5
6.6
6
6.6
5
3.5
7
2.7
5
5.1
7
1.7
5
4.9
6
2.1
5
2.5
6
7.2
5
3.8
20
8
3.3
3
7
2.6
5
5.2
6
7.6
5
4.1
7
0.2
5
4.6
8
6.1
5
9.5
7
7.5
5
6.6
8
2.2
5
8.1
8
1.4
5
7.9
7
3.8
5
5.6
7
7.9
5
6.8
21
8
8.8
9
8
3.7
5
8.6
8
0.3
5
7.5
8
2.1
5
8.0
9
2.3
6
2.4
8
6.9
5
9.6
8
9.8
6
1.0
8
9.3
6
0.9
8
4.4
5
8.8
8
7.0
5
9.8
22
9
4.4
4
9
3.0
6
2.0
9
2.1
6
0.9
9
2.5
6
1.4
9
7.0
6
5.4
9
4.2
6
2.7
9
5.7
6
4.0
9
5.6
6
3.8
9
3.4
6
1.9
9
4.6
6
2.9
23
1
00
.00
100
.0
65.4
1
00
.0
64.3
1
00
.0
64.8
1
00
.0
68.3
1
00
.0
65.8
1
00
.0
66.9
1
00
.0
66.8
1
00
.0
65.1
1
00
.0
65.9
Tabl
e A3-
11:
Eur
opea
n re
fere
nce
popu
latio
n (1
1 co
untr
ies)
. Ind
ivid
ual n
orm
dat
a fo
rK
IDSC
RE
EN
-27
PRO
XY:
Phy
sica
l Wel
l-bei
ng
Not
e: C
alcu
latio
n of
sco
res
was
rest
ricte
d to
com
plet
e ca
ses.
PR =
per
cent
ile; T
S =
T-sc
ore
for t
he p
artic
ular
(sub
-)po
pula
tion
(M =
50,
SD
= 1
0).
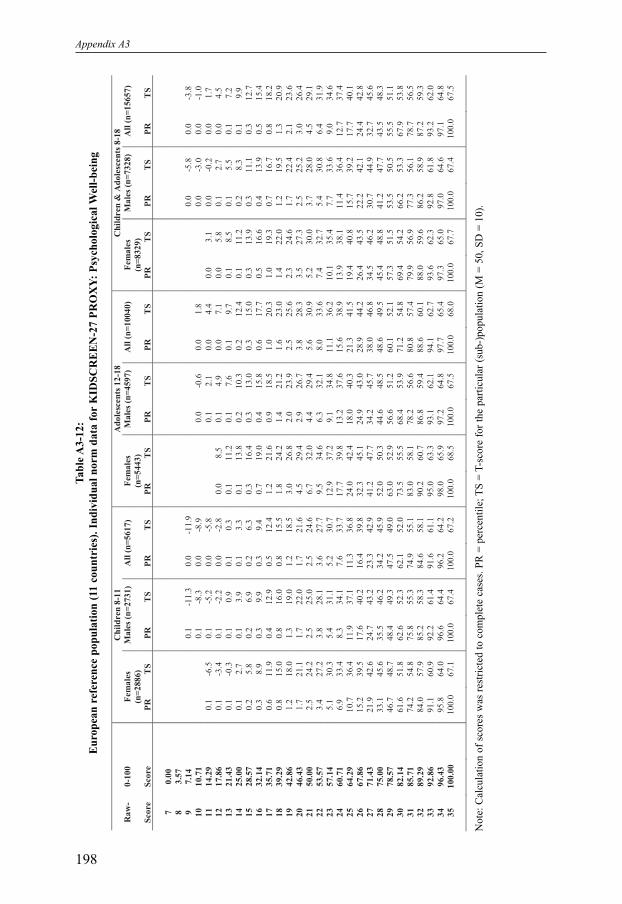
Appendix A3
198
C
hil
dren
8-1
1
Ad
ole
scen
ts 1
2-1
8
Ch
ild
ren
& A
do
lesc
en
ts 8
-18
Ra
w-
0-1
00
F
em
ale
s
(n=
288
6)
Ma
les
(n=
273
1)
All
(n
=5
617
) F
em
ale
s
(n=
544
3)
Ma
les
(n=
459
7)
All
(n
=1
004
0)
Fem
ale
s
(n=
832
9)
Ma
les
(n=
732
8)
All
(n
=1
565
7)
Sco
re
Sco
re
P
R
TS
P
R
TS
P
R
TS
P
R
TS
P
R
TS
P
R
TS
P
R
TS
P
R
TS
P
R
TS
7
0.0
0
8
3.5
7
9
7.1
4
0
.1
-11
.3
0.0
-1
1.9
0
.0
-5.8
0
.0
-3.8
10
1
0.7
1
0
.1
-8.3
0
.0
-8.9
0
.0
-0.6
0
.0
1.8
0
.0
-3.0
0
.0
-1.0
11
1
4.2
9
0
.1
-6.5
0
.1
-5.2
0
.0
-5.8
0
.1
2.1
0
.0
4.4
0
.0
3.1
0
.0
-0.2
0
.0
1.7
12
1
7.8
6
0
.1
-3.4
0
.1
-2.2
0
.0
-2.8
0
.0
8.5
0
.1
4.9
0
.0
7.1
0
.0
5.8
0
.1
2.7
0
.0
4.5
13
2
1.4
3
0
.1
-0.3
0
.1
0.9
0
.1
0.3
0
.1
11.2
0
.1
7.6
0
.1
9.7
0
.1
8.5
0
.1
5.5
0
.1
7.2
14
2
5.0
0
0
.1
2.7
0
.1
3.9
0
.1
3.3
0
.1
13.8
0
.2
10.3
0
.2
12.4
0
.1
11.2
0
.2
8.3
0
.1
9.9
15
2
8.5
7
0
.2
5.8
0
.2
6.9
0
.2
6.3
0
.3
16.4
0
.3
13.0
0
.3
15.0
0
.3
13.9
0
.3
11.1
0
.3
12.7
16
3
2.1
4
0
.3
8.9
0
.3
9.9
0
.3
9.4
0
.7
19.0
0
.4
15.8
0
.6
17.7
0
.5
16.6
0
.4
13.9
0
.5
15.4
17
3
5.7
1
0
.6
11.9
0
.4
12.9
0
.5
12.4
1
.2
21.6
0
.9
18.5
1
.0
20.3
1
.0
19.3
0
.7
16.7
0
.8
18.2
18
3
9.2
9
0
.8
15.0
0
.8
16.0
0
.8
15.5
1
.8
24.2
1
.4
21.2
1
.6
23.0
1
.4
22.0
1
.2
19.5
1
.3
20.9
19
4
2.8
6
1
.2
18.0
1
.3
19.0
1
.2
18.5
3
.0
26.8
2
.0
23.9
2
.5
25.6
2
.3
24.6
1
.7
22.4
2
.1
23.6
20
4
6.4
3
1
.7
21.1
1
.7
22.0
1
.7
21.6
4
.5
29.4
2
.9
26.7
3
.8
28.3
3
.5
27.3
2
.5
25.2
3
.0
26.4
21
5
0.0
0
2
.5
24.2
2
.5
25.0
2
.5
24.6
6
.7
32.0
4
.4
29.4
5
.6
30.9
5
.2
30.0
3
.7
28.0
4
.5
29.1
22
5
3.5
7
3
.4
27.2
3
.8
28.1
3
.6
27.7
9
.5
34.6
6
.3
32.1
8
.0
33.6
7
.4
32.7
5
.4
30.8
6
.4
31.9
23
5
7.1
4
5
.1
30.3
5
.4
31.1
5
.2
30.7
1
2.9
3
7.2
9
.1
34.8
1
1.1
3
6.2
1
0.1
3
5.4
7
.7
33.6
9
.0
34.6
24
6
0.7
1
6
.9
33.4
8
.3
34.1
7
.6
33.7
1
7.7
3
9.8
1
3.2
3
7.6
1
5.6
3
8.9
1
3.9
3
8.1
1
1.4
3
6.4
1
2.7
3
7.4
25
6
4.2
9
1
0.7
3
6.4
1
1.9
3
7.1
1
1.3
3
6.8
2
4.0
4
2.4
1
8.0
4
0.3
2
1.3
4
1.5
1
9.4
4
0.8
1
5.7
3
9.2
1
7.7
4
0.1
26
6
7.8
6
1
5.2
3
9.5
1
7.6
4
0.2
1
6.4
3
9.8
3
2.3
4
5.1
2
4.9
4
3.0
2
8.9
4
4.2
2
6.4
4
3.5
2
2.2
4
2.1
2
4.4
4
2.8
27
7
1.4
3
2
1.9
4
2.6
2
4.7
4
3.2
2
3.3
4
2.9
4
1.2
4
7.7
3
4.2
4
5.7
3
8.0
4
6.8
3
4.5
4
6.2
3
0.7
4
4.9
3
2.7
4
5.6
28
7
5.0
0
3
3.1
4
5.6
3
5.5
4
6.2
3
4.2
4
5.9
5
2.0
5
0.3
4
4.6
4
8.5
4
8.6
4
9.5
4
5.4
4
8.8
4
1.2
4
7.7
4
3.5
4
8.3
29
7
8.5
7
4
6.7
4
8.7
4
8.4
4
9.3
4
7.5
4
9.0
6
3.0
5
2.9
5
6.6
5
1.2
6
0.1
5
2.1
5
7.3
5
1.5
5
3.5
5
0.5
5
5.5
5
1.1
30
8
2.1
4
6
1.6
5
1.8
6
2.6
5
2.3
6
2.1
5
2.0
7
3.5
5
5.5
6
8.4
5
3.9
7
1.2
5
4.8
6
9.4
5
4.2
6
6.2
5
3.3
6
7.9
5
3.8
31
8
5.7
1
7
4.2
5
4.8
7
5.8
5
5.3
7
4.9
5
5.1
8
3.0
5
8.1
7
8.2
5
6.6
8
0.8
5
7.4
7
9.9
5
6.9
7
7.3
5
6.1
7
8.7
5
6.5
32
8
9.2
9
8
4.0
5
7.9
8
5.2
5
8.3
8
4.6
5
8.1
9
0.2
6
0.7
8
6.8
5
9.4
8
8.6
6
0.1
8
8.0
5
9.6
8
6.2
5
8.9
8
7.2
5
9.3
33
9
2.8
6
9
1.1
6
0.9
9
2.2
6
1.4
9
1.6
6
1.1
9
5.0
6
3.3
9
3.1
6
2.1
9
4.1
6
2.7
9
3.6
6
2.3
9
2.8
6
1.8
9
3.2
6
2.0
34
9
6.4
3
9
5.8
6
4.0
9
6.6
6
4.4
9
6.2
6
4.2
9
8.0
6
5.9
9
7.2
6
4.8
9
7.7
6
5.4
9
7.3
6
5.0
9
7.0
6
4.6
9
7.1
6
4.8
35
1
00
.00
100
.0
67.1
1
00
.0
67.4
1
00
.0
67.2
1
00
.0
68.5
1
00
.0
67.5
1
00
.0
68.0
1
00
.0
67.7
1
00
.0
67.4
1
00
.0
67.5
Tabl
e A3-
12:
Eur
opea
n re
fere
nce
popu
latio
n (1
1 co
untr
ies)
. Ind
ivid
ual n
orm
dat
a fo
rK
IDSC
RE
EN
-27
PRO
XY:
Psy
chol
ogic
al W
ell-b
eing
Not
e: C
alcu
latio
n of
sco
res
was
rest
ricte
d to
com
plet
e ca
ses.
PR =
per
cent
ile; T
S =
T-sc
ore
for t
he p
artic
ular
(sub
-)po
pula
tion
(M =
50,
SD
= 1
0).

Provision of European Norm Proxy Data for Individual Diagnostic Use
199
C
hil
dren
8-1
1
Ad
ole
scen
ts 1
2-1
8
Ch
ild
ren
& A
do
lesc
en
ts 8
-18
Ra
w-
0-1
00
F
em
ale
s
(n=
280
3)
Ma
les
(n=
264
2)
All
(n
=5
445
) F
em
ale
s
(n=
542
8)
Ma
les
(n=
456
0)
All
(n
=9
988
) F
em
ale
s
(n=
823
1)
Ma
les
(n=
720
2)
All
(n
=1
543
3)
Sco
re
Sco
re
P
R
TS
P
R
TS
P
R
TS
P
R
TS
P
R
TS
P
R
TS
P
R
TS
P
R
TS
P
R
TS
7
0.0
0
8
3.5
7
9
7.1
4
10
1
0.7
1
0
.0
12.5
0
.0
9.6
0
.0
11.3
0
.0
10.7
0
.0
8.7
0
.0
9.8
11
1
4.2
9
0
.1
8.5
0
.0
9.0
0
.1
14.7
0
.1
11.9
0
.1
13.5
0
.1
13.0
0
.0
11.1
0
.1
12.1
12
1
7.8
6
0
.1
11.0
0
.1
11.8
0
.1
11.4
0
.2
16.9
0
.1
14.2
0
.1
15.8
0
.1
15.2
0
.1
13.4
0
.1
14.4
13
2
1.4
3
0
.1
13.4
0
.1
14.2
0
.1
13.8
0
.3
19.1
0
.1
16.5
0
.2
18.0
0
.3
17.5
0
.1
15.7
0
.2
16.7
14
2
5.0
0
0
.2
15.8
0
.3
16.6
0
.2
16.2
0
.5
21.3
0
.3
18.8
0
.4
20.2
0
.4
19.7
0
.3
18.1
0
.4
19.0
15
2
8.5
7
0
.4
18.3
0
.5
19.0
0
.4
18.7
1
.0
23.4
0
.6
21.1
0
.8
22.5
0
.8
22.0
0
.6
20.4
0
.7
21.3
16
3
2.1
4
0
.5
20.7
1
.0
21.5
0
.7
21.1
1
.9
25.6
1
.3
23.4
1
.6
24.7
1
.4
24.2
1
.2
22.7
1
.3
23.5
17
3
5.7
1
1
.1
23.1
1
.9
23.9
1
.5
23.5
3
.1
27.8
2
.1
25.7
2
.6
26.9
2
.4
26.5
2
.0
25.1
2
.2
25.8
18
3
9.2
9
2
.1
25.6
2
.5
26.3
2
.3
25.9
4
.5
30.0
3
.3
28.0
3
.9
29.1
3
.7
28.7
3
.0
27.4
3
.4
28.1
19
4
2.8
6
3
.3
28.0
3
.8
28.7
3
.5
28.3
6
.7
32.2
4
.9
30.3
5
.8
31.4
5
.5
31.0
4
.5
29.7
5
.0
30.4
20
4
6.4
3
5
.0
30.4
5
.6
31.1
5
.3
30.8
9
.2
34.4
7
.1
32.6
8
.2
33.6
7
.8
33.2
6
.6
32.1
7
.2
32.7
21
5
0.0
0
6
.7
32.8
8
.2
33.5
7
.4
33.2
1
2.2
3
6.6
9
.7
34.9
1
1.1
3
5.8
1
0.3
3
5.5
9
.1
34.4
9
.8
35.0
22
5
3.5
7
9
.9
35.3
1
1.2
3
5.9
1
0.5
3
5.6
1
6.0
3
8.8
1
2.9
3
7.2
1
4.6
3
8.1
1
3.9
3
7.7
1
2.3
3
6.7
1
3.1
3
7.3
23
5
7.1
4
1
3.9
3
7.7
1
5.5
3
8.4
1
4.7
3
8.0
2
0.8
4
1.0
1
8.0
3
9.5
1
9.5
4
0.3
1
8.5
4
0.0
1
7.1
3
9.1
1
7.8
3
9.6
24
6
0.7
1
1
9.2
4
0.1
2
0.0
4
0.8
1
9.6
4
0.4
2
6.6
4
3.1
2
3.0
4
1.8
2
5.0
4
2.5
2
4.1
4
2.2
2
1.9
4
1.4
2
3.1
4
1.9
25
6
4.2
9
2
5.5
4
2.6
2
6.3
4
3.2
2
5.9
4
2.9
3
3.4
4
5.3
2
9.6
4
4.0
3
1.6
4
4.8
3
0.7
4
4.5
2
8.4
4
3.7
2
9.6
4
4.1
26
6
7.8
6
3
3.8
4
5.0
3
2.6
4
5.6
3
3.2
4
5.3
4
1.0
4
7.5
3
6.8
4
6.3
3
9.1
4
7.0
3
8.5
4
6.7
3
5.3
4
6.1
3
7.0
4
6.4
27
7
1.4
3
4
1.8
4
7.4
4
2.1
4
8.0
4
1.9
4
7.7
4
9.0
4
9.7
4
4.6
4
8.6
4
7.0
4
9.2
4
6.5
4
9.0
4
3.6
4
8.4
4
5.2
4
8.7
28
7
5.0
0
5
0.1
4
9.9
5
2.2
5
0.4
5
1.1
5
0.1
5
8.4
5
1.9
5
3.6
5
0.9
5
6.2
5
1.5
5
5.6
5
1.2
5
3.1
5
0.7
5
4.4
5
1.0
29
7
8.5
7
5
8.9
5
2.3
6
2.7
5
2.8
6
0.7
5
2.6
6
6.4
5
4.1
6
2.7
5
3.2
6
4.7
5
3.7
6
3.8
5
3.5
6
2.7
5
3.1
6
3.3
5
3.3
30
8
2.1
4
6
9.1
5
4.7
7
1.8
5
5.3
7
0.4
5
5.0
7
4.3
5
6.3
7
2.1
5
5.5
7
3.3
5
5.9
7
2.5
5
5.7
7
2.0
5
5.4
7
2.3
5
5.6
31
8
5.7
1
7
8.2
5
7.1
8
1.1
5
7.7
7
9.6
5
7.4
8
1.6
5
8.5
8
0.4
5
7.8
8
1.0
5
8.2
8
0.4
5
8.0
8
0.6
5
7.8
8
0.5
5
7.9
32
8
9.2
9
8
5.8
5
9.6
8
7.6
6
0.1
8
6.6
5
9.8
8
7.8
6
0.6
8
7.6
6
0.1
8
7.7
6
0.4
8
7.1
6
0.2
8
7.6
6
0.1
8
7.3
6
0.2
33
9
2.8
6
9
1.9
6
2.0
9
3.5
6
2.5
9
2.7
6
2.2
9
4.0
6
2.8
9
2.9
6
2.4
9
3.5
6
2.6
9
3.3
6
2.5
9
3.1
6
2.4
9
3.2
6
2.5
34
9
6.4
3
9
6.5
6
4.4
9
7.1
6
4.9
9
6.8
6
4.7
9
7.3
6
5.0
9
6.8
6
4.7
9
7.1
6
4.9
9
7.1
6
4.7
9
6.9
6
4.8
9
7.0
6
4.7
35
1
00
.00
100
.0
66.9
1
00
.0
67.3
1
00
.0
67.1
1
00
.0
67.2
1
00
.0
67.0
1
00
.0
67.1
1
00
.0
67.0
1
00
.0
67.1
1
00
.0
67.0
Tabl
e A3-
13:
Eur
opea
n re
fere
nce
popu
latio
n (1
1 co
untr
ies)
. Ind
ivid
ual n
orm
dat
a fo
rK
IDSC
RE
EN
-27
PRO
XY:
Par
ent R
elat
ions
& A
uton
omy
Not
e: C
alcu
latio
n of
sco
res
was
rest
ricte
d to
com
plet
e ca
ses.
PR =
per
cent
ile; T
S =
T-sc
ore
for t
he p
artic
ular
(sub
-)po
pula
tion
(M =
50,
SD
= 1
0).

Appendix A3
200
C
hil
dren
8-1
1
Ad
ole
scen
ts 1
2-1
8
Ch
ild
ren
& A
do
lesc
en
ts 8
-18
Ra
w-
0-1
00
F
em
ale
s
(n=
287
4)
Ma
les
(n=
272
6)
All
(n
=5
600
) F
em
ale
s
(n=
545
0)
Ma
les
(n=
455
6)
All
(n
=1
000
6)
Fem
ale
s
(n=
832
4)
Ma
les
(n=
728
2)
All
(n
=1
560
6)
Sco
re
Sco
re
P
R
TS
P
R
TS
P
R
TS
P
R
TS
P
R
TS
P
R
TS
P
R
TS
P
R
TS
P
R
TS
4
0.0
0
0
.1
8.6
0
.3
10.1
0
.2
9.4
0
.1
13.4
0
.3
13.8
0
.2
13.6
0
.1
11.9
0
.3
12.5
0
.2
12.2
5
6.2
5
0
.3
12.2
0
.4
13.7
0
.3
13.0
0
.3
16.7
0
.4
17.1
0
.4
16.9
0
.3
15.3
0
.4
16.0
0
.3
15.6
6
12.5
0
0
.4
15.9
0
.6
17.3
0
.5
16.6
0
.5
20.1
0
.7
20.4
0
.6
20.2
0
.4
18.8
0
.7
19.4
0
.6
19.1
7
18.7
5
0
.7
19.6
0
.8
20.9
0
.8
20.2
1
.2
23.4
1
.2
23.7
1
.2
23.6
1
.1
22.2
1
.0
22.8
1
.1
22.5
8
25.0
0
1
.5
23.2
2
.6
24.5
2
.0
23.9
3
.0
26.7
3
.2
27.1
3
.1
26.9
2
.5
25.6
3
.0
26.2
2
.7
25.9
9
31.2
5
2
.7
26.9
4
.0
28.1
3
.3
27.5
5
.0
30.0
5
.4
30.4
5
.2
30.2
4
.2
29.1
4
.9
29.6
4
.5
29.3
10
3
7.5
0
4
.9
30.6
6
.3
31.7
5
.6
31.1
8
.1
33.4
8
.3
33.7
8
.2
33.5
7
.0
32.5
7
.6
33.0
7
.3
32.7
11
4
3.7
5
8
.6
34.2
9
.9
35.2
9
.2
34.7
1
2.6
3
6.7
1
2.5
3
7.0
1
2.6
3
6.8
1
1.2
3
5.9
1
1.5
3
6.4
1
1.4
3
6.1
12
5
0.0
0
1
5.7
3
7.9
1
6.9
3
8.8
1
6.3
3
8.4
2
1.1
4
0.0
2
1.7
4
0.3
2
1.4
4
0.2
1
9.2
3
9.3
1
9.9
3
9.8
1
9.5
3
9.6
13
5
6.2
5
2
3.7
4
1.6
2
4.0
4
2.4
2
3.9
4
2.0
2
8.6
4
3.3
2
9.0
4
3.6
2
8.7
4
3.5
2
6.9
4
2.8
2
7.1
4
3.2
2
7.0
4
3.0
14
6
2.5
0
3
4.2
4
5.2
3
6.5
4
6.0
3
5.3
4
5.6
3
8.5
4
6.7
3
9.7
4
6.9
3
9.0
4
6.8
3
7.0
4
6.2
3
8.5
4
6.6
3
7.7
4
6.4
15
6
8.7
5
4
8.3
4
8.9
5
0.1
4
9.6
4
9.2
4
9.2
5
0.6
5
0.0
5
2.4
5
0.3
5
1.4
5
0.1
4
9.8
4
9.6
5
1.5
5
0.0
5
0.6
4
9.8
16
7
5.0
0
6
7.6
5
2.5
6
9.2
5
3.2
6
8.4
5
2.9
6
8.3
5
3.3
7
0.3
5
3.6
6
9.2
5
3.4
6
8.1
5
3.1
6
9.9
5
3.4
6
8.9
5
3.2
17
8
1.2
5
7
8.5
5
6.2
8
0.9
5
6.8
7
9.7
5
6.5
7
9.3
5
6.6
7
9.9
5
6.9
7
9.5
5
6.7
7
9.0
5
6.5
8
0.2
5
6.8
7
9.6
5
6.6
18
8
7.5
0
8
8.2
5
9.9
8
9.9
6
0.3
8
9.0
6
0.1
8
7.9
6
0.0
8
8.5
6
0.2
8
8.2
6
0.1
8
8.0
5
9.9
8
9.1
6
0.2
8
8.5
6
0.1
19
9
3.7
5
9
4.2
6
3.5
9
5.8
6
3.9
9
5.0
6
3.7
9
4.2
6
3.3
9
4.2
6
3.5
9
4.2
6
3.4
9
4.2
6
3.3
9
4.8
6
3.6
9
4.5
6
3.5
20
1
00
.00
100
.0
67.2
1
00
.0
67.5
1
00
.0
67.3
1
00
.0
66.6
1
00
.0
66.8
1
00
.0
66.7
1
00
.0
66.8
1
00
.0
67.1
1
00
.0
66.9
Tabl
e A3-
14:
Eur
opea
n re
fere
nce
popu
latio
n (1
1 co
untr
ies)
. Ind
ivid
ual n
orm
dat
a fo
rK
IDSC
RE
EN
-27
PRO
XY:
Soc
ial S
uppo
rt &
Pee
rs
Not
e: C
alcu
latio
n of
sco
res
was
rest
ricte
d to
com
plet
e ca
ses.
PR =
per
cent
ile; T
S =
T-sc
ore
for t
he p
artic
ular
(sub
-)po
pula
tion
(M =
50,
SD
= 1
0).

Provision of European Norm Proxy Data for Individual Diagnostic Use
201
C
hil
dren
8-1
1
Ad
ole
scen
ts 1
2-1
8
Ch
ild
ren
& A
do
lesc
en
ts 8
-18
Ra
w-
0-1
00
F
em
ale
s
(n=
291
2)
Ma
les
(n=
276
0)
All
(n
=5
672
) F
em
ale
s
(n=
544
6)
Ma
les
(n=
460
8)
All
(n
=1
005
4)
Fem
ale
s
(n=
835
8)
Ma
les
(n=
736
8)
All
(n
=1
572
6)
Sco
re
Sco
re
P
R
TS
P
R
TS
P
R
TS
P
R
TS
P
R
TS
P
R
TS
P
R
TS
P
R
TS
P
R
TS
4
0.0
0
0
.1
8.8
0
.0
12.5
0
.0
10.7
0
.0
6.8
0
.0
11.0
0
.0
9.1
5
6.2
5
0
.1
2.5
0
.0
6.8
0
.1
12.5
0
.2
16.0
0
.1
14.3
0
.1
10.6
0
.1
14.6
0
.1
12.7
6
12.5
0
0
.1
6.6
0
.2
13.6
0
.2
10.7
0
.3
16.2
0
.6
19.6
0
.4
17.9
0
.2
14.3
0
.4
18.1
0
.3
16.3
7
18.7
5
0
.2
10.7
0
.6
17.4
0
.3
14.5
0
.8
19.9
1
.2
23.1
1
.0
21.5
0
.6
18.0
1
.0
21.6
0
.8
19.9
8
25.0
0
0
.3
14.9
1
.0
21.1
0
.6
18.4
1
.4
23.6
2
.5
26.6
1
.9
25.1
1
.0
21.7
1
.9
25.1
1
.5
23.5
9
31.2
5
1
.0
19.0
1
.9
24.8
1
.4
22.3
2
.8
27.3
4
.6
30.2
3
.7
28.7
2
.2
25.4
3
.6
28.7
2
.9
27.1
10
3
7.5
0
1
.6
23.1
3
.5
28.5
2
.5
26.1
5
.1
31.0
7
.6
33.7
6
.3
32.4
3
.8
29.1
6
.1
32.2
4
.9
30.7
11
4
3.7
5
3
.2
27.2
6
.3
32.2
4
.7
30.0
8
.7
34.7
1
2.8
3
7.2
1
0.6
3
6.0
6
.8
32.9
1
0.4
3
5.7
8
.5
34.3
12
5
0.0
0
6
.9
31.4
1
2.8
3
5.9
9
.8
33.9
1
7.2
3
8.4
2
3.1
4
0.7
1
9.9
3
9.6
1
3.6
3
6.6
1
9.3
3
9.2
1
6.2
3
7.9
13
5
6.2
5
1
1.6
3
5.5
1
9.3
3
9.6
1
5.3
3
7.7
2
6.8
4
2.2
3
3.6
4
4.3
2
9.9
4
3.2
2
1.5
4
0.3
2
8.2
4
2.7
2
4.6
4
1.5
14
6
2.5
0
1
8.6
3
9.6
2
8.6
4
3.4
2
3.4
4
1.6
3
8.3
4
5.9
4
5.6
4
7.8
4
1.7
4
6.8
3
1.4
4
4.0
3
9.2
4
6.3
3
5.1
4
5.1
15
6
8.7
5
2
8.8
4
3.7
4
1.1
4
7.1
3
4.8
4
5.5
5
1.7
4
9.6
5
8.4
5
1.3
5
4.8
5
0.4
4
3.6
4
7.7
5
1.9
4
9.8
4
7.5
4
8.7
16
7
5.0
0
4
6.7
4
7.8
5
9.4
5
0.8
5
2.8
4
9.4
6
9.3
5
3.3
7
4.4
5
4.9
7
1.6
5
4.0
6
1.4
5
1.5
6
8.8
5
3.3
6
4.8
5
2.3
17
8
1.2
5
6
3.0
5
2.0
7
2.1
5
4.5
6
7.4
5
3.2
8
0.6
5
7.0
8
4.8
5
8.4
8
2.5
5
7.6
7
4.4
5
5.2
8
0.1
5
6.8
7
7.1
5
5.9
18
8
7.5
0
7
7.0
5
6.1
8
2.7
5
8.2
7
9.8
5
7.1
8
9.8
6
0.7
9
1.7
6
1.9
9
0.7
6
1.2
8
5.3
5
8.9
8
8.3
6
0.4
8
6.7
5
9.6
19
9
3.7
5
8
8.7
6
0.2
9
1.8
6
1.9
9
0.2
6
1.0
9
5.8
6
4.4
9
6.7
6
5.4
9
6.2
6
4.8
9
3.3
6
2.6
9
4.9
6
3.9
9
4.0
6
3.2
20
1
00
.00
100
.0
64.3
1
00
.0
65.6
1
00
.0
64.8
1
00
.0
68.1
1
00
.0
69.0
1
00
.0
68.5
1
00
.0
66.3
1
00
.0
67.4
1
00
.0
66.8
Tabl
e A3-
15:
Eur
opea
n re
fere
nce
popu
latio
n (1
1 co
untr
ies)
. Ind
ivid
ual n
orm
dat
a fo
rK
IDSC
RE
EN
-27
PRO
XY:
Sch
ool E
nvir
onm
ent
Not
e: C
alcu
latio
n of
sco
res
was
rest
ricte
d to
com
plet
e ca
ses.
PR =
per
cent
ile; T
S =
T-sc
ore
for t
he p
artic
ular
(sub
-)po
pula
tion
(M =
50,
SD
= 1
0).
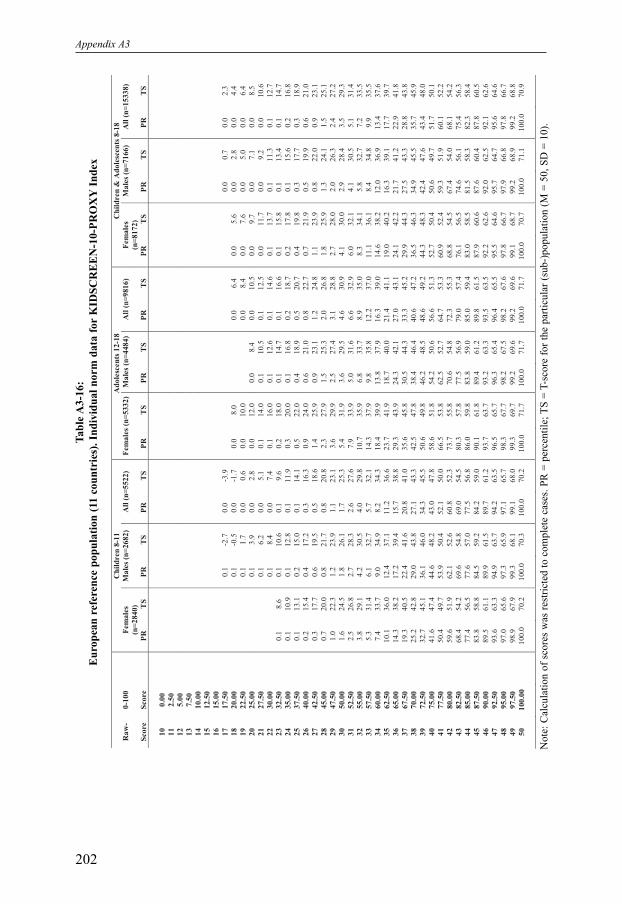
Appendix A3
202
C
hil
dren
8-1
1
Ad
ole
scen
ts 1
2-1
8
Ch
ild
ren
& A
do
lesc
en
ts 8
-18
Ra
w-
0-1
00
F
em
ale
s
(n=
284
0)
Ma
les
(n=
268
2)
All
(n
=5
522
) F
em
ale
s (n
=533
2)
Ma
les
(n=
448
4)
All
(n
=9
816
) F
em
ale
s
(n=
817
2)
Ma
les
(n=
716
6)
All
(n
=1
533
8)
Sco
re
Sco
re
P
R
TS
P
R
TS
P
R
TS
P
R
TS
P
R
TS
P
R
TS
P
R
TS
P
R
TS
P
R
TS
10
0
.00
11
2
.50
12
5
.00
13
7
.50
14
1
0.0
0
15
1
2.5
0
16
1
5.0
0
17
1
7.5
0
0
.1
-2.7
0
.0
-3.9
0
.0
0.7
0
.0
2.3
18
2
0.0
0
0
.1
-0.5
0
.0
-1.7
0
.0
8.0
0
.0
6.4
0
.0
5.6
0
.0
2.8
0
.0
4.4
19
2
2.5
0
0
.1
1.7
0
.0
0.6
0
.0
10.0
0
.0
8.4
0
.0
7.6
0
.0
5.0
0
.0
6.4
20
2
5.0
0
0
.1
3.9
0
.0
2.8
0
.0
12.0
0
.0
8.4
0
.0
10.5
0
.0
9.7
0
.0
7.1
0
.0
8.5
21
2
7.5
0
0
.1
6.2
0
.0
5.1
0
.1
14.0
0
.1
10.5
0
.1
12.5
0
.0
11.7
0
.0
9.2
0
.0
10.6
22
3
0.0
0
0
.1
8.4
0
.0
7.4
0
.1
16.0
0
.1
12.6
0
.1
14.6
0
.1
13.7
0
.1
11.3
0
.1
12.7
23
3
2.5
0
0
.1
8.6
0
.1
10.6
0
.1
9.6
0
.2
18.0
0
.1
14.7
0
.1
16.6
0
.1
15.8
0
.1
13.4
0
.1
14.7
24
3
5.0
0
0
.1
10.9
0
.1
12.8
0
.1
11.9
0
.3
20.0
0
.1
16.8
0
.2
18.7
0
.2
17.8
0
.1
15.6
0
.2
16.8
25
3
7.5
0
0
.1
13.1
0
.2
15.0
0
.1
14.1
0
.5
22.0
0
.4
18.9
0
.5
20.7
0
.4
19.8
0
.3
17.7
0
.3
18.9
26
4
0.0
0
0
.2
15.4
0
.4
17.2
0
.3
16.3
0
.9
24.0
0
.6
21.0
0
.8
22.7
0
.7
21.9
0
.5
19.9
0
.6
21.0
27
4
2.5
0
0
.3
17.7
0
.6
19.5
0
.5
18.6
1
.4
25.9
0
.9
23.1
1
.2
24.8
1
.1
23.9
0
.8
22.0
0
.9
23.1
28
4
5.0
0
0
.7
20.0
0
.8
21.7
0
.8
20.8
2
.3
27.9
1
.5
25.3
2
.0
26.8
1
.8
25.9
1
.3
24.1
1
.5
25.1
29
4
7.5
0
1
.0
22.3
1
.2
23.9
1
.1
23.1
3
.6
29.9
2
.5
27.4
3
.1
28.8
2
.7
28.0
2
.0
26.3
2
.4
27.2
30
5
0.0
0
1
.6
24.5
1
.8
26.1
1
.7
25.3
5
.4
31.9
3
.6
29.5
4
.6
30.9
4
.1
30.0
2
.9
28.4
3
.5
29.3
31
5
2.5
0
2
.5
26.8
2
.7
28.3
2
.6
27.6
7
.9
33.9
5
.0
31.6
6
.6
32.9
6
.0
32.1
4
.1
30.5
5
.1
31.4
32
5
5.0
0
3
.8
29.1
4
.2
30.5
4
.0
29.8
1
0.7
3
5.9
6
.8
33.7
8
.9
35.0
8
.3
34.1
5
.8
32.7
7
.2
33.5
33
5
7.5
0
5
.3
31.4
6
.1
32.7
5
.7
32.1
1
4.3
3
7.9
9
.8
35.8
1
2.2
3
7.0
1
1.1
3
6.1
8
.4
34.8
9
.9
35.5
34
6
0.0
0
7
.4
33.7
9
.0
34.9
8
.2
34.3
1
8.4
3
9.9
1
3.8
3
7.9
1
6.3
3
9.0
1
4.6
3
8.2
1
2.0
3
6.9
1
3.4
3
7.6
35
6
2.5
0
1
0.1
3
6.0
1
2.4
3
7.1
1
1.2
3
6.6
2
3.7
4
1.9
1
8.7
4
0.0
2
1.4
4
1.1
1
9.0
4
0.2
1
6.3
3
9.1
1
7.7
3
9.7
36
6
5.0
0
1
4.3
3
8.2
1
7.2
3
9.4
1
5.7
3
8.8
2
9.3
4
3.9
2
4.3
4
2.1
2
7.0
4
3.1
2
4.1
4
2.2
2
1.7
4
1.2
2
2.9
4
1.8
37
6
7.5
0
1
9.3
4
0.5
2
2.4
4
1.6
2
0.8
4
1.0
3
5.6
4
5.8
3
0.5
4
4.3
3
3.3
4
5.2
2
9.9
4
4.3
2
7.5
4
3.3
2
8.8
4
3.8
38
7
0.0
0
2
5.2
4
2.8
2
9.0
4
3.8
2
7.1
4
3.3
4
2.5
4
7.8
3
8.4
4
6.4
4
0.6
4
7.2
3
6.5
4
6.3
3
4.9
4
5.5
3
5.7
4
5.9
39
7
2.5
0
3
2.7
4
5.1
3
6.1
4
6.0
3
4.3
4
5.5
5
0.6
4
9.8
4
6.2
4
8.5
4
8.6
4
9.2
4
4.3
4
8.3
4
2.4
4
7.6
4
3.4
4
8.0
40
7
5.0
0
4
1.6
4
7.4
4
4.6
4
8.2
4
3.0
4
7.8
5
8.6
5
1.8
5
4.2
5
0.6
5
6.6
5
1.3
5
2.7
5
0.4
5
0.6
4
9.7
5
1.7
5
0.1
41
7
7.5
0
5
0.4
4
9.7
5
3.9
5
0.4
5
2.1
5
0.0
6
6.5
5
3.8
6
2.5
5
2.7
6
4.7
5
3.3
6
0.9
5
2.4
5
9.3
5
1.9
6
0.1
5
2.2
42
8
0.0
0
5
9.6
5
1.9
6
2.1
5
2.6
6
0.8
5
2.3
7
3.7
5
5.8
7
0.6
5
4.8
7
2.3
5
5.3
6
8.8
5
4.5
6
7.4
5
4.0
6
8.1
5
4.2
43
8
2.5
0
6
8.4
5
4.2
6
9.6
5
4.8
6
9.0
5
4.5
8
0.3
5
7.8
7
7.5
5
6.9
7
9.0
5
7.4
7
6.1
5
6.5
7
4.6
5
6.1
7
5.4
5
6.3
44
8
5.0
0
7
7.4
5
6.5
7
7.6
5
7.0
7
7.5
5
6.8
8
6.0
5
9.8
8
3.8
5
9.0
8
5.0
5
9.4
8
3.0
5
8.5
8
1.5
5
8.3
8
2.3
5
8.4
45
8
7.5
0
8
3.8
5
8.8
8
4.5
5
9.2
8
4.2
5
9.0
9
0.1
6
1.8
8
9.4
6
1.2
8
9.8
6
1.5
8
7.9
6
0.6
8
7.6
6
0.4
8
7.8
6
0.5
46
9
0.0
0
8
9.5
6
1.1
8
9.9
6
1.5
8
9.7
6
1.2
9
3.7
6
3.7
9
3.2
6
3.3
9
3.5
6
3.5
9
2.2
6
2.6
9
2.0
6
2.5
9
2.1
6
2.6
47
9
2.5
0
9
3.6
6
3.3
9
4.9
6
3.7
9
4.2
6
3.5
9
6.5
6
5.7
9
6.3
6
5.4
9
6.4
6
5.5
9
5.5
6
4.6
9
5.7
6
4.7
9
5.6
6
4.6
48
9
5.0
0
9
7.0
6
5.6
9
7.3
6
5.9
9
7.1
6
5.7
9
8.3
6
7.7
9
8.2
6
7.5
9
8.2
6
7.6
9
7.8
6
6.7
9
7.9
6
6.8
9
7.8
6
6.7
49
9
7.5
0
9
8.9
6
7.9
9
9.3
6
8.1
9
9.1
6
8.0
9
9.3
6
9.7
9
9.2
6
9.6
9
9.2
6
9.6
9
9.1
6
8.7
9
9.2
6
8.9
9
9.2
6
8.8
50
1
00
.00
100
.0
70.2
1
00
.0
70.3
1
00
.0
70.2
1
00
.0
71.7
1
00
.0
71.7
1
00
.0
71.7
1
00
.0
70.7
1
00
.0
71.1
1
00
.0
70.9
Tabl
e A3-
16:
Eur
opea
n re
fere
nce
popu
latio
n (1
1 co
untr
ies)
. Ind
ivid
ual n
orm
dat
a fo
rK
IDSC
RE
EN
-10-
PRO
XY
Inde
x
Not
e: C
alcu
latio
n of
sco
res
was
rest
ricte
d to
com
plet
e ca
ses.
PR =
per
cent
ile; T
S =
T-sc
ore
for t
he p
artic
ular
(sub
-)po
pula
tion
(M =
50,
SD
= 1
0).
Provision of National Norm Data for Individual Diagnostic Use
203
KIDSCREEN Health Related Quality ofLife Questionnaires
Appendix A4:Provision of National Norm Data for IndividualDiagnostic Use (KIDSCREEN-10 Index)
Table A4-1: AT - Austria. Individual norm data for KIDSCREEN-10 Index..................................205
Table A4-2: CH - Switzerland. Individual norm data for KIDSCREEN-10 Index..................................206
Table A4-3: CZ - Czech Republic. Individual norm data KIDSCREEN-10 Index........................................207
Table A4-4: DE - Germany. Individual norm data for KIDSCREEN-10 Index..................................208
Table A4-5: EL - Greece. Individual norm data for KIDSCREEN-10 Index..................................209
Table A4-6: ES - Spain. Individual norm data for KIDSCREEN-10 Index..................................210
Table A4-7: FR - France. Individual Norm data for KIDSCREEN-10 Index ................................211
Table A4-8: HU - Hungary. Individual norm data for KIDSCREEN-10 Index..................................212
Table A4-9: IE - Ireland. Individual norm data for KIDSCREEN-10 Index..................................213
Table A4-10: NL - Netherlands. Individual norm data for KIDSCREEN-10 Index..................................214
Table A4-11: PL - Poland. Individual norm data for KIDSCREEN-10 Index..................................215
Table A4-12: SE - Sweden. Individual norm data KIDSCREEN-10 Index........................................216
Table A4-13: UK - United Kingdom. Individual norm data KIDSCREEN-10 Index........................................217


Provision of National Norm Data for Individual Diagnostic Use
205
C
hil
dren
8-1
1
Ad
ole
scen
ts 1
2-1
8
Ch
ild
ren
& A
do
lesc
en
ts 8
-18
Ra
w-
0-1
00
F
em
ale
s (n
=255
) M
ale
s (n
=223
) A
ll (
n=
478
) F
em
ale
s (n
=467
) M
ale
s (n
=406
) A
ll (
n=
873
) F
em
ale
s (n
=722
) M
ale
s (n
=629
) A
ll (
n=
1351
)
Sco
re
Sco
re
P
R
TS
P
R
TS
P
R
TS
P
R
TS
P
R
TS
P
R
TS
P
R
TS
P
R
TS
P
R
TS
10
0
.00
11
2
.50
12
5
.00
13
7
.50
14
1
0.0
0
15
1
2.5
0
16
1
5.0
0
17
1
7.5
0
18
2
0.0
0
19
2
2.5
0
0
.7
-3.0
0
.3
-4.0
0
.2
3.5
0
.1
7.5
20
2
5.0
0
0
.7
-0.8
0
.3
-1.8
0
.2
5.5
0
.1
9.4
21
2
7.5
0
0
.7
1.3
0
.3
0.4
0
.5
16.1
0
.4
9.3
0
.4
13.7
0
.3
13.8
0
.4
7.5
0
.3
11.3
22
3
0.0
0
0
.7
3.5
0
.3
2.6
0
.5
17.9
0
.4
11.3
0
.4
15.6
0
.3
15.6
0
.4
9.5
0
.3
13.2
23
3
2.5
0
0
.7
5.7
0
.3
4.7
0
.5
19.8
0
.4
13.3
0
.4
17.4
0
.3
17.4
0
.4
11.5
0
.3
15.0
24
3
5.0
0
0
.7
7.9
0
.3
6.9
1
.1
21.6
0
.4
15.2
0
.7
19.3
0
.7
19.2
0
.4
13.5
0
.5
16.9
25
3
7.5
0
0
.7
10.0
0
.3
9.1
1
.4
23.4
0
.4
17.2
0
.9
21.1
0
.9
21.0
0
.4
15.5
0
.6
18.8
26
4
0.0
0
0
.6
10.4
0
.7
12.2
0
.5
11.3
2
.0
25.2
0
.7
19.2
1
.3
23.0
1
.4
22.8
0
.6
17.5
1
.0
20.7
27
4
2.5
0
0
.6
12.6
0
.7
14.4
0
.5
13.5
2
.6
27.1
0
.7
21.2
1
.7
24.9
1
.8
24.6
0
.6
19.5
1
.2
22.5
28
4
5.0
0
0
.6
14.9
0
.7
16.5
0
.5
15.7
3
.9
28.9
1
.7
23.2
2
.9
26.7
2
.6
26.4
1
.3
21.5
2
.0
24.4
29
4
7.5
0
0
.6
17.1
0
.7
18.7
0
.5
17.9
4
.8
30.7
1
.7
25.2
3
.4
28.6
3
.2
28.2
1
.3
23.6
2
.3
26.3
30
5
0.0
0
1
.0
19.3
0
.7
20.9
0
.7
20.1
6
.4
32.5
3
.5
27.2
5
.1
30.5
4
.4
30.0
2
.4
25.6
3
.5
28.2
31
5
2:.
50
1.4
2
1.5
0
.7
23.0
0
.9
22.3
8
.6
34.3
4
.9
29.2
6
.9
32.3
6
.0
31.8
3
.3
27.6
4
.8
30.1
32
5
5.0
0
2
.1
23.7
2
.7
25.2
2
.3
24.5
1
1.4
3
6.1
5
.7
31.2
8
.7
34.2
8
.0
33.6
4
.6
29.6
6
.4
31.9
33
5
7.5
0
2
.5
25.9
3
.4
27.4
2
.8
26.7
1
4.2
3
8.0
8
.1
33.1
1
1.4
3
6.1
1
0.0
3
5.4
6
.4
31.6
8
.3
33.8
34
6
0.0
0
5
.5
28.2
4
.2
29.5
4
.8
28.8
1
6.5
3
9.8
1
0.8
3
5.1
1
3.9
3
7.9
1
2.6
3
7.2
8
.4
33.6
1
0.7
3
5.7
35
6
2.5
0
7
.4
30.4
5
.1
31.7
6
.3
31.0
2
0.4
4
1.6
1
3.3
3
7.1
1
7.1
3
9.8
1
5.8
3
9.0
1
0.3
3
5.6
1
3.2
3
7.6
36
6
5.0
0
9
.0
32.6
9
.0
33.9
9
.0
33.2
2
7.0
4
3.4
1
5.2
3
9.1
2
1.5
4
1.6
2
0.7
4
0.8
1
3.0
3
7.6
1
7.1
3
9.5
37
6
7.5
0
1
0.6
3
4.8
1
1.2
3
6.0
1
0.9
3
5.4
3
0.7
4
5.2
2
0.4
4
1.1
2
5.9
4
3.5
2
3.6
4
2.6
1
7.1
3
9.6
2
0.6
4
1.3
38
7
0.0
0
1
2.9
3
7.0
1
4.4
3
8.2
1
3.6
3
7.6
3
7.9
4
7.0
2
5.1
4
3.1
3
2.0
4
5.4
2
9.1
4
4.4
2
1.3
4
1.6
2
5.5
4
3.2
39
7
2.5
0
1
4.9
3
9.3
1
6.2
4
0.3
1
5.5
3
9.8
4
5.2
4
8.9
2
9.8
4
5.1
3
8.0
4
7.2
3
4.5
4
6.2
2
5.0
4
3.6
3
0.0
4
5.1
40
7
5.0
0
1
7.6
4
1.5
1
8.9
4
2.5
1
8.2
4
2.0
5
3.1
5
0.7
3
5.5
4
7.1
4
4.9
4
9.1
4
0.6
4
8.0
2
9.6
4
5.6
3
5.4
4
7.0
41
7
7.5
0
2
5.2
4
3.7
3
1.0
4
4.7
2
7.9
4
4.2
6
0.4
5
2:.
5
45.3
4
9.1
5
3.4
5
1.0
4
8.0
4
9.8
4
0.2
4
7.6
4
4.4
4
8.9
42
8
0.0
0
3
0.6
4
5.9
3
7.2
4
6.8
3
3.7
4
6.4
6
8.0
5
4.3
5
2:.
2
51.1
6
0.6
5
2:.
8
54.8
5
1.6
4
6.9
4
9.6
5
1.1
5
0.7
43
8
2.5
0
3
8.5
4
8.1
4
5.7
4
9.0
4
1.9
4
8.6
7
4.8
5
6.1
5
9.6
5
3.0
6
7.7
5
4.7
6
2.0
5
3.4
5
4.6
5
1.7
5
8.6
5
2:.
6
44
8
5.0
0
4
8.7
5
0.4
5
4.2
5
1.2
5
1.3
5
0.7
8
0.1
5
7.9
6
9.7
5
5.0
7
5.3
5
6.6
6
9.0
5
5.2
6
4.2
5
3.7
6
6.8
5
4.5
45
8
7.5
0
5
9.3
5
2:.
6
62.7
5
3.3
6
0.9
5
2:.
9
85.7
5
9.8
7
9.0
5
7.0
8
2.6
5
8.4
7
6.4
5
7.0
7
3.3
5
5.7
7
4.9
5
6.4
46
9
0.0
0
6
9.9
5
4.8
7
2.6
5
5.5
7
1.2
5
5.1
8
9.6
6
1.6
8
5.5
5
9.0
8
7.7
6
0.3
8
2.6
5
8.8
8
0.9
5
7.7
8
1.8
5
8.3
47
9
2.5
0
7
8.5
5
7.0
8
0.3
5
7.7
7
9.3
5
7.3
9
3.8
6
3.4
9
0.6
6
1.0
9
2.3
6
2.1
8
8.4
6
0.6
8
7.0
5
9.7
8
7.7
6
0.1
48
9
5.0
0
8
5.1
5
9.2
8
7.0
5
9.8
8
6.0
5
9.5
9
7.4
6
5.2
9
5.1
6
3.0
9
6.3
6
4.0
9
3.1
6
2.4
9
2.2
6
1.7
9
2.7
6
2.0
49
9
7.5
0
9
3.7
6
1.5
9
2.0
6
2.0
9
2.9
6
1.7
9
9.1
6
7.0
9
7.8
6
5.0
9
8.5
6
5.9
9
7.2
6
4.2
9
5.7
6
3.7
9
6.5
6
3.9
50
1
00
.00
100
.0
63.7
1
00
.0
64.2
1
00
.0
63.9
1
00
.0
68.8
1
00
.0
67.0
1
00
.0
67.7
1
00
.0
66.0
1
00
.0
65.7
1
00
.0
65.8
Tabl
e A4-
1:
AT- A
ustr
ia. I
ndiv
idua
l nor
m d
ata
for
KID
SCR
EE
N-1
0 In
dex
Not
e: C
alcu
latio
n of
sco
res
was
rest
ricte
d to
com
plet
e ca
ses.
PR =
per
cent
ile; T
S =
T-sc
ore
for t
he p
artic
ular
(sub
-)po
pula
tion
(M =
50.
SD
= 1
0).

Appendix A4
206
C
hil
dren
8-1
1
Ad
ole
scen
ts 1
2-1
8
Ch
ild
ren
& A
do
lesc
en
ts 8
-18
Ra
w-
0-1
00
F
em
ale
s (n
=283
) M
ale
s (n
=262
) A
ll (
n=
545
) F
em
ale
s (n
=576
) M
ale
s (n
=495
) A
ll (
n=
1071
) F
em
ale
s (n
=859
) M
ale
s (n
=757
) A
ll (
n=
1619
)
Sco
re
Sco
re
P
R
TS
P
R
TS
P
R
TS
P
R
TS
P
R
TS
P
R
TS
P
R
TS
P
R
TS
P
R
TS
10
0
.00
11
2
.50
12
5
.00
13
7
.50
14
1
0.0
0
15
1
2.5
0
16
1
5.0
0
17
1
7.5
0
18
2
0.0
0
0
.6
-11
.6
0.3
-8
.7
0.2
-4
.5
0.1
1
.4
19
2
2.5
0
0
.6
-9.2
0
.3
-6.4
0
.3
8.5
0
.1
5.4
0
.2
6.7
0
.2
-2.3
0
.2
3.4
20
2
5.0
0
0
.6
-6.8
0
.3
-4.1
0
.3
10.5
0
.1
7.5
0
.2
8.7
0
.2
0.0
0
.2
5.5
21
2
7.5
0
0
.6
-4.4
0
.3
-1.7
0
.3
12.5
0
.1
9.5
0
.2
10.7
0
.2
2.2
0
.2
7.6
22
3
0.0
0
0
.6
-2.0
0
.3
0.6
0
.3
14.5
0
.1
11.6
0
.2
12.6
0
.2
4.4
0
.2
9.6
23
3
2.5
0
0
.6
4.6
0
.6
0.4
0
.5
2.9
0
.6
16.5
0
.3
13.6
0
.5
14.6
0
.2
6.7
0
.3
11.7
24
3
5.0
0
0
.6
6.9
0
.6
2.7
0
.5
5.2
0
.6
18.5
0
.3
10.4
0
.4
15.6
0
.5
16.6
0
.3
8.9
0
.4
13.7
25
3
7.5
0
0
.6
9.2
0
.6
5.1
0
.5
7.5
0
.9
20.4
0
.3
12.6
0
.6
17.7
0
.7
18.5
0
.3
11.2
0
.5
15.8
26
4
0.0
0
0
.6
11.4
0
.6
7.5
0
.5
9.9
1
.3
22.4
0
.5
14.8
0
.9
19.7
1
.0
20.5
0
.5
13.4
0
.7
17.8
27
4
2.5
0
0
.9
13.7
0
.6
9.9
0
.7
12.1
1
.8
24.4
0
.5
17.1
1
.1
21.8
1
.4
22.5
0
.5
15.7
0
.9
19.9
28
4
5.0
0
0
.9
16.0
0
.6
12.3
0
.7
14.4
3
.0
26.4
0
.9
19.3
2
.0
23.9
2
.2
24.5
0
.7
17.9
1
.5
22.0
29
4
7.5
0
0
.9
18.3
0
.6
14.7
0
.7
16.7
4
.0
28.4
1
.6
21.6
2
.9
25.9
2
.9
26.4
1
.2
20.1
2
.1
24.0
30
5
0.0
0
0
.9
20.5
0
.6
17.1
0
.7
19.0
5
.1
30.4
2
.3
23.8
3
.8
28.0
3
.6
28.4
1
.6
22.3
2
.7
26.1
31
5
2:.
50
1.5
2
2.8
1
.0
19.5
1
.1
21.4
7
.0
32.4
2
.5
26.1
4
.9
30.0
5
.1
30.4
1
.9
24.6
3
.6
28.1
32
5
5.0
0
1
.5
25.1
1
.4
21.9
1
.4
23.7
8
.9
34.3
3
.7
28.3
6
.5
32.1
6
.4
32.4
2
.8
26.8
4
.7
30.2
33
5
7.5
0
3
.5
27.3
1
.8
24.3
2
.6
26.0
1
2.2
3
6.3
4
.9
30.5
8
.8
34.1
9
.3
34.3
3
.7
29.0
6
.7
32.3
34
6
0.0
0
5
.3
29.6
1
.8
26.7
3
.5
28.3
1
5.5
3
8.3
6
.9
32.8
1
1.5
3
6.2
1
2.1
3
6.3
5
.0
31.3
8
.8
34.3
35
6
2.5
0
6
.4
31.8
2
.8
29.1
4
.6
30.6
1
8.5
4
0.3
9
.5
35.0
1
4.3
3
8.2
1
4.5
3
8.3
7
.1
33.5
1
1.0
3
6.4
36
6
5.0
0
8
.8
34.1
4
.3
31.5
6
.6
33.0
2
1.8
4
2.3
1
3.6
3
7.3
1
8.0
4
0.3
1
7.5
4
0.3
1
0.3
3
5.7
1
4.1
3
8.4
37
6
7.5
0
1
0.9
3
6.4
6
.9
33.9
9
.0
35.3
2
6.8
4
4.3
1
6.8
3
9.5
2
2.2
4
2.4
2
1.6
4
2.2
1
3.4
3
8.0
1
7.7
4
0.5
38
7
0.0
0
1
3.8
3
8.6
1
1.4
3
6.3
1
2.7
3
7.6
3
3.2
4
6.2
2
0.4
4
1.8
2
7.3
4
4.4
2
6.8
4
4.2
1
7.3
4
0.2
2
2.4
4
2.6
39
7
2.5
0
2
0.1
4
0.9
1
4.9
3
8.7
1
7.6
3
9.9
4
0.6
4
8.2
2
6.5
4
4.0
3
4.0
4
6.5
3
3.8
4
6.2
2
2.5
4
2.4
2
8.5
4
4.6
40
7
5.0
0
2
4.0
4
3.2
1
9.8
4
1.0
2
2.0
4
2.2
4
7.3
5
0.2
3
4.3
4
6.2
4
1.3
4
8.5
3
9.6
4
8.2
2
9.3
4
4.7
3
4.8
4
6.7
41
7
7.5
0
3
0.0
4
5.4
2
7.4
4
3.4
2
8.8
4
4.5
5
8.2
5
2:.
2
42.8
4
8.5
5
1.1
5
0.6
4
8.9
5
0.2
3
7.5
4
6.9
4
3.6
4
8.7
42
8
0.0
0
3
8.8
4
7.7
3
5.0
4
5.8
3
7.0
4
6.8
6
7.4
5
4.2
5
4.0
5
0.7
6
1.2
5
2:.
6
57.9
5
2:.
1
47.4
4
9.1
5
3.0
5
0.8
43
8
2.5
0
4
9.1
5
0.0
4
2.7
4
8.2
4
6.0
4
9.2
7
5.5
5
6.2
6
2.0
5
3.0
6
9.3
5
4.7
6
6.8
5
4.1
5
5.3
5
1.4
6
1.4
5
2:.
9
44
8
5.0
0
6
0.4
5
2:.
2
51.9
5
0.6
5
6.3
5
1.5
8
3.6
5
8.1
7
4.4
5
5.2
7
9.3
5
6.8
7
5.9
5
6.1
6
6.6
5
3.6
7
1.5
5
4.9
45
8
7.5
0
7
0.2
5
4.5
5
9.9
5
3.0
6
5.3
5
3.8
8
9.3
6
0.1
8
1.2
5
7.5
8
5.6
5
8.8
8
3.0
5
8.1
7
3.8
5
5.8
7
8.7
5
7.0
46
9
0.0
0
7
7.3
5
6.8
7
0.2
5
5.4
7
3.9
5
6.1
9
4.0
6
2.1
8
7.1
5
9.7
9
0.8
6
0.9
8
8.5
6
0.0
8
1.3
5
8.1
8
5.1
5
9.0
47
9
2.5
0
8
5.4
5
9.0
8
1.7
5
7.8
8
3.7
5
8.4
9
6.2
6
4.1
9
1.3
6
1.9
9
4.0
6
2.9
9
2.7
6
2.0
8
8.0
6
0.3
9
0.5
6
1.1
48
9
5.0
0
9
1.5
6
1.3
9
0.5
6
0.2
9
1.0
6
0.7
9
8.4
6
6.1
9
6.4
6
4.2
9
7.5
6
5.0
9
6.1
6
4.0
9
4.3
6
2.5
9
5.3
6
3.2
49
9
7.5
0
9
5.4
6
3.6
9
5.1
6
2.6
9
5.2
6
3.0
9
9.1
6
8.1
9
8.4
6
6.4
9
8.8
6
7.0
9
7.9
6
6.0
9
7.2
6
4.8
9
7.6
6
5.2
50
1
00
.00
100
.0
65.8
1
00
.0
65.0
1
00
.0
65.3
1
00
.0
70.1
1
00
.0
68.7
1
00
.0
69.1
1
00
.0
67.9
1
00
.0
67.0
1
00
.0
67.3
Tabl
e A4-
2:C
H -
Switz
erla
nd. I
ndiv
idua
l nor
m d
ata
for
KID
SCR
EE
N-1
0 In
dex
Not
e: C
alcu
latio
n of
sco
res
was
rest
ricte
d to
com
plet
e ca
ses.
PR =
per
cent
ile; T
S =
T-sc
ore
for t
he p
artic
ular
(sub
-)po
pula
tion
(M =
50.
SD
= 1
0).
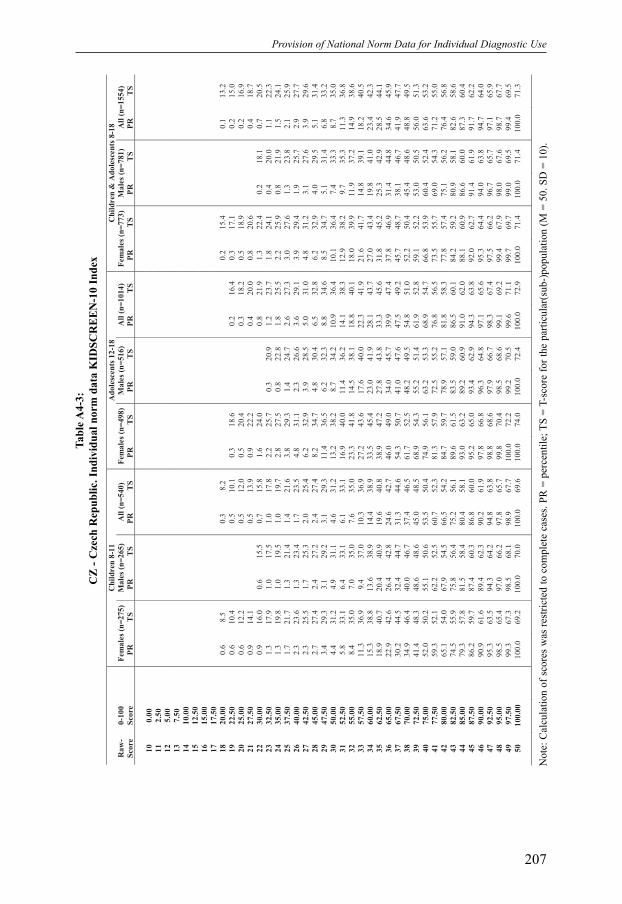
Provision of National Norm Data for Individual Diagnostic Use
207
C
hil
dren
8-1
1
Ad
ole
scen
ts 1
2-1
8
Ch
ild
ren
& A
do
lesc
en
ts 8
-18
Ra
w-
0-1
00
F
em
ale
s (n
=275
) M
ale
s (n
=265
) A
ll (
n=
540
) F
em
ale
s (n
=498
) M
ale
s (n
=516
) A
ll (
n=
1014
) F
em
ale
s (n
=773
) M
ale
s (n
=781
) A
ll (
n=
1554
)
Sco
re
Sco
re
P
R
TS
P
R
TS
P
R
TS
P
R
TS
P
R
TS
P
R
TS
P
R
TS
P
R
TS
P
R
TS
10
0
.00
11
2
.50
12
5
.00
13
7
.50
14
1
0.0
0
15
1
2.5
0
16
1
5.0
0
17
1
7.5
0
18
2
0.0
0
0
.6
8.5
0
.3
8.2
0
.2
15.4
0
.1
13.2
19
2
2.5
0
0
.6
10.4
0
.5
10.1
0
.3
18.6
0
.2
16.4
0
.3
17.1
0
.2
15.0
20
2
5.0
0
0
.6
12.2
0
.5
12.0
0
.5
20.4
0
.3
18.2
0
.5
18.9
0
.2
16.9
21
2
7.5
0
0
.9
14.1
0
.5
13.9
0
.9
22.2
0
.4
20.0
0
.8
20.6
0
.4
18.7
22
3
0.0
0
0
.9
16.0
0
.6
15.5
0
.7
15.8
1
.6
24.0
0
.8
21.9
1
.3
22.4
0
.2
18.1
0
.7
20.5
23
3
2.5
0
1
.3
17.9
1
.0
17.5
1
.0
17.8
2
.2
25.7
0
.3
20.9
1
.2
23.7
1
.8
24.1
0
.4
20.0
1
.1
22.3
24
3
5.0
0
1
.3
19.8
1
.0
19.5
1
.0
19.7
2
.8
27.5
0
.8
22.8
1
.8
25.5
2
.2
25.9
0
.8
21.9
1
.5
24.1
25
3
7.5
0
1
.7
21.7
1
.3
21.4
1
.4
21.6
3
.8
29.3
1
.4
24.7
2
.6
27.3
3
.0
27.6
1
.3
23.8
2
.1
25.9
26
4
0.0
0
2
.3
23.6
1
.3
23.4
1
.7
23.5
4
.8
31.1
2
.3
26.6
3
.6
29.1
3
.9
29.4
1
.9
25.7
2
.9
27.7
27
4
2.5
0
2
.3
25.5
1
.7
25.3
2
.0
25.4
6
.2
32.9
3
.9
28.5
5
.0
31.0
4
.8
31.2
3
.1
27.6
3
.9
29.6
28
4
5.0
0
2
.7
27.4
2
.4
27.2
2
.4
27.4
8
.2
34.7
4
.8
30.4
6
.5
32.8
6
.2
32.9
4
.0
29.5
5
.1
31.4
29
4
7.5
0
3
.4
29.3
3
.1
29.2
3
.1
29.3
1
1.4
3
6.5
6
.2
32.3
8
.8
34.6
8
.5
34.7
5
.1
31.4
6
.8
33.2
30
5
0.0
0
4
.4
31.2
4
.9
31.1
4
.6
31.2
1
3.2
3
8.2
8
.7
34.2
1
0.9
3
6.4
1
0.1
3
6.4
7
.4
33.3
8
.7
35.0
31
5
2.5
0
5
.8
33.1
6
.4
33.1
6
.1
33.1
1
6.9
4
0.0
1
1.4
3
6.2
1
4.1
3
8.3
1
2.9
3
8.2
9
.7
35.3
1
1.3
3
6.8
32
5
5.0
0
8
.4
35.0
7
.0
35.0
7
.6
35.0
2
3.3
4
1.8
1
4.5
3
8.1
1
8.8
4
0.1
1
8.0
3
9.9
1
1.9
3
7.2
1
4.9
3
8.6
33
5
7.5
0
1
1.3
3
6.9
9
.4
37.0
1
0.3
3
6.9
2
7.2
4
3.6
1
7.6
4
0.0
2
2.3
4
1.9
2
1.6
4
1.7
1
4.8
3
9.1
1
8.2
4
0.5
34
6
0.0
0
1
5.3
3
8.8
1
3.6
3
8.9
1
4.4
3
8.9
3
3.5
4
5.4
2
3.0
4
1.9
2
8.1
4
3.7
2
7.0
4
3.4
1
9.8
4
1.0
2
3.4
4
2.3
35
6
2.5
0
1
8.9
4
0.7
2
0.4
4
0.9
1
9.6
4
0.8
3
8.9
4
7.2
2
7.8
4
3.8
3
3.3
4
5.6
3
1.8
4
5.2
2
5.3
4
2.9
2
8.5
4
4.1
36
6
5.0
0
2
2.9
4
2.6
2
6.4
4
2.8
2
4.6
4
2.7
4
6.0
4
9.0
3
4.0
4
5.7
3
9.9
4
7.4
3
7.8
4
6.9
3
1.4
4
4.8
3
4.6
4
5.9
37
6
7.5
0
3
0.2
4
4.5
3
2.4
4
4.7
3
1.3
4
4.6
5
4.3
5
0.7
4
1.0
4
7.6
4
7.5
4
9.2
4
5.7
4
8.7
3
8.1
4
6.7
4
1.9
4
7.7
38
7
0.0
0
3
4.9
4
6.4
4
0.0
4
6.7
3
7.4
4
6.5
6
1.7
5
2.5
4
8.2
4
9.5
5
4.8
5
1.0
5
2.2
5
0.4
4
5.4
4
8.6
4
8.8
4
9.5
39
7
2.5
0
4
1.4
4
8.3
4
8.6
4
8.6
4
5.0
4
8.5
6
8.9
5
4.3
5
5.2
5
1.4
6
1.9
5
2.8
5
9.1
5
2.2
5
3.0
5
0.5
5
6.0
5
1.3
40
7
5.0
0
5
2.0
5
0.2
5
5.1
5
0.6
5
3.5
5
0.4
7
4.9
5
6.1
6
3.2
5
3.3
6
8.9
5
4.7
6
6.8
5
3.9
6
0.4
5
2.4
6
3.6
5
3.2
41
7
7.5
0
5
9.3
5
2.1
6
2.2
5
2.5
6
0.7
5
2.3
8
1.3
5
7.9
7
2.5
5
5.2
7
6.8
5
6.5
7
3.5
5
5.7
6
9.0
5
4.3
7
1.2
5
5.0
42
8
0.0
0
6
5.1
5
4.0
6
7.9
5
4.5
6
6.5
5
4.2
8
4.7
5
9.7
7
8.9
5
7.1
8
1.8
5
8.3
7
7.8
5
7.4
7
5.1
5
6.2
7
6.4
5
6.8
43
8
2.5
0
7
4.5
5
5.9
7
5.8
5
6.4
7
5.2
5
6.1
8
9.6
6
1.5
8
3.5
5
9.0
8
6.5
6
0.1
8
4.2
5
9.2
8
0.9
5
8.1
8
2.6
5
8.6
44
8
5.0
0
7
9.3
5
7.8
8
1.5
5
8.4
8
0.4
5
8.1
9
3.0
6
3.2
8
9.2
6
0.9
9
1.0
6
2.0
8
8.1
6
0.9
8
6.6
6
0.0
8
7.3
6
0.4
45
8
7.5
0
8
6.2
5
9.7
8
7.4
6
0.3
8
6.8
6
0.0
9
5.2
6
5.0
9
3.4
6
2.9
9
4.3
6
3.8
9
2.0
6
2.7
9
1.4
6
1.9
9
1.7
6
2.2
46
9
0.0
0
9
0.9
6
1.6
8
9.4
6
2.3
9
0.2
6
1.9
9
7.8
6
6.8
9
6.3
6
4.8
9
7.1
6
5.6
9
5.3
6
4.4
9
4.0
6
3.8
9
4.7
6
4.0
47
9
2.5
0
9
5.3
6
3.5
9
4.3
6
4.2
9
4.8
6
3.8
9
8.8
6
8.6
9
7.9
6
6.7
9
8.3
6
7.4
9
7.5
6
6.2
9
6.7
6
5.7
9
7.1
6
5.9
48
9
5.0
0
9
8.5
6
5.4
9
7.0
6
6.2
9
7.8
6
5.7
9
9.8
7
0.4
9
8.5
6
8.6
9
9.1
6
9.2
9
9.4
6
7.9
9
8.0
6
7.6
9
8.7
6
7.7
49
9
7.5
0
9
9.3
6
7.3
9
8.5
6
8.1
9
8.9
6
7.7
1
00
.0
72.2
9
9.2
7
0.5
9
9.6
7
1.1
9
9.7
6
9.7
9
9.0
6
9.5
9
9.4
6
9.5
50
1
00
.00
100
.0
69.2
1
00
.0
70.0
1
00
.0
69.6
1
00
.0
74.0
1
00
.0
72.4
1
00
.0
72.9
1
00
.0
71.4
1
00
.0
71.4
1
00
.0
71.3
Tabl
e A4-
3:C
Z -
Cze
ch R
epub
lic. I
ndiv
idua
l nor
m d
ata
KID
SCR
EE
N-1
0 In
dex
Not
e: C
alcu
latio
n of
sco
res
was
rest
ricte
d to
com
plet
e ca
ses.
PR =
per
cent
ile; T
S =
T-sc
ore
for t
he p
artic
ular
(sub
-)po
pula
tion
(M =
50.
SD
= 1
0).
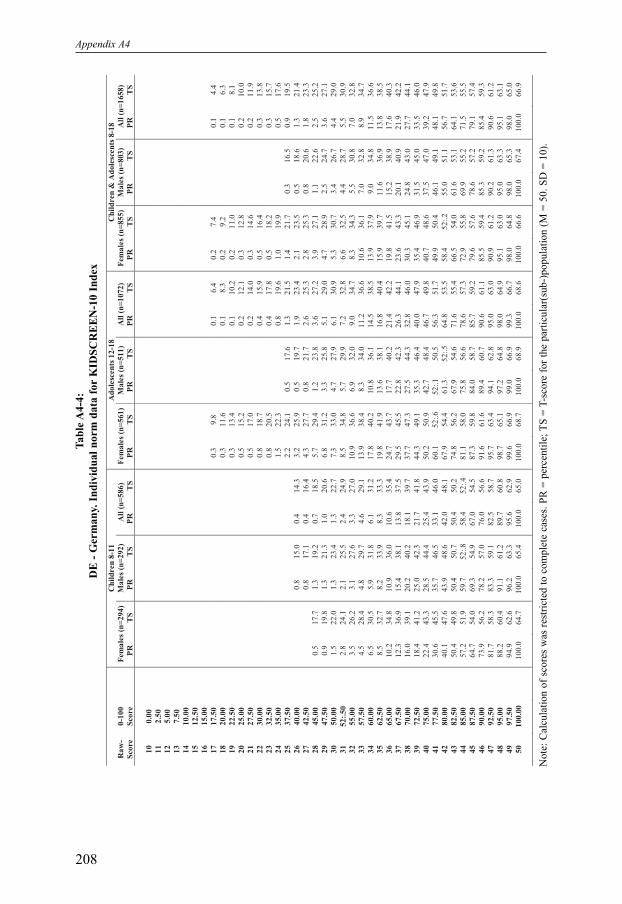
Appendix A4
208
C
hil
dren
8-1
1
Ad
ole
scen
ts 1
2-1
8
Ch
ild
ren
& A
do
lesc
en
ts 8
-18
Ra
w-
0-1
00
F
em
ale
s (n
=294
) M
ale
s (n
=292
) A
ll (
n=
586
) F
em
ale
s (n
=561
) M
ale
s (n
=511
) A
ll (
n=
1072
) F
em
ale
s (n
=855
) M
ale
s (n
=803
) A
ll (
n=
1658
)
Sco
re
Sco
re
P
R
TS
P
R
TS
P
R
TS
P
R
TS
P
R
TS
P
R
TS
P
R
TS
P
R
TS
P
R
TS
10
0
.00
11
2
.50
12
5
.00
13
7
.50
14
1
0.0
0
15
1
2.5
0
16
1
5.0
0
17
1
7.5
0
0
.3
9.8
0
.1
6.4
0
.2
7.4
0
.1
4.4
18
2
0.0
0
0
.3
11.6
0
.1
8.3
0
.2
9.2
0
.1
6.3
19
2
2.5
0
0
.3
13.4
0
.1
10.2
0
.2
11.0
0
.1
8.1
20
2
5.0
0
0
.5
15.2
0
.2
12.1
0
.3
12.8
0
.2
10.0
21
2
7.5
0
0
.5
17.0
0
.2
14.0
0
.3
14.6
0
.2
11.9
22
3
0.0
0
0
.8
18.7
0
.4
15.9
0
.5
16.4
0
.3
13.8
23
3
2.5
0
0
.8
20.5
0
.4
17.8
0
.5
18.2
0
.3
15.7
24
3
5.0
0
1
.5
22.3
0
.8
19.6
1
.0
19.9
0
.5
17.6
25
3
7.5
0
2
.2
24.1
0
.5
17.6
1
.3
21.5
1
.4
21.7
0
.3
16.5
0
.9
19.5
26
4
0.0
0
0
.8
15.0
0
.4
14.3
3
.2
25.9
0
.5
19.7
1
.9
23.4
2
.1
23.5
0
.5
18.6
1
.3
21.4
27
4
2.5
0
0
.8
17.1
0
.4
16.4
4
.3
27.7
0
.8
21.7
2
.6
25.3
2
.8
25.3
0
.8
20.6
1
.8
23.3
28
4
5.0
0
0
.5
17.7
1
.3
19.2
0
.7
18.5
5
.7
29.4
1
.2
23.8
3
.6
27.2
3
.9
27.1
1
.1
22.6
2
.5
25.2
29
4
7.5
0
0
.9
19.8
1
.3
21.3
1
.0
20.6
6
.8
31.2
3
.3
25.8
5
.1
29.0
4
.7
28.9
2
.5
24.7
3
.6
27.1
30
5
0.0
0
1
.5
22.0
1
.3
23.4
1
.3
22.7
7
.3
33.0
4
.7
27.9
6
.1
30.9
5
.3
30.7
3
.4
26.7
4
.4
29.0
31
5
2:.
50
2.8
2
4.1
2
.1
25.5
2
.4
24.9
8
.5
34.8
5
.7
29.9
7
.2
32.8
6
.6
32.5
4
.4
28.7
5
.5
30.9
32
5
5.0
0
3
.5
26.2
3
.1
27.6
3
.3
27.0
1
0.9
3
6.6
6
.9
32.0
9
.0
34.7
8
.3
34.3
5
.5
30.8
7
.0
32.8
33
5
7.5
0
4
.5
28.4
4
.8
29.7
4
.6
29.1
1
3.9
3
8.4
8
.3
34.0
1
1.2
3
6.6
1
0.6
3
6.1
7
.0
32.8
8
.9
34.7
34
6
0.0
0
6
.5
30.5
5
.9
31.8
6
.1
31.2
1
7.8
4
0.2
1
0.8
3
6.1
1
4.5
3
8.5
1
3.9
3
7.9
9
.0
34.8
1
1.5
3
6.6
35
6
2.5
0
8
.5
32.7
8
.2
33.9
8
.3
33.3
1
9.8
4
1.9
1
3.6
3
8.1
1
6.8
4
0.4
1
5.9
3
9.7
1
1.6
3
6.9
1
3.8
3
8.5
36
6
5.0
0
1
0.2
3
4.8
1
0.9
3
6.0
1
0.6
3
5.4
2
4.7
4
3.7
1
7.7
4
0.2
2
1.4
4
2.2
1
9.8
4
1.5
1
5.2
3
8.9
1
7.6
4
0.3
37
6
7.5
0
1
2.3
3
6.9
1
5.4
3
8.1
1
3.8
3
7.5
2
9.5
4
5.5
2
2.8
4
2.3
2
6.3
4
4.1
2
3.6
4
3.3
2
0.1
4
0.9
2
1.9
4
2.2
38
7
0.0
0
1
6.0
3
9.1
2
0.2
4
0.2
1
8.1
3
9.7
3
7.7
4
7.3
2
7.5
4
4.3
3
2.8
4
6.0
3
0.3
4
5.1
2
4.8
4
3.0
2
7.7
4
4.1
39
7
2.5
0
1
8.4
4
1.2
2
5.0
4
2.3
2
1.7
4
1.8
4
4.3
4
9.1
3
5.3
4
6.4
4
0.0
4
7.9
3
5.4
4
6.9
3
1.5
4
5.0
3
3.5
4
6.0
40
7
5.0
0
2
2.4
4
3.3
2
8.5
4
4.4
2
5.4
4
3.9
5
0.2
5
0.9
4
2.7
4
8.4
4
6.7
4
9.8
4
0.7
4
8.6
3
7.5
4
7.0
3
9.2
4
7.9
41
7
7.5
0
3
0.6
4
5.5
3
5.7
4
6.5
3
3.1
4
6.0
6
0.1
5
2:.
6
52
:.1
5
0.5
5
6.3
5
1.7
4
9.9
5
0.4
4
6.1
4
9.1
4
8.1
4
9.8
42
8
0.0
0
4
0.1
4
7.6
4
3.9
4
8.6
4
2.0
4
8.1
6
7.9
5
4.4
6
1.3
5
2:.
5
64.8
5
3.5
5
8.4
5
2:.
2
55.0
5
1.1
5
6.7
5
1.7
43
8
2.5
0
5
0.4
4
9.8
5
0.4
5
0.7
5
0.4
5
0.2
7
4.8
5
6.2
6
7.9
5
4.6
7
1.6
5
5.4
6
6.5
5
4.0
6
1.6
5
3.1
6
4.1
5
3.6
44
8
5.0
0
5
7.2
5
1.9
5
9.7
5
2:.
8
58.4
5
2:.
4
81.1
5
8.0
7
5.8
5
6.6
7
8.6
5
7.3
7
2.9
5
5.8
6
9.9
5
5.2
7
1.5
5
5.5
45
8
7.5
0
6
4.7
5
4.0
6
9.3
5
4.9
6
7.0
5
4.5
8
7.3
5
9.8
8
4.0
5
8.7
8
5.7
5
9.2
7
9.6
5
7.6
7
8.6
5
7.2
7
9.1
5
7.4
46
9
0.0
0
7
3.9
5
6.2
7
8.2
5
7.0
7
6.0
5
6.6
9
1.6
6
1.6
8
9.4
6
0.7
9
0.6
6
1.1
8
5.5
5
9.4
8
5.3
5
9.2
8
5.4
5
9.3
47
9
2.5
0
8
1.7
5
8.3
8
3.3
5
9.1
8
2.5
5
8.7
9
5.7
6
3.4
9
4.1
6
2.8
9
5.0
6
3.0
9
0.9
6
1.2
9
0.2
6
1.3
9
0.6
6
1.2
48
9
5.0
0
8
8.2
6
0.4
9
1.1
6
1.2
8
9.7
6
0.8
9
8.7
6
5.1
9
7.2
6
4.8
9
8.0
6
4.9
9
5.1
6
3.0
9
5.0
6
3.3
9
5.1
6
3.1
49
9
7.5
0
9
4.9
6
2.6
9
6.2
6
3.3
9
5.6
6
2.9
9
9.6
6
6.9
9
9.0
6
6.9
9
9.3
6
6.7
9
8.0
6
4.8
9
8.0
6
5.3
9
8.0
6
5.0
50
1
00
.00
100
.0
64.7
1
00
.0
65.4
1
00
.0
65.0
1
00
.0
68.7
1
00
.0
68.9
1
00
.0
68.6
1
00
.0
66.6
1
00
.0
67.4
1
00
.0
66.9
Tabl
e A4-
4:D
E -
Ger
man
y. In
divi
dual
nor
m d
ata
for
KID
SCR
EE
N-1
0 In
dex
Not
e: C
alcu
latio
n of
sco
res
was
rest
ricte
d to
com
plet
e ca
ses.
PR =
per
cent
ile; T
S =
T-sc
ore
for t
he p
artic
ular
(sub
-)po
pula
tion
(M =
50.
SD
= 1
0).
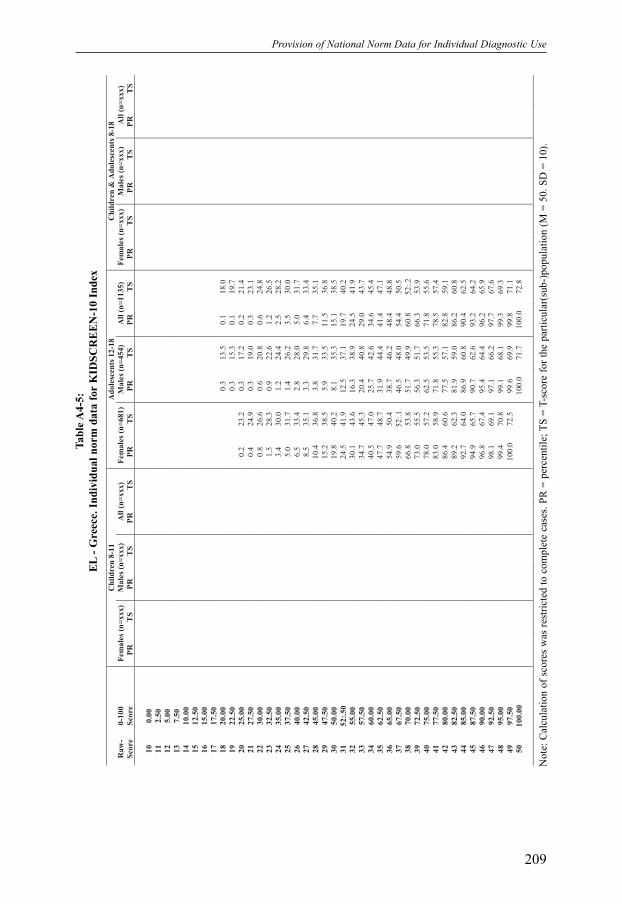
Provision of National Norm Data for Individual Diagnostic Use
209
C
hil
dren
8-1
1
Ad
ole
scen
ts 1
2-1
8
Ch
ild
ren
& A
do
lesc
en
ts 8
-18
Ra
w-
0-1
00
F
em
ale
s (n
=xxx)
Ma
les
(n=
xxx)
All
(n
=xxx)
Fem
ale
s (n
=681
) M
ale
s (n
=454
) A
ll (
n=
1135
) F
em
ale
s (n
=xxx)
Ma
les
(n=
xxx)
All
(n
=xxx)
Sco
re
Sco
re
P
R
TS
P
R
TS
P
R
TS
P
R
TS
P
R
TS
P
R
TS
P
R
TS
P
R
TS
P
R
TS
10
0
.00
11
2
.50
12
5
.00
13
7
.50
14
1
0.0
0
15
1
2.5
0
16
1
5.0
0
17
1
7.5
0
18
2
0.0
0
0
.3
13.5
0
.1
18.0
19
2
2.5
0
0
.3
15.3
0
.1
19.7
20
2
5.0
0
0
.2
23.2
0
.3
17.2
0
.2
21.4
21
2
7.5
0
0
.4
24.9
0
.3
19.0
0
.3
23.1
22
3
0.0
0
0
.8
26.6
0
.6
20.8
0
.6
24.8
23
3
2.5
0
1
.5
28.3
0
.9
22.6
1
.2
26.5
24
3
5.0
0
3
.4
30.0
1
.2
24.4
2
.5
28.2
25
3
7.5
0
5
.0
31.7
1
.4
26.2
3
.5
30.0
26
4
0.0
0
6
.5
33.4
2
.8
28.0
5
.0
31.7
27
4
2.5
0
8
.5
35.1
3
.3
29.8
6
.4
33.4
28
4
5.0
0
1
0.4
3
6.8
3
.8
31.7
7
.7
35.1
29
4
7.5
0
1
5.2
3
8.5
5
.9
33.5
1
1.5
3
6.8
30
5
0.0
0
1
9.8
4
0.2
8
.1
35.3
1
5.1
3
8.5
31
5
2:.
50
24.5
4
1.9
1
2.5
3
7.1
1
9.7
4
0.2
32
5
5.0
0
3
0.1
4
3.6
1
6.3
3
8.9
2
4.5
4
1.9
33
5
7.5
0
3
4.7
4
5.3
2
0.4
4
0.8
2
9.0
4
3.7
34
6
0.0
0
4
0.5
4
7.0
2
5.7
4
2.6
3
4.6
4
5.4
35
6
2.5
0
4
7.7
4
8.7
3
1.9
4
4.4
4
1.4
4
7.1
36
6
5.0
0
5
4.9
5
0.4
3
8.7
4
6.2
4
8.4
4
8.8
37
6
7.5
0
5
9.6
5
2:.
1
46.5
4
8.0
5
4.4
5
0.5
38
7
0.0
0
6
6.8
5
3.8
5
1.7
4
9.9
6
0.8
5
2:.
2
39
7
2.5
0
7
3.0
5
5.5
5
6.3
5
1.7
6
6.3
5
3.9
40
7
5.0
0
7
8.0
5
7.2
6
2.5
5
3.5
7
1.8
5
5.6
41
7
7.5
0
8
3.0
5
8.9
7
1.8
5
5.3
7
8.5
5
7.4
42
8
0.0
0
8
6.4
6
0.6
7
7.5
5
7.1
8
2.8
5
9.1
43
8
2.5
0
8
9.2
6
2.3
8
1.9
5
9.0
8
6.2
6
0.8
44
8
5.0
0
9
2.7
6
4.0
8
6.9
6
0.8
9
0.4
6
2.5
45
8
7.5
0
9
4.9
6
5.7
9
0.7
6
2.6
9
3.2
6
4.2
46
9
0.0
0
9
6.8
6
7.4
9
5.4
6
4.4
9
6.2
6
5.9
47
9
2.5
0
9
8.1
6
9.1
9
7.1
6
6.2
9
7.7
6
7.6
48
9
5.0
0
9
9.4
7
0.8
9
9.1
6
8.1
9
9.3
6
9.3
49
9
7.5
0
1
00
.0
72.5
9
9.6
6
9.9
9
9.8
7
1.1
50
1
00
.00
100
.0
71.7
1
00
.0
72.8
Tabl
e A4-
5:
EL
- Gre
ece.
Indi
vidu
al n
orm
dat
a fo
rK
IDSC
RE
EN
-10
Inde
x
Not
e: C
alcu
latio
n of
sco
res
was
rest
ricte
d to
com
plet
e ca
ses.
PR =
per
cent
ile; T
S =
T-sc
ore
for t
he p
artic
ular
(sub
-)po
pula
tion
(M =
50.
SD
= 1
0).
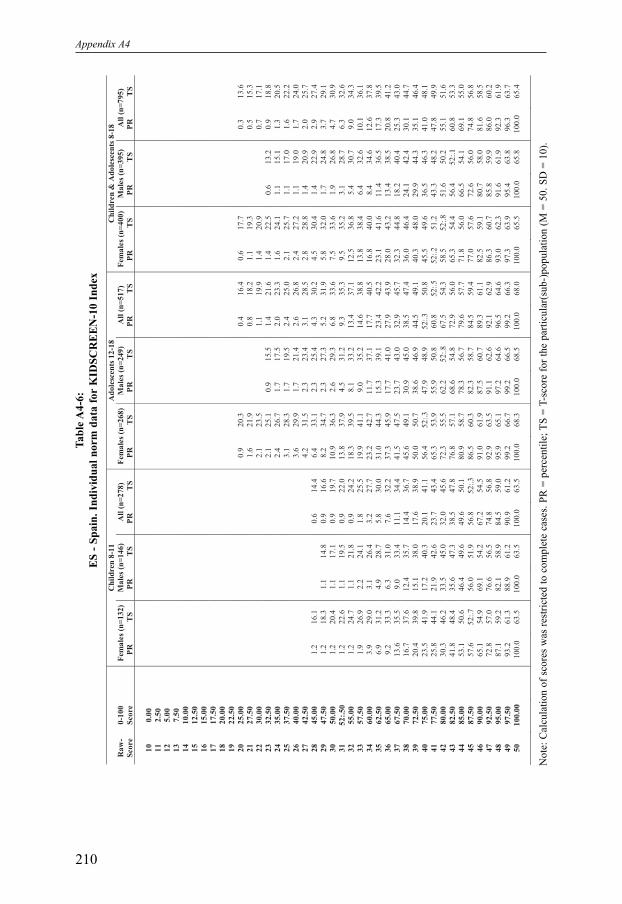
Appendix A4
210
C
hil
dren
8-1
1
Ad
ole
scen
ts 1
2-1
8
Ch
ild
ren
& A
do
lesc
en
ts 8
-18
Ra
w-
0-1
00
F
em
ale
s (n
=132
) M
ale
s (n
=146
) A
ll (
n=
278
) F
em
ale
s (n
=268
) M
ale
s (n
=249
) A
ll (
n=
517
) F
em
ale
s (n
=400
) M
ale
s (n
=395
) A
ll (
n=
795
)
Sco
re
Sco
re
P
R
TS
P
R
TS
P
R
TS
P
R
TS
P
R
TS
P
R
TS
P
R
TS
P
R
TS
P
R
TS
10
0
.00
11
2
.50
12
5
.00
13
7
.50
14
1
0.0
0
15
1
2.5
0
16
1
5.0
0
17
1
7.5
0
18
2
0.0
0
19
2
2.5
0
20
2
5.0
0
0
.9
20.3
0
.4
16.4
0
.6
17.7
0
.3
13.6
21
2
7.5
0
1
.6
21.9
0
.8
18.2
1
.1
19.3
0
.5
15.3
22
3
0.0
0
2
.1
23.5
1
.1
19.9
1
.4
20.9
0
.7
17.1
23
3
2.5
0
2
.1
25.1
0
.9
15.5
1
.4
21.6
1
.4
22.5
0
.6
13.2
0
.9
18.8
24
3
5.0
0
2
.4
26.7
1
.7
17.5
2
.0
23.3
1
.6
24.1
1
.1
15.1
1
.3
20.5
25
3
7.5
0
3
.1
28.3
1
.7
19.5
2
.4
25.0
2
.1
25.7
1
.1
17.0
1
.6
22.2
26
4
0.0
0
3
.6
29.9
1
.7
21.4
2
.6
26.8
2
.4
27.2
1
.1
19.0
1
.7
24.0
27
4
2.5
0
4
.2
31.5
2
.3
23.4
3
.1
28.5
2
.8
28.8
1
.4
20.9
2
.0
25.7
28
4
5.0
0
1
.2
16.1
0
.6
14.4
6
.4
33.1
2
.3
25.4
4
.3
30.2
4
.5
30.4
1
.4
22.9
2
.9
27.4
29
4
7.5
0
1
.2
18.3
1
.1
14.8
0
.9
16.6
8
.2
34.7
2
.3
27.3
5
.2
31.9
5
.8
32.0
1
.7
24.8
3
.7
29.1
30
5
0.0
0
1
.2
20.4
1
.1
17.1
0
.9
19.7
1
0.9
3
6.3
2
.6
29.3
6
.8
33.6
7
.5
33.6
1
.9
26.8
4
.7
30.9
31
5
2:.
50
1.2
2
2.6
1
.1
19.5
0
.9
22.0
1
3.8
3
7.9
4
.5
31.2
9
.3
35.3
9
.5
35.2
3
.1
28.7
6
.3
32.6
32
5
5.0
0
1
.2
24.7
1
.1
21.8
0
.9
24.2
1
8.3
3
9.5
8
.1
33.2
1
3.4
3
7.1
1
2.5
3
6.8
5
.4
30.7
9
.0
34.3
33
5
7.5
0
1
.9
26.9
2
.2
24.1
1
.8
25.5
1
9.9
4
1.1
9
.0
35.2
1
4.6
3
8.8
1
3.8
3
8.4
6
.4
32.6
1
0.1
3
6.1
34
6
0.0
0
3
.9
29.0
3
.1
26.4
3
.2
27.7
2
3.2
4
2.7
1
1.7
3
7.1
1
7.7
4
0.5
1
6.8
4
0.0
8
.4
34.6
1
2.6
3
7.8
35
6
2.5
0
6
.9
31.2
4
.9
28.7
5
.8
30.0
3
1.0
4
4.3
1
5.3
3
9.1
2
3.4
4
2.2
2
3.1
4
1.6
1
1.4
3
6.5
1
7.3
3
9.5
36
6
5.0
0
9
.2
33.3
6
.3
31.0
7
.6
32.2
3
7.3
4
5.9
1
7.7
4
1.0
2
7.9
4
3.9
2
8.0
4
3.2
1
3.4
3
8.5
2
0.8
4
1.2
37
6
7.5
0
1
3.6
3
5.5
9
.0
33.4
1
1.1
3
4.4
4
1.5
4
7.5
2
3.7
4
3.0
3
2.9
4
5.7
3
2.3
4
4.8
1
8.2
4
0.4
2
5.3
4
3.0
38
7
0.0
0
1
6.7
3
7.6
1
2.4
3
5.7
1
4.4
3
6.7
4
5.6
4
9.1
3
0.9
4
5.0
3
8.5
4
7.4
3
6.0
4
6.4
2
4.1
4
2.4
3
0.1
4
4.7
39
7
2.5
0
2
0.4
3
9.8
1
5.1
3
8.0
1
7.6
3
8.9
5
0.0
5
0.7
3
8.6
4
6.9
4
4.5
4
9.1
4
0.3
4
8.0
2
9.9
4
4.3
3
5.1
4
6.4
40
7
5.0
0
2
3.5
4
1.9
1
7.2
4
0.3
2
0.1
4
1.1
5
6.4
5
2:.
3
47.9
4
8.9
5
2:.
3
50.8
4
5.5
4
9.6
3
6.5
4
6.3
4
1.0
4
8.1
41
7
7.5
0
2
5.8
4
4.1
2
1.9
4
2.6
2
3.7
4
3.4
6
5.3
5
3.9
5
5.9
5
0.8
6
0.8
5
2:.
5
52
:.2
5
1.2
4
3.3
4
8.2
4
7.8
4
9.9
42
8
0.0
0
3
0.3
4
6.2
3
3.5
4
5.0
3
2.0
4
5.6
7
2.3
5
5.5
6
2.2
5
2:.
8
67.5
5
4.3
5
8.5
5
2:.
8
51.6
5
0.2
5
5.1
5
1.6
43
8
2.5
0
4
1.8
4
8.4
3
5.6
4
7.3
3
8.5
4
7.8
7
6.8
5
7.1
6
8.6
5
4.8
7
2.9
5
6.0
6
5.3
5
4.4
5
6.4
5
2:.
1
60.8
5
3.3
44
8
5.0
0
5
3.1
5
0.6
4
6.4
4
9.6
4
9.6
5
0.1
8
0.9
5
8.7
7
8.3
5
6.7
7
9.6
5
7.7
7
1.8
5
6.0
6
6.5
5
4.1
6
9.1
5
5.0
45
8
7.5
0
5
7.6
5
2:.
7
56.0
5
1.9
5
6.8
5
2:.
3
86.5
6
0.3
8
2.3
5
8.7
8
4.5
5
9.4
7
7.0
5
7.6
7
2.6
5
6.0
7
4.8
5
6.8
46
9
0.0
0
6
5.1
5
4.9
6
9.1
5
4.2
6
7.2
5
4.5
9
1.0
6
1.9
8
7.5
6
0.7
8
9.3
6
1.1
8
2.5
5
9.1
8
0.7
5
8.0
8
1.6
5
8.5
47
9
2.5
0
7
2.8
5
7.0
7
6.6
5
6.5
7
4.8
5
6.8
9
2.9
6
3.5
9
1.1
6
2.6
9
2.1
6
2.9
8
6.3
6
0.7
8
5.8
5
9.9
8
6.0
6
0.2
48
9
5.0
0
8
7.1
5
9.2
8
2.1
5
8.9
8
4.5
5
9.0
9
5.9
6
5.1
9
7.2
6
4.6
9
6.5
6
4.6
9
3.0
6
2.3
9
1.6
6
1.9
9
2.3
6
1.9
49
9
7.5
0
9
3.2
6
1.3
8
8.9
6
1.2
9
0.9
6
1.2
9
9.2
6
6.7
9
9.2
6
6.5
9
9.2
6
6.3
9
7.3
6
3.9
9
5.4
6
3.8
9
6.3
6
3.7
50
1
00
.00
100
.0
63.5
1
00
.0
63.5
1
00
.0
63.5
1
00
.0
68.3
1
00
.0
68.5
1
00
.0
68.0
1
00
.0
65.5
1
00
.0
65.8
1
00
.0
65.4
Tabl
e A4-
6:
ES
- Spa
in. I
ndiv
idua
l nor
m d
ata
for
KID
SCR
EE
N-1
0 In
dex
Not
e: C
alcu
latio
n of
sco
res
was
rest
ricte
d to
com
plet
e ca
ses.
PR =
per
cent
ile; T
S =
T-sc
ore
for t
he p
artic
ular
(sub
-)po
pula
tion
(M =
50.
SD
= 1
0).
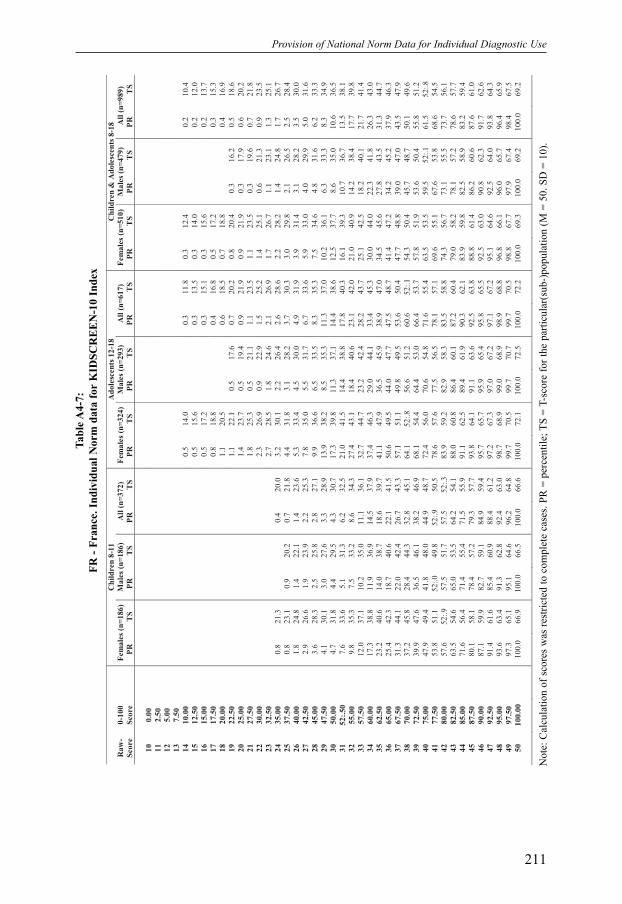
Provision of National Norm Data for Individual Diagnostic Use
211
C
hil
dren
8-1
1
Ad
ole
scen
ts 1
2-1
8
Ch
ild
ren
& A
do
lesc
en
ts 8
-18
Ra
w-
0-1
00
F
em
ale
s (n
=186
) M
ale
s (n
=186
) A
ll (
n=
372
) F
em
ale
s (n
=324
) M
ale
s (n
=293
) A
ll (
n=
617
) F
em
ale
s (n
=510
) M
ale
s (n
=479
) A
ll (
n=
989
)
Sco
re
Sco
re
P
R
TS
P
R
TS
P
R
TS
P
R
TS
P
R
TS
P
R
TS
P
R
TS
P
R
TS
P
R
TS
10
0
.00
11
2
.50
12
5
.00
13
7
.50
14
1
0.0
0
0
.5
14.0
0
.3
11.8
0
.3
12.4
0
.2
10.4
15
1
2.5
0
0
.5
15.6
0
.3
13.5
0
.3
14.0
0
.2
12.0
16
1
5.0
0
0
.5
17.2
0
.3
15.1
0
.3
15.6
0
.2
13.7
17
1
7.5
0
0
.8
18.8
0
.4
16.8
0
.5
17.2
0
.3
15.3
18
2
0.0
0
1
.1
20.5
0
.6
18.5
0
.7
18.8
0
.4
16.9
19
2
2.5
0
1
.1
22.1
0
.5
17.6
0
.7
20.2
0
.8
20.4
0
.3
16.2
0
.5
18.6
20
2
5.0
0
1
.4
23.7
0
.5
19.4
0
.9
21.9
0
.9
21.9
0
.3
17.9
0
.6
20.2
21
2
7.5
0
1
.8
25.3
0
.5
21.1
1
.1
23.5
1
.1
23.5
0
.3
19.6
0
.7
21.8
22
3
0.0
0
2
.3
26.9
0
.9
22.9
1
.5
25.2
1
.4
25.1
0
.6
21.3
0
.9
23.5
23
3
2.5
0
2
.7
28.5
1
.8
24.6
2
.1
26.9
1
.7
26.7
1
.1
23.1
1
.3
25.1
24
3
5.0
0
0
.8
21.3
0
.4
20.0
3
.2
30.1
2
.2
26.4
2
.6
28.6
2
.2
28.2
1
.4
24.8
1
.7
26.7
25
3
7.5
0
0
.8
23.1
0
.9
20.2
0
.7
21.8
4
.4
31.8
3
.1
28.2
3
.7
30.3
3
.0
29.8
2
.1
26.5
2
.5
28.4
26
4
0.0
0
1
.8
24.8
1
.4
22.1
1
.4
23.6
5
.3
33.4
4
.5
30.0
4
.9
31.9
3
.9
31.4
3
.1
28.2
3
.5
30.0
27
4
2.5
0
2
.9
26.6
1
.9
23.9
2
.2
25.3
7
.8
35.0
5
.5
31.7
6
.7
33.6
5
.9
33.0
4
.0
29.9
5
.0
31.6
28
4
5.0
0
3
.6
28.3
2
.5
25.8
2
.8
27.1
9
.9
36.6
6
.5
33.5
8
.3
35.3
7
.5
34.6
4
.8
31.6
6
.2
33.3
29
4
7.5
0
4
.1
30.1
3
.0
27.6
3
.3
28.9
1
3.9
3
8.2
8
.5
35.3
1
1.3
3
7.0
1
0.2
3
6.1
6
.3
33.3
8
.3
34.9
30
5
0.0
0
4
.7
31.8
4
.4
29.5
4
.3
30.7
1
7.3
3
9.8
1
1.3
3
7.1
1
4.4
3
8.6
1
2.5
3
7.7
8
.6
35.0
1
0.6
3
6.5
31
5
2:.
50
7.6
3
3.6
5
.1
31.3
6
.2
32.5
2
1.0
4
1.5
1
4.4
3
8.8
1
7.8
4
0.3
1
6.1
3
9.3
1
0.7
3
6.7
1
3.5
3
8.1
32
5
5.0
0
9
.8
35.3
7
.5
33.2
8
.6
34.3
2
7.4
4
3.1
1
8.4
4
0.6
2
3.1
4
2.0
2
1.0
4
0.9
1
4.2
3
8.4
1
7.7
3
9.8
33
5
7.5
0
1
2.0
3
7.1
1
0.2
3
5.0
1
1.1
3
6.1
3
2.7
4
4.7
2
3.2
4
2.4
2
8.2
4
3.7
2
5.1
4
2.5
1
8.2
4
0.1
2
1.7
4
1.4
34
6
0.0
0
1
7.3
3
8.8
1
1.9
3
6.9
1
4.5
3
7.9
3
7.4
4
6.3
2
9.0
4
4.1
3
3.4
4
5.3
3
0.0
4
4.0
2
2.3
4
1.8
2
6.3
4
3.0
35
6
2.5
0
2
3.2
4
0.6
1
4.0
3
8.7
1
8.6
3
9.7
4
1.1
4
7.9
3
6.5
4
5.9
3
8.9
4
7.0
3
4.5
4
5.6
2
7.8
4
3.5
3
1.3
4
4.7
36
6
5.0
0
2
5.4
4
2.3
1
8.7
4
0.6
2
2.1
4
1.5
5
0.6
4
9.5
4
4.0
4
7.7
4
7.5
4
8.7
4
1.4
4
7.2
3
4.2
4
5.2
3
7.9
4
6.3
37
6
7.5
0
3
1.3
4
4.1
2
2.0
4
2.4
2
6.7
4
3.3
5
7.1
5
1.1
4
9.8
4
9.5
5
3.6
5
0.4
4
7.7
4
8.8
3
9.0
4
7.0
4
3.5
4
7.9
38
7
0.0
0
3
7.2
4
5.8
2
8.4
4
4.3
3
2.8
4
5.1
6
4.1
5
2:.
8
56.6
5
1.2
6
0.6
5
2:.
1
54.3
5
0.4
4
5.7
4
8.7
5
0.1
4
9.6
39
7
2.5
0
3
9.9
4
7.6
3
6.5
4
6.1
3
8.2
4
6.9
6
8.1
5
4.4
6
4.4
5
3.0
6
6.4
5
3.7
5
7.8
5
1.9
5
3.6
5
0.4
5
5.8
5
1.2
40
7
5.0
0
4
7.9
4
9.4
4
1.8
4
8.0
4
4.9
4
8.7
7
2.4
5
6.0
7
0.6
5
4.8
7
1.6
5
5.4
6
3.5
5
3.5
5
9.5
5
2:.
1
61.5
5
2:.
8
41
7
7.5
0
5
3.8
5
1.1
5
2:.
0
49.8
5
2:.
9
50.5
7
8.6
5
7.6
7
7.5
5
6.5
7
8.1
5
7.1
6
9.6
5
5.1
6
7.6
5
3.8
6
8.6
5
4.5
42
8
0.0
0
5
7.6
5
2:.
9
57.5
5
1.7
5
7.5
5
2:.
3
83.9
5
9.2
8
2.9
5
8.3
8
3.5
5
8.8
7
4.3
5
6.7
7
3.1
5
5.5
7
3.7
5
6.1
43
8
2.5
0
6
3.5
5
4.6
6
5.0
5
3.5
6
4.2
5
4.1
8
8.0
6
0.8
8
6.4
6
0.1
8
7.2
6
0.4
7
9.0
5
8.2
7
8.1
5
7.2
7
8.6
5
7.7
44
8
5.0
0
7
1.6
5
6.4
7
1.4
5
5.4
7
1.5
5
5.9
9
1.1
6
2.5
8
9.4
6
1.9
9
0.3
6
2.1
8
3.9
5
9.8
8
2.5
5
8.9
8
3.2
5
9.4
45
8
7.5
0
8
0.1
5
8.1
7
8.4
5
7.2
7
9.3
5
7.7
9
3.8
6
4.1
9
1.1
6
3.6
9
2.5
6
3.8
8
8.8
6
1.4
8
6.2
6
0.6
8
7.6
6
1.0
46
9
0.0
0
8
7.1
5
9.9
8
2.7
5
9.1
8
4.9
5
9.4
9
5.7
6
5.7
9
5.9
6
5.4
9
5.8
6
5.5
9
2.5
6
3.0
9
0.8
6
2.3
9
1.7
6
2.6
47
9
2.5
0
9
1.4
6
1.6
8
5.4
6
0.9
8
8.4
6
1.2
9
7.2
6
7.3
9
7.0
6
7.2
9
7.1
6
7.2
9
5.1
6
4.6
9
2.5
6
4.0
9
3.8
6
4.3
48
9
5.0
0
9
3.6
6
3.4
9
1.3
6
2.8
9
2.4
6
3.0
9
8.7
6
8.9
9
9.0
6
8.9
9
8.9
6
8.8
9
6.8
6
6.1
9
6.0
6
5.7
9
6.4
6
5.9
49
9
7.5
0
9
7.3
6
5.1
9
5.1
6
4.6
9
6.2
6
4.8
9
9.7
7
0.5
9
9.7
7
0.7
9
9.7
7
0.5
9
8.8
6
7.7
9
7.9
6
7.4
9
8.4
6
7.5
50
1
00
.00
100
.0
66.9
1
00
.0
66.5
1
00
.0
66.6
1
00
.0
72.1
1
00
.0
72.5
1
00
.0
72.2
1
00
.0
69.3
1
00
.0
69.2
1
00
.0
69.2
Tabl
e A4-
7:
FR -
Fran
ce. I
ndiv
idua
l Nor
m d
ata
for
KID
SCR
EE
N-1
0 In
dex
Not
e: C
alcu
latio
n of
sco
res
was
rest
ricte
d to
com
plet
e ca
ses.
PR =
per
cent
ile; T
S =
T-sc
ore
for t
he p
artic
ular
(sub
-)po
pula
tion
(M =
50.
SD
= 1
0).
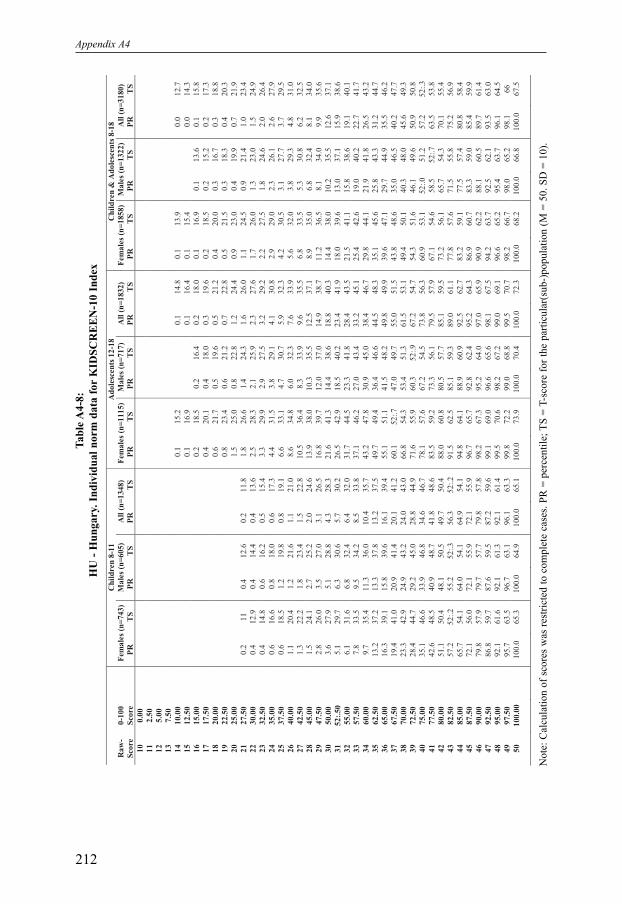
Appendix A4
212
C
hil
dre
n 8
-11
A
do
lesc
ents
12
-18
C
hil
dre
n &
Ad
ole
scen
ts 8
-18
Ra
w-
0-1
00
F
ema
les
(n=
743
) M
ale
s (n
=605
) A
ll (
n=
1348
) F
ema
les
(n=
111
5)
Ma
les
(n=
717
) A
ll (
n=
1832
) F
ema
les
(n=
185
8)
Ma
les
(n=
132
2)
All
(n
=3
180
)
Sco
re
Sco
re
P
R
TS
P
R
TS
P
R
TS
P
R
TS
P
R
TS
P
R
TS
P
R
TS
P
R
TS
P
R
TS
10
0
.00
11
2
.50
12
5
.00
13
7
.50
14
1
0.0
0
0
.1
15.2
0
.1
14.8
0
.1
13.9
0
.0
12.7
15
1
2.5
0
0
.1
16.9
0
.1
16.4
0
.1
15.4
0
.0
14.3
16
1
5.0
0
0
.2
18.5
0
.2
16.4
0
.2
18.0
0
.1
16.9
0
.1
13.6
0
.1
15.8
17
1
7.5
0
0
.4
20.1
0
.4
18.0
0
.3
19.6
0
.2
18.5
0
.2
15.2
0
.2
17.3
18
2
0.0
0
0
.6
21.7
0
.5
19.6
0
.5
21.2
0
.4
20.0
0
.3
16.7
0
.3
18.8
19
2
2.5
0
0
.8
23.4
0
.6
21.2
0
.7
22.8
0
.5
21.5
0
.3
18.3
0
.4
20.3
20
2
5.0
0
1
.5
25.0
0
.8
22.8
1
.2
24.4
0
.9
23.0
0
.4
19.9
0
.7
21.9
21
2
7.5
0
0
.2
11
0
.4
12.6
0
.2
11.8
1
.8
26.6
1
.4
24.3
1
.6
26.0
1
.1
24.5
0
.9
21.4
1
.0
23.4
22
3
0.0
0
0
.4
12.9
0
.4
14.4
0
.4
13.6
2
.5
28.3
2
.1
25.9
2
.3
27.6
1
.7
26.0
1
.3
23.0
1
.5
24.9
23
3
2.5
0
0
.4
14.8
0
.6
16.2
0
.5
15.4
3
.3
29.9
2
.9
27.5
3
.2
29.2
2
.2
27.5
1
.8
24.6
2
.0
26.4
24
3
5.0
0
0
.6
16.6
0
.8
18.0
0
.6
17.3
4
.4
31.5
3
.8
29.1
4
.1
30.8
2
.9
29.0
2
.3
26.1
2
.6
27.9
25
3
7.5
0
0
.6
18.5
1
.2
19.8
0
.8
19.1
6
.6
33.1
4
.7
30.7
5
.9
32.3
4
.2
30.5
3
.1
27.7
3
.7
29.5
26
4
0.0
0
1
.1
20.4
1
.2
21.6
1
.1
21.0
8
.6
34.8
6
.0
32.3
7
.6
33.9
5
.6
32.0
3
.8
29.3
4
.8
31.0
27
4
2.5
0
1
.3
22.2
1
.8
23.4
1
.5
22.8
1
0.5
3
6.4
8
.3
33.9
9
.6
35.5
6
.8
33.5
5
.3
30.8
6
.2
32.5
28
4
5.0
0
1
.5
24.1
2
.7
25.2
2
.0
24.6
1
3.9
3
8.0
1
0.3
3
5.5
1
2.5
3
7.1
8
.9
35.0
6
.8
32.4
8
.1
34.0
29
4
7.5
0
2
.8
26.0
3
.5
27.0
3
.1
26.5
1
6.8
3
9.7
1
2.0
3
7.0
1
4.9
3
8.7
1
1.2
3
6.5
8
.1
34.0
9
.9
35.6
30
5
0.0
0
3
.6
27.9
5
.1
28.8
4
.3
28.3
2
1.6
4
1.3
1
4.4
3
8.6
1
8.8
4
0.3
1
4.4
3
8.0
1
0.2
3
5.5
1
2.6
3
7.1
31
5
2:.
50
5.1
2
9.7
6
.3
30.6
5
.7
30.2
2
6.5
4
2.9
1
8.5
4
0.2
2
3.4
4
1.9
1
8.0
3
9.6
1
3.0
3
7.1
1
5.9
3
8.6
32
5
5.0
0
6
.1
31.6
6
.8
32.4
6
.4
32.0
3
1.7
4
4.5
2
3.3
4
1.8
2
8.4
4
3.5
2
1.5
4
1.1
1
5.8
3
8.6
1
9.1
4
0.1
33
5
7.5
0
7
.8
33.5
9
.5
34.2
8
.5
33.8
3
7.1
4
6.2
2
7.0
4
3.4
3
3.2
4
5.1
2
5.4
4
2.6
1
9.0
4
0.2
2
2.7
4
1.7
34
6
0.0
0
9
.7
35.4
1
1.3
3
6.0
1
0.4
3
5.7
4
3.2
4
7.8
3
0.9
4
5.0
3
8.4
4
6.7
2
9.8
4
4.1
2
1.9
4
1.8
2
6.5
4
3.2
35
6
2.5
0
1
3.2
3
7.2
1
3.3
3
7.8
1
3.2
3
7.5
4
9.7
4
9.4
3
6.4
4
6.6
4
4.5
4
8.3
3
5.1
4
5.6
2
5.8
4
3.3
3
1.2
4
4.7
36
6
5.0
0
1
6.3
3
9.1
1
5.8
3
9.6
1
6.1
3
9.4
5
5.1
5
1.1
4
1.5
4
8.2
4
9.8
4
9.9
3
9.6
4
7.1
2
9.7
4
4.9
3
5.5
4
6.2
37
6
7.5
0
1
9.4
4
1.0
2
0.9
4
1.4
2
0.1
4
1.2
6
0.1
5
2:.
7
47.0
4
9.7
5
5.0
5
1.5
4
3.8
4
8.6
3
5.0
4
6.5
4
0.2
4
7.7
38
7
0.0
0
2
3.3
4
2.9
2
4.9
4
3.2
2
4.0
4
3.0
6
6.8
5
4.3
5
3.4
5
1.3
6
1.5
5
3.1
4
9.4
5
0.1
4
0.3
4
8.0
4
5.6
4
9.3
39
7
2.5
0
2
8.4
4
4.7
2
9.2
4
5.0
2
8.8
4
4.9
7
1.6
5
5.9
6
0.3
5
2:.
9
67.2
5
4.7
5
4.3
5
1.6
4
6.1
4
9.6
5
0.9
5
0.8
40
7
5.0
0
3
5.1
4
6.6
3
3.9
4
6.8
3
4.6
4
6.7
7
8.1
5
7.6
6
7.2
5
4.5
7
3.8
5
6.3
6
0.9
5
3.1
5
2:.
0
51.2
5
7.2
5
2:.
3
41
7
7.5
0
4
2.6
4
8.5
4
0.9
4
8.7
4
1.8
4
8.6
8
3.5
5
9.2
7
3.3
5
6.1
7
9.5
5
7.9
6
7.1
5
4.6
5
8.5
5
2:.
7
63.5
5
3.8
42
8
0.0
0
5
1.1
5
0.4
4
8.1
5
0.5
4
9.7
5
0.4
8
8.0
6
0.8
8
0.5
5
7.7
8
5.1
5
9.5
7
3.2
5
6.1
6
5.7
5
4.3
7
0.1
5
5.4
43
8
2.5
0
5
7.2
5
2:.
2
55.2
5
2:.
3
56.3
5
2:.
2
91.5
6
2.5
8
5.1
5
9.3
8
9.0
6
1.1
7
7.8
5
7.6
7
1.5
5
5.8
7
5.2
5
6.9
44
8
5.0
0
6
5.7
5
4.1
6
4.0
5
4.1
6
4.9
5
4.1
9
4.8
6
4.1
8
8.9
6
0.9
9
2.5
6
2.7
8
3.2
5
9.1
7
7.5
5
7.4
8
0.8
5
8.4
45
8
7.5
0
7
2.1
5
6.0
7
2.1
5
5.9
7
2.1
5
5.9
9
6.7
6
5.7
9
2.8
6
2.4
9
5.2
6
4.3
8
6.9
6
0.7
8
3.3
5
9.0
8
5.4
5
9.9
46
9
0.0
0
7
9.8
5
7.9
7
9.7
5
7.7
7
9.8
5
7.8
9
8.2
6
7.3
9
5.2
6
4.0
9
7.0
6
5.9
9
0.9
6
2.2
8
8.1
6
0.5
8
9.7
6
1.4
47
9
2.5
0
8
6.8
5
9.7
8
7.6
5
9.5
8
7.2
5
9.6
9
9.1
6
9.0
9
6.6
6
5.6
9
8.1
6
7.5
9
4.2
6
3.7
9
2.5
6
2.1
9
3.5
6
3.0
48
9
5.0
0
9
2.1
6
1.6
9
2.1
6
1.3
9
2.1
6
1.4
9
9.5
7
0.6
9
8.2
6
7.2
9
9.0
6
9.1
9
6.6
6
5.2
9
5.4
6
3.7
9
6.1
6
4.5
49
9
7.5
0
9
5.7
6
3.5
9
6.7
6
3.1
9
6.1
6
3.3
9
9.8
7
2.2
9
9.0
6
8.8
9
9.5
7
0.7
9
8.2
6
6.7
9
8.0
6
5.2
9
8.1
6
6
50
1
00
.00
100
.0
65.3
1
00
.0
64.9
1
00
.0
65.1
1
00
.0
73.9
1
00
.0
70.4
1
00
.0
72.3
1
00
.0
68.2
1
00
.0
66.8
1
00
.0
67.5
Tabl
e A4-
8:H
U -
Hun
gary
. Ind
ivid
ual n
orm
dat
a fo
rK
IDSC
RE
EN
-10
Inde
x
Not
e: C
alcu
latio
n of
sco
res
was
rest
ricte
d to
com
plet
e ca
ses.
PR =
per
cent
ile; T
S =
T-sc
ore
for t
he p
artic
ular
(sub
-)po
pula
tion
(M =
50.
SD
= 1
0).

Provision of National Norm Data for Individual Diagnostic Use
213
C
hil
dre
n 8
-11
A
do
lesc
ents
12
-18
C
hil
dre
n &
Ad
ole
scen
ts 8
-18
Ra
w-
0-1
00
F
ema
les
(n=
160
) M
ale
s (n
=148
) A
ll (
n=
308
) F
ema
les
(n=
564
) M
ale
s (n
=330
) A
ll (
n=
894
) F
ema
les
(n=
724
) M
ale
s (n
=478
) A
ll (
n=
1202
)
Sco
re
Sco
re
P
R
TS
P
R
TS
P
R
TS
P
R
TS
P
R
TS
P
R
TS
P
R
TS
P
R
TS
P
R
TS
10
0
.00
11
2
.50
12
5
.00
13
7
.50
14
1
0.0
0
15
1
2.5
0
16
1
5.0
0
0
.2
14.5
0
.1
11.5
17
1
7.5
0
0
.3
16.1
0
.2
13.3
18
2
0.0
0
0
.4
17.7
0
.2
15.0
19
2
2.5
0
0
.5
19.4
0
.3
16.7
20
2
5.0
0
0
.5
21.7
0
.3
19.2
0
.5
21.0
0
.3
18.4
21
2
7.5
0
0
.8
23.4
0
.5
14.2
0
.6
20.9
0
.7
22.6
0
.3
14.2
0
.5
20.1
22
3
0.0
0
0
.8
14.1
1
.6
25.1
0
.7
16.2
1
.1
22.7
1
.4
24.2
0
.5
16.1
1
.0
21.8
23
3
2.5
0
1
.6
17.1
1
.2
16.0
2
.2
26.8
0
.8
18.2
1
.6
24.4
1
.9
25.9
0
.7
18.0
1
.4
23.5
24
3
5.0
0
1
.8
18.9
1
.3
17.8
2
.4
28.4
1
.0
20.2
1
.7
26.2
2
.1
27.5
0
.8
19.9
1
.5
25.2
25
3
7.5
0
2
.0
20.7
1
.4
19.7
3
.6
30.1
1
.1
22.2
2
.6
27.9
3
.1
29.1
0
.9
21.8
2
.2
26.9
26
4
0.0
0
2
.2
22.5
1
.5
21.5
5
.2
31.8
2
.2
24.2
4
.0
29.7
4
.4
30.8
1
.7
23.8
3
.3
28.6
27
4
2.5
0
2
.4
24.3
1
.7
23.4
7
.8
33.5
2
.6
26.2
5
.8
31.4
6
.5
32.4
2
.0
25.7
4
.7
30.3
28
4
5.0
0
2
.7
26.2
1
.9
25.3
9
.4
35.2
3
.1
28.2
7
.1
33.2
7
.7
34.0
2
.4
27.6
5
.6
32.0
29
4
7.5
0
2
.9
28.0
1
.8
25.9
2
.1
27.1
1
3.0
3
6.8
4
.0
30.2
9
.6
35.0
1
0.7
3
5.7
3
.2
29.5
7
.7
33.7
30
5
0.0
0
3
.5
29.8
2
.4
27.8
2
.7
28.9
1
6.3
3
8.5
5
.5
32.2
1
2.3
3
6.7
1
3.4
3
7.3
4
.4
31.4
9
.8
35.4
31
5
2:.
50
4.2
3
1.6
4
.2
29.8
3
.9
30.8
1
9.9
4
0.2
7
.0
34.2
1
5.1
3
8.5
1
6.3
3
8.9
6
.1
33.3
1
2.3
3
7.1
32
5
5.0
0
5
.8
33.4
6
.3
31.7
5
.9
32.6
2
3.4
4
1.9
8
.8
36.2
1
8.0
4
0.2
1
9.5
4
0.6
8
.0
35.2
1
4.9
3
8.8
33
5
7.5
0
7
.1
35.2
7
.7
33.6
7
.2
34.5
2
6.8
4
3.6
1
2.7
3
8.2
2
1.6
4
2.0
2
2.4
4
2.2
1
1.1
3
7.1
1
7.9
4
0.5
34
6
0.0
0
8
.9
37.0
9
.1
35.5
8
.8
36.4
3
2.3
4
5.3
1
7.5
4
0.2
2
6.8
4
3.7
2
7.1
4
3.8
1
4.9
3
9.1
2
2.2
4
2.2
35
6
2.5
0
1
5.7
3
8.9
1
2.3
3
7.4
1
4.0
3
8.2
3
8.0
4
6.9
2
4.2
4
2.2
3
2.9
4
5.5
3
3.0
4
5.5
2
0.5
4
1.0
2
8.1
4
3.9
36
6
5.0
0
1
9.5
4
0.7
1
6.3
3
9.3
1
7.9
4
0.1
4
3.8
4
8.6
3
0.2
4
4.2
3
8.8
4
7.2
3
8.4
4
7.1
2
5.9
4
2.9
3
3.5
4
5.7
37
6
7.5
0
2
3.3
4
2.5
1
9.7
4
1.2
2
1.6
4
1.9
5
1.3
5
0.3
3
8.4
4
6.2
4
6.5
4
9.0
4
5.1
4
8.7
3
2.6
4
4.8
4
0.1
4
7.4
38
7
0.0
0
2
9.5
4
4.3
2
5.8
4
3.1
2
7.7
4
3.8
5
8.5
5
2:.
0
46.3
4
8.2
5
4.0
5
0.7
5
2:.
1
50.4
4
0.0
4
6.7
4
7.3
4
9.1
39
7
2.5
0
3
6.3
4
6.1
3
3.3
4
5.0
3
4.9
4
5.6
6
5.1
5
3.7
5
2:.
9
50.2
6
0.6
5
2:.
5
58.8
5
2:.
0
46.9
4
8.6
5
4.0
5
0.8
40
7
5.0
0
4
5.7
4
7.9
4
0.6
4
7.0
4
3.3
4
7.5
7
1.2
5
5.4
6
0.2
5
2:.
2
67.1
5
4.2
6
5.5
5
3.6
5
4.2
5
0.5
6
1.0
5
2:.
5
41
7
7.5
0
5
1.3
4
9.7
4
8.1
4
8.9
4
9.8
4
9.3
7
7.0
5
7.0
6
9.3
5
4.2
7
4.2
5
6.0
7
1.3
5
5.3
6
2.8
5
2:.
4
67.9
5
4.2
42
8
0.0
0
5
7.5
5
1.5
5
2:.
8
50.8
5
5.3
5
1.2
8
2.0
5
8.7
7
3.8
5
6.2
7
9.0
5
7.7
7
6.6
5
6.9
6
7.3
5
4.4
7
2.9
5
5.9
43
8
2.5
0
6
2.5
5
3.4
6
2.2
5
2:.
7
62.4
5
3.0
8
7.3
6
0.4
8
1.4
5
8.2
8
5.1
5
9.5
8
1.8
5
8.5
7
5.5
5
6.3
7
9.3
5
7.6
44
8
5.0
0
6
8.7
5
5.2
6
9.0
5
4.6
6
8.8
5
4.9
9
0.4
6
2.1
8
7.5
6
0.2
8
9.4
6
1.2
8
5.6
6
0.2
8
1.8
5
8.2
8
4.1
5
9.3
45
8
7.5
0
7
2.4
5
7.0
7
5.0
5
6.5
7
3.7
5
6.7
9
4.7
6
3.8
9
0.9
6
2.2
9
3.3
6
3.0
8
9.8
6
1.8
8
6.0
6
0.1
8
8.3
6
1.0
46
9
0.0
0
8
2.4
5
8.8
8
1.0
5
8.4
8
1.7
5
8.6
9
6.5
6
5.4
9
3.9
6
4.2
9
5.5
6
4.8
9
3.4
6
3.4
8
9.9
6
2.0
9
2.0
6
2.7
47
9
2.5
0
8
7.4
6
0.6
8
5.7
6
0.3
8
6.6
6
0.4
9
8.2
6
7.1
9
7.3
6
6.2
9
7.9
6
6.5
9
5.8
6
5.1
9
3.7
6
3.9
9
5.0
6
4.4
48
9
5.0
0
9
3.1
6
2.4
9
0.5
6
2.2
9
1.8
6
2.3
9
9.3
6
8.8
9
9.1
6
8.2
9
9.2
6
8.3
9
7.9
6
6.7
9
6.4
6
5.8
9
7.3
6
6.1
49
9
7.5
0
9
6.9
6
4.2
9
3.2
6
4.2
9
5.1
6
4.2
9
9.8
7
0.5
9
9.4
7
0.2
9
9.7
7
0.0
9
9.2
6
8.3
9
7.5
6
7.7
9
8.5
6
7.8
50
1
00
.00
100
.0
66.0
1
00
.0
66.1
1
00
.0
66.0
1
00
.0
72.2
1
00
.0
72.2
1
00
.0
71.8
1
00
.0
70.0
1
00
.0
69.7
1
00
.0
69.5
Tabl
e A4-
9:
IE -
Irel
and.
Indi
vidu
al n
orm
dat
a fo
rK
IDSC
RE
EN
-10
Inde
x
Not
e: C
alcu
latio
n of
sco
res
was
rest
ricte
d to
com
plet
e ca
ses.
PR =
per
cent
ile; T
S =
T-sc
ore
for t
he p
artic
ular
(sub
-)po
pula
tion
(M =
50.
SD
= 1
0).

Appendix A4
214
C
hil
dren
8-1
1
Ad
ole
scen
ts 1
2-1
8
Ch
ild
ren
& A
do
lesc
en
ts 8
-18
Ra
w-
0-1
00
F
em
ale
s (n
=322
) M
ale
s (n
=327
) A
ll (
n=
649
) F
em
ale
s (n
=613
) M
ale
s (n
=546
) A
ll (
n=
1159
) F
em
ale
s (n
=935
) M
ale
s (n
=873
) A
ll (
n=
1808
)
Sco
re
Sco
re
P
R
TS
P
R
TS
P
R
TS
P
R
TS
P
R
TS
P
R
TS
P
R
TS
P
R
TS
P
R
TS
10
0
.00
11
2
.50
12
5
.00
13
7
.50
14
1
0.0
0
15
1
2.5
0
16
1
5.0
0
17
1
7.5
0
18
2
0.0
0
19
2
2.5
0
20
2
5.0
0
21
2
7.5
0
22
3
0.0
0
23
3
2.5
0
24
3
5.0
0
0
.4
16.3
0
.2
14.7
0
.2
15.1
0
.1
13.0
25
3
7.5
0
0
.4
18.4
0
.3
13.8
0
.3
16.8
0
.2
17.1
0
.2
12.3
0
.2
15.1
26
4
0.0
0
0
.7
20.5
0
.3
15.9
0
.5
18.8
0
.5
19.0
0
.2
14.4
0
.3
17.1
27
4
2.5
0
1
.2
22.5
0
.3
18.1
0
.7
20.9
0
.8
21.0
0
.2
16.6
0
.4
19.2
28
4
5.0
0
0
.5
14.5
0
.2
14.3
1
.8
24.6
0
.5
20.2
1
.1
23.0
1
.2
23.0
0
.4
18.7
0
.8
21.2
29
4
7.5
0
0
.5
16.3
0
.8
16.8
0
.5
16.6
2
.3
26.7
0
.9
22.3
1
.6
25.0
1
.6
25.0
0
.8
20.8
1
.2
23.2
30
5
0.0
0
1
.3
18.5
1
.1
19.0
0
1.1
1
8.8
3
.3
28.7
1
.2
24.4
2
.2
27.1
2
.6
27.0
1
.1
23.0
1
.8
25.3
31
5
2:.
50
1.7
2
0.8
1
.9
21.3
1
.7
21.1
4
.6
30.8
1
.7
26.6
3
.2
29.2
3
.5
29.0
1
.7
25.1
2
.7
27.3
32
5
5.0
0
2
.1
23.0
2
.3
23.5
2
.1
23.3
6
.5
32.9
2
.4
28.7
4
.5
31.2
4
.9
31.0
2
.3
27.2
3
.6
29.4
33
5
7.5
0
2
.1
25.3
2
.3
25.8
2
.1
25.6
8
.8
34.9
4
.2
30.8
6
.6
33.3
6
.4
33.0
3
.4
29.4
5
.0
31.4
34
6
0.0
0
3
.7
27.5
3
.1
28.0
3
.4
27.8
1
1.4
3
7.0
6
.6
33.0
9
.1
35.4
8
.8
35.0
5
.3
31.5
7
.1
33.5
35
6
2.5
0
5
.0
29.8
4
.6
30.3
4
.8
30.0
1
5.6
3
9.1
1
0.8
3
5.1
1
3.3
3
7.4
1
2.0
3
6.9
8
.5
33.7
1
0.3
3
5.5
36
6
5.0
0
6
.5
32.0
6
.2
32.5
6
.3
32.3
2
1.9
4
1.1
1
4.2
3
7.2
1
8.3
3
9.5
1
6.6
3
8.9
1
1.2
3
5.8
1
4.0
3
7.6
37
6
7.5
0
8
.4
34.3
1
0.1
3
4.8
9
.3
34.5
2
7.7
4
3.2
1
7.4
3
9.4
2
2.8
4
1.6
2
1.0
4
0.9
1
4.6
3
7.9
1
7.9
3
9.6
38
7
0.0
0
1
2.4
3
6.5
1
3.8
3
7.0
1
3.1
3
6.8
3
3.9
4
5.3
2
1.2
4
1.5
2
7.9
4
3.6
2
6.5
4
2.9
1
8.4
4
0.1
2
2.6
4
1.7
39
7
2.5
0
1
4.0
3
8.8
1
8.4
3
9.3
1
6.2
3
9.0
4
0.3
4
7.3
2
8.0
4
3.7
3
4.5
4
5.7
3
1.2
4
4.9
2
4.4
4
2.2
2
7.9
4
3.7
40
7
5.0
0
1
8.9
4
1.0
2
3.3
4
1.5
2
1.1
4
1.3
4
8.9
4
9.4
3
7.3
4
5.8
4
3.4
4
7.8
3
8.6
4
6.9
3
2.1
4
4.3
3
5.4
4
5.7
41
7
7.5
0
2
6.4
4
3.3
2
7.3
4
3.8
2
6.8
4
3.5
5
7.1
5
1.5
4
4.1
4
7.9
5
0.9
4
9.8
4
6.5
4
8.9
3
7.8
4
6.5
4
2.3
4
7.8
42
8
0.0
0
3
3.2
4
5.5
3
1.8
4
6.0
3
2.5
4
5.8
6
4.2
5
3.6
5
3.1
5
0.1
5
9.0
5
1.9
5
3.5
5
0.9
4
5.1
4
8.6
4
9.5
4
9.8
43
8
2.5
0
4
2.9
4
7.8
4
2.0
4
8.3
4
2.4
4
8.0
7
2.5
5
5.6
5
9.3
5
2:.
2
66.3
5
4.0
6
2.3
5
2:.
9
52
:.8
5
0.8
5
7.7
5
1.9
44
8
5.0
0
4
9.4
5
0.0
4
9.6
5
0.5
4
9.5
5
0.3
7
9.6
5
7.7
6
6.2
5
4.3
7
3.3
5
6.0
6
9.2
5
4.9
6
0.0
5
2:.
9
64.7
5
3.9
45
8
7.5
0
5
6.2
5
2:.
3
59.7
5
2:.
8
57.9
5
2:.
5
85.8
5
9.8
7
4.3
5
6.5
8
0.4
5
8.1
7
5.6
5
6.8
6
8.8
5
5.0
7
2.3
5
6.0
46
9
0.0
0
6
6.2
5
4.5
6
9.2
5
5.0
6
7.7
5
4.8
9
0.8
6
1.8
8
0.9
5
8.6
8
6.2
6
0.2
8
2.3
5
8.8
7
6.5
5
7.2
7
9.5
5
8.0
47
9
2.5
0
7
4.6
5
6.8
7
8.3
5
7.3
7
6.5
5
7.0
9
5.1
6
3.9
8
8.1
6
0.7
9
1.8
6
2.2
8
8.0
6
0.8
8
4.4
5
9.3
8
6.3
6
0.1
48
9
5.0
0
8
3.6
5
9.0
8
6.3
5
9.5
8
4.9
5
9.3
9
7.6
6
6.0
9
2.7
6
2.9
9
5.3
6
4.3
9
2.7
6
2.8
9
0.3
6
1.5
9
1.5
6
2.1
49
9
7.5
0
9
1.0
6
1.3
9
3.0
6
1.8
9
2.0
6
1.5
9
9.2
6
8.0
9
6.4
6
5.0
9
7.9
6
6.4
9
6.4
6
4.8
9
5.1
6
3.6
9
5.8
6
4.1
50
1
00
.00
100
.0
63.5
1
00
.0
64.0
1
00
.0
63.8
1
00
.0
70.1
1
00
.0
67.1
1
00
.0
68.4
1
00
.0
66.8
1
00
.0
65.7
1
00
.0
66.2
Tabl
e A4-
10:
NL
- Net
herl
ands
. Ind
ivid
ual n
orm
dat
a fo
rK
IDSC
RE
EN
-10
Inde
x
Not
e: C
alcu
latio
n of
sco
res
was
rest
ricte
d to
com
plet
e ca
ses.
PR =
per
cent
ile; T
S =
T-sc
ore
for t
he p
artic
ular
(sub
-)po
pula
tion
(M =
50.
SD
= 1
0).

Provision of National Norm Data for Individual Diagnostic Use
215
C
hil
dren
8-1
1
Ad
ole
scen
ts 1
2-1
8
Ch
ild
ren
& A
do
lesc
en
ts 8
-18
Ra
w-
0-1
00
F
em
ale
s (n
=293
) M
ale
s (n
=258
) A
ll (
n=
551
) F
em
ale
s (n
=622
) M
ale
s (n
=496
) A
ll (
n=
1118
) F
em
ale
s (n
=915
) M
ale
s (n
=754
) A
ll (
n=
1669
)
Sco
re
Sco
re
P
R
TS
P
R
TS
P
R
TS
P
R
TS
P
R
TS
P
R
TS
P
R
TS
P
R
TS
P
R
TS
10
0
.00
11
2
.50
12
5
.00
13
7
.50
14
1
0.0
0
15
1
2.5
0
16
1
5.0
0
17
1
7.5
0
18
2
0.0
0
0
.3
21.2
0
.1
18.9
0
.2
19.8
0
.1
17.2
19
2
2.5
0
0
.5
22.9
0
.3
20.6
0
.4
21.4
0
.2
18.9
20
2
5.0
0
0
.9
24.5
0
.3
18.7
0
.6
22.3
0
.6
23.0
0
.2
16.7
0
.4
20.6
21
2
7.5
0
1
.1
26.2
0
.5
20.5
0
.7
24.1
0
.7
24.6
0
.3
18.6
0
.5
22.3
22
3
0.0
0
0
.5
16.7
0
.3
14.1
2
.3
27.8
0
.5
22.4
1
.4
25.8
1
.7
26.2
0
.3
20.4
1
.0
23.9
23
3
2.5
0
0
.5
18.5
0
.3
16.1
3
.4
29.5
0
.9
24.2
2
.3
27.5
2
.4
27.7
0
.6
22.2
1
.6
25.6
24
3
5.0
0
0
.5
20.3
0
.3
18.0
5
.0
31.1
1
.6
26.1
3
.5
29.2
3
.5
29.3
1
.1
24.1
2
.4
27.3
25
3
7.5
0
0
.5
22.2
0
.3
20.0
6
.6
32.7
3
.0
28.0
5
.0
30.9
4
.6
30.9
2
.0
25.9
3
.4
29.0
26
4
0.0
0
0
.5
24.0
0
.6
18.9
0
.5
21.9
8
.2
34.4
3
.5
29.8
6
.1
32.7
5
.7
32.5
2
.4
27.8
4
.2
30.7
27
4
2.5
0
0
.9
25.8
0
.6
21.0
0
.7
23.9
1
1.1
3
6.0
5
.0
31.7
8
.4
34.4
7
.8
34.1
3
.5
29.6
5
.8
32.4
28
4
5.0
0
1
.2
27.7
1
.3
23.1
1
.1
25.8
1
3.8
3
7.7
6
.8
33.6
1
0.7
3
6.1
9
.7
35.7
4
.9
31.4
7
.5
34.0
29
4
7.5
0
3
.8
29.5
1
.3
25.3
2
.6
27.8
1
6.8
3
9.3
8
.9
35.4
1
3.3
3
7.8
1
2.7
3
7.3
6
.2
33.3
9
.8
35.7
30
5
0.0
0
6
.2
31.3
1
.3
27.4
3
.8
29.7
2
0.7
4
1.0
1
2.7
3
7.3
1
7.2
3
9.6
1
6.1
3
8.9
8
.8
35.1
1
2.8
3
7.4
31
5
2:.
50
8.2
3
3.1
2
.4
29.6
5
.5
31.7
2
5.2
4
2.6
1
6.3
3
9.2
2
1.3
4
1.3
1
9.8
4
0.5
1
1.6
3
6.9
1
6.1
3
9.1
32
5
5.0
0
1
0.6
3
5.0
3
.9
31.7
7
.4
33.6
3
1.1
4
4.3
2
1.3
4
1.0
2
6.7
4
3.0
2
4.5
4
2.1
1
5.4
3
8.8
2
0.4
4
0.8
33
5
7.5
0
1
3.3
3
6.8
7
.8
33.8
1
0.7
3
5.6
3
4.9
4
5.9
2
6.8
4
2.9
3
1.3
4
4.7
2
8.0
4
3.7
2
0.3
4
0.6
2
4.5
4
2.5
34
6
0.0
0
1
7.0
3
8.6
9
.0
36.0
1
3.3
3
7.5
4
0.4
4
7.6
3
1.5
4
4.7
3
6.4
4
6.4
3
2.9
4
5.3
2
3.8
4
2.5
2
8.8
4
4.1
35
6
2.5
0
1
9.1
4
0.5
1
5.6
3
8.1
1
7.4
3
9.5
4
7.6
4
9.2
3
7.8
4
6.6
4
3.3
4
8.2
3
8.5
4
6.9
3
0.2
4
4.3
3
4.7
4
5.8
36
6
5.0
0
2
2.9
4
2.3
2
1.8
4
0.2
2
2.4
4
1.5
5
4.2
5
0.9
4
5.2
4
8.5
5
0.2
4
9.9
4
4.2
4
8.4
3
7.2
4
6.1
4
1.0
4
7.5
37
6
7.5
0
2
9.3
4
4.1
2
8.0
4
2.4
2
8.7
4
3.4
6
1.0
5
2:.
5
53.5
5
0.3
5
7.7
5
1.6
5
0.9
5
0.0
4
4.8
4
8.0
4
8.1
4
9.2
38
7
0.0
0
3
6.2
4
6.0
3
3.8
4
4.5
3
5.1
4
5.4
6
7.8
5
4.2
6
0.6
5
2:.
2
64.6
5
3.3
5
7.7
5
1.6
5
1.4
4
9.8
5
4.8
5
0.9
39
7
2.5
0
4
1.6
4
7.8
4
0.0
4
6.7
4
0.9
4
7.3
7
3.0
5
5.8
6
6.6
5
4.1
7
0.2
5
5.1
6
3.0
5
3.2
5
7.5
5
1.7
6
0.5
5
2:.
5
40
7
5.0
0
4
8.5
4
9.6
4
6.6
4
8.8
4
7.6
4
9.3
8
0.4
5
7.5
7
4.1
5
5.9
7
7.6
5
6.8
7
0.2
5
4.8
6
4.7
5
3.5
6
7.7
5
4.2
41
7
7.5
0
5
7.0
5
1.5
5
5.9
5
0.9
5
6.5
5
1.2
8
3.9
5
9.1
8
2.1
5
7.8
8
3.1
5
8.5
7
5.3
5
6.4
7
3.2
5
5.3
7
4.4
5
5.9
42
8
0.0
0
6
3.5
5
3.3
6
4.0
5
3.1
6
3.8
5
3.2
8
8.0
6
0.8
8
7.0
5
9.7
8
7.5
6
0.2
8
0.1
5
8.0
7
9.1
5
7.2
7
9.7
5
7.6
43
8
2.5
0
7
1.4
5
5.1
6
9.8
5
5.2
7
0.6
5
5.1
9
1.7
6
2.4
9
0.4
6
1.5
9
1.1
6
2.0
8
5.2
5
9.6
8
3.4
5
9.0
8
4.3
5
9.3
44
8
5.0
0
7
5.1
5
7.0
7
9.5
5
7.4
7
7.2
5
7.1
9
3.7
6
4.1
9
2.6
6
3.4
9
3.2
6
3.7
8
7.8
6
1.2
8
8.1
6
0.8
8
7.9
6
1
45
8
7.5
0
7
9.9
5
8.8
8
6.8
5
9.5
8
3.1
5
9.1
9
6.3
6
5.7
9
5.6
6
5.2
9
6.0
6
5.4
9
1.1
6
2.8
9
2.6
6
2.7
9
1.8
6
2.6
46
9
0.0
0
8
6.4
6
0.6
9
0.6
6
1.6
8
8.4
6
1.0
9
7.8
6
7.4
9
7.0
6
7.1
9
7.4
6
7.1
9
4.1
6
4.4
9
4.8
6
4.5
9
4.4
6
4.3
47
9
2.5
0
9
0.4
6
2.4
9
2.6
6
3.8
9
1.4
6
3.0
9
8.4
6
9.0
9
8.0
6
9.0
9
8.2
6
8.8
9
5.9
6
6.0
9
6.1
6
6.4
9
6.0
6
6.0
48
9
5.0
0
9
6.6
6
4.3
9
6.1
6
5.9
9
6.4
6
4.9
9
9.0
7
0.7
9
8.8
7
0.8
9
8.9
7
0.6
9
8.3
6
7.5
9
7.9
6
8.2
9
8.1
6
7.7
49
9
7.5
0
9
9.0
6
6.1
9
7.2
6
8.0
9
8.2
6
6.9
9
9.4
7
2.3
9
9.8
7
2.7
9
9.6
7
2.3
9
9.2
6
9.1
9
8.9
7
0.0
9
9.1
6
9.4
50
1
00
.00
100
.0
67.9
1
00
.0
70.2
1
00
.0
68.8
1
00
.0
74.0
1
00
.0
74.6
1
00
.0
74.0
1
00
.0
70.7
1
00
.0
71.9
1
00
.0
71.1
Tabl
e A4-
11:
PL- P
olan
d. In
divi
dual
nor
m d
ata
for
KID
SCR
EE
N-1
0 In
dex
Not
e: C
alcu
latio
n of
sco
res
was
rest
ricte
d to
com
plet
e ca
ses.
PR =
per
cent
ile; T
S =
T-sc
ore
for t
he p
artic
ular
(sub
-)po
pula
tion
(M =
50.
SD
= 1
0).

Appendix A4
216
A
do
lesc
en
ts 1
2-1
8
Ra
w-
0-1
00
F
em
ale
s (n
=151
0)
Ma
les
(n=
158
7)
All
(n
=3
097
)
Sco
re
Sco
re
P
R
TS
P
R
TS
P
R
TS
10
0
.00
11
2
.50
12
5
.00
0.1
1
9.1
0
.1
19.1
13
7
.50
0.1
1
9.1
0
.1
19.1
14
1
0.0
0
0
.1
19.1
0
.1
19.1
0
.1
19.1
15
1
2.5
0
0
.1
19.1
0
.1
19.1
0
.1
19.1
16
1
5.0
0
0
.1
19.1
0
.1
19.1
0
.1
19.1
17
1
7.5
0
0
.1
19.1
0
.1
19.1
0
.1
19.1
18
2
0.0
0
0
.2
21.2
0
.1
19.1
0
.1
19.1
19
2
2.5
0
0
.4
23.5
0
.2
21.2
0
.3
22.5
20
2
5.0
0
0
.6
24.9
0
.2
21.2
0
.4
23.5
21
2
7.5
0
0
.7
25.4
0
.2
21.2
0
.5
24.2
22
3
0.0
0
1
.1
27.1
0
.3
22.5
0
.7
25.4
23
3
2.5
0
1
.3
27.7
0
.5
24.2
0
.9
26.3
24
3
5.0
0
1
.9
29.3
0
.5
24.2
1
.2
27.4
25
3
7.5
0
2
.3
30.1
0
.9
26.3
1
.6
28.6
26
4
0.0
0
3
.6
32.0
1
.3
27.7
2
.5
30.4
27
4
2.5
0
4
.8
33.4
1
.8
29.0
3
.3
31.6
28
4
5.0
0
5
.9
34.4
2
.3
30.1
4
.1
32.6
29
4
7.5
0
7
.4
35.5
2
.9
31.0
5
.1
33.7
30
5
0.0
0
9
.2
36.7
3
.6
32.0
6
.3
34.7
31
5
2.5
0
1
1.4
3
7.9
4
.8
33.4
8
.0
36.0
32
5
5.0
0
1
4.6
3
9.5
6
.2
34.6
1
0.3
3
7.4
33
5
7.5
0
1
7.3
4
0.6
8
.4
36.2
1
2.8
3
8.6
34
6
0.0
0
2
1.1
4
2.0
1
0.4
3
7.4
1
5.6
3
9.9
35
6
2.5
0
2
5.5
4
3.4
1
3.9
3
9.2
1
9.5
4
1.4
36
6
5.0
0
3
1.3
4
5.1
1
7.6
4
0.7
2
4.3
4
3.0
37
6
7.5
0
3
6.5
4
6.6
2
2.1
4
2.3
2
9.1
4
4.5
38
7
0.0
0
4
2.7
4
8.2
2
8.2
4
4.2
3
5.3
4
6.2
39
7
2.5
0
4
9.0
4
9.8
3
4.3
4
6.0
4
1.4
4
7.8
40
7
5.0
0
5
4.7
5
1.2
4
0.6
4
7.6
4
7.5
4
9.4
41
7
7.5
0
6
2.5
5
3.2
4
8.0
4
9.5
5
5.1
5
1.3
42
8
0.0
0
6
9.2
5
5.0
5
4.9
5
1.2
6
1.9
5
3.0
43
8
2.5
0
7
5.1
5
6.8
6
2.7
5
3.2
6
8.7
5
4.9
44
8
5.0
0
8
0.2
5
8.5
7
0.8
5
5.5
7
5.4
5
6.9
45
8
7.5
0
8
4.9
6
0.3
7
7.4
5
7.5
8
1.1
5
8.8
46
9
0.0
0
8
8.2
6
1.9
8
4.6
6
0.2
8
6.3
6
0.9
47
9
2.5
0
9
2.1
6
4.1
8
9.2
6
2.4
9
0.6
6
3.2
48
9
5.0
0
9
5.9
6
7.4
9
3.8
6
5.4
9
4.8
6
6.3
49
9
7.5
0
9
8.4
7
1.4
9
7.4
6
9.4
9
7.9
7
0.3
50
1
00
.00
100
.0
75.5
1
00
.0
73.5
1
00
.0
74.4
Tabl
e A4-
12:
SE -
Swed
en. I
ndiv
idua
l nor
m d
ata
KID
SCR
EE
N-1
0 In
dex
Not
e: C
alcu
latio
n of
sco
res
was
rest
ricte
d to
com
plet
e ca
ses.
PR =
per
cent
ile; T
S =
T-sc
ore
for t
he p
artic
ular
(sub
-)po
pula
tion
(M =
50.
SD
= 1
0).

Provision of National Norm Data for Individual Diagnostic Use
217
C
hil
dren
8-1
1
Ad
ole
scen
ts 1
2-1
8
Ch
ild
ren
& A
do
lesc
en
ts 8
-18
Ra
w-
0-1
00
F
em
ale
s (n
=420
) M
ale
s (n
=462
) A
ll (
n=
882
) F
em
ale
s (n
=436
) M
ale
s (n
=444
) A
ll (
n=
880
) F
em
ale
s (n
=856
) M
ale
s (n
=906
) A
ll (
n=
1762
)
Sco
re
Sco
re
P
R
TS
P
R
TS
P
R
TS
P
R
TS
P
R
TS
P
R
TS
P
R
TS
P
R
TS
P
R
TS
10
0
.00
11
2
.50
12
5
.00
13
7
.50
14
1
0.0
0
15
1
2.5
0
16
1
5.0
0
0
.4
11.3
0
.2
8.8
0
.2
14.4
0
.1
11.8
17
1
7.5
0
0
.4
12.9
0
.2
10.6
0
.2
16.0
0
.1
13.5
18
2
0.0
0
0
.4
14.6
0
.3
9.8
0
.3
12.3
0
.2
17.6
0
.2
12.1
0
.1
15.1
19
2
2.5
0
0
.6
16.2
0
.6
11.6
0
.5
14.0
0
.5
20.5
0
.3
18.3
0
.5
19.2
0
.3
13.9
0
.3
16.8
20
2
5.0
0
0
.6
17.9
0
.6
13.4
0
.5
15.7
0
.8
22.1
0
.4
20.0
0
.7
20.8
0
.3
15.7
0
.4
18.5
21
2
7.5
0
0
.6
19.5
0
.6
15.3
0
.5
17.5
1
.4
23.8
0
.4
18.9
0
.8
21.7
1
.0
22.4
0
.4
17.4
0
.6
20.2
22
3
0.0
0
1
.0
21.2
0
.6
17.1
0
.7
19.2
1
.7
25.5
0
.7
20.7
1
.1
23.4
1
.3
24.0
0
.6
19.2
0
.9
21.9
23
3
2.5
0
1
.3
22.8
0
.8
18.9
0
.9
20.9
2
.1
27.1
1
.0
22.5
1
.5
25.1
1
.7
25.7
0
.8
21.0
1
.2
23.5
24
3
5.0
0
1
.7
24.4
1
.1
20.7
1
.4
22.7
3
.0
28.8
1
.6
24.3
2
.3
26.8
2
.3
27.3
1
.3
22.8
1
.8
25.2
25
3
7.5
0
1
.7
26.1
1
.6
22.5
1
.6
24.4
3
.3
30.5
1
.9
26.0
2
.5
28.6
2
.5
28.9
1
.7
24.6
2
.0
26.9
26
4
0.0
0
3
.1
27.7
2
.0
24.4
2
.5
26.1
4
.1
32.1
3
.4
27.8
3
.7
30.3
3
.6
30.5
2
.6
26.3
3
.1
28.6
27
4
2.5
0
3
.9
29.4
2
.6
26.2
3
.2
27.8
5
.0
33.8
4
.9
29.6
5
.0
32.0
4
.4
32.1
3
.7
28.1
4
.1
30.3
28
4
5.0
0
4
.8
31.0
3
.9
28.0
4
.3
29.6
7
.5
35.5
5
.6
31.4
6
.6
33.7
6
.2
33.7
4
.7
29.9
5
.4
32.0
29
4
7.5
0
6
.5
32.7
4
.6
29.8
5
.5
31.3
1
0.1
3
7.1
6
.5
33.2
8
.3
35.4
8
.3
35.3
5
.5
31.7
6
.9
33.7
30
5
0.0
0
9
.6
34.3
5
.4
31.6
7
.4
33.0
1
4.2
3
8.8
7
.8
35.0
1
1.0
3
7.1
1
1.9
3
6.9
6
.6
33.5
9
.2
35.3
31
5
2.5
0
1
1.7
3
6.0
7
.4
33.5
9
.4
34.8
2
0.2
4
0.5
1
0.5
3
6.8
1
5.3
3
8.8
1
6.0
3
8.5
8
.9
35.3
1
2.4
3
7.0
32
5
5.0
0
1
3.6
3
7.6
9
.5
35.3
1
1.5
3
6.5
2
5.4
4
2.1
1
4.8
3
8.5
2
0.1
4
0.5
1
9.6
4
0.2
1
2.1
3
7.0
1
5.8
3
8.7
33
5
7.5
0
1
5.8
3
9.2
1
1.9
3
7.1
1
3.7
3
8.2
3
1.8
4
3.8
1
8.2
4
0.3
2
5.0
4
2.2
2
3.9
4
1.8
1
5.0
3
8.8
1
9.3
4
0.4
34
6
0.0
0
1
9.6
4
0.9
1
4.9
3
8.9
1
7.1
3
9.9
3
7.1
4
5.5
2
3.4
4
2.1
3
0.2
4
3.9
2
8.5
4
3.4
1
9.1
4
0.6
2
3.6
4
2.1
35
6
2.5
0
2
4.1
4
2.5
1
8.8
4
0.8
2
1.3
4
1.7
4
2.8
4
7.1
2
9.5
4
3.9
3
6.1
4
5.6
3
3.6
4
5.0
2
4.0
4
2.4
2
8.7
4
3.8
36
6
5.0
0
2
8.8
4
4.2
2
3.8
4
2.6
2
6.2
4
3.4
4
8.3
4
8.8
3
5.1
4
5.7
4
1.6
4
7.3
3
8.8
4
6.6
2
9.3
4
4.2
3
3.9
4
5.4
37
6
7.5
0
3
3.8
4
5.8
2
8.1
4
4.4
3
0.8
4
5.1
5
2.9
5
0.5
3
9.6
4
7.5
4
6.2
4
9.0
4
3.6
4
8.2
3
3.7
4
6.0
3
8.5
4
7.1
38
7
0.0
0
3
8.3
4
7.5
3
4.3
4
6.2
3
6.2
4
6.9
5
8.2
5
2.1
4
6.6
4
9.2
5
2.4
5
0.7
4
8.5
4
9.8
4
0.3
4
7.7
4
4.3
4
8.8
39
7
2.5
0
4
6.0
4
9.1
3
9.9
4
8.0
4
2.8
4
8.6
6
6.5
5
3.8
5
2.4
5
1.0
5
9.4
5
2.4
5
6.4
5
1.4
4
6.0
4
9.5
5
1.1
5
0.5
40
7
5.0
0
5
0.9
5
0.7
4
7.8
4
9.9
4
9.3
5
0.3
7
1.8
5
5.5
6
2.1
5
2.8
6
6.9
5
4.1
6
1.6
5
3.1
5
4.8
5
1.3
5
8.1
5
2.2
41
7
7.5
0
5
7.6
5
2.4
5
6.8
5
1.7
5
7.2
5
2.0
7
8.0
5
7.1
6
8.9
5
4.6
7
3.4
5
5.8
6
8.0
5
4.7
6
2.7
5
3.1
6
5.3
5
3.9
42
8
0.0
0
6
3.1
5
4.0
6
1.8
5
3.5
6
2.4
5
3.8
8
1.9
5
8.8
7
6.8
5
6.4
7
9.3
5
7.5
7
2.7
5
6.3
6
9.1
5
4.9
7
0.9
5
5.6
43
8
2.5
0
6
9.5
5
5.7
7
0.1
5
5.3
6
9.8
5
5.5
8
5.8
6
0.5
8
2.2
5
8.2
8
4.0
5
9.2
7
7.8
5
7.9
7
6.0
5
6.7
7
6.9
5
7.2
44
8
5.0
0
7
8.3
5
7.3
7
8.7
5
7.1
7
8.5
5
7.2
9
0.0
6
2.1
8
7.0
6
0.0
8
8.5
6
0.9
8
4.2
5
9.5
8
2.8
5
8.4
8
3.5
5
8.9
45
8
7.5
0
8
2.8
5
9.0
8
4.8
5
9.0
8
3.8
5
8.9
9
2.9
6
3.8
8
9.9
6
1.7
9
1.4
6
2.7
8
8.0
6
1.1
8
7.3
6
0.2
8
7.6
6
0.6
46
9
0.0
0
8
8.3
6
0.6
9
0.0
6
0.8
8
9.2
6
0.7
9
4.5
6
5.5
9
3.7
6
3.5
9
4.1
6
4.4
9
1.5
6
2.7
9
1.8
6
2.0
9
1.7
6
2.3
47
9
2.5
0
9
3.3
6
2.3
9
3.9
6
2.6
9
3.6
6
2.4
9
7.5
6
7.1
9
6.2
6
5.3
9
6.9
6
6.1
9
5.5
6
4.3
9
5.0
6
3.8
9
5.2
6
4.0
48
9
5.0
0
9
6.2
6
3.9
9
6.8
6
4.4
9
6.5
6
4.1
9
8.9
6
8.8
9
7.8
6
7.1
9
8.3
6
7.8
9
7.5
6
5.9
9
7.3
6
5.6
9
7.4
6
5.7
49
9
7.5
0
9
9.0
6
5.5
9
9.1
6
6.3
9
9.1
6
5.9
9
9.8
7
0.5
9
9.1
6
8.9
9
9.4
6
9.5
9
9.4
6
7.6
9
9.1
6
7.4
9
9.3
6
7.4
50
1
00
.00
100
.0
67.2
1
00
.0
68.1
1
00
.0
67.6
1
00
.0
72.1
1
00
.0
70.7
1
00
.0
71.2
1
00
.0
69.2
1
00
.0
69.1
1
00
.0
69.0
Tabl
e A4-
13:
UK
- U
nite
d K
ingd
om. I
ndiv
idua
l nor
m d
ata
KID
SCR
EE
N-1
0 In
dex
Not
e: C
alcu
latio
n of
sco
res
was
rest
ricte
d to
com
plet
e ca
ses.
PR =
per
cent
ile; T
S =
T-sc
ore
for t
he p
artic
ular
(sub
-)po
pula
tion
(M =
50.
SD
= 1
0).

Provision of National Norm Proxy Data for Individual Diagnostic Use
219
KIDSCREEN Health Related Quality ofLife Questionnaires
Appendix A5:Provision of National Norm Proxy Data for Individual DiagnosticUse (KIDSCREEN-10 Index)
Table A5-1: AT - Austria. Individual norm data KIDSCREEN-10-PROXY Index ........................221
Table A5-2: CH - Switzerland. Individual norm data KIDSCREEN-10-PROXY Index ........................222
Table A5-3: CZ - Czech Republic. Individual norm data KIDSCREEN-10-PROXY Index ........................223
Table A5-4: DE - Germany. Individual norm data KIDSCREEN-10-PROXY Index ........................224
Table A5-5: EL - Greece. Individual norm data KIDSCREEN-10-PROXY Index for Greece ......225
Table A5-6: ES - Spain. Individual norm data KIDSCREEN-10-PROXY Index ........................226
Table A5-7: FR - France. Individual norm data KIDSCREEN-10-PROXY Index ........................227
Table A5-8: HU - Hungary. Individual norm data KIDSCREEN-10-PROXY Index ........................228
Table A5-9: NL - Netherlands. Individual norm data KIDSCREEN-10-PROXY Index ........................229
Table A5-10: PL - Poland. Individual norm data KIDSCREEN-10-PROXY Index ........................230
Table A5-11: UK - United Kingdom. Individual norm data KIDSCREEN-10 Index........................................231

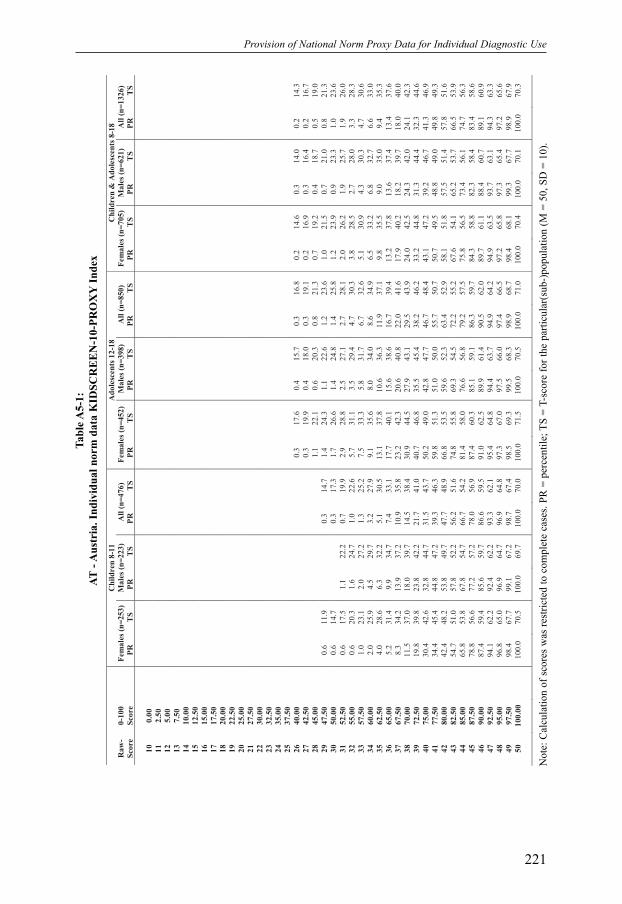
Provision of National Norm Proxy Data for Individual Diagnostic Use
221
C
hil
dren
8-1
1
Ad
ole
scen
ts 1
2-1
8
Ch
ild
ren
& A
do
lesc
en
ts 8
-18
Ra
w-
0-1
00
F
em
ale
s (n
=253
) M
ale
s (n
=223
) A
ll (
n=
476
) F
em
ale
s (n
=452
) M
ale
s (n
=398
) A
ll (
n=
850
) F
em
ale
s (n
=705
) M
ale
s (n
=621
) A
ll (
n=
1326
)
Sco
re
Sco
re
P
R
TS
P
R
TS
P
R
TS
P
R
TS
P
R
TS
P
R
TS
P
R
TS
P
R
TS
P
R
TS
10
0
.00
11
2
.50
12
5
.00
13
7
.50
14
1
0.0
0
15
1
2.5
0
16
1
5.0
0
17
1
7.5
0
18
2
0.0
0
19
2
2.5
0
20
2
5.0
0
21
2
7.5
0
22
3
0.0
0
23
3
2.5
0
24
3
5.0
0
25
3
7.5
0
26
4
0.0
0
0
.3
17.6
0
.4
15.7
0
.3
16.8
0
.2
14.6
0
.3
14.0
0
.2
14.3
27
4
2.5
0
0
.3
19.9
0
.4
18.0
0
.3
19.1
0
.2
16.9
0
.3
16.4
0
.2
16.7
28
4
5.0
0
1
.1
22.1
0
.6
20.3
0
.8
21.3
0
.7
19.2
0
.4
18.7
0
.5
19.0
29
4
7.5
0
0
.6
11.9
0
.3
14.7
1
.4
24.3
1
.1
22.6
1
.2
23.6
1
.0
21.5
0
.7
21.0
0
.8
21.3
30
5
0.0
0
0
.6
14.7
0
.3
17.3
1
.7
26.6
1
.4
24.8
1
.4
25.8
1
.2
23.9
0
.9
23.3
1
.0
23.6
31
5
2.5
0
0
.6
17.5
1
.1
22.2
0
.7
19.9
2
.9
28.8
2
.5
27.1
2
.7
28.1
2
.0
26.2
1
.9
25.7
1
.9
26.0
32
5
5.0
0
0
.6
20.3
1
.6
24.7
1
.0
22.6
5
.7
31.1
3
.5
29.4
4
.7
30.3
3
.8
28.5
2
.7
28.0
3
.3
28.3
33
5
7.5
0
1
.0
23.1
2
.0
27.2
1
.3
25.2
7
.5
33.3
5
.8
31.7
6
.7
32.6
5
.1
30.9
4
.3
30.3
4
.7
30.6
34
6
0.0
0
2
.0
25.9
4
.5
29.7
3
.2
27.9
9
.1
35.6
8
.0
34.0
8
.6
34.9
6
.5
33.2
6
.8
32.7
6
.6
33.0
35
6
2.5
0
4
.0
28.6
6
.3
32.2
5
.1
30.5
1
3.1
3
7.8
1
0.6
3
6.3
1
1.9
3
7.1
9
.8
35.5
9
.0
35.0
9
.4
35.3
36
6
5.0
0
5
.2
31.4
9
.9
34.7
7
.4
33.1
1
7.7
4
0.1
1
5.6
3
8.6
1
6.7
3
9.4
1
3.2
3
7.8
1
3.6
3
7.4
1
3.4
3
7.6
37
6
7.5
0
8
.3
34.2
1
3.9
3
7.2
1
0.9
3
5.8
2
3.2
4
2.3
2
0.6
4
0.8
2
2.0
4
1.6
1
7.9
4
0.2
1
8.2
3
9.7
1
8.0
4
0.0
38
7
0.0
0
1
1.5
3
7.0
1
8.0
3
9.7
1
4.5
3
8.4
3
0.9
4
4.5
2
7.9
4
3.1
2
9.5
4
3.9
2
4.0
4
2.5
2
4.3
4
2.0
2
4.1
4
2.3
39
7
2.5
0
1
9.8
3
9.8
2
3.8
4
2.2
2
1.7
4
1.0
4
0.7
4
6.8
3
5.5
4
5.4
3
8.2
4
6.2
3
3.2
4
4.8
3
1.3
4
4.4
3
2.3
4
4.6
40
7
5.0
0
3
0.4
4
2.6
3
2.8
4
4.7
3
1.5
4
3.7
5
0.2
4
9.0
4
2.8
4
7.7
4
6.7
4
8.4
4
3.1
4
7.2
3
9.2
4
6.7
4
1.3
4
6.9
41
7
7.5
0
3
4.4
4
5.4
4
4.8
4
7.2
3
9.3
4
6.3
5
9.8
5
1.3
5
1.0
5
0.0
5
5.7
5
0.7
5
0.7
4
9.5
4
8.8
4
9.0
4
9.8
4
9.3
42
8
0.0
0
4
2.4
4
8.2
5
3.8
4
9.7
4
7.7
4
8.9
6
6.8
5
3.5
5
9.6
5
2.3
6
3.4
5
2.9
5
8.1
5
1.8
5
7.5
5
1.4
5
7.8
5
1.6
43
8
2.5
0
5
4.7
5
1.0
5
7.8
5
2.2
5
6.2
5
1.6
7
4.8
5
5.8
6
9.3
5
4.5
7
2.2
5
5.2
6
7.6
5
4.1
6
5.2
5
3.7
6
6.5
5
3.9
44
8
5.0
0
6
5.8
5
3.8
6
7.8
5
4.7
6
6.7
5
4.2
8
1.4
5
8.0
7
6.6
5
6.8
7
9.2
5
7.5
7
5.8
5
6.5
7
3.4
5
6.1
7
4.7
5
6.3
45
8
7.5
0
7
8.8
5
6.6
7
7.2
5
7.2
7
8.0
5
6.9
8
7.4
6
0.3
8
5.1
5
9.1
8
6.3
5
9.7
8
4.3
5
8.8
8
2.3
5
8.4
8
3.4
5
8.6
46
9
0.0
0
8
7.4
5
9.4
8
5.6
5
9.7
8
6.6
5
9.5
9
1.0
6
2.5
8
9.9
6
1.4
9
0.5
6
2.0
8
9.7
6
1.1
8
8.4
6
0.7
8
9.1
6
0.9
47
9
2.5
0
9
4.1
6
2.2
9
2.4
6
2.2
9
3.3
6
2.1
9
5.4
6
4.8
9
4.4
6
3.7
9
4.9
6
4.2
9
4.9
6
3.5
9
3.7
6
3.1
9
4.3
6
3.3
48
9
5.0
0
9
6.8
6
5.0
9
6.9
6
4.7
9
6.9
6
4.8
9
7.3
6
7.0
9
7.5
6
6.0
9
7.4
6
6.5
9
7.2
6
5.8
9
7.3
6
5.4
9
7.2
6
5.6
49
9
7.5
0
9
8.4
6
7.7
9
9.1
6
7.2
9
8.7
6
7.4
9
8.5
6
9.3
9
9.5
6
8.3
9
8.9
6
8.7
9
8.4
6
8.1
9
9.3
6
7.7
9
8.9
6
7.9
50
1
00
.00
100
.0
70.5
1
00
.0
69.7
1
00
.0
70.0
1
00
.0
71.5
1
00
.0
70.5
1
00
.0
71.0
1
00
.0
70.4
1
00
.0
70.1
1
00
.0
70.3
Tabl
e A5-
1:AT
- Aus
tria
. Ind
ivid
ual n
orm
dat
a K
IDSC
RE
EN
-10-
PRO
XY
Inde
x
Not
e: C
alcu
latio
n of
sco
res
was
rest
ricte
d to
com
plet
e ca
ses.
PR =
per
cent
ile; T
S =
T-sc
ore
for t
he p
artic
ular
(sub
-)po
pula
tion
(M =
50,
SD
= 1
0).

Appendix A5
222
C
hil
dren
8-1
1
Ad
ole
scen
ts 1
2-1
8
Ch
ild
ren
& A
do
lesc
en
ts 8
-18
Ra
w-
0-1
00
F
em
ale
s (n
=289
) M
ale
s (n
=257
) A
ll (
n=
546
) F
em
ale
s (n
=570
) M
ale
s (n
=484
) A
ll (
n=
1054
) F
em
ale
s (n
=859
) M
ale
s (n
=741
) A
ll (
n=
1600
)
Sco
re
Sco
re
P
R
TS
P
R
TS
P
R
TS
P
R
TS
P
R
TS
P
R
TS
P
R
TS
P
R
TS
P
R
TS
10
0
.00
11
2
.50
12
5
.00
13
7
.50
14
1
0.0
0
15
1
2.5
0
16
1
5.0
0
17
1
7.5
0
18
2
0.0
0
19
2
2.5
0
20
2
5.0
0
21
2
7.5
0
22
3
0.0
0
23
3
2.5
0
24
3
5.0
0
25
3
7.5
0
0
.6
13.8
0
.3
11.8
0
.4
12.0
0
.2
10.5
26
4
0.0
0
0
.8
16.1
0
.3
11.4
0
.5
14.2
0
.5
14.3
0
.2
11.0
0
.3
12.9
27
4
2.5
0
1
.0
18.4
0
.3
14.0
0
.6
16.6
0
.6
16.7
0
.2
13.6
0
.4
15.4
28
4
5.0
0
0
.6
15.3
0
.3
15.2
1
.0
20.7
0
.5
16.5
0
.7
19.0
0
.6
19.1
0
.5
16.1
0
.5
17.8
29
4
7.5
0
0
.5
17.6
0
.6
17.9
0
.5
17.8
1
.2
23.0
0
.5
19.1
0
.8
21.4
0
.9
21.5
0
.5
18.7
0
.6
20.3
30
5
0.0
0
0
.9
20.2
1
.0
20.4
0
.8
20.3
1
.6
25.3
1
.1
21.6
1
.3
23.8
1
.3
23.9
1
.0
21.3
1
.1
22.7
31
5
2.5
0
1
.8
22.8
1
.4
23.0
1
.5
22.9
2
.5
27.6
1
.7
24.2
2
.1
26.2
2
.2
26.3
1
.5
23.8
1
.9
25.2
32
5
5.0
0
2
.5
25.4
2
.8
25.6
2
.6
25.5
4
.0
29.9
2
.1
26.7
3
.1
28.6
3
.5
28.6
2
.3
26.4
2
.9
27.7
33
5
7.5
0
4
.1
28.0
4
.3
28.2
4
.2
28.1
6
.3
32.2
3
.3
29.3
4
.9
31.0
5
.6
31.0
3
.6
28.9
4
.7
30.1
34
6
0.0
0
5
.2
30.6
5
.8
30.7
5
.5
30.7
9
.1
34.5
4
.9
31.8
7
.2
33.4
7
.8
33.4
5
.2
31.5
6
.6
32.6
35
6
2.5
0
6
.6
33.2
7
.1
33.3
6
.8
33.3
1
2.9
3
6.8
8
.2
34.4
1
0.8
3
5.8
1
0.8
3
5.8
7
.8
34.0
9
.4
35.0
36
6
5.0
0
9
.0
35.8
1
0.5
3
5.9
9
.7
35.9
1
6.1
3
9.1
1
1.1
3
6.9
1
3.8
3
8.2
1
3.7
3
8.2
1
0.9
3
6.6
1
2.4
3
7.5
37
6
7.5
0
1
3.8
3
8.4
1
4.4
3
8.5
1
4.1
3
8.4
2
0.5
4
1.4
1
6.9
3
9.5
1
8.8
4
0.6
1
8.3
4
0.5
1
6.1
3
9.1
1
7.2
3
9.9
38
7
0.0
0
2
0.4
4
1.0
1
9.9
4
1.0
2
0.2
4
1.0
2
7.0
4
3.7
2
4.3
4
2.0
2
5.8
4
3.0
2
4.8
4
2.9
2
2.8
4
1.7
2
3.9
4
2.4
39
7
2.5
0
2
7.0
4
3.6
2
6.9
4
3.6
2
7.0
4
3.6
3
5.9
4
6.0
3
2.6
4
4.6
3
4.4
4
5.4
3
2.9
4
5.3
3
0.6
4
4.3
3
1.9
4
4.9
40
7
5.0
0
3
7.8
4
6.2
3
5.9
4
6.2
3
6.9
4
6.2
4
4.7
4
8.3
4
1.3
4
7.1
4
3.2
4
7.8
4
2.4
4
7.7
3
9.4
4
6.8
4
1.0
4
7.3
41
7
7.5
0
4
6.8
4
8.8
4
8.3
4
8.8
4
7.5
4
8.8
5
3.3
5
0.6
5
2.7
4
9.7
5
3.0
5
0.2
5
1.1
5
0.1
5
1.2
4
9.4
5
1.1
4
9.8
42
8
0.0
0
5
8.2
5
1.4
5
5.3
5
1.3
5
6.9
5
1.4
6
2.1
5
2.9
6
2.4
5
2.2
6
2.2
5
2.6
6
0.8
5
2.5
5
9.9
5
1.9
6
0.4
5
2.2
43
8
2.5
0
6
8.9
5
4.0
6
6.2
5
3.9
6
7.6
5
4.0
7
3.0
5
5.3
7
0.9
5
4.8
7
2.0
5
5.0
7
1.6
5
4.8
6
9.2
5
4.5
7
0.5
5
4.7
44
8
5.0
0
8
3.1
5
6.6
7
9.8
5
6.5
8
1.5
5
6.5
8
0.6
5
7.6
7
8.9
5
7.3
7
9.8
5
7.4
8
1.4
5
7.2
7
9.2
5
7.0
8
0.4
5
7.1
45
8
7.5
0
8
7.9
5
9.2
8
8.3
5
9.1
8
8.1
5
9.1
8
7.9
5
9.9
8
8.0
5
9.9
8
8.0
5
9.8
8
7.9
5
9.6
8
8.1
5
9.6
8
8.0
5
9.6
46
9
0.0
0
9
1.0
6
1.8
9
3.0
6
1.6
9
1.9
6
1.7
9
2.5
6
2.2
9
2.6
6
2.4
9
2.5
6
2.3
9
2.0
6
2.0
9
2.7
6
2.2
9
2.3
6
2.0
47
9
2.5
0
9
3.4
6
4.4
9
5.3
6
4.2
9
4.3
6
4.3
9
5.8
6
4.5
9
6.1
6
5.0
9
5.9
6
4.7
9
5.0
6
4.4
9
5.8
6
4.7
9
5.4
6
4.5
48
9
5.0
0
9
7.2
6
7.0
9
6.5
6
6.8
9
6.9
6
6.9
9
8.4
6
6.8
9
8.1
6
7.5
9
8.3
6
7.1
9
8.0
6
6.8
9
7.6
6
7.3
9
7.8
6
7.0
49
9
7.5
0
9
9.0
6
9.6
9
9.2
6
9.4
9
9.1
6
9.5
9
9.6
6
9.1
9
9.2
7
0.1
9
9.4
6
9.5
9
9.4
6
9.1
9
9.2
6
9.8
9
9.3
6
9.4
50
1
00
.00
100
.0
72.2
1
00
.0
71.9
1
00
.0
72.1
1
00
.0
71.4
1
00
.0
72.6
1
00
.0
71.9
1
00
.0
71.5
1
00
.0
72.4
1
00
.0
71.9
Tabl
e A5-
2:
CH
- Sw
itzer
land
. Ind
ivid
ual n
orm
dat
a K
IDSC
RE
EN
-10-
PRO
XY
Inde
x
Not
e: C
alcu
latio
n of
sco
res
was
rest
ricte
d to
com
plet
e ca
ses.
PR =
per
cent
ile; T
S =
T-sc
ore
for t
he p
artic
ular
(sub
-)po
pula
tion
(M =
50,
SD
= 1
0).

Provision of National Norm Proxy Data for Individual Diagnostic Use
223
C
hil
dren
8-1
1
Ad
ole
scen
ts 1
2-1
8
Ch
ild
ren
& A
do
lesc
en
ts 8
-18
Ra
w-
0-1
00
F
em
ale
s (n
=276
) M
ale
s (n
=264
) A
ll (
n=
540
) F
em
ale
s (n
=502
) M
ale
s (n
=518
) A
ll (
n=
1020
) F
em
ale
s (n
=778
) M
ale
s (n
=782
) A
ll (
n=
1560
)
Sco
re
Sco
re
P
R
TS
P
R
TS
P
R
TS
P
R
TS
P
R
TS
P
R
TS
P
R
TS
P
R
TS
P
R
TS
10
0
.00
11
2
.50
12
5
.00
13
7
.50
14
1
0.0
0
15
1
2.5
0
16
1
5.0
0
17
1
7.5
0
18
2
0.0
0
19
2
2.5
0
20
2
5.0
0
21
2
7.5
0
0
.3
11.3
0
.2
9.5
0
.2
10.3
0
.1
9.1
22
3
0.0
0
0
.3
13.4
0
.2
11.7
0
.2
12.5
0
.1
11.3
23
3
2.5
0
0
.3
15.6
0
.2
14.0
0
.2
14.6
0
.1
13.5
24
3
5.0
0
0
.6
14.2
0
.3
14.2
0
.5
17.7
0
.3
14.6
0
.3
16.2
0
.3
16.8
0
.3
14.6
0
.3
15.7
25
3
7.5
0
0
.8
16.2
1
.0
16.5
0
.8
16.4
0
.5
19.9
0
.5
16.9
0
.4
18.5
0
.5
18.9
0
.6
16.9
0
.5
17.9
26
4
0.0
0
1
.3
18.4
1
.6
18.7
1
.3
18.6
1
.4
22.0
0
.5
19.2
0
.9
20.7
1
.3
21.0
0
.8
19.2
1
.0
20.2
27
4
2.5
0
1
.7
20.6
1
.6
21.0
1
.6
20.8
1
.7
24.2
0
.7
21.5
1
.1
22.9
1
.6
23.2
1
.0
21.4
1
.2
22.4
28
4
5.0
0
2
.9
22.8
1
.6
23.2
2
.2
23.0
2
.0
26.3
1
.4
23.9
1
.7
25.2
2
.3
25.3
1
.4
23.7
1
.9
24.6
29
4
7.5
0
3
.4
24.9
1
.6
25.5
2
.5
25.3
3
.2
28.5
2
.1
26.2
2
.6
27.4
3
.2
27.5
1
.9
26.0
2
.6
26.8
30
5
0.0
0
3
.8
27.1
2
.4
27.7
3
.0
27.5
4
.6
30.6
2
.7
28.5
3
.6
29.6
4
.2
29.6
2
.6
28.3
3
.4
29.0
31
5
2.5
0
4
.8
29.3
3
.1
30.0
3
.9
29.7
6
.1
32.8
3
.3
30.9
4
.7
31.9
5
.6
31.8
3
.2
30.6
4
.4
31.2
32
5
5.0
0
5
.5
31.5
4
.2
32.2
4
.8
31.9
8
.1
34.9
5
.2
33.2
6
.7
34.1
7
.2
33.9
4
.9
32.9
6
.0
33.4
33
5
7.5
0
6
.6
33.7
5
.7
34.5
6
.1
34.1
1
1.7
3
7.1
9
.7
35.5
1
0.7
3
6.3
9
.8
36.1
8
.3
35.2
9
.1
35.7
34
6
0.0
0
8
.7
35.9
1
1.4
3
6.7
1
0.0
3
6.3
1
5.7
3
9.2
1
4.5
3
7.8
1
5.1
3
8.6
1
3.2
3
8.2
1
3.4
3
7.5
1
3.3
3
7.9
35
6
2.5
0
1
1.2
3
8.1
1
5.2
3
9.0
1
3.1
3
8.6
2
1.5
4
1.4
1
9.9
4
0.2
2
0.7
4
0.8
1
7.8
4
0.3
1
8.3
3
9.8
1
8.1
4
0.1
36
6
5.0
0
1
7.0
4
0.3
2
1.3
4
1.2
1
9.1
4
0.8
2
6.9
4
3.5
2
4.1
4
2.5
2
5.5
4
3.0
2
3.4
4
2.5
2
3.2
4
2.1
2
3.3
4
2.3
37
6
7.5
0
2
2.8
4
2.5
2
8.5
4
3.5
2
5.6
4
3.0
3
5.2
4
5.7
3
1.1
4
4.8
3
3.1
4
5.3
3
0.8
4
4.6
3
0.2
4
4.4
3
0.5
4
4.5
38
7
0.0
0
2
9.3
4
4.7
3
7.9
4
5.7
3
3.5
4
5.2
4
4.4
4
7.8
4
2.1
4
7.2
4
3.2
4
7.5
3
9.1
4
6.8
4
0.7
4
6.7
3
9.9
4
6.7
39
7
2.5
0
3
8.4
4
6.9
4
4.3
4
8.0
4
1.3
4
7.4
5
1.8
5
0.0
5
1.3
4
9.5
5
1.6
4
9.7
4
7.1
4
8.9
4
9.0
4
9.0
4
8.0
4
8.9
40
7
5.0
0
4
8.5
4
9.1
5
5.3
5
0.2
5
1.8
4
9.7
6
0.4
5
2.1
6
1.9
5
1.8
6
1.2
5
2.0
5
6.2
5
1.1
5
9.7
5
1.3
5
7.9
5
1.2
41
7
7.5
0
5
5.7
5
1.3
6
2.5
5
2.5
5
9.0
5
1.9
6
9.1
5
4.3
7
0.0
5
4.1
6
9.6
5
4.2
6
4.4
5
3.2
6
7.5
5
3.5
6
5.9
5
3.4
42
8
0.0
0
6
5.9
5
3.5
7
0.8
5
4.7
6
8.3
5
4.1
7
6.5
5
6.4
7
8.4
5
6.5
7
7.4
5
6.4
7
2.7
5
5.4
7
5.8
5
5.8
7
4.3
5
5.6
43
8
2.5
0
7
3.9
5
5.7
7
7.2
5
7.0
7
5.5
5
6.3
8
3.9
5
8.6
8
4.6
5
8.8
8
4.2
5
8.7
8
0.3
5
7.5
8
2.1
5
8.1
8
1.2
5
7.8
44
8
5.0
0
8
2.6
5
7.9
8
4.8
5
9.2
8
3.7
5
8.5
8
9.4
6
0.7
9
0.0
6
1.1
8
9.7
6
0.9
8
7.0
5
9.6
8
8.2
6
0.4
8
7.6
6
0.0
45
8
7.5
0
8
8.4
6
0.1
9
0.1
6
1.5
8
9.2
6
0.7
9
3.2
6
2.9
9
2.8
6
3.4
9
3.0
6
3.1
9
1.5
6
1.8
9
1.9
6
2.7
9
1.7
6
2.2
46
9
0.0
0
9
3.9
6
2.3
9
3.9
6
3.7
9
3.9
6
3.0
9
6.2
6
5.0
9
5.7
6
5.8
9
6.0
6
5.4
9
5.4
6
3.9
9
5.1
6
5.0
9
5.3
6
4.4
47
9
2.5
0
9
5.3
6
4.5
9
7.0
6
6.0
9
6.1
6
5.2
9
7.6
6
7.2
9
7.9
6
8.1
9
7.7
6
7.6
9
6.8
6
6.1
9
7.6
6
7.3
9
7.2
6
6.7
48
9
5.0
0
9
8.9
6
6.7
9
8.5
6
8.2
9
8.7
6
7.4
9
9.0
6
9.3
9
8.4
7
0.4
9
8.7
6
9.8
9
9.0
6
8.2
9
8.5
6
9.6
9
8.7
6
8.9
49
9
7.5
0
9
9.6
6
8.9
9
9.6
7
0.5
9
9.6
6
9.6
9
9.2
7
1.5
9
9.2
7
2.8
9
9.2
7
2.1
9
9.3
7
0.4
9
9.4
7
1.9
9
9.4
7
1.1
50
1
00
.00
100
.0
71.1
1
00
.0
72.7
1
00
.0
71.8
1
00
.0
73.6
1
00
.0
75.1
1
00
.0
74.3
1
00
.0
72.5
1
00
.0
74.2
1
00
.0
73.3
Tabl
e A5-
3:
CZ
- C
zech
Rep
ublic
. Ind
ivid
ual n
orm
dat
a K
IDSC
RE
EN
-10-
PRO
XY
Inde
x
Not
e: C
alcu
latio
n of
sco
res
was
rest
ricte
d to
com
plet
e ca
ses.
PR =
per
cent
ile; T
S =
T-sc
ore
for t
he p
artic
ular
(sub
-)po
pula
tion
(M =
50,
SD
= 1
0).
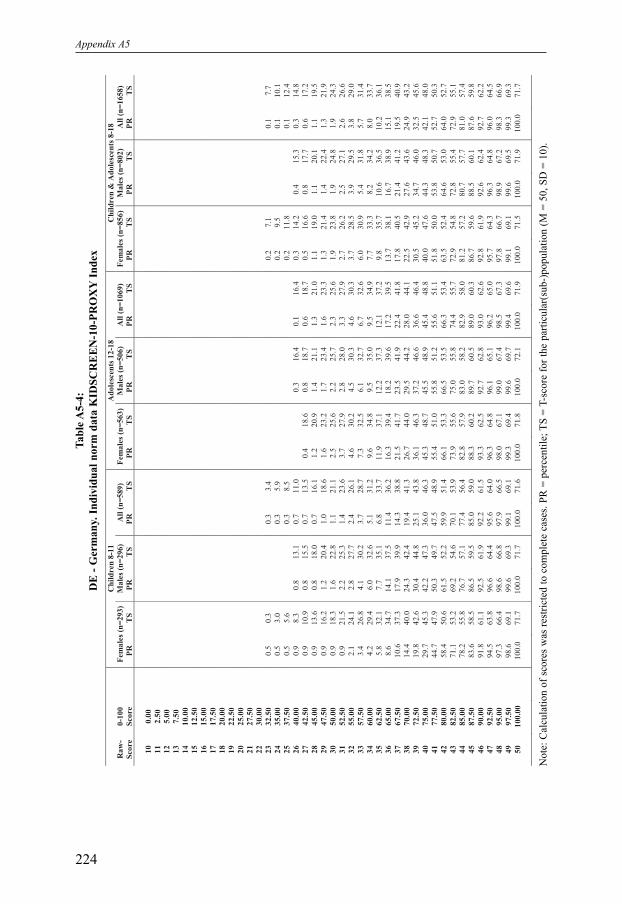
Appendix A5
224
C
hil
dren
8-1
1
Ad
ole
scen
ts 1
2-1
8
Ch
ild
ren
& A
do
lesc
en
ts 8
-18
Ra
w-
0-1
00
F
em
ale
s (n
=293
) M
ale
s (n
=296
) A
ll (
n=
589
) F
em
ale
s (n
=563
) M
ale
s (n
=506
) A
ll (
n=
1069
) F
em
ale
s (n
=856
) M
ale
s (n
=802
) A
ll (
n=
1658
)
Sco
re
Sco
re
P
R
TS
P
R
TS
P
R
TS
P
R
TS
P
R
TS
P
R
TS
P
R
TS
P
R
TS
P
R
TS
10
0
.00
11
2
.50
12
5
.00
13
7
.50
14
1
0.0
0
15
1
2.5
0
16
1
5.0
0
17
1
7.5
0
18
2
0.0
0
19
2
2.5
0
20
2
5.0
0
21
2
7.5
0
22
3
0.0
0
23
3
2.5
0
0
.5
0.3
0
.3
3.4
0
.2
7.1
0
.1
7.7
24
3
5.0
0
0
.5
3.0
0
.3
5.9
0
.2
9.5
0
.1
10.1
25
3
7.5
0
0
.5
5.6
0
.3
8.5
0
.2
11.8
0
.1
12.4
26
4
0.0
0
0
.9
8.3
0
.8
13.1
0
.7
11.0
0
.3
16.4
0
.1
16.4
0
.3
14.2
0
.4
15.3
0
.3
14.8
27
4
2.5
0
0
.9
10.9
0
.8
15.5
0
.7
13.5
0
.4
18.6
0
.8
18.7
0
.6
18.7
0
.5
16.6
0
.8
17.7
0
.6
17.2
28
4
5.0
0
0
.9
13.6
0
.8
18.0
0
.7
16.1
1
.2
20.9
1
.4
21.1
1
.3
21.0
1
.1
19.0
1
.1
20.1
1
.1
19.5
29
4
7.5
0
0
.9
16.2
1
.2
20.4
1
.0
18.6
1
.6
23.2
1
.7
23.4
1
.6
23.3
1
.3
21.4
1
.4
22.4
1
.3
21.9
30
5
0.0
0
0
.9
18.3
1
.6
22.8
1
.1
21.1
2
.5
25.6
2
.2
25.7
2
.3
25.6
1
.9
23.8
1
.9
24.8
1
.9
24.3
31
5
2.5
0
0
.9
21.5
2
.2
25.3
1
.4
23.6
3
.7
27.9
2
.8
28.0
3
.3
27.9
2
.7
26.2
2
.5
27.1
2
.6
26.6
32
5
5.0
0
2
.1
24.1
2
.8
27.7
2
.4
26.1
4
.6
30.2
4
.5
30.3
4
.6
30.3
3
.7
28.5
3
.9
29.5
3
.8
29.0
33
5
7.5
0
3
.4
26.8
4
.1
30.2
3
.7
28.7
7
.3
32.5
6
.1
32.7
6
.7
32.6
6
.0
30.9
5
.4
31.8
5
.7
31.4
34
6
0.0
0
4
.2
29.4
6
.0
32.6
5
.1
31.2
9
.6
34.8
9
.5
35.0
9
.5
34.9
7
.7
33.3
8
.2
34.2
8
.0
33.7
35
6
2.5
0
5
.8
32.1
7
.7
35.1
6
.8
33.7
1
1.9
3
7.1
1
2.2
3
7.3
1
2.1
3
7.2
9
.8
35.7
1
0.6
3
6.5
1
0.2
3
6.1
36
6
5.0
0
8
.6
34.7
1
4.1
3
7.5
1
1.4
3
6.2
1
6.3
3
9.4
1
8.2
3
9.6
1
7.2
3
9.5
1
3.7
3
8.1
1
6.7
3
8.9
1
5.1
3
8.5
37
6
7.5
0
1
0.6
3
7.3
1
7.9
3
9.9
1
4.3
3
8.8
2
1.5
4
1.7
2
3.5
4
1.9
2
2.4
4
1.8
1
7.8
4
0.5
2
1.4
4
1.2
1
9.5
4
0.9
38
7
0.0
0
1
4.4
4
0.0
2
4.3
4
2.4
1
9.4
4
1.3
2
6.7
4
4.0
2
9.5
4
4.2
2
8.0
4
4.1
2
2.5
4
2.9
2
7.6
4
3.6
2
4.9
4
3.2
39
7
2.5
0
1
9.8
4
2.6
3
0.4
4
4.8
2
5.1
4
3.8
3
6.1
4
6.3
3
7.2
4
6.6
3
6.6
4
6.4
3
0.5
4
5.2
3
4.7
4
6.0
3
2.5
4
5.6
40
7
5.0
0
2
9.7
4
5.3
4
2.2
4
7.3
3
6.0
4
6.3
4
5.3
4
8.7
4
5.5
4
8.9
4
5.4
4
8.8
4
0.0
4
7.6
4
4.3
4
8.3
4
2.1
4
8.0
41
7
7.5
0
4
4.7
4
7.9
5
0.3
4
9.7
4
7.5
4
8.9
5
5.4
5
1.0
5
5.8
5
1.2
5
5.6
5
1.1
5
1.8
5
0.0
5
3.8
5
0.7
5
2.7
5
0.3
42
8
0.0
0
5
8.4
5
0.6
6
1.5
5
2.2
5
9.9
5
1.4
6
6.1
5
3.3
6
6.5
5
3.5
6
6.3
5
3.4
6
3.5
5
2.4
6
4.6
5
3.0
6
4.0
5
2.7
43
8
2.5
0
7
1.1
5
3.2
6
9.2
5
4.6
7
0.1
5
3.9
7
3.9
5
5.6
7
5.0
5
5.8
7
4.4
5
5.7
7
2.9
5
4.8
7
2.8
5
5.4
7
2.9
5
5.1
44
8
5.0
0
7
8.2
5
5.8
7
6.7
5
7.1
7
7.4
5
6.4
8
2.8
5
7.9
8
3.0
5
8.2
8
2.9
5
8.0
8
1.2
5
7.2
8
0.7
5
7.7
8
1.0
5
7.4
45
8
7.5
0
8
3.6
5
8.5
8
6.5
5
9.5
8
5.0
5
9.0
8
8.3
6
0.2
8
9.7
6
0.5
8
9.0
6
0.3
8
6.7
5
9.6
8
8.5
6
0.1
8
7.6
5
9.8
46
9
0.0
0
9
1.8
6
1.1
9
2.5
6
1.9
9
2.2
6
1.5
9
3.3
6
2.5
9
2.7
6
2.8
9
3.0
6
2.6
9
2.8
6
1.9
9
2.6
6
2.4
9
2.7
6
2.2
47
9
2.5
0
9
4.5
6
3.8
9
6.6
6
4.4
9
5.6
6
4.0
9
6.3
6
4.8
9
6.1
6
5.1
9
6.2
6
5.0
9
5.7
6
4.3
9
6.3
6
4.8
9
6.0
6
4.5
48
9
5.0
0
9
7.3
6
6.4
9
8.6
6
6.8
9
7.9
6
6.5
9
8.0
6
7.1
9
9.0
6
7.4
9
8.5
6
7.3
9
7.8
6
6.7
9
8.9
6
7.2
9
8.3
6
6.9
49
9
7.5
0
9
8.6
6
9.1
9
9.6
6
9.3
9
9.1
6
9.1
9
9.3
6
9.4
9
9.6
6
9.7
9
9.4
6
9.6
9
9.1
6
9.1
9
9.6
6
9.5
9
9.3
6
9.3
50
1
00
.00
100
.0
71.7
1
00
.0
71.7
1
00
.0
71.6
1
00
.0
71.8
1
00
.0
72.1
1
00
.0
71.9
1
00
.0
71.5
1
00
.0
71.9
1
00
.0
71.7
Tabl
e A5-
4:
DE
- G
erm
any.
Indi
vidu
al n
orm
dat
a K
IDSC
RE
EN
-10-
PRO
XY
Inde
x
Not
e: C
alcu
latio
n of
sco
res
was
rest
ricte
d to
com
plet
e ca
ses.
PR =
per
cent
ile; T
S =
T-sc
ore
for t
he p
artic
ular
(sub
-)po
pula
tion
(M =
50,
SD
= 1
0).

Provision of National Norm Proxy Data for Individual Diagnostic Use
225
A
do
lesc
en
ts 1
2-1
8
Ra
w-
0-1
00
F
em
ale
s (n
=587
) M
ale
s (n
=390
) A
ll (
n=
977
)
Sco
re
Sco
re
P
R
TS
P
R
TS
P
R
TS
10
0
.00
11
2
.50
12
5
.00
13
7
.50
14
1
0.0
0
15
1
2.5
0
16
1
5.0
0
17
1
7.5
0
18
2
0.0
0
19
2
2.5
0
20
2
5.0
0
21
2
7.5
0
22
3
0.0
0
0
.4
12.6
0
.2
16.4
23
3
2.5
0
0
.3
20.2
0
.4
14.8
0
.3
18.4
24
3
5.0
0
0
.4
22.2
0
.4
16.9
0
.4
20.5
25
3
7.5
0
0
.7
24.2
0
.7
19.1
0
.6
22.5
26
4
0.0
0
1
.2
26.2
1
.3
21.3
1
.2
24.6
27
4
2.5
0
1
.9
28.2
1
.3
23.5
1
.7
26.6
28
4
5.0
0
2
.6
30.2
1
.9
25.7
2
.3
28.6
29
4
7.5
0
4
.9
32.2
2
.4
27.8
3
.9
30.7
30
5
0.0
0
7
.0
34.1
3
.6
30.0
5
.6
32.7
31
5
2.5
0
1
0.8
3
6.1
5
.4
32.2
8
.6
34.8
32
5
5.0
0
1
3.8
3
8.1
7
.2
34.4
1
1.2
3
6.8
33
5
7.5
0
1
8.8
4
0.1
1
0.2
3
6.5
1
5.4
3
8.8
34
6
0.0
0
2
4.6
4
2.1
1
4.8
3
8.7
2
0.7
4
0.9
35
6
2.5
0
3
2.5
4
4.1
1
9.9
4
0.9
2
7.5
4
2.9
36
6
5.0
0
3
9.4
4
6.0
2
5.8
4
3.1
3
3.9
4
5.0
37
6
7.5
0
4
5.2
4
8.0
3
3.3
4
5.3
4
0.4
4
7.0
38
7
0.0
0
5
2.8
5
0.0
4
3.2
4
7.4
4
9.0
4
9.0
39
7
2.5
0
6
1.6
5
2.0
5
2.0
4
9.6
5
7.7
5
1.1
40
7
5.0
0
6
8.4
5
4.0
6
0.7
5
1.8
6
5.3
5
3.1
41
7
7.5
0
7
4.7
5
6.0
6
8.6
5
4.0
7
2.3
5
5.2
42
8
0.0
0
8
0.9
5
7.9
7
5.3
5
6.2
7
8.6
5
7.2
43
8
2.5
0
8
5.8
5
9.9
8
2.7
5
8.3
8
4.6
5
9.3
44
8
5.0
0
8
9.2
6
1.9
8
8.9
6
0.5
8
9.1
6
1.3
45
8
7.5
0
9
1.8
6
3.9
9
1.8
6
2.7
9
1.8
6
3.3
46
9
0.0
0
9
5.0
6
5.9
9
4.6
6
4.9
9
4.9
6
5.4
47
9
2.5
0
9
7.4
6
7.9
9
7.2
6
7.1
9
7.3
6
7.4
48
9
5.0
0
9
9.0
6
9.9
9
9.2
6
9.2
9
9.1
6
9.5
49
9
7.5
0
9
9.5
7
1.8
9
9.2
7
1.4
9
9.4
7
1.5
50
1
00
.00
100
.0
73.8
1
00
.0
73.6
1
00
.0
73.5
Tabl
e A5-
5:
EL
- Gre
ece.
Indi
vidu
al n
orm
dat
a K
IDSC
RE
EN
-10-
PRO
XY
Inde
x fo
rG
reec
e
Not
e: C
alcu
latio
n of
sco
res
was
rest
ricte
d to
com
plet
e ca
ses.
PR =
per
cent
ile; T
S =
T-sc
ore
for t
he p
artic
ular
(sub
-)po
pula
tion
(M =
50,
SD
= 1
0).

Appendix A5
226
C
hil
dren
8-1
1
Ad
ole
scen
ts 1
2-1
8
Ch
ild
ren
& A
do
lesc
en
ts 8
-18
Ra
w-
0-1
00
F
em
ale
s (n
=138
) M
ale
s (n
=160
) A
ll (
n=
298
) F
em
ale
s (n
=255
) M
ale
s (n
=235
) A
ll (
n=
490
) F
em
ale
s (n
=393
) M
ale
s (n
=395
) A
ll (
n=
788
)
Sco
re
Sco
re
P
R
TS
P
R
TS
P
R
TS
P
R
TS
P
R
TS
P
R
TS
P
R
TS
P
R
TS
P
R
TS
10
0
.00
11
2
.50
12
5
.00
13
7
.50
14
1
0.0
0
15
1
2.5
0
16
1
5.0
0
17
1
7.5
0
18
2
0.0
0
19
2
2.5
0
20
2
5.0
0
21
2
7.5
0
22
3
0.0
0
23
3
2.5
0
24
3
5.0
0
25
3
7.5
0
26
4
0.0
0
0
.6
18.9
0
.3
17.5
0
.4
16.4
0
.2
15.3
27
4
2.5
0
1
.3
21.0
0
.7
18.0
0
.8
19.7
0
.8
18.5
0
.4
16.3
0
.5
17.5
28
4
5.0
0
1
.3
23.1
1
.1
20.3
1
.1
21.8
0
.8
20.7
0
.6
18.6
0
.7
19.7
29
4
7.5
0
2
.1
25.1
1
.1
22.6
1
.5
24.0
1
.3
22.8
0
.6
20.9
0
.9
21.9
30
5
0.0
0
1
.1
18.7
0
.5
19.0
3
.2
27.2
1
.8
24.9
2
.5
26.2
2
.3
25.0
1
.1
23.2
1
.7
24.1
31
5
2.5
0
1
.1
21.2
0
.5
21.5
3
.7
29.2
3
.0
27.2
3
.3
28.3
2
.7
27.1
1
.8
25.5
2
.2
26.4
32
5
5.0
0
1
.1
23.7
1
.0
24.0
0
.9
23.9
4
.8
31.3
4
.3
29.5
4
.5
30.5
3
.4
29.3
2
.8
27.8
3
.0
28.6
33
5
7.5
0
1
.1
26.1
3
.2
26.4
2
.0
26.3
6
.0
33.4
6
.3
31.8
6
.1
32.7
4
.1
31.4
5
.0
30.1
4
.6
30.8
34
6
0.0
0
3
.0
28.6
5
.1
28.9
4
.0
28.7
1
0.2
3
5.4
8
.1
34.1
9
.2
34.8
7
.6
33.6
6
.8
32.4
7
.2
33.0
35
6
2.5
0
4
.5
31.0
6
.4
31.3
5
.4
31.2
1
3.3
3
7.5
1
1.9
3
6.4
1
2.7
3
7.0
1
0.2
3
5.7
9
.6
34.7
9
.9
35.2
36
6
5.0
0
6
.6
33.5
9
.4
33.7
8
.0
33.6
1
6.9
3
9.6
1
4.5
3
8.6
1
5.8
3
9.2
1
3.2
3
7.9
1
2.4
3
7.0
1
2.8
3
7.5
37
6
7.5
0
1
1.6
3
6.0
1
2.6
3
6.1
1
2.1
3
6.1
2
2.4
4
1.6
1
8.3
4
0.9
2
0.4
4
1.3
1
8.6
4
0.0
1
6.0
3
9.3
1
7.3
3
9.7
38
7
0.0
0
1
8.0
3
8.4
1
6.3
3
8.6
1
7.1
3
8.5
2
6.2
4
3.7
2
6.0
4
3.2
2
6.1
4
3.5
2
3.4
4
2.2
2
2.0
4
1.6
2
2.7
4
1.9
39
7
2.5
0
2
3.0
4
0.9
2
0.7
4
1.0
2
1.8
4
1.0
3
4.1
4
5.8
3
5.7
4
5.5
3
4.9
4
5.7
3
0.2
4
4.4
2
9.6
4
3.9
2
9.9
4
4.1
40
7
5.0
0
2
8.2
4
3.4
2
6.9
4
3.4
2
7.5
4
3.4
4
3.1
4
7.8
4
5.4
4
7.8
4
4.2
4
7.8
3
7.9
4
6.5
3
7.9
4
6.2
3
7.9
4
6.3
41
7
7.5
0
3
7.6
4
5.8
3
7.5
4
5.9
3
7.6
4
5.8
5
2.9
4
9.9
5
1.8
5
0.1
5
2.4
5
0.0
4
7.6
4
8.7
4
6.0
4
8.5
4
6.8
4
8.6
42
8
0.0
0
4
4.1
4
8.3
4
5.0
4
8.3
4
4.6
4
8.3
6
1.6
5
2.0
6
0.4
5
2.4
6
1.0
5
2.2
5
5.4
5
0.8
5
4.2
5
0.8
5
4.8
5
0.8
43
8
2.5
0
5
5.0
5
0.7
5
2.5
5
0.7
5
3.7
5
0.7
6
7.5
5
4.1
7
0.6
5
4.7
6
9.0
5
4.3
6
3.1
5
3.0
6
3.3
5
3.1
6
3.2
5
3.0
44
8
5.0
0
6
6.6
5
3.2
6
1.9
5
3.1
6
4.1
5
3.2
7
4.5
5
6.1
7
7.0
5
7.0
7
5.7
5
6.5
7
1.7
5
5.1
7
0.9
5
5.4
7
1.3
5
5.2
45
8
7.5
0
7
1.7
5
5.7
7
0.1
5
5.6
7
0.8
5
5.6
8
0.8
5
8.2
8
3.4
5
9.3
8
2.1
5
8.7
7
7.6
5
7.3
7
8.0
5
7.7
7
7.8
5
7.4
46
9
0.0
0
7
9.0
5
8.1
7
6.3
5
8.0
7
7.5
5
8.0
8
6.8
6
0.3
8
9.3
6
1.6
8
8.0
6
0.8
8
4.0
5
9.4
8
4.0
6
0.0
8
4.0
5
9.7
47
9
2.5
0
8
8.4
6
0.6
9
0.0
6
0.4
8
9.3
6
0.5
9
0.6
6
2.3
9
5.3
6
3.9
9
2.9
6
3.0
8
9.9
6
1.6
9
3.1
6
2.2
9
1.5
6
1.9
48
9
5.0
0
9
2.0
6
3.0
9
5.6
6
2.8
9
4.0
6
2.9
9
4.5
6
4.4
9
8.7
6
6.1
9
6.5
6
5.2
9
3.7
6
3.7
9
7.5
6
4.5
9
5.6
6
4.1
49
9
7.5
0
9
7.8
6
5.5
1
00
.0
65.3
9
9.0
6
5.4
9
8.0
6
6.5
1
00
.0
68.4
9
9.0
6
7.3
9
8.0
6
5.9
1
00
.0
66.8
9
9.0
6
6.3
50
1
00
.00
100
.0
68.0
1
00
.0
67.8
1
00
.0
68.5
1
00
.0
69.5
1
00
.0
68.0
1
00
.0
68.5
Tabl
e A5-
6:E
S - S
pain
. Ind
ivid
ual n
orm
dat
a K
IDSC
RE
EN
-10-
PRO
XY
Inde
x
Not
e: C
alcu
latio
n of
sco
res
was
rest
ricte
d to
com
plet
e ca
ses.
PR =
per
cent
ile; T
S =
T-sc
ore
for t
he p
artic
ular
(sub
-)po
pula
tion
(M =
50,
SD
= 1
0).

Provision of National Norm Proxy Data for Individual Diagnostic Use
227
C
hil
dren
8-1
1
Ad
ole
scen
ts 1
2-1
8
Ch
ild
ren
& A
do
lesc
en
ts 8
-18
Ra
w-
0-1
00
F
em
ale
s (n
=180
) M
ale
s (n
=185
) A
ll (
n=
365
) F
em
ale
s (n
=308
) M
ale
s (n
=282
) A
ll (
n=
590
) F
em
ale
s (n
=488
) M
ale
s (n
=467
) A
ll (
n=
955
)
Sco
re
Sco
re
P
R
TS
P
R
TS
P
R
TS
P
R
TS
P
R
TS
P
R
TS
P
R
TS
P
R
TS
P
R
TS
10
0
.00
11
2
.50
12
5
.00
13
7
.50
14
1
0.0
0
15
1
2.5
0
16
1
5.0
0
17
1
7.5
0
18
2
0.0
0
19
2
2.5
0
20
2
5.0
0
0
.5
18.0
0
.3
18.4
0
.3
16.2
0
.2
16.1
21
2
7.5
0
0
.5
20.7
0
.5
19.9
0
.4
20.4
0
.3
18.1
0
.3
18.1
0
.3
18.1
22
3
0.0
0
0
.5
22.7
0
.5
21.9
0
.4
22.3
0
.3
20.1
0
.3
20.1
0
.3
20.1
23
3
2.5
0
0
.8
24.6
0
.5
23.8
0
.6
24.2
0
.5
22.0
0
.3
22.0
0
.4
22.0
24
3
5.0
0
1
.4
26.5
0
.5
25.8
0
.9
26.2
0
.9
24.0
0
.3
24.0
0
.5
24.0
25
3
7.5
0
0
.9
21.5
0
.4
20.0
1
.8
28.5
2
.2
27.7
1
.9
28.1
1
.1
26.0
1
.5
25.9
1
.3
26.0
26
4
0.0
0
1
.4
23.6
0
.7
22.2
2
.4
30.4
2
.7
29.6
2
.4
30.1
1
.5
28.0
2
.0
27.9
1
.7
27.9
27
4
2.5
0
2
.0
25.7
1
.0
24.4
3
.9
32.4
3
.6
31.6
3
.7
32.0
2
.5
30.0
2
.8
29.8
2
.6
29.9
28
4
5.0
0
2
.9
27.8
1
.4
26.6
6
.2
34.3
7
.9
33.5
7
.0
33.9
3
.9
32.0
5
.8
31.8
4
.8
31.9
29
4
7.5
0
0
.9
27.5
3
.9
29.8
2
.2
28.8
1
0.4
3
6.2
1
1.1
3
5.4
1
0.7
3
5.9
6
.8
34.0
8
.2
33.7
7
.4
33.8
30
5
0.0
0
1
.4
29.8
6
.0
31.9
3
.5
30.9
1
4.0
3
8.2
1
2.9
3
7.4
1
3.4
3
7.8
9
.2
35.9
1
0.1
3
5.6
9
.6
35.8
31
5
2.5
0
5
.1
32.1
7
.6
34.0
6
.3
33.1
1
9.1
4
0.1
1
6.4
3
9.3
1
7.8
3
9.8
1
4.0
3
7.9
1
2.9
3
7.6
1
3.4
3
7.8
32
5
5.0
0
9
.0
34.4
9
.7
36.1
9
.3
35.3
2
6.0
4
2.1
2
0.3
4
1.3
2
3.3
4
1.7
1
9.7
3
9.9
1
6.1
3
9.5
1
8.0
3
9.7
33
5
7.5
0
1
4.5
3
6.7
1
4.1
3
8.1
1
4.3
3
7.5
3
2.4
4
4.0
2
6.1
4
3.2
2
9.4
4
3.6
2
5.8
4
1.9
2
1.3
4
1.5
2
3.6
4
1.7
34
6
0.0
0
1
8.4
3
9.0
1
8.9
4
0.2
1
8.7
3
9.7
3
9.9
4
5.9
3
3.9
4
5.2
3
7.1
4
5.6
3
2.0
4
3.9
2
8.0
4
3.4
3
0.0
4
3.7
35
6
2.5
0
2
4.6
4
1.3
2
6.5
4
2.3
2
5.6
4
1.9
4
7.1
4
7.9
4
1.0
4
7.1
4
4.2
4
7.5
3
8.8
4
5.9
3
5.3
4
5.4
3
7.1
4
5.6
36
6
5.0
0
3
2.9
4
3.6
3
2.5
4
4.4
3
2.7
4
4.0
5
3.6
4
9.8
5
1.2
4
9.0
5
2.5
4
9.5
4
6.0
4
7.9
4
3.8
4
7.3
4
4.9
4
7.6
37
6
7.5
0
3
7.9
4
6.0
4
0.6
4
6.4
3
9.3
4
6.2
6
1.4
5
1.8
5
9.4
5
1.0
6
0.5
5
1.4
5
2.8
4
9.9
5
2.0
4
9.3
5
2.4
4
9.6
38
7
0.0
0
4
5.1
4
8.3
4
6.0
4
8.5
4
5.5
4
8.4
6
6.3
5
3.7
6
6.8
5
2.9
6
6.5
5
3.3
5
8.5
5
1.9
5
8.6
5
1.2
5
8.5
5
1.5
39
7
2.5
0
5
3.9
5
0.6
5
3.6
5
0.6
5
3.7
5
0.6
7
3.2
5
5.7
7
2.5
5
4.9
7
2.8
5
5.3
6
6.1
5
3.8
6
5.0
5
3.2
6
5.5
5
3.5
40
7
5.0
0
6
4.0
5
2.9
5
9.5
5
2.7
6
1.7
5
2.8
7
9.6
5
7.6
7
8.8
5
6.8
7
9.2
5
7.2
7
3.8
5
5.8
7
1.2
5
5.1
7
2.5
5
5.5
41
7
7.5
0
7
4.5
5
5.2
6
8.6
5
4.7
7
1.5
5
5.0
8
4.4
5
9.5
8
2.3
5
8.7
8
3.4
5
9.1
8
0.8
5
7.8
7
6.9
5
7.1
7
8.9
5
7.4
42
8
0.0
0
8
1.7
5
7.5
7
7.2
5
6.8
7
9.4
5
7.1
8
9.0
6
1.5
8
5.5
6
0.7
8
7.3
6
1.1
8
6.3
5
9.8
8
2.2
5
9.0
8
4.3
5
9.4
43
8
2.5
0
8
6.7
5
9.8
8
2.6
5
8.9
8
4.6
5
9.3
9
1.6
6
3.4
9
0.8
6
2.6
9
1.2
6
3.0
8
9.8
6
1.8
8
7.6
6
0.9
8
8.7
6
1.4
44
8
5.0
0
9
1.1
6
2.2
8
7.0
6
1.0
8
9.0
6
1.5
9
4.8
6
5.4
9
4.7
6
4.6
9
4.8
6
5.0
9
3.4
6
3.8
9
1.6
6
2.9
9
2.6
6
3.3
45
8
7.5
0
9
3.9
6
4.5
9
2.9
6
3.1
9
3.4
6
3.7
9
6.4
6
7.3
9
6.5
6
6.5
9
6.4
6
6.9
9
5.5
6
5.8
9
5.1
6
4.8
9
5.3
6
5.3
46
9
0.0
0
9
6.1
6
6.8
9
6.7
6
5.1
9
6.4
6
5.9
9
7.7
6
9.2
9
7.6
6
8.5
9
7.6
6
8.8
9
7.1
6
7.8
9
7.2
6
6.8
9
7.2
6
7.3
47
9
2.5
0
9
7.8
6
9.1
9
8.4
6
7.2
9
8.1
6
8.0
9
9.0
7
1.2
9
8.3
7
0.4
9
8.7
7
0.8
9
8.6
6
9.7
9
8.3
6
8.7
9
8.4
6
9.2
48
9
5.0
0
9
8.9
7
1.4
1
00
.0
69.3
9
9.5
7
0.2
9
9.7
7
3.1
9
8.9
7
2.3
9
9.3
7
2.7
9
9.4
7
1.7
9
9.4
7
0.7
9
9.4
7
1.2
49
9
7.5
0
9
9.4
7
3.7
9
9.7
7
2.4
9
9.7
7
5.1
1
00
.0
74.3
9
9.8
7
4.7
9
9.6
7
3.7
1
00
.0
72.6
9
9.8
7
3.2
50
1
00
.00
100
.0
76.0
1
00
.0
74.6
1
00
.0
77.0
1
00
.0
76.6
1
00
.0
75.7
1
00
.0
75.1
Tabl
e A5-
7:
FR -
Fran
ce. I
ndiv
idua
l nor
m d
ata
KID
SCR
EE
N-1
0-PR
OX
YIn
dex
Not
e: C
alcu
latio
n of
sco
res
was
rest
ricte
d to
com
plet
e ca
ses.
PR =
per
cent
ile; T
S =
T-sc
ore
for t
he p
artic
ular
(sub
-)po
pula
tion
(M =
50,
SD
= 1
0).

Appendix A5
228
C
hil
dren
8-1
1
Ad
ole
scen
ts 1
2-1
8
Ch
ild
ren
& A
do
lesc
en
ts 8
-18
Ra
w-
0-1
00
F
em
ale
s (n
=478
) M
ale
s (n
=362
) A
ll (
n=
840
) F
em
ale
s (n
=675
) M
ale
s (n
=374
) A
ll (
n=
1049
) F
em
ale
s (n
=115
3)
Ma
les
(n=
736
) A
ll (
n=
1889
)
Sco
re
Sco
re
P
R
TS
P
R
TS
P
R
TS
P
R
TS
P
R
TS
P
R
TS
P
R
TS
P
R
TS
P
R
TS
10
0
.00
11
2
.50
12
5
.00
13
7
.50
14
1
0.0
0
15
1
2.5
0
16
1
5.0
0
17
1
7.5
0
0
.4
5.5
0
.2
2.5
0
.2
6.4
0
.1
7.8
18
2
0.0
0
0
.4
7.4
0
.2
4.5
0
.2
12.9
0
.2
11.7
0
.1
10.5
0
.2
8.3
0
.1
9.7
19
2
2.5
0
0
.4
9.3
0
.2
6.5
0
.2
14.8
0
.2
13.6
0
.1
12.4
0
.2
10.3
0
.1
11.6
20
2
5.0
0
0
.4
11.2
0
.2
8.5
0
.2
16.6
0
.2
15.4
0
.1
14.2
0
.2
12.2
0
.1
13.5
21
2
7.5
0
0
.4
13.1
0
.2
10.5
0
.2
18.5
0
.4
14.5
0
.2
17.3
0
.1
16.1
0
.3
14.1
0
.2
15.4
22
3
0.0
0
0
.4
15.1
0
.2
12.5
0
.2
20.3
0
.4
16.5
0
.2
19.2
0
.1
17.9
0
.3
16.0
0
.2
17.3
23
3
2.5
0
0
.3
12.2
0
.4
17.0
0
.3
14.5
0
.5
22.2
0
.4
18.5
0
.4
21.1
0
.4
19.8
0
.3
18.0
0
.3
19.1
24
3
5.0
0
0
.3
14.3
0
.4
18.9
0
.3
16.5
0
.7
24.1
0
.7
20.5
0
.6
23.0
0
.5
21.7
0
.5
19.9
0
.4
21.0
25
3
7.5
0
0
.3
16.4
0
.4
20.8
0
.3
18.5
1
.0
26.0
0
.9
22.4
0
.9
24.9
0
.7
23.5
0
.6
21.8
0
.6
22.9
26
4
0.0
0
0
.3
18.5
0
.7
22.7
0
.4
20.5
1
.2
27.8
1
.6
24.4
1
.3
26.8
0
.8
25.4
1
.1
23.8
0
.9
24.8
27
4
2.5
0
0
.7
20.6
1
.4
24.6
1
.0
22.5
2
.2
29.7
2
.2
26.4
2
.2
28.7
1
.6
27.3
1
.8
25.7
1
.6
26.7
28
4
5.0
0
1
.1
22.7
1
.4
26.5
1
.2
24.5
4
.0
31.6
2
.5
28.3
3
.4
30.6
2
.8
29.1
2
.0
27.6
2
.4
28.6
29
4
7.5
0
1
.5
24.7
3
.3
28.4
2
.3
26.5
5
.7
33.4
4
.2
30.3
5
.1
32.5
3
.9
31.0
3
.8
29.5
3
.9
30.4
30
5
0.0
0
3
.2
26.8
4
.4
30.3
3
.7
28.5
9
.8
35.3
6
.1
32.3
8
.5
34.4
7
.0
32.8
5
.3
31.5
6
.4
32.3
31
5
2.5
0
4
.0
28.9
5
.5
32.2
4
.7
30.5
1
3.8
3
7.2
8
.8
34.2
1
2.0
3
6.2
9
.7
34.7
7
.2
33.4
8
.7
34.2
32
5
5.0
0
6
.3
31.0
8
.3
34.1
7
.2
32.5
1
8.7
3
9.0
1
0.1
3
6.2
1
5.6
3
8.1
1
3.5
3
6.6
9
.2
35.3
1
1.9
3
6.1
33
5
7.5
0
7
.6
33.1
1
1.9
3
6.1
9
.4
34.5
2
2.6
4
0.9
1
4.4
3
8.2
1
9.7
4
0.0
1
6.4
3
8.4
1
3.2
3
7.2
1
5.1
3
8.0
34
6
0.0
0
9
.0
35.2
1
4.4
3
8.0
1
1.3
3
6.5
2
6.2
4
2.8
1
7.4
4
0.2
2
3.1
4
1.9
1
9.1
4
0.3
1
5.9
3
9.2
1
7.8
3
9.9
35
6
2.5
0
1
2.8
3
7.3
1
7.7
3
9.9
1
4.9
3
8.5
3
2.6
4
4.6
2
4.1
4
2.1
2
9.6
4
3.8
2
4.4
4
2.2
2
0.9
4
1.1
2
3.0
4
1.8
36
6
5.0
0
1
6.5
3
9.4
2
2.6
4
1.8
1
9.1
4
0.5
3
8.4
4
6.5
3
0.5
4
4.1
3
5.6
4
5.7
2
9.3
4
4.0
2
6.6
4
3.0
2
8.3
4
3.6
37
6
7.5
0
2
0.9
4
1.5
2
7.0
4
3.7
2
3.5
4
2.5
4
6.0
4
8.4
3
6.7
4
6.1
4
2.6
4
7.6
3
5.6
4
5.9
3
1.9
4
4.9
3
4.1
4
5.5
38
7
0.0
0
2
5.5
4
3.6
3
3.7
4
5.6
2
9.0
4
4.5
5
2.9
5
0.2
4
4.1
4
8.0
4
9.8
4
9.5
4
1.5
4
7.8
3
9.0
4
6.9
4
0.5
4
7.4
39
7
2.5
0
3
3.9
4
5.7
4
1.2
4
7.5
3
7.1
4
6.5
6
1.0
5
2.1
5
0.8
5
0.0
5
7.4
5
1.4
4
9.8
4
9.6
4
6.1
4
8.8
4
8.3
4
9.3
40
7
5.0
0
4
2.1
4
7.7
4
8.3
4
9.4
4
4.8
4
8.5
6
6.7
5
4.0
5
6.5
5
2.0
6
3.0
5
3.3
5
6.5
5
1.5
5
2.5
5
0.7
5
4.9
5
1.2
41
7
7.5
0
5
0.4
4
9.8
5
6.3
5
1.3
5
3.0
5
0.5
7
3.6
5
5.8
6
5.8
5
4.0
7
0.8
5
5.1
6
4.0
5
3.3
6
1.1
5
2.6
6
2.9
5
3.1
42
8
0.0
0
5
9.8
5
1.9
6
3.0
5
3.3
6
1.2
5
2.5
7
9.6
5
7.7
7
4.9
5
5.9
7
7.9
5
7.0
7
1.4
5
5.2
6
9.0
5
4.6
7
0.5
5
5.0
43
8
2.5
0
6
6.3
5
4.0
6
9.1
5
5.2
6
7.5
5
4.5
8
4.5
5
9.5
8
0.0
5
7.9
8
2.9
5
8.9
7
6.9
5
7.1
7
4.6
5
6.5
7
6.0
5
6.8
44
8
5.0
0
7
3.5
5
6.1
7
5.2
5
7.1
7
4.2
5
6.5
8
8.5
6
1.4
8
6.9
5
9.9
8
7.9
6
0.8
8
2.2
5
8.9
8
1.1
5
8.4
8
1.8
5
8.7
45
8
7.5
0
8
0.8
5
8.2
8
2.1
5
9.0
8
1.3
5
8.5
9
1.8
6
3.3
9
2.2
6
1.8
9
2.0
6
2.7
8
7.3
6
0.8
8
7.2
6
0.3
8
7.2
6
0.6
46
9
0.0
0
8
7.7
6
0.3
8
9.5
6
0.9
8
8.5
6
0.5
9
5.3
6
5.1
9
5.1
6
3.8
9
5.2
6
4.6
9
2.1
6
2.7
9
2.4
6
2.3
9
2.2
6
2.5
47
9
2.5
0
9
3.3
6
2.4
9
5.0
6
2.8
9
4.0
6
2.5
9
7.5
6
7.0
9
6.8
6
5.8
9
7.2
6
6.5
9
5.7
6
4.5
9
5.9
6
4.2
9
5.8
6
4.4
48
9
5.0
0
9
6.4
6
4.5
9
6.7
6
4.7
9
6.5
6
4.5
9
8.5
6
8.9
9
8.1
6
7.8
9
8.4
6
8.4
9
7.6
6
6.4
9
7.4
6
6.1
9
7.6
6
6.3
49
9
7.5
0
9
8.3
6
6.6
9
8.6
6
6.6
9
8.4
6
6.5
9
9.6
7
0.7
9
9.2
6
9.7
9
9.4
7
0.3
9
9.0
6
8.2
9
8.9
6
8.0
9
9.0
6
8.1
50
1
00
.00
100
.0
68.7
1
00
.0
68.5
1
00
.0
68.5
1
00
.0
72.6
1
00
.0
71.7
1
00
.0
72.2
1
00
.0
70.1
1
00
.0
69.9
1
00
.0
70.0
Tabl
e A5-
8:
HU
- H
unga
ry. I
ndiv
idua
l nor
m d
ata
KID
SCR
EE
N-1
0-PR
OX
YIn
dex
Not
e: C
alcu
latio
n of
sco
res
was
rest
ricte
d to
com
plet
e ca
ses.
PR =
per
cent
ile; T
S =
T-sc
ore
for t
he p
artic
ular
(sub
-)po
pula
tion
(M =
50,
SD
= 1
0).

Provision of National Norm Proxy Data for Individual Diagnostic Use
229
C
hil
dren
8-1
1
Ad
ole
scen
ts 1
2-1
8
Ch
ild
ren
& A
do
lesc
en
ts 8
-18
Ra
w-
0-1
00
F
em
ale
s (n
=320
) M
ale
s (n
=322
) A
ll (
n=
642
) F
em
ale
s (n
=593
) M
ale
s (n
=548
) A
ll (
n=
1151
) F
em
ale
s (n
=913
) M
ale
s (n
=870
) A
ll (
n=
1783
)
Sco
re
Sco
re
P
R
TS
P
R
TS
P
R
TS
P
R
TS
P
R
TS
P
R
TS
P
R
TS
P
R
TS
P
R
TS
10
0
.00
11
2
.50
12
5
.00
13
7
.50
14
1
0.0
0
15
1
2.5
0
16
1
5.0
0
17
1
7.5
0
18
2
0.0
0
19
2
2.5
0
20
2
5.0
0
21
2
7.5
0
22
3
0.0
0
0
.3
9.0
0
.1
6.5
0
.2
6.7
0
.1
4.3
23
3
2.5
0
0
.3
11.2
0
.1
8.8
0
.2
8.9
0
.1
6.6
24
3
5.0
0
0
.3
13.4
0
.1
11.0
0
.2
11.2
0
.1
9.0
25
3
7.5
0
0
.4
15.6
0
.2
13.3
0
.3
13.4
0
.1
11.3
26
4
0.0
0
0
.6
17.8
0
.3
15.6
0
.4
15.7
0
.2
13.6
27
4
2.5
0
0
.6
20.0
0
.3
17.9
0
.4
17.9
0
.2
15.9
28
4
5.0
0
0
.5
12.9
0
.2
12.6
0
.6
22.2
0
.3
20.1
0
.4
20.1
0
.2
15.7
0
.2
18.2
29
4
7.5
0
0
.5
14.7
0
.8
15.4
0
.5
15.1
1
.2
24.4
0
.4
19.3
0
.8
22.4
0
.9
22.3
0
.5
18.1
0
.7
20.5
30
5
0.0
0
1
.0
17.2
1
.1
18.0
0
.9
17.6
1
.7
26.6
0
.8
21.7
1
.2
24.6
1
.4
24.6
0
.8
20.5
1
.1
22.8
31
5
2.5
0
1
.4
19.8
1
.6
20.5
1
.4
20.2
2
.8
28.9
1
.1
24.1
2
.0
26.9
2
.3
26.8
1
.3
23.0
1
.8
25.1
32
5
5.0
0
2
.5
22.3
1
.6
23.0
2
.0
22.7
4
.7
31.1
1
.7
26.5
3
.2
29.2
3
.9
29.0
1
.6
25.4
2
.8
27.4
33
5
7.5
0
3
.2
24.8
2
.0
25.5
2
.5
25.2
6
.7
33.3
2
.7
28.9
4
.8
31.5
5
.4
31.2
2
.4
27.8
4
.0
29.7
34
6
0.0
0
3
.6
27.3
3
.7
28.0
3
.6
27.7
8
.4
35.5
4
.0
31.3
6
.3
33.7
6
.6
33.5
3
.9
30.2
5
.3
32.0
35
6
2.5
0
4
.4
29.9
5
.3
30.5
4
.8
30.2
1
2.8
3
7.7
6
.2
33.7
9
.6
36.0
9
.8
35.7
5
.9
32.7
7
.9
34.4
36
6
5.0
0
5
.9
32.4
6
.6
33.1
6
.2
32.7
1
7.6
3
9.9
1
1.1
3
6.1
1
4.5
3
8.3
1
3.5
3
7.9
9
.4
35.1
1
1.5
3
6.7
37
6
7.5
0
8
.1
34.9
1
0.3
3
5.6
9
.2
35.3
2
3.7
4
2.1
1
5.5
3
8.5
1
9.8
4
0.5
1
8.2
4
0.2
1
3.6
3
7.5
1
6.0
3
9.0
38
7
0.0
0
1
1.9
3
7.4
1
4.0
3
8.1
1
2.9
3
7.8
3
2.3
4
4.3
2
2.6
4
0.9
2
7.7
4
2.8
2
5.2
4
2.4
1
9.4
3
9.9
2
2.4
4
1.3
39
7
2.5
0
1
6.8
4
0.0
2
0.0
4
0.6
1
8.4
4
0.3
4
0.1
4
6.5
2
9.0
4
3.3
3
4.8
4
5.1
3
1.9
4
4.6
2
5.6
4
2.4
2
8.9
4
3.6
40
7
5.0
0
2
3.1
4
2.5
2
4.3
4
3.1
2
3.7
4
2.8
4
7.4
4
8.7
3
8.3
4
5.7
4
3.1
4
7.4
3
8.9
4
6.8
3
3.1
4
4.8
3
6.1
4
5.9
41
7
7.5
0
3
1.5
4
5.0
3
4.6
4
5.6
3
3.0
4
5.3
5
6.2
5
0.9
4
6.7
4
8.1
5
1.6
4
9.6
4
7.6
4
9.1
4
2.2
4
7.2
4
4.9
4
8.2
42
8
0.0
0
4
0.0
4
7.5
4
3.6
4
8.2
4
1.8
4
7.8
6
4.3
5
3.2
5
4.9
5
0.5
5
9.8
5
1.9
5
5.8
5
1.3
5
0.7
4
9.6
5
3.3
5
0.5
43
8
2.5
0
5
2.2
5
0.0
5
4.4
5
0.7
5
3.3
5
0.4
7
2.5
5
5.4
6
2.6
5
2.9
6
7.7
5
4.2
6
5.3
5
3.5
5
9.5
5
2.1
6
2.5
5
2.8
44
8
5.0
0
6
2.8
5
2.6
6
5.5
5
3.2
6
4.1
5
2.9
8
1.1
5
7.6
7
0.7
5
5.3
7
6.1
5
6.4
7
4.7
5
5.8
6
8.8
5
4.5
7
1.8
5
5.1
45
8
7.5
0
7
3.4
5
5.1
7
2.7
5
5.7
7
3.0
5
5.4
8
5.6
5
9.8
7
9.8
5
7.7
8
2.8
5
8.7
8
1.3
5
8.0
7
7.1
5
6.9
7
9.3
5
7.4
46
9
0.0
0
8
0.3
5
7.6
8
1.3
5
8.2
8
0.8
5
7.9
9
0.2
6
2.0
8
6.5
6
0.1
8
8.4
6
1.0
8
6.7
6
0.2
8
4.6
5
9.3
8
5.7
5
9.8
47
9
2.5
0
8
7.2
6
0.1
9
1.6
6
0.7
8
9.4
6
0.4
9
4.2
6
4.2
9
1.8
6
2.4
9
3.1
6
3.3
9
1.7
6
2.4
9
1.7
6
1.8
9
1.7
6
2.1
48
9
5.0
0
9
4.3
6
2.7
9
4.7
6
3.3
9
4.5
6
3.0
9
7.3
6
6.4
9
5.6
6
4.8
9
6.5
6
5.5
9
6.2
6
4.7
9
5.3
6
4.2
9
5.8
6
4.4
49
9
7.5
0
9
7.8
6
5.2
9
8.8
6
5.8
9
8.3
6
5.5
9
8.8
6
8.6
9
7.6
6
7.2
9
8.2
6
7.8
9
8.5
6
6.9
9
8.0
6
6.6
9
8.2
6
6.7
50
1
00
.00
100
.0
67.7
1
00
.0
68.3
1
00
.0
68.0
1
00
.0
70.8
1
00
.0
69.6
1
00
.0
70.1
1
00
.0
69.1
1
00
.0
69.0
1
00
.0
69.0
Tabl
e A5-
9:N
L- N
ethe
rlan
ds. I
ndiv
idua
l nor
m d
ata
KID
SCR
EE
N-1
0-PR
OX
YIn
dex
Not
e: C
alcu
latio
n of
sco
res
was
rest
ricte
d to
com
plet
e ca
ses.
PR =
per
cent
ile; T
S =
T-sc
ore
for t
he p
artic
ular
(sub
-)po
pula
tion
(M =
50,
SD
= 1
0).

Appendix A5
230
C
hil
dren
8-1
1
Ad
ole
scen
ts 1
2-1
8
Ch
ild
ren
& A
do
lesc
en
ts 8
-18
Ra
w-
0-1
00
F
em
ale
s (n
=281
) M
ale
s (n
=254
) A
ll (
n=
535
) F
em
ale
s (n
=599
) M
ale
s (n
=486
) A
ll (
n=
1085
) F
em
ale
s (n
=880
) M
ale
s (n
=740
) A
ll (
n=
1620
)
Sco
re
Sco
re
P
R
TS
P
R
TS
P
R
TS
P
R
TS
P
R
TS
P
R
TS
P
R
TS
P
R
TS
P
R
TS
10
0
.00
11
2
.50
12
5
.00
13
7
.50
14
1
0.0
0
15
1
2.5
0
16
1
5.0
0
17
1
7.5
0
18
2
0.0
0
19
2
2.5
0
20
2
5.0
0
21
2
7.5
0
22
3
0.0
0
23
3
2.5
0
0
.3
21.2
0
.1
20.0
0
.2
19.3
0
.1
18.1
24
3
5.0
0
0
.4
23.3
0
.3
20.5
0
.3
22.1
0
.3
21.4
0
.2
18.7
0
.2
20.2
25
3
7.5
0
0
.7
25.4
0
.5
22.7
0
.6
24.3
0
.5
23.5
0
.4
20.9
0
.4
22.4
26
4
0.0
0
0
.6
17.4
0
.3
18.0
1
.3
27.5
0
.5
24.9
0
.9
26.4
0
.9
25.6
0
.5
23.2
0
.7
24.6
27
4
2.5
0
0
.6
20.8
1
.0
19.9
0
.6
20.4
2
.5
29.5
0
.9
27.1
1
.8
28.5
1
.8
27.7
0
.8
25.4
1
.4
26.7
28
4
5.0
0
1
.2
23.2
1
.4
22.3
1
.2
22.8
4
.5
31.6
1
.7
29.4
3
.2
30.7
3
.4
29.8
1
.5
27.6
2
.5
28.9
29
4
7.5
0
1
.2
25.6
1
.4
24.8
1
.2
25.2
6
.3
33.7
3
.9
31.6
5
.2
32.8
4
.6
31.9
3
.0
29.9
3
.9
31.0
30
5
0.0
0
1
.9
27.9
1
.8
27.3
1
.7
27.6
9
.7
35.7
6
.6
33.8
8
.3
34.9
7
.2
34.0
4
.9
32.1
6
.1
33.2
31
5
2.5
0
4
.0
30.3
3
.6
29.7
3
.8
30.0
1
4.7
3
7.8
9
.3
36.0
1
2.3
3
7.1
1
1.2
3
6.1
7
.3
34.4
9
.5
35.3
32
5
5.0
0
5
.0
32.7
6
.7
32.2
5
.8
32.5
1
7.8
3
9.9
1
4.3
3
8.3
1
6.2
3
9.2
1
3.7
3
8.1
1
1.7
3
6.6
1
2.8
3
7.5
33
5
7.5
0
8
.2
35.0
8
.7
34.6
8
.4
34.9
2
3.7
4
1.9
1
8.6
4
0.5
2
1.4
4
1.3
1
8.7
4
0.2
1
5.2
3
8.9
1
7.1
3
9.6
34
6
0.0
0
1
2.8
3
7.4
9
.9
37.1
1
1.4
3
7.3
3
2.7
4
4.0
2
7.4
4
2.7
3
0.3
4
3.5
2
6.3
4
2.3
2
1.4
4
1.1
2
4.1
4
1.8
35
6
2.5
0
1
6.0
3
9.8
1
6.6
3
9.6
1
6.3
3
9.7
3
9.4
4
6.1
3
7.5
4
4.9
3
8.5
4
5.6
3
1.9
4
4.4
3
0.3
4
3.4
3
1.2
4
4.0
36
6
5.0
0
2
4.9
4
2.2
2
3.3
4
2.0
2
4.1
4
2.1
4
8.1
4
8.1
4
5.9
4
7.2
4
7.1
4
7.7
4
0.7
4
6.5
3
8.2
4
5.6
3
9.5
4
6.1
37
6
7.5
0
3
3.4
4
4.5
3
1.6
4
4.5
3
2.5
4
4.5
5
5.2
5
0.2
5
3.8
4
9.4
5
4.6
4
9.9
4
8.2
4
8.6
4
6.1
4
7.9
4
7.3
4
8.3
38
7
0.0
0
4
3.7
4
6.9
4
3.0
4
6.9
4
3.3
4
6.9
6
1.4
5
2.3
6
1.1
5
1.6
6
1.3
5
2.0
5
5.7
5
0.7
5
4.9
5
0.1
5
5.4
5
0.4
39
7
2.5
0
5
3.3
4
9.3
5
3.2
4
9.4
5
3.3
4
9.3
6
6.9
5
4.4
6
9.3
5
3.8
6
8.0
5
4.1
6
2.6
5
2.8
6
3.8
5
2.3
6
3.1
5
2.6
40
7
5.0
0
6
1.5
5
1.6
6
2.3
5
1.8
6
1.9
5
1.7
7
7.3
5
6.4
7
5.5
5
6.0
7
6.5
5
6.2
7
2.2
5
4.9
7
1.0
5
4.6
7
1.7
5
4.7
41
7
7.5
0
7
0.4
5
4.0
6
9.7
5
4.3
7
0.1
5
4.1
8
2.8
5
8.5
8
2.3
5
8.3
8
2.6
5
8.4
7
8.8
5
7.0
7
8.0
5
6.8
7
8.5
5
6.9
42
8
0.0
0
7
6.4
5
6.4
7
8.0
5
6.8
7
7.2
5
6.6
8
7.0
6
0.6
8
7.9
6
0.5
8
7.4
6
0.5
8
3.6
5
9.1
8
4.5
5
9.1
8
4.0
5
9.1
43
8
2.5
0
8
2.1
5
8.7
8
4.7
5
9.2
8
3.3
5
9.0
9
1.0
6
2.6
9
0.7
6
2.7
9
0.9
6
2.6
8
8.1
6
1.2
8
8.7
6
1.3
8
8.4
6
1.2
44
8
5.0
0
8
9.3
6
1.1
9
0.6
6
1.7
8
9.9
6
1.4
9
4.5
6
4.7
9
3.0
6
4.9
9
3.8
6
4.8
9
2.8
6
3.2
9
2.2
6
3.6
9
2.5
6
3.4
45
8
7.5
0
9
2.5
6
3.5
9
3.7
6
4.1
9
3.1
6
3.8
9
5.7
6
6.8
9
5.9
6
7.2
9
5.8
6
6.9
9
4.6
6
5.3
9
5.2
6
5.8
9
4.9
6
5.5
46
9
0.0
0
9
5.0
6
5.9
9
6.9
6
6.6
9
5.9
6
6.2
9
7.8
6
8.8
9
7.7
6
9.4
9
7.8
6
9.0
9
6.9
6
7.4
9
7.4
6
8.1
9
7.2
6
7.7
47
9
2.5
0
9
7.1
6
8.2
9
8.1
6
9.1
9
7.6
6
8.6
9
9.0
7
0.9
9
9.2
7
1.6
9
9.1
7
1.2
9
8.4
6
9.5
9
8.8
7
0.3
9
8.6
6
9.8
48
9
5.0
0
9
8.6
7
0.6
1
00
.0
71.5
9
9.3
7
1.0
9
9.8
7
3.0
9
9.4
7
3.8
9
9.6
7
3.3
9
9.4
7
1.6
9
9.6
7
2.5
9
9.5
7
2.0
49
9
7.5
0
1
00
.0
73.0
1
00
.0
74.0
1
00
.0
73.4
1
00
.0
75.0
9
9.4
7
6.1
9
9.7
7
5.4
1
00
.0
73.7
9
9.6
7
4.8
9
9.8
7
4.2
50
1
00
.00
100
.0
75.4
1
00
.0
76.4
1
00
.0
75.8
1
00
.0
76.9
1
00
.0
78.3
1
00
.0
77.6
1
00
.0
75.8
1
00
.0
77.0
1
00
.0
76.3
Tabl
e A5-
10:
PL- P
olan
d. In
divi
dual
nor
m d
ata
KID
SCR
EE
N-1
0-PR
OX
YIn
dex
Not
e: C
alcu
latio
n of
sco
res
was
rest
ricte
d to
com
plet
e ca
ses.
PR =
per
cent
ile; T
S =
T-sc
ore
for t
he p
artic
ular
(sub
-)po
pula
tion
(M =
50,
SD
= 1
0).

Provision of National Norm Proxy Data for Individual Diagnostic Use
231
C
hil
dren
8-1
1
Ad
ole
scen
ts 1
2-1
8
Ch
ild
ren
& A
do
lesc
en
ts 8
-18
Ra
w-
0-1
00
F
em
ale
s (n
=331
) M
ale
s (n
=358
) A
ll (
n=
689
) F
em
ale
s (n
=228
) M
ale
s (n
=263
) A
ll (
n=
491
) F
em
ale
s (n
=559
) M
ale
s (n
=621
) A
ll (
n=
1180
)
Sco
re
Sco
re
P
R
TS
P
R
TS
P
R
TS
P
R
TS
P
R
TS
P
R
TS
P
R
TS
P
R
TS
P
R
TS
10
0
.00
11
2
.50
12
5
.00
13
7
.50
14
1
0.0
0
15
1
2.5
0
16
1
5.0
0
17
1
7.5
0
18
2
0.0
0
19
2
2.5
0
20
2
5.0
0
21
2
7.5
0
22
3
0.0
0
23
3
2.5
0
24
3
5.0
0
25
3
7.5
0
1
.0
22.0
0
.6
20.8
0
.6
21.4
0
.4
18.0
0
.3
17.9
0
.3
18.0
26
4
0.0
0
1
.0
24.0
1
.3
22.9
1
.1
23.5
0
.4
20.2
0
.5
20.1
0
.5
20.2
27
4
2.5
0
0
.4
19.6
0
.2
19.2
1
.0
26.0
1
.3
25.1
1
.1
25.6
0
.4
22.3
0
.8
22.3
0
.6
22.4
28
4
5.0
0
0
.7
21.0
0
.4
21.9
0
.5
21.5
1
.6
28.0
1
.8
27.2
1
.5
27.6
0
.9
24.5
0
.9
24.5
0
.9
24.5
29
4
7.5
0
1
.1
23.4
0
.4
24.2
0
.7
23.8
2
.3
30.0
3
.1
29.3
2
.7
29.6
1
.5
26.7
1
.5
26.7
1
.4
26.7
30
5
0.0
0
1
.6
25.7
0
.9
26.5
1
.2
26.2
3
.6
32.0
4
.6
31.4
4
.1
31.7
2
.3
28.9
2
.4
28.9
2
.4
28.9
31
5
2.5
0
2
.2
28.1
1
.5
28.9
1
.7
28.5
7
.0
34.0
6
.5
33.5
6
.8
33.8
4
.1
31.0
3
.6
31.1
3
.8
31.1
32
5
5.0
0
3
.4
30.4
4
.2
31.2
3
.8
30.8
9
.7
36.1
8
.1
35.6
8
.8
35.8
5
.9
33.2
5
.8
33.3
5
.9
33.3
33
5
7.5
0
4
.3
32.8
5
.9
33.5
5
.1
33.2
1
4.5
3
8.1
1
2.6
3
7.7
1
3.5
3
7.9
8
.4
35.4
8
.7
35.5
8
.6
35.4
34
6
0.0
0
8
.7
35.1
1
0.1
3
5.8
9
.4
35.5
1
9.4
4
0.1
1
8.0
3
9.8
1
8.7
3
9.9
1
3.1
3
7.5
1
3.4
3
7.7
1
3.3
3
7.6
35
6
2.5
0
1
2.3
3
7.5
1
5.6
3
8.1
1
4.0
3
7.8
2
5.5
4
2.1
2
4.5
4
1.9
2
5.0
4
2.0
1
7.7
3
9.7
1
9.4
3
9.9
1
8.6
3
9.8
36
6
5.0
0
1
8.4
3
9.8
2
1.8
4
0.4
2
0.2
4
0.1
3
3.9
4
4.1
3
2.1
4
4.0
3
2.9
4
4.1
2
4.7
4
1.8
2
6.1
4
2.1
2
5.5
4
2.0
37
6
7.5
0
2
6.3
4
2.1
2
7.4
4
2.8
2
6.9
4
2.5
4
0.0
4
6.1
3
9.7
4
6.1
3
9.8
4
6.1
3
1.9
4
4.0
3
2.6
4
4.3
3
2.2
4
4.2
38
7
0.0
0
3
4.4
4
4.5
3
5.2
4
5.1
3
4.8
4
4.8
4
7.0
4
8.2
4
7.3
4
8.2
4
7.1
4
8.2
3
9.5
4
6.2
4
0.3
4
6.5
4
0.0
4
6.4
39
7
2.5
0
4
2.3
4
6.8
4
3.7
4
7.4
4
3.0
4
7.1
5
4.0
5
0.2
5
6.4
5
0.3
5
5.3
5
0.2
4
7.1
4
8.3
4
9.0
4
8.7
4
8.1
4
8.5
40
7
5.0
0
5
1.9
4
9.2
5
3.9
4
9.7
5
2.9
4
9.5
5
9.7
5
2.2
6
1.7
5
2.4
6
0.8
5
2.3
5
5.1
5
0.5
5
7.2
5
0.9
5
6.2
5
0.7
41
7
7.5
0
6
0.0
5
1.5
6
2.8
5
2.0
6
1.5
5
1.8
6
8.1
5
4.2
6
8.9
5
4.5
6
8.5
5
4.4
6
3.3
5
2.7
6
5.4
5
3.1
6
4.4
5
2.9
42
8
0.0
0
6
8.2
5
3.9
7
0.4
5
4.4
6
9.4
5
4.1
7
6.4
5
6.2
7
7.2
5
6.6
7
6.8
5
6.4
7
1.6
5
4.8
7
3.3
5
5.3
7
2.5
5
5.1
43
8
2.5
0
7
5.6
5
6.2
7
8.8
5
6.7
7
7.2
5
6.5
8
2.5
5
8.2
8
2.5
5
8.7
8
2.5
5
8.5
7
8.4
5
7.0
8
0.4
5
7.5
7
9.4
5
7.3
44
8
5.0
0
8
2.5
5
8.6
8
4.4
5
9.0
8
3.5
5
8.8
8
6.9
6
0.2
8
7.4
6
0.8
8
7.2
6
0.5
8
4.3
5
9.2
8
5.7
5
9.7
8
5.0
5
9.4
45
8
7.5
0
8
7.0
6
0.9
8
9.4
6
1.3
8
8.3
6
1.1
8
9.5
6
2.3
9
1.6
6
2.9
9
0.6
6
2.6
8
8.1
6
1.3
9
0.3
6
1.9
8
9.2
6
1.6
46
9
0.0
0
9
1.3
6
3.3
9
1.3
6
3.6
9
1.3
6
3.4
9
1.7
6
4.3
9
5.0
6
5.0
9
3.5
6
4.7
9
1.4
6
3.5
9
2.9
6
4.1
9
2.2
6
3.8
47
9
2.5
0
9
5.2
6
5.6
9
4.1
6
5.9
9
4.6
6
5.8
9
6.1
6
6.3
9
7.7
6
7.1
9
6.9
6
6.7
9
5.6
6
5.7
9
5.6
6
6.3
9
5.6
6
6.0
48
9
5.0
0
9
8.2
6
8.0
9
6.9
6
8.3
9
7.5
6
8.1
9
7.4
6
8.3
9
8.5
6
9.2
9
8.0
6
8.8
9
7.9
6
7.8
9
7.6
6
8.5
9
7.7
6
8.2
49
9
7.5
0
1
00
.0
70.3
9
9.4
7
0.6
9
9.7
7
0.4
9
9.1
7
0.3
9
9.2
7
1.3
9
9.2
7
0.8
9
9.7
7
0.0
9
9.3
7
0.7
9
9.5
7
0.4
50
1
00
.00
100
.0
72.9
1
00
.0
72.8
1
00
.0
72.3
1
00
.0
73.4
1
00
.0
72.9
1
00
.0
72.2
1
00
.0
72.9
1
00
.0
72.5
Tabl
e A5-
11:
UK
- U
nite
d K
ingd
om. I
ndiv
idua
l nor
m d
ata
KID
SCR
EE
N-1
0 In
dex
Not
e: C
alcu
latio
n of
sco
res
was
rest
ricte
d to
com
plet
e ca
ses.
PR =
per
cent
ile; T
S =
T-sc
ore
for t
he p
artic
ular
(sub
-)po
pula
tion
(M =
50,
SD
= 1
0).
Quality of life (QoL) assessment in children with
chronic health conditions and disabilities needs
to be age-appropriate and address health-related
as well as disease-specific concerns of children in
a balanced way. The proposed DISABKIDS mod-
ular approach has tackled these challenges of
international paediatric OoL research by provid-
ing modules that are on the one hand applicable
for children of specific age groups and specific
health conditions, and on the hand can be
applied across different subgroups. The DIS-
ABKIDS questionnaires have been developed
within a European cross-cultural multi-centre
study in order to be able to compare different
conditions across health care systems from differ-
ent countries and in order to be able to conduct
multinational clinical studies. The DISABKIDS
groups used a simultaneous approach towards
cross-cultural instrument development that
ensures the cross-cultural applicability of the
measures. The current handbook describes all rel-
evant user information (e.g. psychometrics or ref-
erence data), necessary for applying the DIS-
ABKIDS questionnaires.
The authors:Silke Schmidt, Corinna Petersen, Holger Mühlan,Marie Claude Simeoni, David Debensason, UteThyen, Esther Müller-Godeffroy, AthanasiosVidalis, John Tsanakas, Elpis Hatziagorou, Paraske-vi Karagianni, Hendrik Koopmann, Rolanda Baars,John Chaplin, Mick Power, Clare Atherton, PeterHoare, Michael Quittan, Othmar Schuhfried andMonika BullingerTHE DISABKIDS Group Europe
The DISABKIDS Group Europe
The DISABKIDS QuestionnairesQuality of life questionnaires for childrenwith chronic conditions
PABST SCIENCE PUBLISHERSEichengrund 28, D-49525 Lengerich
Tel.: ++ 49 (0) 5484-308, Fax: ++ 49 (0) 5484-550
E-mail: [email protected], Internet: http://www.pabst-publishers.de
2006, 212 pages + CD-ROM, ISBN 3-89967-166-X,Price: 35,- Euro