the kyoto protocol: an assault on science, economic growth
TRANSCRIPT
THE KYOTO PROTOCOL:AN ASSAULT ON
SCIENCE,ECONOMIC GROWTH,
AND HUMAN FREEDOMS
A.A. IllarionovIllarionovAdviser to the President of RussiaAdviser to the President of Russia
August 16,August 16, 20020044©© InstituteInstitute of Economic Analysisof Economic Analysis

©ИЭА
KyotoKyoto’’s scientific basis s scientific basis ––
or the lack thereof.or the lack thereof.
©ИЭА
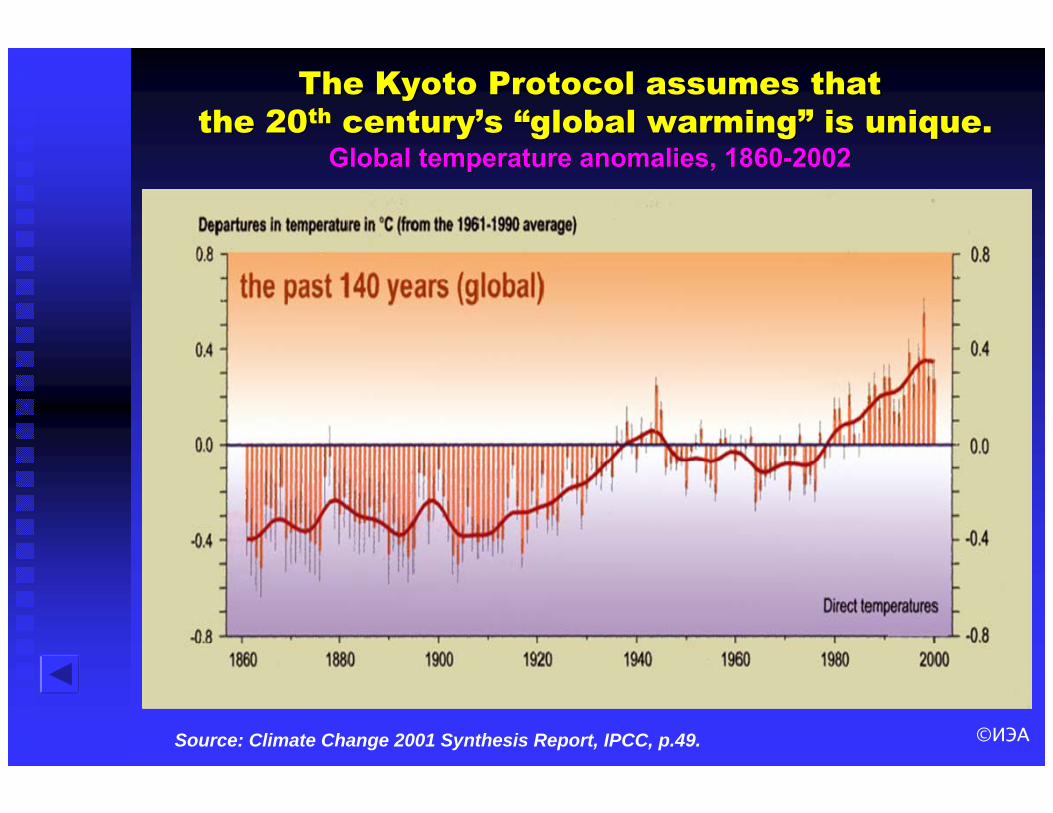
The Kyoto Protocol assumes thatThe Kyoto Protocol assumes thatthe 20the 20thth centurycentury’’s s ““global warmingglobal warming”” is unique.is unique.
Global temperature anomalies,Global temperature anomalies, 18601860--20022002
Source: Climate Change 2001 Synthesis Report, IPCC, p.49.
©ИЭА
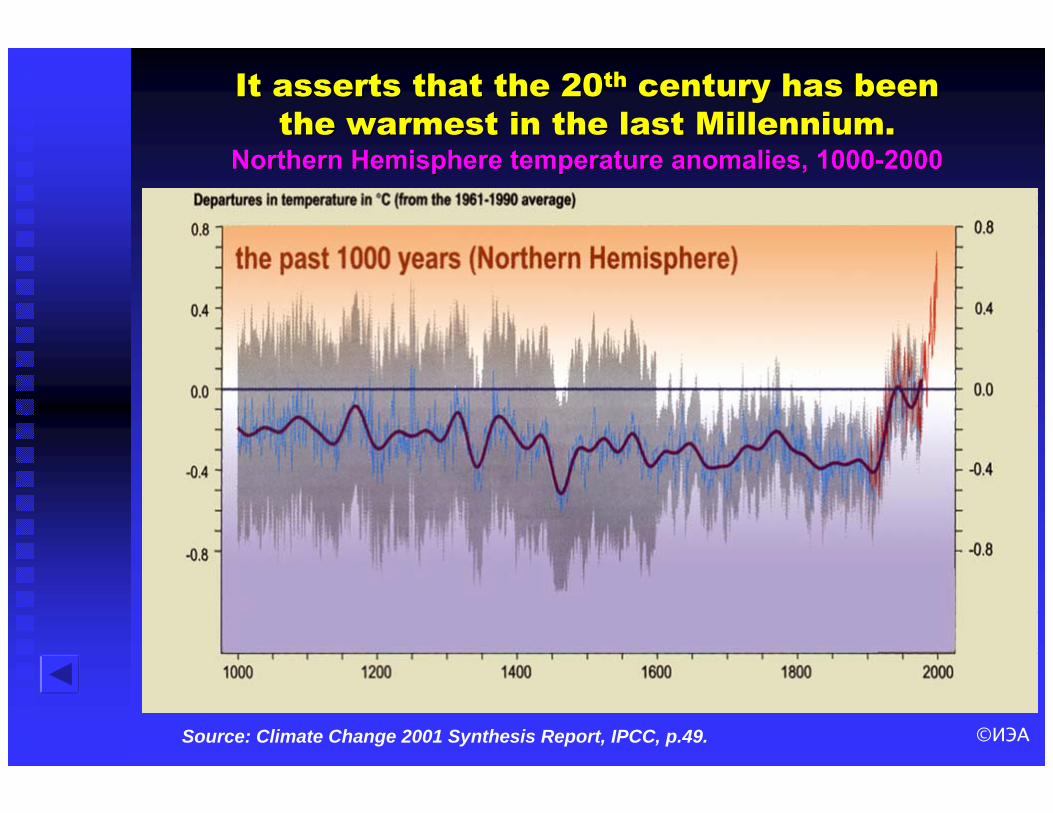
It asserts that the 20It asserts that the 20thth century has been century has been the warmest in the last Millennium.the warmest in the last Millennium.
Northern Hemisphere temperature anomalies,Northern Hemisphere temperature anomalies, 10001000--20002000
Source: Climate Change 2001 Synthesis Report, IPCC, p.49.

©ИЭА
It asserts that the current global warming It asserts that the current global warming is explained by the increase is explained by the increase
in COin CO22 concentration in the atmosphereconcentration in the atmosphere……Global COGlobal CO22 concentration in the atmosphere, 1860concentration in the atmosphere, 1860--20032003
Source: Carbon Dioxide Information Analysis Center, 2003.
270
290
310
330
350
370
39018
60
1868
1876
1884
1892
1900
1908
1916
1924
1932
1940
1948
1956
1964
1972
1980
1988
1996
2004
ppm
©ИЭА
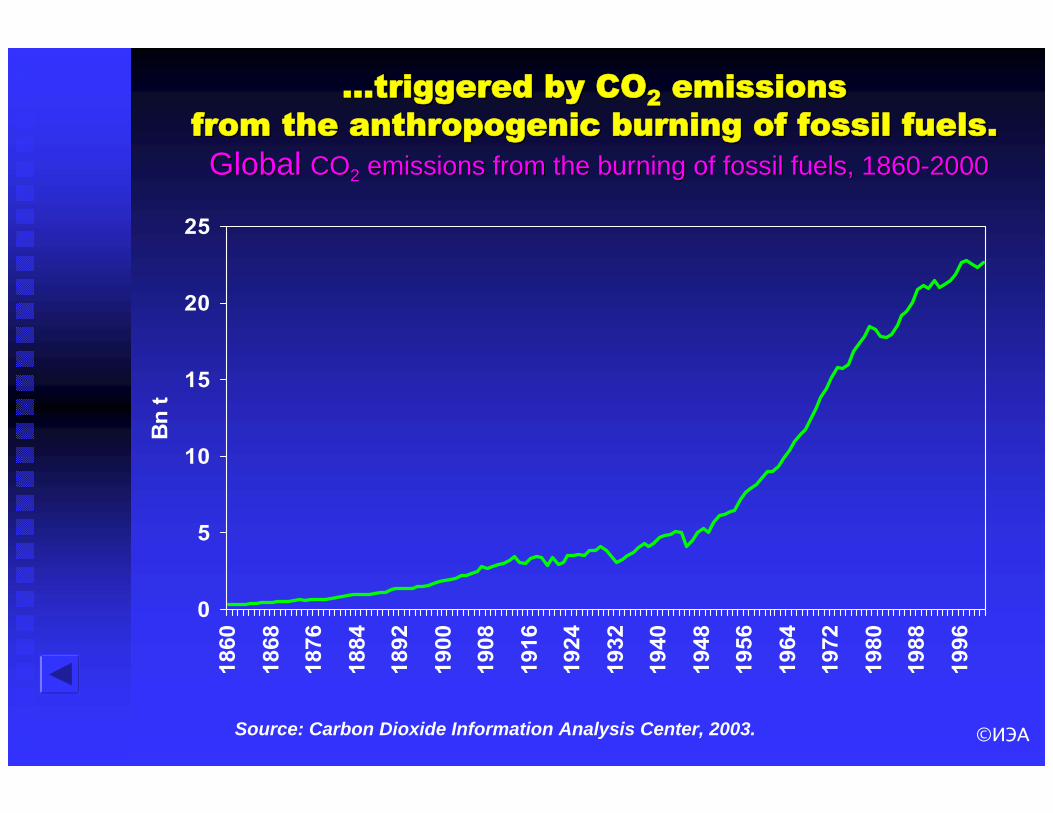
……triggered by COtriggered by CO22 emissions emissions from the anthropogenic burning of fossil fuels.from the anthropogenic burning of fossil fuels.
GlobalGlobal COCO22 emissions from the burning of fossil fuels, 1860emissions from the burning of fossil fuels, 1860--20002000
Source: Carbon Dioxide Information Analysis Center, 2003.
0
5
10
15
20
2518
60
1868
1876
1884
1892
1900
1908
1916
1924
1932
1940
1948
1956
1964
1972
1980
1988
1996
Bn
t
©ИЭА
Is this Is this ““theorytheory”” convincing?convincing?

©ИЭА
-1,5
-1,0
-0,5
0,0
0,5
1,0
1,5
2,0
2,5
3,012
,512
,011
,511
,010
,510
,0 9,5
9,0
8,5
8,0
7,5
7,0
6,5
6,0
5,5
5,0
4,5
4,0
3,5
3,0
2,5
2,0
1,5
1,0
0,5
0,0
Time, thousands of years before present
Tem
pera
ture
, o С
150
170
190
210
230
250
270
290
310
330
CO
2, pp
mv
Changes in temperature, oC
CO2 concentration, ppmv
The variation in global temperature cannot be The variation in global temperature cannot be explained by the variation in CO2 concentration in explained by the variation in CO2 concentration in
the atmosphere in the last 13 thousand years.the atmosphere in the last 13 thousand years.Changes in temperature and СО2 concentration, last 13 000 years
Sources: Salamatin A.N., Lipenkov V.Ya., Barkov N.I., Jouzel J., Petit J.R., Raynaud D. Ice-core age dating and palaeothermometercalibration based on isotope and temperature profiles from deep boreholes at Vostok Station (East Antarctica).- Journal of Geophysical Research, 1998, vol. 103, N D8, pp. 8963-8977; Petit J.R., Jouzel J., Raynaud D., Barkov N.I., Barnola J.M., Basile I., Bender M., ChappellazJ., Davis M., Delague G., Delmotte M., Kotlyakov V.M., Legrand M., Lipenkov V.Ya., Lorius C., Pepin L., Ritz C., Saltzman E., Stievenard M. Climate and atmospheric history of the past 420,000 years from the Vostok ice core, Antarctica. Nature, vol. 399, N 6735, 3 June 1999, pp. 429-436; Neftel, Friedli, Moore et al. Historical Carbon Dioxide Record from the Siple Station Ice Core (reported on-line by the Carbon Dioxide Information Analysis Center at http://cdiac.esd.ornl.gov/ftp/trends/co2/siple2.013). Bern, Switzerland, 1974.

©ИЭА
The variation in global temperature cannot be The variation in global temperature cannot be explained by the variation in COexplained by the variation in CO22 concentrationconcentration
in the atmosphere in the last 140 years.in the atmosphere in the last 140 years.Changes in temperature and СО2 concentration, last 140 years
13,6
13,7
13,8
13,9
14,0
14,1
14,218
60
1868
1876
1884
1892
1900
1908
1916
1924
1932
1940
1948
1956
1964
1972
1980
1988
1996
Glo
bal a
bsol
ute
tem
pera
ture
, o C
260
280
300
320
340
360
380
CO
2 con
cent
ratio
n, p
pm
Global temperature, oC
CO2 concentration, ppmv
Source: Carbon Dioxide Information Analysis Center, 2003.

©ИЭА
CO2 emissions from the
burning of fossil fuels
The variation in global temperature cannot be The variation in global temperature cannot be explained by variation in COexplained by variation in CO22 emissions of emissions of anthropogenic origin in the last 140 years.anthropogenic origin in the last 140 years.
COCO22 emissions from the anthropogenic burning of fossil fuels, 1860emissions from the anthropogenic burning of fossil fuels, 1860--20002000
Source: Climate Change 2001 Synthesis Report, IPCC, p.49.

©ИЭА
Global temperature is better correlated Global temperature is better correlated with the Sunwith the Sun’’s geomagnetic activity s geomagnetic activity
than with COthan with CO22 concentration in the atmosphere.concentration in the atmosphere.SStandardized anomalies in COtandardized anomalies in CO22 concentration, AA Index concentration, AA Index
of geomagnetic activity and global temperature (22yma), 1889of geomagnetic activity and global temperature (22yma), 1889--20012001
Source: Carbon Dioxide Information Analysis Center, 2003, WDC for STP, Moscow .
-2,0-1,5-1,0-0,50,00,51,01,52,02,53,0
1889
1894
1899
1904
1909
1914
1919
1924
1929
1934
1939
1944
1949
1954
1959
1964
1969
1974
1979
1984
1989
1994
1999
AA Index
CO2 concentration
Global temperature

©ИЭА
This is perhaps not so surprising given thatThis is perhaps not so surprising given thatCOCO22 of anthropogenic origin represents less of anthropogenic origin represents less
than 1% of total COthan 1% of total CO22 in the atmosphere.in the atmosphere.
Source: Carbon Dioxide Information Analysis Center.

©ИЭА
CONCLUSION 1:CONCLUSION 1:
The correlation between COThe correlation between CO22 concentration concentration
in the atmosphere and global temperature is in the atmosphere and global temperature is
far from provenfar from proven..
©ИЭА
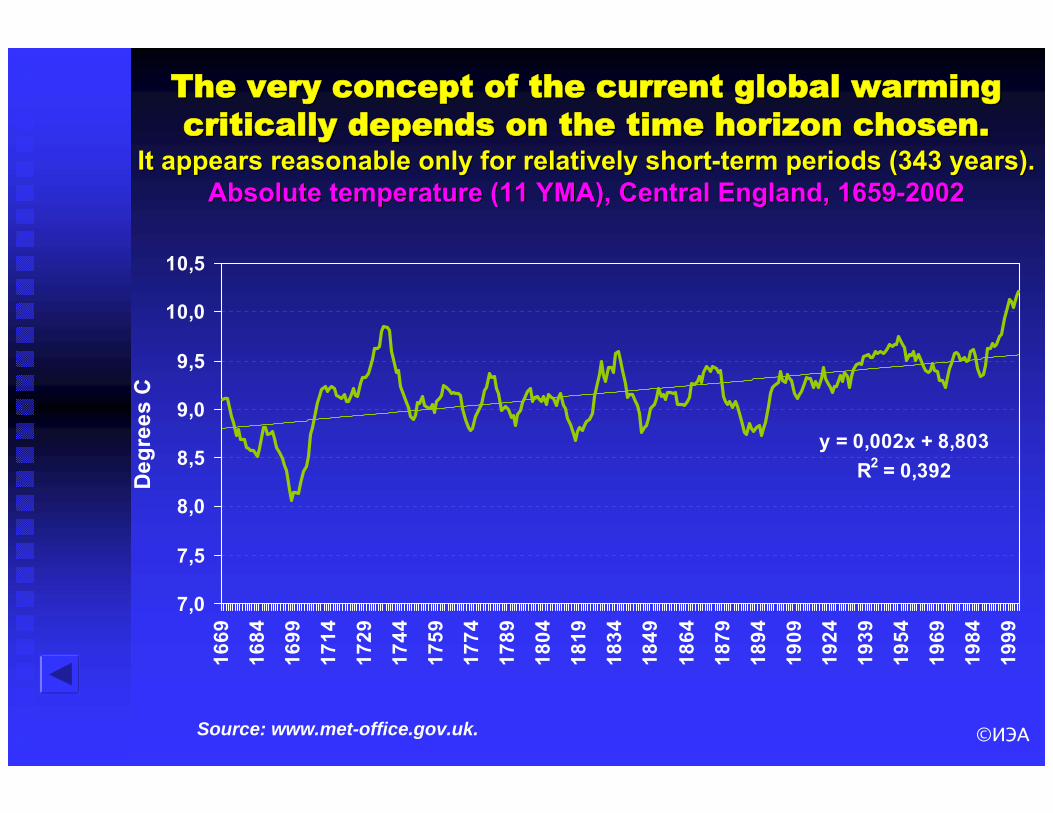
The very concept of the current global warmingThe very concept of the current global warmingcritically depends on the time horizon chosen.critically depends on the time horizon chosen.
It appears reasonable only for relatively shortIt appears reasonable only for relatively short--term periods (343 years).term periods (343 years).AbsoluteAbsolute temperature (temperature (1111 YMA)YMA),, Central England, 1659Central England, 1659--20022002
Source: www.met-office.gov.uk.
y = 0,002x + 8,803R2 = 0,392
7,0
7,5
8,0
8,5
9,0
9,5
10,0
10,5
1669
1684
1699
1714
1729
1744
1759
1774
1789
1804
1819
1834
1849
1864
1879
1894
1909
1924
1939
1954
1969
1984
1999
Deg
rees
C

©ИЭА
The very concept of the current global warmingThe very concept of the current global warmingappears unproven for longerappears unproven for longer--term periods term periods
(12 centuries).(12 centuries).AbsoluteAbsolute temperature (temperature (3030 YMA)YMA),, NE Canada (Baffin Island), 752NE Canada (Baffin Island), 752--19921992
y = -0,0002x + 3,048R2 = 0,0495
0,0
0,5
1,0
1,5
2,0
2,5
3,0
3,5
4,0
4,578
1
840
899
958
1017
1076
1135
1194
1253
1312
1371
1430
1489
1548
1607
1666
1725
1784
1843
1902
1961
degr
ees
Source: World Data Center for Palaeoclimatology, Boulder, USA.

©ИЭА
The very concept of the current global warmingThe very concept of the current global warmingappears unproven for longappears unproven for long--term periods term periods
(35 centuries).(35 centuries).Absolute temperatureAbsolute temperature ((3030 YMA)YMA),, Tasmania,1571 BC Tasmania,1571 BC -- 1991 AD1991 AD
y = -2E-05x + 15,019R2 = 0,0057
14,0
14,2
14,4
14,6
14,8
15,0
15,2
15,4
15,6
15,8-1
571
-139
6
-122
1
-104
6
-871
-696
-521
-346
-171 4
179
354
529
704
879
1054
1229
1404
1579
1754
1929
degr
ees
Source: World Data Center for Palaeoclimatology, Boulder, USA.

©ИЭАSource: Grootes, P.M., Stuiver, M., White, J.W.C., Johnsen, S.J., Jouzel J., Comparison of oxygen isotope records from the GISP and GRIP Greenland ice cores. Nature 366, 1993, pp. 552-554.
The current global warming is not unique, nor is it The current global warming is not unique, nor is it the most pronounced in the history of civilization:the most pronounced in the history of civilization:
not in the last 5 thousand years, not in the last 5 thousand years, Variation in polar temperature in the last 5000 yearsVariation in polar temperature in the last 5000 years
Distribution of Oxygen δ18О in the upper part of the kern from drill GISР2 (last 5000 years)
©ИЭА
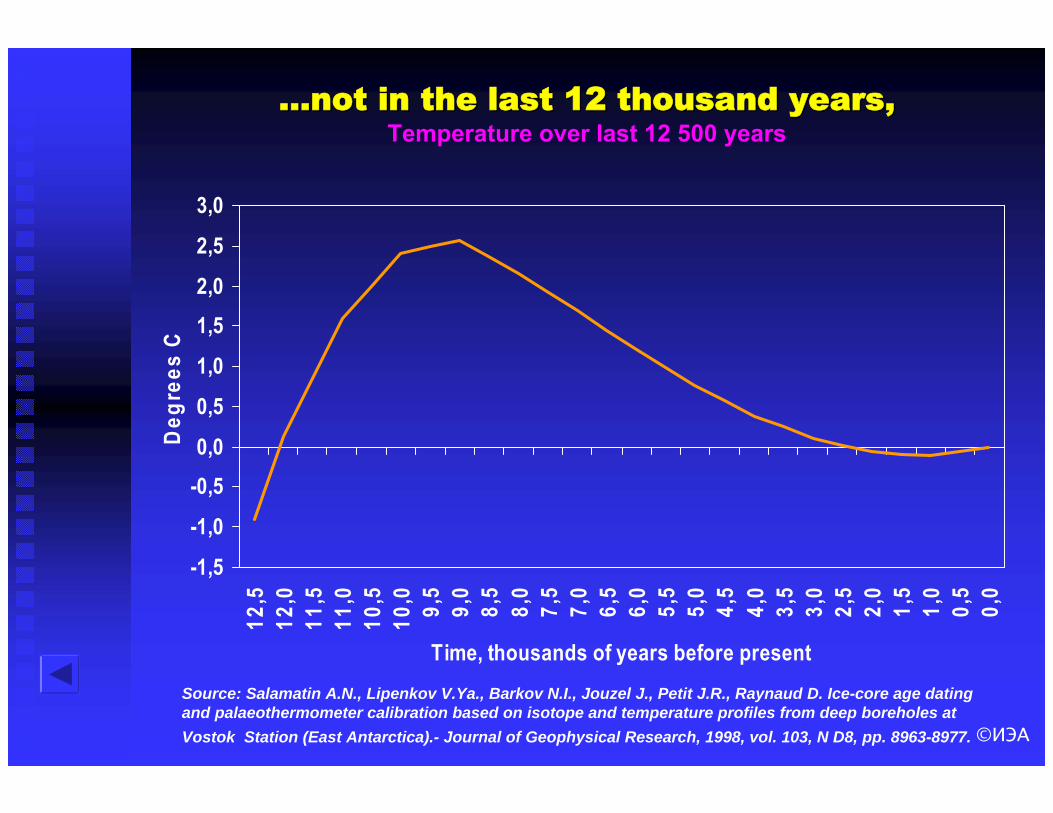
……not in the last 12 thousand years,not in the last 12 thousand years,Temperature over last 12 500 years
-1,5
-1,0
-0,5
0,0
0,5
1,0
1,5
2,0
2,5
3,0
12,5
12,0
11,5
11,0
10,5
10,0 9,5
9,0
8,5
8,0
7,5
7,0
6,5
6,0
5,5
5,0
4,5
4,0
3,5
3,0
2,5
2,0
1,5
1,0
0,5
0,0
Time, thousands of years before present
Deg
rees
C
Source: Salamatin A.N., Lipenkov V.Ya., Barkov N.I., Jouzel J., Petit J.R., Raynaud D. Ice-core age dating and palaeothermometer calibration based on isotope and temperature profiles from deep boreholes at Vostok Station (East Antarctica).- Journal of Geophysical Research, 1998, vol. 103, N D8, pp. 8963-8977.

©ИЭА
-12,0
-10,0
-8,0
-6,0
-4,0
-2,0
0,0
2,0
4,0
6,041
540
138
637
235
734
332
831
429
928
527
025
624
122
721
219
818
316
915
414
012
511
1 96 82 67 53 38 24 9
Time, thousands of years before present
Tem
pera
ture
, o С
……and not in the last 415 thousand years of the and not in the last 415 thousand years of the EarthEarth’’s historys history.
The longThe long--term climatic cycles term climatic cycles ((M. M. MilankovitchMilankovitch cycles) over last 415 000 yearscycles) over last 415 000 years
Source: Petit J.R., Jouzel J., Raynaud D., Barkov N.I., Barnola J.M., Basile I., Bender M., Chappellaz J., Davis M., Delague G., DelmotteM., Kotlyakov V.M., Legrand M., Lipenkov V.Ya., Lorius C., Pepin L., Ritz C., Saltzman E., Stievenard M. Climate and atmospheric history of the past 420,000 years from the Vostok ice core, Antarctica. Nature, vol. 399, N 6735, 3 June 1999, pp. 429-436.
©ИЭА
CONCLUSION 2:CONCLUSION 2:
There is There is no signno sign that the warming of the that the warming of the
planet in the 20planet in the 20thth century was century was ““unique.unique.””

©ИЭА
CONCLUSION 3:CONCLUSION 3:
Previous instances of global warming could Previous instances of global warming could
not been triggered by the anthropogenic not been triggered by the anthropogenic
burning of fossil fuels.burning of fossil fuels.
They are the result of They are the result of natural variabilitynatural variability. .

©ИЭА
CONCLUSION 4:CONCLUSION 4:
Cases of global warming due to natural forces Cases of global warming due to natural forces
have been much have been much strongerstronger than the current one than the current one
of allegedly of anthropogenic origin.of allegedly of anthropogenic origin.
The anthropogenic impact on climate change The anthropogenic impact on climate change
through COthrough CO22 emissions from the burning of fossil emissions from the burning of fossil
fuels fuels –– if any if any –– is incomparably is incomparably weakerweaker than the than the
impact of natural forces.impact of natural forces.

©ИЭА
-12,0
-10,0
-8,0
-6,0
-4,0
-2,0
0,0
2,0
4,0
6,041
540
038
537
035
534
032
531
029
528
026
525
023
522
020
519
017
516
014
513
011
510
0 85 70 55 40 25 10
Time, thousands of years before present
Tem
pera
ture
, o С
150
170
190
210
230
250
270
290
310
CO
2, pp
mv
Changes in temperature, oC
CO2 concentration, ppmv
Historically, changes in temperature precede changes in CO2 concentration, not vice versa.
Changes in temperature and СО2 concentration, last 415 000 years (D1-D4)
Sources: Salamatin A.N., Lipenkov V.Ya., Barkov N.I., Jouzel J., Petit J.R., Raynaud D. Ice-core age dating and palaeothermometer calibration based on isotope and temperature profiles from deep boreholes at Vostok Station (East Antarctica).- Journal of Geophysical Research, 1998, vol. 103, N D8, pp. 8963-8977; Petit J.R., Jouzel J., Raynaud D., Barkov N.I., Barnola J.M., Basile I., Bender M., Chappellaz J., Davis M., DelagueG., Delmotte M., Kotlyakov V.M., Legrand M., Lipenkov V.Ya., Lorius C., Pepin L., Ritz C., Saltzman E., Stievenard M. Climate and atmospheric history of the past 420,000 years from the Vostok ice core, Antarctica. Nature, vol. 399, N 6735, 3 June 1999, pp. 429-436.

©ИЭА
CONCLUSION 5:CONCLUSION 5:
The causality between COThe causality between CO22 concentration in the concentration in the
atmosphere and global temperature atmosphere and global temperature –– if any if any ––
is the is the oppositeopposite to what is asserted.to what is asserted.
©ИЭА
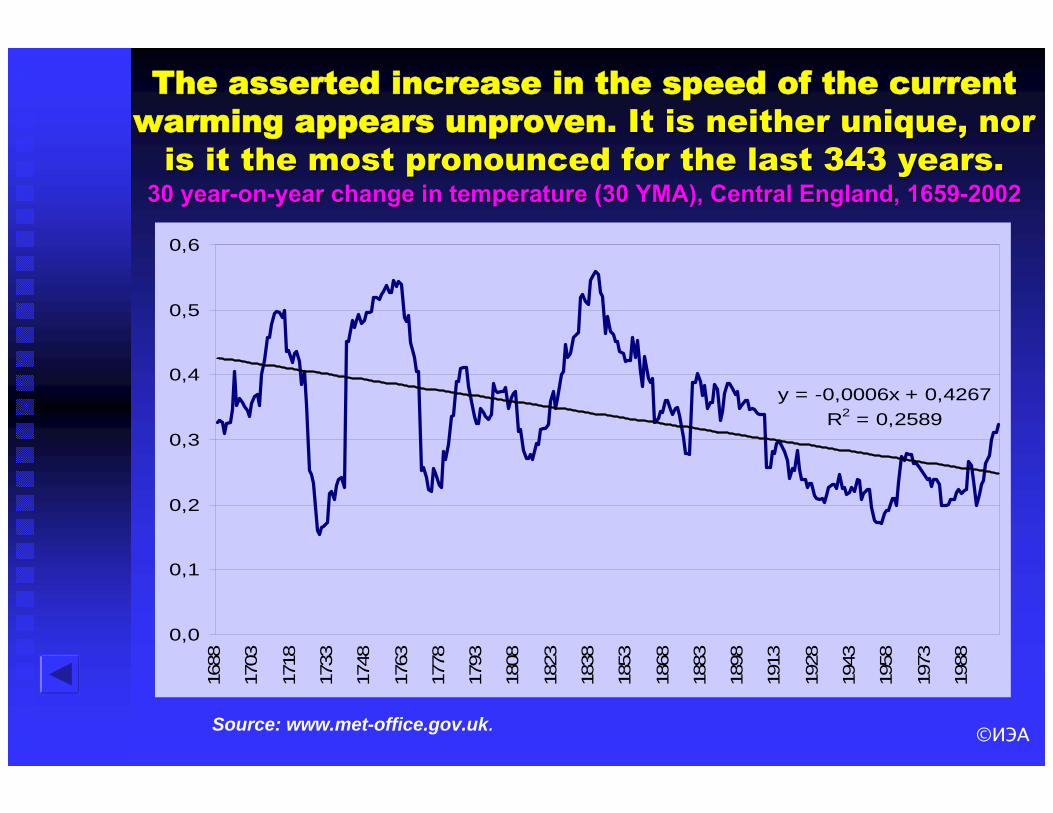
The asserted increase in the speed of the current The asserted increase in the speed of the current warming appears unprovenwarming appears unproven. It is neither unique, nor . It is neither unique, nor
is it the most pronounced for the last 343 years.is it the most pronounced for the last 343 years.30 year30 year--onon--year change in temperature (year change in temperature (3030 YMA)YMA),, Central England, 1659Central England, 1659--20022002
y = -0,0006x + 0,4267R2 = 0,2589
0,0
0,1
0,2
0,3
0,4
0,5
0,6
1688
1703
1718
1733
1748
1763
1778
1793
1808
1823
1838
1853
1868
1883
1898
1913
1928
1943
1958
1973
1988
Source: www.met-office.gov.uk.

©ИЭА
The asserted increase in the speed of the current The asserted increase in the speed of the current warming warming is neither unique, nor is it the most is neither unique, nor is it the most
pronounced in the last 35 centuries.pronounced in the last 35 centuries.30 year30 year--onon--year changes in temperatureyear changes in temperature,, Tasmania, 1751 BC Tasmania, 1751 BC –– 1991 AD1991 AD
y = 1E-07x + 0,0014R2 = 1E-07
-1,0
-0,8
-0,6
-0,4
-0,2
0,0
0,2
0,4
0,6
0,8
1,0-1
541
-136
9
-119
7
-102
5
-853
-681
-509
-337
-165 7
179
351
523
695
867
1039
1211
1383
1555
1727
1899
degr
ees
Source: World Data Center for Palaeoclimatology, Boulder, USA.

©ИЭА
-1,0
-0,5
0,0
0,5
1,0
1,5
414,
540
0,5
386,
537
2,5
358,
534
4,5
330,
531
6,5
302,
528
8,5
274,
526
0,5
246,
523
2,5
218,
520
4,5
190,
517
6,5
162,
514
8,5
134,
512
0,5
106,
592
,578
,564
,550
,536
,522
,5 8,5
Time, thousands of years before present
Deg
rees
C
The asserted increase in the speed of the current The asserted increase in the speed of the current warming warming is neither unique, nor is it the most is neither unique, nor is it the most pronounced in the last 415 thousand years.pronounced in the last 415 thousand years.
500 year500 year--onon--year changes in temperature over last 415 000 yearsyear changes in temperature over last 415 000 years,, VostokVostok ice coreice core
о
Source: Petit J.R., Jouzel J., Raynaud D., Barkov N.I., Barnola J.M., Basile I., Bender M., Chappellaz J., Davis M., Delague G., Delmotte M., Kotlyakov V.M., Legrand M., Lipenkov V.Ya., Lorius C., Pepin L., Ritz C., Saltzman E., Stievenard M. Climate and atmospheric history of the past 420,000 years from the Vostok ice core, Antarctica. Nature, vol. 399, N 6735, 3 June 1999, pp. 429-436.

©ИЭА
Average annual maximum in wind speed in Atlantic hurricanes
The asserted increase in the strength of the The asserted increase in the strength of the extraordinary climatic events appears unprovenextraordinary climatic events appears unproven..

©ИЭА
CONCLUSION 6:CONCLUSION 6:
The changes in the frequency, speed, and The changes in the frequency, speed, and
strength of extraordinary climatic eventsstrength of extraordinary climatic events
in recent years are the in recent years are the oppositeopposite of what is of what is
assertedasserted..

©ИЭА
IPCC-used version of global temperature indexseems to be distorted.
lPCC-used and corrected versions of global temperature anomalies indices for Northern Hemisphere, 1400-1980
Source: S. McIntyre, R. McKitrick, Corrections to the Mann et. al. (1998) Proxy Data Base and Northern Hemispheric Average Temperature Series, Energy & Environment. Volume 14, Number 6, 2003.
©ИЭА
CONCLUSION 7:CONCLUSION 7:
The The ““theorytheory”” of unique global warming in the of unique global warming in the
2020thth century is based on century is based on poorly processed poorly processed datadata..

©ИЭА
CONCLUSION 8:CONCLUSION 8:
The Kyoto Protocol is based on flawed science.The Kyoto Protocol is based on flawed science.

©ИЭА
KyotoKyoto’’s economic rationale s economic rationale ––
or the lack thereof.or the lack thereof.

©ИЭА
Economic growth and energy consumptionare strongly correlated.
Energy consumption andEnergy consumption and GDP growth in GDP growth in 124 124 countries,countries, 19921992--19991999
Source: World Resources Institute, IMF.
y = 0,85x + 2,11R2 = 0,75
0
2
4
6
8
10
12
-2 -1 0 1 2 3 4 5 6 7 8 9 10 11
Ln (Energy consumption, mln toe)
Ln (G
DP,
$ B
n)

©ИЭА
Energy consumption and CO2 emissionsare strongly correlated.
Energy consumption andEnergy consumption and СОСО22 emissions in emissions in 124 124 countries,countries, 19921992--19991999
Source: World Resources Institute, International Energy Agency.
y = 0,09x2 + 0,08x + 2,72R2 = 0,81
0
2
4
6
8
10
12
14
-2 -1 0 1 2 3 4 5 6 7 8 9 10 11
Ln (Energy consumption, mln toe )
Ln (С
О2
emis
sion
s, m
ln t)
©ИЭА
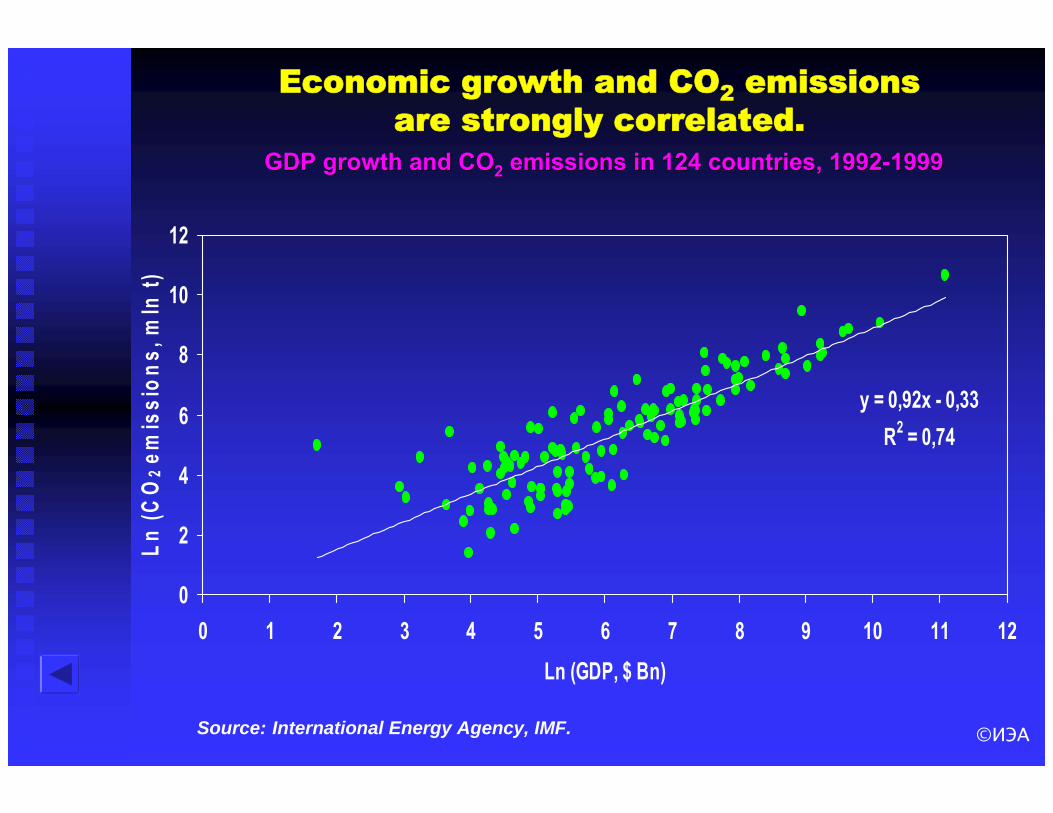
Economic growth and CO2 emissionsare strongly correlated.
GDP growth andGDP growth and СОСО22 emissions in emissions in 124 124 countries,countries, 19921992--19991999
Source: International Energy Agency, IMF.
y = 0,92x - 0,33R2 = 0,74
0
2
4
6
8
10
12
0 1 2 3 4 5 6 7 8 9 10 11 12Ln (GDP, $ Bn)
Ln (С
О2
emis
sion
s, m
ln t)
©ИЭА
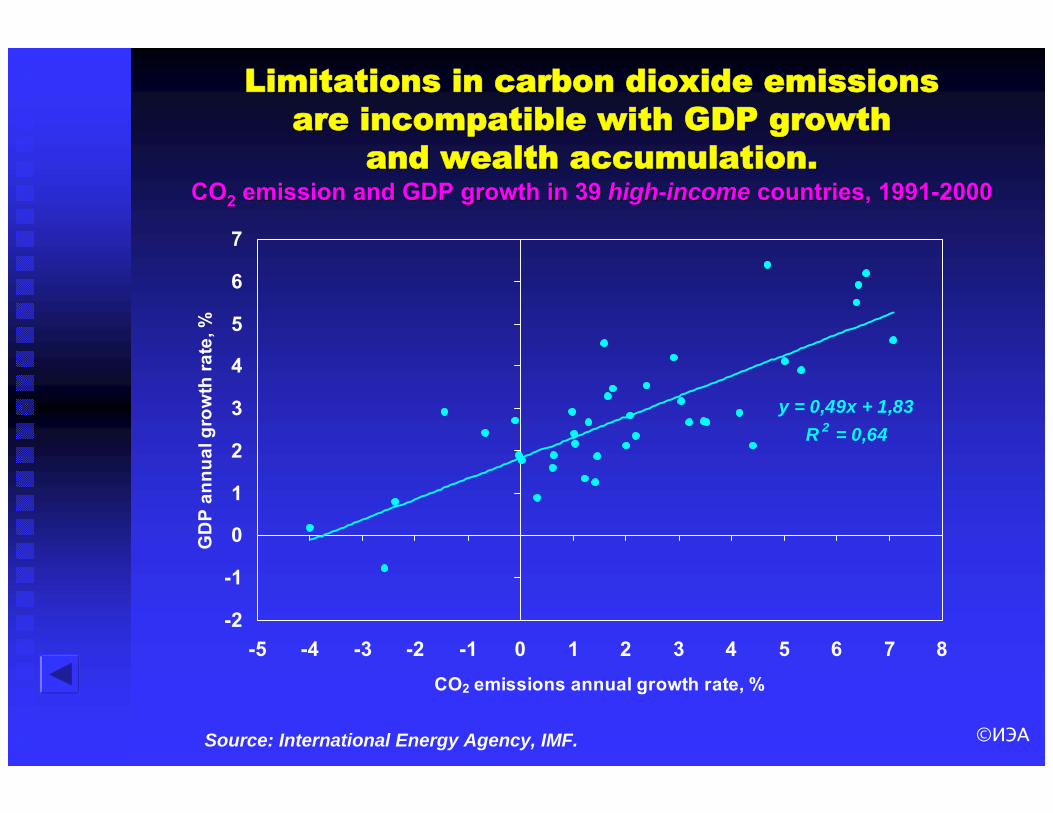
Limitations in carbon dioxide emissions Limitations in carbon dioxide emissions are incompatible with GDP growthare incompatible with GDP growth
and wealth accumulation.and wealth accumulation.СОСО22 emission and GDP growth in 39 emission and GDP growth in 39 highhigh--incomeincome countries, 19countries, 199191--20002000
y = 0,49x + 1,83R 2 = 0,64
-2
-1
0
1
2
3
4
5
6
7
-5 -4 -3 -2 -1 0 1 2 3 4 5 6 7 8CO2 emissions annual growth rate, %
GD
P an
nual
gro
wth
rate
, %
Source: International Energy Agency, IMF.

©ИЭА
Limitations in carbon dioxide emissions Limitations in carbon dioxide emissions are incompatible with GDP growth are incompatible with GDP growth
and poverty reductionand poverty reduction..COCO2 2 emissions and GDP growth in 32 emissions and GDP growth in 32 lowlow--incomeincome countries, 1991countries, 1991--20002000
y = 0,36x + 0,82R 2 = 0,34
-10
-8
-6
-4
-2
0
2
4
6
8
10
-10 -5 0 5 10 15 20 25СО2 emissions annual growth rates, %
GD
P an
nual
gro
wth
rate
s, %
Source: International Energy Agency, IMF.
©ИЭА
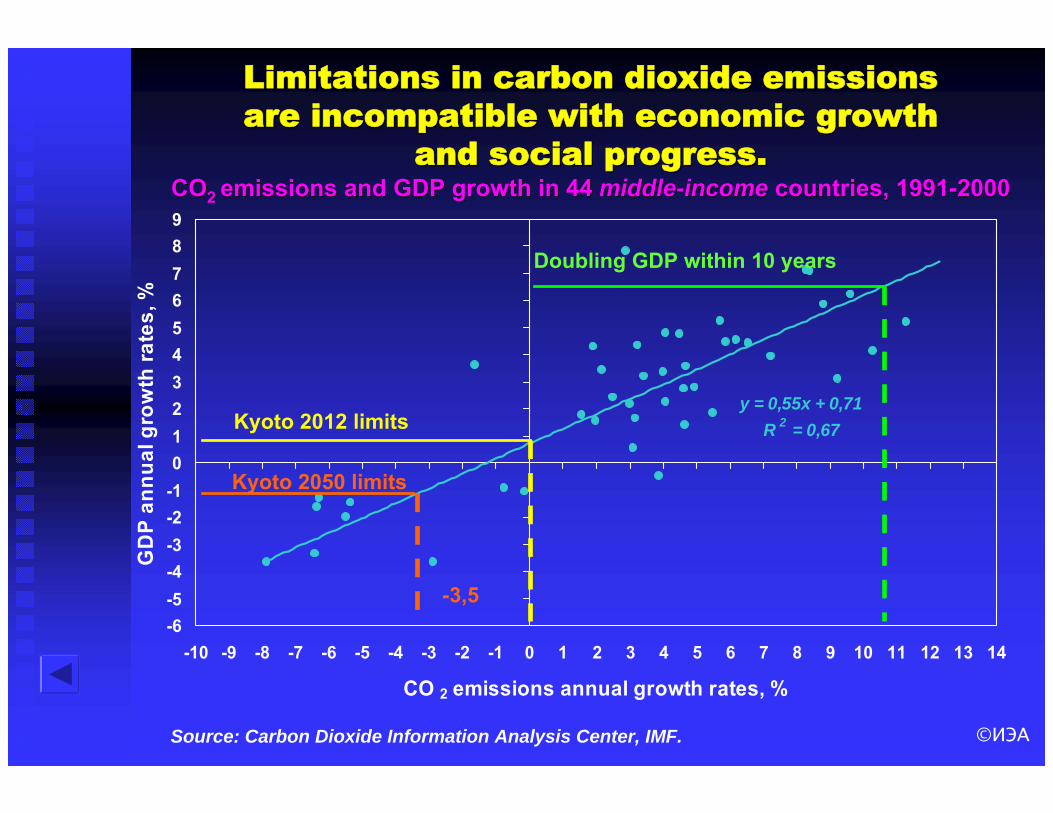
Limitations in carbon dioxide emissionsLimitations in carbon dioxide emissionsare incompatible with economic growthare incompatible with economic growth
and social progress.and social progress.COCO2 2 emissions and GDP growth in 44 emissions and GDP growth in 44 middlemiddle--incomeincome countries, 1991countries, 1991--20002000
y = 0,55x + 0,71R 2 = 0,67
-6-5-4-3-2-10123456789
-10 -9 -8 -7 -6 -5 -4 -3 -2 -1 0 1 2 3 4 5 6 7 8 9 10 11 12 13 14
CO 2 emissions annual growth rates, %
GD
P an
nual
gro
wth
rate
s, %
Doubling GDP within 10 years
Kyoto 2012 limits
Kyoto 2050 limits
-3,5
Source: Carbon Dioxide Information Analysis Center, IMF.

©ИЭА
CONCLUSION 9:CONCLUSION 9:
The Kyoto Protocol is incompatible with The Kyoto Protocol is incompatible with
economic growth and sustainable development.economic growth and sustainable development.

©ИЭА
Limitations in carbon dioxide emissions Limitations in carbon dioxide emissions are particularly discriminatory are particularly discriminatory
against lowagainst low-- and middleand middle--income economies.income economies.Kuznets curve. GDP per capita and CO2 emissions per unit of GDP
0,0
0,1
0,2
0,3
0,4
0,5
0,6
0,7
0 1 2 3 4 5 6 7 8 9 10 11 12 13 14 15 16 17 18 19 20 21 22 23 24 25GDP per capita by thousands of 1999 PPP US$
(moving average of 25 observations)
СО
2 em
issi
ons
per u
nit o
f GD
P,
mov
ing
aver
age
of 2
5 ob
serv
atio
ns
Source: Carbon Dioxide Information Analysis Center, IMF.
©ИЭА
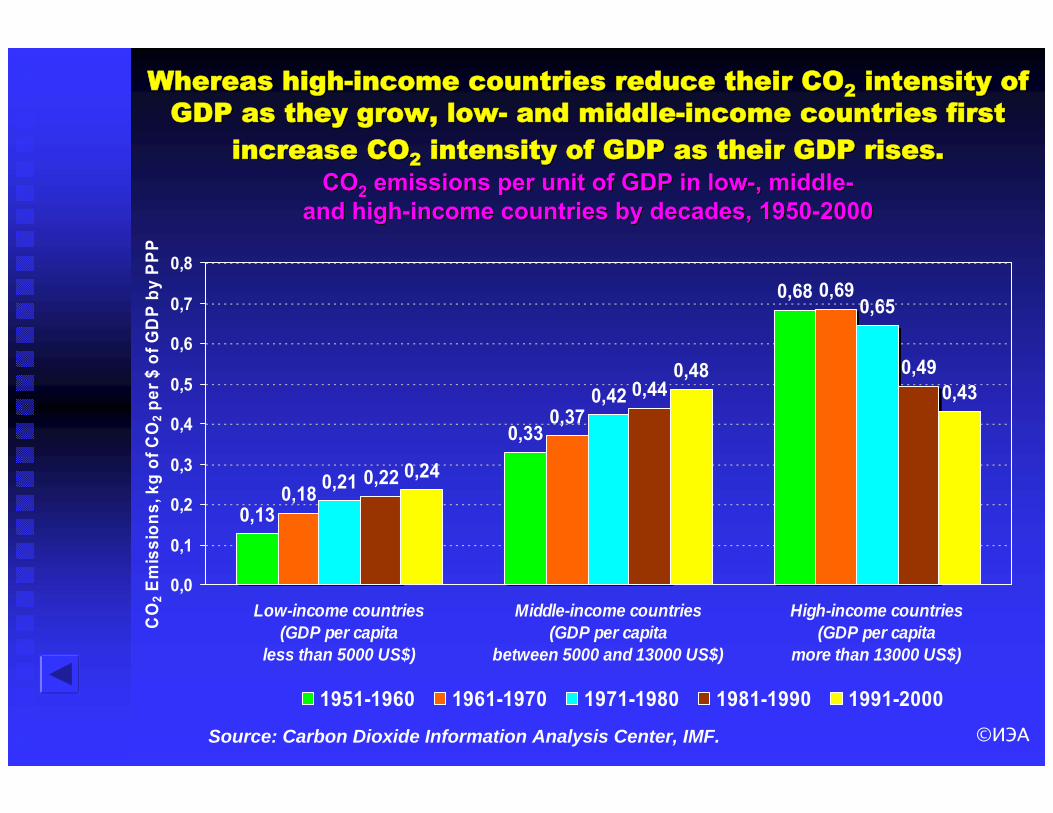
Whereas highWhereas high--income countries reduce their COincome countries reduce their CO22 intensity of intensity of GDP as they grow, lowGDP as they grow, low-- and middleand middle--income countries first income countries first
increase COincrease CO22 intensity of GDP as their GDP rises.intensity of GDP as their GDP rises.COCO22 emissions per unit of GDP in lowemissions per unit of GDP in low--, middle, middle--
and highand high--income countries by decades, 1950income countries by decades, 1950--20002000
0,13
0,33
0,68
0,18
0,37
0,69
0,21
0,42
0,65
0,22
0,440,49
0,24
0,480,43
0,0
0,1
0,2
0,3
0,4
0,5
0,6
0,7
0,8
Low-income countries(GDP per capita
less than 5000 US$)
Middle-income countries(GDP per capita
between 5000 and 13000 US$)
High-income countries(GDP per capita
more than 13000 US$)
CO
2 Em
issi
ons,
kg
of C
O2 p
er $
of G
DP
by P
PP
1951-1960 1961-1970 1971-1980 1981-1990 1991-2000
Source: Carbon Dioxide Information Analysis Center, IMF.

©ИЭА
Limitations in carbon dioxide emissions Limitations in carbon dioxide emissions are particularly discriminatoryare particularly discriminatory
against fastagainst fast--growing economies.growing economies.COCO22 emissions per unit of GDPemissions per unit of GDP
in fastin fast-- and slowand slow--growing middlegrowing middle--income countries (1950=100%)income countries (1950=100%)
Average
Fast-growing
Slow-growing
100
120
140
160
180
200
22019
50
1952
1954
1956
1958
1960
1962
1964
1966
1968
1970
1972
1974
1976
1978
1980
1982
1984
1986
1988
1990
1992
1994
1996
1998
2000
Inde
x (1
950=
100%
)
Source: Carbon Dioxide Information Analysis Center, 2003.

©ИЭА
CONCLUSION 10:CONCLUSION 10:
The Kyoto Protocol is particularly The Kyoto Protocol is particularly
discriminatory against lowdiscriminatory against low-- and middleand middle--income income
economies.economies.
©ИЭА
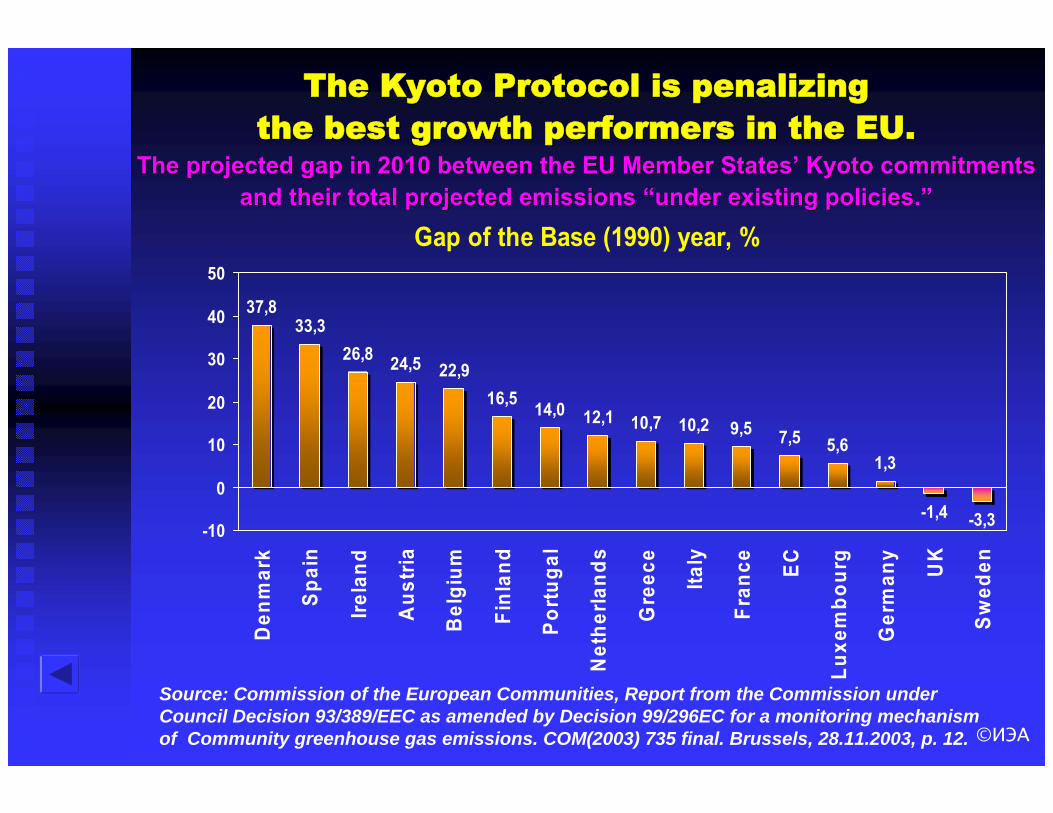
The Kyoto Protocol is penalizing The Kyoto Protocol is penalizing the best growth performers in the EU.the best growth performers in the EU.
The projected gap in 2010 between the EU Member StatesThe projected gap in 2010 between the EU Member States’’ Kyoto commitmentsKyoto commitmentsand their total projected emissions and their total projected emissions ““under existing policies.under existing policies.””
Gap of the Base (1990) year, %
37,833,3
26,8 24,5 22,916,5 14,0 12,1 10,7 10,2 9,5 7,5 5,6
1,3
-1,4 -3,3-10
0
10
20
30
40
50D
enm
ark
Spai
n
Irela
nd
Aus
tria
Bel
gium
Finl
and
Portu
gal
Net
herla
nds
Gre
ece
Italy
Fran
ce EC
Luxe
mbo
urg
Ger
man
y
UK
Swed
en
Source: Commission of the European Communities, Report from the Commission under Council Decision 93/389/EEC as amended by Decision 99/296EC for a monitoring mechanism of Community greenhouse gas emissions. COM(2003) 735 final. Brussels, 28.11.2003, p. 12.

©ИЭА
Limitations in carbon dioxide emissions in developed Limitations in carbon dioxide emissions in developed economies are associated with slow GDP growth and economies are associated with slow GDP growth and slow progress in reduction of COslow progress in reduction of CO22 intensity of GDP.intensity of GDP.
Source: International Energy Agency, IMF.
Annual average growth rates:CO2 emissions, 1997-2001 GDP, 1997-2003 CO2 intensity of GDP, 1997-2001
0,3
1,9
-1,2
1,8
3,3
-1,6
-3
-2
-1
0
1
2
3
4
per c
ent
17 Pro-Kyoto Developed Economies (EU15, Canada, Japan)
11 Non-Kyoto Developed Economies (USA, Australia, Taiwan, Korea, Hong Kong, Singapore, Israel,Mexico, Cyprus, Malta, Puerto-Rico)

©ИЭА
CONCLUSION 11:CONCLUSION 11:
The Kyoto Protocol penalizes fastThe Kyoto Protocol penalizes fast--growing growing
economies.economies.

©ИЭА
CONCLUSION 12:CONCLUSION 12:
The Kyoto Protocol is ineffective in achievingThe Kyoto Protocol is ineffective in achieving
higher economic efficiency as measured by a higher economic efficiency as measured by a
reduction in COreduction in CO22 intensity of GDP.intensity of GDP.

©ИЭА
D (7,2%)C (6,7%)
B (6,2%)
Actual emissions
A (5,0%)Index (1990=100%)
E (9,0%)
0
20
40
60
80
100
120
140
160
180
20019
9019
9119
9219
9319
9419
9519
9619
9719
9819
9920
0020
0120
0220
0320
0420
0520
0620
0720
0820
0920
1020
1120
1220
1320
1420
1520
1620
1720
1820
1920
20
CO
2 em
issi
on in
dex
(199
0=10
0%)
RussiaRussia’’s s СОСО22 emission will exceed emission will exceed the 1990 level in 2007the 1990 level in 2007--2012.2012.
COCO22 emissions emissions (1990=100%):(1990=100%): actualactual in in 19901990--2003 2003 and forecasts forand forecasts for 20042004--20202020
KP first phase
Projected emissions accordingto forecasts of GDP growth:

©ИЭА
0
20
40
60
80
100
120
140
160
180
20019
9019
9119
9219
9319
9419
9519
9619
9719
9819
9920
0020
0120
0220
0320
0420
0520
0620
0720
0820
0920
1020
1120
1220
1320
1420
1520
1620
1720
1820
1920
20
CO
2 em
issi
on in
dex
(199
0=10
0%)
Forecast B (6,2%)
Kyoto-2050 limitsActual emissions
Russia's Kyoto Cross.Russia's Kyoto Cross.Under the Kyoto Protocol, after 2010 Russia will be a buyer,Under the Kyoto Protocol, after 2010 Russia will be a buyer,
not a seller of COnot a seller of CO22 quotas.quotas.RussiaRussia’’ss actual COactual CO22 and forecasted emissions, and Kyoto limits for Russia (1and forecasted emissions, and Kyoto limits for Russia (1stst and next phase)and next phase)
Kyoto-2012 limits
Russia as seller Russia as buyer
KP first phase
Kyoto-2010 limits

©ИЭА
CONCLUSION 13:CONCLUSION 13:
The Kyoto Protocol is harmful for economic The Kyoto Protocol is harmful for economic
growth in Russia.growth in Russia.
©ИЭА
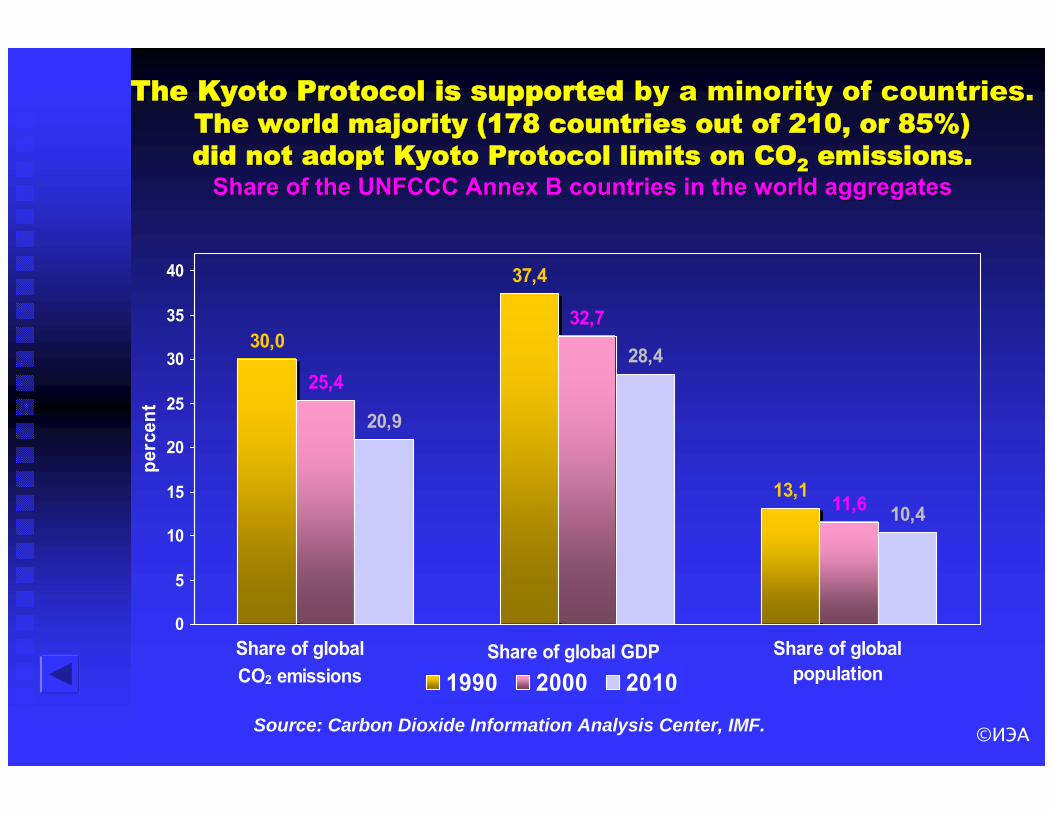
The Kyoto Protocol is supported The Kyoto Protocol is supported by a minority of countries.by a minority of countries.The world majority (178 countries out of 210, or 85%)The world majority (178 countries out of 210, or 85%)did not adopt Kyoto Protocol limits on COdid not adopt Kyoto Protocol limits on CO22 emissions.emissions.
Share of the UNFCCC Annex B countries in the world aggregatesShare of the UNFCCC Annex B countries in the world aggregates
30,0
37,4
13,1
25,4
32,7
11,6
20,9
28,4
10,4
0
5
10
15
20
25
30
35
40
perc
ent
1990 2000 2010Share of global CO2 emissions
Share of global GDP Share of globalpopulation
Source: Carbon Dioxide Information Analysis Center, IMF.

©ИЭА
CONCLUSION 14:CONCLUSION 14:
The Kyoto Protocol is The Kyoto Protocol is notnot universal.universal.
It is supported by the worldIt is supported by the world’’s minority.s minority.

©ИЭА
ItIt’’s impossible to switch away from s impossible to switch away from hydrocarbons to another energy base hydrocarbons to another energy base
in a short period of time.in a short period of time.World energy consumption by source of origin, 2000World energy consumption by source of origin, 2000
Source: World Resources Institute.
©ИЭА
CONCLUSION 15:CONCLUSION 15:
The Kyoto Protocol is based The Kyoto Protocol is based
on technological illusions.on technological illusions.
©ИЭА
CONCLUSION 16:CONCLUSION 16:
From an economic point of view,From an economic point of view,
the Kyoto system of mandatory restrictions the Kyoto system of mandatory restrictions
and penalties is an Orwellian nightmare.and penalties is an Orwellian nightmare.

©ИЭА
KyotoKyoto’’s rationale s rationale
for human civilization for human civilization ––
or the lack thereof.or the lack thereof.
©ИЭА
-12,0
-10,0
-8,0
-6,0
-4,0
-2,0
0,0
2,0
4,0
6,041
540
138
637
235
734
332
831
429
928
527
025
624
122
721
219
818
316
915
414
012
511
1 96 82 67 53 38 24 9
Time, thousands of years before present
Tem
pera
ture
, o С
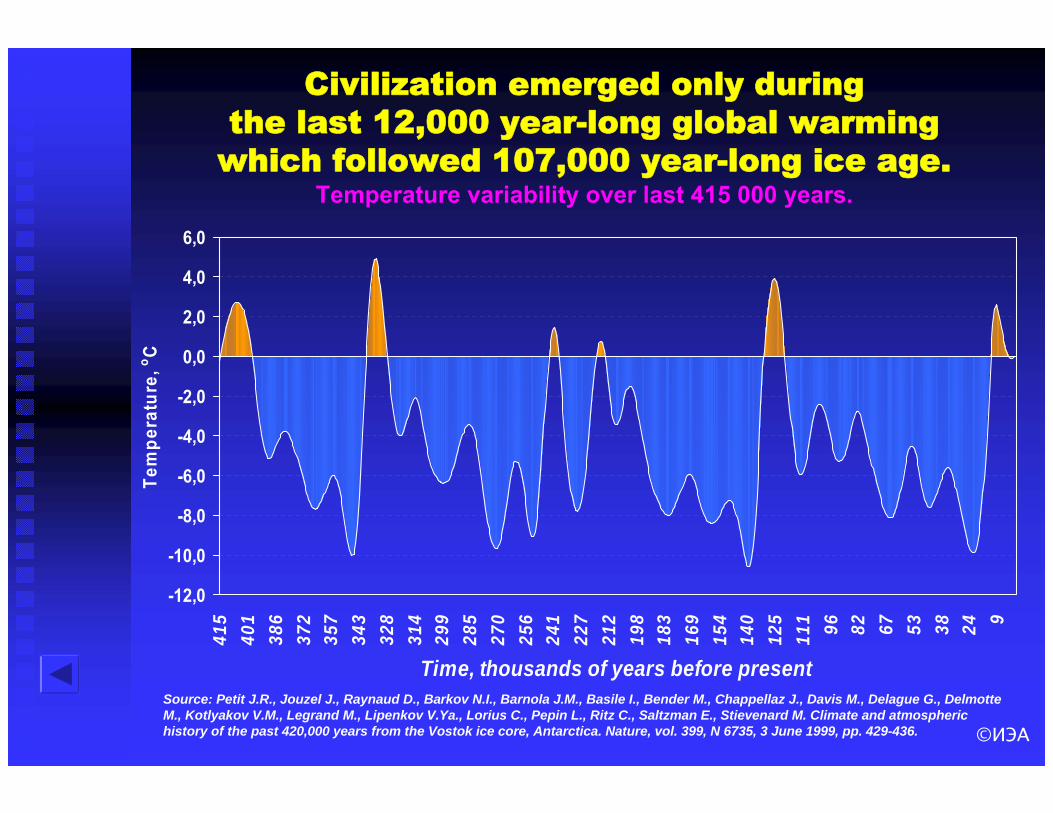
Civilization emerged only during the last 12,000 year-long global warming
which followed 107,000 year-long ice age.Temperature variability over last 415 000 years.
Source: Petit J.R., Jouzel J., Raynaud D., Barkov N.I., Barnola J.M., Basile I., Bender M., Chappellaz J., Davis M., Delague G., DelmotteM., Kotlyakov V.M., Legrand M., Lipenkov V.Ya., Lorius C., Pepin L., Ritz C., Saltzman E., Stievenard M. Climate and atmospheric history of the past 420,000 years from the Vostok ice core, Antarctica. Nature, vol. 399, N 6735, 3 June 1999, pp. 429-436.

©ИЭА
Global temperature was above its current level for only 58 thousand years out of the last 415 thousand years (for 14% of this period).
Global temperature was lower than its current levelfor 357 thousand years out of the last 415 thousand years (for 86% this period).
Global temperature last peaked 9,000 years ago, and then embarked on a long-term downward trend.

©ИЭА
Mortality is sensitive to air temperature.Mortality is sensitive to air temperature.RussiaRussia’’s mortality seasonal deviations,s mortality seasonal deviations, 19971997--20032003
1,4
1,0
0,4
0,0
0,1
-0,4 -0,5
-1,4
-0,6
0,0-0,3
0,4
-2,0
-1,5
-1,0
-0,5
0,0
0,5
1,0
1,5
2,0
Janu
ary
Febr
uary
Mar
ch
Apr
il
May
June
July
Aug
ust
Sept
embe
r
Oct
ober
Nov
embe
r
Dec
embe
r
Dea
ths
per 1
000
popu
latio
n
Source: Goskomstat RF.

©ИЭА
According to the Kyoto Protocol, national and supranational bureaucratic monsters must be created.
They will ration emissions and therefore economic activity worldwide.
The fate of countries, industries, companies, and ultimately individuals around the world will depend on them.

©ИЭА
FINAL CONCLUSION:
Kyoto-ism is the most broad-based,
the most intrusive and the most aggressive
assault on basic human freedoms
since the collapse of fascism and communism.