the labor market effects of rising health insurance premiums
TRANSCRIPT

609
[ Journal of Labor Economics, 2006, vol. 24, no. 3]� 2006 by The University of Chicago. All rights reserved.0734-306X/2006/2403-0007$10.00
The Labor Market Effects of RisingHealth Insurance Premiums
Katherine Baicker, University of California, Los Angeles,
and the National Bureau of Economic Research
Amitabh Chandra, Harvard University, Institute for the
Study of Labor, and the National Bureau of Economic Research
We estimate the effect of rising health insurance premiums on wages,employment, and the distribution of part-time and full-time workusing variation in medical malpractice payments driven by the recent“medical malpractice crisis.” We estimate that a 10% increase inhealth insurance premiums reduces the aggregate probability of beingemployed by 1.2 percentage points, reduces hours worked by 2.4%,and increases the likelihood that a worker is employed only part timeby 1.9 percentage points. For workers covered by employer providedhealth insurance, this increase in premiums results in an offsettingdecrease in wages of 2.3%.
I. Introduction
In the United States, two-thirds of the nonelderly population is coveredby employer-provided health insurance (EHI), either directly or as a de-
Mark was an extraordinary economist, advisor, and friend, and we will misshis advice, generosity, and insights. We are grateful to Mark Berger, JonathanGruber, Ellen Meara, Derek Neal, Douglas Staiger, Aaron Yelowitz, conferenceparticipants at the Mark C. Berger Research Conference, the NBER SummerInstitute, and the annual meetings of the American Economic Association forvery insightful comments. The views expressed here are the research findings ofthe authors and do not necessarily represent those of the Council of EconomicAdvisers or the White House. Contact the corresponding author, Amitabh Chan-dra, at [email protected].

610 Baicker/Chandra
pendent through a family member’s coverage.1 According to a nationalsurvey conducted by the Kaiser Family Foundation, the cost of EHI hasincreased by over 59% since 2000, with no accompanying increase in thescale or scope of benefits; between 2003 and 2004 the price of premiumsincreased 11.2%, 9 percentage points more than the 2.3% increase inworkers’ hourly earnings.2 Increases in health insurance premiums mayhave significant effects on labor markets, including changes in the numberof jobs, hours worked per employee, wages, and compensation packages.Indeed, it is possible that a significant portion of the increase in theuninsured population may be a consequence of employers shedding thisbenefit as health insurance premiums rise (Porter 2004). Simple correla-tions are consistent with this story: despite strong economic growth inthe 1990s, the number of nonelderly uninsured grew by 3 percentagepoints to 15.7% of the population, while the price of health insurancepremiums grew by 34%.
Understanding the relationship between health insurance costs and la-bor markets is of growing policy importance. Proposals to cover theuninsured often rely on “employer mandates” that would require em-ployers to cover eligible workers.3 For example, California’s Senate Bill2 (also known as Proposition 72, narrowly defeated in November 2004)would have required all employers with more than 20 employees to pro-vide health insurance to their workers (who work more than 100 hoursper month). Other policy proposals include the provision of tax creditsfor the purchase of nongroup health insurance, which would differentiallychange eligible employees’ valuation of benefits provided by their em-ployer versus wages.
The magnitude of the effects of increases in benefit costs on employ-ment, wages, and health insurance coverage will be driven by the elastic-ities of labor supply and demand, institutional constraints on wages andcompensation packages, and how much workers value the increase inhealth insurance costs. Since employers currently provide such coveragevoluntarily, if workers fully value these benefits then they will bear thecost of the increase in reduced wages, with no accompanying change in
1 These tabulations are from the annual demographic files of the Current Pop-ulation Survey (CPS) for 1988–2003. We define the nonelderly population as thoseunder the age of 65.
2 These figures are obtained from Kaiser Family Foundation, Kaiser Commis-sion on Medicaid and the Uninsured (2003). In fig. 1, we use these data to illustratethe growth of premiums since 1996 for family and single-person policies.
3 Yelowitz (2004) provides a thorough discussion of this legislation and estimatesits economic impact.

Health Insurance Premiums 611
employment, employment costs, or employee utility.4 Thus, in a worldwhere workers value benefits at their cost and are able to sort betweenfirms based on their preferences—and without other institutional con-straints—increases in the costs of benefits should be fully offset by de-creases in wages.
There are many reasons, however, to believe that firms have limitedability to offset increases in the price of health insurance premiumsthrough lower compensation. Institutional constraints, such as the min-imum wage, union rules, and other provisions of labor law that prohibitdifferent demographic groups from being paid differently, limit a firm’sability to reduce compensation.5 Nondiscrimination provisions increasethe incentives to move workers with different preferences for benefitsthan their coworkers, that is, “anomalous workers,” into part-time po-sitions. Carrington, McCue, and Pierce (2002) provide evidence of suchbehavior. They note that anomalous workers (i.e., low-pay employees inhigh-pay firms) are more likely to be part-time employees than they arein firms where they resemble the typical worker. They demonstrate thatInternal Revenue Service nondiscrimination rules limit the extent ofwithin-firm inequality in benefits but increase (within-firm) wage in-equality. Their study demonstrates that firms skirt these nondiscrimina-tion rules by moving workers with unusual benefits into part-time po-sitions. In the context of our research, such pressures would imply thatemployers move married women (who typically decline EHI) workingin firms where the typical worker is a married man (who elects coverage)into part-time jobs. For these reasons, increases in the cost of providinghealth insurance may affect employment and the structure of work.
Identifying the magnitude of these effects empirically, however, is dif-ficult. Data on premiums and wages are usually not jointly available atthe individual level. Additionally, most micro–data sets (such as the CPS)do not allow the researcher to control adequately for worker character-istics, such as ability, that might simultaneously influence both healthinsurance costs and the outcome under study. In this article we uncoverthe causal effect of increases in the cost of benefits on labor market out-
4 This view is explicitly studied in the literature estimating the wage-fringe trade-off (e.g., Gruber 1994). A $1 increase in the value of fringes may be offset by a$1 reduction in fringe benefits—or, in the case of most tax-favored benefits, a $1/( ) reduction, where t is the tax rate.1 � t
5 We used the February CPS supplement to examine the degree to which low-wage workers have EHI and are therefore at risk of losing such coverage. In thesedata (weighted using CPS weights), we focused on two samples: (a) workers whoearn within $3 of the minimum wage in their state and (b) workers who earn lessthan $10 per hour (which corresponds with the 25th percentile of wages). Forthese samples, the fractions that are eligible for EHI are 52.6% and 60.5%, re-spectively, and the fractions covered by EHI are 31.7% and 38.5%, respectively.

612 Baicker/Chandra
comes by exploiting an exogenous source of variation in the cost of pro-viding health insurance: the recent “medical malpractice crisis,” wheremalpractice costs for physicians grew dramatically in some states but notin others. As we discuss in more detail below, the growth of malpracticepayments affects both malpractice insurance premiums and the cost ofhealth insurance: if the demand for health care is relatively inelastic (be-cause of private or public health insurance), the increased cost of mal-practice will be borne by consumers in the form of higher health insurancepremiums, rather than primarily by physicians in the form of lower com-pensation (see Baicker and Chandra 2005).
In Section II we outline a conceptual framework for our analysis. Sec-tion III examines econometric challenges to estimating the hypothesizedeffects and provides a justification for our use of malpractice paymentsas an instrumental variable for health premiums. In Section IV we describethe data that we use. In Section V we present empirical results, includingspecification checks that provide validation for our use of malpracticepayments as a plausible instrument for health insurance premiums. Wefind that the cost of increases in health insurance premiums is borne byworkers through decreased wages for those with EHI and through de-creased hours for those moved from full-time jobs with benefits to part-time jobs without. As we discuss in Section VI, these results have strongimplications for the effectiveness and distributional impact of many dif-ferent health-care reform proposals.
II. Conceptual Framework
The effect of increased benefits costs on employment outcomes dependson several factors. Summers (1989) examines the effects of mandated ben-efits (versus taxes) on wages and employment, highlighting the importanceof the employees’ valuation of the benefit. The provision of a benefit thatis fully valued by workers should not change employment—but shoulddecrease wages by the cost of the benefit. Gruber and Krueger (1991)discuss this model more formally. Following their framework, let L ps
and be the labor supply and demand curves,f(W � aC) L p (W � C)d
respectively. The variable W represents wages, C represents the premiumfor the health insurance provided by the employer (thus incorporatingboth the quantity of insurance and the price for that policy), and aCrepresents employees’ monetary valuation of that health insurance. It isstraightforward to demonstrate that
d s d sdW/dC p �(h � ah )/(h � h ), (1)
where hd and hs are the price elasticities of labor demand and supply. If, then wages fall by the full cost of the mandated benefit, and ifa p 1, then the results are identical to those obtained for the incidencea p 0

Health Insurance Premiums 613
of a payroll tax. Additionally, the proportional change in employmentwill be given by
ddL/L p h (W � W � dC)/W , (2)0 1 0
where W0 and W1 represent the initial and final levels of wages.Equation (2) demonstrates that the effect of rising health insurance
premiums on employment is inversely proportional to the wage offsetcaused by the employer provision of health insurance (which means thatit is also a negative function of a) and is proportional to the elasticity oflabor demand. Note that as the premium (C) is the product of the quantityof health insurance provided and the price of that bundle, changes in Cmay reflect changes in the price of EHI or changes in quantity (directlyor as an indirect effect of changes in price), although in practice employersmay be limited in their ability to change the health insurance bundle.
An increase in the price of EHI results in an inward shift of the labordemand curve, unambiguously lowering employment and wages ceterisparibus. However, there may also be a corresponding shift outward ofthe labor supply curve: if the cost of both EHI and health insurance inthe nongroup market increase together (and a is positive), workers willvalue the increase in employer expenditures on benefits and be willing toaccept lower wages in exchange for higher spending on health insurance.It is important to note that this outward shift of the labor supply curvewill not occur if the price of EHI increases while the price of healthinsurance in the nongroup market is unchanged, because workers couldthen purchase the health insurance on their own without using extraresources (making their outside option more attractive relative to workingand being compensated in part with EHI) and would thus be unwillingto accept an offsetting reduction in wages.
The effect of an increase in the cost of EHI on the labor market equi-librium, again assuming a is positive, is thus a fall in wages but an am-biguous change in employment. Employment falls less or rises more, thegreater is the worker valuation of health insurance, a. There are a fewgroups for whom we might, however, particularly expect to see employ-ment losses: employers may not be able to reduce wages for workers nearthe minimum wage. There are also other antidiscrimination provisions oflabor law that prohibit different demographic groups from being paiddifferently. Union rules and workplace norms about differential pay fordifferent demographic groups (who may have heterogeneous demands forEHI) make it difficult for an employer to perfectly fine-tune the wageresponse to rising EHI premiums. For such groups, we expect to see adecrease in employment.
In the Summers (1989) model, labor supply is treated as a discretechoice; there is no distinction between employment and hours worked.If this divisibility is introduced, the effect on hours worked and em-

614 Baicker/Chandra
ployment are ambiguous. This is because increases in the price of EHIraise the fixed costs of employment, which suggests that employers wouldwant more hours from fewer workers. In this case, hours for workerswith EHI would increase, while their wages decrease; this mechanism isemphasized by Cutler and Madrian (1998). By contrast, since part-timeworkers are typically not covered by EHI, we might also expect employersto replace full-time workers eligible for EHI with part-time workers with-out EHI. In this situation, total employment may increase. In both cases,we do not expect to see an increase in wages or a decrease in hours forworkers with EHI. Nor do we expect to see an increase in full-timeemployment, although the total effect on employment is ambiguous.
In light of these ambiguous analytical predictions of the effect of healthinsurance costs on hours, employment, and the fraction of full-time andpart-time jobs, assessing the labor market effects of increases in healthinsurance premiums is fundamentally an empirical question.
III. Empirical Strategy
Empirically evaluating the effect of rising health premiums on em-ployment, wages, hours worked, and the composition of employment(the share of jobs that are full time or part time) is an exercise withnumerous challenges. Data sets such as the census and the CPS do notcontain information on the employer costs of health insurance or thegenerosity of plans. Additionally, even if this information were available,such data sets do not allow the researcher to control adequately for workercharacteristics that might also influence the outcome under study.6 Inprinciple, a large-scale social experiment that does not suffer from attritionor agents attempting to compensate for their treatment regime may solveselection problems of this nature, and an instrumental variable estimationstrategy can reproduce the experimental estimate if the underlying as-sumptions behind instrumental variables (IV) estimation are satisfied.
To motivate our estimation strategy, consider the following structuralequation for a worker i in state j and in year t:
Outcome p b � b HI � X P � S � T � � . (3)ijt 0 1 i i j t ijt
Here, Outcomei is the labor market outcome of interest (hours worked,wages, wage income, unemployment, part-time/full-time status, or receiptof health insurance). The expression Xi measures person-level covariates,including controls for family structure, marital status, and industry. Ex-pressions Sj and Tt are state and year fixed effects, respectively, and �ijt is
6 These limitations are identical to those that have plagued the literature onidentifying the wage-fringe trade-off. Currie and Madrian (2000) provide a com-prehensive overview of this literature.

Health Insurance Premiums 615
a person-specific idiosyncratic term.7 Expression HIi measures the pre-mium associated with providing individual i with EHI.8 This equationcan be modified to include interaction effects and indicator variables forcertain demographic groups that may be of particular interest (e.g., hourlyworkers, married women, workers near the minimum wage, or workerswith EHI).
The first problem inherent in an ordinary least squares (OLS) estimationof equation (3) is that . For example, workersCov (Cost of HI , �i) ( 0i
with high ability may work at firms that offer generous health benefitsand, therefore, high premiums. Second, data sets such as the Survey ofIncome and Program Participation (SIPP) or CPS do not report the valueor generosity of the health insurance plan received by a worker.9 Empiricalresearchers have responded to this limitation by imputing health insurancepremiums to each respondent based on industry (Cutler and Madrian1998) and based on industry, firm size, and family/single status (Yelowitz2004). These imputations solve the missing data problem and can in prin-ciple reduce the potential endogeneity problem. We first discuss the iden-
7 Cutler and Madrian (1998) do not include state fixed effects. Yelowitz (2004)examines data from California; his analysis is therefore comparable to one wherestate fixed effects are included.
8 Technically, HIi should measure the difference between EHI premiums andpremiums for policies purchased in the nongroup market. The nongroup marketis small relative to the size of the group market, and it is also highly individuallyrated. Using data from the 2005 March CPS, we found that 16.9 million individualsunder the age of 65 (6.6% of this group) were covered by directly purchasedhealth insurance. In contrast, 161 million individuals (63.2%) were covered byEHI. This 10-fold difference suggests that the nongroup market is small. In con-trast to the group market, prices in the nongroup market are affected by smoking,age, alcohol consumption, weight, and preexisting conditions such as diabetes,hepatitis, AIDS, asthma, high cholesterol, and liver conditions. We made thisdetermination by pricing individual premiums on http://www.eHealthInsurance.com. For the purpose of estimation, the above discussion makes it clear that wemust include state fixed effects. These fixed effects will control for state-leveldifferences in the price of EHI and insurance purchased in the nongroup market.However, to the extent that the price of insurance in the nongroup market ishighly idiosyncratic to the individual, our IV strategy will remove any correlationbetween premiums for EHI and premiums for nongroup health insurance.
9 The SIPP offers several advantages over the CPS, and we explored the pos-sibility of using the SIPP in the early stages of our project. The ability to use afixed-effects estimator makes its use extremely appealing, as it would control fortime-invariant heterogeneity. To use the SIPP we would need persons to switchjobs, industry, or family structure, so that we can observe changes in the priceof EHI overtime; if there were no such changes, the imputed premium for EHIwould be perfectly collinear with the fixed effect, and these observations wouldnot contribute to the estimation of the coefficient on EHI. However, if the factorsthat induce job changes or family transitions (such as illness or economic down-turns) are also correlated with changes in labor market outcomes, then we wouldneed an IV strategy.

616 Baicker/Chandra
tification strategy implicit in this approach and then contrast it with ouralternative strategy.
Imputed premium data may be thought of as representing premiumsthat have been obtained using the match characteristics (such as industryand family structure) as instruments. That is, if data on HIi were available,we could, in principle, estimate:
HI p g � Industry � Firm Size � Family Structure � v . (4)dfs 0 d f s dfs
The dfs subscripts make explicit the notion that equation (4) is estimatedat the level of industry d, firm size f, and family structure s and not atthe level of a person i. (Equation [4] could also be estimated at the statelevel.) One could use the fitted values from equation (4), , as the keyHIdfs
regressor in the estimation of equation (3). Implicitly, these fitted valuesmay be thought of as characterizing the relationship
HI { HI � m . (5)i idfs
Here, mi represents the portion of health insurance premiums that isidiosyncratic to person i. It is probably the case that Cov (� , m ) ( 0ijt i
because more productive workers who can command large compensationpackages will choose packages with more health insurance. This is theprincipal reason for why the OLS estimation of equation (3) will notproduce consistent estimates. If , as would be the caseCov (� , HI ) p 0ijt dfs
if industry, firm size, and family structure were valid instruments, thenwe may estimate:
Outcome p b � b HI � X P � S � T � � . (6)ijt 0 1 i j t ijtdfs
The central problem with estimating equation (6) in lieu of equation (3)is the possibility that . This would be true if the “in-Cov (HI , � ) ( 0idfs
struments” (industry, firm size, and family structure) are correlated with�i, the unobservable characteristics of the worker. If workers in a certainsector of the economy or those who are married are systematically morelikely to have different levels of unobservable characteristics that affecthealth insurance premiums, then such a correlation is possible.10 Thisproblem is identical to the standard endogeneity problem in programevaluation, where receipt of the treatment is correlated with unobservablecharacteristics of the person receiving treatment.
10 We examined whether these instruments failed a test of overidentifying re-strictions. To perform this test we regressed the two-stage least squares residualson all the exogenous variables and examined whether the R2 exceeded the criticalvalues of a x2 distribution with degrees of freedom equal to the number of in-struments. For each of our key dependent variables (wages and salary, hours, part-time status, and employment), the test statistic using industry and firm size asinstruments exceeded a value of 1,000, several times higher than the critical valuesof the x2 distribution required to reject these variables as instruments.

Health Insurance Premiums 617
A solution to this problem is to instrument for imputed premiumsusing variables that are uncorrelated with �i and mi but are correlatedwith imputed health insurance premiums. In our analysis we use state-level, per-capita medical malpractice payments as an instrument for im-puted premiums. For malpractice payments to provide a valid instru-mental variable for imputed premiums, it must be the case that theinstruments affect health premiums. Second, it must also be the case thatmalpractice payments are not correlated with the unobservable charac-teristics of workers. In the next subsection, we explore the prima faciavalidity of these assumptions.
The Medical Malpractice Crisis
The “medical malpractice crisis” that began at the turn of the twenty-first century refers to the dramatic increase in physician premiums formalpractice insurance. Chandra, Nundy, and Seabury (2005) and Mello,Studdert, and Brennan (2003) provide an overview of this crisis and itsunderlying causes and consequences. Both the American Medical Asso-ciation and the Physician Insurers Association of America attribute thedramatic increase in physician malpractice insurance premiums to thegrowth in malpractice payments (see Smarr 2003; American Medical As-sociation 2004a, 2004b). Whereas other factors such as declines in insurers’investment income—including the presence of an underwriting cycle, aless competitive insurance market, and climbing reinsurance rates—areacknowledged to have contributed to this medical malpractice crisis, in-surer losses from increases in malpractice payments are believed to be theprimary contributor to the growth of malpractice premiums. Indeed, aGeneral Accounting Office study of seven states concluded that thegrowth of insurer’s losses from payments is the primary driver of thegrowth of premiums (see U.S. General Accounting Office 2003a, 2003b).
If the demand for health services is inelastic, then the effect of increasingmalpractice payments on malpractice premiums will have little effect onnet physician compensation. Indeed, Baicker and Chandra (2005) arguethat because of the nature of health insurance (which insulates the patientfrom the marginal costs of seeking care, and which is subsidized by thetax code), the demand for medical services is relatively inelastic. Thedemand for health services by Medicare beneficiaries is likely to be evenless elastic, as they are further insulated from even a wage-fringe benefittrade-off. Consumers of health care are therefore likely to bear the bruntof the cost through increases in the price of health care (and, consequently,health insurance premiums).11
11 In theory we could also use malpractice premiums as an instrument for healthinsurance premiums. However, there is less systematic data on malpractice in-surance premiums. There is an annual survey conducted by the publication Med-

618 Baicker/Chandra
With this preliminary validation, we use increases in malpractice pay-ments as an instrument for health insurance premiums to estimate thefollowing first-stage equation:
HI p g � g Malpractice Payments � X P � S � T � v , (7)0 1 jt i j t iijt
where, as discussed below, malpractice payments are broken down by thesize and number of payments for different specialties. Instrumenting forimputed premiums removes the bias from any residual correlation be-tween �i and . This is because the instrument only picks up that partHIijt
of the (within-state) variation in imputed premiums that is attributableto (within-state) changes in the malpractice climate. It may be temptingto reason that the correlation of premiums with the instrument, mal-practice payments, is potentially spurious because states with high mal-practice payments may have workers who are systematically more or lessabled. This is not the case, however, as all of our specifications includestate fixed effects.
It is particularly important in the context of this source of variation tounderstand the way that workers will value benefits. Our use of thisinstrument does not rely on the fact that workers get more or betterhealth care as their premiums rise. Rather, as malpractice costs rise, theprice of purchasing health care through any source—employer insurance,nongroup insurance, or out of pocket—will increase. Workers may bewilling to accept lower wages in exchange for costlier health insurancebecause they would have to pay more on the open market for it, whetheror not the increase in premiums is associated with higher value healthcare.
IV. Data
A. Health Insurance Premiums
We use annual state-level data on health insurance premiums by typeof policy (family or single) and employer size from the Medical Expen-diture Panel Survey for 1996 to 2002. We assign premiums to workersbased on their state of residence and year and on their family structure(with single respondents given the single premium). We obtain very similarresults when we do not match on family structure or when we furthermatch workers based on firm size (with employees of small firms giventhe small firm premium and unemployed respondents given the averagepremium).
In figure 1 we illustrate the steady growth in premiums for familypremiums and single premiums over the time period of our study. All
ical Liability Monitor, but the survey does not rely on administrative data, doesnot cover all states or medical specialties, and varies year to year in the numberof insurers that are surveyed.

Health Insurance Premiums 619
Fig. 1.—Growth in health insurance premiums. The data are from the Medical Expen-diture Panel Survey. The premiums are expressed in year 2001 dollars.
dollar figures are expressed in year 2001 dollars. Family premiums grewfrom an average of $5,000 in 1996 to well over $8,000 in 2002. Premiumsfor single policies also grew substantially—from an average of $2,000 in1996 to over $3,000 in 2002. In figure 2 we illustrate the details of familyand single policies for the 10 states with the largest population in 2000—panel A reports the level of premiums in 1996, and panel B reports thelevel of premiums in 2002. We see that family premiums grew between40% and 60% over this time period in these states. The growth in singlepremiums was smaller but still considerable: in states such as Florida,Georgia, Michigan, and Ohio, premiums for single people grew by over40%. Both panels also show the share of total premiums that was paidfor by employee and employer contributions—even though premiumsincreased substantially, the share paid by employees remained relativelystable.
B. Labor Market Data
The CPS is a monthly survey of about 50,000 households conductedby the Bureau of the Census for the Bureau of Labor Statistics. The surveyhas been conducted for more than 50 years and is the primary source ofinformation on the labor-force characteristics of the U.S. civilian non-institutional population. The March (annual demographic survey) files ofthe CPS contain information on hours worked, wage and salary income,unemployment, and health insurance coverage in the past year.
We use data from the 1996–2002 March CPS. We use information ondemographics (such as age, gender, race, marital status, family size, and

620 Baicker/Chandra
Fig. 2.—Health insurance premiums in 1996 (panel A), and health insurance premiumsin 2002 (panel B). The data are from the Medical Expenditure Panel Survey. The premiumsare expressed in year 2001 dollars. The 10 largest states (by population) are shown.
education), labor market variables (such as wage and salary, employmentstatus, firm size, and hours worked), and health insurance coverage (suchas source of coverage). Because we expect premiums from last year toaffect current labor market outcomes, we measure hours worked, full-time/part-time status, and unemployment during the reference week ofthe survey (typically the second week of March). We include all respon-dents between the ages of 22 and 64, although we further limit the samplein some of our analyses. Our data are summarized in table 1.

Health Insurance Premiums 621
Table 1Summary Statistics
All 1996–99 2000–2002
Mean SD Mean SD Mean SD
HI variables:Premiums 5,259 1,968 4,773 1,675 5,938 2,139HI from employer .62 .49 .61 .49 .62 .49Any HI .84 .37 .83 .37 .84 .36
Labor market outcomes:Hours 37.2 16.7 35.9 17.8 39.1 14.5Wage and salary income (real) 33,902 37,152 32,896 36,818 35,310 37,570Part time (!30 hours per
week) .14 .35 .15 .36 .14 .35Employed .88 .33 .88 .33 .88 .33
Malpractice payments (real percapita $):
Total 3.27 1.94 3.13 1.79 3.47 2.11Internal medicine 1.74 1.31 1.59 1.18 1.96 1.44Obstetrics-gynecology 7.36 4.44 6.91 4.00 8.00 4.93Surgery .25 .21 .26 .23 .23 .18
Malpractice payments (no. per100,000 population):
Total 1.6 .7 1.6 .7 1.6 .7Internal medicine .4 .2 .4 .2 .4 .3Obstetrics-gynecology 3.1 1.4 3.1 1.4 3.1 1.5Surgery .2 .2 .2 .3 .1 .1
Note.—HI p health insurance. Individual-level observations are from the 1996–2002 Current Pop-ulation Survey (CPS). The sample is limited to those ages 22–64. The HI premiums are from the MedicalExpenditure Panel Survey (state-year data on premiums by policy type and employer size). The mal-practice payments are from the National Practitioner Data Bank. Labor market outcomes and employerhealth insurance information are from the CPS (March and February). Sample sizes were 194,739 forthe 1996–99 period and 151,785 for the 2000–2002 period.
C. Medical Malpractice Payments
We obtain data on malpractice payments from the National PractitionerData Bank (NPDB) for the 1996–2002 period.12 We calculate the size andnumber of payments resulting from medical treatments (including diag-nosis, medication, and other medical treatment), surgical treatments (in-cluding surgery and anesthesia), obstetrical treatments, and other treat-ments (including monitoring, equipment, intravenous and blood, and all
12 Noncompliance is subject to civil penalties codified in 42 U.S.C. 11131–52.We examine payments that resulted from either a court judgment against theprovider or a settlement made outside of the courts. We exclude payments thatwere linked to dentists, pharmacists, social workers, or nurses. In a small fractionof payments, there are multiple physician defendants (and thus multiple reports),but only the total payment by all defendants is reported. In these cases we averagethe payment by the number of physicians involved. In the NPDB, 5% of paymentsare made by state funds in addition to other payments made by the primaryinsurer for the same incident. We match such payments based on an algorithmthat uses unique physician identifiers, state of work, state of licensure, area ofmalpractice, type of payment (judgment or settlement), and year of occurrence.

622 Baicker/Chandra
others). Table 1 shows the growth of per capita malpractice payments atthe state level between 1996–99 and 2000–2002. The variability of pay-ments (over time within states) is the source of our identification. Forexample, over the 2001–3 period, per capita payments were highest in thestates of New York, Pennsylvania, New Jersey, Connecticut, West Vir-ginia, and Delaware. In these states the burden of malpractice liabilitywas almost twice the U.S. average of $13.50 per person. See Chandra etal. (2005) for more details on the growth of malpractice payments asmeasured by the NPDB.13
V. Results
We begin with an examination of the effect of increases in health in-surance premiums on employment, wages, and hours worked. The oddcolumns of table 2 show the results of the OLS estimation of equation(3). All regressions include state and year fixed effects and the individual-level controls outlined above, and they are weighted using the March CPSfinal weights. Standard errors are clustered at the state level. Premiums,income, and hours are all measured in logs. The OLS effect of increasesin health insurance premiums on labor market outcomes suggests that a10% increase in premiums leads to a 1.3% decrease in wage and salaryincome and a 0.1% decrease in hours worked. As discussed above, how-ever, the OLS results are likely to be biased by omitted individual char-acteristics (such as ability) and economic conditions. We use medical mal-practice payments (including real per capita dollars and the number ofpayments per capita, by specialty, current and lagged) to instrument forhealth insurance premiums. Table 3 reports several variants of the firststage regression shown in equation (5). For the two-stage least squaresestimates that follow, we use the most flexible form of the instruments(which provides the greatest power in the first stage, with the instrumentsjointly significant at and with a first-stage F-statistic of 4.45),p ! .0001but here we show more constrained forms to aid in interpretation (sincepayments by different specialties are highly correlated). The results suggestthat when per capita malpractice payments double, health insurance pre-
13 One of the major criticisms of the NPDB is the “corporate shield” (U.S.General Accounting Office 2000). This is a loophole that makes payments madeon behalf of a hospital or other corporation exempt from inclusion in the NPDB,as long as any individual practitioner is dropped as part of a settlement agreement.Chandra et al. (2005) provide evidence that this is not a first-order source of biasin the data bank. Even if it were these omissions would only serve to weaken theestimated first stage. A more problematic source of bias occurs if there is state-level variation in the magnitude of the corporate shield (a hypothesis on whichthere is no formal or anecdotal evidence). We include state-fixed effects in ouranalysis to help ameliorate this potential problem. We are grateful to Aaron Ye-lowitz for recommending this discussion.

Table 2Effect of Premiums on Labor Market Outcomes
Sample: All (with PositiveHours Last Year)
Ln (Wage andSalary Income)
Ln (Hours)(If Employed)
Part Time(If Employed) Employed
Have HIthrough
Employer
EmployeeShare of HI
Premium
OLS(1)
IV(2)
OLS(3)
IV(4)
OLS(5)
IV(6)
OLS(7)
IV(8)
OLS(9)
IV(10)
OLS(11)
IV(12)
Ln (HI premium) �.129(.14)
�.088(.133)
�.009(.023)
�.236(.103)
.012(.026)
.190(.072)
�.022(.014)
�.120(.065)
�.173(.130)
�.063(.077)
�.129(.032)
�.031(.088)
N 346,524 346,524 304,744 304,744 304,744 304,744 346,524 346,524 346,524 346,524 346,524 346,524Covariates and fixed effects Yes Yes Yes Yes Yes Yes Yes Yes Yes Yes Yes Yes
Note.—OLS p ordinary least squares; IV p instrumental variables; HI p health insurance. The individual-level observations are from 1996–2002 Current PopulationSurvey (CPS). The sample is limited to those ages 22–64. The HI premiums are from the Medical Expenditure Panel Survey (state-year data on premiums by policy type andemployer size). The malpractice payments are from the National Practitioner Data Bank. The labor market outcomes and employer health insurance information are from theCPS (March). Part-time workers work less than 30 hours per week. Covariates include race, age, age2, age3, marital status, education, gender, and health status. Instrumentsinclude real dollar amount and number of medical malpractice payments per capita for different specialties (surgery, obstetrics-gynecology, internal medicine, and other) forcurrent year and previous year. Premiums assigned based on state, year, and family structure (and employer size for employed). Regressions are weighted by March CPSweights, and standard errors are clustered at state level.

624 Baicker/Chandra
Table 3First Stage Regressions
Effect of Growth in MalpracticePayments on Health Insurance Pre-
miums (Log-Log Specification)
(1) (2) (3)
All payments .011(.009)
.021(.008)
Surgical payments .014(.006)
Obstetrics-gynecology payments �.003(.003)
Internal medicine payments .005(.007)
Other payments �.001(.001)
No. of surgical paymets �.022(.008)
No. of obstetrics-gynecology payments .005(.005)
No. of internal medicine payments .008(.012)
No. of other payments �.004(.003)
F-statistic on instruments 2.820 4.100 4.450F-test significance .185 .054 .007Covariates No Yes YesState and year effects Yes Yes Yes
Note.—The individual-level observations are from the 1996–2002 Current Population Survey. Thesample is limited to those ages 22–64. The health insurance premiums are from the Medical ExpenditurePanel Survey (state-year data on premiums by policy type and employer size). The malpractice paymentsare from the National Practitioner Data Bank. Covariates include race, age, age2, age3, marital status,education, gender, and health status. Standard errors are clustered at state level. The growth of paymentsis measured as the change in real payments per capita or the number of payments per capita.
miums increase by 1%–2%. This is consistent with previous estimatesthat malpractice payments comprise around 1% of total health expen-ditures (Kessler and McClellan 1996). We show the results of a similarregression at the state-year (rather than individual) level graphically infigure 3.
Results from two-stage least squares estimation of equation (6) areshown in the even columns of table 2. Here, a 10% increase in premiumsreduces wages and salary by 0.9%. There is a large effect of premiumson hours worked—coming partly from increases in the probability ofunemployment but also through increases in the probability of part-timework. This is consistent with our expectation that as the cost of providinghealth insurance benefits increases, firms will substitute part-time workerswith limited benefits for full-time workers. In fact, in our data only 22%of part-time workers have employer health insurance, while 64% of full-time workers do. Consistent with the reduction in full-time jobs, thereis also an overall decline in employment rates and a (statistically insig-

Health Insurance Premiums 625
Fig. 3.—The effect of malpractice payments on health insurance premiums. The regres-sion line represents an adjusted coefficient of 0.03 (clustered SE 0.01). The sample includesannual observations of 48 continental U.S. states from 1996 to 2002. The controls includecategorical measures of educational attainment, race, age, marital status, health status, andgender mix (at the state-year level), as well as state and year fixed effects. Standard errorsare clustered at the state level. The covariates are aggregated to state-year level from theannual March CPS.
nificant) decline in the probability of being covered by EHI.14 In contrastto the OLS results, all the IV results are consistent with the predictionsof a model where workers partially value health benefits or where firmsare constrained in their ability to adjust wages. For each IV specificationwe evaluated the potential endogeneity of the imputed health insurancepremium variable by performing a Durbin-Wu-Hausman test. In each ofthese tests, we rejected the null hypothesis that the OLS estimates were
14 Ideally, we would also examine the extent to which employers offer EHI. Toshed more light on this issue we examined the results of the Kaiser/Health Re-search Educational Trust survey. These data show that between 1996 and 2002(the period of our study), the percentage of firms offering EHI increased from59% to 66%. There was no change for larger firms (defined as those who employover 200 workers), 99% of whom offer coverage. These firms account for ap-proximately 60% of total employment. Unfortunately, we are unable to explorethe relationship between an employer’s decision to offer EHI and increases inthe price of EHI in more detail. Questions about whether or not an employee isoffered EHI are only asked in the 1997, 1999, and 2001 February supplements.In these years, we can match almost three-quarters of the March respondents tothe February survey, but this represents less than 30% of our original sample. Inthis smaller sample, however, we do not have the power to detect changes in EHIbeing offered to employees: our results were simply too noisy to allow us toconclude that we were learning anything systematic.

626 Baicker/Chandra
not systematically different from the IV estimates (each test statistic hada p-value of less than 0.0001).
As health insurance costs have risen, popular concern has grown overincreases in required employee contributions to health insurance premiums.In fact, between 1996 and 2002, the employee share of health insurancepremiums remained relatively stable at just under 20%. This fraction doesnot seem to respond to increases in health insurance premiums—using ourIV specification in table 2, column 12, the fraction of premiums paid byemployees (and consequently employers) does not respond to increases inpremiums.
We were concerned that the first-stage F-statistic of 4.45 could be in-dicative of a problem of weak instruments (Staiger and Stock 1997).15
Following Stock, Wright, and Yogo (2002), we reestimated the models intable 2 with limited information maximum likelihood (LIML) methodsas operationalized by Moreira (2003) and Moreira and Poi (2003). Thistreatment constructs tests of coefficients based on the conditional distri-butions of nonpivotal statistics. The LIML point estimates were virtuallyidentical to the IV results reported in table 2 (SEs in parentheses): wages�0.080 (0.143), hours �0.218 (0.072), part time 0.162 (0.058), any healthinsurance 0.067 (0.054), and EHI �0.040 (0.073).
We also examined whether our results were robust to the inclusion ofindustry and occupation controls and state-year unemployment rates, andwe found very similar results with the inclusion of these additional var-iables. Specifically, the IV coefficients (SEs) on the probability of beingpart time with these additional controls entered simultaneously were 0.17(0.07), on hours they were �0.199 (0.106), on employment they were�0.10 (0.065), and on the probability of receiving EHI they were �0.04(0.07). These estimates are very similar to those reported in table 2.16 Wereport these results as a specification check rather than our primary spec-ification because the additional covariates are all potentially endogenousvariables that may change in reaction to increases in health insurancepremiums.
As previous models and empirical research have suggested, we mightexpect certain groups to be more sensitive in changes in the cost of health
15 It should be noted that without clustering the standard errors, the first stageF-statistics exceed 500. We rely on the smaller, more conservative F-statistic withclustered standard errors, but we report this statistic as well because it is not clearwhat the appropriate F-stage is with clustered data. We are grateful to DouglasStaiger for recommending the use of LIML to examine the potential for weakinstruments.
16 Results with the inclusion of region-specific time trends were also quite sim-ilar (SEs in parentheses): wages and salary �0.095 (.177), hours �.18 (.158), parttime 0.196 (0.096), employed .160 (.094), any HI �0.065 (0.105), EHI �0.104(.096), and employee share 0.054 (.125).

Health Insurance Premiums 627
insurance. First, workers with health insurance should see a much biggeroffset in their wages than workers without, who should see none. Thefirst column of table 4 tests this hypothesis by including the interactionof health insurance premiums with an indicator for coverage by EHI. Wesee that, in fact, all of the reductions in income are borne by employeeswith health insurance. The magnitude of the elasticity of �0.20 is con-sistent with dollar-for-dollar offset (since premiums, paid with pretaxdollars, are about 20% of wage and salary income at the mean)—implyingthat covered workers bear the full incidence of increases in health insur-ance premiums. The results for part-time workers in table 4, columns3–4, are consistent with part-time workers seeing an increase in wagesand a decline in coverage when health insurance premiums increase (whichwould be the case if workers were moving from full-time jobs with ben-efits to part-time jobs with higher wages instead of benefits), but theseresults are not statistically significant.
If our predictions are correct, we should also see declines in wage andsalary income (and health insurance coverage from an employer) for work-ers in sectors where the demand for labor is particularly elastic. Becausemanufacturing goods are nationally traded and the labor demand for man-ufacturing workers is a derived demand, we would expect the local de-mand for such workers to be particularly sensitive to the price of healthinsurance. Table 4, columns 5–7, shows that in addition to the largerpredicted wage declines for this group, we also observe a decrease in theprobability of employment and an increase in the probability of beingshifted to part-time work.17
Which workers would be most likely to give up EHI (in exchange forhigher wages) as premiums increase? Married women are likely to have alower value of EHI, as they may have access to insurance though theirhusbands (Berger et al. 2003). As shown in the last panel of table 4, thesewomen are indeed more likely to lose EHI when premiums go up. Theyare also more likely to be employed and more likely to be in part-timejobs (recall that our model predicted that total employment might increaseif there was a shift to part-time jobs). In contrast to the results for marriedwomen, we find that there is a large wage offset for married men (coefficienton interaction term of �0.04, not shown in table) but that there is no effecton the probability of being part time (coefficient on interaction term of0.009, insignificant) or on the probability of being employed for this group(coefficient on interaction term of 0.021, insignificant). That the results formarried men and women are different in a manner that accords with eco-
17 Employment in the manufacturing sector is measured as major industry ofemployment last year, while the dependent variable is measured as employmentlast week. For this reason, we cannot include interactions with hours or EHI,also measured currently as opposed to last year, using this variable.
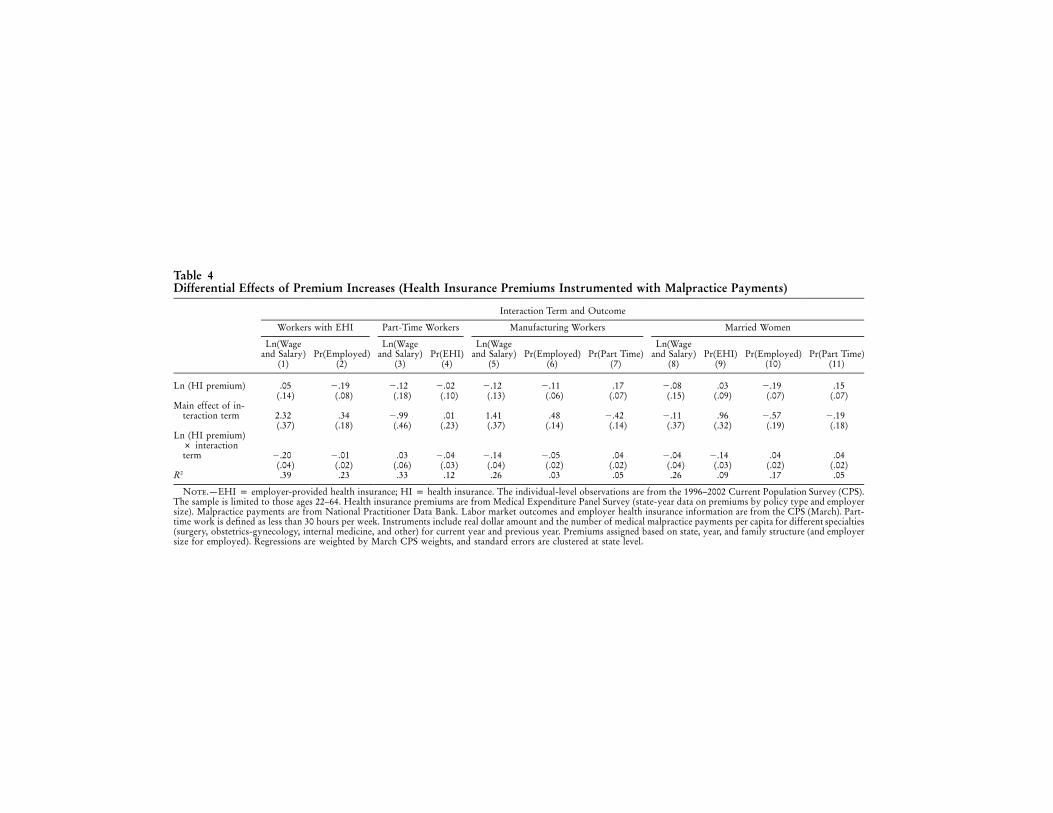
Table 4Differential Effects of Premium Increases (Health Insurance Premiums Instrumented with Malpractice Payments)
Interaction Term and Outcome
Workers with EHI Part-Time Workers Manufacturing Workers Married Women
Ln(Wageand Salary)
(1)Pr(Employed)
(2)
Ln(Wageand Salary)
(3)Pr(EHI)
(4)
Ln(Wageand Salary)
(5)Pr(Employed)
(6)Pr(Part Time)
(7)
Ln(Wageand Salary)
(8)Pr(EHI)
(9)Pr(Employed)
(10)Pr(Part Time)
(11)
Ln (HI premium) .05(.14)
�.19(.08)
�.12(.18)
�.02(.10)
�.12(.13)
�.11(.06)
.17(.07)
�.08(.15)
.03(.09)
�.19(.07)
.15(.07)
Main effect of in-teraction term 2.32
(.37).34
(.18)�.99(.46)
.01(.23)
1.41(.37)
.48(.14)
�.42(.14)
�.11(.37)
.96(.32)
�.57(.19)
�.19(.18)
Ln (HI premium)# interactionterm �.20
(.04)�.01(.02)
.03(.06)
�.04(.03)
�.14(.04)
�.05(.02)
.04(.02)
�.04(.04)
�.14(.03)
.04(.02)
.04(.02)
R2 .39 .23 .33 .12 .26 .03 .05 .26 .09 .17 .05
Note.—EHI p employer-provided health insurance; HI p health insurance. The individual-level observations are from the 1996–2002 Current Population Survey (CPS).The sample is limited to those ages 22–64. Health insurance premiums are from Medical Expenditure Panel Survey (state-year data on premiums by policy type and employersize). Malpractice payments are from National Practitioner Data Bank. Labor market outcomes and employer health insurance information are from the CPS (March). Part-time work is defined as less than 30 hours per week. Instruments include real dollar amount and the number of medical malpractice payments per capita for different specialties(surgery, obstetrics-gynecology, internal medicine, and other) for current year and previous year. Premiums assigned based on state, year, and family structure (and employersize for employed). Regressions are weighted by March CPS weights, and standard errors are clustered at state level.

Health Insurance Premiums 629
nomic theory is reassuring. It provides further evidence that our instrumentis not picking up spurious underlying trends in labor market outcomes.
In table 5 we further explore the robustness of our identification strategy.We study the relationship between predicted health insurance premiumsand variables, which should not be affected by our instruments. (The pre-dicted premium on the right-hand side captures the variation in our in-struments that is used in the IV estimation.) Columns 1–5 of table 5 dem-onstrate that the instruments are unable to predict variation in percentageblack, educational attainment, gender, marital status, or health. Composi-tional changes in the levels of these variables could potentially affect thelabor market outcomes that we study but should not be affected by theincrease in malpractice payments—and they are not. To further test ouridentification strategy, we also include as a dependent variable the proba-bility that an employee is included in an employer pension plan, shown incolumn 6 of table 5. This could be viewed as a falsification test—healthinsurance premiums might not be expected to affect pension benefits—butit is possible that when health plan costs go up, all other forms of com-pensation (wages and other benefits) are reduced to absorb the cost. Thisdoes not seem to be the case: the probability of an employee having apension benefit does not respond to increases in health insurance premiumsin the IV specification, with an insignificant coefficient estimate. Finally, inthe last three columns on the right, we note the lack of relationship betweenpredicted premiums and health outcomes (measured at the state-year level).18
This finding rules out a class of explanations wherein the population ofstates with relatively higher malpractice payments is relatively sicker—andas sickness levels increase, health premiums rise. Population illness levelsare not the driving factor here. Table 5 also notes that predicted premiumsare not associated with higher cesarean-section rates (a procedure that iswidely believed to be affected by the use of “defensive medicine”).19
We can use our estimates to study the economy-wide impact of thegrowth of health insurance premiums. Using the estimates in tables 2 and4, we can calculate the effect of rising health insurance premiums on theprobability of being employed, employed as a full-time worker, averagehours worked, and annual income. These estimates are summarized intable 6. A 20% increase in health insurance premiums (smaller than the
18 Data on aggregate mortality come from the Area Resource File (NationalCenter for Health Workforce Analysis 2003; reported at the county-year level,aggregated to the state-year level by the authors)
19 Baicker and Chandra (2005) demonstrate that increases in medical malpracticeliability are not associated with changes in physician flows or the greater use ofsurgical procedures. This finding rules out a situation where increases in mal-practice payments affect both the price and quantity of health care received byworkers; changes in the malpractice climate appear only to affect the price ofhealth care as measured by health insurance premiums.

Table 5Specification Checks
Sample: AllBlack
(1)
CollegeEducation
(2)Female
(3)Married
(4)
GoodHealth
(5)
EmployerPension
(6)
Mortality Rates Cesarean-SectionRates
(9)Overall
(7)Cancer
(8)
Ln (HI Premium) �.090(.061)
.048(.094)
.002(.062)
�.090(.078)
�.104(.099)
.180(.137)
.001(.002)
.0003(.0004)
�.072(.144)
R2 .076 .068 .011 .002 .072 .038 .990 .091 .984N 346,524 346,524 346,524 346,524 346,524 346,524 240 206 240State and Year FEs Yes Yes Yes Yes Yes Yes Yes Yes YesSample CPS Micro CPS Micro CPS Micro CPS Micro CPS Micro CPS Micro State-year State-year State-year
Note.—The individual-level observations are from the 1996–2002 Current Population Survey (CPS). The sample is limited to those ages 22–64. The health insurancepremiums are from the Medical Expenditure Panel Survey (state-year data on premiums by policy type and employer size). The malpractice payments are from the NationalPractitioner Data Bank. The labor market outcomes and employer health insurance information are from the CPS (March). The instruments include the real dollar amountand the number of medical malpractice payments per capita for different specialties (surgery, obstetrics-gynecology, internal medicine, and other) for the current year and theprevious year. The premiums assigned are based on state, year, family, and structure (and employer size for employed). The regressions are weighted by March CPS weights,and standard errors are clustered at state level. Covariates include race, age, age2, age3, marital status, education, gender, and health status, excluding the dependent variable.

Health Insurance Premiums 631
Table 6Effects of 20% Increase in Premiums
Mean Coefficient Effect
Probability of being employed (percentage point) 73% �.12 �2.4%Probability of working full time, conditional on
working (percentage point) 84% �.189 �3.8%Average hours per week, conditional on working 41 �.237 �1.9Average annual income (insignificant) 33,750 �.088 �594Average annual income, conditional on working
and having employer health insurance 41,442 �.205 �1,699
increase seen in many areas in the past 3 years) would reduce the prob-ability of being employed by 2.4 percentage points—the equivalent ofapproximately 3.5 million workers. A similar number of workers wouldmove from full-time jobs to part time, reducing the average number ofhours worked per week by a little over an hour. Annual (wage and salary)income would be reduced by $1,700 for those who are employed andhave EHI.20 Together, these estimates demonstrate that the labor marketeffects of rising health insurance are far from neutral.
VI. Conclusion
Rising health insurance premiums, unemployment, and uninsurancehave led to increased scrutiny of the labor market consequences of risingbenefits costs. These relationships are, however, difficult to disentanglewithout a source of exogenous variation. We use variation in medicalmalpractice payments to derive the causal effect of rising health insurancepremiums on wages, employment, and health insurance coverage.
We find that the cost of increasing health insurance premiums is borneprimarily by workers in the form of decreased wages for workers withEHI—so that they bear the full cost of the premium increase. Our analysisimplies that workers do at least partially value health insurance benefitsbut that there are impediments to full adjustment through wages, partic-ularly for certain groups. Institutional constraints that prevent firms fromdiscontinuing coverage only for those workers who value it least meanthat as the costs of benefits rise, firms and workers have an incentive tomove from full-time jobs with benefits to part-time jobs without. We seethis increase in part-time work. Workers who value coverage the leastwill have the greatest incentive to move into jobs that do not offer coverage
20 Ideally, we would have also been able to determine whether wage changesin “protected groups,” such as union workers and those near the minimum wage,are smaller, with correspondingly higher negative employment effects. We per-formed a subgroup analysis to explore this hypothesis and noted that our resultswere too noisy to conclude anything systematic.

632 Baicker/Chandra
as premiums rise. We find that groups like married women, who are likelyto have lower value of health insurance coverage through their employer,are more likely to lose coverage as premiums rise.
Our results on wage shifting are consistent with those in Gruber (1994):for workers with EHI, we observe full shifting of the increased price ofhealth insurance onto wages. In addition, our results provide further evi-dence that the effects of increasing costs are borne disproportionately byparticular groups.21 In contrast to Gruber’s study and to the results inGruber and Krueger (1991), we find effects on both hours and employ-ment. These results may appear to be contradictory, but they are not: inGruber’s study workers receive new maternity benefits, and in Gruberand Krueger they receive more generous workers compensation; bothbenefits are probably valued by workers, and the empirical finding of thefull shifting of increased costs to wages with no effect on overall em-ployment is consistent with the insights of Summers (1989). In our article,however, the increase in the price of health insurance premiums is drivenby the medical malpractice crisis, a change that may not enhance the valueof health benefits.22 It is therefore unsurprising that workers do not valuethis increase in costs as highly and that the labor market responds withdecreased wages and labor utilization.
These results have strong implications for policies designed to cover theuninsured. For example, if employer health insurance mandates raise thecost of employing workers, we should expect most workers to bear thecost through reduced wages. If some classes of workers are exempt fromthe mandate (such as part-time workers or those at particularly small firms),employers are likely to substitute uncovered jobs for covered ones, un-dermining the net effect of the mandate on insurance rates. More generally,rising health insurance premiums will place an increasing burden on workersand increase the ranks of both the uninsured and the unemployed.
References
American Medical Association. 2004a. The medical liability crisis: Talkingpoints. American Medical Association, Chicago, http://www.ama-assn.org/ama1/pub/upload/mm/399/mlr_tp.pdf (last accessed April 29, 2004).
21 Gruber (1994) finds that the cost of the maternity benefits are fully borne bymarried women. Gruber (1997) finds the payroll decline that accompanied Chileanprivatization of social security was fully manifested in wages. Sheiner (1995) findsthat demographic groups with higher ex ante insurance costs (such as older workers)experience full wage shifting when the price of health insurance increases.
22 Other work by Kessler and McClellan (1996) did not find an effect of theincreased utilization of medical services stemming from tort reforms on mortalityfrom heart attacks and ischemic heart disease. There is also a related literature inmedicine that notes that increases in marginal medical spending are not associatedwith improvements in patient satisfaction (Fisher et al. 2003a, 2003b; Baicker andChandra 2004).

Health Insurance Premiums 633
———. 2004b. The medical liability crisis: Why repealing the McCarran-Ferguson or passing other insurance laws is not the answer. AmericanMedical Association, http://www.ama-assn.org/ama1/pub/upload/mm/399/mlrcrisis.pdf (last accessed May 2, 2004).
Baicker, Katherine, and Amitabh Chandra. 2004. Medicare spending, thephysician workforce and beneficaries quality of care. Health AffairsW4 (April 7): 184–97.
———. 2005. The effect of malpractice liability on the delivery of healthcare. Forum for health economics and policy, forum: Frontiers in healthpolicy research 8, http://www.bepress.com/fhep/8/4 (last accessedMarch 25, 2006).
Berger, Mark C., Dan A. Black, Amitabh Chandra, and Frank A. Scott.2003. Children, nondiscriminatory provision of fringe benefits, andhousehold labor market decisions. Research in Labor Economics 22:309–49.
Carrington, William, Kristen McCue, and Brooks Pierce. 2002. Non-discrimination rules and the distribution of fringe benefits. Journal ofLabor Economics 20, no. 2:S5–S33.
Chandra, Amitabh, Shantanu S. Nundy, and Seth A. Seabury. 2005. Thegrowth of physician malpractice liability. Health Affairs W5 (May 31):240–49.
Currie, Janet, and Brigitte C. Madrian. 2000. Health, health insurance andthe labor market. In The handbook of labor economics, vol. 3C, ed.Orley Ashenfelter and David Card. Amsterdam: Elsevier Science.
Cutler, David, and Brigitte Madrian. 1998. Labor market responses torising health insurance costs: Evidence on hours worked. RAND Jour-nal of Economics 29, no. 3:509–30.
Fisher, Elliott, David E. Wennberg, Therese Stukel, Dan Gottlieb, F. LeeLucas, and Etoile Pinder. 2003a. The implications of regional variationsin Medicare spending. Pt. 1. The content, quality, and accessibility ofcare. Annals of Internal Medicine 138, no. 4:273–87.
———. 2003b. The implications of regional variations in Medicare spend-ing. Pt. 2. The content, quality, and accessibility of care. Annals ofInternal Medicine 138, no. 4:288–98.
Gruber, Jonathan. 1994. The incidence of mandated maternity benefits.American Economic Review 84:622–41.
———. 1997. The incidence of payroll taxation: Evidence from Chile.Journal of Labor Economics 15, no. 3, pt. 2:S72–S101.
Gruber, Jonathan, and Alan B. Krueger. 1991. The incidence of mandatedemployer-provided insurance: Lessons from workers’ compensation in-surance. Tax Policy and the Economy 5:111–43.
Kaiser Family Foundation, Kaiser Commission on Medicaid and the Un-insured. 2003. Health insurance coverage in America, 2002 data update.Kaiser Family Foundation, Washington, DC.

634 Baicker/Chandra
Kessler, Daniel P., and Mark B. McClellan. 1996. Do doctors practicedefensive medicine? Quarterly Journal of Economics 111, no. 2:353–90.
Mello, Michelle M., David M. Studdert, and Troy A. Brennan. 2003. Thenew medical malpractice crisis. New England Journal of Medicine 348,no. 23:2281–84.
Moreira, Marcelo. 2003. A conditional likelihood ratio test for structuralmodels. Econometrica 71, no. 4:1027–48.
Moreira, Marcelo, and Brian Poi. 2003. Implementing tests with correctsize in the simultaneous equations model. Stata Journal 3, no. 1:57–7.
National Center for Health Workforce Analysis, Department of Healthand Human Services. 2003. Area resource file. National Center forHealth Workforce Analysis, Washington, DC.
Porter, Eduardo. 2004. Rising cost of health benefits cited as factor inslump of jobs. New York Times, August 19.
Sheiner, Louise. 1995. Health costs, aging and wages. Unpublished man-uscript, Federal Reserve Board, Washington, DC.
Smarr, Lawrence E. 2003. Statement of the Physician Insurers Associationof America before a joint hearing of the United States Senate JudiciaryCommittee and the Heath, Education, Labor and Pensions Committee,http://www.thepiaa.org/pdf_files/February_11_Testimony.pdf (last ac-cessed May 2, 2004).
Staiger, Douglas, and James H. Stock. 1997. Instrumental variables re-gression with weak instruments. Econometrica 65:557–86.
Stock, James H., Jonathan Wright, and Motohiro Yogo. 2002. A surveyof weak instruments and weak identification in generalized method ofmoments. Journal of Business and Economic Statistics 20:518–29.
Summers, Lawrence H. 1989. Some simple economics of mandated ben-efits. American Economic Review 79:177–83.
U.S. General Accounting Office. 2000. Major improvements are neededto enhance data bank’s reliability. Publication no. GAO-01-130. Wash-ington, DC: U.S. Government Printing Office.
———. 2003a. Implications of rising premiums on access to health care.Publication no. GAO-03-836. Washington, DC: U.S. GovernmentPrinting Office.
———. 2003b. Medical malpractice insurance: Multiple factors have con-tributed to increased premium rates. Publication no. GAO-03-702.Washington, DC: U.S. Government Printing Office.
Yelowitz, Aaron. 2004. The economic impact of Proposition 72 on Cal-ifornia employers. Employment Policies Institute, Washington, DC,http://www.EPIonline.org (last accessed on October 1, 2004).