the landscape of climate finance 2012 - climate policy initiative
TRANSCRIPT
The Landscape of Climate Finance 2012
A CPI Report
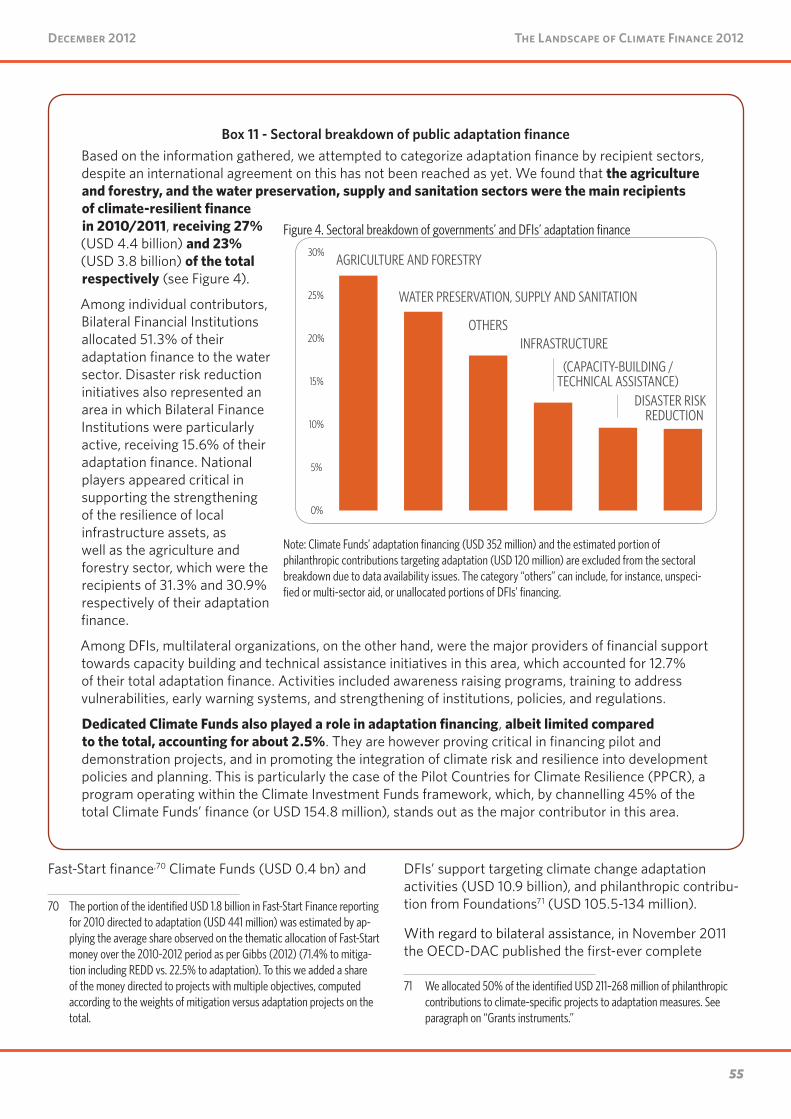
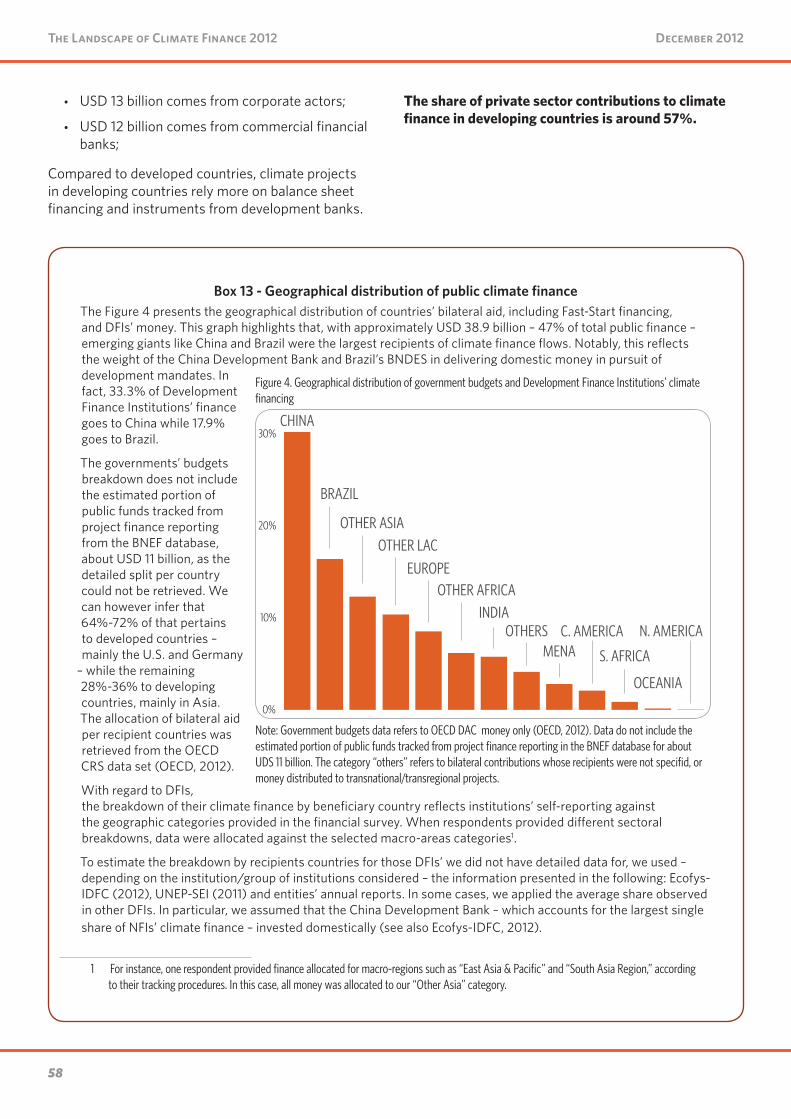
Barbara BuchnerAngela FalconerMorgan Herveacute-MignucciChiara Trabacchi
December 2012
Climate Policy Initiative
About CPIClimate Policy Initiative (CPI) is a policy effectiveness analysis and advisory organization whose mission is to assess diagnose and support the efforts of key governments around the world to achieve low-carbon growth
CPI is headquartered in San Francisco and has offices around the world which are affiliated with distinguished research institutions Offices include CPI Beijing affiliated with the School of Public Policy and Management at Tsinghua University CPI Berlin CPI Hyderabad affiliated with the Indian School of Business CPI Rio affiliated with Pontifical Catholic University of Rio (PUC-Rio) and CPI Venice affiliated with Fondazione Eni Enrico Mattei (FEEM) CPI is an independent not-for-profit organization that receives long-term funding from George Soros
DescriptorsSector Multilateral Climate Finance
Region International
KeywordsClimate Finance Private Finance Public Finance Climate Policy International Climate Negotiations
Related CPI Reports
The Landscape of Climate Finance 2011
Contact Barbara Buchner CPI EuropebarbarabuchnercpiveniceorgMorgan Herveacute-Mignucci CPI Venicemorganherve-mignuccicpiveniceorg
Copyright copy 2012 Climate Policy Initiative wwwclimatepolicyinitiativeorg
All rights reserved CPI welcomes the use of its material for noncommercial purposes such as policy discussions or educational activities under a Creative Commons Attribution-NonCommercial-ShareAlike 30 Unported License
For commercial use please contact admincpisforg
AcknowledgementsThe authors wish to thank the following organizations and professionals for their collabora-tion and inputs including in alphabetical order Adaptation Fund African Development Bank Agence Franccedilaise de Deacuteveloppement Asian Development Bank Asociacioacuten Latino-americana de Instituciones Financieras para el Desarrollo Banco Nacional de Desenvolvimen-to Economico e Social BlueNext Bloomberg New Energy Finance Climate Investment Funds Development Bank of Latin America Development Bank of Southern Africa E3G Ecofys European Bank for Reconstruction and Development European Climate Foundation Global Canopy Programme Global Environmental Facility Independent Evaluation Group of the World Bank Group Inter-American Development Bank International Finance Corporation Japan International Cooperation Agency KfW Bankengruppe Nacional Financiera Organisa-tion for Economic Co-operation and Development Overseas Development Institute Over-seas Private Investment Corporation The Nature Conservancy United Nations Environment Programme UNFCCC Secretariat World Bank and the World Wildlife Fund
Experts in these organizations were critical in helping us better understand the available data the various linkages between flows and our work has benefited substantially from the many discussions The authors would like to acknowledge and thank the following professionals for their cooperation and contributions Claudio Alatorre Frenk Philippe Ambrosi Amal-Lee Amin Geraldine Ang Sabrina Archambault Joumana Asso Andreas Biermann Simon Billett Neil Bird Lucas Bossard Milena Breisinger Alice Caravani Sarah Carta Ken Chomitz Christa Clapp Jan Corfee-Morlot Juacutelia Silva Dolado Tundidor Mafalda Duarte Jane Ebinger Ubaldo Elizondo Jane Ellis Pierre Forestier Jorge Gastelumendi Valerie Gaveau Guido Geissler Pierre Guigon Erik Haites Jochen Harnisch Kyosuke Inada Marcelo Jordan Sumalee Khosla Ale-jandro Kilpatrick Franka Kingel Hafiz Mirza Enrique Nieto Chantal Naidoo Ros Nightingale Christina Rollin Lisa Ryan Matt Leggett Abraham Louw Johanna Luumltterfelds David S Mc-Cauley Ariane Meier Kawamura Mihoko John E Morton Smita Nakhooda Valeria Pacardo Charlie Parker Cecilia Piemonte Camilo Rojas Eric Usher Eduardo Vasquez Kunze Sheelagh Whitley and Ming Yang
Finally the authors would like to acknowledge the contribution of the following CPI experts for the briefs on specific countries studies featured in the report Rodney Boyd Joana Chia-vari Wenjuan Dong Shobit Goel Uday Varadarajan Yuqing Ariel Yu A special thanks also to Ruby Barcklay Gianleo Frisari Tom Heller Ingmar Juergens Valerio Micale David Nelson Elysha Rom-Povolo Gireesh Shrimali Tim Varga Jane Wilkinson and Marni Wood for their help useful comments suggestions and internal review
PrefaceMapping the landscape of climate finance across the world is a work in progress ndash we aim to provide the best possible information but cannot claim to have captured everything Comments and clarifications on the numbers tracking methods and sources are very welcome
4
The Landscape of Climate Finance 2012
5
The Landscape of Climate Finance 2012December 2012 December 2012
Executive SummaryClimate finance has been a key topic in recent interna-tional climate negotiations Understanding how much and what type of finance is available to advance low-carbon growth and combat climate change at a global level is critical to scaling up finance and ensuring that resources are used effectively
The Landscape of Climate Finance 2012 estimates that annual global climate finance flows reached approximately USD 343-385 billion on average USD 364 billion in 20102011 This figure rep-resents an increase from last yearrsquos report mostly because of the expanded scope of this yearrsquos study (See Box ES-1) but still falls short of the investment required to limit global temperature rise to below two degrees Celsius To achieve this goal the International Energy Agency projects that incremental investment in the energy sector will need to reach USD 36 trillion over the period of 2012-2050 ndash or approximately USD 1 trillion each year
The private sector contributed the majority of finance (USD 217-243 billion) mostly from devel-oped country actors The public sector (USD 16-23 billion) acted as a catalyst for private finance as well as providing bilateral aid to other develop-ing countries A large proportion of public finance reflected domestic government support toward struc-tural changes in energy systems as engines of economic growth
Public and private intermediaries especially national development banks and commercial banks played an important role raising and channelling global climate finance (USD 110-120 billion) as well as supporting the creation of an envi-ronment conducive to private sector investment
Emerging economies were key recipients of climate finance but were also important sources Roughly one third of global mitigation investments were located in China Brazil and India A significant share of this was raised domestically and invested in pursuit of national development mandates
The following provides more detailed findings for each stage of the lifecycle of climate finance flows ndash from public sources private sources through to intermediar-ies instruments and uses
Public SourcesPublic sources ranged at least between USD 16-23 billion or 5-6 of the total amount A large proportion of this amount reflects domes-tic government support to renewable energy projects and related infrastructure as engines of economic growth
Notwithstanding fiscal austerity and the tightening credit context the public sector increased funding for low-carbon climate-resilient development Notably bilateral Official Development Assistance grew from USD 95 billion in 2009 to an estimated USD 23 billion in 2010 reflecting the impact of fast-start finance pledges which we estimate accounted for around 36 of Official Development Assistance in 2010 A large portion of this Official Development Assistance was subsequently intermediated by Bilateral Finance Institutions
The Landscape 2012 captures a broader range of public domestic flows in developed and developing coun-tries We found that almost USD 11 billion was spent to support domestic renewable energy projects This spending was largely related to the tail end of the US lsquogreenrsquo economic stimulus packages
Furthermore our investigation of the ownership struc-tures of seemingly private investments indicates that a large portion of these investments could be classified as governmentsrsquo direct and indirect shareholdings and lending to private investment structures While we have not included these types of government invest-ments in this yearrsquos finance flows diagram our prelimi-nary investigation identified USD 51 billion of public money sitting behind private investments mostly in developing countries and in particular China
4
The Landscape of Climate Finance 2012
5
The Landscape of Climate Finance 2012December 2012 December 2012
Box ES-1 Building an understanding of climate financeCPIrsquos Landscape of Climate Finance 2011 represented the first attempt to map the lifecycle of climate finance flows across the globe This yearrsquos study the Landscape 2012 builds and improves upon our previous work using data from the latest year available mostly 2011
Compared with the Landscape 2011 the Landscape 2012 aims to provide to the extent possible an expanded geographical scope covering more flows between and within countries expanded coverage of players including broader coverage of private and public actors a more detailed representation of private sector flows with a better picture of sources and uses an improved representation of uses by economic sector including flows toward adaptation improving land use and preventing deforestation and a better understanding of the final users of climate finance
While the Landscape 2012 provides real insights about global climate finance this exercise is still a work in progress External factors continue to hinder our collective understanding of the scope true magnitude nature and effectiveness of global climate finance flows
Future steps need to resolve the following key issues to build an understanding of climate finance
bull Further expansion of scope and coverage Climate finance configurations differ by country and circumstance and a variety of actors with distinctive responsibilities exist There needs to be a better understanding of the different actors including the various players in the private sector and Development Finance Institutions at the international national and local levels To inform the debate on climate finance effectiveness better sectoral and geographic information on the uses of money is also required
bull A net perspective The Landscape 2012 takes both incremental costs and investment capital into account and focuses on gross flows due to the difficulty of calculating incremental cost and net values of all finance flows To create a more precise picture we need more information about net flows and incremental costs compared to business-as-usual or lsquobrownrsquo investments
bull A sound understanding of how effectively financial flows are being used and whether they address the challenges posed by climate change and global needs In addition to CPIrsquos effort to build up an evidence-based bottom-up database of success and failure stories related to climate finance (the San Giorgio Group case studies) there is a need to explore whether finance flows represented in the Landscape have been effective
bull A benchmark on business-as-usual or lsquobrownrsquo finance flows To put climate finance estimates into perspective comparable estimates of traditional polluting investments are a useful benchmark to check whether there is real progress towards a low-carbon climate-resilient future
A comprehensive picture of climate finance flows is essential to ensure that governments and policymakers have the knowledge and tools to spend their money most effectively CPI remains committed to improving the understanding and transparency of todayrsquos climate finance landscape to help countries learn how to spend money wisely
The San Giorgio Group is a working group of key financial intermediaries and institutions actively engaged in green low-emissions finance Led by CPI the World Bank Group OECD and CLP the mission of the Group is to provide valuable insights on how to scale up climate finance and spend available resources more wisely To this end CPI is examining a series of case studies to determine how public money can catalyze and incentiv-ize private investment in low-carbon technologies and to provide lessons for scaling up green finance
6
The Landscape of Climate Finance 2012
7
The Landscape of Climate Finance 2012December 2012 December 2012
Private SourcesPrivate finance continued to represent the lionrsquos share of total climate finance flows with USD 217-243 billion or 63 of the total Close to two-thirds of private finance came from developed countries
In developed countries private actors contributed USD 143 billion with USD 68-70 billion in asset finance Fifty-five percent of projects were financed on a balance sheet basis while 45 were funded through project-level finance Commercial banks were the leading providers of project-level debt (77) while domestic public budgets contributed around 17 and corporate players contributed around 6 In devel-oped countries domestic private actors contributed the most to overall asset finance investment flows (84) Investment by private actors from other OECD members (almost exclusively developed countries) rep-resented around 12 of investment and investment by private actors from non-OECD countries made up the remaining 4
In developing countries private actors contributed USD 85 billion with USD 64-87 billion in asset finance Four out of five projects were financed on a balance sheet basis This headline obscures important country-specific trends such as the role of National Development Banks in encouraging private investments at the local level In particular the Brazilian National Development Bank (BNDES) played a central role in financing wind power generation in Brazil We estimate that domestic private actors contributed up to 83 of private investments in developing countries Private investors from OECD countries contributed 15 while non-OECD actors made up the remaining 2
The inclusion of small-scale renewable energy finance (almost exclusively in developed countries) in the Landscape 2012 highlights the significant contribution of households and corporate actors (USD 83 billion)
IntermediariesPublic and private financial institutions played an important role in the climate finance land-scape raising and channelling USD 110-120 billion Public intermediaries (such as Multilateral Bilateral and National Development Banks) distributed USD 77 billion or about 67 of these resources Public intermediaries can also enable private investment and help make projects viable
Development Finance Institutions (multilateral bilat-eral and national) continued to play a pivotal role dis-tributing climate finance of around USD 77 billion This represented about 21 of global climate finance flows In addition domestic and international development agencies played a critical role in channeling bilateral aid
Increased international focus on the role of National and Sub-regional Development Banks made it pos-sible to gather more detailed information about the climate finance flows and the role of these intermediar-ies in managing and disbursing funds Together with Bilateral Finance Institutions these banks distributed the majority of intermediated climate finance (USD 54 billion) and played a growing role enabling the transi-tion to low-carbon and climate resilient development in the countries where they operate In fact 89 of total climate finance from National and Sub-regional Development Banks was invested in the country in which these institutions are located
National Development Banks in emerging economies such as the Brazilian and the Chinese development banks channeled the largest share Local budget contributions to climate compatible activities in these countries was particularly evident in Brazil where the Brazilian Development Bankrsquos concessional support to renewable power generation projects reflected the governmentrsquos backing for the Bankrsquos operations in the pursuit of its policy targets
It is important to acknowledge the complex interplay between actors at different stages of the lifecycle of climate flows Multilateral and bilateral entities tend to rely on national actorsrsquo closer proximity and knowledge of the local market with the objective of channeling money more effectively National actors on the other hand benefit from the expertise of international inter-mediaries to develop their capacity to assess analyze and structure green investment projects or appraise the
6
The Landscape of Climate Finance 2012
7
The Landscape of Climate Finance 2012December 2012 December 2012
risk profiles of developers In turn this allows national institutions to pass knowledge to the local banking system to unlock its financing potential and exploit its ability to reach a wide group of recipients
Dedicated Climate Funds typically managed by multilateral bilateral and national intermediaries contributed at least USD 15 billion to overall flows Their importance is likely to grow given their capacity to catalyze and coordinate resources for co-financing including at national levels
Private commercial banks and infrastructure funds intermediated around USD 38 billion including project-level debt and direct investments Private intermediar-ies played a particularly critical role by providing the scale of finance and financial toolboxes able to address the specific needs of lsquogreenrsquo and innovative investment interventions (eg concentrated solar power etc) On the other hand project developers provided equity capital and know-how
InstrumentsOur analysis of instruments indicates that most climate finance USD 293-347 billion out of USD 364 billion can be classified as investments in which public or private financial institutions had an ownership interest or claim ndash that is money which has to be paid back ndash rather than as contri-butions to incremental costs
Public intermediaries enabled otherwise unviable projects through the use of instruments such as concessional loans and grants
Around USD 293 billion was in the form of market rate loans and equity of which USD 262 billion had been made by the private sector Green credit lines as well as support for institutional development were also intended to attract local financial institutions to on-lend to projects that would not otherwise be implemented and to favor private sector investment
Public intermediaries enabled investments by filling capacity and viability gaps that prevented private investors from engaging in capital-intensive riskier and in the short-term less profitable ventures Public intermediaries delivered more than 60 of their financ-ing through concessional loans and about 7 in grant form Lowering the cost of debt in this way is essential
for low-carbon technologies to compete with traditional fuel-based alternatives
Beyond grants loans equity and debt finance a variety of risk management instruments help to overcome risk barriers and encourage low-carbon technologies to scale up Public-private facilities and guarantees to assume regulatory credit or perceived technology risks are just some of the instruments that can remove the risks private actors are not willing or capable of bearing
Uses
Mitigation activities attracted USD 350 billion mostly related to renewable energy and energy efficiency Emerging economies were key recipi-ents of climate finance Close to 33 of mitiga-tion-related finance was invested in China Brazil and India
The majority of funding captured by the Landscape 2012 was spent on mitigation activities Compared to the Landscape 2011 there was progress in understanding adaptation finance due to increased tracking efforts However weaknesses in defining and tracking adap-tation finance partial reporting by some multilateral players and the inability of existing efforts to capture private flows dedicated to such activities hampered our understanding of adaptation finance flows
The bulk of financing captured went to renewable energy generation projects and energy efficiency accounting for 85 and 4 of the total respectively This reflects governmentsrsquo low-carbon growth ambi-tions the commercial viability of a broad range of proven technologies the profit-driven character of private investments and the data sources we had access to
This report confirms that public financial institutions are playing an essential role in financing clean energy allo-cating more than 60 of their intermediated financial flows to renewable energy and energy efficiency They are also essential for financing adaptation measures contributing up to USD 11 billion and even more impor-tantly managing and implementing some of the relevant adaptation funds
The allocation of climate finance between developed and developing countries was relatively balanced with USD 193 billion or 53 going to projects in developed
8
The Landscape of Climate Finance 2012
9
The Landscape of Climate Finance 2012December 2012 December 2012
countries and USD 172 billion or 47 to projects in developing countries
Emerging giants such as China Brazil and India were the largest recipients of global mitigation-directed climate finance flows with USD 171 billion close to 33 of the total This implies that investments have been made where they are needed most and where mitiga-tion potential is the greatest Notably a significant share of this was raised domestically and invested in pursuit of development mandates
8
The Landscape of Climate Finance 2012
9
The Landscape of Climate Finance 2012December 2012 December 2012
32
Venture Capital Priva
te E
GENERAL TAX REVENUES
CARBON-RELATED TAXES
CARBON MARKET
REVENUESDEVELOPM
ENT FINANCE INSTITUTIONS
VENTURE CAPITAL PRIVATE EQUITY amp INFRASTRUCTURE FUNDS
$214
$22
$57
$53
$13
$5
$14
$350
DIFFERENT DISBURSEM
ENT CHANNELS
$2$7
$2
$47
$23
$32
$17
$104
$70
$32
POLICY INCENTIVES
RISK MANAGEM
ENT
CARBON OFFSET FINANCE
GRANTS
LOW-COST
PROJECT DEBT
PROJECT-LEVEL M
ARKET RATE DEBT
PROJECT-LEVEL EQUITY
BALANCE SHEET FINANCING
DEBT PORTION
INSTITUTIONAL INVESTORS
PROJECT DEVELOPERS
CORPORATE ACTORS
HOUSEHOLDS
GOVERNMENT
BUDGETS
$19
MITIGATION
ADAPTATION
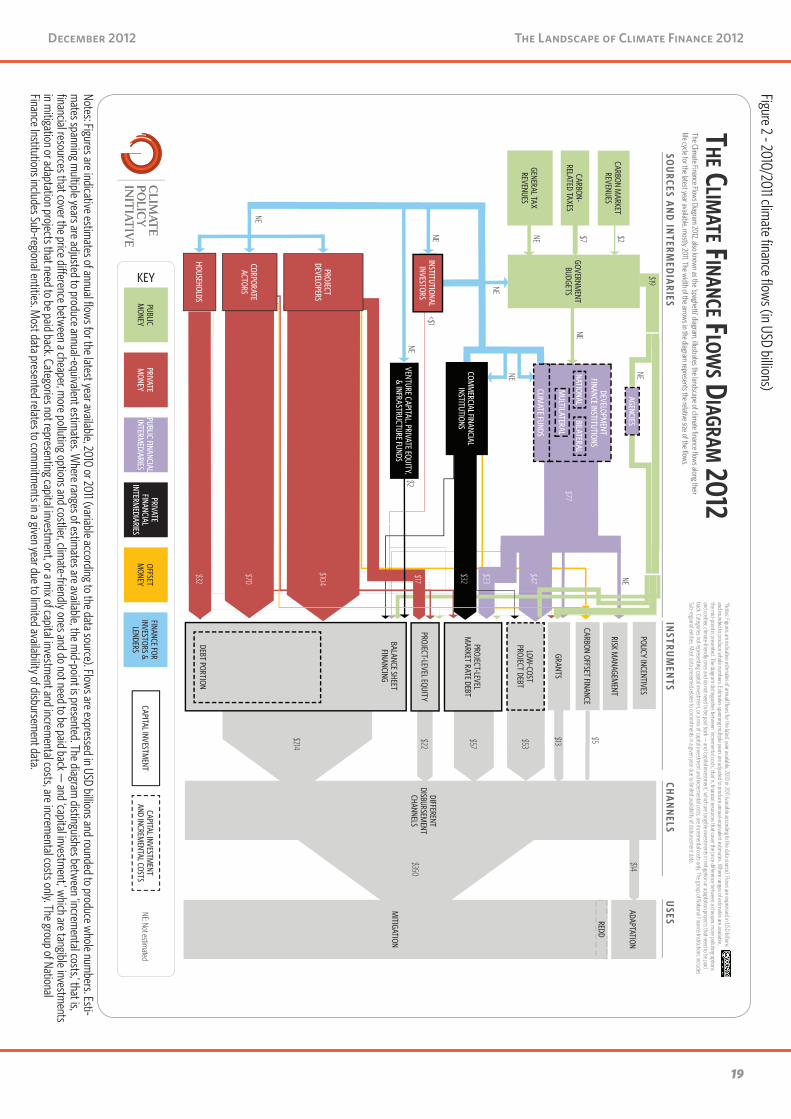
Notes Figures are indicative estimates of annual fl ow
s for the latest year available 2010 or 2011 (variable according to the data source) Flows are expressed in USD billions
and rounded to produce whole num
bers Estimates spanning m
ultiple years are adjusted to produce annual-equivalent estimates W
here ranges of estimates are available
the mid-point is presented The diagram
distinguishes between lsquoincrem
ental costsrsquo that is fi nancial resources that cover the price di erence between a cheaper m
ore polluting options and costlier clim
ate-friendly ones and do not need to be paid back mdash and lsquocapital investm
entrsquo which are tangible investm
ents in mitigation or adaptation projects that need to be paid
back Categories not representing capital investment or a m
ix of capital investment and increm
ental costs are incremental costs only The group of National Finance Institutions includes
Sub-regional entities Most data presented relates to com
mitm
ents in a given year due to limited availability of disbursem
ent data
COMM
ERCIAL FINANCIAL INSTITUTIONS
AGENCIES
THE C
LIMATE FINANCE FLOW
S DIAGRAM 2012
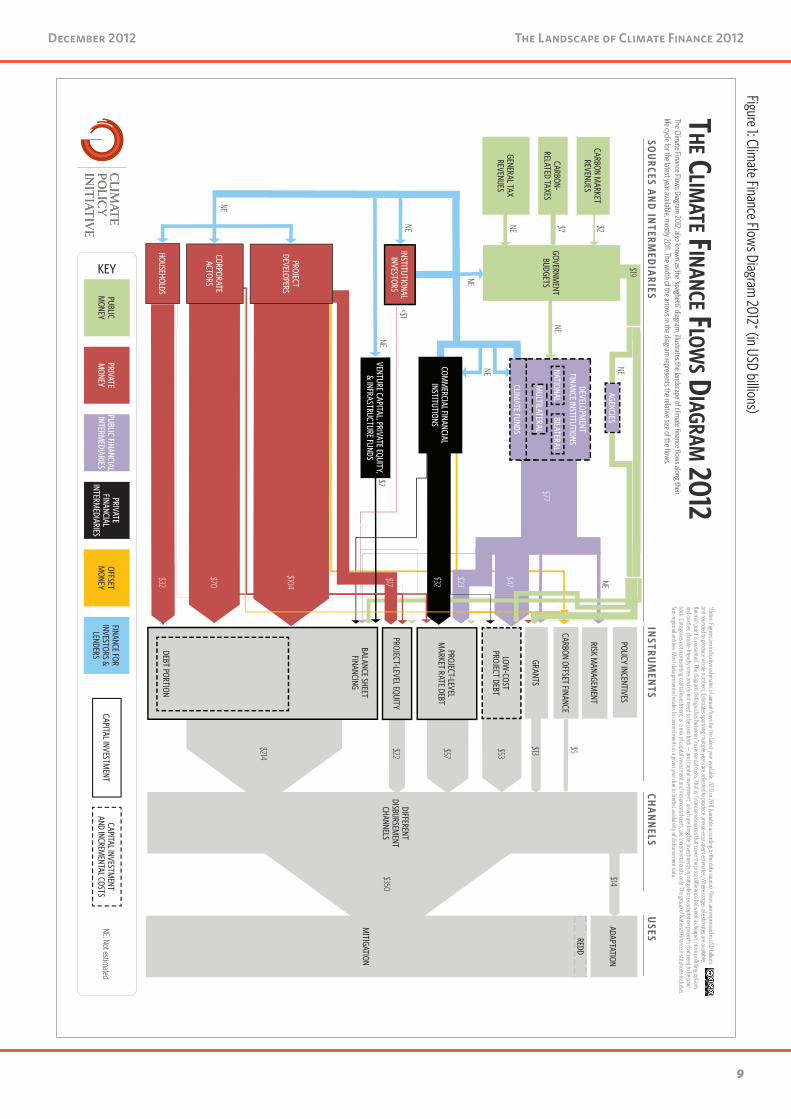
The Climate Finance Flow
s Diagram 2012 also know
n as the lsquospaghettirsquo diagram illustrates the landscape of clim
ate fi nance fl ows along their
life cycle for the latest year available mostly 2011 The w
idth of the arrows in the diagram represents the relative size of the fl ows
NE
lt$1
MULTILATERAL
NATIONALBILATERAL
NE
NE
NE
NE
NE
NE
$77
CLIMATE FUNDS
NE Not estimated
PUBLIC M
ONEYPRIVATE M
ONEYPUBLIC FINANCIAL INTERM
EDIARIES
PRIVATE FINANCIAL
INTERMEDIARIES
OFFSET M
ONEYCAPITAL INVESTM
ENTCAPITAL INVESTM
ENT AND INCREM
ENTAL COSTS
KEY
FINANCE FOR INVESTORS amp
LENDERS
REDD
SOU
RCES AN
D IN
TERMED
IARIES
INSTRU
MEN
TSCH
AN
NELS
USES
NE
NE
Figure 1 Climate Finance Flows Diagram
2012 (in USD billions)
10
The Landscape of Climate Finance 2012
11
The Landscape of Climate Finance 2012December 2012 December 2012
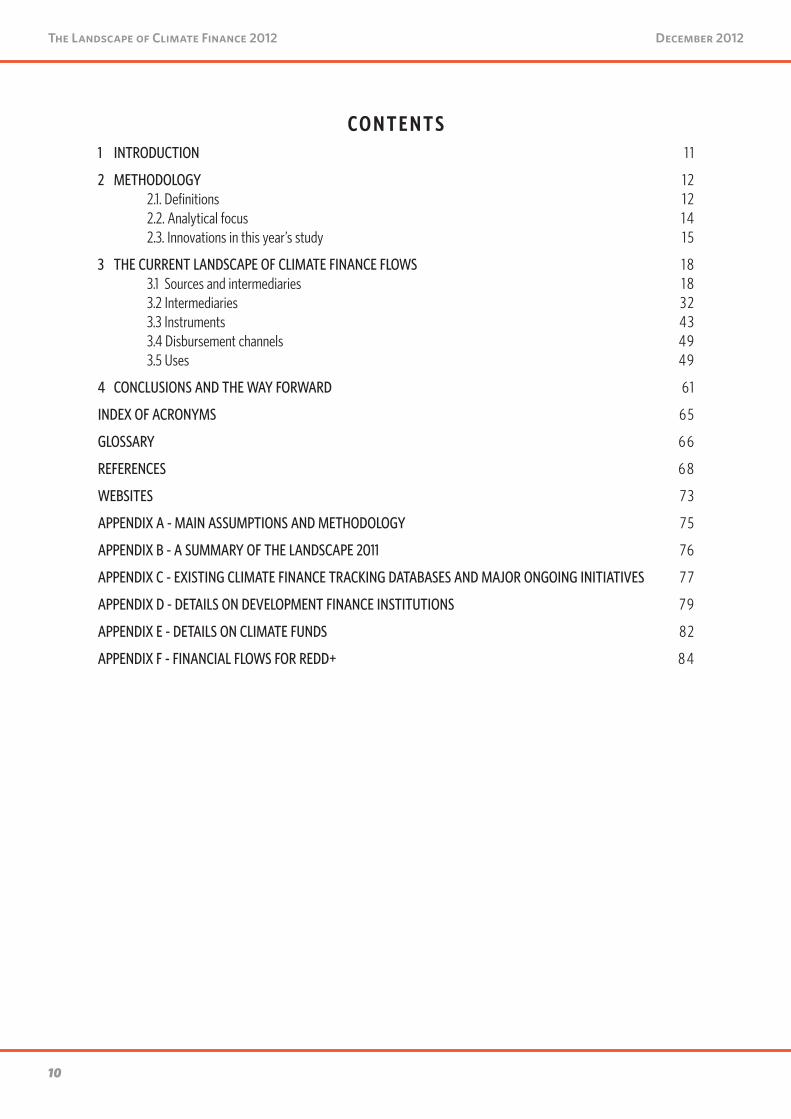
CO N T E N TS1 INTRODUCTION 1 1
2 METHODOLOGY 1221 Definitions 1222 Analytical focus 1 423 Innovations in this yearrsquos study 15
3 THE CURRENT LANDSCAPE OF CLIMATE FINANCE FLOWS 1 831 Sources and intermediaries 1 832 Intermediaries 3233 Instruments 4334 Disbursement channels 4935 Uses 49
4 CONCLUSIONS AND THE WAY FORWARD 61
INDEX OF ACRONYMS 6 5
GLOSSARY 6 6
REFERENCES 6 8
WEBSITES 7 3
APPENDIX A - MAIN ASSUMPTIONS AND METHODOLOGY 75
APPENDIX B - A SUMMARY OF THE LANDSCAPE 2011 76
APPENDIX C - EXISTING CLIMATE FINANCE TRACKING DATABASES AND MAJOR ONGOING INITIATIVES 7 7
APPENDIX D - DETAILS ON DEVELOPMENT FINANCE INSTITUTIONS 7 9
APPENDIX E - DETAILS ON CLIMATE FUNDS 8 2
APPENDIX F - FINANCIAL FLOWS FOR REDD+ 8 4
10
The Landscape of Climate Finance 2012
11
The Landscape of Climate Finance 2012December 2012 December 2012
1 IntroductionClimate change is a global challenge that requires a global response Failure to comprehend the global context of the financing challenge will undermine our ability to accurately assess whether current investments are on track and made where they can deliver the great-est impacts to limit global temperature rise to below two degrees Celsius To achieve this temperature goal the International Energy Agency projects that incre-mental investment in the energy sector alone will need to reach USD 36 trillion over the period of 2012-2050 ndash or approximately USD 1 trillion each year (IEA 2012)
The aim of this study is to contribute understanding on how much and what type of financial support is avail-able globally to advance action on low-carbon climate resilient development Ultimately building this under-standing is essential for ensuring that governments and investors everywhere have the knowledge and tools to spend their money in ways that optimize prospects for achieving the transition
The first Landscape of Climate Finance published in 2011 (Landscape 2011) was the most comprehensive over-view of the global climate finance landscape to-date This yearrsquos study (Landscape 2012) aims to improve on last yearrsquos estimates and add deeper insight into the nature of global climate finance It provides a more detailed breakdown of flows and sheds light on the latest trends
The Landscape 2012 aims to provide to the extent possible
bull An expanded geographical scope covering flows between developing countries (lsquoSouth-Southrsquo) from developed to developing countries and domestic climate finance flows
bull An expanded coverage of national sub-regional regional and international public actors
bull A more detailed representation of private sector climate finance flows with a better picture of sources and uses
bull An improved representation of climate finance uses by sector (sectoral uses) including flows to adaptation and to reducing emissions from deforestation and forest degradation ldquoplusrdquo the sustainable management and conservation of forests and the enhancement of carbon stocks in developing countries (known as REDD+ schemes) and
bull A better understanding of the recipients and final uses of climate finance both in terms of sectoral uses and of geographical destination
This report has three main sections Section 2 outlines our methodology including key definitions and differ-ences compared to the Landscape 2011 Section 3 the main body describes the current landscape of climate finance flows along their lifecycle from sources through to intermediaries instruments channels and end uses Section 4 summarizes our findings and provides brief recommendations to improve existing climate finance tracking efforts
12
The Landscape of Climate Finance 2012
13
The Landscape of Climate Finance 2012December 2012 December 2012
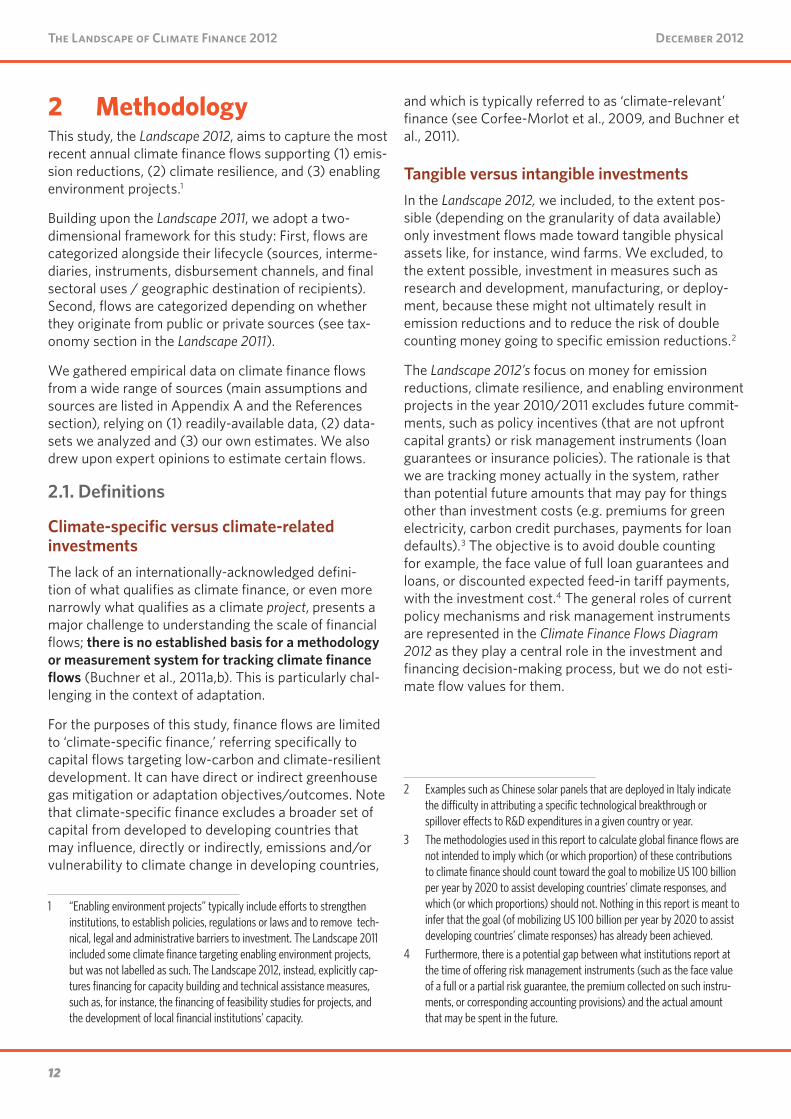
2 MethodologyThis study the Landscape 2012 aims to capture the most recent annual climate finance flows supporting (1) emis-sion reductions (2) climate resilience and (3) enabling environment projects1
Building upon the Landscape 2011 we adopt a two-dimensional framework for this study First flows are categorized alongside their lifecycle (sources interme-diaries instruments disbursement channels and final sectoral uses geographic destination of recipients) Second flows are categorized depending on whether they originate from public or private sources (see tax-onomy section in the Landscape 2011)
We gathered empirical data on climate finance flows from a wide range of sources (main assumptions and sources are listed in Appendix A and the References section) relying on (1) readily-available data (2) data-sets we analyzed and (3) our own estimates We also drew upon expert opinions to estimate certain flows
21 Definitions
Climate-specific versus climate-related investmentsThe lack of an internationally-acknowledged defini-tion of what qualifies as climate finance or even more narrowly what qualifies as a climate project presents a major challenge to understanding the scale of financial flows there is no established basis for a methodology or measurement system for tracking climate finance flows (Buchner et al 2011ab) This is particularly chal-lenging in the context of adaptation
For the purposes of this study finance flows are limited to lsquoclimate-specific financersquo referring specifically to capital flows targeting low-carbon and climate-resilient development It can have direct or indirect greenhouse gas mitigation or adaptation objectivesoutcomes Note that climate-specific finance excludes a broader set of capital from developed to developing countries that may influence directly or indirectly emissions andor vulnerability to climate change in developing countries
1 ldquoEnabling environment projectsrdquo typically include efforts to strengthen institutions to establish policies regulations or laws and to remove tech-nical legal and administrative barriers to investment The Landscape 2011 included some climate finance targeting enabling environment projects but was not labelled as such The Landscape 2012 instead explicitly cap-tures financing for capacity building and technical assistance measures such as for instance the financing of feasibility studies for projects and the development of local financial institutionsrsquo capacity
and which is typically referred to as lsquoclimate-relevantrsquo finance (see Corfee-Morlot et al 2009 and Buchner et al 2011)
Tangible versus intangible investments In the Landscape 2012 we included to the extent pos-sible (depending on the granularity of data available) only investment flows made toward tangible physical assets like for instance wind farms We excluded to the extent possible investment in measures such as research and development manufacturing or deploy-ment because these might not ultimately result in emission reductions and to reduce the risk of double counting money going to specific emission reductions2
The Landscape 2012rsquos focus on money for emission reductions climate resilience and enabling environment projects in the year 20102011 excludes future commit-ments such as policy incentives (that are not upfront capital grants) or risk management instruments (loan guarantees or insurance policies) The rationale is that we are tracking money actually in the system rather than potential future amounts that may pay for things other than investment costs (eg premiums for green electricity carbon credit purchases payments for loan defaults)3 The objective is to avoid double counting for example the face value of full loan guarantees and loans or discounted expected feed-in tariff payments with the investment cost4 The general roles of current policy mechanisms and risk management instruments are represented in the Climate Finance Flows Diagram 2012 as they play a central role in the investment and financing decision-making process but we do not esti-mate flow values for them
2 Examples such as Chinese solar panels that are deployed in Italy indicate the difficulty in attributing a specific technological breakthrough or spillover effects to RampD expenditures in a given country or year
3 The methodologies used in this report to calculate global finance flows are not intended to imply which (or which proportion) of these contributions to climate finance should count toward the goal to mobilize US 100 billion per year by 2020 to assist developing countriesrsquo climate responses and which (or which proportions) should not Nothing in this report is meant to infer that the goal (of mobilizing US 100 billion per year by 2020 to assist developing countriesrsquo climate responses) has already been achieved
4 Furthermore there is a potential gap between what institutions report at the time of offering risk management instruments (such as the face value of a full or a partial risk guarantee the premium collected on such instru-ments or corresponding accounting provisions) and the actual amount that may be spent in the future
12
The Landscape of Climate Finance 2012
13
The Landscape of Climate Finance 2012December 2012 December 2012
Incremental costs versus investment capitalIncremental cost and investment capital are both important lenses for climate finance flows Incremental cost refers to financial resources provided to compensate for the difference between a less costly more polluting option and a costlier more environmen-tally-friendly andor climate-resilient one Investment capital refers to tangible investment in mitigation or adaptation projects Whereas investment capital is paid back to the investor incremental costs often are not and are thus often funded with public climate funds either through policy support or concessional finance5 Whether incremental costs are covered by public support often make the difference in whether the private sector invests in a project Almost all costs asso-ciated with REDD+ measures are incremental costs
Our work captures mostly investment capital rather than incremental support (see previous sub-section) In order to get to the incremental cost value of emission reductions climate-resilience and enabling environ-ment projects we need assumptions for baselines against which we measure the incremental cost Such baselines are project-specific and would require us to make debatable assumptions on what fair baselines would be More efforts are needed to address this issue in-depth
Gross value versus net valueClimate finance can be measured in terms of lsquogrossrsquo or lsquonetrsquo metrics (AGF 2010)6 The Landscape 2012 focuses on gross flows which reflect the full volume of financial flows delivered through all instruments rather than net flows which provide an indication of the final net contribution of investors and countries Gross flows include money that has to be paid back by recipients ie concessional and non-concessional loans and equity Nonetheless they shed light on the level of mobilized international investments and the net contribution of countries
More efforts are needed to break down contributions by gross or net value As a first step into this direction
5 In the case of energy efficiency the additional upfront costs do need to be paid back but are expected to be compensated with energy savings over time Also they can be paid for by private investors since they do get paid back
6 Under the approach flows would represent the financial flows transferred to countries in any given year (these include grants concessional and non-concessional loans mobilised through the bilateral and multilateral institutions private capital flows and flows from GHG offset projects) Under the approach amounts repaid by the recipient countries would be deducted (eg repayments of loan principal repatriation of capital)
section 35 on climate finance sectoral uses specifies this information whenever available
Mixed reporting yearsOur estimates of climate finance are based on the most recent data available The Landscape 2012 uses a mix of 2010 and 2011 data7
We used different sources of information to map exist-ing flows of climate finance We had a choice of using 2010 data only or reporting 2011 data for a significant part of the Landscape (most importantly Bloomberg New Energy Finance data on private flows) We selected the latter option in order to (1) highlight the most current trends in financing despite reporting delays in some areas and (2) provide consistency from year to year so that the Landscape 2012 picks up where the Landscape 2011 left off Where flows span several years we annualized them to make them compatible with other data sources
Commitment versus disbursement dataWe report committed finance rather than disbursed finance New commitment signifies the concrete commitment of money by the means of a closure of a financing contract board decisions on investment loan award announcements or similar actions Commitment finance does not imply that money will immediately flow as a lump sum to project developers8 There might be a time lag between commitments and disbursement But while disbursement information provides a more accurate picture of actual climate finance flows than commitment information disbursement data is not as universally available9 In addition 20102011 disburse-ment data can reflect commitments spanning several years for projects with long construction periods Disbursement data would therefore require further refinement For these reasons we mostly use commit-ment data in the Landscape 201210
7 Data derived from OECDrsquos Creditor Reporting System Aid Activities data-base (OECD CRS) namely public budget and the EU Institutionsrsquo climate finance data refer to 2010 while the others are all 2011 data or presenting the fiscal year 2011 (eg July 2010-June 2011 depending on the accounting methodologies) Philanthropy data instead refer to 20082009
8 A complicating factor is that there is a range of interpretations of what commitment actually constitutes
9 In ldquoThe German Landscape of Climate Financerdquo (CPI 2012) the granularity of data at the national level allowed the authors to rely on disbursement data to a greater extent
10 Where available we used disbursement figures In the case of Climate Funds we include annual commitments approved for specific projects rather than total pledges to the Funds which are disbursed over a number
14
The Landscape of Climate Finance 2012
15
The Landscape of Climate Finance 2012December 2012 December 2012
Reporting currencyAll the flows in this report have been converted to USD billion when reported in other currencies Appendix A provides more details on the exchange rates used
22 Analytical focus
Project-level primary financingThe gold standard in our analysis is project-level financing data Project-level financing data is as close as we can get to emission reductions enhanced climate resilience and a stronger enabling environment In the instrument section we therefore define ldquoinstru-mentsrdquo as the instruments covering project costs in the reporting year or primary financing instruments We exclude instruments that cover financing costs that is secondary market instruments11 The exception to this rule relates to Development Finance Institutions whose flows can include instruments that cover committed money to a specific sector or actor
Secondary market transactions do not represent new money targeting climate finance but rather money changing hands Focusing on primary tangible invest-ments allows us to more accurately estimate financing that supports low-carbon climate-resilient activities
Finance flowsThis year we have solely captured flows among actors rather than (1) any ownership or claims one actor may have on another and (2) readily-available resources (net income debt secured and shareholdersrsquo equity from prior years)12
The flow-only representation has strong implications on what is being covered and represented in the Climate
of years Likewise for DFIs we include annual commitments ie funds ap-proved for projects in a given budget year (UNEP 2011 presents what dif-ferent BFIs mean as ldquocommittedrdquo funds) Only one organization surveyed provided disbursement data rather than commitments
11 For example consider a project in which a utility invests money from its own balance sheet to finance a new onshore wind farm With our focus on project-level financing we would categorize this investment as balance sheet financing We do not examine where the corporate money is coming from (borrowing programmes on-going activities capital increase or sale of non-strategic assets)
12 In this sense we are also capturing payments (or estimates of payments) for carbon finance
Finance Flows Diagram 2012 (also known as the lsquospa-ghettirsquo diagram) compared to the Climate Finance Flows Diagram 2011 In particular inflows need not match out-flows For example a development bank may have com-mitted USD 3 billion in 2011 even though it only received USD 500 million of aid contribution the same year from public budgets mdash this doesnrsquot mean this bank is par-ticularly good at leveraging money or in the opposite case that it is wasting money because the flows do not capture other ownership and assets By capturing flows in this way we are also able to highlight where money may be sitting with a given actor within the landscape of climate finance
The linearity of the lifecycle of flows is however a simplification Flows are categorized alongside the lifecycle of flows (sources intermediaries instruments disbursement channels and uses recipients) as though the lifecycle was a linear path In reality pathways for finance are more complex and involve (1) feedback loops ie money can go back and forth between differ-ent actors (2) multiple layers and cascades of equity ownership and (3) intermediate layers of instruments eg between government budgets and National Finance Institutions13
Ranges for estimated valuesGiven the uncertainty surrounding some data sources the multiple potential approaches to estimating specific climate finance flows and the lack of agreement on climate finance definitions and boundaries we opted to represent climate finance flows as ranges whenever possible rather than conveying a single-point estimate For example data ranges for renewable energy asset finance depends on data sources for non-domestic money (either Bloomberg New Energy Finance or UNCTAD Foreign Direct Investment data) For the sake of readability the numbers reproduced on the Climate Finance Flows Diagram 2012 correspond to mid-points
13 Depending on where you draw the line you could have many layers of source to instrument to recipient with each recipient becoming a source itself
The Landscape of climate finance focuses on tangible project-level primary financing flows
14
The Landscape of Climate Finance 2012
15
The Landscape of Climate Finance 2012December 2012 December 2012
23 Innovations in this yearrsquos study
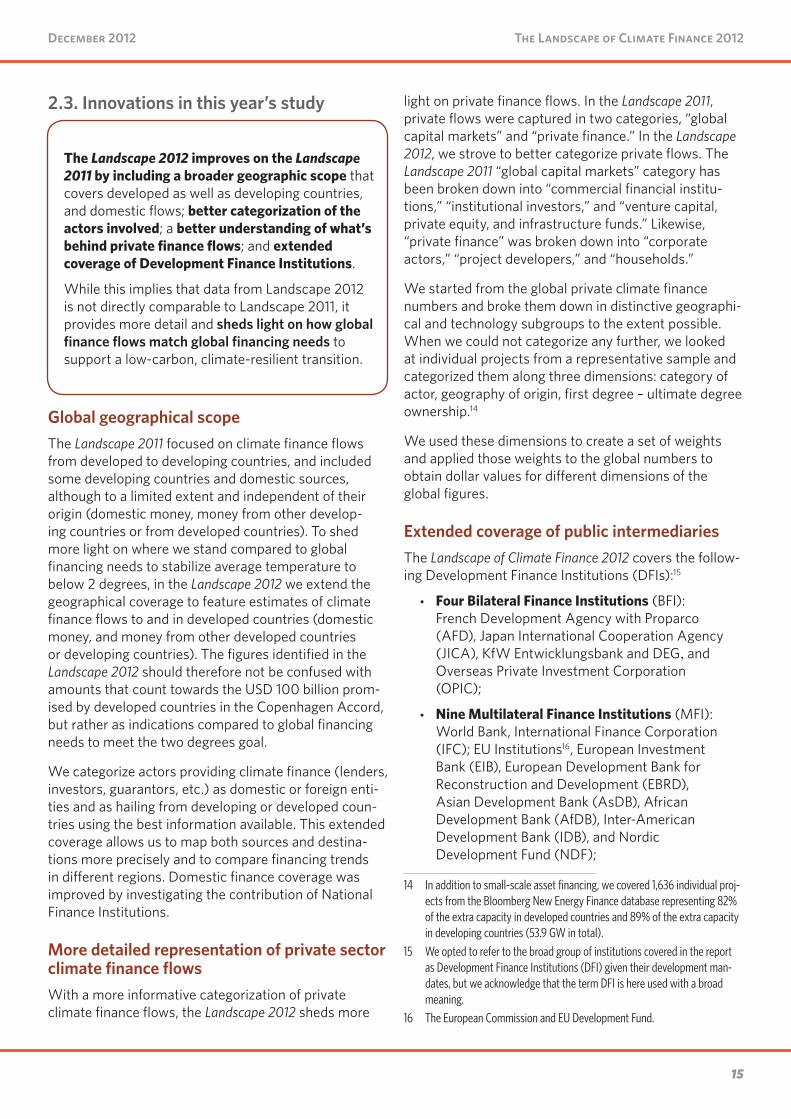
Global geographical scopeThe Landscape 2011 focused on climate finance flows from developed to developing countries and included some developing countries and domestic sources although to a limited extent and independent of their origin (domestic money money from other develop-ing countries or from developed countries) To shed more light on where we stand compared to global financing needs to stabilize average temperature to below 2 degrees in the Landscape 2012 we extend the geographical coverage to feature estimates of climate finance flows to and in developed countries (domestic money and money from other developed countries or developing countries) The figures identified in the Landscape 2012 should therefore not be confused with amounts that count towards the USD 100 billion prom-ised by developed countries in the Copenhagen Accord but rather as indications compared to global financing needs to meet the two degrees goal
We categorize actors providing climate finance (lenders investors guarantors etc) as domestic or foreign enti-ties and as hailing from developing or developed coun-tries using the best information available This extended coverage allows us to map both sources and destina-tions more precisely and to compare financing trends in different regions Domestic finance coverage was improved by investigating the contribution of National Finance Institutions
More detailed representation of private sector climate finance flowsWith a more informative categorization of private climate finance flows the Landscape 2012 sheds more
light on private finance flows In the Landscape 2011 private flows were captured in two categories ldquoglobal capital marketsrdquo and ldquoprivate financerdquo In the Landscape 2012 we strove to better categorize private flows The Landscape 2011 ldquoglobal capital marketsrdquo category has been broken down into ldquocommercial financial institu-tionsrdquo ldquoinstitutional investorsrdquo and ldquoventure capital private equity and infrastructure fundsrdquo Likewise ldquoprivate financerdquo was broken down into ldquocorporate actorsrdquo ldquoproject developersrdquo and ldquohouseholdsrdquo
We started from the global private climate finance numbers and broke them down in distinctive geographi-cal and technology subgroups to the extent possible When we could not categorize any further we looked at individual projects from a representative sample and categorized them along three dimensions category of actor geography of origin first degree ndash ultimate degree ownership14
We used these dimensions to create a set of weights and applied those weights to the global numbers to obtain dollar values for different dimensions of the global figures
Extended coverage of public intermediariesThe Landscape of Climate Finance 2012 covers the follow-ing Development Finance Institutions (DFIs)15
bull Four Bilateral Finance Institutions (BFI) French Development Agency with Proparco (AFD) Japan International Cooperation Agency (JICA) KfW Entwicklungsbank and DEG and Overseas Private Investment Corporation (OPIC)
bull Nine Multilateral Finance Institutions (MFI) World Bank International Finance Corporation (IFC) EU Institutions16 European Investment Bank (EIB) European Development Bank for Reconstruction and Development (EBRD) Asian Development Bank (AsDB) African Development Bank (AfDB) Inter-American Development Bank (IDB) and Nordic Development Fund (NDF)
14 In addition to small-scale asset financing we covered 1636 individual proj-ects from the Bloomberg New Energy Finance database representing 82 of the extra capacity in developed countries and 89 of the extra capacity in developing countries (539 GW in total)
15 We opted to refer to the broad group of institutions covered in the report as Development Finance Institutions (DFI) given their development man-dates but we acknowledge that the term DFI is here used with a broad meaning
16 The European Commission and EU Development Fund
The Landscape 2012 improves on the Landscape 2011 by including a broader geographic scope that covers developed as well as developing countries and domestic flows better categorization of the actors involved a better understanding of whatrsquos behind private finance flows and extended coverage of Development Finance Institutions
While this implies that data from Landscape 2012 is not directly comparable to Landscape 2011 it provides more detail and sheds light on how global finance flows match global financing needs to support a low-carbon climate-resilient transition
16
The Landscape of Climate Finance 2012
17
The Landscape of Climate Finance 2012December 2012 December 2012
bull Nineteen National Finance Institutions Brazilian Development Bank (BNDES) Development Bank of Latin America (CAF) Nacional Financiera (Nafin) Fideicomisos Institudos en Relacion con la Agricultura (Fira) Agencia Financiera de Desarollo Development Bank of Southern Africa (DBSA) Indian Renewable Energy Development Agency (IREDA) Banco del Estado de Chile Central American Bank for Economic Integration (BCIECABEI) Bancoldex Colombia Black Sea Trade and Development Bank of Greece (BSTDB) China Development Bank (CDB) Caisse de Depot et de Gestion of Morocco (CDG) Eximbank Indonesia Croatian Bank for Reconstruction and Development (HBOR) Korea Finance Corporation (KoFC) Industrial Development Bank of Turkey (TSKB) Small Industries Development Bank of India (SIDBI) and Vnesheconombank of Russia (VEB)
These institutionsrsquo climate financing data were retrieved from a blend of primary and secondary data sources Sixteen organizations out of the 32 covered in the report provided their data for mitigation and adaptation activi-ties directly by the means of a financial survey
Acknowledging the challenges in determining what qualifies as mitigation or adaptation and to unequivo-cally attribute specific investments to only one of these two themes mitigation and adaptation were broken down by sectors The choice of the sectors was guided and informed by other methodologies and account-ing practices (eg OECDCRS UNEP-SEI 2011) In those cases where respondents provided different sectoral breakdowns the projectcategory description was considered for allocating data against the chosen categories In the presence of activities with multiple objectives (both mitigation and adaptation) this amount was allocated according to the weights of mitigation and adaptation on the given total of climate finance17 To the extent possible data were adjusted to exclude interventions not in line with our definition of climate finance (eg we carved out financing for RampD manu-facturing or lower carbon energy generation projects the latter because they may have included fuel-to-fuel
17 For instance of the USD 96 billion ODA marked as climate finance in the OECD CRS database and not channelled by AFD JICA or KfW USD 42 billion is marked as mitigation only USD 3 as adaptation only and USD 24 billion as both mitigation and adaptation related We allocated the dual purpose money according to the distribution between mitigation only and adaptation only projects (59 vs 41) For DFIs eg in the case of EU Institutions dual purpose money (USD 264 million) was allocated accord-ing to the share of mitigation and adaptation projects (55 vs 45)
switch project such as fuel to gas and coal to gas and fossil fuel based co-generation) We acknowledge the uncertainties associated with what qualifies as climate finance and what does not and the ldquoimmaturityrdquo of some institutionsrsquo tracking and reporting methodolo-gies which affects our understanding on the real magni-tude and nature of the climate finance delivered by these institutions
Extended coverage of sectoral usesThe Landscape 2011 focused on renewable energy While we did our best to capture energy efficiency energy smart technologies and infrastructure industrial processes transportation and other sectors reliable data sources in these fields that fit within our frame-work were limited Some of these missing data sources are now available at national levels and we therefore managed to include a broader sectoral coverage in the Landscape 201218
Note that coverage for climate-resilience is even patchier due to reporting and categorization issues which hamper our understanding of what constitutes adaptation finance
Other changesThe capital boxes in the Landscape 2011 have been recategorized into ldquomarket rate project-level debtrdquo ldquoproject-level equityrdquo and ldquobalance-sheet financingrdquo for the Landscape 2012 We also mapped primary carbon offset flows differently attributing flows directly to the actors involved in the acquisition of primary offsets Apart from these changes several categories have been renamed for the Landscape 2012 government budgets (previous domestic public budgets) Development Finance Institutions including bilateral multilateral and national financial institutions (previous bilateral multilateral agencies and banks) carbon offset finance (previous carbon offset flows) and low-cost project-level debt (previous concessional loans)
18 Note that nuclear was not included in either the Landscape 2011 or in the Landscape 2012 as we could not identify data sources highlighting financ-ing directed to this type of projects None of the DFIs surveyed included in their climate finance reporting financing for nuclear projects nor did donors in their reporting to the OECD DAC
16
The Landscape of Climate Finance 2012
17
The Landscape of Climate Finance 2012December 2012 December 2012
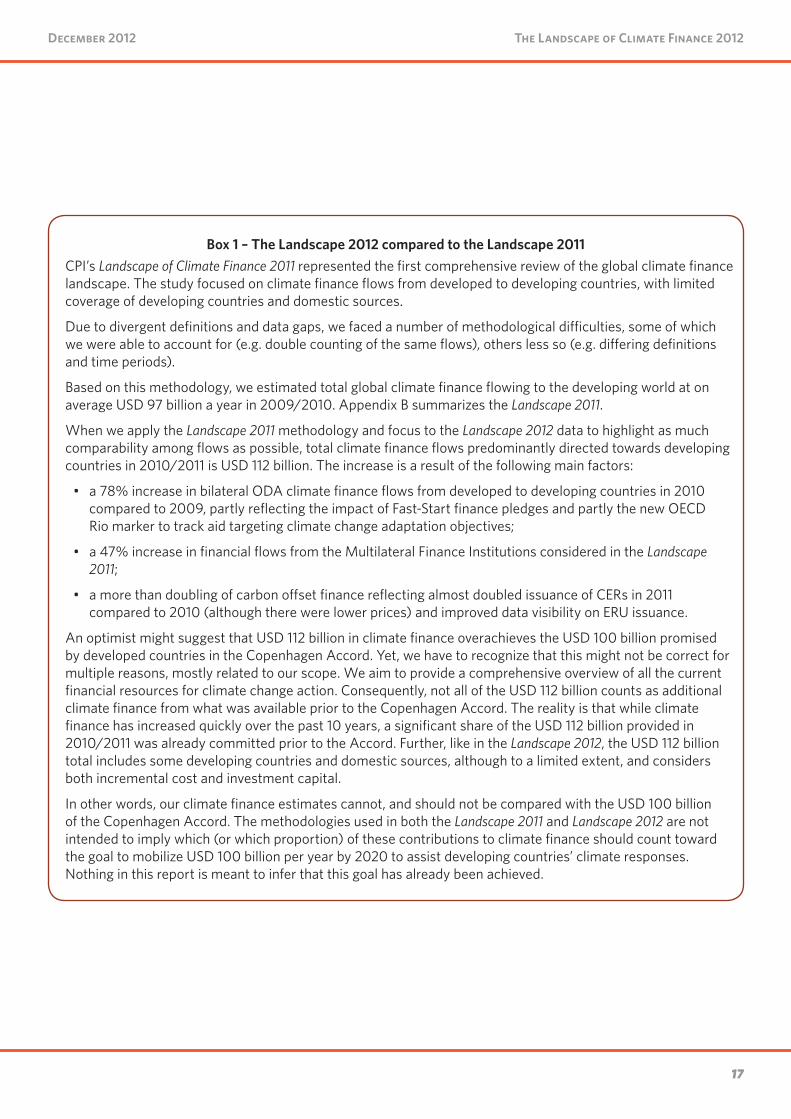
Box 1 ndash The Landscape 2012 compared to the Landscape 2011CPIrsquos Landscape of Climate Finance 2011 represented the first comprehensive review of the global climate finance landscape The study focused on climate finance flows from developed to developing countries with limited coverage of developing countries and domestic sources
Due to divergent definitions and data gaps we faced a number of methodological difficulties some of which we were able to account for (eg double counting of the same flows) others less so (eg differing definitions and time periods)
Based on this methodology we estimated total global climate finance flowing to the developing world at on average USD 97 billion a year in 20092010 Appendix B summarizes the Landscape 2011
When we apply the Landscape 2011 methodology and focus to the Landscape 2012 data to highlight as much comparability among flows as possible total climate finance flows predominantly directed towards developing countries in 20102011 is USD 112 billion The increase is a result of the following main factors
bull a 78 increase in bilateral ODA climate finance flows from developed to developing countries in 2010 compared to 2009 partly reflecting the impact of Fast-Start finance pledges and partly the new OECD Rio marker to track aid targeting climate change adaptation objectives
bull a 47 increase in financial flows from the Multilateral Finance Institutions considered in the Landscape 2011
bull a more than doubling of carbon offset finance reflecting almost doubled issuance of CERs in 2011 compared to 2010 (although there were lower prices) and improved data visibility on ERU issuance
An optimist might suggest that USD 112 billion in climate finance overachieves the USD 100 billion promised by developed countries in the Copenhagen Accord Yet we have to recognize that this might not be correct for multiple reasons mostly related to our scope We aim to provide a comprehensive overview of all the current financial resources for climate change action Consequently not all of the USD 112 billion counts as additional climate finance from what was available prior to the Copenhagen Accord The reality is that while climate finance has increased quickly over the past 10 years a significant share of the USD 112 billion provided in 20102011 was already committed prior to the Accord Further like in the Landscape 2012 the USD 112 billion total includes some developing countries and domestic sources although to a limited extent and considers both incremental cost and investment capital
In other words our climate finance estimates cannot and should not be compared with the USD 100 billion of the Copenhagen Accord The methodologies used in both the Landscape 2011 and Landscape 2012 are not intended to imply which (or which proportion) of these contributions to climate finance should count toward the goal to mobilize USD 100 billion per year by 2020 to assist developing countriesrsquo climate responses Nothing in this report is meant to infer that this goal has already been achieved
18
The Landscape of Climate Finance 2012
19
The Landscape of Climate Finance 2012December 2012 December 2012
3 The Current Landscape of Climate Finance FlowsIn this section we describe how climate finance breaks down along the lifecycle of financial flows from sources to end uses For each stage of global climate finance we aim to highlight the key reasons and motivations for finance flows ranges of finance involved where the money is coming from (geographies specific actors etc) where it is going (geographies specific actors technologies etc) and any issues specific to each life-cycle stage
31 Sources and intermediaries
Current sources of climate finance include
These various sources have multiple connections to each other There is also a strong interrelation between public and private sources of finance
Not captured in these figures are governmentsrsquo direct and indirect shareholdings and lending to private invest-ment structures as well as private contributions to International Financial Institutions (public contributions to Development Finance Institutions are captured only to a limited extent)
In the Landscape 2012 we have highlighted the contribu-tion of several categories of private stakeholders acting in the global landscape of climate finance namely corporate actors project developers households and institutional investors19 The contribution of public and private intermediaries (USD 110 ndash 120 billion) is dis-cussed in section 32
Carbon-related mechanisms Carbon-related mechanisms are comprised of (1) carbon market revenues and (2) all climate-related taxes raised by governments (ranging from explicit and implicit carbon taxes) Money collected from carbon markets and carbon-related taxes flows to government budgets though it is not clear how much is earmarked
19 Potential future sources of climate finance discussed in international forums are not mapped in the Landscape These include revenues from taxation of international aviation and shipping emissions revenues gener-ated by removing fossil fuel subsidies revenues generated by fossil fuel extraction royaltieslicenses revenues from a financial transaction tax (FTT) or allocation of Special Drawing Rights etc
SOURCES amp INTERMEDIARIES ()ANNUAL FLOWS OF DIRECT CLIMATE FINANCE
(2010 2011 USD BILLION)
PUBLIC
Government budgets (5) 160 - 226
Development Finance Institutions (21) 768
bull Climate Funds (lt1) 15
Sub-total public (26) 927 - 993
PRIVATE
Corporate actors (21) 693 - 805
Institutional investors (lt1) gt 06
Project developers (34) 1150 - 1293
Households (9) 323
Commercial financial institutions (10) 307 - 404
Venture capital private equity amp infrastructure funds (1) 24
Sub-total private (74) 2503 - 2855
TOTAL
Total 3430 - 3848bull Sub-total sources (68) 2332 - 2653
bull Sub-total intermediaries (32) 1099 - 1196
The sum of climate finance flows from all sources totals USD 343-385 billion The dominant source is the private sector which provides as much as USD 250-286 billion in climate finance or 74 of total climate finance (out of USD 364 billion on average) Of private actors project developers provide USD 122 billion or 34 of total climate finance while other corporate actors provide USD 75 billion or 21 of total climate finance Contributions from government budgets ranged between USD 16 and 23 billion including direct public investments and north-south aid flows Development Finance Institutions along with Climate Funds provided USD 77 billion
18
The Landscape of Climate Finance 2012
19
The Landscape of Climate Finance 2012December 2012 December 2012Figure 2 - 20102011 clim
ate finance flows (in USD billions)
32
Venture Capital Priva
te E
GENERAL TAX REVENUES
CARBON-RELATED TAXES
CARBON MARKET
REVENUESDEVELOPM
ENT FINANCE INSTITUTIONS
VENTURE CAPITAL PRIVATE EQUITY amp INFRASTRUCTURE FUNDS
$214
$22
$57
$53
$13
$5
$14
$350
DIFFERENT DISBURSEM
ENT CHANNELS
$2$7
$2
$47
$23
$32
$17
$104
$70
$32
POLICY INCENTIVES
RISK MANAGEM
ENT
CARBON OFFSET FINANCE
GRANTS
LOW-COST
PROJECT DEBT
PROJECT-LEVEL M
ARKET RATE DEBT
PROJECT-LEVEL EQUITY
BALANCE SHEET FINANCING
DEBT PORTION
INSTITUTIONAL INVESTORS
PROJECT DEVELOPERS
CORPORATE ACTORS
HOUSEHOLDS
GOVERNMENT
BUDGETS
$19
MITIGATION
ADAPTATION
Notes Figures are indicative estimates of annual fl ow
s for the latest year available 2010 or 2011 (variable according to the data source) Flows are expressed in USD billions
and rounded to produce whole num
bers Estimates spanning m
ultiple years are adjusted to produce annual-equivalent estimates W
here ranges of estimates are available
the mid-point is presented The diagram
distinguishes between lsquoincrem
ental costsrsquo that is fi nancial resources that cover the price di erence between a cheaper m
ore polluting options and costlier clim
ate-friendly ones and do not need to be paid back mdash and lsquocapital investm
entrsquo which are tangible investm
ents in mitigation or adaptation projects that need to be paid
back Categories not representing capital investment or a m
ix of capital investment and increm
ental costs are incremental costs only The group of National Finance Institutions includes
Sub-regional entities Most data presented relates to com
mitm
ents in a given year due to limited availability of disbursem
ent data
COMM
ERCIAL FINANCIAL INSTITUTIONS
AGENCIES
THE C
LIMATE FINANCE FLOW
S DIAGRAM 2012
The Climate Finance Flow
s Diagram 2012 also know
n as the lsquospaghettirsquo diagram illustrates the landscape of clim
ate fi nance fl ows along their
life cycle for the latest year available mostly 2011 The w
idth of the arrows in the diagram represents the relative size of the fl ows
NE
lt$1
MULTILATERAL
NATIONALBILATERAL
NE
NE
NE
NE
NE
NE
$77
CLIMATE FUNDS
NE Not estimated
PUBLIC M
ONEYPRIVATE M
ONEYPUBLIC FINANCIAL INTERM
EDIARIES
PRIVATE FINANCIAL
INTERMEDIARIES
OFFSET M
ONEYCAPITAL INVESTM
ENTCAPITAL INVESTM
ENT AND INCREM
ENTAL COSTS
KEY
FINANCE FOR INVESTORS amp
LENDERS
REDD
SOU
RCES AN
D IN
TERMED
IARIES
INSTRU
MEN
TSCH
AN
NELS
USES
NE
NE
Notes Figures are indicative estimates of annual flow
s for the latest year available 2010 or 2011 (variable according to the data source) Flows are expressed in USD billions and rounded to produce w
hole numbers Esti-
mates spanning m
ultiple years are adjusted to produce annual-equivalent estimates W
here ranges of estimates are available the m
id-point is presented The diagram distinguishes between lsquoincrem
ental costsrsquo that is financial resources that cover the price difference between a cheaper m
ore polluting options and costlier climate-friendly ones and do not need to be paid back mdash
and lsquocapital investmentrsquo w
hich are tangible investments
in mitigation or adaptation projects that need to be paid back Categories not representing capital investm
ent or a mix of capital investm
ent and incremental costs are increm
ental costs only The group of National Finance Institutions includes Sub-regional entities M
ost data presented relates to comm
itments in a given year due to lim
ited availability of disbursement data
20
The Landscape of Climate Finance 2012
21
The Landscape of Climate Finance 2012December 2012 December 2012
SOURCES ESTIMATED VALUE DESTINATIONS
ExtE
rnal
bull Auctioning of European Union Allowances (EUAs) USD 162 billion
bull Auction of allowances on the Regional Greenhouse Gas Initiative (RGGI) USD 017 billion
bull Transaction of Kyoto Assigned amount units (AAUs) USD 024 billion
USD 20 BILLION
Oth
Er ac
tOrs
bull Government budgets USD 20 billion
DESCRIPTION
Proceeds from sales and auctions of carbon assets to cap-and-trade compliance buyers Originate from carbon constrained economic sectors or countries In particular
bull Transactions of Kyoto assets between governmentsbull Sale of carbon allowances to cap-and-trade market participants in Europe and in the US
PRIMARY DATA
SOURCES
bull World Bank State and Trends of the Global Carbon Marketsbull European Energy Exchange (EEX) databull European Commission DG CLIMA
ISSUES AND FUTURE
ANALYSISbull No specific earmarking of the proceeds towards emission reductions projects
for climate finance purposes (ie how much will be spent by governments towards climate finance)
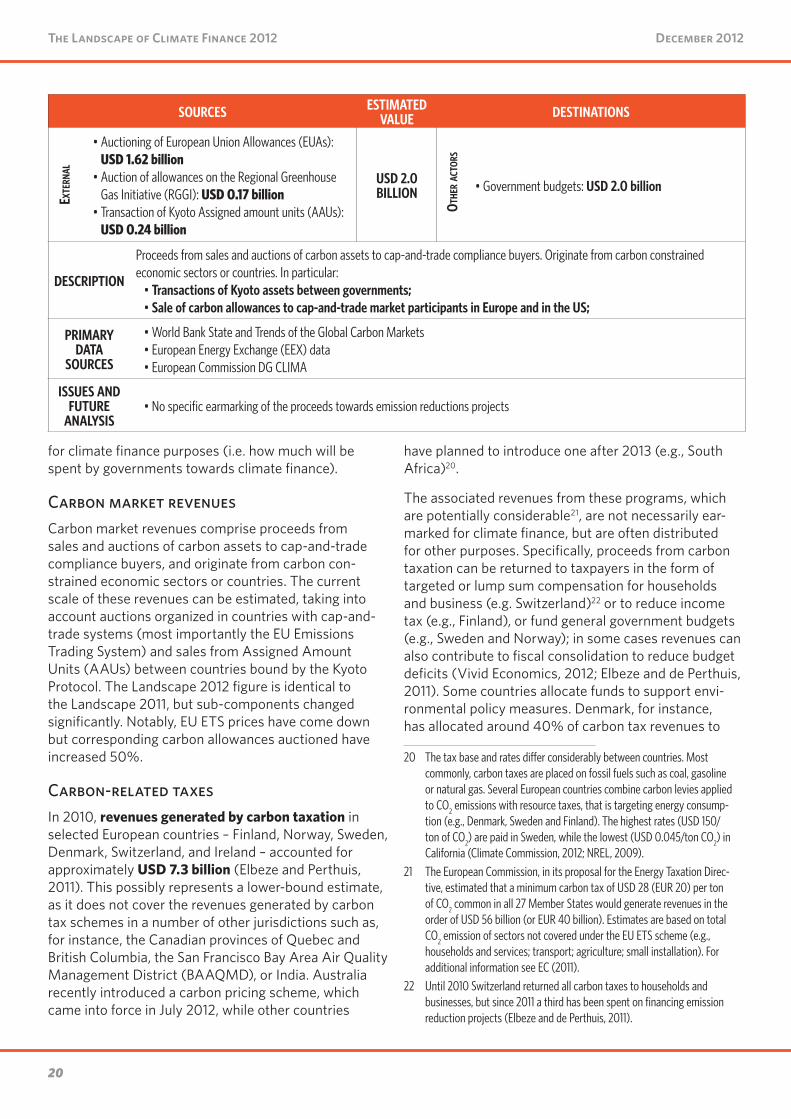
Carbon market revenuesCarbon market revenues comprise proceeds from sales and auctions of carbon assets to cap-and-trade compliance buyers and originate from carbon con-strained economic sectors or countries The current scale of these revenues can be estimated taking into account auctions organized in countries with cap-and-trade systems (most importantly the EU Emissions Trading System) and sales from Assigned Amount Units (AAUs) between countries bound by the Kyoto Protocol The Landscape 2012 figure is identical to the Landscape 2011 but sub-components changed significantly Notably EU ETS prices have come down but corresponding carbon allowances auctioned have increased 50
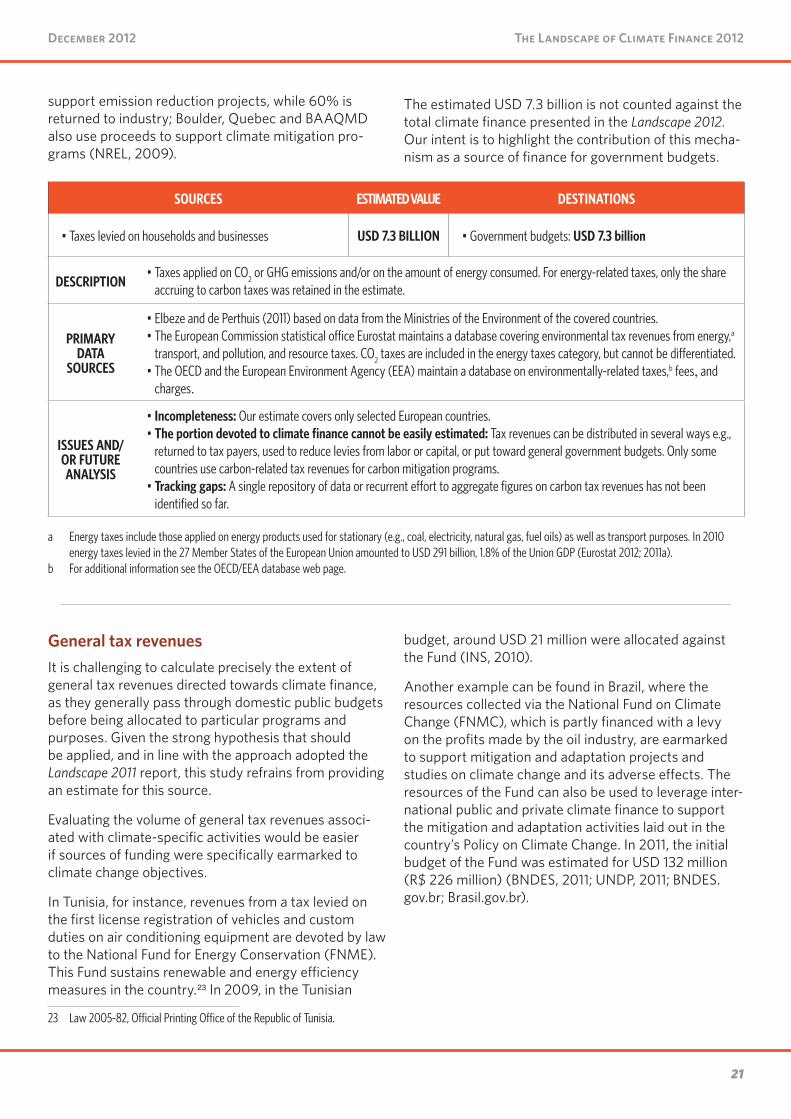
Carbon-related taxes In 2010 revenues generated by carbon taxation in selected European countries ndash Finland Norway Sweden Denmark Switzerland and Ireland ndash accounted for approximately USD 73 billion (Elbeze and Perthuis 2011) This possibly represents a lower-bound estimate as it does not cover the revenues generated by carbon tax schemes in a number of other jurisdictions such as for instance the Canadian provinces of Quebec and British Columbia the San Francisco Bay Area Air Quality Management District (BAAQMD) or India Australia recently introduced a carbon pricing scheme which came into force in July 2012 while other countries
have planned to introduce one after 2013 (eg South Africa)20
The associated revenues from these programs which are potentially considerable21 are not necessarily ear-marked for climate finance but are often distributed for other purposes Specifically proceeds from carbon taxation can be returned to taxpayers in the form of targeted or lump sum compensation for households and business (eg Switzerland)22 or to reduce income tax (eg Finland) or fund general government budgets (eg Sweden and Norway) in some cases revenues can also contribute to fiscal consolidation to reduce budget deficits (Vivid Economics 2012 Elbeze and de Perthuis 2011) Some countries allocate funds to support envi-ronmental policy measures Denmark for instance has allocated around 40 of carbon tax revenues to
20 The tax base and rates differ considerably between countries Most commonly carbon taxes are placed on fossil fuels such as coal gasoline or natural gas Several European countries combine carbon levies applied to CO2 emissions with resource taxes that is targeting energy consump-tion (eg Denmark Sweden and Finland) The highest rates (USD 150ton of CO2) are paid in Sweden while the lowest (USD 0045ton CO2) in California (Climate Commission 2012 NREL 2009)
21 The European Commission in its proposal for the Energy Taxation Direc-tive estimated that a minimum carbon tax of USD 28 (EUR 20) per ton of CO2 common in all 27 Member States would generate revenues in the order of USD 56 billion (or EUR 40 billion) Estimates are based on total CO2 emission of sectors not covered under the EU ETS scheme (eg households and services transport agriculture small installation) For additional information see EC (2011)
22 Until 2010 Switzerland returned all carbon taxes to households and businesses but since 2011 a third has been spent on financing emission reduction projects (Elbeze and de Perthuis 2011)
20
The Landscape of Climate Finance 2012
21
The Landscape of Climate Finance 2012December 2012 December 2012
support emission reduction projects while 60 is returned to industry Boulder Quebec and BAAQMD also use proceeds to support climate mitigation pro-grams (NREL 2009)
The estimated USD 73 billion is not counted against the total climate finance presented in the Landscape 2012 Our intent is to highlight the contribution of this mecha-nism as a source of finance for government budgets
SOURCES ESTIMATED VALUE DESTINATIONS
bull Taxes levied on households and businesses USD 73 BILLION bull Government budgets USD 73 billion
DESCRIPTIONbull Taxes applied on CO2 or GHG emissions andor on the amount of energy consumed For energy-related taxes only the share
accruing to carbon taxes was retained in the estimate
PRIMARY DATA
SOURCES
bull Elbeze and de Perthuis (2011) based on data from the Ministries of the Environment of the covered countriesbull The European Commission statistical office Eurostat maintains a database covering environmental tax revenues from energya
transport and pollution and resource taxes CO2 taxes are included in the energy taxes category but cannot be differentiatedbull The OECD and the European Environment Agency (EEA) maintain a database on environmentally-related taxesb fees and
charges
ISSUES ANDOR FUTURE ANALYSIS
bull Incompleteness Our estimate covers only selected European countriesbull The portion devoted to climate finance cannot be easily estimated Tax revenues can be distributed in several ways eg
returned to tax payers used to reduce levies from labor or capital or put toward general government budgets Only some countries use carbon-related tax revenues for carbon mitigation programs
bull Tracking gaps A single repository of data or recurrent effort to aggregate figures on carbon tax revenues has not been identified so far
a Energy taxes include those applied on energy products used for stationary (eg coal electricity natural gas fuel oils) as well as transport purposes In 2010 energy taxes levied in the 27 Member States of the European Union amounted to USD 291 billion 18 of the Union GDP (Eurostat 2012 2011a)
b For additional information see the OECDEEA database web page
General tax revenuesIt is challenging to calculate precisely the extent of general tax revenues directed towards climate finance as they generally pass through domestic public budgets before being allocated to particular programs and purposes Given the strong hypothesis that should be applied and in line with the approach adopted the Landscape 2011 report this study refrains from providing an estimate for this source
Evaluating the volume of general tax revenues associ-ated with climate-specific activities would be easier if sources of funding were specifically earmarked to climate change objectives
In Tunisia for instance revenues from a tax levied on the first license registration of vehicles and custom duties on air conditioning equipment are devoted by law to the National Fund for Energy Conservation (FNME) This Fund sustains renewable and energy efficiency measures in the country23 In 2009 in the Tunisian
23 Law 2005-82 Official Printing Office of the Republic of Tunisia
budget around USD 21 million were allocated against the Fund (INS 2010)
Another example can be found in Brazil where the resources collected via the National Fund on Climate Change (FNMC) which is partly financed with a levy on the profits made by the oil industry are earmarked to support mitigation and adaptation projects and studies on climate change and its adverse effects The resources of the Fund can also be used to leverage inter-national public and private climate finance to support the mitigation and adaptation activities laid out in the countryrsquos Policy on Climate Change In 2011 the initial budget of the Fund was estimated for USD 132 million (R$ 226 million) (BNDES 2011 UNDP 2011 BNDESgovbr Brasilgovbr)
22
The Landscape of Climate Finance 2012
23
The Landscape of Climate Finance 2012December 2012 December 2012
Government budgets
Contributions from government budgets are estimated at between USD 16 and 23 billion in 20102011 The estimate includes USD 111 ndash 112 billion of domestic funds for project finance reported in the Bloomberg New Energy Finance database largely origi-nating from developed countries for small-scale invest-ments (USD 28 billion) larger-scale investments (USD 83 billion) and carbon offset finance (USD 01 billion) A large part relates to the US governmentrsquos rsquogreenrsquo economic stimulus packages
The estimate also includes contributions from devel-oped country governments to developing countries of between USD 48 and 114 billion in 2010 excluding reporting of finance channelled through AFD JICA and KfW as discussed below The lower bound of this esti-mate considers only aid marked as ldquoprincipallyrdquo climate change-related in the OECDrsquos Creditor Reporting System (CRS) database The upper bound of the range includes an additional USD 18 billion of money identi-fied in Fast-Start Finance reporting for the same year The range includes bilateral Overseas Development
Assistance (ODA) and Fast-Start Finance commitments in 2010 from 28 OECD countries plus Cyprus Latvia Liechtenstein Lithuania Mata and the UAE Notably no data was available in the sources consulted for OECD countries such as Chile Estonia Hungary Israel Mexico24 or Turkey
For our estimates of government budget contributions we exclude government contributions (including ODA) delivered through national bilateral and multilateral intermediaries and funds due to the current lack of data required to do so across the full range of actors and to avoid double counting with other flows captured separately (see Intermediaries section) Our estimate is therefore conservative and can be considered as a minimum Further discussion on government contri-butions to Development Finance Institutions (DFIs) is included in Box 3 which attempts to highlight the extent of public sector contributions to funding for
24 Mexico is a member of the OECD with DAC observer status Latt (2011) discuss Mexicorsquos role as an ldquoemerging donorrdquo conducting technical and scientific cooperation projects in developing countries to a value of around USD 16 million in 2009
SOURCES ESIMATED VALUE DESTINATIONS
IntE
rnal bull Carbon market revenues USD 2 billion
bull Carbon taxes USD 73 billionbull General tax revenues NE
USD 16-23 BILLION In
stru
mEn
ts an
d usE
s
bull Policy incentives NEbull Risk management NEbull Carbon offset finance USD 01 billionbull Grants USD 42 ndash 99 billionbull Low cost debt USD 59 ndash 65 billionbull Project-level market rate debt USD 02 billionbull Project-level equity USD 02 ndash 05 billionbull Balance sheet financing USD 54 billion
Usesbull USD 149-182 billion mitigation bull USD 1-44 billion adaptation
ExtE
rnal
bull Changes in net debt from third-party NE
OthE
r act
Ors
bull Development Finance Institutions NEbull Climate Funds NEbull Ownership of other actors of the landscape NE
DESCRIPTIONDomestic and international government climate finance expenditures fed by conventional tax revenues ownership earnings or sovereign bond issuance as well as in some cases revenues raised from carbon pricing mechanisms
PRIMARY DATA
SOURCES
bull OECD Development Database on Aid Activities Creditor Reporting System bull Fast Start Finance Reporting to the UNFCCCbull Bloomberg New Energy Finance database
ISSUES AND FUTURE
ANALYSIS
There is a lack of information on the extent of government contributions to Development Finance Institutionsrsquo climate finance as well as domestic and developing country sources of climate finance General budget support is by definition not earmarked in any way but may be another source of climate finance not currently tracked
Note Carbon market revenues and taxes while included in this table are discussed in detail in previous sections and tables
22
The Landscape of Climate Finance 2012
23
The Landscape of Climate Finance 2012December 2012 December 2012
low-carbon climate-resilient development in recent years in spite of fiscal austerity and the tightening credit context
Indeed if we were to include these amounts we see that more than half ndash USD 116 billion of USD 23 billion ndash of bilateral ODA commitments in 2010 were reported as being delivered by just three Bilateral Finance Institutions (AFD KfW and JICA) We also see that climate-related bilateral Official Development Assistance grew from USD 95 billion in 2009 to an estimated USD 23 billion in 2010 reflecting the impact of Fast-Start finance pledges which we estimate accounted for around 36 of Official Development Assistance in 2010 as well as the introduction of the marker for adaptation finance in the OECD CRS data-base The top providers of bilateral ODA were Japan Germany France and the United States
Export credits which support export transactions by hedging risks for investors are excluded from our esti-mate of government contributions because the instru-ments may not be called upon and may not therefore represent a true flow They may however play a key role in stimulating private low-emission investments in developing countries (see Instrument section for further information)
Grants (USD 42-99 billion) low-cost debt (USD 59-65 billion) and ldquobalance sheetrdquo financing of owned emission reductions projects (municipalities public schools military installations etc) (USD 54 billion) are the most common forms of financing provided using government money Flows to policy incentives and risk management instruments are expected to be very large but are not quantified in the study
We find that 64-72 of that deployment occurs in developed countries and 28-36 in developing countries
a American Reinvestment and Recovery Act grants Georgia Environmental Finance Authority grants Voluntary Airport Low Emission grants State of Pennsylvania solar program grants Rhode Island Economic Development Corporation grants etc
ExampleThe US Governmentrsquos many roles in solar project financing include (1) federal and state-level policy incentives to promote the renewable energy deployment (2) risk management instruments such as US Department of Energy partial or full loan guarantees (3) project-specific grantsa and (4) low cost debt such as the US Department of the Treasuryrsquos Federal Financing Bank loans to some of the largest projects financed in 2011 These various roles highlight the diversity of financing instruments available
24
The Landscape of Climate Finance 2012
25
The Landscape of Climate Finance 2012December 2012 December 2012
Box 3 The role of Development Finance Institutions Development Finance Institutions play a complex and crucial role in the climate finance landscape operating as a pivotal link between public and private finance
Preliminary investigation of the ownership structure of private investments mapped in the climate finance landscape indicates that a large portion of these investments could be classified as governmentsrsquo direct and indirect shareholdings in and lending to private investment structures (see Box 5 for more information) Public finance institutions add significant value to financing packages by subsidizing interest rates transforming the maturity of loans to long-term and absorbing a share of the risks of the loans handed out to the private sector Without public backing many of these packages would be unviable
Likewise government backing of Development Finance Institutions underpins their ability to raise funds and provide a range of instruments specially tailored to the delivery of low-emissions climate-resilient finance
The ownership structure of DFIs is typically dominated by nationalmember governments that initially capitalized the institutionsrsquo capital base and govern their activities
Net budget inflows to Development Finance Institutions in a given year on the other hand are mainly driven by their own financial activities (for instance their equity holdings and earmarked returns on investments) and finance raised on capital markets andor borrowings from governments With high financial security profiles (AAA credit rating) DFIs are able to refinance their activities via very low interest rate bonds
Also thanks to their capital structure and high financial security DFIs can deliver a range of concessional and non-concessional instruments to finance investments in developing countries Budget inflows may also include specific grant contributions from governments or trust funds that can either be passed on directly or used to further soften lending conditions (the grant element) of low-cost debt in order to deliver loans with deep concessions adapted to recipient needs eg poor financial capacity or for projects with long-term economic returns The average level of grant element in concessional loans provided by DFIs varies considerably depending on institutional mandates
Given the complexities laid out above this study does not yet provide an estimate of the level of government contribution to DFIs The foremost difficulty encountered relates to quantifying the costs to governments of absorbing the risks associated with backing DFI activities In terms of budget flows on the other hand transparent reporting is not always available due to confidentiality requirements and the fact that finance is disbursed over a period of years rather than at the time of commitment also presents difficulties
Discussions with just three DFIs included in this study suggest average grant elements of concessional loans of between 12 and 20 but with a range up to 70 for individual loans with deep concessions If we were to assume that all grants are provided using 100 contributions from government sources and an average grant element contribution from governments to low-cost debt of 17 we would estimate a contribution of government budgets to all DFI activities captured in the Climate Finance Flows Diagram 2012 of USD $10924 million (15 or 17 leverage) This estimate is not included in the Climate Finance Flows Diagram 2012 at present due to the lack of detailed information available for the full range of institutions included in the study and the difficulties outlined above
Thus while annual government budget contributions to DFIs may be relatively low finance provided by DFIs is generally considered to be public For example in the case of bilateral ODA according to the OECD DACrsquos reporting directives where ldquoOfficial transactions are [defined as] those undertaken by central state or local government agencies at their own risk and responsibility regardless of whether these agencies have raised the funds through taxation or through borrowing from the private sectorrdquo
24
The Landscape of Climate Finance 2012
25
The Landscape of Climate Finance 2012December 2012 December 2012
Box 4 ndash Supporting Renewable Energy in the US
US federal tax incentives cash grants and loans sustained a boom in renewables investment through the depths of the worst financial crisis since the Great Depression
The US public and private sectors invested a total of USD 143 billion in renewable energy projects and installed 34 GW of new solar and wind capacity between 2008-2011 ndash with over USD 50 billion and 9 GW in 2011 alone While the bulk of the financing for these projects came from the private sector growth was underpinned by stable renewable deployment support policies at both the state and federal level
With relatively low US electricity market prices most renewable projects built over the last four years would not have attracted investors without additional support from governments or ratepayers Aggressive long-term state-level renewable energy obligations (such as Californiarsquos requirement that 33 of its electricity be generated from non-hydroelectric renewable energy sources by 2020) have driven demand However as the recession squeezed state and ratepayer budgets federal government supports became more important
Prior to the financial crisis two primary federal policies were available ndash a USD 22MWh production tax credit for wind and a 30 investment tax credit (ITC) for solar But tax incentives require substantial and predictable tax liabilities from profits to be useful ndash and once the crisis hit these were in short supply Twenty or so large financial firms had provided over USD 6 billion in tax equity financing for renewable projects in 2007 About half of them ndash including AIG Lehman Brothers Citi and John Hancock ndash had exited the tax equity market by 2009 Further the financial crisis left banks less willing and able to provide long-term low-cost debt for capital-intensive projects such as wind and solar farms
The US economic stimulus in early 2009 addressed these issues Instead of tax credits wind and solar projects starting construction by the end of 2011 could choose a 1603 Cash Grant equal to 30 of eligible project costs So far the program has provided USD 13 billion (USD 47 billion in 2011) to support renewable investment The federal government also offered direct federal loans and partial guarantees of private loans to address tightness in debt markets a total of USD 86 billion in direct loans (USD 7 billion in 2011) and USD 57 billion in partial guarantees (USD 42 billion in 2011) to date
These and other measures leveraged enough private investment to double US non-hydroelectric renewable energy generating capacity in four years And as the financial crisis has eased the tax equity market has recovered hitting the $6 billion level in 2011
The two stimulus programs ended in 2011 and the production tax credit for wind expires at the end of 2012 The cost of extending the production tax credit now stands as a significant barrier to continued renewable energy growth However there are ways to make these important federal policies more cost-effective Policies that expand the pool of investors could reduce costs for developers and for taxpayers CPI work suggests that replacing the current tax incentives with smaller cash incentives could provide the same benefits to projects at just over half the cost to government
Prepared by Uday Varadarajan (CPI San Francisco udayvaradarajancpisforg)
Based on Varadarajan et al ldquoSupporting Renewables while Saving Taxpayers Moneyrdquo CPI Report (2012)
26
The Landscape of Climate Finance 2012
27
The Landscape of Climate Finance 2012December 2012 December 2012
Corporate actorsIn the Landscape 2012 we have been better able to high-light the contribution of corporate actors in the global landscape of climate finance We find that corporate actors contributed 21 of global climate finance Corporate actors unlike project developers do not sell green electricity or related products and services We identified two main categories of corporate actors
First some non-energy corporate actors are eager to deploy emissions reduction assets to reduce their energy bills or meet voluntary commitments These include technology companies (eg Google) and com-panies with large warehouses installations or factories (eg IKEA) The estimate of contributions from non-energy corporate actors includes a very large share of small-scale renewable energy (solar PV and solar water heating amp cooling) of more than USD 51 billion Sometimes the investor is an industrial conglomerate for which it is hard to be able to identify a specific set of activities Apart from investing in emissions reduction
projects some of these corporate actors might be required to comply with GHG emissions cap-and-trade scheme allowing for the use of offsets
Second some manufacturers of (renewable) energy systems financed the deployment of their own systems (pilot amp demonstration plants vendor financing etc) Examples include wind turbine manufacturers (such as Chinarsquos Goldwin and Spainrsquos Gamesa) solar PV and thermal systems manufacturers (Japanrsquos Sharp Spainrsquos Gestamp USArsquos MEMC Indiarsquos Moser Baer and Chinarsquos CHINT Group) and electricity generation technology providers (USArsquos GE financial services Indiarsquos Crompton Greaves and South Korearsquos Samsung CampT Corp)
We find that 80-93 of corporate actorsrsquo contributions are sourced domestically 6-14 in other developed countries than the emissions reduction project host country and the remaining 2-6 in other developing countries than the emissions reduction project host country (technology developers notably) We find that
SOURCES ESTIMATED VALUE DESTINATIONS
IntE
rnal bull Reinvested earnings from recurrent and exceptional
income NEUSD 693 ndash
805 BILLION
Inst
rum
Ents bull Carbon offset finance USD 12 billion
bull Project-level market rate debt USD 15 ndash 26 billionbull Project-level equity USD 15 ndash 26 billionbull Balance sheet financing USD 650 ndash 741 billion
ExtE
rnal bull Changes in net debt and equity from third-partya
NE
OthE
r act
Ors
bull Ownership of other actors of the landscape NE
DESCRIPTIONCorporate actors whose activity cannot be categorized as ldquoproject developersrdquo comprised of
bull Non-energy corporate actorsbull Manufacturers of renewable energy systems
PRIMARY DATA
SOURCES
bull Bloomberg New Energy Finance and UNCTAD FDI databull Frankfurt School - UNEP Collaborating Centre for Climate amp Sustainable Energy Finance Global Trends in Renewable Energy
Investment 2012bull REN21 Renewables 2012 ndash Global Status Reportbull Weiss amp Mauthner Solar Heat Worldwide report (edition 2012)bull Ecosystem Marketplace State of the Voluntary Carbon Markets Report
ISSUES AND FUTURE
ANALYSIS
bull Motivation for investment The main driver for investment (energy savings opportunism synergies with other corporate activities promoting own technologies etc) is not always clear
bull Access to capital Sometimes corporate money helps overcome difficulties in accessing more traditional sources of capital such as banks
bull Definitional issues Boundaries with households can be difficult to delineate in the case of small family-based corporate actors Likewise geographical origin of corporate actors can be hard to identify in the case of multinational groups
a This corresponds to the net value of debt raised minus debt repaid for a given year This relates to commercial financial institutions mostly Please note that other actors of the landscape such as institutional investors can be interested in corporate debt issues (bonds medium-term notes etc) as an investment vehicle The same logic is applied to changes in net equity
26
The Landscape of Climate Finance 2012
27
The Landscape of Climate Finance 2012December 2012 December 2012
13-22 of the corporate actorsrsquo money went to devel-oping countries and 78-87 went to developed coun-tries (notably small scale PV in Italy and Germany)
ExampleIn 2009 Ferrari installed a rooftop PV system at one of its factories in Italy Large warehouses such as those for automotive factories are natural candidates for laying out solar panels on rooftops (General Motors did the same for one of its factory in Spain in 2008 with a total capacity of 12 MW) The main motivation is energy savings (expected savings of 200000 kWh per year) and potential return from installing a rooftop PV system Investment money was sourced from Ferrarirsquos own balance sheet and revenues and would be used to pay for the system and its installation
ExampleSiemens Financial Services and Siemens Bank the lending arms of the German technology manufacturer Siemens would be categorized as corporate actors Money would be sourced from the company balance sheet of parent companies and from their own revenues Money is then lent against projects using Siemens wind turbines For instance Siemens Financial Services provided a share of project-level market rate debt to the 272 MW Seigneurie de Beaupre onshore wind farms in Canada and phase I of the 288 MW Meerwind Sud und Ost offshore wind farm in Germany last year
28
The Landscape of Climate Finance 2012
29
The Landscape of Climate Finance 2012December 2012 December 2012
Institutional investors We find that the direct contribution of institutional investors to emissions reduction projects is in excess of USD 620 million for the year 2011 This number seems low compared to expectation but given the lack of trans-parency on institutional investorsrsquo involvement the fact that our representative sample excludes many countries where institutional investors have been active these last years (notably some North European countries) and our focus on primary equity stakes and not stakes taken in projects already running (secondary market transac-tions representing only money changing hands) this appears as a reasonable lower bound
In 2011 institutional investors have been active on both the debt and equity side For example on the debt side25 US insurance company Metlife provided debt to US onshore wind (EnXco Lakefield) and US solar (Webberville PV Plant) projects In Canada the Great-West Life Assurance Company and Ontario Pension Board provided debt to Sprott amp Firelight Amherst wind farm On the equity side Allianz and Munich Re invested in European solar and wind assets while Brazilrsquos workersrsquo severance fund provided equity to more than 200 MW of domestic onshore wind projects
25 Whenever project bonds have been issued (US solar projects) therersquos a possibility that institutional investors purchased such issues and therefore contribute to providing debt to emissions reduction projects
We find that nearly 37 of institutional investorsrsquo contributions are sourced domestically and the remain-der in developed countries other than the project host country We find that approximately 11 of institutional investorsrsquo money went to developing countries and 89 to developed countries (Europe and the US)
SOURCES ESTIMATED VALUE DESTINATIONS
IntE
rnal bull Reinvested earnings from recurrent and exceptional
income NEgt USD 06 BILLION
Inst
rum
Ents bull Project-level market rate debt gt USD 02 billion
bull Project-level equity gt USD 02 billionbull Balance sheet financing gt USD 02 billion
ExtE
rnal
bull Changes in net debt and equity from third-party NE
OthE
r act
Ors
bull Ownership of other actors of the landscape NE
DESCRIPTION
Theyrsquore comprised ofbull Insurance companiesbull Pension fundsbull Foundations amp endowments
PRIMARY DATA
SOURCESbull Bloomberg New Energy Finance and UNCTAD FDI data
ISSUES AND FUTURE
ANALYSIS
bull Improving coverage a more systematic and in-depth tracking of contributions to the landscape will be useful as more deals (both on the debt and the equity side) involve institutional investors
bull Indirect investment channels institutional investors also invest in emissions reduction projects via infrastructure amp private equity funds
bull Improving definitions distinguishing by sub-categories of institutional investors as they have different objectives and constraints
28
The Landscape of Climate Finance 2012
29
The Landscape of Climate Finance 2012December 2012 December 2012
Project developersWe highlight project developer contributions in the Landscape 2012 and find that they contributed 34 of global climate finance
We define project developers as dedicated entities with the ability to design commission and operate and maintain emissions reduction projects These include power and gas utilities and independent power produc-ers (Spainrsquos EDP Francersquos EDF US Duke Energy China Datang and Guodian for instance) energy companies (Francersquos Total UKrsquos BP or Brazilrsquos Petrobras) and engineering procurement construction contractors and independent developers of projects (NRG Energy in the US smaller Spanish and Italian project developers)
We find that 83-94 of project developersrsquo contri-butions are sourced domestically 6-16 from other developed countries other than the emissions reduc-tion project host country and the remaining 0-1 from other developing countries other than the emissions reduction project host country We find that 50-56 of the project developersrsquo money went to developing coun-tries and 44-50 went to developed countries
SOURCES ESTIMATED VALUE DESTINATIONS
IntE
rnal bull Reinvested earnings from recurrent and exceptional
income NEUSD 1150 ndash
1293 BILLION
Inst
rum
Ents bull Carbon offset finance USD 12 billion
bull Project-level equity USD 164 ndash 184 billionbull Balance sheet financing USD 974 ndash 1097 billion
ExtE
rnal
bull Changes in net debt and equity from third-party NE
OthE
r act
Ors
bull Ownership of other project developers NE
DESCRIPTION
Emissions reduction project developers includingbull Dedicated project developers amp EPC contractorsbull Utilities and independent power producersbull Energy companies
PRIMARY DATA
SOURCES
bull Bloomberg New Energy Finance and UNCTAD FDI databull Frankfurt School - UNEP Collaborating Centre for Climate amp Sustainable Energy Finance Global Trends in Renewable Energy
Investment 2012bull REN21 Renewables 2012 ndash Global Status Reportbull Weiss amp Mauthner Solar Heat Worldwide report (edition 2012)bull Ecosystem Marketplace State of the Voluntary Carbon Markets Report
ISSUES AND FUTURE
ANALYSIS
bull Definitional issues The boundaries of specific sub-categories and potential overlap with corporate actors (conglomerates for instance) needs to be easier to identify to better understand underlying drivers for investment
bull Non-energy projects the contributions of non-energy project developers is hard to assess
ExampleNRG Energy is a US project developer that has deployed roughly 15 GW of solar PV capacity in the US in 2011 directly and via its subsidiaries NRG Energy is able to invest thanks to its expertise own resources and ability to secure project finance and attract external equity investors (such as MidAmerican Energy Holdings Co) for its larger projects
Likewise EDF a French energy grouppower and gas utility invested in solar and wind projects throughout the world in 2011 (US Germany etc) directly and via its subsidiaries (EDF Energies Nouvelles EnXCo Inc etc) Money comes from its own resources and project-level financing (tax equity arrangement in the US for instance)
30
The Landscape of Climate Finance 2012
31
The Landscape of Climate Finance 2012December 2012 December 2012
Households Households represent a source of money that we did not explore in the Landscape 2012 We define house-holds as (1) family-level economic entities (2) high net worth individuals and (3) their intermediaries whether they are family offices investing on their behalf or dedi-cated foundations operating philanthropic programs Their money stems from income and savings including inherited or entrepreneurial wealth They are also able to borrow to invest into emissions reduction assets or support such investment via grants We find that households contributed 8-10 of global climate finance
SOURCES ESTIMATED VALUE DESTINATIONS
IntE
rnal
bull Income and savings NE
USD 323 BILLION
Inst
rum
Ents bull Grants USD 02 billiona
bull Carbon offset finance lt USD 01 billionbull Balance sheet financing USD 321 billion
ExtE
rnal
bull Changes in net debt NE
OthE
r act
Ors
bull Ownership of other actors of the landscape NE
DESCRIPTIONHouseholds and wealthy individuals involved in philanthropy and their intermediaries (family offices and dedicated foundations)
PRIMARY DATA
SOURCES
bull Bloomberg New Energy Finance and UNCTAD FDI databull Frankfurt School - UNEP Collaborating Centre for Climate amp Sustainable Energy Finance Global Trends in Renewable Energy
Investment 2012bull REN21 Renewables 2012 ndash Global Status Reportbull Weiss amp Mauthner Solar Heat Worldwide report (edition 2012)bull Ecosystem Marketplace State of the Voluntary Carbon Markets Report
ISSUES AND FUTURE
ANALYSIS
bull Householdsrsquo contribution is hard to measure Figures are estimates onlybull Sources of finance for households need to be better understoodbull The contribution of households in the field of energy efficiency and electric vehicles investments is not measured here
a This relates to philanthropy and is discussed in the dedicated instrument section
Householdsrsquo asset finance ndash USD 323 billion ndash cor-responds 993 to small scale installations USD 226 billion of solar PV in developed countries and USD 79 billion of solar thermal heating and cooling in devel-oping countries (mainly China) are the largest con-tributors A small share of householdsrsquo contribution to climate finance flows in 2011 relates to grants from US and European philanthropic programmes and an even smaller portion of it relates to voluntary carbon offsetting
As expected all of householdsrsquo contributions were sourced domestically We find that 75 of the house-holdsrsquo contributions were in developed countries and 25 were in developing countries
30
The Landscape of Climate Finance 2012
31
The Landscape of Climate Finance 2012December 2012 December 2012
Box 5 - Who actually sits behind the moneyIn the Landscape 2012 we explored who actually ldquosits behindrdquo climate finance actors That is a project developer can actually be the subsidiary of an entity located in another country or categorized as an actor The ldquoproject developersrdquo category is the one for which this information is most interesting and revealing The impact of such re-categorization is explored in more detail in the uses section of this report In particular we find that
bull Close to USD 410 billion of 2011 project developers investment flows (31-35) could be categorized as domestic public budget instead The largest contributor to this phenomenon is Peoplersquos Republic of Chinarsquos direct and indirect ownership of solar wind waste and biomass project developers
bull Close to USD 60 billion of 2011 project developers investment flows (around 5) is actually funded by (in almost equal parts) (1) venture capital private equity and infrastructure funds on the one hand and (2) corporate actors on the other hand
ExamplesChange in the geographical origin of money - In 2011 EDP Renewables North America LLC financed three onshore wind farms in the US for a cumulative capacity of close to 600 MW Categorizing the project based on first degree ownership implies that project has been financed by a domestic project developer As we dig into the cascading ownership structures of the equity holders and categorize the project based on the ultimate ownership we determine that project has been actually financed by a foreign project developer1
Change in the type of actor ndash In 2011 China Datang Corp Renewable Power Co Ltd financed more than 15 GW of onshore wind farms in mainland China At first sight we would categorize the equity holder of the project as a domestic project developer It turns out that the developer is owned by one of the large state-owned power generation entities and therefore should be categorized as being financed by the Chinese domestic public budget2
1 EDP Renewables North America LLC is owned by EDP Renovaveis SA (Spain) in turn owned by EDP - Energias de Portugal SA (Portugal)2 China Datang Corp Renewable Power Co Ltd is owned by China Datang Corp which is held by the State-owned Assets Supervision amp
Administration Commission of the State Council (SASAC) the Peoplersquos Republic of China holding for State-Owned Entities (SOEs)
32
The Landscape of Climate Finance 2012
33
The Landscape of Climate Finance 2012December 2012 December 2012
32 Intermediaries
finance flows of the last two in particular were partially captured and the category not specifically featured in the Landscape 201127
While until recently the role played by NFIs and Sub-Regional Development Banks in the climate finance architecture has received limited attention international donors are increasingly aware of their privileged position in knowledge of and relationship with local markets This increased international focus the International Development Finance Clubrsquos (IDFC) mapping initiative (Ecofys-IDFC 2012) and their direct disclosure of data made it possible to gather more detailed information about NFIsrsquo and Sub-Regional Banksrsquo climate finance flows and have lent visibility to their contribution to a wide range of climate-compatible activities
Although we have more information on intermediariesrsquo climate finance than we did in the Landscape 2011 our estimate still represents an incomplete figure due to the partial reporting28 of some entities and our inability to capture other playersrsquo flows due to data constraints
27 The Landscape 2011 included the Brazilian BNDES IREDA and the China Development Bankrsquos climate financing featuring these entities among Bilateral Finance Institutions This year we have broaden the coverage capturing a wider range of National players as well as Sub-Regional ones such as the Development Bank of Southern African (DBSA) the Develop-ment Bank of Latin America (CAF) and the BCIECABEI Central American Bank for Economic Integration See Appendix D for details
28 A number of MDB s currently engaged in a joint initiative aimed at harmonizing mitigation and adaptation finance reporting did not disclose their adaptation finance data as yet The Joint MDB Report on Mitigation
INTERMEDIARIES ANNUAL FLOWS OF DIRECT CLIMATE FINANCE(2010 2011 USD BILLION)
PUBLIC
Development Finance Institutions (67) 768bull National and Sub-Regional Finance Institutions (37) 427a
bull Bilateral Finance Institutions (10) 113bull Multilateral Finance Institutions (18) 212bull Climate Funds (1) 15
Sub-total public (67) 768
PRIVATE
Commercial financial institutions (31) 307 - 404Venture capital private equity amp infrastructure funds (2) 24Sub-total private (33) 331 - 428
TOTAL Total 1099 - 1196
Note To avoid double counting only USD 15 billion of the USD 25 billion Climate Fund money is included in the total Climate Finance (we excluded developed to developing countries bilateral funds which we assume are accounted for in bilateral reporting in the OECD-CRS database) We acknowledge that Climate Funds are not generally associated to Development Finance Institutions here are included in this category as typically managed by DFIs or operating in closed relationship with thema Total National and Sub-regional institutionsrsquo climate financing differs from that presented in the Ecofys-IDFC report (2012) See Appendix D for details
Public and private financial institutions play an important role in climate finance flows raising and channelling USD 110-120 billion of global climate finance Public intermediaries such as Multilateral Bilateral National and Sub-Regional Development Banks distribute USD 768 billion or about two-thirds of these resources
The Landscape 2012 seeks to present a comprehen-sive picture of public and private intermediaries While several initiatives track climate finance that flows through public intermediaries there is less informa-tion about climate finance distributed through private intermediaries Their engagement is critical to identify and finance climate projects particularly small-scale ones thereby to unlock private resources and scale-up finance26
Public sector intermediariesDevelopment Finance InstitutionsIn the Landscape 2012 the public intermediaries cat-egory covers a broad range of Development Finance Institutions (DFIs) including Multilateral Bilateral Sub-Regional and National Finance Institutions The climate
26 The San Giorgio Group ldquoProsol Tunisiardquo case study presents insights on this aspect See Trabacchi et al (2012) See also for instance the Turkish Sustainable Energy Finance initiative established by EBRD to help drive the transformation in the private banking sector in supports of small and medium sized energy efficiency and renewable energy investments For more information see (Ebrdcom and Tursefforg)
32
The Landscape of Climate Finance 2012
33
The Landscape of Climate Finance 2012December 2012 December 2012
UN agencies as well as countriesrsquo cooperation agen-cies are also active intermediaries in the climate finance architecture29 the flows managed and distributed by these entities have not been included in this section to avoid double counting Their resources ndash the portion complying with ODA criteria and hence reported in the OECD-CRS database ndash are in fact captured in the Governmentsrsquo budgets data An ad-hoc study should be pursued to highlight their actual contribute which typically goes beyond pure intermediation By working closely with recipient governments on national strate-gies and policy frameworks conducive to investment in fact these entities help develop demand for climate finance (AGF 2010) With the objective to enhance the effectiveness of their actions DFIs often partner with these agencies to coordinate interventions
The resources raised and channelled by DFIs can be both of public and private nature DFIs in fact do not only operate through public budget resources (ie direct contributions from donor countries) but can also raise funds on the capital markets reinvest earnings and mobilize additional funds through co-financing (either from commercial banks financial institutions develop-ment partners or other international finance institu-tions) This allows them to support investments that are much greater than public funds can provide alone
Sources of finance vary from bank to bank depend-ing on their structure and mandates30 It is difficult to determine the portion of public budgets flowing to DFIs each year in the pursuit of development coopera-tion activities or specific mandates It is also difficult to quantify how much global capital markets contribute
Finance 2011 (IDB et al 2012) released for Rio+20 provides preliminary insights on the methodology developed and the resulting mitigation figures A new version of the report with revised and more disaggregated data is planned to be released at COP 18 in Doha The release of a report describing the jointly agreed methodology for adaptation is also planned at the same time
29 Agencies like DIFID NORAD and USAID in 2010 channelled possibly up to USD 96 billion of the bilateral climate-marked aid featured in the OECD CRS database (OECD 2010) They also played a role in the delivery of Fast-Start Finance USAID for instance serviced 27 of the US Fast-Start Finance over the FY20102011 (Fransen 2012)
30 For instance the International Development Association (IDA) ndash the larg-est multilateral channel of concessional financing to the poorest countries ndash is largely funded through donor contributions The International Bank for Reconstruction and Development (IBRD) on the other hand obtains most of its funds by issuing bonds in international capital markets In addition to general bond issuance some institutions have also initiated the issuance of climate themed bonds so called ldquogreen bondsrdquo The World Bank Group for example has issued over USD 33 billion in green bonds since the inaugural issue in 2008 (Treasuryworldbankorg)
to DFIsrsquo climate financing in a given year Clarifying this could shed light on the extent of the so-called ldquoleverage effectrdquo exerted by these entities to public money
Box 3 on government contributions to DFIs presents additional insights on this aspect
National Finance InstitutionsThe NFIs category in the Climate Finance Flows Diagram 2012 reflects a variety of players including
bull Some of the largest National Development Banks such as the Brazilian BNDES31 and the Chinese Development Bank (CDB) which contribute more than 80 of NFIsrsquo finance
bull Sub-Regional Development Banks like the Development Bank of Latin America (CAF) and
bull Relatively smaller players such as the Mexican Nacional Financiera (NAFIN) whose involve-ment and expertise in the climate finance arena are growing rapidly
With 427 billion32 NFIs represented around 567 of the total climate finance distributed by public actors (DFIs) in 2011
Although diverse and at various stages of institutional readiness for climate finance NFIs have key charac-teristics in common They bridge critical funding gaps perform in areas underserved by the private sector and implement national strategies set by their governments By partnering with MFIs andor BFIs National enti-ties can acquire relevant experience in the preparation risk assessment evaluation and monitoring of climate projects33
NFIs can have general mandates to foster broad eco-nomic and social development objectives or they can have mandates focused on specific niches ndash such as financing small- and medium-sized enterprises encour-aging infrastructure development or supporting a countryrsquos agribusiness sector (IDFC 2012)
31 In 2011 BNDES had a capital base of nearly USD 33 billion (BNDES 2012b)32 Data refers to funds committed in 2011 except for one institution that
reported its annual disbursement instead of commitments To minimize potential double counting the climate finance flows of the Indian Renew-able Energy Development Agency (IREDA) were reduced by 40 since as reported in IREDA (2012) the institutionrsquos resource base for 20102012 draws approximately 40 on international assistance
33 For instance the Sustainable Project Directorate of NAFIN ndash the bankrsquos unit dedicated to support climate-related projects received technical assistance from the World Bank and uses its methodology and manuals to manage the risks associated with renewable energy projects (IDB 2011)
34
The Landscape of Climate Finance 2012
35
The Landscape of Climate Finance 2012December 2012 December 2012
SOURCES ESTIMATED VALUE DESTINATIONS
IntE
rnal
bull Proceeds from operations NEUSD 753 BILLION In
stru
mEn
ts an
d usE
s
bull Risk management NEa
bull Carbon offset finance USD 007 billionbull Grants USD 401 billionbull Low-cost debt USD 466 billion bull Project-level market-rate debt 234 billionbull Project-level equity USD 037 billionbull Balance sheet financing USD 078 billionb
Usesbull USD 644 billion mitigation (86)bull USD 109 billion adaptation (14)
Oth
Er a
ctOr
s bull Public finance institutions bull Commercial financial institutionsbull Funds (eg climate funds carbon funds venture
capital and private equity funds)c
bull Ultimate beneficiaries
ExtE
rnal bull Public Budgets NE
bull Capital markets NEbull Other Development Finance Institutionsd
DESCRIPTION
The Development Finance Institutions featured in this study include bull National Finance Institutions (NFIs) ie entities typically owned funded and governed by a single national government with
local development mandates The climate finance flows of this players also include Sub-Regional Development Banks ie those generally supported by a group of countries in the pursuit of sub-regional mandatese
bull Bilateral Finance Institutions (BFIs) ie an individual country with the aim of providing aid contributing technical support or investing in selected development activities in developing or emerging countries
bull multiple countries encompassing both developing borrower countries and developed donor countries with the aim to provide financial and technical support to developing and emerging countries andor coordinate support among their member countries Multilateral Finance Institutions (MFIs)f
PRIMARY DATA
SOURCES
bull Self-reporting via CPI surveybull IDFC Green Finance Work Program (Ecofys-IDFC 2012)bull UNEP Bilateral Financial Institutions Climate Change Working Group (UNEP 2011)bull Joint MDB Climate Finance Tracking Initiative (IDB et al 2012)bull OECD Creditor Reporting System Aid Activities Database (OECD 2010)bull Bloomberg New Energy Finance Desktop Analysis
ISSUES ANDOR FUTURE ANALYSIS
bull Non comparability The reported estimate is derived from institutionsrsquo self reporting and secondary data sources Given the various approaches currently in place for accounting and tracking climate finance finance flows cannot be fully compared amongst this diverse group of institutionsg
bull Incompleteness To capture the true magnitude of DFIs involvement in the global climate finance landscape additional entities should be included in the analysis as well as the entire spectrum of their mitigation and adaptation financing Our estimate in fact reflects partial reporting from some MFIs which disclose mitigation finance data onlyh
bull Confidentiality concerns or lack of transparency impede actual understanding on some institutionsrsquo flowsbull Double-counting Cross financing between institutions may occur possibly resulting in double counting more research is
needed to ensure that presented flows are not inflated by such cross flowsi
a The portion of climate finance distributed in the form of risk management instruments is not included in the total actually reaching mitigation andor adapta-tion projects (see the Landscape 2012 methodology in Section 2)
b The total climate finance retrieved from the Ecofys-IDFC (2012) report for a group of NFIs was broken down against our categories of instruments according to (1st) the share stated in the report itself (ie 95 to loans and 5 to ldquoother instrumentsrdquo) (2nd) the weights observed in the financing modalities applied by the NFIs and BFIs for which we had data Due to data availability issues we allocated half of the estimated equity portion to ldquoproject-level equityrdquo and the other half to ldquobalance sheet financingrdquo
c The BFIsrsquo volume of climate finance includes investments in carbon funds and investment funds for renewable energy and clean technology projects OPIC in particular provides support to private equity funds aimed at developing nations Bancoacuteldex for instance made an investment in a relatively small venture capital fund called lsquoProgresa Capitalrsquo which focuses in the area of inter alia alternative energy (Smallridge et al 2012)
d The Mexican Nafin for instance has access to lines of credit from the World Bank and the Inter-American Development Bank (TNC 2012)
34
The Landscape of Climate Finance 2012
35
The Landscape of Climate Finance 2012December 2012 December 2012
In 2011 NFIs and Sub-Regional Development banks supported key low-carbon development sectors renewable energy projects and energy conservation accounted in fact for 509 and 262 of their mitiga-tion financing respectively Projects spanned from wind farms large-scale hydro and sustainable transport modalities or infrastructures (10) to those aimed at reducing land-use emissions via re-forestation and afforestation (23) BNDES funding to wind projects in 2011 was remarkable with USD 2 billion approved (investments of USD 32 billion) for 43 wind parks its support to the sector increased by almost three times compared to 2010 levels (BNDES 2012 see Box 7)
NFIs and Sub-Regional Development Banks also played a role in building countriesrsquo resilience to climate change devoting 12 (or USD 52 billion) of their support to measures contributing to adaptation objectives 313 of this in infrastructure improvements and 309 in the agriculture and forestry sector
NFIs and Sub-Regional Development Banks financed these activities mainly through loans at interest rates below those charged by commercial banks Low interest rate loans represented 866 of NFIrsquos climate financing BNDES stands out as a major provider of concession-ary credit that accounted for 997 of its lending This practice has helped to lower the cost of debt in Brazil the cost of debt is relatively higher in other emerging countries where NFIs such as the South African DBSA and the Indian Renewable Energy Development Agency (IREDA) financed mostly at market rates34
Unsurprisingly NFIs tend to invest domestically In fact 89 of their total climate finance was invested in the country where they are located Climate finance origi-nating from NFIs and Sub-Regional Development banks based in non-OECD countries (96 of the total) was mostly (90) directed toward domestic actions in the home country of the institution The remaining went to other non-OECD countries
Bilateral Finance Institutions (BFIs)The BFIs considered in the study include Agence Franccedilaise de Developpement and Proparco (AFD) KfW Entwicklungsbank and DEG (KfW) Japan International Cooperation Agency (JICA) and Overseas Private Investment Corporation (OPIC) Each of these BFIs have different structural characteristics and mandates AFD KfW and JICA are chiefly responsible for allocat-ing their countriesrsquo bilateral ODA contributions to other countries whereas OPIC provides financing and insur-ance to private sector investors that may help recipient countriesrsquo businesses while favouring US business interests35
In 2011 BFIs channelled about USD 113 billion in support of mitigation and adaptation interventions
Comparisons between BFIsrsquo outflows reported in the Landscape 2012 and the Landscape 2011 should be made with caution because data were obtained from different
34 The South African Government is committed to expand concessionary finance to boost investment and influence the direction of the economy (Pinheiro 2012) BNEF (2011) states that the interest rates applied by IREDA are more or less in line with those of commercial lenders and that it cannot be viewed as a source of ldquosubsidisedrdquo lending To estimate its portion of low-cost debt versus market-rate debt we associated to the former the total amount of finance committed to those sectors that in 2011 received the interest rate subsidies provided by the Indian Ministry of New and Renewable Energy to the Agency (IREDA 2012) To market-rate debt we allocated the remaining portion With regard to the high cost of debt issue see Box 9 on ldquoThe Indiarsquos experience in Financing Renewablesrdquo
35 OPIC typically supports companiesprojects that are at least 25 US-owned (OPICgov)
e NFIs and Sub-Regional Development Banksrsquo climate finance data are presented jointly as the data retrieved for some of these entities was in an aggregated form and sourced from the Ecofys-IDFC (2012) report This prevented us from associating financing to a single entity or re-allocating the related financing to a different category Sub-Regional Banks eg the Development Bank of America Latina CAF in fact can be seen as multilat-eral institutions For details on the institutions included in our estimates see Appendix D We acknowledge the presence of private players amongst banksrsquo shareholders CAF for instance has 18 shareholder countries and 14 private banks
f This definition follows that of amongst others Atteridge et al (2009) the World Bank (see WB website) and the UNFCCC (see UNFCCC website)
g MDBs are currently developing a joint approach for climate finance track-ing which has been implemented and applied to the data we received from some of the institutions covered in the study According to IDB et al (2012) ndash the first outcome of the MFIsrsquo work with a focus on mitiga-tion finance ndash the newly developed approach strives to capture only the components of a project with climate co-benefits This might not be the case as yet for other intermediaries which may account for the whole value of the project Additional work is needed to harmonize accounting methodologies enabling comparability between flows across the entire spectrum of DFIs
h Both comprehensiveness and comparability issues will partially be addressed in the future as MFIs have harmonized their adaptation and mitigation finance tracking and will jointly report their climate finance numbers Some BFIs are engaged in the discussions and hopefully these approaches will be transferred to NFIs too
i In the Landscape 2012 we tried to minimize double counting to the maximum extent possible depending on the granularity of data available Nafin for instance in 2011 financed renewable energy generation projects with USD 71 million of KfW resources This resources were not included in the total to avoid double counting In addition we were ensured that cross financing did not occur between the institutions covered in the Ecofys-IDFC report (2012) used as a source for some NFIsrsquo data
36
The Landscape of Climate Finance 2012
37
The Landscape of Climate Finance 2012December 2012 December 2012
and disaster risk reduction which in total received approximately USD 337 million more than in 2010
BFIs proved significant in channelling Fast-Start Finance contributions to developing countries AFD for instance implemented 69 of Francersquos Fast-Start Finance commitments in 2011 (USD 585 million) and also a portion of the European Commission ones (EC 2012 Minefi 2011) KfW was entrusted with 19 of Germanyrsquos Fast-Start Finance (Vieweg et al 2012)39 while OPIC in FY 2011 delivered 36 of the US total (USD 31 billion) notably increasing its share as com-pared to the previous year (8 in 2010) In a period of budget pressures OPIC ndash which operates at no net cost to the American taxpayer ndash helped the US meet its commitments at no expense to the public budget (Fransen et al 2012)
infrastructure such as mangroves39 KfW Fast-Start Finance refers to 2010-2011 Germany committed USD 473
million in 2010 and USD 603 million in 2011 Actual allocation was higher by USD 7 million in 2010 and USD 89 million in 2011
sources and categorized in a different manner36 When looking at equivalent data self-reported by the institu-tions the year-to-year variation highlights a 23 drop37 This could be because of contingency factors andor fewer projects in the pipeline The sector that expe-rienced the most significant reduction in funding was the sustainable transport sector which received almost USD 3 billion less than in 2010 (a 78 decrease mostly due to the fact that some investments have been post-poned to the beginning of next year) The agriculture forestry and land use sector and the energy efficiency sector also experienced reduced support with a 34 and 20 decrease respectively On the other hand certain adaptation measures saw increased funding such as those related to infrastructure development38
36 In last yearrsquos study data were compiled from various second-party sources and BNDES CDB and IREDA were included in this category
37 DEG has not been included in the year-on-year comparisons due to data availability issues
38 Projects in these categories include for example water infrastructure measures to improve dikes but also projects to plant or restore ldquogreenrdquo
Box 6 ndash How do NFIs finance their operations The case of BNDESNFIs have a diversified funding sources that include long-term sources of reimbursable and non-reimbursable public resources public deposits other Development Finance Institutionsrsquo resources and capital market bonds Funding diversification and the possibility of blending market and concessional resources from different actors enables NFIs to establish more attractive financing conditions for projects that are in the publicrsquos best interest
The weight of the various sources of capital can vary between the Banksrsquo capital structure and the annual inflow of resources used to finance operations
In the case of BNDES for instance the Government of Brazil funded the predominant share of the Bankrsquos total capital 817 as of the end of 2011 This share is comprised of resources from the National Treasury which contributes 497 and has been the Bankrsquos main creditor since 2010 another 285 of the total is financed by the Workersrsquo Assistance Fund (FAT) a special payroll tax (the PIS-PASEP) the Audiovisual Sectorial Fund and the National Climate Change Fund Further 34 comes from other governmental sources These funds are complemented by resources raised in the foreign market through financial market activities as well as operations with international institutions such as the Japan Bank for International Cooperation (JBIC) and the European Investment Bank (EIB) In 2011 foreign fundraising represented 36 of the Bankrsquos financing structure The remaining 147 is related to assets monetization and other obligations (BNDES 2012)
In recent years there has been a noticeable increase in the funds that BNDES receives from the Treasury while the amount of funding from international institutions has decreased steadily
In terms of capital flows over the course of 2011 756 of BNDESrsquo total net resources (USD 85 billion) came from return on credit operations while 192 came from the National Treasury The remaining was sourced from the Workersrsquo Assistance Fund and other sources
Pinheiro (2012) reports that the Bank received an annual contribution of about USD 10 billion from the Brazilian Government which is then channelled to recipients to achieve the Bankrsquos mandate
36
The Landscape of Climate Finance 2012
37
The Landscape of Climate Finance 2012December 2012 December 2012
BFIs also operate through a range of dedicated Climate Funds40 and are also active in carbon markets playing a ldquocarbon brokering rolerdquo through carbon investment funds41 The KfW Carbon Fund for instance promotes the use of carbon credits for compliance with the obli-gation under the UNFCCC while enabling and simplify-ing access to the market for buyers and sellers It also assumes or mitigates market risks (eg EU ETS III) As of December 2011 the KfW Carbon Fund contracted credit of over USD 557 million (Suennen 2012 UNEP-SEI 2011)
Multilateral Finance Institutions (MFIs)MFIs include
bull Global players like the World Bank Group
bull Regionally-oriented agencies such as the African Development Bank (AfDB) and the Asian Development Bank (ADB) and
bull Entities without a banking basis such as the EU Institutions generally identified as multilateral bodies42
MFIsrsquo financial support to climate change activities amounted to about USD 212 billion in 2011
The list of MFIs covered in the Landscape 2012 is the same as in the Landscape 2011 but our current esti-mate reflects better data quality made possible by the improved data gathering approach we adopted (ie direct reporting from the majority of the institutions 6 out of 9) and the improvements in MFIsrsquo reporting Comparisons with last year study however are not possible as we relied on different data sources with difference in scope Self-reporting data for 2010 and 2011 have not been made consistently available in some cases due to changes implemented in the accounting methodologies
In 2011 MFIs proved critical in supporting renewable energy generation projects which received 518 of
40 In 2011 for instance KfW and the German Federal Ministry for the Environ-ment launched the Global Climate Change Partnership Fund (GCCPF) a public-private initiative focused on energy efficiency and renewable energy investment for SME and private households The Danish Govern-ment IFC and Deutsche Bank also committed financing to the partnership over the course of the year (GCCPF website)
41 Last April AFD ndash along with other partners ndash announced the upcoming launch of a Carbon Fund for Africa (CDC Climat 2012)
42 The EU Institutions namely the EU Commission and the EU Development Fund are treated as multilateral bodies in the OECD DAC statistics Their climate finance data included in the Landscape 2012 refer only to their direct (ldquobilateralrdquo) contributions to developing countries (OECD 2011d)
their total mitigation finance (approximately USD 95 billion) The other two sectors that benefitted the most were energy efficiency and sustainable transport which received 194 and 184 respectively In terms of adaptation financing MFIsrsquo support was mainly directed to interventions in the agriculture and forestry sector and to capacity buildingtechnical assistance measures which received 278 and 127 of their total support to adaptation (USD 29 billion)43 Among DFIs MFIs are the ones that devoted the highest share to capacity building measures
Market rate debt was the dominant means used by MFIs for distributing climate finance (78)
Asian and European countries were the principal recipients receiving 37 (or USD 78 billion) and 271 (USD 58 billion) of the total MFIsrsquo climate finance respectively
The European Bank for Reconstruction and Development (EBRD) and the European Investment Bank (EIB) provided the greatest support to Europe (734)44 These lenders have been particularly impor-tant at a time when a deteriorated financing environ-ment has threatened the European Unionrsquos low-carbon transition The higher cost of borrowing experienced by commercial banks has in fact hampered lending which is unfortunate in times when investment needs are sig-nificant45 and action cannot be delayed (BNEF 2012b)
43 Activities with adaptation co-benefits in the transportation sector also received significant support Among the measures supported eg develop-ment of climate-resilient design standards upgrade of existing roads and highways to climate resilient design standards etc
44 Germanyrsquos KfW Group has also been a lead lender in the European clean energy sector (see Box 12)
45 For instance BNEF (2012b) states that investments in renewable energy capacity amount to more than USD 600 billion between the 2011-20 period in European Union countries alone
38
The Landscape of Climate Finance 2012
39
The Landscape of Climate Finance 2012December 2012 December 2012
Box 7 - Brazilrsquos experience in financing renewable energy with a focus on wind power
The total amount of BNDESrsquo approved financing for wind power has been dramatically increasing in recent years reaching USD 2 billion (R$ 34 billion) in 2011 which represents a 173 increase compared to 2010 (BNDES 2011)
According to US PREF (2012) BNDES reduces borrowing costs for eligible wind projects by roughly 40 BNDESrsquo favourable financing conditions also apply to other alternative technologies like biomass and small hydro and have been improving particularly since 20061 as part as BNDESrsquo mandate to incentivize ldquogreenrdquo sources of electricity According to BNDESrsquo analysis its financing offerings have contributed to a 25 decrease in renewable electricity tariffs during the 2003-2011 period
In general BNDESrsquo loans to renewable power generation projects have interest rates at 14 below those practiced for coal or oil thermal plants They also have longer repayment terms 16-20 years for renewable energy versus 14 years for conventional plants Moreover BNDESrsquo participation in renewable energy projects can reach at maximum 70-90 while for coal or oil thermoelectric plants it is at 50 (IDFC 2012)
Further by keeping fossil fuel based generation like coal and fuel oil fired thermal plants under stricter loan terms BNDES provides a competitive edge to renewable energies
Given the favourable financing environment for clean projects wind is not the only renewable resource that has experienced growth Overall BNDESrsquo disbursements to all renewable energy technologies supported by Brazilrsquos national policy have showed an upward trend in the 2003-2011 period which reflect the significant increase in BNDESrsquo volume of disbursements in the same period
In 2011 BNDESrsquo disbursements to renewable energy and energy efficiency reached about USD 72 billion (R$ 123 billion) 31 higher than in 2008
Prepared by Joana Chiavari (CPI Rio joanachiavaricpirioorg)
Based on a forthcoming CPI Report on policy approaches for promoting onshore wind power in Brazil
1 By looking at the financing conditions applied by the Bank over the 2003-2011 period we noted that in 2006 for instance the amortization period increased from 12 to 14 years and then in 2007 to 16 years Moreover the Bank lowered its basic return requirement from 25 to 15 in 2006 decreasing this further in 2007 to 1 and 2008 to 09
The Brazilian development bank BNDES is essential to Brazilrsquos renewable energy energy efficiency and deforestation financing
38
The Landscape of Climate Finance 2012
39
The Landscape of Climate Finance 2012December 2012 December 2012
Climate Funds
In recent years a number of climate-specific funds have been set up46 which could also be categorized as
bull bilateral funds financed by single donor countries with one or more recipient country
bull multilateral funds financed by more than one donor country with more than one recipient country
bull national and regional funds established and managed by one or more recipient countries
46 In multiple cases pre-existing environmental and conservation trust funds are channeling climate related resources Some such funds have even been (or are in the process of being) accredited as National Implementing Enti-ties for the Adaptation Fund (eg ldquoProtected Areas Conservation Trustrdquo for Belize and the Micronesia Conservation Trust for the Federated States of Micronesia)
to channel resources from one or more donor country and or domestic resources
While our estimates show that Climate Funds com-mitted USD 25 billion in total to projects in 2011 we include only 15 billion in the Landscape 2012 after deducting bilateral funds (USD 1 billion) which are already accounted for under countriesrsquo bilateral reporting Our estimate is based on the Heinrich Boumlll Stiftung (HBF) and the Overseas Development Institute (ODI)rsquos Climate Funds Update database reporting by the organizations managing individual Funds as well as the UNDP Multi-Partner Trust Fund Office website We find that existing Climate Funds mostly channel donor money in the form of grants47 Our estimates
47 The Adaptation Fund is an exception in that while it channels grants its main source of finance is the monetization of 2 of CDM credits issued The Amazon Fund also has a particular model for raising finance ndash it is a
SOURCES ESTIMATED VALUE DESTINATIONS
IntE
rnal bull Government Budgets NE
USD 15 BILLION In
stru
mEn
ts an
d usE
s bull Grants USD 1446 millionbull Low-cost debt USD 8 millionbull Project-level equity USD 17 million
Usesbull USD 1142 million mitigation (76)bull USD 352 million adaptation (24)
ExtE
rnal
bull Government Budgets NEbull Commercial financial institutions NEbull Institutional investors NEbull Bilateral and Multilateral Financial Institutions NE Ot
hEr a
ctOr
s bull Channels multilateral regional and national implementing entities
bull End recipients governments NGOs and the private sector
DESCRIPTION
bull Climate funds pool resources from donors and domestic sources to support low-carbon climate-resilient development projects Funds usually have a finite lifetime and a specific sectoral focus eg renewable energy adaptation forestry etc In many cases multilateral financial institutions channel funds to recipients and provide financial environmental and social safeguards However there is a trend towards establishing greater national ownership and control of these funds
PRIMARY DATA
SOURCES
bull Self-reporting by Funds bull Overseas Development Institute (ODI) Heinrich Boumlll Stiftung (HBF) Climate Funds Update websitebull UNDP Multi-Partner Trust Fund Office Gatewaybull Fundsrsquo Annual Reports
ISSUES AND FUTURE
ANALYSIS
bull Challenges in tracking climate finance delivered through climate funds remain in particular there is a risk of double counting with reporting from bilateral and multilateral organizations
bull More tracking efforts are needed to unveil the current contribution and role of existing National Fundsa
Note To avoid double counting we carry forward in our calculations only USD 15 billion of Climate Fund money identified (USD 25 billion) excluding developed to developing country bilateral funds which we assume are accounted for in bilateral reporting and accounted for in the government budgets category It is assumed that multilateral institutions managing funds do not include climate fund money in their climate finance reporting and hence that there is no double counting Furthermore co-funding often provided by multilateral organizations is not considered in the above estimates of climate fund moneya For instance Bangladesh has two Climate Funds the Bangladesh Climate Change Trust Fund (BCCTF) established in 2010 by the local government and funded
with resources from the national budget and the Bangladesh Climate Change Resilience Fund (BCCRF) created at the same time to pull funds from donor countries The BCCTF is resourced entirely from the governmentrsquos own budget with USD 100 million in 2009 2010 and 2011 in the form of an endowment Other developing countries such as the Maldives have also established similar national funds (Khan Hannan et al 2011 Gomez-Echeverri 2010)
40
The Landscape of Climate Finance 2012
41
The Landscape of Climate Finance 2012December 2012 December 2012
do not include co-funding which is often provided at the project level A detailed breakdown of data by Fund is provided in Appendix E The Landscape 2012 esti-mate represents a reduction from the Landscape 2011 estimate (upper bound USD 32 billion) which is a reflection of improvements in data sources in particu-lar better annual project approval volume data not a reflection of a reduction in the contribution of the funds
Multilateral organizations such as the World Bank and other UN agencies typically provide trustee and administrative services to manage multilateral and some national funds lsquooff-balance sheetrsquo as well as act as lsquoImplementing Agenciesrsquo to channel funds to local recipients and monitor implementation Bilateral funds are typically administered by donor development agencies Recipient countries are however increasingly seeking lsquodirect accessrsquo to funds both through National Implementing Entities48 which can access project funds directly instead of through an international implement-ing entity and by setting up nationally governed Climate Funds
performance-based fund securing contributions from donors on the basis of demonstrated reductions in the annual deforestation rate The Climate Investment Funds while financed mainly with grant contributions also re-ceived donorsrsquo money in the form of capital and loans and extend grants concessional loans and guarantees via MFIs (Climateinvestmentfundsorg)
48 For instance the Adaptation Fund has now accredited 12 National 10 Multilateral and one Regional Implementing Entities
The Green Climate FundIn future years the Green Climate Fund may become an important additional climate fund but it is not yet operational In 2010 Parties to the UNFCCC established the Green Climate Fund with the aim of providing ldquoscaled-up predictable and adequate fundingrdquo to support projects programs policies and other climate-related activities in developing countries In 2011 the Conference of Parties approved the governing instrument for the Green Climate Fund and with the Fundrsquos first meeting in August 2012 the Board is now taking the first steps towards operationalizing the Fund It is not yet clear however how much and when finance will actually flow through the Green Climate Fund
ExampleThe Climate Investment Funds consist of two multi-donor trust funds the Clean Technology Fund and the Strategic Climate Fund The latter is made up of three programs the Forest Investment Program the Pilot Program for Climate Resilience and the Scaling Up Renewable Energy in Low Income Countries Program The Climate Investment Funds are the single biggest set of Funds dedicated to climate finance holding USD 72 billion in pledged funding from 14 donor countries So far they have programmed over USD 6 billion for 48 developing countries with over 200 projects already financed (Climateinvestmentsfundsorg EBRDcom)
Operational since 20082009 and administered by the World Bank each Fund has a specific purpose The Clean Technology Fund is aimed at projects with large-scale emissions reduction potential and provides loans at terms which are even more favourable than most development banks The Forest Investment Program supports the strengthening of enabling environments and investments addressing the drivers of deforestation in eight countries The Pilot Program for Climate Resilience pilots and demonstrates ways in which climate risk and resilience can be integrated into core development planning and implementation The Scaling Up Renewable Energy in Low Income Countries Program supports the deployment of renewable energy in the least developed countries According to HBF and ODIrsquos Climate Funds Update the Clean Investment Funds have so far disbursed USD 148 million to recipients
40
The Landscape of Climate Finance 2012
41
The Landscape of Climate Finance 2012December 2012 December 2012
Private sector intermediaries
Commercial financial institutionsIn the Landscape 2011 commercial banks were catego-rized without any estimates of amounts involved In the Landscape 2012 wersquove been able to estimate a portion of this category that relates to renewable energy project finance We find that commercial financial institutions contributed 9-10 of total global climate finance
We estimate that 38-50 of commercial financial institutions contributions come from domestic financial institutions while 50-62 of contributions are from institutions in foreign developed countries (European and Japanese investment banks are notable contribu-tors to other countries) Developing countries received 23-42 of this finance while developed countries received 58-77
SOURCES ESTIMATED VALUE DESTINATIONS
IntE
rnal bull Reinvested earnings from recurrent and exceptional
income NEUSD 307 ndash
404 BILLION
Inst
rum
Ents
bull Risk management NEbull Carbon offset finance USD 22 billionbull Low cost debt USD 01 ndash 11 billionbull Project-level market rate debt USD 274 ndash 357
billionbull Project-level equity USD 03 ndash 04 billionbull Balance sheet financing USD 08-11 billion
ExtE
rnal
bull Changes in net debt and equity from third-party NE
OthE
r act
Ors
bull Lending to all other actors of the landscape on a balance sheet basis NE
DESCRIPTION
Commercial financial institutions or commercial banks include all the sources of private debt capital These include but are not limited to
bull Profit-driven investment banksbull Carbon brokers and fundsbull Banks and insurance companies providing risk management solutions
PRIMARY DATA SOURCES
bull Bloomberg New Energy Finance and UNCTAD FDI databull Ecosystem Marketplace State of the Voluntary Carbon Markets Report
ISSUES AND FUTURE
ANALYSISbull Commercial financial institutionsrsquo contributions to ldquoactoror project sponsor-level debtrdquo are hard to measure and analyze
ExamplesClose to 600 MW of Spanish solar PV and thermal capacity was financed on a project finance basis in 2011 Spanish banks such as Banco Santander BBVA or Banco Espanol de Credito were instrumental in contributing project finance debt to solar project developers Other European (Portugal Germany France Italy and the Netherlands) and Japanese banks played an important role as well
For the Landscape 2012 we find that most of the projects developed are financed on a balance sheet basis ie the project developers raise money for all their activities without specifically earmarking projects Since we are unable to relate this funding to the emissions reduction projects and that information is scarce we do not include this in our estimate for commercial financial institutions
42
The Landscape of Climate Finance 2012
43
The Landscape of Climate Finance 2012December 2012 December 2012
Venture capital private equity and infrastructure fundsThe direct contribution of venture capital private equity and infrastructure funds to emissions reduc-tion projects is in excess of USD 24 billion for the year 2011
We estimate that 55-56 of venture capital private equity and infrastructure fundsrsquo contributions come from domestic sources while 44-45 come from foreign developed countries Developing countries received an estimated 15 of venture capital private equity and infrastructure climate finance while devel-oped countries received 85
SOURCES ESTIMATED VALUE DESTINATIONS
IntE
rnal bull Reinvested earnings from recurrent and exceptional
income NE
USD 24 BILLION
Inst
rum
Ents
bull Project-level equity USD 10 billionbull Balance sheet financing USD 14 billion
ExtE
rnal bull Changes in net debt and equity from third-party
(investors) NE
OthE
r act
Ors
bull Investing into other actors of the landscape on a balance sheet basis (corporate actors and project developers) NE
DESCRIPTION
This category capturesbull Venture capital fundsbull Private equity fundsbull Infrastructure funds
PRIMARY DATA SOURCES bull Bloomberg New Energy Finance and UNCTAD FDI data
ISSUES AND FUTURE
ANALYSIS
bull Private equity fundsrsquo investment into emissions reduction technology manufacturers (wind turbines solar panels etc) which are also involved in the deployment and financing of projects is difficult to estimate
ExamplesGroups such as Barclays Infrastructure Funds Management Ltd and Triodos Bank contributed to European wind and solar projects in 2011 They typically invest in a diversified portfolio of energy and or infrastructure assets or businesses (not necessarily all related to emissions reduction) on behalf of investors into such funds The investors behind these funds are typically institutional investors and wealthy individuals
42
The Landscape of Climate Finance 2012
43
The Landscape of Climate Finance 2012December 2012 December 2012
33 Instruments
Most climate finance ndash USD 276-310 billion out of a total USD 343-385 billion ndash can be classified as investment or more generally instruments that include ownership or claims Key instruments delivering these investments include balance sheet financing (59) project-level market rate debt (16) and low-cost debt (15) Other categories of instruments such as carbon offset flows grants and project-level equity make up the remainder of climate finance
The instruments considered in our analysis correspond to all the economic49 and financial instruments50 used in the deployment of emissions reduction projects Financial support can either be given directly to specific projects andor local implementing entities using a variety of instruments or it can assist national policy efforts Building upon the Landscape 2011 we consider six major categories of instruments (i) policy incen-tives (ii) risk management (iii) carbon offset finance (iv) grants (v) low-cost debt and (vi) capital instru-ments including project-level market rate debt project-level equity and balance sheet financing51 While not necessarily comprehensive these categories aim to capture the major instruments used to deliver climate finance
Policy IncentivesPolicy incentives include income-enhancing mecha-nisms such as feed-in tariffs tradable certificates tax incentives and clean energy subsidies which are most commonly funded domestically Many emerging economies in particular have started to use income-enhancing mechanisms to stimulate clean energy investment As discussed in the methodology section we do not report an estimate for total policy incentives finance given the risk of double counting (both invest-ment money and future revenues from the investment
49 ldquoA means by which decisions or actions of government affect the behav-iour of producers and consumers by causing changes in the prices to be paid for these activitiesrdquo (OECD Glossary of Statistical Terms available here httpstatsoecdorgglossarydetailaspID=6408)
50 ldquoA financial instrument is any contract that gives rise to a financial asset of one entity and a financial liability or equity instrument of another entityrdquo (IFRS IAS 32 Financial Instruments Presentation available here httpwwwifrsorgDocumentsIAS32pdf)
51 There is a large share of debt sitting behind balance sheet financing as project sponsors often obtain corporate loans or issue corporate bonds
to remunerate the investor) However the category of policy incentives is included in the Climate Finance Flows Diagram 2012 as policy incentives play a critical role in attracting climate finance at the investment stage
Risk Management
Official long-term export credits Export credits can be provided by or on behalf of gov-ernments and can take the following three forms (i) official direct support (loans) (ii) private export credit with repayment insurance (iii) private export credit with repayment guarantee (Buchner et al 2011)
In 2009 the share of export credits available to clean energy sectors (renewable energy and co-generationdistrict heating) rose to USD 07 billion (OECD statis-tics on export credits 2010 as cited in Buchner et al 2011) While more recent data is not yet available we might expect the proportion of climate specific export credits to increase given an agreement this year by OECD countries to incentivise export credit support for climate mitigation projects (including flexible repayment structures and longer tenors for advanced technologies and energy efficiency) while maintaining stricter financial terms and conditions for fossil-fuel based projects (OECD 2012)
It is worth noting that export credits of types (ii) and (iii) outlined above are paid to the exporter and there-fore technically represent a developed to developed country flow Furthermore these types of export credits may not be used and may not therefore represent a true flow of climate finance More detailed data is there-fore required to gain a better understanding of the role of export credits in stimulating private low-emission investments in developing countries
GuaranteesGuarantees are used to mitigate the risks involved in clean investments These can include risks related to non-payment technology performance or the fulfill-ment of obligations by government and affiliated agen-cies vis-agrave-vis a given project Based on our review of DFIrsquos flows we estimate annual guarantees in support of climate mitigation and adaptation to be at least USD 18 billion On top of this government budgets contributed a non-estimated amount of climate finance for loan guarantees (for instance through the US Department of Energy loan guarantee program for US solar projects in 2011)
Although money relative to guarantees is typically
44
The Landscape of Climate Finance 2012
45
The Landscape of Climate Finance 2012December 2012 December 2012
accounted for by financial institutions acting as guaran-tors52 we do not report the notional amounts relative to guarantees as tangible flows for in the course of our reporting period Guarantees do not need to be exer-cised there is a chance there will never be any outflow for the guarantor (for more details please refer to the methodology section) However guarantees certainly play a central role in clean investment decision-mak-ing and will be the focus of forthcoming CPI work
Carbon offset financeCarbon offsets aggregate public and private money for emissions reduction commitments or to meet voluntary objectives Payments for carbon offsets go to various offset projects currently most of these projects are related to the Kyoto Protocolrsquos Clean Development Mechanism (CDM) and Joint Implementation (JI) Apart from actors on the smaller but growing volun-tary market main players are compliance entities and
52 And they usually set aside provisions reducing their ability to invest in or lend to climate finance projects
intermediaries in regional and national systems (such as the EU Emissions Trading System - EU ETS - and the JVETS) and countries with Kyoto Protocol com-mitments Offset buyers can acquire offsets directly via carbon offset brokers or via carbon procurement funds This instrument category comprises all offsets markets in which primary carbon offsets can be pur-chased for cash
We estimate that carbon offset flows totalled between USD 465 and USD 475 billion in 2011 Our estimate includes only the incremental cost linked to carbon offsets not the investment costs of correspond-ing emissions reduction projects
This range is based on available data from the World Bank the UNFCCC IGES and Ecosystem Marketplace and is an increase compared to the Landscape 2011 estimate (USD 17 ndash 20 billion) mainly thanks to the increased CER issuance by the UNFCCC (although there were lower prices) and improved data visibility on ERU issuance
INSTRUMENTS ANNUAL FLOWS OF DIRECT CLIMATE FINANCE(2010 2011 USD BILLION)
INSTRUMENTS FOR INCREMENTAL COST
Policy incentives NOT ESTIMATED
Risk management NOT ESTIMATED
Carbon offset finance (1) 47 - 48
Grants (3) 98 - 156
Low-cost debt (15) 527 - 542
Sub-total instruments for incremental costs (19) 672 - 747bull public sources (4) 102 - 166bull private sources (1) 26
bull public intermediaries (14) 522bull private intermediaries (1) 23 - 33
INSTRUMENTS FOR CAPITAL COST
Project-level market rate debt (16) 527 - 621
Project-level equity (6) 200 - 235
Balance sheet financing (59) 2031 - 2248
Sub-total instruments for capital cost (81) 2758 - 3104bull public sources (2) 58 - 61
bull private sources (62) 2145 - 2401bull public intermediaries (7) 246
bull private intermediaries (10) 309 - 396
TOTAL
Total 3430 - 3850bull public sources (5) 160 - 227
bull private sources (63) 2171 -2427bull public intermediaries (21) 767
bull private intermediaries (10) 332 - 429
44
The Landscape of Climate Finance 2012
45
The Landscape of Climate Finance 2012December 2012 December 2012
GrantsGrants are transfers in cash or in kind for which recipi-ents do not incur any legal debt (OECD 2007b) Grants can play an important role in reducing upfront project investment costs and meeting viability gaps for projects that are more expensive than the business as usual Grants can also include support to enhance the enabling environment for investments through for instance knowledge management programs technical assistance and capacity building
In the Landscape 2012 we find that 35 (USD 13 billion) of total identified climate finance flows in 20102011 were delivered in the form of grants This is three times the amount of grants identified in the Landscape 2011 This figure can be considered an underestimate as it lacks data on grant contributions from developing country governmentsrsquo to domestic clean energy
In 2010 37 (USD 7 billion) on average of direct government budget flows were delivered in the form of ODA grants The top providers of grants as reported in the OECDrsquos CRS database were the UK Japan Norway and Germany Combined with grants provided by DFIs and Climate Funds we estimate on average 13 of total ldquopublicrdquo contributions were provided in the form of grants (USD 125 billion) Meanwhile just 02 of private finance was delivered as grants and originated from philanthropic contributions
While there is no comprehensive overview of the global extent of philanthropic contributions to climate-specific projects Vrana and Cracknell (2011) cite a range of studies which have reviewed environmental grant-making by foundations in the UK the US Canada Australia and New Zealand
Vrana and Cracknellrsquos (2011) review of environmental funding by European foundations suggests that climate change relevant grants reached around USD 53 million53 annually over the period 2008 ndash 2009 an estimated 13 of which flowed to end beneficiaries in develop-ing countries and the remainder to Europe and North America We assume a 5050 split between mitigation and adaptation activities for this figure54
Meanwhile the Environmental Grantmakers
53 This figure is expected to be an underestimate as it was based on a limited number of foundations and excluded environmental grants which were not more specifically marked for sector relevance
54 39 of EUR 37 million is reported as energy and transport It is not clear what percentage of activities reported as ldquoclimate and atmosphererdquo are for mitigation versus adaptation
Association (2012) estimates the contribution of US foundations to the ldquoclimate and atmosphererdquo area in 2009 to have been between USD 158 ndash 215 million55 60 of this finance stayed in the US 6 flowed to North America and Europe and 34 was directed to the rest of the world including Asia Africa Central and South America We exclude an additional USD 150 ndash 165 million worth of grants to energy and transport related activities given that there is no way to deter-mine the share of those grants that went to fossil fuel related activities We therefore estimate that a total of approximately USD 211 ndash 268 million in philanthropic contributions went to climate projects in 20082009
ExampleJICA supports a variety of climate projects around the world through grants In Kenya for example JICA supports a program that helps communities adapt to floods and develop infrastructure such as evacuation facilities In Vietnam JICA supports low-carbon development through integrated grant and project loan packages and technical assistance to support physical infrastructure development capacity building and policy development JICA also provides grants that encourage infrastructure projects to engage Japanese firms the Agency provides funding for preparatory studies and helps finance infrastructure that will be later operated by private players Source Inaka (2011)
Low-cost debtLow-cost debt is financing provided at terms prefer-able to those prevailing on the market including for example longer repayment terms lower interest rates and higher levels of participation in investments Low-cost debt includes concessional loans
The biggest low-cost debt providers are Development Finance Institutions and governments Loan conditions vary greatly between individual institutions and proj-ects The terms of loan repayments are important for engaging the private sector but at the same time providers need to avoid over-subsidization and to increase the value obtained for public money It is not however possible to comment on the terms of debt due
55 Lower value includes projects marked as pertaining to the specified focal area as a ldquoprimary issuerdquo while the higher value includes overall giving (primary and secondary issue)
46
The Landscape of Climate Finance 2012
47
The Landscape of Climate Finance 2012December 2012 December 2012
to a lack of aggregated data figures presented here are gross rather than net flows
Up to 146 (USD 535 billion) of total climate finance flows captured in the Landscape 2012 are delivered in the form of low-cost debt These flows are entirely from public sources in particular National Finance Institutions (indeed 866 of their financing or USD 37 billion is delivered through low-cost debt) Bilateral Finance Institutions (which use low-cost debt to deliver 62 or USD 7 billion of their climate financ-ing) and directly from governments (32 or USD 62 billion on average of government climate financing is delivered through low-cost debt) This compares to just USD 126 billion worth of concessional loans identified in the Landscape 2011 reflecting the extended coverage of DFIsrsquo flows and in particular NFIs in the Landscape 2012
The central role of BNDES in the rapid expansion of wind and other renewable energy sources in Brazil in
recent years is highlighted in Box 7 Here low-cost debt has reduced borrowing costs for investors by around 40 and in turn reduced renewable electricity tariffs by around 25
Capital instrumentsThe capital instrument category tracks the trans-formation of capital contributions into shareholder ownership (equity) creditor claims (debt loans bonds etc) and hybrid capital instruments Any source or intermediary may contribute capital Capital contributions are registered in specific mitigation and adaptation investment project balance sheets Capital is returned to contributors in two forms first as dividends and changes in the market value of the shares held for equity holders and second as coupons or interim inter-est payments and return of principal for debt holders
In the Landscape 2012 we split investment capital
Examples ndash Mexicorsquos Renewable Energy Financing Facility (REFF)1
The REFF was established within the Mexican Nacional Financiera (NAFIN) to address the renewable energy financing gap by encouraging private sector investment REFF provides
bull direct loans with long repayment terms (about 10-15 years) and fixed interest rates to project developers to finance the construction of new renewable energy projects and support their financing needs during their life and
bull contingent credit lines to cover transitory cash flow shortages during the project lifecycle (eg due to lower than expected energy generation or prices) up to the volume needed to service senior debt
As shown in the figure below NAFIN channels international funds from the Inter-American Development Bank and the Clean Technology Fund combining them with its own to attract private capital It is expected that the facility will ultimately reach a total value of USD 540 million Providing a maximum of USD 10 million to individual projects it is expected that the facility will contribute to investments with a total capital value of up to USD 1540 million2
1 Source Visconti et al (2012) Smallridge et al (2012) based on IDB (2011)
2 This figure is estimated considering a total 1000 MW of installed generation capacity and investment costs of USD 2-25 million per MW (IDB 2011)
Source Smallridge et al (2012) based on IDB (2011)
46
The Landscape of Climate Finance 2012
47
The Landscape of Climate Finance 2012December 2012 December 2012
sources into three major categories56 project-level market rate debt project-level equity and balance sheet financing
Project-level market rate debt worth USD 527 ndash 621 billion went towards emissions reduction projects in 2011 The debt is being repaid on the revenues gener-ated by the emissions reduction project rather than its sponsor (non-recourse debt) This is mostly project finance debt but by extension we include project bonds lease financing and other financing techniques in this category Unsurprisingly the largest contributors were commercial financial institutions (USD 274 ndash 357 billion) More interestingly a significant portion of project-level market rate debt came from other actors notably vendor financing for technology manufacturers
We find that project-level equity worth USD 200 ndash 235 billion was directed to emissions reduction projects in 2011 This is the equity counterpart of project-level market rate debt
Balance sheet financing (or sponsor-level financing) worth USD 2031 ndash 2248 billion went towards emis-sions reduction projects in the year 2011 This category corresponds to investment capital raised at the sponsor level rather than at the project level The largest con-tributors to this type of instrument are project develop-ers (USD 974 ndash 1097 billion) corporate actors (USD 650 ndash 741 billion) and households (around USD 321 billion) From an analytical standpoint it is impossible to determine the sources of balance sheet financing for several reasons First sponsor-level capital includes various sources of capital reinvested earnings from the sponsorrsquos activities equity from shareholders and debt from lenders (commercial financial institutions for loans and credit lines institutional investors and mutual funds for bond and notes) Second the money raised at the sponsor level is not earmarked Third it is challenging to come up with a simple estimate to break down balance sheet financing into debt and equity components Sponsor financing practices and economic circumstances vary across industries and countries For example in India project developers must overcome difficulties securing corporate debt whereas in Europe utilities can use regular borrowing programs more easily Moreover we cannot merely look at sponsorsrsquo balance sheets for guidance as the mix of capital sources for emissions reduction projects will not
56 In order to make the instrument categories mutually exclusive any amount categorized as lsquocapitalrsquo should be free of any form of support from other instruments (subsidies carbon offsets etc) and should only represent the net lsquocapitalrsquo dedicated to investments
necessarily be the same as the mix of capital sources for all projects
48
The Landscape of Climate Finance 2012
49
The Landscape of Climate Finance 2012December 2012 December 2012
Box 9 ndash Indiarsquos experience in financing renewable energy
India which is already the worldrsquos fifth-largest market for wind power has set ambitious targets for both wind and solar generation These targets of 20 GW for solar (by 2022) and 31 GW for wind (by 2017) will require massive investment for an economy already facing competing needs for investment in energy and infrastructure more generally A plethora of renewable policy abounds at the state level and the federal government offers its own policies ndash such as accelerated depreciation and the renewable energy certificate (REC) market ndash but all of these policies are likely to be undermined by the state of Indian financial markets and their regulation
In particular Nelson and Shrimali et al (2012) found that in the short term the interest rates and terms for debt may raise the cost of renewable energy by 24-32 compared to similar projects financed in the US and Europe The high cost of debt wipes out all or most of the cost advantages India might otherwise have and makes renewable energy much less competitive against conventional alternatives There are also signs that in the longer term debt will become increasingly hard to secure even at high costs which could put targets beyond reach for both cost and financing reasons
The main causes of high interest rates for renewable energy projects lie in the general financial market conditions of the country Growth high inflation competing investment needs and country risks all contribute A shallow bond market regulatory restrictions on foreign capital flows and heavy government borrowing add to the problem while the cost of currency swaps and country risk negate the advantages that could come from access to lower-cost foreign debt
While there is agreement in India that debt markets might be a problem there is less agreement as to the precise nature of this problem or potential solutions Discussions with analysts operating in the country revealed the existence of a gap between risks perceptions and expected returns from renewable energy projects in India To bridge this gap several initiatives have been taken by multilateral banks to establish risk guarantee funds For instance the Asian Development Bank and the Indian Government set up a partial risk guarantee fund in which they cover all risks and pay 50 of the default value at a nominal premium But such measures have struggled so far as project developers are unwilling to pay a high premium for such insurance coverage
In other rapidly developing countries facing high interests and competing investment demands such as Brazil renewable energy investors rely partly on concessionary support from National Development Finance Institutions However in India the deregulation of financial markets that occurred in the early lsquo90s has in fact led many National Finance Institutions to convert themselves into commercial banks that cannot make concessionary loans Further analysis is needed to evaluate what lessons can be learned from experience in places like Brazil or China and how these lessons could be adapted to the Indian context
Prepared by Shobhit Goel (CPI Hyderabad shobhitgoelcpihyderabadorg)
Based on Nelson Shrimali et al (2012) ldquoMeeting Indiarsquos Renewable Energy Targets The Financing Challengerdquo CPI Report (forthcoming)
The high cost of debt is the most pressing problem currently facing renewable energy financing in India
48
The Landscape of Climate Finance 2012
49
The Landscape of Climate Finance 2012December 2012 December 2012
34 Disbursement channelsDisbursement channels are organizations that work directly to disburse funds for climate mitigation and adaptation projects including organizations from the public57 and private sector public-private partnerships (PPPs) local financial institutions and banks multilat-eral organizations non-governmental organizations and civil society They may be local regional national or international organizations
There is no aggregated information available on the split of finance by type of disbursement organization but examples from specific investments or organizations can help to shed light on current patterns and best prac-tice For instance Germanyrsquos KfW collaborates with a range of local financial institutions including micro-banks commercial banks refinancing institutions village savings banks non-governmental organizations and regional and supra-regional micro-finance funds to build up micro and small enterprises
Public climate finance from developed to developing countries is sometimes provided directly to recipient governments or government agencies for distribution to end recipients More often however for efficiency and to ensure environmental social and economic safeguards are applied donors channel money through international organizations (eg UNDP UNEP or Multilateral Finance Institutions) or large reputable and often international non-governmental organiza-tions This has also been the operational mode of many international Climate Funds For instance the Clean Technology Fund the World Bank Group the African Development Bank the Asian Development Bank the European Bank for Reconstruction and Development and the Inter-American Development Bank act as implementing agencies working alongside local execut-ing agencies who actually implement projects The Adaptation Fund is an exception in that a number of National Implementing Entities have been accredited to receive money directly from the Fund (see Section 32 on Climate Funds)
There is often a complex web of relationships involved in implementing a project For instance the Clean Technology Fund awarded low-cost debt to Ouarzazate I a Moroccan Concentrated Solar Power plant However this debt is channeled through the African Development Bank and International Bank for Reconstruction and Development then passed to the Moroccan Agency for Solar Energy (MASEN) which
57 Public organizations including government ministries departments programs and agencies
provides debt financing to a public private partnership Special Purpose Vehicle which will build and operate the plant (see Falconer and Frisari 2012)
Regardless of the geographic nature of climate finance flows and whether they are public or private the types of organizations engaged to disburse and implement climate finance are of crucial importance shaping the capacity available to implement and scale up low emissions and climate resilient activities In particu-lar engagement of local organizations is important to ensure capabilities are transferred or built up locally rather than being isolated in international organizations
35 Uses
Mitigation measures received the bulk of climate finance around USD 350 billion The private sector money captured in the Landscape 2012 accounted on average for USD 268 billion about 73 of the total and was directed towards renewable energy generation projects wind and solar in particular
Governmentsrsquo climate finance was also strongly focused on mitigation measures (87) This reflects low-carbon development ambitions and commitment to supporting structural changes in energy systems seen as engines of economic growth
Public financial institutions also played a pivotal role in the support of clean energy investment allocating more than 60 of their climate flows to renewable energy and energy efficiency measures By packaging
In 20102011 mitigation measures attracted USD 350 billion out of USD 364 billion This is largely the result of significant capital investments in mitigation measures like renewable energy
Data on REDD+ finance are poor but suggests that flows could be around USD 118 billion per year predominantly from domestic government contributions
Adaptation interventions received USD 123 to USD 158 billion primarily in the form of incremental cost payments While there has been some progress in tracking adaptation finance since the Landscape 2011 weaknesses in defining and tracking adaptation finance partial reporting by some multilateral players and the inability of existing efforts to capture private flows dedicated to such activities continued to hamper our understanding of adaptation finance flows
50
The Landscape of Climate Finance 2012
51
The Landscape of Climate Finance 2012December 2012 December 2012
financing instruments tailored to address market fail-ures they can close the viability gap of clean technolo-gies to help them mature and become self-sustaining They can also provide access to long-term financing for these projects otherwise not readily available in local capital markets
MitigationWhat does the private sector finance
We find that the private sector (both private sources and intermediaries) contributed USD 2503 ndash 2855 billion towards the total of global climate finance in 20102011 (74 of the total) All that money went to climate change mitigation This reflects both the difficulties in estimating private sector adaptation finance (even though households and corporate actors do engage in autonomous adaptation activities) and the constraints of the global datasets to which we had access (Bloomberg New Energy Finance and UNCTAD Foreign Direct Investment data for renewable energy asset finance and REN21 and Frankfurt School of
Finance amp Bloomberg New Energy Finance for small-scale renewable energy)58
The total amount breaks down into
bull USD 833 billion for small-scale investment USD 737 billion for solar PV and USD 94 billion for solar water heaters and coolers
bull USD 1623 ndash 1975 billion for larger renewable energy asset finance corresponding to an extra capacity of 67 GW (more than 67 for wind and more than 20 for solar technologies) and
bull The remainder to carbon offset finance
The largest private contributors to mitigation invest-ment were project developers (USD 1160 ndash 1303 billion) corporate actors (USD 693 ndash 805 billion) and commercial financial institutions (USD 307 ndash 404 billion) Private sector investment relied on contributions from public sources and intermediaries
58 Please note that given the data constraints data on energy efficiency is lacking Ryan et al (2012) estimate that about USD 23 billion in DFIsrsquo financing leveraged about USD 46-184 billion in energy efficiency invest-ments in developing countries in 2011 depending on the leverage ratio (2 or 8)
Table 1 Climate finance breakdown of sources into mitigation and adaptation fundsa
SOURCES amp INTERMEDIARIES MITIGATION(USD BILLION)
ADAPTATION(USD BILLION)
TOTAL (USD BILLION)
PROJECT DEVELOPERS 1150 ndash 1293 NE 1150 ndash 1293
CORPORATE ACTORS 693 ndash 805 NE 693 ndash 805
HOUSEHOLDS 323 NE 323
INSTITUTIONAL INVESTORS 06 NE 06
COMMERCIAL FINANCIAL INSTITUTIONS 307 ndash 404 NE 307 ndash 404
VENTURE CAPITAL PRIVATE EQUITY AND INFRASTRUCTURE FUNDS 24 NE 24
GOVERNMENTS BUDGETS 149 ndash 182 10 ndash 44 159 - 226
NATIONAL FINANCE INSTITUTIONS 375 52 427
MULTILATERAL FINANCE INSTITUTIONS 183 29 212
BILATERAL FINANCE INSTITUTIONS 86 27 113
CLIMATE FUNDS 11 04 15
TOTAL 3307 ndash 3693 123 ndash 157 3430 ndash 3850
Note Figures represent annual flows for the latest available year (20102011) variable according to the data sources (2010 for OECD DAC members and EU Institu-tions 2011 for all the other organizations) Most data presented relate to commitments in the given year disbursement data are included for one DFI only The figures do not add up to the total exactly because of roundinga Philanthropy which is not included in the table due to the materiality of the flow accounts for about USD 211-268 million which due to lack of information we
assume is split equally between mitigation and adaptation (around USD 120 million to each)
50
The Landscape of Climate Finance 2012
51
The Landscape of Climate Finance 2012December 2012 December 2012
instruments addressing incremental costs but also access to debt financing both at the project level and at the sponsor level
What does the public sector finance
Governments and public financial intermediaries invested USD 804-837 billion in mitigation mea-sures in 20102011 Development Finance Institutions contributed USD 644 billion or 784 of the total Renewable energy and energy efficiency received 54 and 18 of total public mitigation financing respectively The sustainable transport sector received a significant amount of climate funds 10 of the total mainly from National Finance Institutions and Multilateral Finance Institutions
In particular NFIsrsquo climate finance activities highlight the domestic emphasis which is driven by the low-carbon development strategies of the countries they operate in or to which they are linked to About USD 289 billion (or 677 of the NFIsrsquo total climate financ-ing) was committed to renewable energy and energy efficiency measures implemented mainly domesti-cally We estimate that more than 80 of NFIsrsquo finance was spent in China and Brazil reflecting the relevant weights of CBD and BNDES in this category59 The transport sector of importance for socio-economic development represented 10 of NFIsrsquo mitigation finance The activities supported include rail and ship transportation waterways Bus Rapid Transit systems and vehicles substitution Acknowledging that these activities may ultimately result in emission reductions it is difficult to understand and compare them against
59 As described in Box 7 BNDES placed a particular emphasis on wind and hydropower projects in 2011 CDB too demonstrated its commitment in the support of wind farms and large-scale hydroelectric projects proac-tively implementing the governmentrsquos Green Credit Policies At year-end 2011 its outstanding loan portfolio in energy conservation emissions reduction as well as environmental protection sectors at USD 1018 billion (RMB 6583 billion) up by 33 year-on-year demonstrates its commit-ment The increase observed in the Banksrsquo support to the power sector in 2011 reflects the countryrsquos need to overcome chronic power shortages and optimize the supply mix Worth noting that nuclear and integrated or pithead coal-based plants were also the recipients of the Banksrsquo financing (CDB 2012) CDB does not invest domestically only it is also invests abroad playing an important role in the financing of overseas activities of state-owned enterprises with the aim of creating national champions and acquire advanced technologies (eg Brookingsedu) The Bank also con-tinued to provide financing to the China National Petroleum Corporation Group and SINOPEC Group to support their overseas oil field exploration efforts As of the end of 2011 CDBsrsquo outstanding loan balance in this sector stood at USD 598 billion (RMB 3865 billion) (CDB 2012)
a business-as-usual scenario and to understand if and what they should be qualified as climate finance60
MFIsrsquo mitigation financing was also strongly oriented towards renewable sources of energy and energy con-servation measures which received more than 614 of their total commitments (about USD 13 billion) This can partly be explained by the sectoral specializa-tion of some players such as the EBRD which devoted 938 of its 2011 mitigation finance to these sectors61 MFIsrsquo resources also financed measures aimed at strengthening regulatory and institutional frameworks supportive for clean-technologies62 They also worked with local financial institutions to embed capacity and create specific skills in the preparation risk evaluation and monitoring of these types of projects as well as in the identification of investment opportunities63
The development of the financial sectorrsquos capabilities was also one of the areas targeted by bilateral players such as KfW which dedicated 56 of its 2011 climate finance to capacity building measures in the mitigation area Overall in 2011 the largest shares of BFIs climate spending was directed to the energy (292 to renew-able 13 to energy efficiency) and waste management sectors (9) Transport and agriculture forestry and land use accounted for 122
The forestry sector is an area of emerging interest for some BFIs KfW for instance has a lsquoforest and climate protection programrsquo with Indonesia the largest single-sum beneficiary to date of Germanyrsquos Fast-Start financing (Vieweg et al 2012) The promotion of REDD initiatives is also an important objective for JICA and AfD (AfD 2012 JICA 2012b)
The largest share of bilateral ODA commitments marked as climate mitigation (38) which represented about 60-80 of 2010 DAC membersrsquo reporting was
60 The World Bank identifies the activities with mitigation co-benefits in the sector eg modal shifts traffic management etc (see Worldbankorg) Not all DFIs however have sophisticated systems and frameworks for accounting mitigation finance in place and this is particularly true with regard to the majority of NFIs whose approaches are still in their infancy (See Smallridge et al 2012)
61 Projects supported can range from energy efficiency interventions in the industrial and residential sector support to biomass technologies and the financing of standalone renewable energy projects such as wind and hydropower (EBRDcom 2012)
62 In 2011 capacity buildingtechnical assistance measures related to mitiga-tion received 05 billion of MFIsrsquo commitments
63 See eg the EBRD Sustainable Energy Financing Facilities which comprises a comprehensive technical assistance program intended to provide imple-mentation support to partner banks sub-borrowers and project sponsors (EBRDcom)
52
The Landscape of Climate Finance 2012
53
The Landscape of Climate Finance 2012December 2012 December 2012
committed to projects in the agriculture forestry and land use sector Capacity buildingenabling environ-ment measures received another significant 30 while renewable energy generation from hydro geothermal solar and wind sources captured 15 (OECD 2012)64 African and Asian countries accounted for almost 40 of overall bilateral spending (OECD 2012) This underscores the importance of addressing critical development issues jointly with mitigation measures to achieve growth in a sustainable manner
The volume of public money we found ldquositting behindrdquo project developersrsquo actions (about 11 billion see Box 5) largely originating from and delivered to developed countries (64-72 of the total) ndash mainly in Germany and the US ndash was directed to support and accelerate local deployment of renewable energy measures This reflects the large injection of funds as a result of the ldquogreenrdquo stimulus plans and the effect of policies incen-tivizing uptake Box 3 on the US Federal Tax Incentive Program provides insights on these aspects
REDD+The scope of activities considered ldquoREDD+rdquo65 is notori-ously difficult to delineate While REDD implies efforts to reduce deforestation and forest degradation the lsquoplusrsquo refers to the restoration and rehabilitation of forests and to addressing the drivers of the problem A broad range of activities is needed to tackle the drivers of deforestation and support transitions to more sus-tainable economic development pathways
REDD+ finance can support the creation of enabling environments (eg capacity and institution building and policy and regulatory reform) and mitigation projects (eg creating protected areas or rehabilitating ecosys-tems) Transitioning from a project-by-project approach toward landscape and industry scale approaches would improve prospects of achieving reductions at scale
64 Bilateral fundsrsquo focus are also starting to move towards Nationally Ap-propriate Mitigation Actions (NAMAs) as demonstrated from for instance the early initiative of a group of Nordic countries financing such programs in Vietnam and Peru In Peru USD 3 million (EUR 22 million) will be invested in the waste management sector with bilateral funds from Nordic countries (Denmark Finland Iceland Norway Sweden via the so-called Nordic Partnership Initiative) and domestic money from Peru itself but also from the Nordic Environmental Development Fund In Vietnam the USD 21 million (EUR 15 million) NAMA will focus on the cement manufac-turing sector with financing from Nordic countries and Vietnam itself For additional information see NEFCO website (NEFCOorg)
65 Reducing Emissions from Deforestation and forest Degradation the sus-tainable management and conservation of forests and the enhancement of carbon stocks
by shifting production practices commodity supply chains and land use patterns across jurisdictions and geographies For instance programs aimed at reform-ing policies and creating incentives to intensify agricul-tural productivity thereby reducing pressure to convert forests to achieve increased yields and programs to create alternative livelihoods should be considered part of an effective REDD+ strategy A wide range of actors and sources of finance will be required to realize this broad scale transition including national and interna-tional public and private finance
The potentially broad scope of REDD+ activities adds to the challenges of tracking global financing flows data on which are particularly poor (Buchner et al 2011 Simula 2010 Streck and Parker 2012 ISU 2012 PWC 2011) Fragments of information available on current REDD+ flows suggest they are lagging far behind needs projected by the 2008 Eliasch Review to be around USD 17-33 billion per year by 2030 for a 50 reduction in deforestation
Current flows of REDD+ finance come largely from national and international governments with smaller but growing contributions from non-governmental organi-zations philanthropic and private sector sources The majority of international REDD+ financing to date has focused on lsquoREDD+ readinessrsquo66 building capacity and institutions and some demonstration projects while REDD+ activities at scale and lsquopayment for perfor-mancersquo activities have yet to gather pace
Selected estimates of annual REDD+ finance flows are presented in Appendix F to give a sense of the possible scale of current commitments Estimates include bilat-eral and multilateral flows and dedicated funds as well as forest carbon market flows The data suggest that current REDD+ flows could be approximately USD 13 billion per year67 The figures highlight the dominance
66 ldquoREDD readinessrdquo generally means that all the preconditions ndash in terms of institutional policy and regulatory frameworks ndash necessary to enable countries implement REDD measures are in place Under the UNFCCC Cancun Agreements countries are requested to develop a national strategy or action plan a national forest reference level a robust and transparent national forest monitoring system and a system for providing information on how the safeguards are being addressed and respected (UNFCCC 2010 - Cancun Agreements Art 71)
67 Where possible the value of commitments to approved projects is counted rather than the full value of pledges to funds Higher estimates of international public finance tend to include pledges The International Sustainability Unit (ISU) estimates that total REDD+ financing pledges for the period 2010-2012 based on reporting by donors through the VRD of USD 4 billion Streck and Parker (2012) estimate that international public finance currently accounts for around USD 3 billion per annum including multiannual pledges and funds
52
The Landscape of Climate Finance 2012
53
The Landscape of Climate Finance 2012December 2012 December 2012
Box 10 - Sectoral breakdown of public mitigation financeFigure 3 presents the sectoral breakdown of countriesrsquo bilateral aid including Fast-Start finance1 and DFIsrsquo support targeting climate change mitigation activities It also includes the estimated portion of public funds tracked from project finance reporting in the BNEF database which was entirely directed towards renewable energy projects2
The allocation of the various activities listed in the OECD CRS database (OECD 2012) against the presented sectors was based on the best available information (ie project purpose and description)3 The weights obtained for each sector were then applied to allocate the identified portion of Fast-Start finance devoted to mitigation
We acknowledge the presence of financial flows directed to projects not in line with our definition of climate finance such as money invested in research and development gas-fired power plants or projects with apparently no link to abatement interventions but rather linked to activities like human rights (eg ldquoCSO campaign against poverty hunger exclusion and violation of human rights in South Asiardquo) or peace-building conflict prevention and resolution (both marked as ldquosignificantrdquo in the OECD CRS dataset) Support to such activities was allocated to the category ldquoothersrdquo which also include multi-sector or unspecified aid MichaelowaMichaelowa (2011) also highlights issues related to donors incorrect coding and reporting to OECD DAC (see OCED 2010 for comments on MichaelowaMichaelowa 2011)
With regard to DFIs the breakdown of mitigation finance reflects institutions self-reporting against the sectoral categories provided in the financial survey In those cases where respondents provided different sectoral breakdown the projectcategory description was considered for allocating data against the chosen categories
To estimate the sectoral allocation of DFIsrsquo climate finance sourced from secondary data we used ndash depending on the institutiongroup of institutions considered ndash the following Ecofys-IDFC (2012) UNEP-SEI (2011) Annual Reports and BNEF (2012)
1 To allocate to the mitigation theme the USD 18 billion identified in Fast-Start Finance reporting for 2010 we applied the average share observed in the distribution of money between mitigation and adaptation projects during the 2010-2011 period as per Gibbs (2012) (714 including REDD vs 225) To this we added a share of the money directed to projects with multiple objectives computed according to the weight of mitigation versus adaptation projects on the total
2 The sectoral breakdown does not include Climate Funds money due to data availability issues3 Climate finance commitments retrieved from the OECD CRS data set and allocated to the energy efficiency sector refer to a portion of those
flows directed to measures aimed at improving the ldquopower quality and reliabilityrdquo of electrical transmissiondistribution networks A specific example is for instance a project titled ldquoPacific Power Utilities improved energy efficiencyrdquo We acknowledge that more detailed analysis is needed to understand what is behind each specific project ldquolabelrdquo
Figure 3 Sectoral breakdown of governmentsrsquo and DFIsrsquo mitigation finance (USD 804-837 billion)
0
10
20
30
40
50
60 RENEWABLE ENERGY GENERATION
ENERGY EFFICIENCY
SUSTAINABLE TRANSPORT
AGRICULTURE FORESTRY amp LAND USEOTHERS
WASTE amp WASTE WATER
CAPACITY-BUILDING
FUEL SWITCH
Note The total include Climate Fundsrsquo mitigation financing which is however excluded from the sectoral allocation due to data availability The category ldquoothersrdquo can include unspecifid or multi-sector aid or unallocated portions of DFIsrsquo financing
54
The Landscape of Climate Finance 2012
55
The Landscape of Climate Finance 2012December 2012 December 2012
of bilateral finance and support claims that bilateral finance for REDD+ has so far been faster to disburse than multilateral finance (ISU 2012)
This estimate however largely based on data for inter-national public flows does not account for domestic REDD+ finance which some experts estimate could be several times greater than international donor flows It is particularly difficult to determine the volume of domestic flows and few reliable estimates are available Streck and Parker (2012) estimate that approximately USD 25 billion per year is spent in Brazil Mexico and Indonesia alone and a further USD 7 billion annually is spent in China on afforestation activities Meanwhile Brazil Cameroon the Democratic Republic of Congo Gabon Indonesia Laos Mexico and Papua New Guinea report REDD+ self-finance amounts to USD 24 billion in the Voluntary REDD+ Database68 database (ISU 2012)
Private sector motivations to invest in REDD+ activities include carbon market compliance pre-compliance positioning and corporate social responsibility includ-ing voluntary carbon market participation While the volume of forest credits traded on voluntary markets dropped by almost half between 2010 and 2011 the average price of credits almost doubled meaning that the market held its overall value On the other hand sales of CDMJI forestry credits rose considerably between 2010 and 2011 (as the end of the Kyoto compli-ance period drew near) but average prices fell slightly (Peters-Stanley 2012) Some new emerging compliance carbon markets notably in Australia as well as nascent bilateral markets may provide new sources of demand going forward Aside from carbon markets Streck and Parker (2012) estimate that the private sector is cur-rently generating more than USD 1 billion each year through premiums associated with certified forest products at least part of which goes towards conserva-tion programs
Taken together available estimates of domestic international and private flows imply total REDD+ flows of around USD 118 billion per year This figure is not presented in the Climate Finance Flows Diagram 2012 at present given the figurersquos high level of uncer-tainty and poor underlying data sources It would appear however that domestic governments are the most significant contributors to REDD+ finance Engaging the private sector to drive sustainable produc-tion practices will be crucial to meaningfully tackle the drivers of deforestation supported by clear government
68 Source httpreddplusdatabaseorg
incentives and policies and support from the interna-tional community
Adaptation
Little agreement exists on what qualifies as adapta-tion finance or more narrowly what qualifies as an adaptation intervention Adaptation in fact encom-passes various types of activities which may span the entire vulnerability reduction-response to impacts continuum and which can be applied to a wide range of sectors (agriculture water energy etc) As a result most institutions are not yet equipped with a proper methodology for measuring adaptation finance although relevant efforts to establish tracking and reporting approaches are currently underway (eg the MDBsrsquo initiative on joint adaptation finance tracking)
Hence weaknesses in defining measuring tracking and reporting adaptation finance partial data from some multilateral players and the inability of existing efforts to capture private resources dedicated to such activi-ties hampered our understanding of adaptation finance flows
Given the definitional and methodological complexity surrounding the topic there are few estimates available so far as few have actually tried to truly identify and assess adaptation financing
In the Landscape 2012 we aim to highlight the progress achieved so far on this matter as well as underscore the remaining gaps
Our estimate of about USD 123ndash157 billion of adapta-tion finance comprises donorsrsquo bilateral aid (USD 1-44 billion) (OECD 2012)69 including USD 428 million of
69 Data are adjusted to exclude Bilateral Finance Institutionsrsquo contributions to this field
In 20102011 USD 123 ndash 158 billion was directed towards activities with adaptation objectives Accounting for 775 of the total public financial institutions were the predominant sources These institutions are also the holders of long-standing expertise in the field given their past experience in the areas of development assistance with relevance to adaptation
The biggest knowledge gap in adaptation financing is the role of the private sector which is not estimated in this study
54
The Landscape of Climate Finance 2012
55
The Landscape of Climate Finance 2012December 2012 December 2012
Fast-Start finance70 Climate Funds (USD 04 bn) and
70 The portion of the identified USD 18 billion in Fast-Start Finance reporting for 2010 directed to adaptation (USD 441 million) was estimated by ap-plying the average share observed on the thematic allocation of Fast-Start money over the 2010-2012 period as per Gibbs (2012) (714 to mitiga-tion including REDD vs 225 to adaptation) To this we added a share of the money directed to projects with multiple objectives computed according to the weights of mitigation versus adaptation projects on the total
DFIsrsquo support targeting climate change adaptation activities (USD 109 billion) and philanthropic contribu-tion from Foundations71 (USD 1055-134 million)
With regard to bilateral assistance in November 2011 the OECD-DAC published the first-ever complete
71 We allocated 50 of the identified USD 211ndash268 million of philanthropic contributions to climate-specific projects to adaptation measures See paragraph on ldquoGrants instrumentsrdquo
Box 11 - Sectoral breakdown of public adaptation financeBased on the information gathered we attempted to categorize adaptation finance by recipient sectors despite an international agreement on this has not been reached as yet We found that the agriculture and forestry and the water preservation supply and sanitation sectors were the main recipients of climate-resilient finance in 20102011 receiving 27 (USD 44 billion) and 23 (USD 38 billion) of the total respectively (see Figure 4)
Among individual contributors Bilateral Financial Institutions allocated 513 of their adaptation finance to the water sector Disaster risk reduction initiatives also represented an area in which Bilateral Finance Institutions were particularly active receiving 156 of their adaptation finance National players appeared critical in supporting the strengthening of the resilience of local infrastructure assets as well as the agriculture and forestry sector which were the recipients of 313 and 309 respectively of their adaptation finance
Among DFIs multilateral organizations on the other hand were the major providers of financial support towards capacity building and technical assistance initiatives in this area which accounted for 127 of their total adaptation finance Activities included awareness raising programs training to address vulnerabilities early warning systems and strengthening of institutions policies and regulations
Dedicated Climate Funds also played a role in adaptation financing albeit limited compared to the total accounting for about 25 They are however proving critical in financing pilot and demonstration projects and in promoting the integration of climate risk and resilience into development policies and planning This is particularly the case of the Pilot Countries for Climate Resilience (PPCR) a program operating within the Climate Investment Funds framework which by channelling 45 of the total Climate Fundsrsquo finance (or USD 1548 million) stands out as the major contributor in this area
Figure 4 Sectoral breakdown of governmentsrsquo and DFIsrsquo adaptation finance
0
5
10
15
20
25
30
AGRICULTURE AND FORESTRY
WATER PRESERVATION SUPPLY AND SANITATION
OTHERSINFRASTRUCTURE
(CAPACITY-BUILDING TECHNICAL ASSISTANCE)
DISASTER RISKREDUCTION
Note Climate Fundsrsquo adaptation financing (USD 352 million) and the estimated portion of philanthropic contributions targeting adaptation (USD 120 million) are excluded from the sectoral breakdown due to data availability issues The category ldquoothersrdquo can include for instance unspeci-fied or multi-sector aid or unallocated portions of DFIsrsquo financing
56
The Landscape of Climate Finance 2012
57
The Landscape of Climate Finance 2012December 2012 December 2012
Creditor Reporting System dataset on aid for climate change adaptation whose ldquomarkerrdquo was approved by member countries in 2009 (OECD 2011)72 While donors inappropriate coding73 affects the true magni-tude of the identified flows (Junghans and Harmeling 2012) this has brought to light their contributions to the field advancing understanding on how much money is going to advance the adaptation agenda
Elaborating on the OECD-DAC methodology which is ldquoobjective basedrdquo74 the World Bank has developed an ldquoactivity-basedrdquo system that tracks spending on activi-ties with adaptation co-benefits at the sub-component level75 ldquoonly if they explicitly include climate adaptation reasoning and directly address vulnerability or impact from climate variability and changerdquo (IEG 2012) This system was introduced in 201276
This initiative feeds into the group of MDBs currently working on a joint approach for adaptation finance tracking (AfDBorg IDB et al 2012) The outcomes of this effort which will be released at COP 18 are hence not fully reflected in our figures
Four MDBs in fact opted to report on mitigation only while in the process of finalizing the above mentioned methodology others estimated adaptation financ-ing following the DAC Rio Marker as selection criteria for adaptation activities (eg EBRD KfW and JICA) The World Bankrsquos figures reflect instead the newly piloted methodology More information is needed on the approaches followed by NFIs for reporting to understand what is actually counted against this theme Those surveyed by us or under the Ecofys-IDFC (2012) initiative were requested to report according to the OECD definition
72 This marker captures those activities that aim ldquoto reduce the vulner-ability of human or natural systems to the impacts of climate change and climate-related risks by maintaining or increasing adaptive capacity and resiliencerdquo For additional information see OECD website (OECDorg)
73 Junghans and Harmeling (2012) reveal that about 65 of the activities in the adaptation dataset are unrelated to it or do not identify adaptation as a ldquosignificantrdquo or ldquoprincipalrdquo target while about half of the remaining 35 are over-coded eg reporting adaptation as a primary objective when it should have rather been reported as secondary
74 In the OECD CRS database a project is marked as having adaptation as a ldquoprincipal objectiverdquo if ldquothe activity would not have been funded but for that objectiverdquo or as having a ldquosignificant objectiverdquo if the intervention was ldquoformulated or adjusted to help meet climate concernsrdquo (OECD 2011 IEG 2012)
75 The typology of activities with climate co-benefits by World Bank sector can be consulted at the Worldbankorg website
76 For more information see also World Bank website at httpclimatechangeworldbankorgcontenttracking-finance
The biggest knowledge gap in adaptation financing is the role of the private sector Businesses house-holds and other private groups have a vested interest in engaging in climate initiatives particularly when climate change may directly affect their main sources of revenue The private sectorrsquos financial support can take the form of investments aimed at climate-proofing businesses and assets77 corporate social responsibility initiatives as well as philanthropic contribution
Geographical distribution of climate financeThe Landscape 2012 strives to unveil additional informa-tion on domestic climate finance flows This is reflected in the private flows categorization and the expanded coverage of Development Finance Institutionsrsquo climate expenditures
We find that USD 193 billion of global climate finance or 53 goes to projects in developed countries Some notable sources include the following
bull USD 62 billion comes from corporate actors (including a significant portion of small-scale renewable investment)
bull USD 58 billion comes from project developers
bull USD 24 billion comes from commercial financial banks (reflecting higher recourse to project-level debt financing) and
bull USD 24 billion comes from German and Italian households (investing in solar PV)
In developed countries the largest contributors are private actors (89)
We also find that USD 171 billion of global climate finance goes to projects in developing countries Some notable sources include the following
bull USD 70 billion comes from Development Finance Institutions
bull USD 65 billion comes from (mostly domestic) project developers
77 The UNFCCC maintains a database of private sector action on adaptation (PSI) Activities may encompass those aimed to ensuring the resilience of business operations or the supply of technologiesservices in support of vulnerable communities The PSI is a voluntary initiative intended to raise awareness about climate change adaptation in the private sector It also responds to the mandate given to the secretariat by the Parties of the Convention to engage stakeholders in enhancing the response to climate change Financial aspects related to the various cases presented is not readily available or whether specified not verified by the UNFCCC secretariat For additional information see UNFCCCint
56
The Landscape of Climate Finance 2012
57
The Landscape of Climate Finance 2012December 2012 December 2012
Box 12 - How is Germany financing its energy transition Financing the Energiewende
The private sector is proving pivotal in financing the German energy transition In 2010 the private sector financed contributed more than 95 of total climate finance invested in the country providing USD 478 billion
Germany plays a central role in European decarbonization The government has set ambitious climate and energy targets to reduce emissions 80-95 below 1990 levels by 2050 (Energy Concept 2010) while phasing-out nuclear energy by 2022 (2011 Energy Transition Energiewende)
In 2010 at least USD 491 billion (15 of GDP) was invested to support the German transition to a low-carbon economy (CPI 2012)
The private sector provided more than 95 of climate finance in Germany almost half of which was supported by concessionary loans from development banks Thus the public sector played an important role in supporting private investment The bulk of private money came from corporate investors (USD 292 billion) led by corporations in the energy sector Private households invested a significant USD 186 billion
Besides the concessionary loans the high share of private investment coincided with other incentives such as the Feed-in Tariff In 2010 the Feed-in tariff paid to households and corporate renewable energy generators amounted to approximately USD 174 billion equivalent to 49 of the actual total capital investment in renewable energy in that the same year This underlines the importance of the FiT in influencing renewable energy investorsrsquo decisions
The federal-level development banks KfW and Rentenbank provided at least USD 219 billion of concessional loans for climate-specific investments which represented a 43 share of total capital investment in renewable energy and 72 of total incremental investment in energy efficiency1 The significant role of concessionary loans highlights the importance of public finance instruments beyond just direct subsidies and grants
Renewable energy generation capital investments in buildings energy utilities agriculture and industry amounted to USD 353 billion Corporations across sectors invested USD 216 billion while private households invested a significant USD 131 billion in the building sector renewable energy capacity Energy efficiency amounted to USD 96 billion of incremental investment the householdsrsquo share of which was USD 54 billion (57) Investments in efficient buildings accounted for the largest share of energy efficiency investment with USD 77 billion
Is Germany on track Whether or not climate-specific finance in Germany was sufficient in 2010 to meet Germanyrsquos climate and energy targets is difficult to answer No comprehensive estimate is available for the total investment required for reaching these targets However CPI Report (2012) assessment of the distribution of climate finance across different uses provides a basis for focusing subsequent in-depth analysis on this regard
Prepared by Rodney Boyd (CPI Berlin rodneyboydcpiberlinorg)
Based on ldquoThe Landscape of Climate Finance in Germanyrdquo CPI (2012)
1 Please note the referenced study reports figures for total capital investments for renewable energy and incremental investments for energy efficiency
58
The Landscape of Climate Finance 2012
59
The Landscape of Climate Finance 2012December 2012 December 2012
Box 13 - Geographical distribution of public climate financeThe Figure 4 presents the geographical distribution of countriesrsquo bilateral aid including Fast-Start financing and DFIsrsquo money This graph highlights that with approximately USD 389 billion ndash 47 of total public finance ndash emerging giants like China and Brazil were the largest recipients of climate finance flows Notably this reflects the weight of the China Development Bank and Brazilrsquos BNDES in delivering domestic money in pursuit of development mandates In fact 333 of Development Finance Institutionsrsquo finance goes to China while 179 goes to Brazil
The governmentsrsquo budgets breakdown does not include the estimated portion of public funds tracked from project finance reporting from the BNEF database about USD 11 billion as the detailed split per country could not be retrieved We can however infer that 64-72 of that pertains to developed countries ndash mainly the US and Germany
ndash while the remaining 28-36 to developing countries mainly in Asia The allocation of bilateral aid per recipient countries was retrieved from the OECD CRS data set (OECD 2012)
With regard to DFIs the breakdown of their climate finance by beneficiary country reflects institutionsrsquo self-reporting against the geographic categories provided in the financial survey When respondents provided different sectoral breakdowns data were allocated against the selected macro-areas categories1
To estimate the breakdown by recipients countries for those DFIsrsquo we did not have detailed data for we used ndash depending on the institutiongroup of institutions considered ndash the information presented in the following Ecofys-IDFC (2012) UNEP-SEI (2011) and entitiesrsquo annual reports In some cases we applied the average share observed in other DFIs In particular we assumed that the China Development Bank ndash which accounts for the largest single share of NFIsrsquo climate finance ndash invested domestically (see also Ecofys-IDFC 2012)
1 For instance one respondent provided finance allocated for macro-regions such as ldquoEast Asia amp Pacificrdquo and ldquoSouth Asia Regionrdquo according to their tracking procedures In this case all money was allocated to our ldquoOther Asiardquo category
Figure 4 Geographical distribution of government budgets and Development Finance Institutionsrsquo climate financing
CHINA
BRAZIL
OTHER ASIAOTHER LAC
EUROPEOTHER AFRICA
INDIA
OTHERS
MENA
C AMERICA
S AFRICA
OCEANIA
N AMERICA
0
10
20
30
Note Government budgets data refers to OECD DAC money only (OECD 2012) Data do not include the estimated portion of public funds tracked from project finance reporting in the BNEF database for about UDS 11 billion The category ldquoothersrdquo refers to bilateral contributions whose recipients were not specifid or money distributed to transnationaltransregional projects
bull USD 13 billion comes from corporate actors
bull USD 12 billion comes from commercial financial banks
Compared to developed countries climate projects in developing countries rely more on balance sheet financing and instruments from development banks
The share of private sector contributions to climate finance in developing countries is around 57
58
The Landscape of Climate Finance 2012
59
The Landscape of Climate Finance 2012December 2012 December 2012
Box 14 - Financing Renewable Energy Generation and Energy Efficiency in China
Chinarsquos ambition to shift to a greener economy is reflected in the significant investments made in the renewable energy and energy efficiency sectors over the past few years
In terms of gross investment in renewable energy China has led the world for the past three years as gross investment in renewable energy increased 51 from USD 337 billion in 2009 to USD 51 billion in 2011 In 2011 877 of the total investment was devoted to wind power and solar PV which reached 624 GW (about 25 of worldrsquos capacity) and 31 GW (44 of the global market1) accumulated installed capacity respectively
With USD 396 billion or 886 of the total asset financing was the primary method of supporting wind and solar PV projects This is typically arranged with an 8020 debt to equity ratio in the case of wind where developers are requested by law to take at minimum a 20 equity stake and borrow the remaining from state-owned or policy-related banks The ratio is different for distributive PV projects where developers take equity stakes for 30 borrow 20 from banks and get the remaining 50 in the form of grants under the ldquoGolden Sun demonstrationrdquo and the Building-integrated PV (BIPV) subsidy programs introduced in 20092
State-owned enterprises (SOEs)3 are the major developers in both the wind and solar PV markets accounting for 799 and 61 of total installed capacities respectively SOEs have privileged access to credit from financial institutions thanks to their long-established relationship with state-owned banks
1 The National Development and Reform Commission has revised the 12th Five Year Plan solar PV target from 15 GW to 21 GW by the end of 2015 in order to boost the domestic solar PV market and to absorb the excess supply due to US anti-dumping and anti-subsidy tariffs On Oct24 2012 the Information Office of the State Council published the 2012 edition of white paper on Chinarsquos Energy Policy which claimed that Chinarsquos installed generating capacity of solar energy was expected to exceed 21GW by 2015
2 The BIPV subsidy program provides upfront subsidies for grid-connected rooftop and BIPV systems 3 SOEs include national provincial and municipal level state-owned enterprises and their subsidiariesspinoffs
bull State-backed enterprises shape the current outlook of Chinarsquos solar PV and wind power generation
bull China invested a sum of USD 142 billion to improve energy efficiency over the 11th Five-Year Plan (2006 to 2010) Private finance accounted for 83 of that total
Figure 5 Sectoral breakdown of Chinarsquos energy efficiency investments
0
20
40
60
80
INDUSTRY BUILDING TRANSPORT
Perce
nt o
f tot
al
CAPACITY BUILDING
60
The Landscape of Climate Finance 2012
61
The Landscape of Climate Finance 2012December 2012 December 2012
and their solid balance sheets which can serve as loan guarantees
China was also a leader in investment in the energy efficiency sector Investment in energy efficiency was driven by the mandatory targets set in the 11th Five-Year Plan (FYP) to reduce national energy intensity by 20 from 2005 levels by 2010 Over the course of the Plan (2006-2010) Chinarsquos energy efficiency investment reached a cumulative amount of USD 120 billion
Private finance represented the lionrsquos share of total energy efficiency finance 79 of the total USD 120 billion invested corporations provided USD 533 billion households contributed USD 19 billion commercial banks provided USD 38 billion and the stock market raised USD 16 billion Private funding was raised in the form of direct equity and debt investments
Public money contributed USD 229 billion (191) The central government supported energy efficiency programs in the industrial building and transport sectors with USD 152 billion (127) in the form of direct investment subsidies rewards transfer payments government procurements and concessional loans Provincial and lower-level governments provided USD 77 billion (64) as local supplements to support activities in their jurisdictions International institutions and international carbon market contributed additional USD 23 billion (19)
The industrial sector attracted the greatest share of money 89 or USD 107 billion to undergo energy audits technology upgrades facility retrofitting and closure of outdated plants
Energy efficiency investment in the 11th FYP surpassed the amount invested in any previous FYPs The vast scale of investment was critical to Chinarsquos energy target achievement in the 11th FYP period On average the ratio of public funding to ldquoprivate investmentrdquo was 1 to 423 This leverage effect should however be interpreted by keeping in mind that there are governmental resources ldquositting-behindrdquo private investments
Prepared by Dong Wenjuan and Yu Yuqing (CPI Beijing dongwenjuancpibeijingorg yuyuqingcpibeijingorg)
Based on forthcoming ldquoAnnual Review of Low-Carbon Development in China (2013)rdquo CPI Report
60
The Landscape of Climate Finance 2012
61
The Landscape of Climate Finance 2012December 2012 December 2012
4 Conclusions and the way forwardA comprehensive picture of todayrsquos climate finance flows will improve our collective understanding not only about how much and what type of finance is provided to promote low-carbon climate-resilient development but how the world stands in relation to global finance and temperature goals With a comprehensive picture we can begin to identify how different types of support cor-respond to different needs and whether resources are being spent productively This understanding is critical to highlight emerging trends and position policy makers and investors to respond to the challenges effectively
The Landscape 2012 builds and improves upon CPIrsquos initial effort to provide a snapshot of the current climate finance landscape Our methodology draws on a wide variety of tracking initiatives and information systems to estimate the possible scale of available finance This study highlights that there is not one single climate finance story climate finance archetypes differ by country and circumstance In addition a number of actors have distinctive responsibilities Public and private intermediaries continue to play a pivotal role in distributing climate finance National banks are playing a growing role in channeling resources Private com-mercial banks and infrastructure funds are also critical players they intermediate both project finance debt and direct investments In addition better information about private finance flows highlights the various private sector representatives that are active in climate invest-ments on the primary investment and lending sides mdash including institutional investors albeit to a small extent mdash and clean technology manufacturers engaged in vendor financing
The Landscape 2012 suggests that annual global climate finance flows reach between USD 343 - 385 billion in 2010-2011 or USD 364 billion on average Although close to 75 of this comes from private sources the public sector plays a pivotal role by providing funds that catalyze private sector investment These figures shed light on global efforts to match the global financing need Overall while money is clearly flowing to low-car-bon climate-resilient development investment levels fall far short of that required to limit global temperature rise to below two degrees Celsius The International Energy Agency projects that incremental investment in the energy sector will need to reach USD 36 trillion over the period of 2012-2050 ndash or approximately USD 1 tril-lion each year (IEA 2012) This estimate highlights just
how much more finance is required to fund the transi-tion toward a low-carbon climate resilient future
The amounts represented in the Landscape 2012 reflect better data and increased coverage The Landscape 2012 aimed to address some of the major information gaps identified in the Landscape 2011 Building upon the Landscape 2011 the Landscape 2012 better captures the magnitude and nature of climate finance flows between and within countries We expanded the geographic scope covered more types of actors and collected better information about the recipients of finance Most importantly by untangling private sector flows we have improved our understand-ing about the actual sources of money where it is going and through which financial instruments This has been particularly true in the case of domestic flows
Nonetheless there is room for improvement Reporting gaps and inconsistent labels and definitions hamper our ability to track and fully capture the scale and effective-ness of climate finance Climate Policy Initiative will con-tinue to build and improve upon this understanding in future Landscapes and through other ongoing efforts78
Emerging key issuesThis study confirms and elaborates upon several find-ings from the Landscape 2011
Private capital is essential and makes up the lionrsquos share of global climate investment flows
Public resources alone cannot finance the transition to a low-carbon climate-resilient future unlocking private sector capital will be essential The Landscape
78 To unlock sufficient climate finance for a low-carbon climate-resilient transition it is essential to increase climate finance effectiveness based on the optimal balance between public and private capital To shed light on how to do this CPI in collaboration with the World Bank Group CLP and the OECD established the San Giorgio Group a new working group of key financial intermediaries and institutions actively engaged in green low-emissions finance The core objective of the Group is to analyze how to mobilize and deploy adequate and effective finance to achieve low-carbon climate-resilient development To address the weak understanding of climate finance effectiveness CPI has initiated within the San Giorgio Group a work stream on concrete case studies to build up knowledge on elements that make investments successful from a financial environmen-tal organizational and political perspective By building up an evidence base what works and what doesnrsquot the goals is to learn from the wide range of existing and evolving financing practices to provide insights on how to scale up climate finance and spend available resources more wisely For more information see httpclimatepolicyinitiativeorgvenicesan-giorgio-group
62
The Landscape of Climate Finance 2012
63
The Landscape of Climate Finance 2012December 2012 December 2012
2012 highlights the relationship between public and private sources and suggests that a major portion of private investment relies on public finance to create an environment where investments are viable There is a clear incidence of public money standing behind private investments particularly in the emerging economies of China and Brazil
Well-targeted public capital can make investments go further
Well-targeted public resources are an essential element of transformational climate investment structures Most public money (almost 80) is currently delivered through national bilateral and multilateral organiza-tions While public institutions generally take the risk for money channeled through these organizations the money itself can be largely raised from private sources Our findings suggest a number of best practices are emerging in developing and developed countries where well-targeted public capital is starting to unlock
significant investment The Landscape 2012 also shows that bilateral public funding increased despite fiscal austerity and tightening credit context likely reflecting the impact of fast-start finance pledges
Looking forward public money remains essential but given its scarcity we need to understand its role (ie which risks should reside with the public sector and which should reside with the private sector and how the scale of these risks depends on the nature of the investments) to spend available resources wisely Public funds especially international public money should only pay for those risks the private or national public investments will not bear and the scale of these publicly offloaded or assumed risks depend on the nature of the investment
Domestic finance is a key element
Our findings underline the importance of domestic finance in addressing the global challenge of climate change The Landscape 2012 highlights that a large
Box 15 ndash Tracking issues
Many organizations maintain databases andor prepare reports about particular elements of the climate finance landscape However there is no integrated international system for storing this data many flows are not systematically measured reported or verified and where tracking efforts are in place granularity and consistency varies (cf Buchner et al 2011) This hampers efforts to compare and aggregate data and assess the effectiveness of finance
As the sources and volumes of climate finance increase the challenge to track and analyze flows will become greater While many organizations are working to improve these systems a number of areas require urgent attention
bull Transparency and consistency in definitions - what is counted and reported as climate finance including sectoral boundaries and whether total project value or only relevant portions of investments are counted
bull A clearer distinction between incremental costs and investment capital
bull Related to this a better understanding of how incremental support and specialized risk instruments stimulate investment and
bull Improved information about domestic and private flows of finance Most clean development investment will need to come from national private sources but data remains scarce
Based on ldquo The Landscape of Climate Financerdquo CPI Report (2011)
Many organizations are engaged in efforts to track aspects of the climate finance picture but several gaps remain
These gaps hamper efforts to compare and aggregate data and assess the overarching effectiveness of finance
62
The Landscape of Climate Finance 2012
63
The Landscape of Climate Finance 2012December 2012 December 2012
proportion of public investment reflected domestic gov-ernment support toward structural changes in energy systems as engines of economic growth Further infor-mation on private finance shows that domestic private actors play a key role
Emerging economies play a key role
Roughly one third of global mitigation investments are located in China Brazil and India Further a significant share of investment in these three countries is raised domestically and disbursed by state-owned entities in pursuit of development mandates We hope that these leaders signal a trend among other developing countries toward low-emissions climate-resilient growth as a practical and productive national development strategy
Understanding about adaptation finance is still scarce
While the large majority of climate finance is still used for mitigation measures we have been able to capture more money that is beginning to be invested in adapta-tion activities This reflects new tracking initiatives that specifically address the information gap on adaptation finance However data inconsistencies and the difficul-ties in defining what constitutes adaptation finance (and where the boundaries between adaptation and develop-ment finance are) hamper our understanding
Next steps for data gathering and analysisTo improve the worldrsquos understanding of climate finance and to put current climate finance flows in per-spective the following key issues need to be addressed
Comprehensiveness mdash further expansion of scope and coverage
This study emphasizes the relative importance of private finance Further information on private finance is needed particularly related to non-project level entry points for finance to better understand corporate sources of capital for balance sheet financing
The Landscape 2012 also confirms the essential role of a number of actors including international national and local financial institutions and households Additional detail on these institutionsrsquo financing including infor-mation about the new methodology that Multilateral Development Banks79 are developing for tracking and
79 Including the African Development Bank (AfDB) the Asian Development Bank (ADB) the European Bank for Reconstruction and Development (EBRD) the European Investment Bank (EIB) the Inter-American Develop-ment Bank (IDB) the World Bank (WB) and the International Finance Corporation (IFC)
accounting mitigation and adaptation finance will improve our understanding of their role in climate finance We also need better information on domestic-level finance and on financing channels for households A better overview of climate funds particularly national ones would further improve the comprehensiveness of the climate finance landscape
Finally better information on the role of specific sectors (such as energy efficiency and non-energy sectors) and uses (such as adaptation and enabling environment finance) and better mapping of specific instruments (such as tax incentives) is needed
The dimensions of climate finance mdash clarify net climate finance flows
The Landscape 2012 takes both incremental costs and investment capital into account It focuses on gross flows due to the difficulty of calculating incremental cost and net values of all finance flows due to the importance of understanding the full volume of finan-cial flows delivered Gross flows also tell a story about upfront support that is needed to encourage further investments Ultimately it is instructive to understand net contributions by countries and actors and to obtain a good understanding of incremental costs compared with business-as-usual or ldquobrownrdquo investments This is particularly important to understand how global efforts are tracking against the financing levels needed to stabilize average global temperature below two degrees Celsius Proxies are necessary to better understand these dimensions In this context the role of risk mitiga-tion and policy instruments in addressing incremental costs warrant further work
The impact mdash increase understanding of climate finance effectiveness
The biggest gap in todayrsquos climate finance landscape remains the lack of a sound understanding about whether finance flows are being used effectively and whether they adequately address the challenges posed by climate change and global needs We need more efforts to define and describe what constitutes effective climate finance starting with lessons from the important experiences of organizations already working to measure the impact of climate finance In fact a number of countries and DFIs are now actively developing frameworks to measure and evaluate the performance of the climate finance they are providing delivering andor receiving (Buchner et al 2012) fos-tering more streamlined reporting frameworks
64
The Landscape of Climate Finance 2012
65
The Landscape of Climate Finance 2012December 2012 December 2012
More rigorous monitoring and reporting can aid learn-ing planning and budgeting at the country level and thus drive effectiveness improvements However more than just tracking will be required analysis of policy effectiveness will also be critical In addition to CPIrsquos effort to build up an evidence-based bottom-up database of success and failure stories related to climate finance (the San Giorgio Group case studies)80 there is a need to explore how effectiveness can also be ascribed to the climate finance landscape Possibilities include the calculationindication of expected avoided carbon emissions carbon cost per unit and co-impacts A further option to increase the understanding about the effectiveness of climate finance is to relate public money contributions to estimates of incremental costs Finally disbursement channels are also key for effective climate finance spending and more information on this element could improve the understanding of climate finance effectiveness
The benchmark mdash exploration of business-as-usual (ldquobrownrdquo) finance flows
To put climate finance estimates into perspective com-parable estimates of traditional ldquobrownrdquo or business-as-usual finance are a useful benchmark to check whether there is real progress towards a low-carbon climate-resilient future
CPI remains committed to improving the understanding and transparency of todayrsquos climate finance landscape
80 Within the San Giorgio Group CPI works on concrete case studies to build up knowledge on elements that make investments successful from a financial environmental organizational and political perspective We aim to provide credible information on how to ramp up public expenditures integrate national and international capital streams leverage public funds with private flows efficiently and invest the aggregate wisely For more information see httpclimatepolicyinitiativeorgpublicationsan-giorgio-group-case-studies
64
The Landscape of Climate Finance 2012
65
The Landscape of Climate Finance 2012December 2012 December 2012
Index of acronyms AAU Assigned Amount UnitAsDB Asian Development BankAF Adaptation FundAFD Agence Franccedilaise de DeacuteveloppementAfDB African Development BankAGF High-Level Advisory Group on Climate Change FinancingBFI Bilateral Finance Institution BIPV Building Integrated PhotovoltaicBNDES Brazilian Development BankBNEF Bloomberg New Energy FinanceCAF Development Bank of Latin America CDB China Development BankCDC Caisse des DeacutepocirctsCDM Clean Development Mechanisms CEA California Environmental AssociationCER Certified Emissions Reductions CIF Climate Investment Funds CRS Creditor Reporting SystemDAC Development Assistance Committee DBSA Development Bank of Southern AfricaDFI Development Finance InstitutionsEBRD European Bank for Reconstruction and Development ECA Export Credit Agency EDF Environmental Defense FundEEA European Energy AgencyEEC European Economic CommunityEIB European Investment BankEU European UnionEU ETS European Union Emissions Trading SystemFDI Foreign Direct Investment FiT Feed-in TariffFYP Chinarsquos Five-Year PlanGEF Global Environmental Facility GHG Greenhouse Gas Emissions IBRD International Bank for Reconstruction and Development ICI International Climate InitiativeIDA International Development Association IDB Inter-American Development BankIEA International Energy AgencyIFC International Finance CorporationIFCI International Forest Carbon InitiativeIGES Institute for Global Environmental StrategiesIIED International Institute for Environment and DevelopmentIREDA Indian Renewable Energy Development AgencyJI Joint Implementation JICA Japan International Cooperation AgencyJVETS Japan Voluntary Emissions Trading SchemeKFW KFW Entwicklungsbank (German Development Bank)MDB Multilateral Development BankMFI Multilateral Finance InstitutionNAFIN Nacional Financiera Development Bank
NDF Nordic Development Fund NFI National Finance InstitutionODA Official Development Assistance ODI Overseas Development InstituteOECD Organization for Economic Co-operation and DevelopmentOPIC Overseas Private Investment CorporationOTC Over-the-CounterREDD Reducing Emissions from Deforestation and Forest
DegradationREN21 Renewable Energy Policy Network for the 21st Century RGGI Regional Greenhouse Gas InitiativeSOE State-Owned Enterprise including national provincial
and municipal level state-owned enterprises and their subsidiariesspinoffs
TNC The Nature ConservancyUNDP United Nations Development Programme UNEP United Nations Environment ProgrammeUNEP-Risoslash United Nations Environment Programme Risoslash Centre on
Energy Environment and Sustainable DevelopmentUNFCCC United Nations Framework Convention on Climate ChangeVER Voluntary Emissions ReductionsWB World Bank
66
The Landscape of Climate Finance 2012
67
The Landscape of Climate Finance 2012December 2012 December 2012
GlossaryCRS
The Creditor Reporting System is a database of individual aid activities which contains detailed quantitative and descrip-tive data on individual aid projects and programs It enables analysis of the sectoral and geographical breakdown of aid for selected years and donors
DAC
The Development Assistance Committee is the committee of the OECD which deals with development co-operation matters At present there are 24 members of the DAC Australia Austria Belgium Canada Denmark Finland France Germany Greece Italy Ireland Japan Korea Luxembourg the Netherlands New Zealand Norway Portugal Spain Sweden Switzerland the United Kingdom the United States and the European Commission
EXPORT CREDITExport credits are government financial support direct financing guarantees insurance or interest rate support provided to foreign buyers to assist in the financing of the purchase of goods from national exporters (OECD 2012d)
FAST-START FINANCE
The Copenhagen Accord obliges developed countries to collectively provide fast-start finance to developing countries in the amount ldquoapproaching USD 30 billion for the period 2010-2012rdquo for enhanced action on mitigation (including Reducing Emissions from Deforestation and forest Degradation REDD) adaptation technology development and transfer and capacity building
GRANT Transfers made in capital goods or services for which no repayment is required
INCREMENTAL COST AND
INVESTMENT CAPITAL
Incremental cost and investment capital are both important lenses for climate finance flows Incremental cost refers to financial resources provided to compensate the difference between a less costly more polluting option and a costlier more environmentally friendly andor climate-resilient one Investment capital refers to tangible investment in mitigation or adaptation projects Whereas investment capital is paid back to the investor incremental costs often are not and are often funded by public climate finance support either through policy support or concessional finance
INFRASTRUCTURE FUND
ldquoFunds focused on making direct financial investments in projects across the following sectors power (renewables coal-fired gas turbine and nuclear) water (treatment and distribution) transportation (airports ports roads parking lots and rail links) social (prisons hospitals and schools) and utilities (gas distribution electricity transmission fixed-line telephone and mobile telephone)rdquo (PFI Global Infrastructure Report 2007 ldquoThe rise of infra fundsrdquo retrieved from httpcrgpstanfordedupublicationsarticles_presentationsOrr_01_Infra_funds_2007pfiepdf)
JOINT IMPLEMENTATION
(JI)
Track 1 JI Simplified approval process for JI projects where the host Party is considered to fulfill all the eligibility require-ments of the Kyoto Protocol on emission reportingTrack 2 JI Parties that have not met the Kyoto Protocol requirements on emission reporting can carry out JI projects under a more rigorous approval regime
ODA
Official Development Assistance is defined as those flows to developing countries (countries and territories on the DAC List of ODA Recipients) and to multilateral agencies in the form of grants or loans which are provided by the official sec-tor aimed to promote economic development and welfare given at concessional financial terms (if a loan having a grant element of at least 25) In addition to financial flows technical co-operation is included in aid
PRIVATE EQUITYldquoPrivate equity invests in private companies (hellip) to distinguish it from lsquopublic equityrsquo investments in stock markets (hellip) Private equity funds acquire established companies in old industries with the aim of reviving their fortunes (hellip) Private equity funds come in all shapes and sizesrdquo (EVCA website httpevcaeuwhat-is-private-equity)
REDD+REDD+ goes beyond deforestation and forest degradation and includes the role of conservation sustainable management of forests and enhancement of forest carbon stocks
66
The Landscape of Climate Finance 2012
67
The Landscape of Climate Finance 2012December 2012 December 2012
RIO MARKERS(RMS)
The Rio Markers (RMs) are indicators of the degree of relevance of a given activity in addressing the objectives of the three ldquoRio Conventionsrdquo (the United Nations Convention on Biological Diversity (CBD) the United Nations Framework Convention on Climate Change (UNFCCC) and the UNCCD) The screening of an activity against the objectives of a Convention will result in the following scores0 (not targeted) means that the activity is found not to be targeted to the Convention1 (significant) means that targeting the objectives of the Convention is an important but secondary purpose of the activity (ie not one of the principal reasons for undertaking the activity)2 (principal) means that targeting the objectives of the Convention is an explicit objective of the activity and fundamental in its design (ie the activity would not have been undertaken without this objective)3 (Action ProgrammeAP-related) for desertification only It means that the activity was undertaken to combat desertifi-cationland degradation as a principal objective and in support of an action programme (NAP SRAP or RAP) to implement the UNCCD
VENTURE CAPITALldquoVenture capital is a type of private equity focused on start-up companies Venture capital funds often back entrepreneurs who have just the germ of a business ideardquo (EVCA website httpevcaeuwhat-is-private-equity)
68
The Landscape of Climate Finance 2012
69
The Landscape of Climate Finance 2012December 2012 December 2012
ReferencesAgence Franccedilaise de Developpement (AFD) (2011)
ldquoResults and Lessons Learned from AFDrsquos Opera-tions in the fight Against Climate Change from 2005 to 2010rdquo Paris France
Agence Franccedilaise de Developpement (AFD) (2012) ldquoLrsquoactivite Financiegravere du Groupe AFD Dans la Lutte Contre le Changement Climatique Resultats pour 2011rdquo Paris France
Agence Franccedilaise de Developpement (AFD) (2012) ldquoScreening Tool For Classification of laquo Adaptation raquo Projects From The AFD Grouprdquo Paris France
AGF (UN Advisory Group on Climate Change Financ-ing) (2010) ldquoReport of the Secretary-Generalrsquos High-level Advisory Group on Climate Change Financingrdquo New York United States United Nations
Asian Development Bank (ADB) (2012) ldquoAnnual Report 2011rdquo Manila Philippines
Atteridge A C Kehler Siebert R J T Klein C Butler and P Tella ldquoBilateral Finance Institutions and Climate Change A Mapping of Climate Portfoliosrdquo prepared by the Stockholm Environment Institute for the Climate Change Working Group for Bilat-eral Finance Institutions November 2009
Banco Estado (2012) ldquoAnnual Report 2011rdquo Chile
Bloomberg New Energy Finance (2011) ldquoThe Past and Future of Development Bank Finance to Clean Energy Projectsrdquo Clean energy Research Note April 2011
Bloomberg New Energy Finance (2012a) ldquoVital Sta-tistics of Development Bank Funding for Broad Clean Energyrdquo Louw A July 2012 London United Kingdom
Bloomberg New Energy Finance (2012b) ldquoMemo to Policy Makers Re-charge the Development Banksrdquo Monthly VIP Comment Monthly Clean Energy Comment for Senior Executives McCrone A Volume V Issue 60 April 2012
BNDES (2012) ldquoAnnual Report 2011rdquo available at httpwwwbndesgovbrSiteBNDESexportsitesdefaultbndes_ptGaleriasArquivosempresaRelAnualra2011relatorio_anual2011_trilinguepdf
BNDES (2012b) Personal Communications and direct reporting April-August 2012
Buchner B Brown L Corfee-Morlot J (2011) ldquoMoni-toring and Tracking Long-Term Finance to Support Climate Actionrdquo OECD COMENVEPOCIEASLT(2011)3
Buchner B Falconer A Herve-Mignucci M Trabacchi C Brinkman M (2011) ldquoThe Landscape of Climate Financerdquo CPI Report October 2011
Buchner B A Falconer C Trabacchi and J Wilkinson (2012) A Survey of Systems to Monitor and Evalu-ate Climate Finance Effectiveness A CPI Report July 2012
Buchner B J Brown and J Corfee-Morlot (2011) ldquoMonitoring and Tracking Long-Term Finance to Support Climate Action httpwwwoecdorgenvironmentclimatechange48073739pdf
Caijing News (2012) ldquoChinarsquos Photovoltaic Industry on Brink of Bankruptcy Reportrdquo httpenglishcaijingcomcn2012-08-08111998243html accessed online at 2012-09-06
CEA (2007) ldquoDesign to Win Philanthropyrsquos Role in the Fight against Global Warmingrdquo California Environ-mental Associates San Francisco August 2007 available at httpwwwclimateactionprojectcomdocsDesign_to_Win_8_01_07pdf
CEC (2011) ldquoLa taxe carbone de la theorie agrave la pra-tique Les problematiques liees agrave lrsquoinstauration drsquoune taxe carbonerdquo Chaire Economie du Climat Universite Paris-Dauphine CDC Climate FLM No 20 February 2011 available at httpwwwchaireeconomieduclimatorgwp-contentuploads20110211-02-12-FLM-n20-Elbeze-De-Perthuispdf
China Development Bank (CDB) ldquoAnnual Report 2011rdquo available at httpwwwjicagojpenglishpublica-tionsreportsannual2011indexhtml
China-Denmark Wind Energy Development ProjectChina Renewable Energy Association 2009 ldquoChina Wind Energy and Electricity Tariff Develop-ment Reportrdquo
Clapp C J Ellis J Benn and J Corfee-Morlot (2012) ldquoTracking Climate Finance What and Howrdquo 04-May-2012COMENVEPOCIEASLT(2012) Paris France OECD httpwwwoecdorgenvi-ronmentclimatechange50293494pdf
Climate Commission (2012) ldquoThe Critical Decade International Action on Climate Changerdquo Flan-nery T R Beale and G Hueston Commonwealth
68
The Landscape of Climate Finance 2012
69
The Landscape of Climate Finance 2012December 2012 December 2012
of Australia (Department of Climate Change and Energy Efficiency) 2012
Corfee-Morlot J Guay B and Larsen KM (2009) ldquoFinancing for Climate Change Mitigation Towards a Framework for Measurement Reporting and Verificationrdquo OECDIEA Information Paper Paris October 2009
CPI (2010) The State of International Climate Finance Is it Adequate and is it Productive Climate Policy Initiative Venice available at httpclimatepolicyinitiativeorgpublicationthe-state-of-international-climate-finance-is-it-adequate-and-is-it-productive
CPI (2011) Inaugural Meeting of the San Giorgio Group Expanding Green Low-Emissions Finance ldquoProposed Analytical Program to Support Green Low-Emissions Financerdquo Island of San Giorgio Maggiore Venice Italy October 2010
CPI (2012) ldquoThe Landscape of Climate Finance in Germanyrdquo I Juergens H Amecke R Boyd B Buchner A Novikova A Rosenberg K Stelmakh A Vasa CPI Report (forthcoming) CPI consulta-tion draft as of October 2012 available at httpclimatepolicyinitiativeorgberlin
CPI (2012b) ldquoSecond Annual San Giorgio Group Meeting Expanding Green Low-Emission Financerdquo httpclimatepolicyinitiativeorgveniceeventsecond-annual-san-giorgio-group-meeting-expanding-green-low-emissions-finance
CPI (2013) ldquoAnnual Review of Low-Carbon Develop-ment in China (2013)rdquo CPI Report (forthcoming)
Development Bank of Southern Africa (DBSA) (2012) ldquoAnnual Report 201011rdquo South Africa
Ecofys-IDFC (2012) ldquoMapping of Green Finance Deliv-ered by IDFC Members in 2011rdquo Houmlhne N Khosla S Fekete H Gilbert A
Elbeze J and C de Perthuis 2011 Twenty Years of Carbon Taxation in Europe some lessons learned Information and Debates Series No 9 April 2011 Chaire Economie di Climat
Environmental Grantmakers Association (EGA) 2012 Tracking the Field Volume 3 Exploring Environ-mental Grantmaking httpcymcdncomsiteswwwwingsweborgresourceresmgrfilesfinal_report_v3pdf
European Bank for Recontruction and Development (EBRD) Sustainable Energy Financing Facility
(SES) May 2012 available at httpwwwebrdcomdownloadsresearchfactsheetsseffpdf
European Commission (EC) (2011) ldquoProposal for a Council Directive Amending Directive 200396EC Restructuring The Community Framework for The Taxation of Energy Products and Electricityrdquo Brussels SEC(2011) 409 httpeceuropaeutax-ation_customsresourcesdocumentstaxationsec_2011_409_impact_assesment_part1_enpdf
Eurostat (2011) ldquoStatistic in Focus 672011rdquo Environ-ment and Energy httpeppeurostateceuropaeucacheITY_OFFPUBKS-SF-11-067ENKS-SF-11-067-ENPDF European Commission
Eurostat (2011b) Environmental Taxes httpeppeurostateceuropaeustatistics_explainedindexphpEnvironmental_taxes European Commission
Falconer A and G Frisari 2012 San Giorgio Group Case Study ldquoOuarzazate I CSPrdquo Climate Policy Initia-tive available at httpclimatepolicyinitiativeorgour-workpublications
Fransen T Stasio K S Nakhooda (2012) ldquoThe US Fast-Start Finance Contributionrdquo World Resource Institute Overseas Development Institute May 2012 Working Paper available at httpwwwodiorgukpublications6560-usa-america-fast-start-finance-unfccc-pledge
FS-UNEP and BNEF (2012) ldquoGlobal Trends in Renew-able Energy Investment 2012rdquo Frankfurt SchoolUNEP Collaborating Centre for Climate amp Sustain-able Energy Finance and Bloomberg New Energy Finance Available at httpfs-unep-centreorgpublicationsglobal-trends-renewable-energy-investment-2012
Gibbs D (2012) ldquoLessons Learnt from Fast‐Start Financerdquo Presentation at the First workshop on Long-term Finance UNFCCC July 2012 httpunfcccintfilescooperation_supportfinan-cial_mechanismlong-term_financeapplicationpdfgibbs11june2012pdf
Gomez-Echeverri L (2010) National Funding Entities Their Role in the Transition to a New Paradigm of Global Cooperation on Climate Change European Capacity Building Initiative httpwwweuroca-pacityorgdownloadsNFEsPolicyReportpdf
Inada K (2011) Presentation ldquoClimate Finance JICA Implications for the Green Climate Fundrdquo August 29 2011 Japan International Cooperation Agency (JICA) httpwwwdbsaorgConfrFCCWorkshop20Material2011208202920
70
The Landscape of Climate Finance 2012
71
The Landscape of Climate Finance 2012December 2012 December 2012
JICA20DBSA20Climate20Finance20(2)20[Compatibility20Mode]pdf
Independent Evaluation Group (IEG) World Bank IFC and MIGA Adapting to Climate Change Assess-ing the World Bank Group Experience Phase III of the World Bank Group and Climate Change Independent Evaluation Group Washington DC United States available at httpiegworldbank-grouporgcontentdamiegclimate_change3cc3_full_evalpdf
Indian Renewable Energy Development Agency (IREDA) ldquoAnnual Report 2010-2011rdquo
Inter-American Development Bank (IDB) African De-velopment Bank (AfDB) Asian Development Bank (ADB) European Bank for Reconstruction and Development (EBRD) European Investment Bank (EIB) World Bank (WB) International Finance Corporation (IFC) (2012) ldquoJoint MDB Report on Mitigation Finance 2011rdquo available at httpclimatechangeworldbankorgsitesdefaultfilesMMF_2011_version_21pdf
Inter-American Development Bank (IDB) (2011) ldquoMexico CTF Renewable Energy Financing Facility (CTF-REF)rdquo (ME-L1109 httpwwwclimateinvestmentfundsorgcifsitesclimatein-vestmentfundsorgfilesApproval20by20Mail20Mexico20Renewable20Energy20Program20Proposal20III20PIDpdf
International Development Finance Club (2012) ldquoWork Plan 2 Leverage Private and Public Funds Position Paper on Leverage of Public and Private Fundsrdquo IDFC 2012
International Energy Agency (IEA) (2012) ldquoWorld Energy Outlook 2012rdquo November 2012 Paris France
International Finance Corporation (IFC) (2012) ldquoMan-agementrsquos Discussion and Analysis and Con-solidated Financial Statementsrdquo June 30 2012 Washington DC United States
International Sustainability Unit (ISU) The Princes Charitiesrsquo (2012) ldquoInterim REDD+ Finance Current Status and Ways Forward for 2013-2020rdquo November 2012
Japan International Cooperation Agency (JICA) (2012) ldquoAnnual Report 2011rdquo
Japan International Cooperation Agency (JICA) (2012b) httpwwwjicagojppublicationspamphpdfreddpdf
Junghans L S Harmeling 2012 Different Tales from Different Countries A first assessment of the OECD ldquoAdaptation Markerrdquo Germanwatch httpgermanwatchorgdedownload6741pdf
KfW Bankengruppe Bank aus Verantwortung ldquoAnnual Report 2011rdquo and Exhibit (D) Germany available at httpwwwkfwdekfwenIIIDownload_CenterFinancial_PublicationsFinancial_publica-tions1_Geschaeftsberichte_E120706_006_RZ_KfW_GB11_EN_Webpdf
KfW Bankengruppe Bank aus Verantwortung ldquoFinancial Report 2011rdquo Germany
KfW Bankengruppe KfW Entwicklungsbank DEG ndash Deutsche Investitions- und Entwicklungsge-sellschaft mbH (2011) ldquoAdaptation to Climate Change Cooperation with Developing Countries ndash Climate and Developmentrdquo Frankfurt am Main Germany June 2011
Khan Hannan S M Doha S Haque S (2011) ldquoThe Ban-gladesh National Climate Funds A Brief History and Description of the Bangladesh Climate Change Trust Fundrdquo LDC paper series IIED and ECBI
Latt J (2011) ldquoMexico as an Emerging Donorrdquo EDC 2020 Policy Brief No18 March 2011
Marion V A Esch L Grieszlighaber F Fuller F Mers-mann F Fallasch L De Marez (2012) ldquoGerman Fast- Start Lessons Learned for Long-Term Financerdquo Climate Analytics Wuppertal Institute Germanwatch August 2012 httpwwwbmu-klimaschutzinitiativedefiles2012-German_FSF_Study_1076pdf
Michaelowa AMichaelowa K (2011) Coding Errors or Statistical Embellishment The Political Economy of Reporting Climate Aid In World Development Vol 39 No 11 2011 pp 2010ndash2020
Ministry of Economy Finance and Industry (Minefi) (2011) Ministry of Ecology Sustainable Develop-ment Transport and Housing Ministry of Foreign and European Affairs ldquoHow Francersquos Development Partnerships are Meeting the Challenge of Climate Change Fast-start implementation for 2011 Paris France
Nacional Financiera (2012) ldquoAnnual Report 2011rdquo Mexico
National Renewable Energy Laboratory (NREL) 2009 Carbon Taxes a Review of Experience and Policy Design Considerations Sumner J L Bird and H
70
The Landscape of Climate Finance 2012
71
The Landscape of Climate Finance 2012December 2012 December 2012
Smith Technical Report NRELTP-6A2-47312 December 2009
Nelson D G Shrimali G S Goel C Konda R Kumar (2012) ldquoMeeting Indiarsquos Renewable Energy Targets How Policy Can Help Overcome Financing Chal-lenges and Encourage Investmentrdquo CPI Report (forthcoming)
Nordic Development Fund (NDF) (2012) ldquoAnnual Report 2011rdquo Helsinki Finland
Oakes N Leggett M Cranford M Vickers H (eds) (2012) ldquoThe Little Forest Finance Bookrdquo Global Canopy Programme Oxford
OECD (2007) ldquoReporting Directive for the Creditor Reporting Systemrdquo DCDDAC(2007)39Final Organisation for Economic Co-operation and Development (OECD) Paris September 2007
OECD (2010) Statistics on Export Credits Trade and Agriculture Directorate (TAD) available at httpwwwoecdorgdepartment03355en_2649_34169_1_1_1_1_100html
OECD (2011) ldquoFirst-Ever Comprehensive Data on Aid For Climate Change Adaptationrdquo Organisation for Economic Co-operation and Development (OECD) November 2011 Paris available at httpwwwoecdorgdacaidstatistics49187939pdf
OECD (2011b) Creditor Reporting System _Full down-load file ldquoCRS 2009ziprdquo DAC Creditor Reporting System database httpstatsoecdorgIndex aspxDatasetCode=CRSNEW data down- loaded 5th April 2011
OECD (2012) Creditor Reporting System _Full down-load file ldquoCRS 2011ziprdquo DAC Creditor Reporting System database httpstatsoecdorgIndexaspxDatasetCode=CRSNEW version June 2012
OECD (2012b) Full list of climate change mitigation and climate change adaptation aid activities 2010 httpwwwoecdorgdacaidstatis-tics50089594xlsx
OECD (2012c) ldquoUnderstanding on Export Credits for Renewable Energy Climate Change Mitigation and Water Projects as new Annex IV available at httpsearchoecdorgofficialdocumentsdisplaydocumentpdfdoclanguage=enampcote=tadpg(2012)9
OECD (2012d) Glossary of Statistical Terms httpstatsoecdorgglossaryindexhtm
OECDEuropean Environment Agency Database on Instruments Used for Environmental Policy and Natural Resources Management httpwww2oecdorgecoinstqueriesindexhtm
Parker C J Brown J Pickering E Roynestad N Mardas A W Mitchell (2009) ldquoThe Little Climate Finance Bookrdquo Global Canopy Programme
Peters-Stanley M K Hamilton D Yin (2012) ldquoLeverag-ing the Landscape State of the Forest Carbon Markets 2012rdquo Ecosystem Marketplace
Pinheiro AC (2012) ldquoThe Role Of Concessionary Finance In Brazilrdquo CDE Insight June 2012
REN21 (2012) ldquoRenewables 2012 Global Status Reportrdquo at httpwwwren21netdefaultaspxtabid=5434
Republique Tunisienne Ministegravere du Developpement et de la Cooperation Internationale Institut National de La Statistique (INS) (2010) laquo Annuaire Statis-tique de La Tunisie 2005-2009rdquo December 2010
Ryan L Selmet N and Aarsud A (2012) ldquoPlugging the Energy Efficiency Gap with Climate Financerdquo IEA Insights Series 2012 OECDIEA Paris
Simula M (2010) ldquoAnalysis of REDD+ Financing Gaps and Overlapsrdquo Ardot available at httpreddplus-partnershiporg65563en
Smallridge D B Buchner C Trabacchi M Netto JJ Gomes L Serra (2012) ldquoThe Role of National Development Banks in Intermediating Interna-tional Climate Finance to Scale Up Private Sector Investmentsrdquo Inter-American Development Bank Working Paper 2012 (forthcoming)
Streck C and C Parker (2012) ldquoFinancing REDD+rdquo in Angelsen Arild Maria Brockhaus William D Sunderlin and Louis V Verchot 2012 Analysing REDD+ Challenges and choices httpwwwcifororgpublicationspdf_filesBooksBAngelsen1201pdf
Suennen R (2012) Contractual relationships between CMEs and CPAsrdquo Addis Ababa April 2012 KfW Bankengruppe Presentation available at httpaf-ricacarbonforumcom2012docsPresentationsd2_Training20Session202a_PoARainer20Suennenpdf
The Nature Conservancy (TNC) (2012) ldquoClimate Finance Readiness Lessons Learned in Developing Countriesrdquo J Gastelumndi The Nature Conser-vancy Available at httpwwweldisorggodisplayamptype=Documentampid=62706
72
The Landscape of Climate Finance 2012
73
The Landscape of Climate Finance 2012December 2012 December 2012
The World Bank (2011) ldquoAnnual Report 2011rdquo Washing-ton DC United States
Trabacchi C V Micale G Frisari (2012) San Giorgio Group Case Study ldquoPROSOL Tunisiardquo available at httpclimatepolicyinitiativeorgpublicationsan-giorgio-group-case-studies
UNDP (2011) ldquoBlending Climate Finance Through Na-tional Climate Funds A Guidebook for the Design and Establishment of National Funds to Achieve Climate Change Prioritiesrdquo United Nations Devel-opment Programme September 2011 httpwwwundporgcontentdamundplibraryEnviron-ment20and20EnergyClimate20ChangeCapacity20DevelopmentBlending_Climate_Finance_Through_National_Climate_Fundspdf
UNEP (2010) ldquoBilateral Finance Institutions amp Climate Change A Mapping of Public Financial Flows for Mitigation and Adaptation to Developing Countries in 2010rdquo United Nations Environment Programme Stockholm Environment Institute
UNFCCC (2010) ldquoCancun Agreementsldquo Art 71 available at httpunfcccintmeetingscancun_nov_2010items6005php
US PREF (2012) ldquoRamping up Renewables Leverag-ing State RPS Programs amid Uncertain Federal Supportrdquo US Partnership for Renewable Energy Finance White Paper authored by DB Climate Change Advisors (DBCCA) httpuspreforgwp-contentuploads201206Ramping-up-Renewables-Leveraging-State-RPS-Programs-amid-Uncertain-Federal-Support-US-PREF-White-Paper1pdf
Varadarajan U B Pierpont A Hobbs K Rowley (2012) ldquoSupporting Renewables while Saving Taxpayers Moneyrdquo CPI Report September 2012 available at httpclimatepolicyinitiativeorgwp-contentuploads201209Supporting-Renewables-while-Saving-Taxpayers-Moneypdf
Vieweg M Esch A Grieszlighaber L Fuller F Mersmann F Fallasch F De Marez L et al (2012) ldquoGerman Fast Start Finance Lessons Learned for Long-Term Financerdquo Climate Analytics Wuppertal Institute Germanwatch August 2012 available at httpwwwclimateanalyticsorgsitesdefaultfilesat-tachmentsnews2012-German_FSF_Studypdf
Visconti G M Netto JJ Gomes (2012) Presentation ldquoRole of National Development Banks in Promoting Climate Financerdquo Inter-American Development
Bank available at httpclimatepolicyinitiativeorgvenicefiles201209Viscontipdf
Vivid Economics (2012) ldquoCarbon taxation and Fiscal Consolidation the Potential of Carbon Pricing to Reduce Europersquos Fiscal Deficitsrdquo report prepared for the European Climate Foundation and Green Budget Europe May 2012
Vrana M and Cracknell J (2011) ldquoEnvironmental Funding by European Foundations A Snapshotrdquo Environmental Foundation Centre (ECF) Sep-tember 2011 available at httpwwwefcbeprogrammes_servicesresourcesDocumentsefc_environmental_finalpdf
World Bank (2012) ldquoState and Trends of the Carbon Markets 2012rdquo Washington DC May 2012
Weiss W and F Mauthner (2012) ldquoSolar Heat World-wide Markets and Contribution to the energy supply 2010 (edition 2012) at httpwwwiea-shcorgpublicationsdownloadsSolar_Heat_Worldwide-2012pdf
72
The Landscape of Climate Finance 2012
73
The Landscape of Climate Finance 2012December 2012 December 2012
WebsitesAfrican Development Bank (AfDB) website at http
wwwafdborgen
Agencia Financiera de Desarrollo (AfD) website at httpwwwafdgovpy
Asian Development Bank (AsDB) website at httpwwwadborg
Banco de Desarollo de America Latina Development Bank of Latin America (CAF) at httpwwwcafcomviewindexaspms=19
Banco Estado de Chile website at httpswwwban-coestadocl
Bancoldex Colombia website at httpwwwbancoldexcomportaldefaultaspx
Black Sea Trade amp Development Bank website at httpwwwbstdborg
Bloomberg New Energy Finance website at httpbnefcom
Brazilian Development Bank BNDES website at httpwwwbndesgovbrSiteBNDESbndesbndes_enInstitucionalPressNoticias201220120213_fun-doclimahtml
Caisse de Depot et de Gestion (CDG) httpwwwcdgma
China Development Bank (CDB) httpwwwcdbcomcnenglishindexasp
Climate Change Expert Group (CCXG) on the UNFCCC website at httpwwwoecdorgdocument4403746en_2649_34361_1904108_1_1_1_100html
Climate Investment Funds website at httpsclimatein-vestmentfundsorgcif
Development Bank of Southern Africa (DBSA) website at httpwwwdbsadrm-zacom
European Bank for Reconstruction and Development (EBRD) website at httpwwwebrdcompageshomepageshtmlamppanel1-2
European Bank for Reconstruction and Development (EBRD) Sustainable Energy Initiative (SEI) website at httpwwwebrdcompagessectorenergyef-ficiencyseishtml
European Commission Climate Action website at httpeceuropaeuclimapoliciesetsauction-ing_enhtm
European Investment Bank (EIB) website at httpwwweiborg
European Commission Eurostat (2012) Environmental and Energy data base accessed on September 2012 httpappssoeurostateceuropaeunuishowdo
European Commission Eurostat (2012) Environmental Taxes httpeppeurostateceuropaeustatis-tics_explainedindexphpEnvironmental_taxes
French Development Agency (AfD) Agence Franccedilaise de Developpement website at httpwwwafdfrlangenhome
Government of Brazil website at wwwbrasilgovbr
Green Climate Fund website at httpgcfundnethomehtml
International Development Finance Club website at httpwwwidfcorg
Indian Renewable Energy Development Agency (IREDA) website at httpwwwiredagovin
Indonesia Exim Bank website at httpwwwindonesi-aeximbankgoid
Industrial Development Bank of Turkey (TSKB) website at httpwwwtskbcom
Inter-American Development Bank (IDB) website at httpwwwiadborg
International Finance Corporation (IFC) website at httpswwwifcorg
Japan International Cooperation Agency (JICA) website at httpwwwjicagojpenglish
KfW Group website at httpwwwkfwdekfwenKfW_Groupindexjsp
Korea Finance Corporation (KOFC) httpwwwidfcorgMemberskofcaspx
Multi-Donor Trust Fund Office Gateway website at httpmdtfundporg
Nacional Financiera Banca de Desarollo (NAFIN) website at httpwwwnafincomportalnfcontenthomehomehtml
Nordic Development Fund website at wwwndffi
OANDA website at httpwwwoandacom
ODI HBF Climate Funds Update database at httpwwwclimatefundsupdateorg
74
The Landscape of Climate Finance 2012
75
The Landscape of Climate Finance 2012December 2012 December 2012
OECD DAC Creditor Reporting System database at httpwwwoecdorgdataoecd50175037721htm
OECD Glossary of Statistical Terms at httpstatoecdglossary
OECD Trade and Agriculture Directorate (TAD) Export Credits Database at httpwwwoecdorgdepartment03355en_2649_34169_1_1_1_1_100html
OECD Userrsquos Guide to the CRS Aid Activities database at wwwoecdorgdacstatscrsguide
OECD website ldquoFocus on Aid Targeting the Objectives of the Rio Conventionsrdquo at wwwoecdorgdacstatsrioconventions
OECD List of OECD Member Countries at httpwwwoecdorggenerallistofoecdmembercoun-tries-ratificationoftheconventionontheoecdhtm
OECDEEA database on instruments used for environ-mental policy and natural resources management httpwww2oecdorgecoinstqueriesindexhtm
Overseas Private Investment Corporation (OPIC) website at httpwwwopicgov
Small Industries Development Bank of India (SIDBI) website at httpwwwsidbicom
The Brazilian Development Bank website at httpwwwbndesgovbr
The Financial Times FDi Intelligence website at httpwwwfdiintelligencecom
The Foundation Center website at httpfoundation-centerorggpfclimatechangechart-oecdhtml
The Global Environmental Facility (GEF) project data-base at httpwwwgefonlineorg
The Nordic Development Fund (NDF) website at httpwwwndffi
UNCTAD interactive database of Division on Invest-ment and Enterprise at httpwwwunctadorgtemplatesPageaspintItemID=3199amplang=1
UNEP Risoslash Centre CDMJI Pipeline Analysis and Data-base at httpcdmpipelineorg
UNFCCC CDM Registry website at httpcdmunfcccintRegistryindexhtml
UNFCCC Finance Portal for Climate Change website at httpunfcccintcooperation_supportfinan-cial_mechanismfinance_portalitems5824php
Adaptation Private Sector Initiative (PSI) at httpunfcccintadaptationnairobi_work_programmeprivate_sector_initiativeitems4623php
Vnesheconombank (VEB) website at httpwwwvebru
World Bank Project amp Operations database at httpgoworldbankorgIAHNQIVK30
World Bank website at httpworldbankorg
74
The Landscape of Climate Finance 2012
75
The Landscape of Climate Finance 2012December 2012 December 2012
Appendix A - Main assumptions and methodologyThe Scope of Private Climate FinanceWe covered 1636 individual active projects from the Bloomberg New Energy Finance database representing 82 of the extra capacity in developed countries and 89 of the extra capacity in developing countries (539 GW in total)
For both developed and developing countries we looked at the most relevant ldquo2011 financing storiesrdquo each rep-resenting more than 1 GW of extra capacity financed in 2011
Developed countries (OECD) 45 of the projects for 45 of total capacity
The top 7 stories which represent 75 of the proj-ects for 82 of capacity in developed countries are as follows
bull US wind and solar financing
bull Canadian wind financing
bull German wind financing
bull UK wind and biomass amp waste financing
bull Spanish wind and solar financing
bull Italian solar financing
bull Korean wind and marine financing (one large-scale project)
Developing countries (non-OECD) 55 of the projects for 55 of total capacity
The top 3 stories which represent 85 of the projects for 89 of capacity in developing countries are as follows
bull Chinese wind solar and biomass amp waste financing
bull Indian wind financing and solar financing
bull Brazil wind financing
Small-scale distributed capacityData for small-scale distributed capacity (PV and Solar Water Heater) were retrieved from FS-UNEP and BNEF (2012) and Weiss and Mauthner (2012) and catego-rized by geography and category of actors based on the data available
ldquoGreenrdquo FDI dataThe data used in the Landscape 2012 were retrieved by UNCTAD experts from the fDi Markets database Figures covered greenfield investments occurred glob-ally in 2011 We decided to exclude cross-border MampA as we decided to focus on new investment in emission reductionstabilization only
The sectors covered were the following renewable gen-eration (biomass geothermal hydroelectric solar tidal and wind energy) and waste management
To avoid double counting with the data retrieved from the BNEF database FDI data were allocated as the range of uncertainty to the BNEF subtotal except for flows that are typically of domestic nature such as gov-ernmentsrsquo budget and households ones
CURRENCY ANNUAL AVERAGE
EURUSD (2010) 13277
EURUSD (2011) 13926
BR$USD (2011) 05997
TNDUSD (2009) 074654
Source Oanda (2012)
76
The Landscape of Climate Finance 2012
77
The Landscape of Climate Finance 2012December 2012 December 2012
Appendix B - A summary of the Landscape 2011FINANCE FLOWS AMOUNTS
(ON AVERAGE) METHODOLOGY
ALL usd 97 bIllIOn
bull Indicative estimates of annual flows for the latest year available 20092010 (variable according to the data source)
bull Estimates spanning multiple years adjusted to produce annual-equivalentsbull Includes incremental costs and capital investmentbull Most data presented related to commitments in a given year due to limited availability of
disbursement data
BILATERAL usd 228 bIllIOn
bull Bilateral contributions reported through the OECDrsquos Creditor Reporting System Aid Activities (OECD CRS) database
bull Bilateral Finance Institutions direct reporting (TC 2011 UNEP 2010 BNEF 2011)bull an estimate of the volume of green export credits (OECD statistics on export credits 2010
as cited in Buchner et al 2011b)
MULTILATERAL usd 144 bIllIOnbull Multilateral institutionsrsquo direct reporting and reporting by various tracking initiatives
including TC 2011 UNEP 2010 BNEF 2011
CLIMATE FUNDS usd 25 bIllIOn bull ODIHBF Climate Funds Update and reporting by Fund administrators
CARBON OFFSET FINANCE usd 22 bIllIOn
bull This range was calculated using data from the World Bank the UNFCCC and IGES to apply surveyed average annual primary carbon offset prices to the annual volume of offsets issued
PRIVATE FINANCE usd 55 bIllIOn
Range of 370-722 billion betweenbull lsquoGreenrsquo Foreign Direct Investments (FDI) Based on the United Nations Conference on Trade
and Development database (UNCTAD 2010)bull Renewable energy investments based on the United Nations Environment Programme
(UNEP) and BNEF (UNEP and BNEF 2011) regarding renewable energy investments in developing countries (from developed countries other developing countries and private investment from national investors)
VOLUNTARY PHILANTHROPIC CONTRIBUTIONS
usd 450 mIllIOn bull Voluntary philanthropic contributions based on CEA 2007 Ecosystem Marketplace 2011
76
The Landscape of Climate Finance 2012
77
The Landscape of Climate Finance 2012December 2012 December 2012
Appendix C - Existing climate finance tracking databases and major ongoing initiativesTracking public climate financeAdaptation Fund Funded Projects and Funding Status
data at httpswwwadaptation-fundorgfunded_projects
African Development Bank Group (AfDB) Project Portfolio database at httpwwwafdborgenprojects-and-operationsproject-portfolio
AidData Development Finance and Foreign Aid Portal at httpaiddataorg
Asian Development Bank project database at httpwwwadborgprojects
European Bank for Reconstruction and Development (EBRD) online project database at httpwwwebrdcomsafsearchhtmltype=project
European Commission Climate Action Fast-start Finance list of actions tracked at httpeceuropaeuclimapoliciesfinanceinternationalfaststartindex_enhtm
European Investment Bank (EIB) Project finance database at httpwwweiborgprojectsloanssectorsindexhtm
Global Climate Change Alliance (GCCA) Technical and Financial Support database at httpwwwgccaeutechnical-and-financial-support
GEF project database available at httpwwwgefon-lineorg
Federal Ministry for the Environment Nature Conserva-tion and Nuclear Safety Germany National and International Climate Initiative online project data-base at httpwwwbmu-klimaschutzinitiativedeindex_enhtml
Inter-American Development Bank (IDB) online project database at httpwwwiadborgenprojectsprojects1229html
Multi-Partner Trust Fund Office Development and Climate Change Fund at httpmptfundporgfactsheetfundMDG00
ODIHeinrich Boumlll Foundation Climate Funds Update at httpwwwclimatefundsupdateorg
OECD Creditor Reporting System (CRS) Aid Ac-tivities database at httpstatsoecdorgIndexaspxdatasetcode=CRS1
United Nations Development Programme (UNDP) United Nations Environment Programme UNFCCC World Bank Group Fast Start Finance website at (updated as of December 2011) httpwwwfaststartfinanceorg
UNDPGEF Small Grants Programme project database at httpwwwundporgnpenvironment--energyprogramsgp-35html
UNFCCC Finance Portal for Climate Change at httpunfcccintcooperation_supportfinan- cial_mech-anismfinance_portalitems5824php
_____Funding for Adaptation interface at httpunfcccintadaptationimplementing_adaptationadapta-tion_funding_interfaceitems4638php
US Government RecoveryGov Track the Money httpwwwrecoverygovPagesdefaultaspx
Voluntary REDD+ Database REDD+ Partnership at wwwreddplusdatabaseorg
World Bank OECD Aid flows at httpsiteresourcesworldbankorgCFPEXTResourc- es299947-1266002444164indexhtml
World Bank UNDP Climate Finance Options database at wwwclimatefinanceoptionsorgcfo
World Bank Project amp Operations database at httpwebworldbankorgWBSITEEXTERNALPROJECTS0menuPK51562~pagePK64133621~piPK64140076~theSitePK4094100html
WRI Summary of Developed Country lsquoFast-Startrsquo Climate Finance Pledges (updated as f November 2011) at httpwwwwriorgstories201002summary-developed-country-fast-start-climate-finance-pledges
Tracking private climate financeBloomberg New Energy Finance Industry Intelligence
Desktop httpbnefcomservicesindustry- intelligence-slash-desktop
Dealogic ProjectWare and Loan Analytics httpwwwdealogiccoukenmarketdatahtm
Ecosystem Marketplace Bloomberg New Energy Finance Voluntary Carbon Market data at httpmoderncmsecosystemmarketplacecomrepositorymoderncms_documentssovcm_postlaunchreport_20121pdf
78
The Landscape of Climate Finance 2012
79
The Landscape of Climate Finance 2012December 2012 December 2012
_____Publication at httpwwwforest-trendsorgpub-lication_detailsphppublicationID=3164
Environmental Finance Carbon Funds httpwwwenvironmental-financecombooks
European Commission Eurostat FDI Statistics httpeppeurostateceuropaeu
EEX European Energy Exchange data at httpwwweexcomen
Financial Times FDi Intelligence database httpwwwfdiintelligencecom
Foundation Centre research database httpfounda-tioncenterorgfindfundersstatistics
Institute for Global Environmental Strategies (IGES) CDM Programme database at httpwwwigesorjpencdmindexhtml
OECD Creditor Reporting System (CRS) Aid Ac-tivities database at httpstatsoecdorgIndexaspxdatasetcode=CRS1
OECD International Direct Investment Statistics data-base at httpwwwoecdorgdafinternationalin-vestment
Point Carbon - Carbon Project Manager Carbon Market Trader EU at httpwwwpointcarboncomtrading
Thomson Reuters Trader for Commodities Advanced at httptrainingthomsonreuterscomportalproductphppid=4
Thomson Reuters Eikon for Energy at httpthomson-reuterscomproducts_servicesfinancialfinan-cial_productsa-zeikon_for_energy
UNCTAD Interactive Database Division on Investment and Enterprise at httpstatsunctadorgfdi
UNEP-Risoslash CDMJI Pipeline Analysis and Database at httpcdmpipelineorg
UNFCCC CDM and JI Project Activities databases at httpcdmunfcccintProjectsprojsearchhtml
_____Adaptation Private Sector Initiative (PSI) at httpunfcccintadaptationnairobi_work_pro-grammeprivate_sector_initiativeitems4623php
World Bank Private Participation in Infrastructure (PPI) Project Database at httpppiworldbankorg
_____State and Trends of Carbon Market 2012 at httpsiteresourcesworldbankorgINTCARBON-
FINANCEResourcesState_and_Trends_2012_Web_Optimized_19035_CvrampTxt_LRpdf
_____ World Development Indicators and Global Development Finance at http httpdatabankworldbankorgddphomedoStep=1ampid=4
78
The Landscape of Climate Finance 2012
79
The Landscape of Climate Finance 2012December 2012 December 2012
Appendix D - Details on Development Finance Institutions
BILATERAL FINANCE INSTITUTIONS
REPORTING YEAR SOURCE AND NOTES
AfD Agence Franccedilaise de Deacuteveloppement- Proparco
2011
Self-reporting via CPI surveyGiven that some of the projects supported contributed to both mitigation and adaptation purposes we allocated the dual purpose money according to the total distribution between mitigation and adaptation projects
JICAJapan International Cooperation Agency
2011 Self-reporting via CPI survey
KfW - KfW Entwicklungsbank- DEG
2011 Self-reporting via CPI survey
OPICOverseas Private Investment Corporation
2011 Self-reporting via CPI survey
MULTILATERAL FINANCE INSTITUTIONS
REPORTING YEAR SOURCE AND NOTES
AfDB African Development Bank
2011 Self-reporting via CPI survey - mitigation data only
AsDB Asian Development Bank
2011Self-reporting via CPI survey - mitigation data onlyBased on the infornation retrieved on the Banks website and at the best of our knowledge we allocated 100 of the reported portion of equity financing to balance sheet finance
EBRDEuropean Bank for Reconstruction and Development
2011Self-reporting via CPI surveyThe reported portion of equity financing was allocated 5050 between balance sheet financing and project-level equity due to data availabiltiy constraints
EIB European Investment Bank
2011
Joint MDBs Mitigation Finance Report (IDB et al 2012) The figure included hence represents financing to mitigation projects onlyTo retrieve the breakdown by instruments sectors and geography we applyed the shares presented in UNEP-SEI (2011)
EU Institutions 2010
OECD CRS 2010 data (OECD 2012)The figure included in the Landscape 2012 represents aid marked both principal and significantFinancing with multi-purpose objectives (ie both mitigation and adaptation) was allocated according to the distribution between mitigation only and adaptation only projects (55 vs 45)
IDBInter-American Development Bank
2011Self-reporting via CPI surveyThe portion of cliamte finance committed to Mexico was allocated to Central America
IFC International Finance Corporation
2011Self-reporting via CPI survey - mitigation data only
The reported portion of equity financing was allocated 5050 between balance sheet financing and project-level equity due to data availabiltiy constraints
NDFThe Nordic Development Fund
2011
NDF Annual Report 2011To estimate the thematic breakdown between mitigation and adaptation we applied the share retrievd from the OECD CRS 2009 dataset (OECD 2011b)The geographical breakdown was derived from NDF Annual Report 2011 and specifically we allocated committed funds based on the distribution of approved projects at the end of 2011 ie Africa (42) Asia (28) and Latin America (30)
80
The Landscape of Climate Finance 2012
81
The Landscape of Climate Finance 2012December 2012 December 2012
World Bank (IDA and IREDA)
FY 2011
Self-reporting via CPI surveyTo estimate the breakdown by instruments we applied- for IDA 6 to grants 94 to concessional loans as presented in the OECD CRS 2010 data (OECD 2012)- for IBRD 100 market-rate loans as presented in the OECD CRS 2009 data (OECD 2011a)The Bank asseses mitigation and adaptation co-benefits independently Hence to split total 2011 climate financing avoiding double counting we allocated the dual purpose money according to the total distribu-tion between mitigation and adaptation
NATIONAL amp SUB-REGIONAL
DEVELOPMENT FINANCE INSTITUTIONS
REPORTING YEAR SOURCE AND NOTES
AfD Agencia Financiera de Desarollo
2011 Self-reporting via CPI survey
BNDESBrazilian Development Bank
2011
Self-reporting via CPI surveyData included in the report represent dirbursement rather than committmentsThe bank reported financing to renewable energies and energy efficiency as a combined category (see also BNDES 2012) To derive the allocation pertaining to each sector we applied the share on 2011 disclosed deals per sectors as presented in BNEF (2012)
CAFDevelopment Bank of Latin America
2011 Self-reporting via CPI survey
DBSADevelopment Bank of Southern Africa
2011
Self-reporting via CPI surveyGeographical breakdownDBSAs financing to South Africa was considered as domestic spending as occurred in the area where the institution is based in
FIRAFideicomisos Instituidos en Relacioacuten a la Agricultura (Mexico)
2011 Self-reporting via CPI survey
IREDAIndian Renewable Energy Development Agency
2011
IREDA Annual Report (2011)To avoid potential double counting with other DFIs flows total financing was reduced by 40 which is the share of international assistance in IREDAs resource base for 2010-2011 as reported in IREDA (2011)In our estimate we have included financing directed to projects in the following sectors wind hydro biomass power generation energy efficiency and energy conservation solar energy waste to energy Instruments breakdownTo estimate the portion of low-cost debt versus market-rate debt we associated to the former the total amount of finance committed to those sectors for which in 2011 IREDA received the interest rate subsi-dies provided by the Indian Ministry of New and Renewable Energy (IREDA 2012) To market-rate debt was allocated the remaining portion
NAFINNacional Financiera (Mexico)
2011 Self-reporting via CPI survey
80
The Landscape of Climate Finance 2012
81
The Landscape of Climate Finance 2012December 2012 December 2012
BEBanco del Estado de ChileBancoldex SA ColombiaBCIECABEICentral American Bank for Economic IntegrationBSTDB Black Sea Trade and Development Bank of Greece CDGCaisse de Deacutepocirct et de Gestion MoroccoCDB China Development BankHBORCroatian Bank for Reconstruction and DevelopmentIndonesia EximbankKoFCKorea Finance CorporationSIDBI Small Industries Development Bank of IndiaTSKB Industrial Development Bank of TurkeyVEB Vnesheconombank Russia
2011
Ecofys-IDFC (2012) The volume of green finance stated in the report was adjusted by- the 7 share reported as other environmental projects as we opted to include only what banks reported as mitigation and adaptation- climate finance spending data received in response to CPIrsquos survey by the other NFIs and BFI above listed only those covered in the report- climate finance spending data received in response to CPIrsquos survey by AFD KFW and JICA which was re-allocated to the BFIs category- the share of Lower carbon energy generation project as it may have included fuel-to-fuel swtich project (eg fuel to gas coal to gas) or fossil fuel based co-generation- an esitmated portion of guaranteesrisk management instrumentsThe volumed obtained was allocated to mitigation and adaptation assuming a 89 vs11 breakdown which is in line with the report and the share observed in the financing of other BFIs and MFIsNote Due to the above and the includions of KFW Entwicklungsbank and DEGrsquos climate financing rather than the entire KFW Bankengruppe our NFIs total climate financing is lower as compared to the Ecofys-IDFC (2012) report We decided to include KFW Entwicklungsbank and DEGrsquo financing only for two main reasons (a) to avoid double counting with the money captured in the private finance flows and (b) to avoid distortions in the presentation of the BFIsrsquo money given the domestic-oriented focus of the excluded business areas of the Group and the lack of analogous examples across the group of BFIs We acknowledge the presence of public money sitting behind private investments quantifying it whenever possible and highlighting the key role played by KfW domestically in the support of the German Energiewende (see Box 10)Instruments breakdownTo estimate the breakdown between the instruments categories featured in the Landscape 2012 the ag-gregated volume of climate financing was1) Broken down between loans and others instruments (95 versus 5) as indicated in Ecofys-IDFC (2012)2) The resulting amount was then further broken down based on the weighted average observed for the other NFIs + BFIs for which we had data for3) The resulting portion of equity was allocated 5050 between balance sheet financing and project-level equity due to data availabiltiy constraintsGeographical breakdownTo esitmate the breakdown between the various greographical recipients we (1) allocated the estimated portion pertaining to CDB to China assuming that it invested domestically (2) the remaining portion was allocated according to the average shares among the other BFIs and NDBs for which we had data
82
The Landscape of Climate Finance 2012
83
The Landscape of Climate Finance 2012December 2012 December 2012
Appendix E - Details on Climate Funds
FUND NAME TYPE INSTRUMENTS
ESTIMATED LATEST YEAR
VALUE(USD MILLION)
SOURCE AND DETAILS
Adaptation Fund Multilateral1 Grants 856
Approved funds to projects in 2011 Source UNFCCC Finance Portal - Adaptation Fund Database of Projects - httpunfcccintcooperation_and_supportfinancial_mechanismadapta-tion_funditems6668phpApproved20project20data and Adaptation Fund Portal - httpwwwadaptation-fundorg consulted on July 27 2012
Global Environmental Facility (GEF)bull GEF Trust Fundbull Least Developed Countries Fundbull Special Climate Change Fund
MultilateralMultilateralMultilateral
Grants
22051702322181
Projects approved or endorsed by the CEO during 2011 as of end July 2012 Source Personal communication with GEF Secretariat July 2012
UN-REDD Programme Multilateral Grants 352
Multi-Partner Trust Fund Office May 2012 Third Consolidated Annual Progress Report on Activities Implemented under the UN-REDD Programme Fund for the period 1 January ndash 31 December 2011 httpmptfundporg
MDG Achievement Fund ndash Environment and Climate Change thematic window
Multilateral Grants 154Approved budget in 2011 for projects in the Environment and Climate Change thematic windowSource httpmdtfundporg
Climate Investment Funds (CIFs) including
bull the Clean Technology Fund and bull the Strategic Climate Fund
Multilateral
Grants conces-sional loans
loans and guarantees
9295Approved spend in 2011Source wwwclimatefundsupdateorg
Forest Carbon Partnership Facility (FCPF)
Multilateral Grants 214Approved spend in 2011Source wwwclimatefundsupdateorg
Congo Basin Forest Fund Multilateral Grants 573Approved spend in 2011Source wwwclimatefundsupdateorg
Global Energy Efficiency and Renewable Energy Fund
Multilateral Equity 174Approved spend in 2011Source wwwclimatefundsupdateorg
Global Climate Change Alliance Multilateral Grants 770Approved spend in 2011Source wwwclimatefundsupdateorg
Amazon Fund (Fundo Amazocircnia) Bilateral Grants 269Approved spend in 2011Source wwwclimatefundsupdateorg
BNDES Mata Atlacircntica initiative Bilateral Grants 58
R$ 118m approved in 2011 for 3 reforestation projects (con-verted to USD using an exchange rate of USD 048860R$ oandacom 1 September 2012) Source Press Release 26 May 2011 httpwwwbndesgovbrSiteBNDESbndesbndes_enInstitucionalPressNoticias201120110526_mataatlanticahtml
Germanys International Climate Initiative
BilateralGrants and
concessional loans
897Approved spend in 2011Source wwwclimatefundsupdateorg
82
The Landscape of Climate Finance 2012
83
The Landscape of Climate Finance 2012December 2012 December 2012
Australias International Forest Carbon Initiative
Bilateral Grants 314
Total approved spend No annual data is available Cumulative total approved spend is therefore divided by four given four full years of operation since June 2008 Source wwwclimate-fundsupdateorg
Indonesia Climate Change Trust Fund Bilateral Grants 00Approved spend in 2011Source wwwclimatefundsupdateorg
UK Internatioanl Climate Fund Bilateral Grants 782Approved spend in 2011Source wwwclimatefundsupdateorg
Guyana REDD+ Investment Fund Bilateral Grants 04
Administrative fees for project proposal preparation grants for projects approved in 2011 including (1) Institutional Strengthening US$ 305168 Source (2) Micro and Small Enterprise Development $127476
Japans Fast-Start Finance Bilateral
Grants loans risk instru-ments and equity
7997Cumulative total approved spend divided by two to give an approximation of annual flows over two full years of operation to date Source wwwclimatefundsupdateorg
1 Countries can access resources directly through National Implementing Agencies (NIEs) or using the services of a multilateral implementing entity (MIEs)
84
The Landscape of Climate Finance 2012
PB
The Landscape of Climate Finance 2012December 2012 December 2012
Appendix F - Financial flows for REDD+
FUND
ESTIMATED ANNUAL
COMMITMENTS (USD MILLION)
SOURCE
Bilateral and EU Institution commitments marked for climate change and forest related purpose
7000 OECD DAC database data for 2010 (OECD 2012)
Additional Fast Start Finance for REDD+ 2437CPI analysis of Fast Start Finance reporting to UNFCCC for 2010 Gibbs (2012)
Norway-Indonesia REDD+ Partnership 00Phase I contribution equals USD 30 million however no funds have yet been disbursed to projects Source Personal Communication with Indonesian officials
Norway-Guyana REDD+ Investment Fund 04Administrative fees for project proposal preparation grants for projects approved in 2011 including (1) Institutional Strengthening US$ 305168
UN-REDD Programme 352
Multi-Partner Trust Fund Office May 2012 Third Consolidated Annual Progress Report on Activities Implemented under the UN-REDD Programme Fund for the period 1 January ndash 31 December 2011 httpmptfundporg
World BankForest Carbon Partnership Facility (FCPF)
214Approved spend in 2011Source wwwclimatefundsupdateorg
Congo Basin Forest Fund 573Approved spend in 2011Source wwwclimatefundsupdateorg
Forest Investment Program (FIP) 510Approved spend in 2011Source wwwclimatefundsupdateorg
Global Environment Facility (GEF) 109CPI identification of projects related to forests approved or endorsed by the CEO during 2011 as of end July 2012 Source Source data through personal communication with GEF Secretariat July 2012
Global Climate Change Alliance 247Approved spend in 2011 in the REDD area Source wwwclimatefundsup-dateorg
Amazon Fund 269Approved spend in 2011Source wwwclimatefundsupdateorg
BNDES Mata Atlacircntica initiative 58
R$ 118m approved in 2011 for 3 reforestation projects (converted to USD using an exchange rate of USD 048860R$ oandacom 1 September 2012) Source Press Release 26 May 2011 httpwwwbndesgovbrSiteBNDESbndesbndes_enInstitucionalPressNoticias201120110526_mataatlanticahtml
International Tropical Timber Organization (ITTO)
40 Macqueen (2010)
Forest Carbon Markets 1430Peters-Stanley et al (2012) Value of primary credits sold on the volun-tary and CDMJI markets in 2011
Total 13242Notes - The following donor funds are excluded from the table above due to their interaction with other funds presented Australian International Forest Carbon Initiative (USD 314 million annualized estimate based on data from wwwclimatefundsupdateorg) German International Climate Initiative (USD 076 million ap-proved for REDD projects in 2011 according to wwwclimatefundsupdateorg) Norwegian Climate and Forest Initiative (no data on 2011 approved projects at wwwclimatefundsupdateorg) Japan Fast-Start Finance - The estimate of bilateral and EU Institution commitments in the forest sector is based on filtering of OECD CRS data according to climate change marking and forest related purpose coding (forestry industries development educationtraining policy amp admin Management research and services) Project channels and titles were screened to remove potential overlaps with ITTO GEF FIP FCPF and UN-REDD The portion of Fast-Start finance we identified in 2010 data (about USD 18 billion) is estimated to have contributed an additional USD 250 million which was obtained by applying an aver-age 14 share of Fast-Start financing to REDD measures over the December 2010 and 2011 period (Gibbs 2012)
- 1Introduction
- 2Methodology
-
- 21 Definitions
- 22 Analytical focus
- 23 Innovations in this yearrsquos study
-
- 3The Current Landscape of Climate Finance Flows
-
- 31 Sources and intermediaries
- 32 Intermediaries
- 33 Instruments
- 34 Disbursement channels
- 35 Uses
-
- 4Conclusions and the way forward
- Index of acronyms
- Glossary
- References
- Websites
- Appendix A - Main assumptions and methodology
- Appendix B - A summary of the Landscape 2011
- Appendix C - Existing climate finance tracking databases and major ongoing initiatives
- Appendix D - Details on Development Finance Institutions
- Appendix E - Details on Climate Funds
- Appendix F - Financial flows for REDD+
-

About CPIClimate Policy Initiative (CPI) is a policy effectiveness analysis and advisory organization whose mission is to assess diagnose and support the efforts of key governments around the world to achieve low-carbon growth
CPI is headquartered in San Francisco and has offices around the world which are affiliated with distinguished research institutions Offices include CPI Beijing affiliated with the School of Public Policy and Management at Tsinghua University CPI Berlin CPI Hyderabad affiliated with the Indian School of Business CPI Rio affiliated with Pontifical Catholic University of Rio (PUC-Rio) and CPI Venice affiliated with Fondazione Eni Enrico Mattei (FEEM) CPI is an independent not-for-profit organization that receives long-term funding from George Soros
DescriptorsSector Multilateral Climate Finance
Region International
KeywordsClimate Finance Private Finance Public Finance Climate Policy International Climate Negotiations
Related CPI Reports
The Landscape of Climate Finance 2011
Contact Barbara Buchner CPI EuropebarbarabuchnercpiveniceorgMorgan Herveacute-Mignucci CPI Venicemorganherve-mignuccicpiveniceorg
Copyright copy 2012 Climate Policy Initiative wwwclimatepolicyinitiativeorg
All rights reserved CPI welcomes the use of its material for noncommercial purposes such as policy discussions or educational activities under a Creative Commons Attribution-NonCommercial-ShareAlike 30 Unported License
For commercial use please contact admincpisforg
AcknowledgementsThe authors wish to thank the following organizations and professionals for their collabora-tion and inputs including in alphabetical order Adaptation Fund African Development Bank Agence Franccedilaise de Deacuteveloppement Asian Development Bank Asociacioacuten Latino-americana de Instituciones Financieras para el Desarrollo Banco Nacional de Desenvolvimen-to Economico e Social BlueNext Bloomberg New Energy Finance Climate Investment Funds Development Bank of Latin America Development Bank of Southern Africa E3G Ecofys European Bank for Reconstruction and Development European Climate Foundation Global Canopy Programme Global Environmental Facility Independent Evaluation Group of the World Bank Group Inter-American Development Bank International Finance Corporation Japan International Cooperation Agency KfW Bankengruppe Nacional Financiera Organisa-tion for Economic Co-operation and Development Overseas Development Institute Over-seas Private Investment Corporation The Nature Conservancy United Nations Environment Programme UNFCCC Secretariat World Bank and the World Wildlife Fund
Experts in these organizations were critical in helping us better understand the available data the various linkages between flows and our work has benefited substantially from the many discussions The authors would like to acknowledge and thank the following professionals for their cooperation and contributions Claudio Alatorre Frenk Philippe Ambrosi Amal-Lee Amin Geraldine Ang Sabrina Archambault Joumana Asso Andreas Biermann Simon Billett Neil Bird Lucas Bossard Milena Breisinger Alice Caravani Sarah Carta Ken Chomitz Christa Clapp Jan Corfee-Morlot Juacutelia Silva Dolado Tundidor Mafalda Duarte Jane Ebinger Ubaldo Elizondo Jane Ellis Pierre Forestier Jorge Gastelumendi Valerie Gaveau Guido Geissler Pierre Guigon Erik Haites Jochen Harnisch Kyosuke Inada Marcelo Jordan Sumalee Khosla Ale-jandro Kilpatrick Franka Kingel Hafiz Mirza Enrique Nieto Chantal Naidoo Ros Nightingale Christina Rollin Lisa Ryan Matt Leggett Abraham Louw Johanna Luumltterfelds David S Mc-Cauley Ariane Meier Kawamura Mihoko John E Morton Smita Nakhooda Valeria Pacardo Charlie Parker Cecilia Piemonte Camilo Rojas Eric Usher Eduardo Vasquez Kunze Sheelagh Whitley and Ming Yang
Finally the authors would like to acknowledge the contribution of the following CPI experts for the briefs on specific countries studies featured in the report Rodney Boyd Joana Chia-vari Wenjuan Dong Shobit Goel Uday Varadarajan Yuqing Ariel Yu A special thanks also to Ruby Barcklay Gianleo Frisari Tom Heller Ingmar Juergens Valerio Micale David Nelson Elysha Rom-Povolo Gireesh Shrimali Tim Varga Jane Wilkinson and Marni Wood for their help useful comments suggestions and internal review
PrefaceMapping the landscape of climate finance across the world is a work in progress ndash we aim to provide the best possible information but cannot claim to have captured everything Comments and clarifications on the numbers tracking methods and sources are very welcome
4
The Landscape of Climate Finance 2012
5
The Landscape of Climate Finance 2012December 2012 December 2012
Executive SummaryClimate finance has been a key topic in recent interna-tional climate negotiations Understanding how much and what type of finance is available to advance low-carbon growth and combat climate change at a global level is critical to scaling up finance and ensuring that resources are used effectively
The Landscape of Climate Finance 2012 estimates that annual global climate finance flows reached approximately USD 343-385 billion on average USD 364 billion in 20102011 This figure rep-resents an increase from last yearrsquos report mostly because of the expanded scope of this yearrsquos study (See Box ES-1) but still falls short of the investment required to limit global temperature rise to below two degrees Celsius To achieve this goal the International Energy Agency projects that incremental investment in the energy sector will need to reach USD 36 trillion over the period of 2012-2050 ndash or approximately USD 1 trillion each year
The private sector contributed the majority of finance (USD 217-243 billion) mostly from devel-oped country actors The public sector (USD 16-23 billion) acted as a catalyst for private finance as well as providing bilateral aid to other develop-ing countries A large proportion of public finance reflected domestic government support toward struc-tural changes in energy systems as engines of economic growth
Public and private intermediaries especially national development banks and commercial banks played an important role raising and channelling global climate finance (USD 110-120 billion) as well as supporting the creation of an envi-ronment conducive to private sector investment
Emerging economies were key recipients of climate finance but were also important sources Roughly one third of global mitigation investments were located in China Brazil and India A significant share of this was raised domestically and invested in pursuit of national development mandates
The following provides more detailed findings for each stage of the lifecycle of climate finance flows ndash from public sources private sources through to intermediar-ies instruments and uses
Public SourcesPublic sources ranged at least between USD 16-23 billion or 5-6 of the total amount A large proportion of this amount reflects domes-tic government support to renewable energy projects and related infrastructure as engines of economic growth
Notwithstanding fiscal austerity and the tightening credit context the public sector increased funding for low-carbon climate-resilient development Notably bilateral Official Development Assistance grew from USD 95 billion in 2009 to an estimated USD 23 billion in 2010 reflecting the impact of fast-start finance pledges which we estimate accounted for around 36 of Official Development Assistance in 2010 A large portion of this Official Development Assistance was subsequently intermediated by Bilateral Finance Institutions
The Landscape 2012 captures a broader range of public domestic flows in developed and developing coun-tries We found that almost USD 11 billion was spent to support domestic renewable energy projects This spending was largely related to the tail end of the US lsquogreenrsquo economic stimulus packages
Furthermore our investigation of the ownership struc-tures of seemingly private investments indicates that a large portion of these investments could be classified as governmentsrsquo direct and indirect shareholdings and lending to private investment structures While we have not included these types of government invest-ments in this yearrsquos finance flows diagram our prelimi-nary investigation identified USD 51 billion of public money sitting behind private investments mostly in developing countries and in particular China
4
The Landscape of Climate Finance 2012
5
The Landscape of Climate Finance 2012December 2012 December 2012
Box ES-1 Building an understanding of climate financeCPIrsquos Landscape of Climate Finance 2011 represented the first attempt to map the lifecycle of climate finance flows across the globe This yearrsquos study the Landscape 2012 builds and improves upon our previous work using data from the latest year available mostly 2011
Compared with the Landscape 2011 the Landscape 2012 aims to provide to the extent possible an expanded geographical scope covering more flows between and within countries expanded coverage of players including broader coverage of private and public actors a more detailed representation of private sector flows with a better picture of sources and uses an improved representation of uses by economic sector including flows toward adaptation improving land use and preventing deforestation and a better understanding of the final users of climate finance
While the Landscape 2012 provides real insights about global climate finance this exercise is still a work in progress External factors continue to hinder our collective understanding of the scope true magnitude nature and effectiveness of global climate finance flows
Future steps need to resolve the following key issues to build an understanding of climate finance
bull Further expansion of scope and coverage Climate finance configurations differ by country and circumstance and a variety of actors with distinctive responsibilities exist There needs to be a better understanding of the different actors including the various players in the private sector and Development Finance Institutions at the international national and local levels To inform the debate on climate finance effectiveness better sectoral and geographic information on the uses of money is also required
bull A net perspective The Landscape 2012 takes both incremental costs and investment capital into account and focuses on gross flows due to the difficulty of calculating incremental cost and net values of all finance flows To create a more precise picture we need more information about net flows and incremental costs compared to business-as-usual or lsquobrownrsquo investments
bull A sound understanding of how effectively financial flows are being used and whether they address the challenges posed by climate change and global needs In addition to CPIrsquos effort to build up an evidence-based bottom-up database of success and failure stories related to climate finance (the San Giorgio Group case studies) there is a need to explore whether finance flows represented in the Landscape have been effective
bull A benchmark on business-as-usual or lsquobrownrsquo finance flows To put climate finance estimates into perspective comparable estimates of traditional polluting investments are a useful benchmark to check whether there is real progress towards a low-carbon climate-resilient future
A comprehensive picture of climate finance flows is essential to ensure that governments and policymakers have the knowledge and tools to spend their money most effectively CPI remains committed to improving the understanding and transparency of todayrsquos climate finance landscape to help countries learn how to spend money wisely
The San Giorgio Group is a working group of key financial intermediaries and institutions actively engaged in green low-emissions finance Led by CPI the World Bank Group OECD and CLP the mission of the Group is to provide valuable insights on how to scale up climate finance and spend available resources more wisely To this end CPI is examining a series of case studies to determine how public money can catalyze and incentiv-ize private investment in low-carbon technologies and to provide lessons for scaling up green finance
6
The Landscape of Climate Finance 2012
7
The Landscape of Climate Finance 2012December 2012 December 2012
Private SourcesPrivate finance continued to represent the lionrsquos share of total climate finance flows with USD 217-243 billion or 63 of the total Close to two-thirds of private finance came from developed countries
In developed countries private actors contributed USD 143 billion with USD 68-70 billion in asset finance Fifty-five percent of projects were financed on a balance sheet basis while 45 were funded through project-level finance Commercial banks were the leading providers of project-level debt (77) while domestic public budgets contributed around 17 and corporate players contributed around 6 In devel-oped countries domestic private actors contributed the most to overall asset finance investment flows (84) Investment by private actors from other OECD members (almost exclusively developed countries) rep-resented around 12 of investment and investment by private actors from non-OECD countries made up the remaining 4
In developing countries private actors contributed USD 85 billion with USD 64-87 billion in asset finance Four out of five projects were financed on a balance sheet basis This headline obscures important country-specific trends such as the role of National Development Banks in encouraging private investments at the local level In particular the Brazilian National Development Bank (BNDES) played a central role in financing wind power generation in Brazil We estimate that domestic private actors contributed up to 83 of private investments in developing countries Private investors from OECD countries contributed 15 while non-OECD actors made up the remaining 2
The inclusion of small-scale renewable energy finance (almost exclusively in developed countries) in the Landscape 2012 highlights the significant contribution of households and corporate actors (USD 83 billion)
IntermediariesPublic and private financial institutions played an important role in the climate finance land-scape raising and channelling USD 110-120 billion Public intermediaries (such as Multilateral Bilateral and National Development Banks) distributed USD 77 billion or about 67 of these resources Public intermediaries can also enable private investment and help make projects viable
Development Finance Institutions (multilateral bilat-eral and national) continued to play a pivotal role dis-tributing climate finance of around USD 77 billion This represented about 21 of global climate finance flows In addition domestic and international development agencies played a critical role in channeling bilateral aid
Increased international focus on the role of National and Sub-regional Development Banks made it pos-sible to gather more detailed information about the climate finance flows and the role of these intermediar-ies in managing and disbursing funds Together with Bilateral Finance Institutions these banks distributed the majority of intermediated climate finance (USD 54 billion) and played a growing role enabling the transi-tion to low-carbon and climate resilient development in the countries where they operate In fact 89 of total climate finance from National and Sub-regional Development Banks was invested in the country in which these institutions are located
National Development Banks in emerging economies such as the Brazilian and the Chinese development banks channeled the largest share Local budget contributions to climate compatible activities in these countries was particularly evident in Brazil where the Brazilian Development Bankrsquos concessional support to renewable power generation projects reflected the governmentrsquos backing for the Bankrsquos operations in the pursuit of its policy targets
It is important to acknowledge the complex interplay between actors at different stages of the lifecycle of climate flows Multilateral and bilateral entities tend to rely on national actorsrsquo closer proximity and knowledge of the local market with the objective of channeling money more effectively National actors on the other hand benefit from the expertise of international inter-mediaries to develop their capacity to assess analyze and structure green investment projects or appraise the
6
The Landscape of Climate Finance 2012
7
The Landscape of Climate Finance 2012December 2012 December 2012
risk profiles of developers In turn this allows national institutions to pass knowledge to the local banking system to unlock its financing potential and exploit its ability to reach a wide group of recipients
Dedicated Climate Funds typically managed by multilateral bilateral and national intermediaries contributed at least USD 15 billion to overall flows Their importance is likely to grow given their capacity to catalyze and coordinate resources for co-financing including at national levels
Private commercial banks and infrastructure funds intermediated around USD 38 billion including project-level debt and direct investments Private intermediar-ies played a particularly critical role by providing the scale of finance and financial toolboxes able to address the specific needs of lsquogreenrsquo and innovative investment interventions (eg concentrated solar power etc) On the other hand project developers provided equity capital and know-how
InstrumentsOur analysis of instruments indicates that most climate finance USD 293-347 billion out of USD 364 billion can be classified as investments in which public or private financial institutions had an ownership interest or claim ndash that is money which has to be paid back ndash rather than as contri-butions to incremental costs
Public intermediaries enabled otherwise unviable projects through the use of instruments such as concessional loans and grants
Around USD 293 billion was in the form of market rate loans and equity of which USD 262 billion had been made by the private sector Green credit lines as well as support for institutional development were also intended to attract local financial institutions to on-lend to projects that would not otherwise be implemented and to favor private sector investment
Public intermediaries enabled investments by filling capacity and viability gaps that prevented private investors from engaging in capital-intensive riskier and in the short-term less profitable ventures Public intermediaries delivered more than 60 of their financ-ing through concessional loans and about 7 in grant form Lowering the cost of debt in this way is essential
for low-carbon technologies to compete with traditional fuel-based alternatives
Beyond grants loans equity and debt finance a variety of risk management instruments help to overcome risk barriers and encourage low-carbon technologies to scale up Public-private facilities and guarantees to assume regulatory credit or perceived technology risks are just some of the instruments that can remove the risks private actors are not willing or capable of bearing
Uses
Mitigation activities attracted USD 350 billion mostly related to renewable energy and energy efficiency Emerging economies were key recipi-ents of climate finance Close to 33 of mitiga-tion-related finance was invested in China Brazil and India
The majority of funding captured by the Landscape 2012 was spent on mitigation activities Compared to the Landscape 2011 there was progress in understanding adaptation finance due to increased tracking efforts However weaknesses in defining and tracking adap-tation finance partial reporting by some multilateral players and the inability of existing efforts to capture private flows dedicated to such activities hampered our understanding of adaptation finance flows
The bulk of financing captured went to renewable energy generation projects and energy efficiency accounting for 85 and 4 of the total respectively This reflects governmentsrsquo low-carbon growth ambi-tions the commercial viability of a broad range of proven technologies the profit-driven character of private investments and the data sources we had access to
This report confirms that public financial institutions are playing an essential role in financing clean energy allo-cating more than 60 of their intermediated financial flows to renewable energy and energy efficiency They are also essential for financing adaptation measures contributing up to USD 11 billion and even more impor-tantly managing and implementing some of the relevant adaptation funds
The allocation of climate finance between developed and developing countries was relatively balanced with USD 193 billion or 53 going to projects in developed
8
The Landscape of Climate Finance 2012
9
The Landscape of Climate Finance 2012December 2012 December 2012
countries and USD 172 billion or 47 to projects in developing countries
Emerging giants such as China Brazil and India were the largest recipients of global mitigation-directed climate finance flows with USD 171 billion close to 33 of the total This implies that investments have been made where they are needed most and where mitiga-tion potential is the greatest Notably a significant share of this was raised domestically and invested in pursuit of development mandates
8
The Landscape of Climate Finance 2012
9
The Landscape of Climate Finance 2012December 2012 December 2012
32
Venture Capital Priva
te E
GENERAL TAX REVENUES
CARBON-RELATED TAXES
CARBON MARKET
REVENUESDEVELOPM
ENT FINANCE INSTITUTIONS
VENTURE CAPITAL PRIVATE EQUITY amp INFRASTRUCTURE FUNDS
$214
$22
$57
$53
$13
$5
$14
$350
DIFFERENT DISBURSEM
ENT CHANNELS
$2$7
$2
$47
$23
$32
$17
$104
$70
$32
POLICY INCENTIVES
RISK MANAGEM
ENT
CARBON OFFSET FINANCE
GRANTS
LOW-COST
PROJECT DEBT
PROJECT-LEVEL M
ARKET RATE DEBT
PROJECT-LEVEL EQUITY
BALANCE SHEET FINANCING
DEBT PORTION
INSTITUTIONAL INVESTORS
PROJECT DEVELOPERS
CORPORATE ACTORS
HOUSEHOLDS
GOVERNMENT
BUDGETS
$19
MITIGATION
ADAPTATION
Notes Figures are indicative estimates of annual fl ow
s for the latest year available 2010 or 2011 (variable according to the data source) Flows are expressed in USD billions
and rounded to produce whole num
bers Estimates spanning m
ultiple years are adjusted to produce annual-equivalent estimates W
here ranges of estimates are available
the mid-point is presented The diagram
distinguishes between lsquoincrem
ental costsrsquo that is fi nancial resources that cover the price di erence between a cheaper m
ore polluting options and costlier clim
ate-friendly ones and do not need to be paid back mdash and lsquocapital investm
entrsquo which are tangible investm
ents in mitigation or adaptation projects that need to be paid
back Categories not representing capital investment or a m
ix of capital investment and increm
ental costs are incremental costs only The group of National Finance Institutions includes
Sub-regional entities Most data presented relates to com
mitm
ents in a given year due to limited availability of disbursem
ent data
COMM
ERCIAL FINANCIAL INSTITUTIONS
AGENCIES
THE C
LIMATE FINANCE FLOW
S DIAGRAM 2012
The Climate Finance Flow
s Diagram 2012 also know
n as the lsquospaghettirsquo diagram illustrates the landscape of clim
ate fi nance fl ows along their
life cycle for the latest year available mostly 2011 The w
idth of the arrows in the diagram represents the relative size of the fl ows
NE
lt$1
MULTILATERAL
NATIONALBILATERAL
NE
NE
NE
NE
NE
NE
$77
CLIMATE FUNDS
NE Not estimated
PUBLIC M
ONEYPRIVATE M
ONEYPUBLIC FINANCIAL INTERM
EDIARIES
PRIVATE FINANCIAL
INTERMEDIARIES
OFFSET M
ONEYCAPITAL INVESTM
ENTCAPITAL INVESTM
ENT AND INCREM
ENTAL COSTS
KEY
FINANCE FOR INVESTORS amp
LENDERS
REDD
SOU
RCES AN
D IN
TERMED
IARIES
INSTRU
MEN
TSCH
AN
NELS
USES
NE
NE
Figure 1 Climate Finance Flows Diagram
2012 (in USD billions)
10
The Landscape of Climate Finance 2012
11
The Landscape of Climate Finance 2012December 2012 December 2012
CO N T E N TS1 INTRODUCTION 1 1
2 METHODOLOGY 1221 Definitions 1222 Analytical focus 1 423 Innovations in this yearrsquos study 15
3 THE CURRENT LANDSCAPE OF CLIMATE FINANCE FLOWS 1 831 Sources and intermediaries 1 832 Intermediaries 3233 Instruments 4334 Disbursement channels 4935 Uses 49
4 CONCLUSIONS AND THE WAY FORWARD 61
INDEX OF ACRONYMS 6 5
GLOSSARY 6 6
REFERENCES 6 8
WEBSITES 7 3
APPENDIX A - MAIN ASSUMPTIONS AND METHODOLOGY 75
APPENDIX B - A SUMMARY OF THE LANDSCAPE 2011 76
APPENDIX C - EXISTING CLIMATE FINANCE TRACKING DATABASES AND MAJOR ONGOING INITIATIVES 7 7
APPENDIX D - DETAILS ON DEVELOPMENT FINANCE INSTITUTIONS 7 9
APPENDIX E - DETAILS ON CLIMATE FUNDS 8 2
APPENDIX F - FINANCIAL FLOWS FOR REDD+ 8 4
10
The Landscape of Climate Finance 2012
11
The Landscape of Climate Finance 2012December 2012 December 2012
1 IntroductionClimate change is a global challenge that requires a global response Failure to comprehend the global context of the financing challenge will undermine our ability to accurately assess whether current investments are on track and made where they can deliver the great-est impacts to limit global temperature rise to below two degrees Celsius To achieve this temperature goal the International Energy Agency projects that incre-mental investment in the energy sector alone will need to reach USD 36 trillion over the period of 2012-2050 ndash or approximately USD 1 trillion each year (IEA 2012)
The aim of this study is to contribute understanding on how much and what type of financial support is avail-able globally to advance action on low-carbon climate resilient development Ultimately building this under-standing is essential for ensuring that governments and investors everywhere have the knowledge and tools to spend their money in ways that optimize prospects for achieving the transition
The first Landscape of Climate Finance published in 2011 (Landscape 2011) was the most comprehensive over-view of the global climate finance landscape to-date This yearrsquos study (Landscape 2012) aims to improve on last yearrsquos estimates and add deeper insight into the nature of global climate finance It provides a more detailed breakdown of flows and sheds light on the latest trends
The Landscape 2012 aims to provide to the extent possible
bull An expanded geographical scope covering flows between developing countries (lsquoSouth-Southrsquo) from developed to developing countries and domestic climate finance flows
bull An expanded coverage of national sub-regional regional and international public actors
bull A more detailed representation of private sector climate finance flows with a better picture of sources and uses
bull An improved representation of climate finance uses by sector (sectoral uses) including flows to adaptation and to reducing emissions from deforestation and forest degradation ldquoplusrdquo the sustainable management and conservation of forests and the enhancement of carbon stocks in developing countries (known as REDD+ schemes) and
bull A better understanding of the recipients and final uses of climate finance both in terms of sectoral uses and of geographical destination
This report has three main sections Section 2 outlines our methodology including key definitions and differ-ences compared to the Landscape 2011 Section 3 the main body describes the current landscape of climate finance flows along their lifecycle from sources through to intermediaries instruments channels and end uses Section 4 summarizes our findings and provides brief recommendations to improve existing climate finance tracking efforts
12
The Landscape of Climate Finance 2012
13
The Landscape of Climate Finance 2012December 2012 December 2012
2 MethodologyThis study the Landscape 2012 aims to capture the most recent annual climate finance flows supporting (1) emis-sion reductions (2) climate resilience and (3) enabling environment projects1
Building upon the Landscape 2011 we adopt a two-dimensional framework for this study First flows are categorized alongside their lifecycle (sources interme-diaries instruments disbursement channels and final sectoral uses geographic destination of recipients) Second flows are categorized depending on whether they originate from public or private sources (see tax-onomy section in the Landscape 2011)
We gathered empirical data on climate finance flows from a wide range of sources (main assumptions and sources are listed in Appendix A and the References section) relying on (1) readily-available data (2) data-sets we analyzed and (3) our own estimates We also drew upon expert opinions to estimate certain flows
21 Definitions
Climate-specific versus climate-related investmentsThe lack of an internationally-acknowledged defini-tion of what qualifies as climate finance or even more narrowly what qualifies as a climate project presents a major challenge to understanding the scale of financial flows there is no established basis for a methodology or measurement system for tracking climate finance flows (Buchner et al 2011ab) This is particularly chal-lenging in the context of adaptation
For the purposes of this study finance flows are limited to lsquoclimate-specific financersquo referring specifically to capital flows targeting low-carbon and climate-resilient development It can have direct or indirect greenhouse gas mitigation or adaptation objectivesoutcomes Note that climate-specific finance excludes a broader set of capital from developed to developing countries that may influence directly or indirectly emissions andor vulnerability to climate change in developing countries
1 ldquoEnabling environment projectsrdquo typically include efforts to strengthen institutions to establish policies regulations or laws and to remove tech-nical legal and administrative barriers to investment The Landscape 2011 included some climate finance targeting enabling environment projects but was not labelled as such The Landscape 2012 instead explicitly cap-tures financing for capacity building and technical assistance measures such as for instance the financing of feasibility studies for projects and the development of local financial institutionsrsquo capacity
and which is typically referred to as lsquoclimate-relevantrsquo finance (see Corfee-Morlot et al 2009 and Buchner et al 2011)
Tangible versus intangible investments In the Landscape 2012 we included to the extent pos-sible (depending on the granularity of data available) only investment flows made toward tangible physical assets like for instance wind farms We excluded to the extent possible investment in measures such as research and development manufacturing or deploy-ment because these might not ultimately result in emission reductions and to reduce the risk of double counting money going to specific emission reductions2
The Landscape 2012rsquos focus on money for emission reductions climate resilience and enabling environment projects in the year 20102011 excludes future commit-ments such as policy incentives (that are not upfront capital grants) or risk management instruments (loan guarantees or insurance policies) The rationale is that we are tracking money actually in the system rather than potential future amounts that may pay for things other than investment costs (eg premiums for green electricity carbon credit purchases payments for loan defaults)3 The objective is to avoid double counting for example the face value of full loan guarantees and loans or discounted expected feed-in tariff payments with the investment cost4 The general roles of current policy mechanisms and risk management instruments are represented in the Climate Finance Flows Diagram 2012 as they play a central role in the investment and financing decision-making process but we do not esti-mate flow values for them
2 Examples such as Chinese solar panels that are deployed in Italy indicate the difficulty in attributing a specific technological breakthrough or spillover effects to RampD expenditures in a given country or year
3 The methodologies used in this report to calculate global finance flows are not intended to imply which (or which proportion) of these contributions to climate finance should count toward the goal to mobilize US 100 billion per year by 2020 to assist developing countriesrsquo climate responses and which (or which proportions) should not Nothing in this report is meant to infer that the goal (of mobilizing US 100 billion per year by 2020 to assist developing countriesrsquo climate responses) has already been achieved
4 Furthermore there is a potential gap between what institutions report at the time of offering risk management instruments (such as the face value of a full or a partial risk guarantee the premium collected on such instru-ments or corresponding accounting provisions) and the actual amount that may be spent in the future
12
The Landscape of Climate Finance 2012
13
The Landscape of Climate Finance 2012December 2012 December 2012
Incremental costs versus investment capitalIncremental cost and investment capital are both important lenses for climate finance flows Incremental cost refers to financial resources provided to compensate for the difference between a less costly more polluting option and a costlier more environmen-tally-friendly andor climate-resilient one Investment capital refers to tangible investment in mitigation or adaptation projects Whereas investment capital is paid back to the investor incremental costs often are not and are thus often funded with public climate funds either through policy support or concessional finance5 Whether incremental costs are covered by public support often make the difference in whether the private sector invests in a project Almost all costs asso-ciated with REDD+ measures are incremental costs
Our work captures mostly investment capital rather than incremental support (see previous sub-section) In order to get to the incremental cost value of emission reductions climate-resilience and enabling environ-ment projects we need assumptions for baselines against which we measure the incremental cost Such baselines are project-specific and would require us to make debatable assumptions on what fair baselines would be More efforts are needed to address this issue in-depth
Gross value versus net valueClimate finance can be measured in terms of lsquogrossrsquo or lsquonetrsquo metrics (AGF 2010)6 The Landscape 2012 focuses on gross flows which reflect the full volume of financial flows delivered through all instruments rather than net flows which provide an indication of the final net contribution of investors and countries Gross flows include money that has to be paid back by recipients ie concessional and non-concessional loans and equity Nonetheless they shed light on the level of mobilized international investments and the net contribution of countries
More efforts are needed to break down contributions by gross or net value As a first step into this direction
5 In the case of energy efficiency the additional upfront costs do need to be paid back but are expected to be compensated with energy savings over time Also they can be paid for by private investors since they do get paid back
6 Under the approach flows would represent the financial flows transferred to countries in any given year (these include grants concessional and non-concessional loans mobilised through the bilateral and multilateral institutions private capital flows and flows from GHG offset projects) Under the approach amounts repaid by the recipient countries would be deducted (eg repayments of loan principal repatriation of capital)
section 35 on climate finance sectoral uses specifies this information whenever available
Mixed reporting yearsOur estimates of climate finance are based on the most recent data available The Landscape 2012 uses a mix of 2010 and 2011 data7
We used different sources of information to map exist-ing flows of climate finance We had a choice of using 2010 data only or reporting 2011 data for a significant part of the Landscape (most importantly Bloomberg New Energy Finance data on private flows) We selected the latter option in order to (1) highlight the most current trends in financing despite reporting delays in some areas and (2) provide consistency from year to year so that the Landscape 2012 picks up where the Landscape 2011 left off Where flows span several years we annualized them to make them compatible with other data sources
Commitment versus disbursement dataWe report committed finance rather than disbursed finance New commitment signifies the concrete commitment of money by the means of a closure of a financing contract board decisions on investment loan award announcements or similar actions Commitment finance does not imply that money will immediately flow as a lump sum to project developers8 There might be a time lag between commitments and disbursement But while disbursement information provides a more accurate picture of actual climate finance flows than commitment information disbursement data is not as universally available9 In addition 20102011 disburse-ment data can reflect commitments spanning several years for projects with long construction periods Disbursement data would therefore require further refinement For these reasons we mostly use commit-ment data in the Landscape 201210
7 Data derived from OECDrsquos Creditor Reporting System Aid Activities data-base (OECD CRS) namely public budget and the EU Institutionsrsquo climate finance data refer to 2010 while the others are all 2011 data or presenting the fiscal year 2011 (eg July 2010-June 2011 depending on the accounting methodologies) Philanthropy data instead refer to 20082009
8 A complicating factor is that there is a range of interpretations of what commitment actually constitutes
9 In ldquoThe German Landscape of Climate Financerdquo (CPI 2012) the granularity of data at the national level allowed the authors to rely on disbursement data to a greater extent
10 Where available we used disbursement figures In the case of Climate Funds we include annual commitments approved for specific projects rather than total pledges to the Funds which are disbursed over a number
14
The Landscape of Climate Finance 2012
15
The Landscape of Climate Finance 2012December 2012 December 2012
Reporting currencyAll the flows in this report have been converted to USD billion when reported in other currencies Appendix A provides more details on the exchange rates used
22 Analytical focus
Project-level primary financingThe gold standard in our analysis is project-level financing data Project-level financing data is as close as we can get to emission reductions enhanced climate resilience and a stronger enabling environment In the instrument section we therefore define ldquoinstru-mentsrdquo as the instruments covering project costs in the reporting year or primary financing instruments We exclude instruments that cover financing costs that is secondary market instruments11 The exception to this rule relates to Development Finance Institutions whose flows can include instruments that cover committed money to a specific sector or actor
Secondary market transactions do not represent new money targeting climate finance but rather money changing hands Focusing on primary tangible invest-ments allows us to more accurately estimate financing that supports low-carbon climate-resilient activities
Finance flowsThis year we have solely captured flows among actors rather than (1) any ownership or claims one actor may have on another and (2) readily-available resources (net income debt secured and shareholdersrsquo equity from prior years)12
The flow-only representation has strong implications on what is being covered and represented in the Climate
of years Likewise for DFIs we include annual commitments ie funds ap-proved for projects in a given budget year (UNEP 2011 presents what dif-ferent BFIs mean as ldquocommittedrdquo funds) Only one organization surveyed provided disbursement data rather than commitments
11 For example consider a project in which a utility invests money from its own balance sheet to finance a new onshore wind farm With our focus on project-level financing we would categorize this investment as balance sheet financing We do not examine where the corporate money is coming from (borrowing programmes on-going activities capital increase or sale of non-strategic assets)
12 In this sense we are also capturing payments (or estimates of payments) for carbon finance
Finance Flows Diagram 2012 (also known as the lsquospa-ghettirsquo diagram) compared to the Climate Finance Flows Diagram 2011 In particular inflows need not match out-flows For example a development bank may have com-mitted USD 3 billion in 2011 even though it only received USD 500 million of aid contribution the same year from public budgets mdash this doesnrsquot mean this bank is par-ticularly good at leveraging money or in the opposite case that it is wasting money because the flows do not capture other ownership and assets By capturing flows in this way we are also able to highlight where money may be sitting with a given actor within the landscape of climate finance
The linearity of the lifecycle of flows is however a simplification Flows are categorized alongside the lifecycle of flows (sources intermediaries instruments disbursement channels and uses recipients) as though the lifecycle was a linear path In reality pathways for finance are more complex and involve (1) feedback loops ie money can go back and forth between differ-ent actors (2) multiple layers and cascades of equity ownership and (3) intermediate layers of instruments eg between government budgets and National Finance Institutions13
Ranges for estimated valuesGiven the uncertainty surrounding some data sources the multiple potential approaches to estimating specific climate finance flows and the lack of agreement on climate finance definitions and boundaries we opted to represent climate finance flows as ranges whenever possible rather than conveying a single-point estimate For example data ranges for renewable energy asset finance depends on data sources for non-domestic money (either Bloomberg New Energy Finance or UNCTAD Foreign Direct Investment data) For the sake of readability the numbers reproduced on the Climate Finance Flows Diagram 2012 correspond to mid-points
13 Depending on where you draw the line you could have many layers of source to instrument to recipient with each recipient becoming a source itself
The Landscape of climate finance focuses on tangible project-level primary financing flows
14
The Landscape of Climate Finance 2012
15
The Landscape of Climate Finance 2012December 2012 December 2012
23 Innovations in this yearrsquos study
Global geographical scopeThe Landscape 2011 focused on climate finance flows from developed to developing countries and included some developing countries and domestic sources although to a limited extent and independent of their origin (domestic money money from other develop-ing countries or from developed countries) To shed more light on where we stand compared to global financing needs to stabilize average temperature to below 2 degrees in the Landscape 2012 we extend the geographical coverage to feature estimates of climate finance flows to and in developed countries (domestic money and money from other developed countries or developing countries) The figures identified in the Landscape 2012 should therefore not be confused with amounts that count towards the USD 100 billion prom-ised by developed countries in the Copenhagen Accord but rather as indications compared to global financing needs to meet the two degrees goal
We categorize actors providing climate finance (lenders investors guarantors etc) as domestic or foreign enti-ties and as hailing from developing or developed coun-tries using the best information available This extended coverage allows us to map both sources and destina-tions more precisely and to compare financing trends in different regions Domestic finance coverage was improved by investigating the contribution of National Finance Institutions
More detailed representation of private sector climate finance flowsWith a more informative categorization of private climate finance flows the Landscape 2012 sheds more
light on private finance flows In the Landscape 2011 private flows were captured in two categories ldquoglobal capital marketsrdquo and ldquoprivate financerdquo In the Landscape 2012 we strove to better categorize private flows The Landscape 2011 ldquoglobal capital marketsrdquo category has been broken down into ldquocommercial financial institu-tionsrdquo ldquoinstitutional investorsrdquo and ldquoventure capital private equity and infrastructure fundsrdquo Likewise ldquoprivate financerdquo was broken down into ldquocorporate actorsrdquo ldquoproject developersrdquo and ldquohouseholdsrdquo
We started from the global private climate finance numbers and broke them down in distinctive geographi-cal and technology subgroups to the extent possible When we could not categorize any further we looked at individual projects from a representative sample and categorized them along three dimensions category of actor geography of origin first degree ndash ultimate degree ownership14
We used these dimensions to create a set of weights and applied those weights to the global numbers to obtain dollar values for different dimensions of the global figures
Extended coverage of public intermediariesThe Landscape of Climate Finance 2012 covers the follow-ing Development Finance Institutions (DFIs)15
bull Four Bilateral Finance Institutions (BFI) French Development Agency with Proparco (AFD) Japan International Cooperation Agency (JICA) KfW Entwicklungsbank and DEG and Overseas Private Investment Corporation (OPIC)
bull Nine Multilateral Finance Institutions (MFI) World Bank International Finance Corporation (IFC) EU Institutions16 European Investment Bank (EIB) European Development Bank for Reconstruction and Development (EBRD) Asian Development Bank (AsDB) African Development Bank (AfDB) Inter-American Development Bank (IDB) and Nordic Development Fund (NDF)
14 In addition to small-scale asset financing we covered 1636 individual proj-ects from the Bloomberg New Energy Finance database representing 82 of the extra capacity in developed countries and 89 of the extra capacity in developing countries (539 GW in total)
15 We opted to refer to the broad group of institutions covered in the report as Development Finance Institutions (DFI) given their development man-dates but we acknowledge that the term DFI is here used with a broad meaning
16 The European Commission and EU Development Fund
The Landscape 2012 improves on the Landscape 2011 by including a broader geographic scope that covers developed as well as developing countries and domestic flows better categorization of the actors involved a better understanding of whatrsquos behind private finance flows and extended coverage of Development Finance Institutions
While this implies that data from Landscape 2012 is not directly comparable to Landscape 2011 it provides more detail and sheds light on how global finance flows match global financing needs to support a low-carbon climate-resilient transition
16
The Landscape of Climate Finance 2012
17
The Landscape of Climate Finance 2012December 2012 December 2012
bull Nineteen National Finance Institutions Brazilian Development Bank (BNDES) Development Bank of Latin America (CAF) Nacional Financiera (Nafin) Fideicomisos Institudos en Relacion con la Agricultura (Fira) Agencia Financiera de Desarollo Development Bank of Southern Africa (DBSA) Indian Renewable Energy Development Agency (IREDA) Banco del Estado de Chile Central American Bank for Economic Integration (BCIECABEI) Bancoldex Colombia Black Sea Trade and Development Bank of Greece (BSTDB) China Development Bank (CDB) Caisse de Depot et de Gestion of Morocco (CDG) Eximbank Indonesia Croatian Bank for Reconstruction and Development (HBOR) Korea Finance Corporation (KoFC) Industrial Development Bank of Turkey (TSKB) Small Industries Development Bank of India (SIDBI) and Vnesheconombank of Russia (VEB)
These institutionsrsquo climate financing data were retrieved from a blend of primary and secondary data sources Sixteen organizations out of the 32 covered in the report provided their data for mitigation and adaptation activi-ties directly by the means of a financial survey
Acknowledging the challenges in determining what qualifies as mitigation or adaptation and to unequivo-cally attribute specific investments to only one of these two themes mitigation and adaptation were broken down by sectors The choice of the sectors was guided and informed by other methodologies and account-ing practices (eg OECDCRS UNEP-SEI 2011) In those cases where respondents provided different sectoral breakdowns the projectcategory description was considered for allocating data against the chosen categories In the presence of activities with multiple objectives (both mitigation and adaptation) this amount was allocated according to the weights of mitigation and adaptation on the given total of climate finance17 To the extent possible data were adjusted to exclude interventions not in line with our definition of climate finance (eg we carved out financing for RampD manu-facturing or lower carbon energy generation projects the latter because they may have included fuel-to-fuel
17 For instance of the USD 96 billion ODA marked as climate finance in the OECD CRS database and not channelled by AFD JICA or KfW USD 42 billion is marked as mitigation only USD 3 as adaptation only and USD 24 billion as both mitigation and adaptation related We allocated the dual purpose money according to the distribution between mitigation only and adaptation only projects (59 vs 41) For DFIs eg in the case of EU Institutions dual purpose money (USD 264 million) was allocated accord-ing to the share of mitigation and adaptation projects (55 vs 45)
switch project such as fuel to gas and coal to gas and fossil fuel based co-generation) We acknowledge the uncertainties associated with what qualifies as climate finance and what does not and the ldquoimmaturityrdquo of some institutionsrsquo tracking and reporting methodolo-gies which affects our understanding on the real magni-tude and nature of the climate finance delivered by these institutions
Extended coverage of sectoral usesThe Landscape 2011 focused on renewable energy While we did our best to capture energy efficiency energy smart technologies and infrastructure industrial processes transportation and other sectors reliable data sources in these fields that fit within our frame-work were limited Some of these missing data sources are now available at national levels and we therefore managed to include a broader sectoral coverage in the Landscape 201218
Note that coverage for climate-resilience is even patchier due to reporting and categorization issues which hamper our understanding of what constitutes adaptation finance
Other changesThe capital boxes in the Landscape 2011 have been recategorized into ldquomarket rate project-level debtrdquo ldquoproject-level equityrdquo and ldquobalance-sheet financingrdquo for the Landscape 2012 We also mapped primary carbon offset flows differently attributing flows directly to the actors involved in the acquisition of primary offsets Apart from these changes several categories have been renamed for the Landscape 2012 government budgets (previous domestic public budgets) Development Finance Institutions including bilateral multilateral and national financial institutions (previous bilateral multilateral agencies and banks) carbon offset finance (previous carbon offset flows) and low-cost project-level debt (previous concessional loans)
18 Note that nuclear was not included in either the Landscape 2011 or in the Landscape 2012 as we could not identify data sources highlighting financ-ing directed to this type of projects None of the DFIs surveyed included in their climate finance reporting financing for nuclear projects nor did donors in their reporting to the OECD DAC
16
The Landscape of Climate Finance 2012
17
The Landscape of Climate Finance 2012December 2012 December 2012
Box 1 ndash The Landscape 2012 compared to the Landscape 2011CPIrsquos Landscape of Climate Finance 2011 represented the first comprehensive review of the global climate finance landscape The study focused on climate finance flows from developed to developing countries with limited coverage of developing countries and domestic sources
Due to divergent definitions and data gaps we faced a number of methodological difficulties some of which we were able to account for (eg double counting of the same flows) others less so (eg differing definitions and time periods)
Based on this methodology we estimated total global climate finance flowing to the developing world at on average USD 97 billion a year in 20092010 Appendix B summarizes the Landscape 2011
When we apply the Landscape 2011 methodology and focus to the Landscape 2012 data to highlight as much comparability among flows as possible total climate finance flows predominantly directed towards developing countries in 20102011 is USD 112 billion The increase is a result of the following main factors
bull a 78 increase in bilateral ODA climate finance flows from developed to developing countries in 2010 compared to 2009 partly reflecting the impact of Fast-Start finance pledges and partly the new OECD Rio marker to track aid targeting climate change adaptation objectives
bull a 47 increase in financial flows from the Multilateral Finance Institutions considered in the Landscape 2011
bull a more than doubling of carbon offset finance reflecting almost doubled issuance of CERs in 2011 compared to 2010 (although there were lower prices) and improved data visibility on ERU issuance
An optimist might suggest that USD 112 billion in climate finance overachieves the USD 100 billion promised by developed countries in the Copenhagen Accord Yet we have to recognize that this might not be correct for multiple reasons mostly related to our scope We aim to provide a comprehensive overview of all the current financial resources for climate change action Consequently not all of the USD 112 billion counts as additional climate finance from what was available prior to the Copenhagen Accord The reality is that while climate finance has increased quickly over the past 10 years a significant share of the USD 112 billion provided in 20102011 was already committed prior to the Accord Further like in the Landscape 2012 the USD 112 billion total includes some developing countries and domestic sources although to a limited extent and considers both incremental cost and investment capital
In other words our climate finance estimates cannot and should not be compared with the USD 100 billion of the Copenhagen Accord The methodologies used in both the Landscape 2011 and Landscape 2012 are not intended to imply which (or which proportion) of these contributions to climate finance should count toward the goal to mobilize USD 100 billion per year by 2020 to assist developing countriesrsquo climate responses Nothing in this report is meant to infer that this goal has already been achieved
18
The Landscape of Climate Finance 2012
19
The Landscape of Climate Finance 2012December 2012 December 2012
3 The Current Landscape of Climate Finance FlowsIn this section we describe how climate finance breaks down along the lifecycle of financial flows from sources to end uses For each stage of global climate finance we aim to highlight the key reasons and motivations for finance flows ranges of finance involved where the money is coming from (geographies specific actors etc) where it is going (geographies specific actors technologies etc) and any issues specific to each life-cycle stage
31 Sources and intermediaries
Current sources of climate finance include
These various sources have multiple connections to each other There is also a strong interrelation between public and private sources of finance
Not captured in these figures are governmentsrsquo direct and indirect shareholdings and lending to private invest-ment structures as well as private contributions to International Financial Institutions (public contributions to Development Finance Institutions are captured only to a limited extent)
In the Landscape 2012 we have highlighted the contribu-tion of several categories of private stakeholders acting in the global landscape of climate finance namely corporate actors project developers households and institutional investors19 The contribution of public and private intermediaries (USD 110 ndash 120 billion) is dis-cussed in section 32
Carbon-related mechanisms Carbon-related mechanisms are comprised of (1) carbon market revenues and (2) all climate-related taxes raised by governments (ranging from explicit and implicit carbon taxes) Money collected from carbon markets and carbon-related taxes flows to government budgets though it is not clear how much is earmarked
19 Potential future sources of climate finance discussed in international forums are not mapped in the Landscape These include revenues from taxation of international aviation and shipping emissions revenues gener-ated by removing fossil fuel subsidies revenues generated by fossil fuel extraction royaltieslicenses revenues from a financial transaction tax (FTT) or allocation of Special Drawing Rights etc
SOURCES amp INTERMEDIARIES ()ANNUAL FLOWS OF DIRECT CLIMATE FINANCE
(2010 2011 USD BILLION)
PUBLIC
Government budgets (5) 160 - 226
Development Finance Institutions (21) 768
bull Climate Funds (lt1) 15
Sub-total public (26) 927 - 993
PRIVATE
Corporate actors (21) 693 - 805
Institutional investors (lt1) gt 06
Project developers (34) 1150 - 1293
Households (9) 323
Commercial financial institutions (10) 307 - 404
Venture capital private equity amp infrastructure funds (1) 24
Sub-total private (74) 2503 - 2855
TOTAL
Total 3430 - 3848bull Sub-total sources (68) 2332 - 2653
bull Sub-total intermediaries (32) 1099 - 1196
The sum of climate finance flows from all sources totals USD 343-385 billion The dominant source is the private sector which provides as much as USD 250-286 billion in climate finance or 74 of total climate finance (out of USD 364 billion on average) Of private actors project developers provide USD 122 billion or 34 of total climate finance while other corporate actors provide USD 75 billion or 21 of total climate finance Contributions from government budgets ranged between USD 16 and 23 billion including direct public investments and north-south aid flows Development Finance Institutions along with Climate Funds provided USD 77 billion
18
The Landscape of Climate Finance 2012
19
The Landscape of Climate Finance 2012December 2012 December 2012Figure 2 - 20102011 clim
ate finance flows (in USD billions)
32
Venture Capital Priva
te E
GENERAL TAX REVENUES
CARBON-RELATED TAXES
CARBON MARKET
REVENUESDEVELOPM
ENT FINANCE INSTITUTIONS
VENTURE CAPITAL PRIVATE EQUITY amp INFRASTRUCTURE FUNDS
$214
$22
$57
$53
$13
$5
$14
$350
DIFFERENT DISBURSEM
ENT CHANNELS
$2$7
$2
$47
$23
$32
$17
$104
$70
$32
POLICY INCENTIVES
RISK MANAGEM
ENT
CARBON OFFSET FINANCE
GRANTS
LOW-COST
PROJECT DEBT
PROJECT-LEVEL M
ARKET RATE DEBT
PROJECT-LEVEL EQUITY
BALANCE SHEET FINANCING
DEBT PORTION
INSTITUTIONAL INVESTORS
PROJECT DEVELOPERS
CORPORATE ACTORS
HOUSEHOLDS
GOVERNMENT
BUDGETS
$19
MITIGATION
ADAPTATION
Notes Figures are indicative estimates of annual fl ow
s for the latest year available 2010 or 2011 (variable according to the data source) Flows are expressed in USD billions
and rounded to produce whole num
bers Estimates spanning m
ultiple years are adjusted to produce annual-equivalent estimates W
here ranges of estimates are available
the mid-point is presented The diagram
distinguishes between lsquoincrem
ental costsrsquo that is fi nancial resources that cover the price di erence between a cheaper m
ore polluting options and costlier clim
ate-friendly ones and do not need to be paid back mdash and lsquocapital investm
entrsquo which are tangible investm
ents in mitigation or adaptation projects that need to be paid
back Categories not representing capital investment or a m
ix of capital investment and increm
ental costs are incremental costs only The group of National Finance Institutions includes
Sub-regional entities Most data presented relates to com
mitm
ents in a given year due to limited availability of disbursem
ent data
COMM
ERCIAL FINANCIAL INSTITUTIONS
AGENCIES
THE C
LIMATE FINANCE FLOW
S DIAGRAM 2012
The Climate Finance Flow
s Diagram 2012 also know
n as the lsquospaghettirsquo diagram illustrates the landscape of clim
ate fi nance fl ows along their
life cycle for the latest year available mostly 2011 The w
idth of the arrows in the diagram represents the relative size of the fl ows
NE
lt$1
MULTILATERAL
NATIONALBILATERAL
NE
NE
NE
NE
NE
NE
$77
CLIMATE FUNDS
NE Not estimated
PUBLIC M
ONEYPRIVATE M
ONEYPUBLIC FINANCIAL INTERM
EDIARIES
PRIVATE FINANCIAL
INTERMEDIARIES
OFFSET M
ONEYCAPITAL INVESTM
ENTCAPITAL INVESTM
ENT AND INCREM
ENTAL COSTS
KEY
FINANCE FOR INVESTORS amp
LENDERS
REDD
SOU
RCES AN
D IN
TERMED
IARIES
INSTRU
MEN
TSCH
AN
NELS
USES
NE
NE
Notes Figures are indicative estimates of annual flow
s for the latest year available 2010 or 2011 (variable according to the data source) Flows are expressed in USD billions and rounded to produce w
hole numbers Esti-
mates spanning m
ultiple years are adjusted to produce annual-equivalent estimates W
here ranges of estimates are available the m
id-point is presented The diagram distinguishes between lsquoincrem
ental costsrsquo that is financial resources that cover the price difference between a cheaper m
ore polluting options and costlier climate-friendly ones and do not need to be paid back mdash
and lsquocapital investmentrsquo w
hich are tangible investments
in mitigation or adaptation projects that need to be paid back Categories not representing capital investm
ent or a mix of capital investm
ent and incremental costs are increm
ental costs only The group of National Finance Institutions includes Sub-regional entities M
ost data presented relates to comm
itments in a given year due to lim
ited availability of disbursement data
20
The Landscape of Climate Finance 2012
21
The Landscape of Climate Finance 2012December 2012 December 2012
SOURCES ESTIMATED VALUE DESTINATIONS
ExtE
rnal
bull Auctioning of European Union Allowances (EUAs) USD 162 billion
bull Auction of allowances on the Regional Greenhouse Gas Initiative (RGGI) USD 017 billion
bull Transaction of Kyoto Assigned amount units (AAUs) USD 024 billion
USD 20 BILLION
Oth
Er ac
tOrs
bull Government budgets USD 20 billion
DESCRIPTION
Proceeds from sales and auctions of carbon assets to cap-and-trade compliance buyers Originate from carbon constrained economic sectors or countries In particular
bull Transactions of Kyoto assets between governmentsbull Sale of carbon allowances to cap-and-trade market participants in Europe and in the US
PRIMARY DATA
SOURCES
bull World Bank State and Trends of the Global Carbon Marketsbull European Energy Exchange (EEX) databull European Commission DG CLIMA
ISSUES AND FUTURE
ANALYSISbull No specific earmarking of the proceeds towards emission reductions projects
for climate finance purposes (ie how much will be spent by governments towards climate finance)
Carbon market revenuesCarbon market revenues comprise proceeds from sales and auctions of carbon assets to cap-and-trade compliance buyers and originate from carbon con-strained economic sectors or countries The current scale of these revenues can be estimated taking into account auctions organized in countries with cap-and-trade systems (most importantly the EU Emissions Trading System) and sales from Assigned Amount Units (AAUs) between countries bound by the Kyoto Protocol The Landscape 2012 figure is identical to the Landscape 2011 but sub-components changed significantly Notably EU ETS prices have come down but corresponding carbon allowances auctioned have increased 50
Carbon-related taxes In 2010 revenues generated by carbon taxation in selected European countries ndash Finland Norway Sweden Denmark Switzerland and Ireland ndash accounted for approximately USD 73 billion (Elbeze and Perthuis 2011) This possibly represents a lower-bound estimate as it does not cover the revenues generated by carbon tax schemes in a number of other jurisdictions such as for instance the Canadian provinces of Quebec and British Columbia the San Francisco Bay Area Air Quality Management District (BAAQMD) or India Australia recently introduced a carbon pricing scheme which came into force in July 2012 while other countries
have planned to introduce one after 2013 (eg South Africa)20
The associated revenues from these programs which are potentially considerable21 are not necessarily ear-marked for climate finance but are often distributed for other purposes Specifically proceeds from carbon taxation can be returned to taxpayers in the form of targeted or lump sum compensation for households and business (eg Switzerland)22 or to reduce income tax (eg Finland) or fund general government budgets (eg Sweden and Norway) in some cases revenues can also contribute to fiscal consolidation to reduce budget deficits (Vivid Economics 2012 Elbeze and de Perthuis 2011) Some countries allocate funds to support envi-ronmental policy measures Denmark for instance has allocated around 40 of carbon tax revenues to
20 The tax base and rates differ considerably between countries Most commonly carbon taxes are placed on fossil fuels such as coal gasoline or natural gas Several European countries combine carbon levies applied to CO2 emissions with resource taxes that is targeting energy consump-tion (eg Denmark Sweden and Finland) The highest rates (USD 150ton of CO2) are paid in Sweden while the lowest (USD 0045ton CO2) in California (Climate Commission 2012 NREL 2009)
21 The European Commission in its proposal for the Energy Taxation Direc-tive estimated that a minimum carbon tax of USD 28 (EUR 20) per ton of CO2 common in all 27 Member States would generate revenues in the order of USD 56 billion (or EUR 40 billion) Estimates are based on total CO2 emission of sectors not covered under the EU ETS scheme (eg households and services transport agriculture small installation) For additional information see EC (2011)
22 Until 2010 Switzerland returned all carbon taxes to households and businesses but since 2011 a third has been spent on financing emission reduction projects (Elbeze and de Perthuis 2011)
20
The Landscape of Climate Finance 2012
21
The Landscape of Climate Finance 2012December 2012 December 2012
support emission reduction projects while 60 is returned to industry Boulder Quebec and BAAQMD also use proceeds to support climate mitigation pro-grams (NREL 2009)
The estimated USD 73 billion is not counted against the total climate finance presented in the Landscape 2012 Our intent is to highlight the contribution of this mecha-nism as a source of finance for government budgets
SOURCES ESTIMATED VALUE DESTINATIONS
bull Taxes levied on households and businesses USD 73 BILLION bull Government budgets USD 73 billion
DESCRIPTIONbull Taxes applied on CO2 or GHG emissions andor on the amount of energy consumed For energy-related taxes only the share
accruing to carbon taxes was retained in the estimate
PRIMARY DATA
SOURCES
bull Elbeze and de Perthuis (2011) based on data from the Ministries of the Environment of the covered countriesbull The European Commission statistical office Eurostat maintains a database covering environmental tax revenues from energya
transport and pollution and resource taxes CO2 taxes are included in the energy taxes category but cannot be differentiatedbull The OECD and the European Environment Agency (EEA) maintain a database on environmentally-related taxesb fees and
charges
ISSUES ANDOR FUTURE ANALYSIS
bull Incompleteness Our estimate covers only selected European countriesbull The portion devoted to climate finance cannot be easily estimated Tax revenues can be distributed in several ways eg
returned to tax payers used to reduce levies from labor or capital or put toward general government budgets Only some countries use carbon-related tax revenues for carbon mitigation programs
bull Tracking gaps A single repository of data or recurrent effort to aggregate figures on carbon tax revenues has not been identified so far
a Energy taxes include those applied on energy products used for stationary (eg coal electricity natural gas fuel oils) as well as transport purposes In 2010 energy taxes levied in the 27 Member States of the European Union amounted to USD 291 billion 18 of the Union GDP (Eurostat 2012 2011a)
b For additional information see the OECDEEA database web page
General tax revenuesIt is challenging to calculate precisely the extent of general tax revenues directed towards climate finance as they generally pass through domestic public budgets before being allocated to particular programs and purposes Given the strong hypothesis that should be applied and in line with the approach adopted the Landscape 2011 report this study refrains from providing an estimate for this source
Evaluating the volume of general tax revenues associ-ated with climate-specific activities would be easier if sources of funding were specifically earmarked to climate change objectives
In Tunisia for instance revenues from a tax levied on the first license registration of vehicles and custom duties on air conditioning equipment are devoted by law to the National Fund for Energy Conservation (FNME) This Fund sustains renewable and energy efficiency measures in the country23 In 2009 in the Tunisian
23 Law 2005-82 Official Printing Office of the Republic of Tunisia
budget around USD 21 million were allocated against the Fund (INS 2010)
Another example can be found in Brazil where the resources collected via the National Fund on Climate Change (FNMC) which is partly financed with a levy on the profits made by the oil industry are earmarked to support mitigation and adaptation projects and studies on climate change and its adverse effects The resources of the Fund can also be used to leverage inter-national public and private climate finance to support the mitigation and adaptation activities laid out in the countryrsquos Policy on Climate Change In 2011 the initial budget of the Fund was estimated for USD 132 million (R$ 226 million) (BNDES 2011 UNDP 2011 BNDESgovbr Brasilgovbr)
22
The Landscape of Climate Finance 2012
23
The Landscape of Climate Finance 2012December 2012 December 2012
Government budgets
Contributions from government budgets are estimated at between USD 16 and 23 billion in 20102011 The estimate includes USD 111 ndash 112 billion of domestic funds for project finance reported in the Bloomberg New Energy Finance database largely origi-nating from developed countries for small-scale invest-ments (USD 28 billion) larger-scale investments (USD 83 billion) and carbon offset finance (USD 01 billion) A large part relates to the US governmentrsquos rsquogreenrsquo economic stimulus packages
The estimate also includes contributions from devel-oped country governments to developing countries of between USD 48 and 114 billion in 2010 excluding reporting of finance channelled through AFD JICA and KfW as discussed below The lower bound of this esti-mate considers only aid marked as ldquoprincipallyrdquo climate change-related in the OECDrsquos Creditor Reporting System (CRS) database The upper bound of the range includes an additional USD 18 billion of money identi-fied in Fast-Start Finance reporting for the same year The range includes bilateral Overseas Development
Assistance (ODA) and Fast-Start Finance commitments in 2010 from 28 OECD countries plus Cyprus Latvia Liechtenstein Lithuania Mata and the UAE Notably no data was available in the sources consulted for OECD countries such as Chile Estonia Hungary Israel Mexico24 or Turkey
For our estimates of government budget contributions we exclude government contributions (including ODA) delivered through national bilateral and multilateral intermediaries and funds due to the current lack of data required to do so across the full range of actors and to avoid double counting with other flows captured separately (see Intermediaries section) Our estimate is therefore conservative and can be considered as a minimum Further discussion on government contri-butions to Development Finance Institutions (DFIs) is included in Box 3 which attempts to highlight the extent of public sector contributions to funding for
24 Mexico is a member of the OECD with DAC observer status Latt (2011) discuss Mexicorsquos role as an ldquoemerging donorrdquo conducting technical and scientific cooperation projects in developing countries to a value of around USD 16 million in 2009
SOURCES ESIMATED VALUE DESTINATIONS
IntE
rnal bull Carbon market revenues USD 2 billion
bull Carbon taxes USD 73 billionbull General tax revenues NE
USD 16-23 BILLION In
stru
mEn
ts an
d usE
s
bull Policy incentives NEbull Risk management NEbull Carbon offset finance USD 01 billionbull Grants USD 42 ndash 99 billionbull Low cost debt USD 59 ndash 65 billionbull Project-level market rate debt USD 02 billionbull Project-level equity USD 02 ndash 05 billionbull Balance sheet financing USD 54 billion
Usesbull USD 149-182 billion mitigation bull USD 1-44 billion adaptation
ExtE
rnal
bull Changes in net debt from third-party NE
OthE
r act
Ors
bull Development Finance Institutions NEbull Climate Funds NEbull Ownership of other actors of the landscape NE
DESCRIPTIONDomestic and international government climate finance expenditures fed by conventional tax revenues ownership earnings or sovereign bond issuance as well as in some cases revenues raised from carbon pricing mechanisms
PRIMARY DATA
SOURCES
bull OECD Development Database on Aid Activities Creditor Reporting System bull Fast Start Finance Reporting to the UNFCCCbull Bloomberg New Energy Finance database
ISSUES AND FUTURE
ANALYSIS
There is a lack of information on the extent of government contributions to Development Finance Institutionsrsquo climate finance as well as domestic and developing country sources of climate finance General budget support is by definition not earmarked in any way but may be another source of climate finance not currently tracked
Note Carbon market revenues and taxes while included in this table are discussed in detail in previous sections and tables
22
The Landscape of Climate Finance 2012
23
The Landscape of Climate Finance 2012December 2012 December 2012
low-carbon climate-resilient development in recent years in spite of fiscal austerity and the tightening credit context
Indeed if we were to include these amounts we see that more than half ndash USD 116 billion of USD 23 billion ndash of bilateral ODA commitments in 2010 were reported as being delivered by just three Bilateral Finance Institutions (AFD KfW and JICA) We also see that climate-related bilateral Official Development Assistance grew from USD 95 billion in 2009 to an estimated USD 23 billion in 2010 reflecting the impact of Fast-Start finance pledges which we estimate accounted for around 36 of Official Development Assistance in 2010 as well as the introduction of the marker for adaptation finance in the OECD CRS data-base The top providers of bilateral ODA were Japan Germany France and the United States
Export credits which support export transactions by hedging risks for investors are excluded from our esti-mate of government contributions because the instru-ments may not be called upon and may not therefore represent a true flow They may however play a key role in stimulating private low-emission investments in developing countries (see Instrument section for further information)
Grants (USD 42-99 billion) low-cost debt (USD 59-65 billion) and ldquobalance sheetrdquo financing of owned emission reductions projects (municipalities public schools military installations etc) (USD 54 billion) are the most common forms of financing provided using government money Flows to policy incentives and risk management instruments are expected to be very large but are not quantified in the study
We find that 64-72 of that deployment occurs in developed countries and 28-36 in developing countries
a American Reinvestment and Recovery Act grants Georgia Environmental Finance Authority grants Voluntary Airport Low Emission grants State of Pennsylvania solar program grants Rhode Island Economic Development Corporation grants etc
ExampleThe US Governmentrsquos many roles in solar project financing include (1) federal and state-level policy incentives to promote the renewable energy deployment (2) risk management instruments such as US Department of Energy partial or full loan guarantees (3) project-specific grantsa and (4) low cost debt such as the US Department of the Treasuryrsquos Federal Financing Bank loans to some of the largest projects financed in 2011 These various roles highlight the diversity of financing instruments available
24
The Landscape of Climate Finance 2012
25
The Landscape of Climate Finance 2012December 2012 December 2012
Box 3 The role of Development Finance Institutions Development Finance Institutions play a complex and crucial role in the climate finance landscape operating as a pivotal link between public and private finance
Preliminary investigation of the ownership structure of private investments mapped in the climate finance landscape indicates that a large portion of these investments could be classified as governmentsrsquo direct and indirect shareholdings in and lending to private investment structures (see Box 5 for more information) Public finance institutions add significant value to financing packages by subsidizing interest rates transforming the maturity of loans to long-term and absorbing a share of the risks of the loans handed out to the private sector Without public backing many of these packages would be unviable
Likewise government backing of Development Finance Institutions underpins their ability to raise funds and provide a range of instruments specially tailored to the delivery of low-emissions climate-resilient finance
The ownership structure of DFIs is typically dominated by nationalmember governments that initially capitalized the institutionsrsquo capital base and govern their activities
Net budget inflows to Development Finance Institutions in a given year on the other hand are mainly driven by their own financial activities (for instance their equity holdings and earmarked returns on investments) and finance raised on capital markets andor borrowings from governments With high financial security profiles (AAA credit rating) DFIs are able to refinance their activities via very low interest rate bonds
Also thanks to their capital structure and high financial security DFIs can deliver a range of concessional and non-concessional instruments to finance investments in developing countries Budget inflows may also include specific grant contributions from governments or trust funds that can either be passed on directly or used to further soften lending conditions (the grant element) of low-cost debt in order to deliver loans with deep concessions adapted to recipient needs eg poor financial capacity or for projects with long-term economic returns The average level of grant element in concessional loans provided by DFIs varies considerably depending on institutional mandates
Given the complexities laid out above this study does not yet provide an estimate of the level of government contribution to DFIs The foremost difficulty encountered relates to quantifying the costs to governments of absorbing the risks associated with backing DFI activities In terms of budget flows on the other hand transparent reporting is not always available due to confidentiality requirements and the fact that finance is disbursed over a period of years rather than at the time of commitment also presents difficulties
Discussions with just three DFIs included in this study suggest average grant elements of concessional loans of between 12 and 20 but with a range up to 70 for individual loans with deep concessions If we were to assume that all grants are provided using 100 contributions from government sources and an average grant element contribution from governments to low-cost debt of 17 we would estimate a contribution of government budgets to all DFI activities captured in the Climate Finance Flows Diagram 2012 of USD $10924 million (15 or 17 leverage) This estimate is not included in the Climate Finance Flows Diagram 2012 at present due to the lack of detailed information available for the full range of institutions included in the study and the difficulties outlined above
Thus while annual government budget contributions to DFIs may be relatively low finance provided by DFIs is generally considered to be public For example in the case of bilateral ODA according to the OECD DACrsquos reporting directives where ldquoOfficial transactions are [defined as] those undertaken by central state or local government agencies at their own risk and responsibility regardless of whether these agencies have raised the funds through taxation or through borrowing from the private sectorrdquo
24
The Landscape of Climate Finance 2012
25
The Landscape of Climate Finance 2012December 2012 December 2012
Box 4 ndash Supporting Renewable Energy in the US
US federal tax incentives cash grants and loans sustained a boom in renewables investment through the depths of the worst financial crisis since the Great Depression
The US public and private sectors invested a total of USD 143 billion in renewable energy projects and installed 34 GW of new solar and wind capacity between 2008-2011 ndash with over USD 50 billion and 9 GW in 2011 alone While the bulk of the financing for these projects came from the private sector growth was underpinned by stable renewable deployment support policies at both the state and federal level
With relatively low US electricity market prices most renewable projects built over the last four years would not have attracted investors without additional support from governments or ratepayers Aggressive long-term state-level renewable energy obligations (such as Californiarsquos requirement that 33 of its electricity be generated from non-hydroelectric renewable energy sources by 2020) have driven demand However as the recession squeezed state and ratepayer budgets federal government supports became more important
Prior to the financial crisis two primary federal policies were available ndash a USD 22MWh production tax credit for wind and a 30 investment tax credit (ITC) for solar But tax incentives require substantial and predictable tax liabilities from profits to be useful ndash and once the crisis hit these were in short supply Twenty or so large financial firms had provided over USD 6 billion in tax equity financing for renewable projects in 2007 About half of them ndash including AIG Lehman Brothers Citi and John Hancock ndash had exited the tax equity market by 2009 Further the financial crisis left banks less willing and able to provide long-term low-cost debt for capital-intensive projects such as wind and solar farms
The US economic stimulus in early 2009 addressed these issues Instead of tax credits wind and solar projects starting construction by the end of 2011 could choose a 1603 Cash Grant equal to 30 of eligible project costs So far the program has provided USD 13 billion (USD 47 billion in 2011) to support renewable investment The federal government also offered direct federal loans and partial guarantees of private loans to address tightness in debt markets a total of USD 86 billion in direct loans (USD 7 billion in 2011) and USD 57 billion in partial guarantees (USD 42 billion in 2011) to date
These and other measures leveraged enough private investment to double US non-hydroelectric renewable energy generating capacity in four years And as the financial crisis has eased the tax equity market has recovered hitting the $6 billion level in 2011
The two stimulus programs ended in 2011 and the production tax credit for wind expires at the end of 2012 The cost of extending the production tax credit now stands as a significant barrier to continued renewable energy growth However there are ways to make these important federal policies more cost-effective Policies that expand the pool of investors could reduce costs for developers and for taxpayers CPI work suggests that replacing the current tax incentives with smaller cash incentives could provide the same benefits to projects at just over half the cost to government
Prepared by Uday Varadarajan (CPI San Francisco udayvaradarajancpisforg)
Based on Varadarajan et al ldquoSupporting Renewables while Saving Taxpayers Moneyrdquo CPI Report (2012)
26
The Landscape of Climate Finance 2012
27
The Landscape of Climate Finance 2012December 2012 December 2012
Corporate actorsIn the Landscape 2012 we have been better able to high-light the contribution of corporate actors in the global landscape of climate finance We find that corporate actors contributed 21 of global climate finance Corporate actors unlike project developers do not sell green electricity or related products and services We identified two main categories of corporate actors
First some non-energy corporate actors are eager to deploy emissions reduction assets to reduce their energy bills or meet voluntary commitments These include technology companies (eg Google) and com-panies with large warehouses installations or factories (eg IKEA) The estimate of contributions from non-energy corporate actors includes a very large share of small-scale renewable energy (solar PV and solar water heating amp cooling) of more than USD 51 billion Sometimes the investor is an industrial conglomerate for which it is hard to be able to identify a specific set of activities Apart from investing in emissions reduction
projects some of these corporate actors might be required to comply with GHG emissions cap-and-trade scheme allowing for the use of offsets
Second some manufacturers of (renewable) energy systems financed the deployment of their own systems (pilot amp demonstration plants vendor financing etc) Examples include wind turbine manufacturers (such as Chinarsquos Goldwin and Spainrsquos Gamesa) solar PV and thermal systems manufacturers (Japanrsquos Sharp Spainrsquos Gestamp USArsquos MEMC Indiarsquos Moser Baer and Chinarsquos CHINT Group) and electricity generation technology providers (USArsquos GE financial services Indiarsquos Crompton Greaves and South Korearsquos Samsung CampT Corp)
We find that 80-93 of corporate actorsrsquo contributions are sourced domestically 6-14 in other developed countries than the emissions reduction project host country and the remaining 2-6 in other developing countries than the emissions reduction project host country (technology developers notably) We find that
SOURCES ESTIMATED VALUE DESTINATIONS
IntE
rnal bull Reinvested earnings from recurrent and exceptional
income NEUSD 693 ndash
805 BILLION
Inst
rum
Ents bull Carbon offset finance USD 12 billion
bull Project-level market rate debt USD 15 ndash 26 billionbull Project-level equity USD 15 ndash 26 billionbull Balance sheet financing USD 650 ndash 741 billion
ExtE
rnal bull Changes in net debt and equity from third-partya
NE
OthE
r act
Ors
bull Ownership of other actors of the landscape NE
DESCRIPTIONCorporate actors whose activity cannot be categorized as ldquoproject developersrdquo comprised of
bull Non-energy corporate actorsbull Manufacturers of renewable energy systems
PRIMARY DATA
SOURCES
bull Bloomberg New Energy Finance and UNCTAD FDI databull Frankfurt School - UNEP Collaborating Centre for Climate amp Sustainable Energy Finance Global Trends in Renewable Energy
Investment 2012bull REN21 Renewables 2012 ndash Global Status Reportbull Weiss amp Mauthner Solar Heat Worldwide report (edition 2012)bull Ecosystem Marketplace State of the Voluntary Carbon Markets Report
ISSUES AND FUTURE
ANALYSIS
bull Motivation for investment The main driver for investment (energy savings opportunism synergies with other corporate activities promoting own technologies etc) is not always clear
bull Access to capital Sometimes corporate money helps overcome difficulties in accessing more traditional sources of capital such as banks
bull Definitional issues Boundaries with households can be difficult to delineate in the case of small family-based corporate actors Likewise geographical origin of corporate actors can be hard to identify in the case of multinational groups
a This corresponds to the net value of debt raised minus debt repaid for a given year This relates to commercial financial institutions mostly Please note that other actors of the landscape such as institutional investors can be interested in corporate debt issues (bonds medium-term notes etc) as an investment vehicle The same logic is applied to changes in net equity
26
The Landscape of Climate Finance 2012
27
The Landscape of Climate Finance 2012December 2012 December 2012
13-22 of the corporate actorsrsquo money went to devel-oping countries and 78-87 went to developed coun-tries (notably small scale PV in Italy and Germany)
ExampleIn 2009 Ferrari installed a rooftop PV system at one of its factories in Italy Large warehouses such as those for automotive factories are natural candidates for laying out solar panels on rooftops (General Motors did the same for one of its factory in Spain in 2008 with a total capacity of 12 MW) The main motivation is energy savings (expected savings of 200000 kWh per year) and potential return from installing a rooftop PV system Investment money was sourced from Ferrarirsquos own balance sheet and revenues and would be used to pay for the system and its installation
ExampleSiemens Financial Services and Siemens Bank the lending arms of the German technology manufacturer Siemens would be categorized as corporate actors Money would be sourced from the company balance sheet of parent companies and from their own revenues Money is then lent against projects using Siemens wind turbines For instance Siemens Financial Services provided a share of project-level market rate debt to the 272 MW Seigneurie de Beaupre onshore wind farms in Canada and phase I of the 288 MW Meerwind Sud und Ost offshore wind farm in Germany last year
28
The Landscape of Climate Finance 2012
29
The Landscape of Climate Finance 2012December 2012 December 2012
Institutional investors We find that the direct contribution of institutional investors to emissions reduction projects is in excess of USD 620 million for the year 2011 This number seems low compared to expectation but given the lack of trans-parency on institutional investorsrsquo involvement the fact that our representative sample excludes many countries where institutional investors have been active these last years (notably some North European countries) and our focus on primary equity stakes and not stakes taken in projects already running (secondary market transac-tions representing only money changing hands) this appears as a reasonable lower bound
In 2011 institutional investors have been active on both the debt and equity side For example on the debt side25 US insurance company Metlife provided debt to US onshore wind (EnXco Lakefield) and US solar (Webberville PV Plant) projects In Canada the Great-West Life Assurance Company and Ontario Pension Board provided debt to Sprott amp Firelight Amherst wind farm On the equity side Allianz and Munich Re invested in European solar and wind assets while Brazilrsquos workersrsquo severance fund provided equity to more than 200 MW of domestic onshore wind projects
25 Whenever project bonds have been issued (US solar projects) therersquos a possibility that institutional investors purchased such issues and therefore contribute to providing debt to emissions reduction projects
We find that nearly 37 of institutional investorsrsquo contributions are sourced domestically and the remain-der in developed countries other than the project host country We find that approximately 11 of institutional investorsrsquo money went to developing countries and 89 to developed countries (Europe and the US)
SOURCES ESTIMATED VALUE DESTINATIONS
IntE
rnal bull Reinvested earnings from recurrent and exceptional
income NEgt USD 06 BILLION
Inst
rum
Ents bull Project-level market rate debt gt USD 02 billion
bull Project-level equity gt USD 02 billionbull Balance sheet financing gt USD 02 billion
ExtE
rnal
bull Changes in net debt and equity from third-party NE
OthE
r act
Ors
bull Ownership of other actors of the landscape NE
DESCRIPTION
Theyrsquore comprised ofbull Insurance companiesbull Pension fundsbull Foundations amp endowments
PRIMARY DATA
SOURCESbull Bloomberg New Energy Finance and UNCTAD FDI data
ISSUES AND FUTURE
ANALYSIS
bull Improving coverage a more systematic and in-depth tracking of contributions to the landscape will be useful as more deals (both on the debt and the equity side) involve institutional investors
bull Indirect investment channels institutional investors also invest in emissions reduction projects via infrastructure amp private equity funds
bull Improving definitions distinguishing by sub-categories of institutional investors as they have different objectives and constraints
28
The Landscape of Climate Finance 2012
29
The Landscape of Climate Finance 2012December 2012 December 2012
Project developersWe highlight project developer contributions in the Landscape 2012 and find that they contributed 34 of global climate finance
We define project developers as dedicated entities with the ability to design commission and operate and maintain emissions reduction projects These include power and gas utilities and independent power produc-ers (Spainrsquos EDP Francersquos EDF US Duke Energy China Datang and Guodian for instance) energy companies (Francersquos Total UKrsquos BP or Brazilrsquos Petrobras) and engineering procurement construction contractors and independent developers of projects (NRG Energy in the US smaller Spanish and Italian project developers)
We find that 83-94 of project developersrsquo contri-butions are sourced domestically 6-16 from other developed countries other than the emissions reduc-tion project host country and the remaining 0-1 from other developing countries other than the emissions reduction project host country We find that 50-56 of the project developersrsquo money went to developing coun-tries and 44-50 went to developed countries
SOURCES ESTIMATED VALUE DESTINATIONS
IntE
rnal bull Reinvested earnings from recurrent and exceptional
income NEUSD 1150 ndash
1293 BILLION
Inst
rum
Ents bull Carbon offset finance USD 12 billion
bull Project-level equity USD 164 ndash 184 billionbull Balance sheet financing USD 974 ndash 1097 billion
ExtE
rnal
bull Changes in net debt and equity from third-party NE
OthE
r act
Ors
bull Ownership of other project developers NE
DESCRIPTION
Emissions reduction project developers includingbull Dedicated project developers amp EPC contractorsbull Utilities and independent power producersbull Energy companies
PRIMARY DATA
SOURCES
bull Bloomberg New Energy Finance and UNCTAD FDI databull Frankfurt School - UNEP Collaborating Centre for Climate amp Sustainable Energy Finance Global Trends in Renewable Energy
Investment 2012bull REN21 Renewables 2012 ndash Global Status Reportbull Weiss amp Mauthner Solar Heat Worldwide report (edition 2012)bull Ecosystem Marketplace State of the Voluntary Carbon Markets Report
ISSUES AND FUTURE
ANALYSIS
bull Definitional issues The boundaries of specific sub-categories and potential overlap with corporate actors (conglomerates for instance) needs to be easier to identify to better understand underlying drivers for investment
bull Non-energy projects the contributions of non-energy project developers is hard to assess
ExampleNRG Energy is a US project developer that has deployed roughly 15 GW of solar PV capacity in the US in 2011 directly and via its subsidiaries NRG Energy is able to invest thanks to its expertise own resources and ability to secure project finance and attract external equity investors (such as MidAmerican Energy Holdings Co) for its larger projects
Likewise EDF a French energy grouppower and gas utility invested in solar and wind projects throughout the world in 2011 (US Germany etc) directly and via its subsidiaries (EDF Energies Nouvelles EnXCo Inc etc) Money comes from its own resources and project-level financing (tax equity arrangement in the US for instance)
30
The Landscape of Climate Finance 2012
31
The Landscape of Climate Finance 2012December 2012 December 2012
Households Households represent a source of money that we did not explore in the Landscape 2012 We define house-holds as (1) family-level economic entities (2) high net worth individuals and (3) their intermediaries whether they are family offices investing on their behalf or dedi-cated foundations operating philanthropic programs Their money stems from income and savings including inherited or entrepreneurial wealth They are also able to borrow to invest into emissions reduction assets or support such investment via grants We find that households contributed 8-10 of global climate finance
SOURCES ESTIMATED VALUE DESTINATIONS
IntE
rnal
bull Income and savings NE
USD 323 BILLION
Inst
rum
Ents bull Grants USD 02 billiona
bull Carbon offset finance lt USD 01 billionbull Balance sheet financing USD 321 billion
ExtE
rnal
bull Changes in net debt NE
OthE
r act
Ors
bull Ownership of other actors of the landscape NE
DESCRIPTIONHouseholds and wealthy individuals involved in philanthropy and their intermediaries (family offices and dedicated foundations)
PRIMARY DATA
SOURCES
bull Bloomberg New Energy Finance and UNCTAD FDI databull Frankfurt School - UNEP Collaborating Centre for Climate amp Sustainable Energy Finance Global Trends in Renewable Energy
Investment 2012bull REN21 Renewables 2012 ndash Global Status Reportbull Weiss amp Mauthner Solar Heat Worldwide report (edition 2012)bull Ecosystem Marketplace State of the Voluntary Carbon Markets Report
ISSUES AND FUTURE
ANALYSIS
bull Householdsrsquo contribution is hard to measure Figures are estimates onlybull Sources of finance for households need to be better understoodbull The contribution of households in the field of energy efficiency and electric vehicles investments is not measured here
a This relates to philanthropy and is discussed in the dedicated instrument section
Householdsrsquo asset finance ndash USD 323 billion ndash cor-responds 993 to small scale installations USD 226 billion of solar PV in developed countries and USD 79 billion of solar thermal heating and cooling in devel-oping countries (mainly China) are the largest con-tributors A small share of householdsrsquo contribution to climate finance flows in 2011 relates to grants from US and European philanthropic programmes and an even smaller portion of it relates to voluntary carbon offsetting
As expected all of householdsrsquo contributions were sourced domestically We find that 75 of the house-holdsrsquo contributions were in developed countries and 25 were in developing countries
30
The Landscape of Climate Finance 2012
31
The Landscape of Climate Finance 2012December 2012 December 2012
Box 5 - Who actually sits behind the moneyIn the Landscape 2012 we explored who actually ldquosits behindrdquo climate finance actors That is a project developer can actually be the subsidiary of an entity located in another country or categorized as an actor The ldquoproject developersrdquo category is the one for which this information is most interesting and revealing The impact of such re-categorization is explored in more detail in the uses section of this report In particular we find that
bull Close to USD 410 billion of 2011 project developers investment flows (31-35) could be categorized as domestic public budget instead The largest contributor to this phenomenon is Peoplersquos Republic of Chinarsquos direct and indirect ownership of solar wind waste and biomass project developers
bull Close to USD 60 billion of 2011 project developers investment flows (around 5) is actually funded by (in almost equal parts) (1) venture capital private equity and infrastructure funds on the one hand and (2) corporate actors on the other hand
ExamplesChange in the geographical origin of money - In 2011 EDP Renewables North America LLC financed three onshore wind farms in the US for a cumulative capacity of close to 600 MW Categorizing the project based on first degree ownership implies that project has been financed by a domestic project developer As we dig into the cascading ownership structures of the equity holders and categorize the project based on the ultimate ownership we determine that project has been actually financed by a foreign project developer1
Change in the type of actor ndash In 2011 China Datang Corp Renewable Power Co Ltd financed more than 15 GW of onshore wind farms in mainland China At first sight we would categorize the equity holder of the project as a domestic project developer It turns out that the developer is owned by one of the large state-owned power generation entities and therefore should be categorized as being financed by the Chinese domestic public budget2
1 EDP Renewables North America LLC is owned by EDP Renovaveis SA (Spain) in turn owned by EDP - Energias de Portugal SA (Portugal)2 China Datang Corp Renewable Power Co Ltd is owned by China Datang Corp which is held by the State-owned Assets Supervision amp
Administration Commission of the State Council (SASAC) the Peoplersquos Republic of China holding for State-Owned Entities (SOEs)
32
The Landscape of Climate Finance 2012
33
The Landscape of Climate Finance 2012December 2012 December 2012
32 Intermediaries
finance flows of the last two in particular were partially captured and the category not specifically featured in the Landscape 201127
While until recently the role played by NFIs and Sub-Regional Development Banks in the climate finance architecture has received limited attention international donors are increasingly aware of their privileged position in knowledge of and relationship with local markets This increased international focus the International Development Finance Clubrsquos (IDFC) mapping initiative (Ecofys-IDFC 2012) and their direct disclosure of data made it possible to gather more detailed information about NFIsrsquo and Sub-Regional Banksrsquo climate finance flows and have lent visibility to their contribution to a wide range of climate-compatible activities
Although we have more information on intermediariesrsquo climate finance than we did in the Landscape 2011 our estimate still represents an incomplete figure due to the partial reporting28 of some entities and our inability to capture other playersrsquo flows due to data constraints
27 The Landscape 2011 included the Brazilian BNDES IREDA and the China Development Bankrsquos climate financing featuring these entities among Bilateral Finance Institutions This year we have broaden the coverage capturing a wider range of National players as well as Sub-Regional ones such as the Development Bank of Southern African (DBSA) the Develop-ment Bank of Latin America (CAF) and the BCIECABEI Central American Bank for Economic Integration See Appendix D for details
28 A number of MDB s currently engaged in a joint initiative aimed at harmonizing mitigation and adaptation finance reporting did not disclose their adaptation finance data as yet The Joint MDB Report on Mitigation
INTERMEDIARIES ANNUAL FLOWS OF DIRECT CLIMATE FINANCE(2010 2011 USD BILLION)
PUBLIC
Development Finance Institutions (67) 768bull National and Sub-Regional Finance Institutions (37) 427a
bull Bilateral Finance Institutions (10) 113bull Multilateral Finance Institutions (18) 212bull Climate Funds (1) 15
Sub-total public (67) 768
PRIVATE
Commercial financial institutions (31) 307 - 404Venture capital private equity amp infrastructure funds (2) 24Sub-total private (33) 331 - 428
TOTAL Total 1099 - 1196
Note To avoid double counting only USD 15 billion of the USD 25 billion Climate Fund money is included in the total Climate Finance (we excluded developed to developing countries bilateral funds which we assume are accounted for in bilateral reporting in the OECD-CRS database) We acknowledge that Climate Funds are not generally associated to Development Finance Institutions here are included in this category as typically managed by DFIs or operating in closed relationship with thema Total National and Sub-regional institutionsrsquo climate financing differs from that presented in the Ecofys-IDFC report (2012) See Appendix D for details
Public and private financial institutions play an important role in climate finance flows raising and channelling USD 110-120 billion of global climate finance Public intermediaries such as Multilateral Bilateral National and Sub-Regional Development Banks distribute USD 768 billion or about two-thirds of these resources
The Landscape 2012 seeks to present a comprehen-sive picture of public and private intermediaries While several initiatives track climate finance that flows through public intermediaries there is less informa-tion about climate finance distributed through private intermediaries Their engagement is critical to identify and finance climate projects particularly small-scale ones thereby to unlock private resources and scale-up finance26
Public sector intermediariesDevelopment Finance InstitutionsIn the Landscape 2012 the public intermediaries cat-egory covers a broad range of Development Finance Institutions (DFIs) including Multilateral Bilateral Sub-Regional and National Finance Institutions The climate
26 The San Giorgio Group ldquoProsol Tunisiardquo case study presents insights on this aspect See Trabacchi et al (2012) See also for instance the Turkish Sustainable Energy Finance initiative established by EBRD to help drive the transformation in the private banking sector in supports of small and medium sized energy efficiency and renewable energy investments For more information see (Ebrdcom and Tursefforg)
32
The Landscape of Climate Finance 2012
33
The Landscape of Climate Finance 2012December 2012 December 2012
UN agencies as well as countriesrsquo cooperation agen-cies are also active intermediaries in the climate finance architecture29 the flows managed and distributed by these entities have not been included in this section to avoid double counting Their resources ndash the portion complying with ODA criteria and hence reported in the OECD-CRS database ndash are in fact captured in the Governmentsrsquo budgets data An ad-hoc study should be pursued to highlight their actual contribute which typically goes beyond pure intermediation By working closely with recipient governments on national strate-gies and policy frameworks conducive to investment in fact these entities help develop demand for climate finance (AGF 2010) With the objective to enhance the effectiveness of their actions DFIs often partner with these agencies to coordinate interventions
The resources raised and channelled by DFIs can be both of public and private nature DFIs in fact do not only operate through public budget resources (ie direct contributions from donor countries) but can also raise funds on the capital markets reinvest earnings and mobilize additional funds through co-financing (either from commercial banks financial institutions develop-ment partners or other international finance institu-tions) This allows them to support investments that are much greater than public funds can provide alone
Sources of finance vary from bank to bank depend-ing on their structure and mandates30 It is difficult to determine the portion of public budgets flowing to DFIs each year in the pursuit of development coopera-tion activities or specific mandates It is also difficult to quantify how much global capital markets contribute
Finance 2011 (IDB et al 2012) released for Rio+20 provides preliminary insights on the methodology developed and the resulting mitigation figures A new version of the report with revised and more disaggregated data is planned to be released at COP 18 in Doha The release of a report describing the jointly agreed methodology for adaptation is also planned at the same time
29 Agencies like DIFID NORAD and USAID in 2010 channelled possibly up to USD 96 billion of the bilateral climate-marked aid featured in the OECD CRS database (OECD 2010) They also played a role in the delivery of Fast-Start Finance USAID for instance serviced 27 of the US Fast-Start Finance over the FY20102011 (Fransen 2012)
30 For instance the International Development Association (IDA) ndash the larg-est multilateral channel of concessional financing to the poorest countries ndash is largely funded through donor contributions The International Bank for Reconstruction and Development (IBRD) on the other hand obtains most of its funds by issuing bonds in international capital markets In addition to general bond issuance some institutions have also initiated the issuance of climate themed bonds so called ldquogreen bondsrdquo The World Bank Group for example has issued over USD 33 billion in green bonds since the inaugural issue in 2008 (Treasuryworldbankorg)
to DFIsrsquo climate financing in a given year Clarifying this could shed light on the extent of the so-called ldquoleverage effectrdquo exerted by these entities to public money
Box 3 on government contributions to DFIs presents additional insights on this aspect
National Finance InstitutionsThe NFIs category in the Climate Finance Flows Diagram 2012 reflects a variety of players including
bull Some of the largest National Development Banks such as the Brazilian BNDES31 and the Chinese Development Bank (CDB) which contribute more than 80 of NFIsrsquo finance
bull Sub-Regional Development Banks like the Development Bank of Latin America (CAF) and
bull Relatively smaller players such as the Mexican Nacional Financiera (NAFIN) whose involve-ment and expertise in the climate finance arena are growing rapidly
With 427 billion32 NFIs represented around 567 of the total climate finance distributed by public actors (DFIs) in 2011
Although diverse and at various stages of institutional readiness for climate finance NFIs have key charac-teristics in common They bridge critical funding gaps perform in areas underserved by the private sector and implement national strategies set by their governments By partnering with MFIs andor BFIs National enti-ties can acquire relevant experience in the preparation risk assessment evaluation and monitoring of climate projects33
NFIs can have general mandates to foster broad eco-nomic and social development objectives or they can have mandates focused on specific niches ndash such as financing small- and medium-sized enterprises encour-aging infrastructure development or supporting a countryrsquos agribusiness sector (IDFC 2012)
31 In 2011 BNDES had a capital base of nearly USD 33 billion (BNDES 2012b)32 Data refers to funds committed in 2011 except for one institution that
reported its annual disbursement instead of commitments To minimize potential double counting the climate finance flows of the Indian Renew-able Energy Development Agency (IREDA) were reduced by 40 since as reported in IREDA (2012) the institutionrsquos resource base for 20102012 draws approximately 40 on international assistance
33 For instance the Sustainable Project Directorate of NAFIN ndash the bankrsquos unit dedicated to support climate-related projects received technical assistance from the World Bank and uses its methodology and manuals to manage the risks associated with renewable energy projects (IDB 2011)
34
The Landscape of Climate Finance 2012
35
The Landscape of Climate Finance 2012December 2012 December 2012
SOURCES ESTIMATED VALUE DESTINATIONS
IntE
rnal
bull Proceeds from operations NEUSD 753 BILLION In
stru
mEn
ts an
d usE
s
bull Risk management NEa
bull Carbon offset finance USD 007 billionbull Grants USD 401 billionbull Low-cost debt USD 466 billion bull Project-level market-rate debt 234 billionbull Project-level equity USD 037 billionbull Balance sheet financing USD 078 billionb
Usesbull USD 644 billion mitigation (86)bull USD 109 billion adaptation (14)
Oth
Er a
ctOr
s bull Public finance institutions bull Commercial financial institutionsbull Funds (eg climate funds carbon funds venture
capital and private equity funds)c
bull Ultimate beneficiaries
ExtE
rnal bull Public Budgets NE
bull Capital markets NEbull Other Development Finance Institutionsd
DESCRIPTION
The Development Finance Institutions featured in this study include bull National Finance Institutions (NFIs) ie entities typically owned funded and governed by a single national government with
local development mandates The climate finance flows of this players also include Sub-Regional Development Banks ie those generally supported by a group of countries in the pursuit of sub-regional mandatese
bull Bilateral Finance Institutions (BFIs) ie an individual country with the aim of providing aid contributing technical support or investing in selected development activities in developing or emerging countries
bull multiple countries encompassing both developing borrower countries and developed donor countries with the aim to provide financial and technical support to developing and emerging countries andor coordinate support among their member countries Multilateral Finance Institutions (MFIs)f
PRIMARY DATA
SOURCES
bull Self-reporting via CPI surveybull IDFC Green Finance Work Program (Ecofys-IDFC 2012)bull UNEP Bilateral Financial Institutions Climate Change Working Group (UNEP 2011)bull Joint MDB Climate Finance Tracking Initiative (IDB et al 2012)bull OECD Creditor Reporting System Aid Activities Database (OECD 2010)bull Bloomberg New Energy Finance Desktop Analysis
ISSUES ANDOR FUTURE ANALYSIS
bull Non comparability The reported estimate is derived from institutionsrsquo self reporting and secondary data sources Given the various approaches currently in place for accounting and tracking climate finance finance flows cannot be fully compared amongst this diverse group of institutionsg
bull Incompleteness To capture the true magnitude of DFIs involvement in the global climate finance landscape additional entities should be included in the analysis as well as the entire spectrum of their mitigation and adaptation financing Our estimate in fact reflects partial reporting from some MFIs which disclose mitigation finance data onlyh
bull Confidentiality concerns or lack of transparency impede actual understanding on some institutionsrsquo flowsbull Double-counting Cross financing between institutions may occur possibly resulting in double counting more research is
needed to ensure that presented flows are not inflated by such cross flowsi
a The portion of climate finance distributed in the form of risk management instruments is not included in the total actually reaching mitigation andor adapta-tion projects (see the Landscape 2012 methodology in Section 2)
b The total climate finance retrieved from the Ecofys-IDFC (2012) report for a group of NFIs was broken down against our categories of instruments according to (1st) the share stated in the report itself (ie 95 to loans and 5 to ldquoother instrumentsrdquo) (2nd) the weights observed in the financing modalities applied by the NFIs and BFIs for which we had data Due to data availability issues we allocated half of the estimated equity portion to ldquoproject-level equityrdquo and the other half to ldquobalance sheet financingrdquo
c The BFIsrsquo volume of climate finance includes investments in carbon funds and investment funds for renewable energy and clean technology projects OPIC in particular provides support to private equity funds aimed at developing nations Bancoacuteldex for instance made an investment in a relatively small venture capital fund called lsquoProgresa Capitalrsquo which focuses in the area of inter alia alternative energy (Smallridge et al 2012)
d The Mexican Nafin for instance has access to lines of credit from the World Bank and the Inter-American Development Bank (TNC 2012)
34
The Landscape of Climate Finance 2012
35
The Landscape of Climate Finance 2012December 2012 December 2012
In 2011 NFIs and Sub-Regional Development banks supported key low-carbon development sectors renewable energy projects and energy conservation accounted in fact for 509 and 262 of their mitiga-tion financing respectively Projects spanned from wind farms large-scale hydro and sustainable transport modalities or infrastructures (10) to those aimed at reducing land-use emissions via re-forestation and afforestation (23) BNDES funding to wind projects in 2011 was remarkable with USD 2 billion approved (investments of USD 32 billion) for 43 wind parks its support to the sector increased by almost three times compared to 2010 levels (BNDES 2012 see Box 7)
NFIs and Sub-Regional Development Banks also played a role in building countriesrsquo resilience to climate change devoting 12 (or USD 52 billion) of their support to measures contributing to adaptation objectives 313 of this in infrastructure improvements and 309 in the agriculture and forestry sector
NFIs and Sub-Regional Development Banks financed these activities mainly through loans at interest rates below those charged by commercial banks Low interest rate loans represented 866 of NFIrsquos climate financing BNDES stands out as a major provider of concession-ary credit that accounted for 997 of its lending This practice has helped to lower the cost of debt in Brazil the cost of debt is relatively higher in other emerging countries where NFIs such as the South African DBSA and the Indian Renewable Energy Development Agency (IREDA) financed mostly at market rates34
Unsurprisingly NFIs tend to invest domestically In fact 89 of their total climate finance was invested in the country where they are located Climate finance origi-nating from NFIs and Sub-Regional Development banks based in non-OECD countries (96 of the total) was mostly (90) directed toward domestic actions in the home country of the institution The remaining went to other non-OECD countries
Bilateral Finance Institutions (BFIs)The BFIs considered in the study include Agence Franccedilaise de Developpement and Proparco (AFD) KfW Entwicklungsbank and DEG (KfW) Japan International Cooperation Agency (JICA) and Overseas Private Investment Corporation (OPIC) Each of these BFIs have different structural characteristics and mandates AFD KfW and JICA are chiefly responsible for allocat-ing their countriesrsquo bilateral ODA contributions to other countries whereas OPIC provides financing and insur-ance to private sector investors that may help recipient countriesrsquo businesses while favouring US business interests35
In 2011 BFIs channelled about USD 113 billion in support of mitigation and adaptation interventions
Comparisons between BFIsrsquo outflows reported in the Landscape 2012 and the Landscape 2011 should be made with caution because data were obtained from different
34 The South African Government is committed to expand concessionary finance to boost investment and influence the direction of the economy (Pinheiro 2012) BNEF (2011) states that the interest rates applied by IREDA are more or less in line with those of commercial lenders and that it cannot be viewed as a source of ldquosubsidisedrdquo lending To estimate its portion of low-cost debt versus market-rate debt we associated to the former the total amount of finance committed to those sectors that in 2011 received the interest rate subsidies provided by the Indian Ministry of New and Renewable Energy to the Agency (IREDA 2012) To market-rate debt we allocated the remaining portion With regard to the high cost of debt issue see Box 9 on ldquoThe Indiarsquos experience in Financing Renewablesrdquo
35 OPIC typically supports companiesprojects that are at least 25 US-owned (OPICgov)
e NFIs and Sub-Regional Development Banksrsquo climate finance data are presented jointly as the data retrieved for some of these entities was in an aggregated form and sourced from the Ecofys-IDFC (2012) report This prevented us from associating financing to a single entity or re-allocating the related financing to a different category Sub-Regional Banks eg the Development Bank of America Latina CAF in fact can be seen as multilat-eral institutions For details on the institutions included in our estimates see Appendix D We acknowledge the presence of private players amongst banksrsquo shareholders CAF for instance has 18 shareholder countries and 14 private banks
f This definition follows that of amongst others Atteridge et al (2009) the World Bank (see WB website) and the UNFCCC (see UNFCCC website)
g MDBs are currently developing a joint approach for climate finance track-ing which has been implemented and applied to the data we received from some of the institutions covered in the study According to IDB et al (2012) ndash the first outcome of the MFIsrsquo work with a focus on mitiga-tion finance ndash the newly developed approach strives to capture only the components of a project with climate co-benefits This might not be the case as yet for other intermediaries which may account for the whole value of the project Additional work is needed to harmonize accounting methodologies enabling comparability between flows across the entire spectrum of DFIs
h Both comprehensiveness and comparability issues will partially be addressed in the future as MFIs have harmonized their adaptation and mitigation finance tracking and will jointly report their climate finance numbers Some BFIs are engaged in the discussions and hopefully these approaches will be transferred to NFIs too
i In the Landscape 2012 we tried to minimize double counting to the maximum extent possible depending on the granularity of data available Nafin for instance in 2011 financed renewable energy generation projects with USD 71 million of KfW resources This resources were not included in the total to avoid double counting In addition we were ensured that cross financing did not occur between the institutions covered in the Ecofys-IDFC report (2012) used as a source for some NFIsrsquo data
36
The Landscape of Climate Finance 2012
37
The Landscape of Climate Finance 2012December 2012 December 2012
and disaster risk reduction which in total received approximately USD 337 million more than in 2010
BFIs proved significant in channelling Fast-Start Finance contributions to developing countries AFD for instance implemented 69 of Francersquos Fast-Start Finance commitments in 2011 (USD 585 million) and also a portion of the European Commission ones (EC 2012 Minefi 2011) KfW was entrusted with 19 of Germanyrsquos Fast-Start Finance (Vieweg et al 2012)39 while OPIC in FY 2011 delivered 36 of the US total (USD 31 billion) notably increasing its share as com-pared to the previous year (8 in 2010) In a period of budget pressures OPIC ndash which operates at no net cost to the American taxpayer ndash helped the US meet its commitments at no expense to the public budget (Fransen et al 2012)
infrastructure such as mangroves39 KfW Fast-Start Finance refers to 2010-2011 Germany committed USD 473
million in 2010 and USD 603 million in 2011 Actual allocation was higher by USD 7 million in 2010 and USD 89 million in 2011
sources and categorized in a different manner36 When looking at equivalent data self-reported by the institu-tions the year-to-year variation highlights a 23 drop37 This could be because of contingency factors andor fewer projects in the pipeline The sector that expe-rienced the most significant reduction in funding was the sustainable transport sector which received almost USD 3 billion less than in 2010 (a 78 decrease mostly due to the fact that some investments have been post-poned to the beginning of next year) The agriculture forestry and land use sector and the energy efficiency sector also experienced reduced support with a 34 and 20 decrease respectively On the other hand certain adaptation measures saw increased funding such as those related to infrastructure development38
36 In last yearrsquos study data were compiled from various second-party sources and BNDES CDB and IREDA were included in this category
37 DEG has not been included in the year-on-year comparisons due to data availability issues
38 Projects in these categories include for example water infrastructure measures to improve dikes but also projects to plant or restore ldquogreenrdquo
Box 6 ndash How do NFIs finance their operations The case of BNDESNFIs have a diversified funding sources that include long-term sources of reimbursable and non-reimbursable public resources public deposits other Development Finance Institutionsrsquo resources and capital market bonds Funding diversification and the possibility of blending market and concessional resources from different actors enables NFIs to establish more attractive financing conditions for projects that are in the publicrsquos best interest
The weight of the various sources of capital can vary between the Banksrsquo capital structure and the annual inflow of resources used to finance operations
In the case of BNDES for instance the Government of Brazil funded the predominant share of the Bankrsquos total capital 817 as of the end of 2011 This share is comprised of resources from the National Treasury which contributes 497 and has been the Bankrsquos main creditor since 2010 another 285 of the total is financed by the Workersrsquo Assistance Fund (FAT) a special payroll tax (the PIS-PASEP) the Audiovisual Sectorial Fund and the National Climate Change Fund Further 34 comes from other governmental sources These funds are complemented by resources raised in the foreign market through financial market activities as well as operations with international institutions such as the Japan Bank for International Cooperation (JBIC) and the European Investment Bank (EIB) In 2011 foreign fundraising represented 36 of the Bankrsquos financing structure The remaining 147 is related to assets monetization and other obligations (BNDES 2012)
In recent years there has been a noticeable increase in the funds that BNDES receives from the Treasury while the amount of funding from international institutions has decreased steadily
In terms of capital flows over the course of 2011 756 of BNDESrsquo total net resources (USD 85 billion) came from return on credit operations while 192 came from the National Treasury The remaining was sourced from the Workersrsquo Assistance Fund and other sources
Pinheiro (2012) reports that the Bank received an annual contribution of about USD 10 billion from the Brazilian Government which is then channelled to recipients to achieve the Bankrsquos mandate
36
The Landscape of Climate Finance 2012
37
The Landscape of Climate Finance 2012December 2012 December 2012
BFIs also operate through a range of dedicated Climate Funds40 and are also active in carbon markets playing a ldquocarbon brokering rolerdquo through carbon investment funds41 The KfW Carbon Fund for instance promotes the use of carbon credits for compliance with the obli-gation under the UNFCCC while enabling and simplify-ing access to the market for buyers and sellers It also assumes or mitigates market risks (eg EU ETS III) As of December 2011 the KfW Carbon Fund contracted credit of over USD 557 million (Suennen 2012 UNEP-SEI 2011)
Multilateral Finance Institutions (MFIs)MFIs include
bull Global players like the World Bank Group
bull Regionally-oriented agencies such as the African Development Bank (AfDB) and the Asian Development Bank (ADB) and
bull Entities without a banking basis such as the EU Institutions generally identified as multilateral bodies42
MFIsrsquo financial support to climate change activities amounted to about USD 212 billion in 2011
The list of MFIs covered in the Landscape 2012 is the same as in the Landscape 2011 but our current esti-mate reflects better data quality made possible by the improved data gathering approach we adopted (ie direct reporting from the majority of the institutions 6 out of 9) and the improvements in MFIsrsquo reporting Comparisons with last year study however are not possible as we relied on different data sources with difference in scope Self-reporting data for 2010 and 2011 have not been made consistently available in some cases due to changes implemented in the accounting methodologies
In 2011 MFIs proved critical in supporting renewable energy generation projects which received 518 of
40 In 2011 for instance KfW and the German Federal Ministry for the Environ-ment launched the Global Climate Change Partnership Fund (GCCPF) a public-private initiative focused on energy efficiency and renewable energy investment for SME and private households The Danish Govern-ment IFC and Deutsche Bank also committed financing to the partnership over the course of the year (GCCPF website)
41 Last April AFD ndash along with other partners ndash announced the upcoming launch of a Carbon Fund for Africa (CDC Climat 2012)
42 The EU Institutions namely the EU Commission and the EU Development Fund are treated as multilateral bodies in the OECD DAC statistics Their climate finance data included in the Landscape 2012 refer only to their direct (ldquobilateralrdquo) contributions to developing countries (OECD 2011d)
their total mitigation finance (approximately USD 95 billion) The other two sectors that benefitted the most were energy efficiency and sustainable transport which received 194 and 184 respectively In terms of adaptation financing MFIsrsquo support was mainly directed to interventions in the agriculture and forestry sector and to capacity buildingtechnical assistance measures which received 278 and 127 of their total support to adaptation (USD 29 billion)43 Among DFIs MFIs are the ones that devoted the highest share to capacity building measures
Market rate debt was the dominant means used by MFIs for distributing climate finance (78)
Asian and European countries were the principal recipients receiving 37 (or USD 78 billion) and 271 (USD 58 billion) of the total MFIsrsquo climate finance respectively
The European Bank for Reconstruction and Development (EBRD) and the European Investment Bank (EIB) provided the greatest support to Europe (734)44 These lenders have been particularly impor-tant at a time when a deteriorated financing environ-ment has threatened the European Unionrsquos low-carbon transition The higher cost of borrowing experienced by commercial banks has in fact hampered lending which is unfortunate in times when investment needs are sig-nificant45 and action cannot be delayed (BNEF 2012b)
43 Activities with adaptation co-benefits in the transportation sector also received significant support Among the measures supported eg develop-ment of climate-resilient design standards upgrade of existing roads and highways to climate resilient design standards etc
44 Germanyrsquos KfW Group has also been a lead lender in the European clean energy sector (see Box 12)
45 For instance BNEF (2012b) states that investments in renewable energy capacity amount to more than USD 600 billion between the 2011-20 period in European Union countries alone
38
The Landscape of Climate Finance 2012
39
The Landscape of Climate Finance 2012December 2012 December 2012
Box 7 - Brazilrsquos experience in financing renewable energy with a focus on wind power
The total amount of BNDESrsquo approved financing for wind power has been dramatically increasing in recent years reaching USD 2 billion (R$ 34 billion) in 2011 which represents a 173 increase compared to 2010 (BNDES 2011)
According to US PREF (2012) BNDES reduces borrowing costs for eligible wind projects by roughly 40 BNDESrsquo favourable financing conditions also apply to other alternative technologies like biomass and small hydro and have been improving particularly since 20061 as part as BNDESrsquo mandate to incentivize ldquogreenrdquo sources of electricity According to BNDESrsquo analysis its financing offerings have contributed to a 25 decrease in renewable electricity tariffs during the 2003-2011 period
In general BNDESrsquo loans to renewable power generation projects have interest rates at 14 below those practiced for coal or oil thermal plants They also have longer repayment terms 16-20 years for renewable energy versus 14 years for conventional plants Moreover BNDESrsquo participation in renewable energy projects can reach at maximum 70-90 while for coal or oil thermoelectric plants it is at 50 (IDFC 2012)
Further by keeping fossil fuel based generation like coal and fuel oil fired thermal plants under stricter loan terms BNDES provides a competitive edge to renewable energies
Given the favourable financing environment for clean projects wind is not the only renewable resource that has experienced growth Overall BNDESrsquo disbursements to all renewable energy technologies supported by Brazilrsquos national policy have showed an upward trend in the 2003-2011 period which reflect the significant increase in BNDESrsquo volume of disbursements in the same period
In 2011 BNDESrsquo disbursements to renewable energy and energy efficiency reached about USD 72 billion (R$ 123 billion) 31 higher than in 2008
Prepared by Joana Chiavari (CPI Rio joanachiavaricpirioorg)
Based on a forthcoming CPI Report on policy approaches for promoting onshore wind power in Brazil
1 By looking at the financing conditions applied by the Bank over the 2003-2011 period we noted that in 2006 for instance the amortization period increased from 12 to 14 years and then in 2007 to 16 years Moreover the Bank lowered its basic return requirement from 25 to 15 in 2006 decreasing this further in 2007 to 1 and 2008 to 09
The Brazilian development bank BNDES is essential to Brazilrsquos renewable energy energy efficiency and deforestation financing
38
The Landscape of Climate Finance 2012
39
The Landscape of Climate Finance 2012December 2012 December 2012
Climate Funds
In recent years a number of climate-specific funds have been set up46 which could also be categorized as
bull bilateral funds financed by single donor countries with one or more recipient country
bull multilateral funds financed by more than one donor country with more than one recipient country
bull national and regional funds established and managed by one or more recipient countries
46 In multiple cases pre-existing environmental and conservation trust funds are channeling climate related resources Some such funds have even been (or are in the process of being) accredited as National Implementing Enti-ties for the Adaptation Fund (eg ldquoProtected Areas Conservation Trustrdquo for Belize and the Micronesia Conservation Trust for the Federated States of Micronesia)
to channel resources from one or more donor country and or domestic resources
While our estimates show that Climate Funds com-mitted USD 25 billion in total to projects in 2011 we include only 15 billion in the Landscape 2012 after deducting bilateral funds (USD 1 billion) which are already accounted for under countriesrsquo bilateral reporting Our estimate is based on the Heinrich Boumlll Stiftung (HBF) and the Overseas Development Institute (ODI)rsquos Climate Funds Update database reporting by the organizations managing individual Funds as well as the UNDP Multi-Partner Trust Fund Office website We find that existing Climate Funds mostly channel donor money in the form of grants47 Our estimates
47 The Adaptation Fund is an exception in that while it channels grants its main source of finance is the monetization of 2 of CDM credits issued The Amazon Fund also has a particular model for raising finance ndash it is a
SOURCES ESTIMATED VALUE DESTINATIONS
IntE
rnal bull Government Budgets NE
USD 15 BILLION In
stru
mEn
ts an
d usE
s bull Grants USD 1446 millionbull Low-cost debt USD 8 millionbull Project-level equity USD 17 million
Usesbull USD 1142 million mitigation (76)bull USD 352 million adaptation (24)
ExtE
rnal
bull Government Budgets NEbull Commercial financial institutions NEbull Institutional investors NEbull Bilateral and Multilateral Financial Institutions NE Ot
hEr a
ctOr
s bull Channels multilateral regional and national implementing entities
bull End recipients governments NGOs and the private sector
DESCRIPTION
bull Climate funds pool resources from donors and domestic sources to support low-carbon climate-resilient development projects Funds usually have a finite lifetime and a specific sectoral focus eg renewable energy adaptation forestry etc In many cases multilateral financial institutions channel funds to recipients and provide financial environmental and social safeguards However there is a trend towards establishing greater national ownership and control of these funds
PRIMARY DATA
SOURCES
bull Self-reporting by Funds bull Overseas Development Institute (ODI) Heinrich Boumlll Stiftung (HBF) Climate Funds Update websitebull UNDP Multi-Partner Trust Fund Office Gatewaybull Fundsrsquo Annual Reports
ISSUES AND FUTURE
ANALYSIS
bull Challenges in tracking climate finance delivered through climate funds remain in particular there is a risk of double counting with reporting from bilateral and multilateral organizations
bull More tracking efforts are needed to unveil the current contribution and role of existing National Fundsa
Note To avoid double counting we carry forward in our calculations only USD 15 billion of Climate Fund money identified (USD 25 billion) excluding developed to developing country bilateral funds which we assume are accounted for in bilateral reporting and accounted for in the government budgets category It is assumed that multilateral institutions managing funds do not include climate fund money in their climate finance reporting and hence that there is no double counting Furthermore co-funding often provided by multilateral organizations is not considered in the above estimates of climate fund moneya For instance Bangladesh has two Climate Funds the Bangladesh Climate Change Trust Fund (BCCTF) established in 2010 by the local government and funded
with resources from the national budget and the Bangladesh Climate Change Resilience Fund (BCCRF) created at the same time to pull funds from donor countries The BCCTF is resourced entirely from the governmentrsquos own budget with USD 100 million in 2009 2010 and 2011 in the form of an endowment Other developing countries such as the Maldives have also established similar national funds (Khan Hannan et al 2011 Gomez-Echeverri 2010)
40
The Landscape of Climate Finance 2012
41
The Landscape of Climate Finance 2012December 2012 December 2012
do not include co-funding which is often provided at the project level A detailed breakdown of data by Fund is provided in Appendix E The Landscape 2012 esti-mate represents a reduction from the Landscape 2011 estimate (upper bound USD 32 billion) which is a reflection of improvements in data sources in particu-lar better annual project approval volume data not a reflection of a reduction in the contribution of the funds
Multilateral organizations such as the World Bank and other UN agencies typically provide trustee and administrative services to manage multilateral and some national funds lsquooff-balance sheetrsquo as well as act as lsquoImplementing Agenciesrsquo to channel funds to local recipients and monitor implementation Bilateral funds are typically administered by donor development agencies Recipient countries are however increasingly seeking lsquodirect accessrsquo to funds both through National Implementing Entities48 which can access project funds directly instead of through an international implement-ing entity and by setting up nationally governed Climate Funds
performance-based fund securing contributions from donors on the basis of demonstrated reductions in the annual deforestation rate The Climate Investment Funds while financed mainly with grant contributions also re-ceived donorsrsquo money in the form of capital and loans and extend grants concessional loans and guarantees via MFIs (Climateinvestmentfundsorg)
48 For instance the Adaptation Fund has now accredited 12 National 10 Multilateral and one Regional Implementing Entities
The Green Climate FundIn future years the Green Climate Fund may become an important additional climate fund but it is not yet operational In 2010 Parties to the UNFCCC established the Green Climate Fund with the aim of providing ldquoscaled-up predictable and adequate fundingrdquo to support projects programs policies and other climate-related activities in developing countries In 2011 the Conference of Parties approved the governing instrument for the Green Climate Fund and with the Fundrsquos first meeting in August 2012 the Board is now taking the first steps towards operationalizing the Fund It is not yet clear however how much and when finance will actually flow through the Green Climate Fund
ExampleThe Climate Investment Funds consist of two multi-donor trust funds the Clean Technology Fund and the Strategic Climate Fund The latter is made up of three programs the Forest Investment Program the Pilot Program for Climate Resilience and the Scaling Up Renewable Energy in Low Income Countries Program The Climate Investment Funds are the single biggest set of Funds dedicated to climate finance holding USD 72 billion in pledged funding from 14 donor countries So far they have programmed over USD 6 billion for 48 developing countries with over 200 projects already financed (Climateinvestmentsfundsorg EBRDcom)
Operational since 20082009 and administered by the World Bank each Fund has a specific purpose The Clean Technology Fund is aimed at projects with large-scale emissions reduction potential and provides loans at terms which are even more favourable than most development banks The Forest Investment Program supports the strengthening of enabling environments and investments addressing the drivers of deforestation in eight countries The Pilot Program for Climate Resilience pilots and demonstrates ways in which climate risk and resilience can be integrated into core development planning and implementation The Scaling Up Renewable Energy in Low Income Countries Program supports the deployment of renewable energy in the least developed countries According to HBF and ODIrsquos Climate Funds Update the Clean Investment Funds have so far disbursed USD 148 million to recipients
40
The Landscape of Climate Finance 2012
41
The Landscape of Climate Finance 2012December 2012 December 2012
Private sector intermediaries
Commercial financial institutionsIn the Landscape 2011 commercial banks were catego-rized without any estimates of amounts involved In the Landscape 2012 wersquove been able to estimate a portion of this category that relates to renewable energy project finance We find that commercial financial institutions contributed 9-10 of total global climate finance
We estimate that 38-50 of commercial financial institutions contributions come from domestic financial institutions while 50-62 of contributions are from institutions in foreign developed countries (European and Japanese investment banks are notable contribu-tors to other countries) Developing countries received 23-42 of this finance while developed countries received 58-77
SOURCES ESTIMATED VALUE DESTINATIONS
IntE
rnal bull Reinvested earnings from recurrent and exceptional
income NEUSD 307 ndash
404 BILLION
Inst
rum
Ents
bull Risk management NEbull Carbon offset finance USD 22 billionbull Low cost debt USD 01 ndash 11 billionbull Project-level market rate debt USD 274 ndash 357
billionbull Project-level equity USD 03 ndash 04 billionbull Balance sheet financing USD 08-11 billion
ExtE
rnal
bull Changes in net debt and equity from third-party NE
OthE
r act
Ors
bull Lending to all other actors of the landscape on a balance sheet basis NE
DESCRIPTION
Commercial financial institutions or commercial banks include all the sources of private debt capital These include but are not limited to
bull Profit-driven investment banksbull Carbon brokers and fundsbull Banks and insurance companies providing risk management solutions
PRIMARY DATA SOURCES
bull Bloomberg New Energy Finance and UNCTAD FDI databull Ecosystem Marketplace State of the Voluntary Carbon Markets Report
ISSUES AND FUTURE
ANALYSISbull Commercial financial institutionsrsquo contributions to ldquoactoror project sponsor-level debtrdquo are hard to measure and analyze
ExamplesClose to 600 MW of Spanish solar PV and thermal capacity was financed on a project finance basis in 2011 Spanish banks such as Banco Santander BBVA or Banco Espanol de Credito were instrumental in contributing project finance debt to solar project developers Other European (Portugal Germany France Italy and the Netherlands) and Japanese banks played an important role as well
For the Landscape 2012 we find that most of the projects developed are financed on a balance sheet basis ie the project developers raise money for all their activities without specifically earmarking projects Since we are unable to relate this funding to the emissions reduction projects and that information is scarce we do not include this in our estimate for commercial financial institutions
42
The Landscape of Climate Finance 2012
43
The Landscape of Climate Finance 2012December 2012 December 2012
Venture capital private equity and infrastructure fundsThe direct contribution of venture capital private equity and infrastructure funds to emissions reduc-tion projects is in excess of USD 24 billion for the year 2011
We estimate that 55-56 of venture capital private equity and infrastructure fundsrsquo contributions come from domestic sources while 44-45 come from foreign developed countries Developing countries received an estimated 15 of venture capital private equity and infrastructure climate finance while devel-oped countries received 85
SOURCES ESTIMATED VALUE DESTINATIONS
IntE
rnal bull Reinvested earnings from recurrent and exceptional
income NE
USD 24 BILLION
Inst
rum
Ents
bull Project-level equity USD 10 billionbull Balance sheet financing USD 14 billion
ExtE
rnal bull Changes in net debt and equity from third-party
(investors) NE
OthE
r act
Ors
bull Investing into other actors of the landscape on a balance sheet basis (corporate actors and project developers) NE
DESCRIPTION
This category capturesbull Venture capital fundsbull Private equity fundsbull Infrastructure funds
PRIMARY DATA SOURCES bull Bloomberg New Energy Finance and UNCTAD FDI data
ISSUES AND FUTURE
ANALYSIS
bull Private equity fundsrsquo investment into emissions reduction technology manufacturers (wind turbines solar panels etc) which are also involved in the deployment and financing of projects is difficult to estimate
ExamplesGroups such as Barclays Infrastructure Funds Management Ltd and Triodos Bank contributed to European wind and solar projects in 2011 They typically invest in a diversified portfolio of energy and or infrastructure assets or businesses (not necessarily all related to emissions reduction) on behalf of investors into such funds The investors behind these funds are typically institutional investors and wealthy individuals
42
The Landscape of Climate Finance 2012
43
The Landscape of Climate Finance 2012December 2012 December 2012
33 Instruments
Most climate finance ndash USD 276-310 billion out of a total USD 343-385 billion ndash can be classified as investment or more generally instruments that include ownership or claims Key instruments delivering these investments include balance sheet financing (59) project-level market rate debt (16) and low-cost debt (15) Other categories of instruments such as carbon offset flows grants and project-level equity make up the remainder of climate finance
The instruments considered in our analysis correspond to all the economic49 and financial instruments50 used in the deployment of emissions reduction projects Financial support can either be given directly to specific projects andor local implementing entities using a variety of instruments or it can assist national policy efforts Building upon the Landscape 2011 we consider six major categories of instruments (i) policy incen-tives (ii) risk management (iii) carbon offset finance (iv) grants (v) low-cost debt and (vi) capital instru-ments including project-level market rate debt project-level equity and balance sheet financing51 While not necessarily comprehensive these categories aim to capture the major instruments used to deliver climate finance
Policy IncentivesPolicy incentives include income-enhancing mecha-nisms such as feed-in tariffs tradable certificates tax incentives and clean energy subsidies which are most commonly funded domestically Many emerging economies in particular have started to use income-enhancing mechanisms to stimulate clean energy investment As discussed in the methodology section we do not report an estimate for total policy incentives finance given the risk of double counting (both invest-ment money and future revenues from the investment
49 ldquoA means by which decisions or actions of government affect the behav-iour of producers and consumers by causing changes in the prices to be paid for these activitiesrdquo (OECD Glossary of Statistical Terms available here httpstatsoecdorgglossarydetailaspID=6408)
50 ldquoA financial instrument is any contract that gives rise to a financial asset of one entity and a financial liability or equity instrument of another entityrdquo (IFRS IAS 32 Financial Instruments Presentation available here httpwwwifrsorgDocumentsIAS32pdf)
51 There is a large share of debt sitting behind balance sheet financing as project sponsors often obtain corporate loans or issue corporate bonds
to remunerate the investor) However the category of policy incentives is included in the Climate Finance Flows Diagram 2012 as policy incentives play a critical role in attracting climate finance at the investment stage
Risk Management
Official long-term export credits Export credits can be provided by or on behalf of gov-ernments and can take the following three forms (i) official direct support (loans) (ii) private export credit with repayment insurance (iii) private export credit with repayment guarantee (Buchner et al 2011)
In 2009 the share of export credits available to clean energy sectors (renewable energy and co-generationdistrict heating) rose to USD 07 billion (OECD statis-tics on export credits 2010 as cited in Buchner et al 2011) While more recent data is not yet available we might expect the proportion of climate specific export credits to increase given an agreement this year by OECD countries to incentivise export credit support for climate mitigation projects (including flexible repayment structures and longer tenors for advanced technologies and energy efficiency) while maintaining stricter financial terms and conditions for fossil-fuel based projects (OECD 2012)
It is worth noting that export credits of types (ii) and (iii) outlined above are paid to the exporter and there-fore technically represent a developed to developed country flow Furthermore these types of export credits may not be used and may not therefore represent a true flow of climate finance More detailed data is there-fore required to gain a better understanding of the role of export credits in stimulating private low-emission investments in developing countries
GuaranteesGuarantees are used to mitigate the risks involved in clean investments These can include risks related to non-payment technology performance or the fulfill-ment of obligations by government and affiliated agen-cies vis-agrave-vis a given project Based on our review of DFIrsquos flows we estimate annual guarantees in support of climate mitigation and adaptation to be at least USD 18 billion On top of this government budgets contributed a non-estimated amount of climate finance for loan guarantees (for instance through the US Department of Energy loan guarantee program for US solar projects in 2011)
Although money relative to guarantees is typically
44
The Landscape of Climate Finance 2012
45
The Landscape of Climate Finance 2012December 2012 December 2012
accounted for by financial institutions acting as guaran-tors52 we do not report the notional amounts relative to guarantees as tangible flows for in the course of our reporting period Guarantees do not need to be exer-cised there is a chance there will never be any outflow for the guarantor (for more details please refer to the methodology section) However guarantees certainly play a central role in clean investment decision-mak-ing and will be the focus of forthcoming CPI work
Carbon offset financeCarbon offsets aggregate public and private money for emissions reduction commitments or to meet voluntary objectives Payments for carbon offsets go to various offset projects currently most of these projects are related to the Kyoto Protocolrsquos Clean Development Mechanism (CDM) and Joint Implementation (JI) Apart from actors on the smaller but growing volun-tary market main players are compliance entities and
52 And they usually set aside provisions reducing their ability to invest in or lend to climate finance projects
intermediaries in regional and national systems (such as the EU Emissions Trading System - EU ETS - and the JVETS) and countries with Kyoto Protocol com-mitments Offset buyers can acquire offsets directly via carbon offset brokers or via carbon procurement funds This instrument category comprises all offsets markets in which primary carbon offsets can be pur-chased for cash
We estimate that carbon offset flows totalled between USD 465 and USD 475 billion in 2011 Our estimate includes only the incremental cost linked to carbon offsets not the investment costs of correspond-ing emissions reduction projects
This range is based on available data from the World Bank the UNFCCC IGES and Ecosystem Marketplace and is an increase compared to the Landscape 2011 estimate (USD 17 ndash 20 billion) mainly thanks to the increased CER issuance by the UNFCCC (although there were lower prices) and improved data visibility on ERU issuance
INSTRUMENTS ANNUAL FLOWS OF DIRECT CLIMATE FINANCE(2010 2011 USD BILLION)
INSTRUMENTS FOR INCREMENTAL COST
Policy incentives NOT ESTIMATED
Risk management NOT ESTIMATED
Carbon offset finance (1) 47 - 48
Grants (3) 98 - 156
Low-cost debt (15) 527 - 542
Sub-total instruments for incremental costs (19) 672 - 747bull public sources (4) 102 - 166bull private sources (1) 26
bull public intermediaries (14) 522bull private intermediaries (1) 23 - 33
INSTRUMENTS FOR CAPITAL COST
Project-level market rate debt (16) 527 - 621
Project-level equity (6) 200 - 235
Balance sheet financing (59) 2031 - 2248
Sub-total instruments for capital cost (81) 2758 - 3104bull public sources (2) 58 - 61
bull private sources (62) 2145 - 2401bull public intermediaries (7) 246
bull private intermediaries (10) 309 - 396
TOTAL
Total 3430 - 3850bull public sources (5) 160 - 227
bull private sources (63) 2171 -2427bull public intermediaries (21) 767
bull private intermediaries (10) 332 - 429
44
The Landscape of Climate Finance 2012
45
The Landscape of Climate Finance 2012December 2012 December 2012
GrantsGrants are transfers in cash or in kind for which recipi-ents do not incur any legal debt (OECD 2007b) Grants can play an important role in reducing upfront project investment costs and meeting viability gaps for projects that are more expensive than the business as usual Grants can also include support to enhance the enabling environment for investments through for instance knowledge management programs technical assistance and capacity building
In the Landscape 2012 we find that 35 (USD 13 billion) of total identified climate finance flows in 20102011 were delivered in the form of grants This is three times the amount of grants identified in the Landscape 2011 This figure can be considered an underestimate as it lacks data on grant contributions from developing country governmentsrsquo to domestic clean energy
In 2010 37 (USD 7 billion) on average of direct government budget flows were delivered in the form of ODA grants The top providers of grants as reported in the OECDrsquos CRS database were the UK Japan Norway and Germany Combined with grants provided by DFIs and Climate Funds we estimate on average 13 of total ldquopublicrdquo contributions were provided in the form of grants (USD 125 billion) Meanwhile just 02 of private finance was delivered as grants and originated from philanthropic contributions
While there is no comprehensive overview of the global extent of philanthropic contributions to climate-specific projects Vrana and Cracknell (2011) cite a range of studies which have reviewed environmental grant-making by foundations in the UK the US Canada Australia and New Zealand
Vrana and Cracknellrsquos (2011) review of environmental funding by European foundations suggests that climate change relevant grants reached around USD 53 million53 annually over the period 2008 ndash 2009 an estimated 13 of which flowed to end beneficiaries in develop-ing countries and the remainder to Europe and North America We assume a 5050 split between mitigation and adaptation activities for this figure54
Meanwhile the Environmental Grantmakers
53 This figure is expected to be an underestimate as it was based on a limited number of foundations and excluded environmental grants which were not more specifically marked for sector relevance
54 39 of EUR 37 million is reported as energy and transport It is not clear what percentage of activities reported as ldquoclimate and atmosphererdquo are for mitigation versus adaptation
Association (2012) estimates the contribution of US foundations to the ldquoclimate and atmosphererdquo area in 2009 to have been between USD 158 ndash 215 million55 60 of this finance stayed in the US 6 flowed to North America and Europe and 34 was directed to the rest of the world including Asia Africa Central and South America We exclude an additional USD 150 ndash 165 million worth of grants to energy and transport related activities given that there is no way to deter-mine the share of those grants that went to fossil fuel related activities We therefore estimate that a total of approximately USD 211 ndash 268 million in philanthropic contributions went to climate projects in 20082009
ExampleJICA supports a variety of climate projects around the world through grants In Kenya for example JICA supports a program that helps communities adapt to floods and develop infrastructure such as evacuation facilities In Vietnam JICA supports low-carbon development through integrated grant and project loan packages and technical assistance to support physical infrastructure development capacity building and policy development JICA also provides grants that encourage infrastructure projects to engage Japanese firms the Agency provides funding for preparatory studies and helps finance infrastructure that will be later operated by private players Source Inaka (2011)
Low-cost debtLow-cost debt is financing provided at terms prefer-able to those prevailing on the market including for example longer repayment terms lower interest rates and higher levels of participation in investments Low-cost debt includes concessional loans
The biggest low-cost debt providers are Development Finance Institutions and governments Loan conditions vary greatly between individual institutions and proj-ects The terms of loan repayments are important for engaging the private sector but at the same time providers need to avoid over-subsidization and to increase the value obtained for public money It is not however possible to comment on the terms of debt due
55 Lower value includes projects marked as pertaining to the specified focal area as a ldquoprimary issuerdquo while the higher value includes overall giving (primary and secondary issue)
46
The Landscape of Climate Finance 2012
47
The Landscape of Climate Finance 2012December 2012 December 2012
to a lack of aggregated data figures presented here are gross rather than net flows
Up to 146 (USD 535 billion) of total climate finance flows captured in the Landscape 2012 are delivered in the form of low-cost debt These flows are entirely from public sources in particular National Finance Institutions (indeed 866 of their financing or USD 37 billion is delivered through low-cost debt) Bilateral Finance Institutions (which use low-cost debt to deliver 62 or USD 7 billion of their climate financ-ing) and directly from governments (32 or USD 62 billion on average of government climate financing is delivered through low-cost debt) This compares to just USD 126 billion worth of concessional loans identified in the Landscape 2011 reflecting the extended coverage of DFIsrsquo flows and in particular NFIs in the Landscape 2012
The central role of BNDES in the rapid expansion of wind and other renewable energy sources in Brazil in
recent years is highlighted in Box 7 Here low-cost debt has reduced borrowing costs for investors by around 40 and in turn reduced renewable electricity tariffs by around 25
Capital instrumentsThe capital instrument category tracks the trans-formation of capital contributions into shareholder ownership (equity) creditor claims (debt loans bonds etc) and hybrid capital instruments Any source or intermediary may contribute capital Capital contributions are registered in specific mitigation and adaptation investment project balance sheets Capital is returned to contributors in two forms first as dividends and changes in the market value of the shares held for equity holders and second as coupons or interim inter-est payments and return of principal for debt holders
In the Landscape 2012 we split investment capital
Examples ndash Mexicorsquos Renewable Energy Financing Facility (REFF)1
The REFF was established within the Mexican Nacional Financiera (NAFIN) to address the renewable energy financing gap by encouraging private sector investment REFF provides
bull direct loans with long repayment terms (about 10-15 years) and fixed interest rates to project developers to finance the construction of new renewable energy projects and support their financing needs during their life and
bull contingent credit lines to cover transitory cash flow shortages during the project lifecycle (eg due to lower than expected energy generation or prices) up to the volume needed to service senior debt
As shown in the figure below NAFIN channels international funds from the Inter-American Development Bank and the Clean Technology Fund combining them with its own to attract private capital It is expected that the facility will ultimately reach a total value of USD 540 million Providing a maximum of USD 10 million to individual projects it is expected that the facility will contribute to investments with a total capital value of up to USD 1540 million2
1 Source Visconti et al (2012) Smallridge et al (2012) based on IDB (2011)
2 This figure is estimated considering a total 1000 MW of installed generation capacity and investment costs of USD 2-25 million per MW (IDB 2011)
Source Smallridge et al (2012) based on IDB (2011)
46
The Landscape of Climate Finance 2012
47
The Landscape of Climate Finance 2012December 2012 December 2012
sources into three major categories56 project-level market rate debt project-level equity and balance sheet financing
Project-level market rate debt worth USD 527 ndash 621 billion went towards emissions reduction projects in 2011 The debt is being repaid on the revenues gener-ated by the emissions reduction project rather than its sponsor (non-recourse debt) This is mostly project finance debt but by extension we include project bonds lease financing and other financing techniques in this category Unsurprisingly the largest contributors were commercial financial institutions (USD 274 ndash 357 billion) More interestingly a significant portion of project-level market rate debt came from other actors notably vendor financing for technology manufacturers
We find that project-level equity worth USD 200 ndash 235 billion was directed to emissions reduction projects in 2011 This is the equity counterpart of project-level market rate debt
Balance sheet financing (or sponsor-level financing) worth USD 2031 ndash 2248 billion went towards emis-sions reduction projects in the year 2011 This category corresponds to investment capital raised at the sponsor level rather than at the project level The largest con-tributors to this type of instrument are project develop-ers (USD 974 ndash 1097 billion) corporate actors (USD 650 ndash 741 billion) and households (around USD 321 billion) From an analytical standpoint it is impossible to determine the sources of balance sheet financing for several reasons First sponsor-level capital includes various sources of capital reinvested earnings from the sponsorrsquos activities equity from shareholders and debt from lenders (commercial financial institutions for loans and credit lines institutional investors and mutual funds for bond and notes) Second the money raised at the sponsor level is not earmarked Third it is challenging to come up with a simple estimate to break down balance sheet financing into debt and equity components Sponsor financing practices and economic circumstances vary across industries and countries For example in India project developers must overcome difficulties securing corporate debt whereas in Europe utilities can use regular borrowing programs more easily Moreover we cannot merely look at sponsorsrsquo balance sheets for guidance as the mix of capital sources for emissions reduction projects will not
56 In order to make the instrument categories mutually exclusive any amount categorized as lsquocapitalrsquo should be free of any form of support from other instruments (subsidies carbon offsets etc) and should only represent the net lsquocapitalrsquo dedicated to investments
necessarily be the same as the mix of capital sources for all projects
48
The Landscape of Climate Finance 2012
49
The Landscape of Climate Finance 2012December 2012 December 2012
Box 9 ndash Indiarsquos experience in financing renewable energy
India which is already the worldrsquos fifth-largest market for wind power has set ambitious targets for both wind and solar generation These targets of 20 GW for solar (by 2022) and 31 GW for wind (by 2017) will require massive investment for an economy already facing competing needs for investment in energy and infrastructure more generally A plethora of renewable policy abounds at the state level and the federal government offers its own policies ndash such as accelerated depreciation and the renewable energy certificate (REC) market ndash but all of these policies are likely to be undermined by the state of Indian financial markets and their regulation
In particular Nelson and Shrimali et al (2012) found that in the short term the interest rates and terms for debt may raise the cost of renewable energy by 24-32 compared to similar projects financed in the US and Europe The high cost of debt wipes out all or most of the cost advantages India might otherwise have and makes renewable energy much less competitive against conventional alternatives There are also signs that in the longer term debt will become increasingly hard to secure even at high costs which could put targets beyond reach for both cost and financing reasons
The main causes of high interest rates for renewable energy projects lie in the general financial market conditions of the country Growth high inflation competing investment needs and country risks all contribute A shallow bond market regulatory restrictions on foreign capital flows and heavy government borrowing add to the problem while the cost of currency swaps and country risk negate the advantages that could come from access to lower-cost foreign debt
While there is agreement in India that debt markets might be a problem there is less agreement as to the precise nature of this problem or potential solutions Discussions with analysts operating in the country revealed the existence of a gap between risks perceptions and expected returns from renewable energy projects in India To bridge this gap several initiatives have been taken by multilateral banks to establish risk guarantee funds For instance the Asian Development Bank and the Indian Government set up a partial risk guarantee fund in which they cover all risks and pay 50 of the default value at a nominal premium But such measures have struggled so far as project developers are unwilling to pay a high premium for such insurance coverage
In other rapidly developing countries facing high interests and competing investment demands such as Brazil renewable energy investors rely partly on concessionary support from National Development Finance Institutions However in India the deregulation of financial markets that occurred in the early lsquo90s has in fact led many National Finance Institutions to convert themselves into commercial banks that cannot make concessionary loans Further analysis is needed to evaluate what lessons can be learned from experience in places like Brazil or China and how these lessons could be adapted to the Indian context
Prepared by Shobhit Goel (CPI Hyderabad shobhitgoelcpihyderabadorg)
Based on Nelson Shrimali et al (2012) ldquoMeeting Indiarsquos Renewable Energy Targets The Financing Challengerdquo CPI Report (forthcoming)
The high cost of debt is the most pressing problem currently facing renewable energy financing in India
48
The Landscape of Climate Finance 2012
49
The Landscape of Climate Finance 2012December 2012 December 2012
34 Disbursement channelsDisbursement channels are organizations that work directly to disburse funds for climate mitigation and adaptation projects including organizations from the public57 and private sector public-private partnerships (PPPs) local financial institutions and banks multilat-eral organizations non-governmental organizations and civil society They may be local regional national or international organizations
There is no aggregated information available on the split of finance by type of disbursement organization but examples from specific investments or organizations can help to shed light on current patterns and best prac-tice For instance Germanyrsquos KfW collaborates with a range of local financial institutions including micro-banks commercial banks refinancing institutions village savings banks non-governmental organizations and regional and supra-regional micro-finance funds to build up micro and small enterprises
Public climate finance from developed to developing countries is sometimes provided directly to recipient governments or government agencies for distribution to end recipients More often however for efficiency and to ensure environmental social and economic safeguards are applied donors channel money through international organizations (eg UNDP UNEP or Multilateral Finance Institutions) or large reputable and often international non-governmental organiza-tions This has also been the operational mode of many international Climate Funds For instance the Clean Technology Fund the World Bank Group the African Development Bank the Asian Development Bank the European Bank for Reconstruction and Development and the Inter-American Development Bank act as implementing agencies working alongside local execut-ing agencies who actually implement projects The Adaptation Fund is an exception in that a number of National Implementing Entities have been accredited to receive money directly from the Fund (see Section 32 on Climate Funds)
There is often a complex web of relationships involved in implementing a project For instance the Clean Technology Fund awarded low-cost debt to Ouarzazate I a Moroccan Concentrated Solar Power plant However this debt is channeled through the African Development Bank and International Bank for Reconstruction and Development then passed to the Moroccan Agency for Solar Energy (MASEN) which
57 Public organizations including government ministries departments programs and agencies
provides debt financing to a public private partnership Special Purpose Vehicle which will build and operate the plant (see Falconer and Frisari 2012)
Regardless of the geographic nature of climate finance flows and whether they are public or private the types of organizations engaged to disburse and implement climate finance are of crucial importance shaping the capacity available to implement and scale up low emissions and climate resilient activities In particu-lar engagement of local organizations is important to ensure capabilities are transferred or built up locally rather than being isolated in international organizations
35 Uses
Mitigation measures received the bulk of climate finance around USD 350 billion The private sector money captured in the Landscape 2012 accounted on average for USD 268 billion about 73 of the total and was directed towards renewable energy generation projects wind and solar in particular
Governmentsrsquo climate finance was also strongly focused on mitigation measures (87) This reflects low-carbon development ambitions and commitment to supporting structural changes in energy systems seen as engines of economic growth
Public financial institutions also played a pivotal role in the support of clean energy investment allocating more than 60 of their climate flows to renewable energy and energy efficiency measures By packaging
In 20102011 mitigation measures attracted USD 350 billion out of USD 364 billion This is largely the result of significant capital investments in mitigation measures like renewable energy
Data on REDD+ finance are poor but suggests that flows could be around USD 118 billion per year predominantly from domestic government contributions
Adaptation interventions received USD 123 to USD 158 billion primarily in the form of incremental cost payments While there has been some progress in tracking adaptation finance since the Landscape 2011 weaknesses in defining and tracking adaptation finance partial reporting by some multilateral players and the inability of existing efforts to capture private flows dedicated to such activities continued to hamper our understanding of adaptation finance flows
50
The Landscape of Climate Finance 2012
51
The Landscape of Climate Finance 2012December 2012 December 2012
financing instruments tailored to address market fail-ures they can close the viability gap of clean technolo-gies to help them mature and become self-sustaining They can also provide access to long-term financing for these projects otherwise not readily available in local capital markets
MitigationWhat does the private sector finance
We find that the private sector (both private sources and intermediaries) contributed USD 2503 ndash 2855 billion towards the total of global climate finance in 20102011 (74 of the total) All that money went to climate change mitigation This reflects both the difficulties in estimating private sector adaptation finance (even though households and corporate actors do engage in autonomous adaptation activities) and the constraints of the global datasets to which we had access (Bloomberg New Energy Finance and UNCTAD Foreign Direct Investment data for renewable energy asset finance and REN21 and Frankfurt School of
Finance amp Bloomberg New Energy Finance for small-scale renewable energy)58
The total amount breaks down into
bull USD 833 billion for small-scale investment USD 737 billion for solar PV and USD 94 billion for solar water heaters and coolers
bull USD 1623 ndash 1975 billion for larger renewable energy asset finance corresponding to an extra capacity of 67 GW (more than 67 for wind and more than 20 for solar technologies) and
bull The remainder to carbon offset finance
The largest private contributors to mitigation invest-ment were project developers (USD 1160 ndash 1303 billion) corporate actors (USD 693 ndash 805 billion) and commercial financial institutions (USD 307 ndash 404 billion) Private sector investment relied on contributions from public sources and intermediaries
58 Please note that given the data constraints data on energy efficiency is lacking Ryan et al (2012) estimate that about USD 23 billion in DFIsrsquo financing leveraged about USD 46-184 billion in energy efficiency invest-ments in developing countries in 2011 depending on the leverage ratio (2 or 8)
Table 1 Climate finance breakdown of sources into mitigation and adaptation fundsa
SOURCES amp INTERMEDIARIES MITIGATION(USD BILLION)
ADAPTATION(USD BILLION)
TOTAL (USD BILLION)
PROJECT DEVELOPERS 1150 ndash 1293 NE 1150 ndash 1293
CORPORATE ACTORS 693 ndash 805 NE 693 ndash 805
HOUSEHOLDS 323 NE 323
INSTITUTIONAL INVESTORS 06 NE 06
COMMERCIAL FINANCIAL INSTITUTIONS 307 ndash 404 NE 307 ndash 404
VENTURE CAPITAL PRIVATE EQUITY AND INFRASTRUCTURE FUNDS 24 NE 24
GOVERNMENTS BUDGETS 149 ndash 182 10 ndash 44 159 - 226
NATIONAL FINANCE INSTITUTIONS 375 52 427
MULTILATERAL FINANCE INSTITUTIONS 183 29 212
BILATERAL FINANCE INSTITUTIONS 86 27 113
CLIMATE FUNDS 11 04 15
TOTAL 3307 ndash 3693 123 ndash 157 3430 ndash 3850
Note Figures represent annual flows for the latest available year (20102011) variable according to the data sources (2010 for OECD DAC members and EU Institu-tions 2011 for all the other organizations) Most data presented relate to commitments in the given year disbursement data are included for one DFI only The figures do not add up to the total exactly because of roundinga Philanthropy which is not included in the table due to the materiality of the flow accounts for about USD 211-268 million which due to lack of information we
assume is split equally between mitigation and adaptation (around USD 120 million to each)
50
The Landscape of Climate Finance 2012
51
The Landscape of Climate Finance 2012December 2012 December 2012
instruments addressing incremental costs but also access to debt financing both at the project level and at the sponsor level
What does the public sector finance
Governments and public financial intermediaries invested USD 804-837 billion in mitigation mea-sures in 20102011 Development Finance Institutions contributed USD 644 billion or 784 of the total Renewable energy and energy efficiency received 54 and 18 of total public mitigation financing respectively The sustainable transport sector received a significant amount of climate funds 10 of the total mainly from National Finance Institutions and Multilateral Finance Institutions
In particular NFIsrsquo climate finance activities highlight the domestic emphasis which is driven by the low-carbon development strategies of the countries they operate in or to which they are linked to About USD 289 billion (or 677 of the NFIsrsquo total climate financ-ing) was committed to renewable energy and energy efficiency measures implemented mainly domesti-cally We estimate that more than 80 of NFIsrsquo finance was spent in China and Brazil reflecting the relevant weights of CBD and BNDES in this category59 The transport sector of importance for socio-economic development represented 10 of NFIsrsquo mitigation finance The activities supported include rail and ship transportation waterways Bus Rapid Transit systems and vehicles substitution Acknowledging that these activities may ultimately result in emission reductions it is difficult to understand and compare them against
59 As described in Box 7 BNDES placed a particular emphasis on wind and hydropower projects in 2011 CDB too demonstrated its commitment in the support of wind farms and large-scale hydroelectric projects proac-tively implementing the governmentrsquos Green Credit Policies At year-end 2011 its outstanding loan portfolio in energy conservation emissions reduction as well as environmental protection sectors at USD 1018 billion (RMB 6583 billion) up by 33 year-on-year demonstrates its commit-ment The increase observed in the Banksrsquo support to the power sector in 2011 reflects the countryrsquos need to overcome chronic power shortages and optimize the supply mix Worth noting that nuclear and integrated or pithead coal-based plants were also the recipients of the Banksrsquo financing (CDB 2012) CDB does not invest domestically only it is also invests abroad playing an important role in the financing of overseas activities of state-owned enterprises with the aim of creating national champions and acquire advanced technologies (eg Brookingsedu) The Bank also con-tinued to provide financing to the China National Petroleum Corporation Group and SINOPEC Group to support their overseas oil field exploration efforts As of the end of 2011 CDBsrsquo outstanding loan balance in this sector stood at USD 598 billion (RMB 3865 billion) (CDB 2012)
a business-as-usual scenario and to understand if and what they should be qualified as climate finance60
MFIsrsquo mitigation financing was also strongly oriented towards renewable sources of energy and energy con-servation measures which received more than 614 of their total commitments (about USD 13 billion) This can partly be explained by the sectoral specializa-tion of some players such as the EBRD which devoted 938 of its 2011 mitigation finance to these sectors61 MFIsrsquo resources also financed measures aimed at strengthening regulatory and institutional frameworks supportive for clean-technologies62 They also worked with local financial institutions to embed capacity and create specific skills in the preparation risk evaluation and monitoring of these types of projects as well as in the identification of investment opportunities63
The development of the financial sectorrsquos capabilities was also one of the areas targeted by bilateral players such as KfW which dedicated 56 of its 2011 climate finance to capacity building measures in the mitigation area Overall in 2011 the largest shares of BFIs climate spending was directed to the energy (292 to renew-able 13 to energy efficiency) and waste management sectors (9) Transport and agriculture forestry and land use accounted for 122
The forestry sector is an area of emerging interest for some BFIs KfW for instance has a lsquoforest and climate protection programrsquo with Indonesia the largest single-sum beneficiary to date of Germanyrsquos Fast-Start financing (Vieweg et al 2012) The promotion of REDD initiatives is also an important objective for JICA and AfD (AfD 2012 JICA 2012b)
The largest share of bilateral ODA commitments marked as climate mitigation (38) which represented about 60-80 of 2010 DAC membersrsquo reporting was
60 The World Bank identifies the activities with mitigation co-benefits in the sector eg modal shifts traffic management etc (see Worldbankorg) Not all DFIs however have sophisticated systems and frameworks for accounting mitigation finance in place and this is particularly true with regard to the majority of NFIs whose approaches are still in their infancy (See Smallridge et al 2012)
61 Projects supported can range from energy efficiency interventions in the industrial and residential sector support to biomass technologies and the financing of standalone renewable energy projects such as wind and hydropower (EBRDcom 2012)
62 In 2011 capacity buildingtechnical assistance measures related to mitiga-tion received 05 billion of MFIsrsquo commitments
63 See eg the EBRD Sustainable Energy Financing Facilities which comprises a comprehensive technical assistance program intended to provide imple-mentation support to partner banks sub-borrowers and project sponsors (EBRDcom)
52
The Landscape of Climate Finance 2012
53
The Landscape of Climate Finance 2012December 2012 December 2012
committed to projects in the agriculture forestry and land use sector Capacity buildingenabling environ-ment measures received another significant 30 while renewable energy generation from hydro geothermal solar and wind sources captured 15 (OECD 2012)64 African and Asian countries accounted for almost 40 of overall bilateral spending (OECD 2012) This underscores the importance of addressing critical development issues jointly with mitigation measures to achieve growth in a sustainable manner
The volume of public money we found ldquositting behindrdquo project developersrsquo actions (about 11 billion see Box 5) largely originating from and delivered to developed countries (64-72 of the total) ndash mainly in Germany and the US ndash was directed to support and accelerate local deployment of renewable energy measures This reflects the large injection of funds as a result of the ldquogreenrdquo stimulus plans and the effect of policies incen-tivizing uptake Box 3 on the US Federal Tax Incentive Program provides insights on these aspects
REDD+The scope of activities considered ldquoREDD+rdquo65 is notori-ously difficult to delineate While REDD implies efforts to reduce deforestation and forest degradation the lsquoplusrsquo refers to the restoration and rehabilitation of forests and to addressing the drivers of the problem A broad range of activities is needed to tackle the drivers of deforestation and support transitions to more sus-tainable economic development pathways
REDD+ finance can support the creation of enabling environments (eg capacity and institution building and policy and regulatory reform) and mitigation projects (eg creating protected areas or rehabilitating ecosys-tems) Transitioning from a project-by-project approach toward landscape and industry scale approaches would improve prospects of achieving reductions at scale
64 Bilateral fundsrsquo focus are also starting to move towards Nationally Ap-propriate Mitigation Actions (NAMAs) as demonstrated from for instance the early initiative of a group of Nordic countries financing such programs in Vietnam and Peru In Peru USD 3 million (EUR 22 million) will be invested in the waste management sector with bilateral funds from Nordic countries (Denmark Finland Iceland Norway Sweden via the so-called Nordic Partnership Initiative) and domestic money from Peru itself but also from the Nordic Environmental Development Fund In Vietnam the USD 21 million (EUR 15 million) NAMA will focus on the cement manufac-turing sector with financing from Nordic countries and Vietnam itself For additional information see NEFCO website (NEFCOorg)
65 Reducing Emissions from Deforestation and forest Degradation the sus-tainable management and conservation of forests and the enhancement of carbon stocks
by shifting production practices commodity supply chains and land use patterns across jurisdictions and geographies For instance programs aimed at reform-ing policies and creating incentives to intensify agricul-tural productivity thereby reducing pressure to convert forests to achieve increased yields and programs to create alternative livelihoods should be considered part of an effective REDD+ strategy A wide range of actors and sources of finance will be required to realize this broad scale transition including national and interna-tional public and private finance
The potentially broad scope of REDD+ activities adds to the challenges of tracking global financing flows data on which are particularly poor (Buchner et al 2011 Simula 2010 Streck and Parker 2012 ISU 2012 PWC 2011) Fragments of information available on current REDD+ flows suggest they are lagging far behind needs projected by the 2008 Eliasch Review to be around USD 17-33 billion per year by 2030 for a 50 reduction in deforestation
Current flows of REDD+ finance come largely from national and international governments with smaller but growing contributions from non-governmental organi-zations philanthropic and private sector sources The majority of international REDD+ financing to date has focused on lsquoREDD+ readinessrsquo66 building capacity and institutions and some demonstration projects while REDD+ activities at scale and lsquopayment for perfor-mancersquo activities have yet to gather pace
Selected estimates of annual REDD+ finance flows are presented in Appendix F to give a sense of the possible scale of current commitments Estimates include bilat-eral and multilateral flows and dedicated funds as well as forest carbon market flows The data suggest that current REDD+ flows could be approximately USD 13 billion per year67 The figures highlight the dominance
66 ldquoREDD readinessrdquo generally means that all the preconditions ndash in terms of institutional policy and regulatory frameworks ndash necessary to enable countries implement REDD measures are in place Under the UNFCCC Cancun Agreements countries are requested to develop a national strategy or action plan a national forest reference level a robust and transparent national forest monitoring system and a system for providing information on how the safeguards are being addressed and respected (UNFCCC 2010 - Cancun Agreements Art 71)
67 Where possible the value of commitments to approved projects is counted rather than the full value of pledges to funds Higher estimates of international public finance tend to include pledges The International Sustainability Unit (ISU) estimates that total REDD+ financing pledges for the period 2010-2012 based on reporting by donors through the VRD of USD 4 billion Streck and Parker (2012) estimate that international public finance currently accounts for around USD 3 billion per annum including multiannual pledges and funds
52
The Landscape of Climate Finance 2012
53
The Landscape of Climate Finance 2012December 2012 December 2012
Box 10 - Sectoral breakdown of public mitigation financeFigure 3 presents the sectoral breakdown of countriesrsquo bilateral aid including Fast-Start finance1 and DFIsrsquo support targeting climate change mitigation activities It also includes the estimated portion of public funds tracked from project finance reporting in the BNEF database which was entirely directed towards renewable energy projects2
The allocation of the various activities listed in the OECD CRS database (OECD 2012) against the presented sectors was based on the best available information (ie project purpose and description)3 The weights obtained for each sector were then applied to allocate the identified portion of Fast-Start finance devoted to mitigation
We acknowledge the presence of financial flows directed to projects not in line with our definition of climate finance such as money invested in research and development gas-fired power plants or projects with apparently no link to abatement interventions but rather linked to activities like human rights (eg ldquoCSO campaign against poverty hunger exclusion and violation of human rights in South Asiardquo) or peace-building conflict prevention and resolution (both marked as ldquosignificantrdquo in the OECD CRS dataset) Support to such activities was allocated to the category ldquoothersrdquo which also include multi-sector or unspecified aid MichaelowaMichaelowa (2011) also highlights issues related to donors incorrect coding and reporting to OECD DAC (see OCED 2010 for comments on MichaelowaMichaelowa 2011)
With regard to DFIs the breakdown of mitigation finance reflects institutions self-reporting against the sectoral categories provided in the financial survey In those cases where respondents provided different sectoral breakdown the projectcategory description was considered for allocating data against the chosen categories
To estimate the sectoral allocation of DFIsrsquo climate finance sourced from secondary data we used ndash depending on the institutiongroup of institutions considered ndash the following Ecofys-IDFC (2012) UNEP-SEI (2011) Annual Reports and BNEF (2012)
1 To allocate to the mitigation theme the USD 18 billion identified in Fast-Start Finance reporting for 2010 we applied the average share observed in the distribution of money between mitigation and adaptation projects during the 2010-2011 period as per Gibbs (2012) (714 including REDD vs 225) To this we added a share of the money directed to projects with multiple objectives computed according to the weight of mitigation versus adaptation projects on the total
2 The sectoral breakdown does not include Climate Funds money due to data availability issues3 Climate finance commitments retrieved from the OECD CRS data set and allocated to the energy efficiency sector refer to a portion of those
flows directed to measures aimed at improving the ldquopower quality and reliabilityrdquo of electrical transmissiondistribution networks A specific example is for instance a project titled ldquoPacific Power Utilities improved energy efficiencyrdquo We acknowledge that more detailed analysis is needed to understand what is behind each specific project ldquolabelrdquo
Figure 3 Sectoral breakdown of governmentsrsquo and DFIsrsquo mitigation finance (USD 804-837 billion)
0
10
20
30
40
50
60 RENEWABLE ENERGY GENERATION
ENERGY EFFICIENCY
SUSTAINABLE TRANSPORT
AGRICULTURE FORESTRY amp LAND USEOTHERS
WASTE amp WASTE WATER
CAPACITY-BUILDING
FUEL SWITCH
Note The total include Climate Fundsrsquo mitigation financing which is however excluded from the sectoral allocation due to data availability The category ldquoothersrdquo can include unspecifid or multi-sector aid or unallocated portions of DFIsrsquo financing
54
The Landscape of Climate Finance 2012
55
The Landscape of Climate Finance 2012December 2012 December 2012
of bilateral finance and support claims that bilateral finance for REDD+ has so far been faster to disburse than multilateral finance (ISU 2012)
This estimate however largely based on data for inter-national public flows does not account for domestic REDD+ finance which some experts estimate could be several times greater than international donor flows It is particularly difficult to determine the volume of domestic flows and few reliable estimates are available Streck and Parker (2012) estimate that approximately USD 25 billion per year is spent in Brazil Mexico and Indonesia alone and a further USD 7 billion annually is spent in China on afforestation activities Meanwhile Brazil Cameroon the Democratic Republic of Congo Gabon Indonesia Laos Mexico and Papua New Guinea report REDD+ self-finance amounts to USD 24 billion in the Voluntary REDD+ Database68 database (ISU 2012)
Private sector motivations to invest in REDD+ activities include carbon market compliance pre-compliance positioning and corporate social responsibility includ-ing voluntary carbon market participation While the volume of forest credits traded on voluntary markets dropped by almost half between 2010 and 2011 the average price of credits almost doubled meaning that the market held its overall value On the other hand sales of CDMJI forestry credits rose considerably between 2010 and 2011 (as the end of the Kyoto compli-ance period drew near) but average prices fell slightly (Peters-Stanley 2012) Some new emerging compliance carbon markets notably in Australia as well as nascent bilateral markets may provide new sources of demand going forward Aside from carbon markets Streck and Parker (2012) estimate that the private sector is cur-rently generating more than USD 1 billion each year through premiums associated with certified forest products at least part of which goes towards conserva-tion programs
Taken together available estimates of domestic international and private flows imply total REDD+ flows of around USD 118 billion per year This figure is not presented in the Climate Finance Flows Diagram 2012 at present given the figurersquos high level of uncer-tainty and poor underlying data sources It would appear however that domestic governments are the most significant contributors to REDD+ finance Engaging the private sector to drive sustainable produc-tion practices will be crucial to meaningfully tackle the drivers of deforestation supported by clear government
68 Source httpreddplusdatabaseorg
incentives and policies and support from the interna-tional community
Adaptation
Little agreement exists on what qualifies as adapta-tion finance or more narrowly what qualifies as an adaptation intervention Adaptation in fact encom-passes various types of activities which may span the entire vulnerability reduction-response to impacts continuum and which can be applied to a wide range of sectors (agriculture water energy etc) As a result most institutions are not yet equipped with a proper methodology for measuring adaptation finance although relevant efforts to establish tracking and reporting approaches are currently underway (eg the MDBsrsquo initiative on joint adaptation finance tracking)
Hence weaknesses in defining measuring tracking and reporting adaptation finance partial data from some multilateral players and the inability of existing efforts to capture private resources dedicated to such activi-ties hampered our understanding of adaptation finance flows
Given the definitional and methodological complexity surrounding the topic there are few estimates available so far as few have actually tried to truly identify and assess adaptation financing
In the Landscape 2012 we aim to highlight the progress achieved so far on this matter as well as underscore the remaining gaps
Our estimate of about USD 123ndash157 billion of adapta-tion finance comprises donorsrsquo bilateral aid (USD 1-44 billion) (OECD 2012)69 including USD 428 million of
69 Data are adjusted to exclude Bilateral Finance Institutionsrsquo contributions to this field
In 20102011 USD 123 ndash 158 billion was directed towards activities with adaptation objectives Accounting for 775 of the total public financial institutions were the predominant sources These institutions are also the holders of long-standing expertise in the field given their past experience in the areas of development assistance with relevance to adaptation
The biggest knowledge gap in adaptation financing is the role of the private sector which is not estimated in this study
54
The Landscape of Climate Finance 2012
55
The Landscape of Climate Finance 2012December 2012 December 2012
Fast-Start finance70 Climate Funds (USD 04 bn) and
70 The portion of the identified USD 18 billion in Fast-Start Finance reporting for 2010 directed to adaptation (USD 441 million) was estimated by ap-plying the average share observed on the thematic allocation of Fast-Start money over the 2010-2012 period as per Gibbs (2012) (714 to mitiga-tion including REDD vs 225 to adaptation) To this we added a share of the money directed to projects with multiple objectives computed according to the weights of mitigation versus adaptation projects on the total
DFIsrsquo support targeting climate change adaptation activities (USD 109 billion) and philanthropic contribu-tion from Foundations71 (USD 1055-134 million)
With regard to bilateral assistance in November 2011 the OECD-DAC published the first-ever complete
71 We allocated 50 of the identified USD 211ndash268 million of philanthropic contributions to climate-specific projects to adaptation measures See paragraph on ldquoGrants instrumentsrdquo
Box 11 - Sectoral breakdown of public adaptation financeBased on the information gathered we attempted to categorize adaptation finance by recipient sectors despite an international agreement on this has not been reached as yet We found that the agriculture and forestry and the water preservation supply and sanitation sectors were the main recipients of climate-resilient finance in 20102011 receiving 27 (USD 44 billion) and 23 (USD 38 billion) of the total respectively (see Figure 4)
Among individual contributors Bilateral Financial Institutions allocated 513 of their adaptation finance to the water sector Disaster risk reduction initiatives also represented an area in which Bilateral Finance Institutions were particularly active receiving 156 of their adaptation finance National players appeared critical in supporting the strengthening of the resilience of local infrastructure assets as well as the agriculture and forestry sector which were the recipients of 313 and 309 respectively of their adaptation finance
Among DFIs multilateral organizations on the other hand were the major providers of financial support towards capacity building and technical assistance initiatives in this area which accounted for 127 of their total adaptation finance Activities included awareness raising programs training to address vulnerabilities early warning systems and strengthening of institutions policies and regulations
Dedicated Climate Funds also played a role in adaptation financing albeit limited compared to the total accounting for about 25 They are however proving critical in financing pilot and demonstration projects and in promoting the integration of climate risk and resilience into development policies and planning This is particularly the case of the Pilot Countries for Climate Resilience (PPCR) a program operating within the Climate Investment Funds framework which by channelling 45 of the total Climate Fundsrsquo finance (or USD 1548 million) stands out as the major contributor in this area
Figure 4 Sectoral breakdown of governmentsrsquo and DFIsrsquo adaptation finance
0
5
10
15
20
25
30
AGRICULTURE AND FORESTRY
WATER PRESERVATION SUPPLY AND SANITATION
OTHERSINFRASTRUCTURE
(CAPACITY-BUILDING TECHNICAL ASSISTANCE)
DISASTER RISKREDUCTION
Note Climate Fundsrsquo adaptation financing (USD 352 million) and the estimated portion of philanthropic contributions targeting adaptation (USD 120 million) are excluded from the sectoral breakdown due to data availability issues The category ldquoothersrdquo can include for instance unspeci-fied or multi-sector aid or unallocated portions of DFIsrsquo financing
56
The Landscape of Climate Finance 2012
57
The Landscape of Climate Finance 2012December 2012 December 2012
Creditor Reporting System dataset on aid for climate change adaptation whose ldquomarkerrdquo was approved by member countries in 2009 (OECD 2011)72 While donors inappropriate coding73 affects the true magni-tude of the identified flows (Junghans and Harmeling 2012) this has brought to light their contributions to the field advancing understanding on how much money is going to advance the adaptation agenda
Elaborating on the OECD-DAC methodology which is ldquoobjective basedrdquo74 the World Bank has developed an ldquoactivity-basedrdquo system that tracks spending on activi-ties with adaptation co-benefits at the sub-component level75 ldquoonly if they explicitly include climate adaptation reasoning and directly address vulnerability or impact from climate variability and changerdquo (IEG 2012) This system was introduced in 201276
This initiative feeds into the group of MDBs currently working on a joint approach for adaptation finance tracking (AfDBorg IDB et al 2012) The outcomes of this effort which will be released at COP 18 are hence not fully reflected in our figures
Four MDBs in fact opted to report on mitigation only while in the process of finalizing the above mentioned methodology others estimated adaptation financ-ing following the DAC Rio Marker as selection criteria for adaptation activities (eg EBRD KfW and JICA) The World Bankrsquos figures reflect instead the newly piloted methodology More information is needed on the approaches followed by NFIs for reporting to understand what is actually counted against this theme Those surveyed by us or under the Ecofys-IDFC (2012) initiative were requested to report according to the OECD definition
72 This marker captures those activities that aim ldquoto reduce the vulner-ability of human or natural systems to the impacts of climate change and climate-related risks by maintaining or increasing adaptive capacity and resiliencerdquo For additional information see OECD website (OECDorg)
73 Junghans and Harmeling (2012) reveal that about 65 of the activities in the adaptation dataset are unrelated to it or do not identify adaptation as a ldquosignificantrdquo or ldquoprincipalrdquo target while about half of the remaining 35 are over-coded eg reporting adaptation as a primary objective when it should have rather been reported as secondary
74 In the OECD CRS database a project is marked as having adaptation as a ldquoprincipal objectiverdquo if ldquothe activity would not have been funded but for that objectiverdquo or as having a ldquosignificant objectiverdquo if the intervention was ldquoformulated or adjusted to help meet climate concernsrdquo (OECD 2011 IEG 2012)
75 The typology of activities with climate co-benefits by World Bank sector can be consulted at the Worldbankorg website
76 For more information see also World Bank website at httpclimatechangeworldbankorgcontenttracking-finance
The biggest knowledge gap in adaptation financing is the role of the private sector Businesses house-holds and other private groups have a vested interest in engaging in climate initiatives particularly when climate change may directly affect their main sources of revenue The private sectorrsquos financial support can take the form of investments aimed at climate-proofing businesses and assets77 corporate social responsibility initiatives as well as philanthropic contribution
Geographical distribution of climate financeThe Landscape 2012 strives to unveil additional informa-tion on domestic climate finance flows This is reflected in the private flows categorization and the expanded coverage of Development Finance Institutionsrsquo climate expenditures
We find that USD 193 billion of global climate finance or 53 goes to projects in developed countries Some notable sources include the following
bull USD 62 billion comes from corporate actors (including a significant portion of small-scale renewable investment)
bull USD 58 billion comes from project developers
bull USD 24 billion comes from commercial financial banks (reflecting higher recourse to project-level debt financing) and
bull USD 24 billion comes from German and Italian households (investing in solar PV)
In developed countries the largest contributors are private actors (89)
We also find that USD 171 billion of global climate finance goes to projects in developing countries Some notable sources include the following
bull USD 70 billion comes from Development Finance Institutions
bull USD 65 billion comes from (mostly domestic) project developers
77 The UNFCCC maintains a database of private sector action on adaptation (PSI) Activities may encompass those aimed to ensuring the resilience of business operations or the supply of technologiesservices in support of vulnerable communities The PSI is a voluntary initiative intended to raise awareness about climate change adaptation in the private sector It also responds to the mandate given to the secretariat by the Parties of the Convention to engage stakeholders in enhancing the response to climate change Financial aspects related to the various cases presented is not readily available or whether specified not verified by the UNFCCC secretariat For additional information see UNFCCCint
56
The Landscape of Climate Finance 2012
57
The Landscape of Climate Finance 2012December 2012 December 2012
Box 12 - How is Germany financing its energy transition Financing the Energiewende
The private sector is proving pivotal in financing the German energy transition In 2010 the private sector financed contributed more than 95 of total climate finance invested in the country providing USD 478 billion
Germany plays a central role in European decarbonization The government has set ambitious climate and energy targets to reduce emissions 80-95 below 1990 levels by 2050 (Energy Concept 2010) while phasing-out nuclear energy by 2022 (2011 Energy Transition Energiewende)
In 2010 at least USD 491 billion (15 of GDP) was invested to support the German transition to a low-carbon economy (CPI 2012)
The private sector provided more than 95 of climate finance in Germany almost half of which was supported by concessionary loans from development banks Thus the public sector played an important role in supporting private investment The bulk of private money came from corporate investors (USD 292 billion) led by corporations in the energy sector Private households invested a significant USD 186 billion
Besides the concessionary loans the high share of private investment coincided with other incentives such as the Feed-in Tariff In 2010 the Feed-in tariff paid to households and corporate renewable energy generators amounted to approximately USD 174 billion equivalent to 49 of the actual total capital investment in renewable energy in that the same year This underlines the importance of the FiT in influencing renewable energy investorsrsquo decisions
The federal-level development banks KfW and Rentenbank provided at least USD 219 billion of concessional loans for climate-specific investments which represented a 43 share of total capital investment in renewable energy and 72 of total incremental investment in energy efficiency1 The significant role of concessionary loans highlights the importance of public finance instruments beyond just direct subsidies and grants
Renewable energy generation capital investments in buildings energy utilities agriculture and industry amounted to USD 353 billion Corporations across sectors invested USD 216 billion while private households invested a significant USD 131 billion in the building sector renewable energy capacity Energy efficiency amounted to USD 96 billion of incremental investment the householdsrsquo share of which was USD 54 billion (57) Investments in efficient buildings accounted for the largest share of energy efficiency investment with USD 77 billion
Is Germany on track Whether or not climate-specific finance in Germany was sufficient in 2010 to meet Germanyrsquos climate and energy targets is difficult to answer No comprehensive estimate is available for the total investment required for reaching these targets However CPI Report (2012) assessment of the distribution of climate finance across different uses provides a basis for focusing subsequent in-depth analysis on this regard
Prepared by Rodney Boyd (CPI Berlin rodneyboydcpiberlinorg)
Based on ldquoThe Landscape of Climate Finance in Germanyrdquo CPI (2012)
1 Please note the referenced study reports figures for total capital investments for renewable energy and incremental investments for energy efficiency
58
The Landscape of Climate Finance 2012
59
The Landscape of Climate Finance 2012December 2012 December 2012
Box 13 - Geographical distribution of public climate financeThe Figure 4 presents the geographical distribution of countriesrsquo bilateral aid including Fast-Start financing and DFIsrsquo money This graph highlights that with approximately USD 389 billion ndash 47 of total public finance ndash emerging giants like China and Brazil were the largest recipients of climate finance flows Notably this reflects the weight of the China Development Bank and Brazilrsquos BNDES in delivering domestic money in pursuit of development mandates In fact 333 of Development Finance Institutionsrsquo finance goes to China while 179 goes to Brazil
The governmentsrsquo budgets breakdown does not include the estimated portion of public funds tracked from project finance reporting from the BNEF database about USD 11 billion as the detailed split per country could not be retrieved We can however infer that 64-72 of that pertains to developed countries ndash mainly the US and Germany
ndash while the remaining 28-36 to developing countries mainly in Asia The allocation of bilateral aid per recipient countries was retrieved from the OECD CRS data set (OECD 2012)
With regard to DFIs the breakdown of their climate finance by beneficiary country reflects institutionsrsquo self-reporting against the geographic categories provided in the financial survey When respondents provided different sectoral breakdowns data were allocated against the selected macro-areas categories1
To estimate the breakdown by recipients countries for those DFIsrsquo we did not have detailed data for we used ndash depending on the institutiongroup of institutions considered ndash the information presented in the following Ecofys-IDFC (2012) UNEP-SEI (2011) and entitiesrsquo annual reports In some cases we applied the average share observed in other DFIs In particular we assumed that the China Development Bank ndash which accounts for the largest single share of NFIsrsquo climate finance ndash invested domestically (see also Ecofys-IDFC 2012)
1 For instance one respondent provided finance allocated for macro-regions such as ldquoEast Asia amp Pacificrdquo and ldquoSouth Asia Regionrdquo according to their tracking procedures In this case all money was allocated to our ldquoOther Asiardquo category
Figure 4 Geographical distribution of government budgets and Development Finance Institutionsrsquo climate financing
CHINA
BRAZIL
OTHER ASIAOTHER LAC
EUROPEOTHER AFRICA
INDIA
OTHERS
MENA
C AMERICA
S AFRICA
OCEANIA
N AMERICA
0
10
20
30
Note Government budgets data refers to OECD DAC money only (OECD 2012) Data do not include the estimated portion of public funds tracked from project finance reporting in the BNEF database for about UDS 11 billion The category ldquoothersrdquo refers to bilateral contributions whose recipients were not specifid or money distributed to transnationaltransregional projects
bull USD 13 billion comes from corporate actors
bull USD 12 billion comes from commercial financial banks
Compared to developed countries climate projects in developing countries rely more on balance sheet financing and instruments from development banks
The share of private sector contributions to climate finance in developing countries is around 57
58
The Landscape of Climate Finance 2012
59
The Landscape of Climate Finance 2012December 2012 December 2012
Box 14 - Financing Renewable Energy Generation and Energy Efficiency in China
Chinarsquos ambition to shift to a greener economy is reflected in the significant investments made in the renewable energy and energy efficiency sectors over the past few years
In terms of gross investment in renewable energy China has led the world for the past three years as gross investment in renewable energy increased 51 from USD 337 billion in 2009 to USD 51 billion in 2011 In 2011 877 of the total investment was devoted to wind power and solar PV which reached 624 GW (about 25 of worldrsquos capacity) and 31 GW (44 of the global market1) accumulated installed capacity respectively
With USD 396 billion or 886 of the total asset financing was the primary method of supporting wind and solar PV projects This is typically arranged with an 8020 debt to equity ratio in the case of wind where developers are requested by law to take at minimum a 20 equity stake and borrow the remaining from state-owned or policy-related banks The ratio is different for distributive PV projects where developers take equity stakes for 30 borrow 20 from banks and get the remaining 50 in the form of grants under the ldquoGolden Sun demonstrationrdquo and the Building-integrated PV (BIPV) subsidy programs introduced in 20092
State-owned enterprises (SOEs)3 are the major developers in both the wind and solar PV markets accounting for 799 and 61 of total installed capacities respectively SOEs have privileged access to credit from financial institutions thanks to their long-established relationship with state-owned banks
1 The National Development and Reform Commission has revised the 12th Five Year Plan solar PV target from 15 GW to 21 GW by the end of 2015 in order to boost the domestic solar PV market and to absorb the excess supply due to US anti-dumping and anti-subsidy tariffs On Oct24 2012 the Information Office of the State Council published the 2012 edition of white paper on Chinarsquos Energy Policy which claimed that Chinarsquos installed generating capacity of solar energy was expected to exceed 21GW by 2015
2 The BIPV subsidy program provides upfront subsidies for grid-connected rooftop and BIPV systems 3 SOEs include national provincial and municipal level state-owned enterprises and their subsidiariesspinoffs
bull State-backed enterprises shape the current outlook of Chinarsquos solar PV and wind power generation
bull China invested a sum of USD 142 billion to improve energy efficiency over the 11th Five-Year Plan (2006 to 2010) Private finance accounted for 83 of that total
Figure 5 Sectoral breakdown of Chinarsquos energy efficiency investments
0
20
40
60
80
INDUSTRY BUILDING TRANSPORT
Perce
nt o
f tot
al
CAPACITY BUILDING
60
The Landscape of Climate Finance 2012
61
The Landscape of Climate Finance 2012December 2012 December 2012
and their solid balance sheets which can serve as loan guarantees
China was also a leader in investment in the energy efficiency sector Investment in energy efficiency was driven by the mandatory targets set in the 11th Five-Year Plan (FYP) to reduce national energy intensity by 20 from 2005 levels by 2010 Over the course of the Plan (2006-2010) Chinarsquos energy efficiency investment reached a cumulative amount of USD 120 billion
Private finance represented the lionrsquos share of total energy efficiency finance 79 of the total USD 120 billion invested corporations provided USD 533 billion households contributed USD 19 billion commercial banks provided USD 38 billion and the stock market raised USD 16 billion Private funding was raised in the form of direct equity and debt investments
Public money contributed USD 229 billion (191) The central government supported energy efficiency programs in the industrial building and transport sectors with USD 152 billion (127) in the form of direct investment subsidies rewards transfer payments government procurements and concessional loans Provincial and lower-level governments provided USD 77 billion (64) as local supplements to support activities in their jurisdictions International institutions and international carbon market contributed additional USD 23 billion (19)
The industrial sector attracted the greatest share of money 89 or USD 107 billion to undergo energy audits technology upgrades facility retrofitting and closure of outdated plants
Energy efficiency investment in the 11th FYP surpassed the amount invested in any previous FYPs The vast scale of investment was critical to Chinarsquos energy target achievement in the 11th FYP period On average the ratio of public funding to ldquoprivate investmentrdquo was 1 to 423 This leverage effect should however be interpreted by keeping in mind that there are governmental resources ldquositting-behindrdquo private investments
Prepared by Dong Wenjuan and Yu Yuqing (CPI Beijing dongwenjuancpibeijingorg yuyuqingcpibeijingorg)
Based on forthcoming ldquoAnnual Review of Low-Carbon Development in China (2013)rdquo CPI Report
60
The Landscape of Climate Finance 2012
61
The Landscape of Climate Finance 2012December 2012 December 2012
4 Conclusions and the way forwardA comprehensive picture of todayrsquos climate finance flows will improve our collective understanding not only about how much and what type of finance is provided to promote low-carbon climate-resilient development but how the world stands in relation to global finance and temperature goals With a comprehensive picture we can begin to identify how different types of support cor-respond to different needs and whether resources are being spent productively This understanding is critical to highlight emerging trends and position policy makers and investors to respond to the challenges effectively
The Landscape 2012 builds and improves upon CPIrsquos initial effort to provide a snapshot of the current climate finance landscape Our methodology draws on a wide variety of tracking initiatives and information systems to estimate the possible scale of available finance This study highlights that there is not one single climate finance story climate finance archetypes differ by country and circumstance In addition a number of actors have distinctive responsibilities Public and private intermediaries continue to play a pivotal role in distributing climate finance National banks are playing a growing role in channeling resources Private com-mercial banks and infrastructure funds are also critical players they intermediate both project finance debt and direct investments In addition better information about private finance flows highlights the various private sector representatives that are active in climate invest-ments on the primary investment and lending sides mdash including institutional investors albeit to a small extent mdash and clean technology manufacturers engaged in vendor financing
The Landscape 2012 suggests that annual global climate finance flows reach between USD 343 - 385 billion in 2010-2011 or USD 364 billion on average Although close to 75 of this comes from private sources the public sector plays a pivotal role by providing funds that catalyze private sector investment These figures shed light on global efforts to match the global financing need Overall while money is clearly flowing to low-car-bon climate-resilient development investment levels fall far short of that required to limit global temperature rise to below two degrees Celsius The International Energy Agency projects that incremental investment in the energy sector will need to reach USD 36 trillion over the period of 2012-2050 ndash or approximately USD 1 tril-lion each year (IEA 2012) This estimate highlights just
how much more finance is required to fund the transi-tion toward a low-carbon climate resilient future
The amounts represented in the Landscape 2012 reflect better data and increased coverage The Landscape 2012 aimed to address some of the major information gaps identified in the Landscape 2011 Building upon the Landscape 2011 the Landscape 2012 better captures the magnitude and nature of climate finance flows between and within countries We expanded the geographic scope covered more types of actors and collected better information about the recipients of finance Most importantly by untangling private sector flows we have improved our understand-ing about the actual sources of money where it is going and through which financial instruments This has been particularly true in the case of domestic flows
Nonetheless there is room for improvement Reporting gaps and inconsistent labels and definitions hamper our ability to track and fully capture the scale and effective-ness of climate finance Climate Policy Initiative will con-tinue to build and improve upon this understanding in future Landscapes and through other ongoing efforts78
Emerging key issuesThis study confirms and elaborates upon several find-ings from the Landscape 2011
Private capital is essential and makes up the lionrsquos share of global climate investment flows
Public resources alone cannot finance the transition to a low-carbon climate-resilient future unlocking private sector capital will be essential The Landscape
78 To unlock sufficient climate finance for a low-carbon climate-resilient transition it is essential to increase climate finance effectiveness based on the optimal balance between public and private capital To shed light on how to do this CPI in collaboration with the World Bank Group CLP and the OECD established the San Giorgio Group a new working group of key financial intermediaries and institutions actively engaged in green low-emissions finance The core objective of the Group is to analyze how to mobilize and deploy adequate and effective finance to achieve low-carbon climate-resilient development To address the weak understanding of climate finance effectiveness CPI has initiated within the San Giorgio Group a work stream on concrete case studies to build up knowledge on elements that make investments successful from a financial environmen-tal organizational and political perspective By building up an evidence base what works and what doesnrsquot the goals is to learn from the wide range of existing and evolving financing practices to provide insights on how to scale up climate finance and spend available resources more wisely For more information see httpclimatepolicyinitiativeorgvenicesan-giorgio-group
62
The Landscape of Climate Finance 2012
63
The Landscape of Climate Finance 2012December 2012 December 2012
2012 highlights the relationship between public and private sources and suggests that a major portion of private investment relies on public finance to create an environment where investments are viable There is a clear incidence of public money standing behind private investments particularly in the emerging economies of China and Brazil
Well-targeted public capital can make investments go further
Well-targeted public resources are an essential element of transformational climate investment structures Most public money (almost 80) is currently delivered through national bilateral and multilateral organiza-tions While public institutions generally take the risk for money channeled through these organizations the money itself can be largely raised from private sources Our findings suggest a number of best practices are emerging in developing and developed countries where well-targeted public capital is starting to unlock
significant investment The Landscape 2012 also shows that bilateral public funding increased despite fiscal austerity and tightening credit context likely reflecting the impact of fast-start finance pledges
Looking forward public money remains essential but given its scarcity we need to understand its role (ie which risks should reside with the public sector and which should reside with the private sector and how the scale of these risks depends on the nature of the investments) to spend available resources wisely Public funds especially international public money should only pay for those risks the private or national public investments will not bear and the scale of these publicly offloaded or assumed risks depend on the nature of the investment
Domestic finance is a key element
Our findings underline the importance of domestic finance in addressing the global challenge of climate change The Landscape 2012 highlights that a large
Box 15 ndash Tracking issues
Many organizations maintain databases andor prepare reports about particular elements of the climate finance landscape However there is no integrated international system for storing this data many flows are not systematically measured reported or verified and where tracking efforts are in place granularity and consistency varies (cf Buchner et al 2011) This hampers efforts to compare and aggregate data and assess the effectiveness of finance
As the sources and volumes of climate finance increase the challenge to track and analyze flows will become greater While many organizations are working to improve these systems a number of areas require urgent attention
bull Transparency and consistency in definitions - what is counted and reported as climate finance including sectoral boundaries and whether total project value or only relevant portions of investments are counted
bull A clearer distinction between incremental costs and investment capital
bull Related to this a better understanding of how incremental support and specialized risk instruments stimulate investment and
bull Improved information about domestic and private flows of finance Most clean development investment will need to come from national private sources but data remains scarce
Based on ldquo The Landscape of Climate Financerdquo CPI Report (2011)
Many organizations are engaged in efforts to track aspects of the climate finance picture but several gaps remain
These gaps hamper efforts to compare and aggregate data and assess the overarching effectiveness of finance
62
The Landscape of Climate Finance 2012
63
The Landscape of Climate Finance 2012December 2012 December 2012
proportion of public investment reflected domestic gov-ernment support toward structural changes in energy systems as engines of economic growth Further infor-mation on private finance shows that domestic private actors play a key role
Emerging economies play a key role
Roughly one third of global mitigation investments are located in China Brazil and India Further a significant share of investment in these three countries is raised domestically and disbursed by state-owned entities in pursuit of development mandates We hope that these leaders signal a trend among other developing countries toward low-emissions climate-resilient growth as a practical and productive national development strategy
Understanding about adaptation finance is still scarce
While the large majority of climate finance is still used for mitigation measures we have been able to capture more money that is beginning to be invested in adapta-tion activities This reflects new tracking initiatives that specifically address the information gap on adaptation finance However data inconsistencies and the difficul-ties in defining what constitutes adaptation finance (and where the boundaries between adaptation and develop-ment finance are) hamper our understanding
Next steps for data gathering and analysisTo improve the worldrsquos understanding of climate finance and to put current climate finance flows in per-spective the following key issues need to be addressed
Comprehensiveness mdash further expansion of scope and coverage
This study emphasizes the relative importance of private finance Further information on private finance is needed particularly related to non-project level entry points for finance to better understand corporate sources of capital for balance sheet financing
The Landscape 2012 also confirms the essential role of a number of actors including international national and local financial institutions and households Additional detail on these institutionsrsquo financing including infor-mation about the new methodology that Multilateral Development Banks79 are developing for tracking and
79 Including the African Development Bank (AfDB) the Asian Development Bank (ADB) the European Bank for Reconstruction and Development (EBRD) the European Investment Bank (EIB) the Inter-American Develop-ment Bank (IDB) the World Bank (WB) and the International Finance Corporation (IFC)
accounting mitigation and adaptation finance will improve our understanding of their role in climate finance We also need better information on domestic-level finance and on financing channels for households A better overview of climate funds particularly national ones would further improve the comprehensiveness of the climate finance landscape
Finally better information on the role of specific sectors (such as energy efficiency and non-energy sectors) and uses (such as adaptation and enabling environment finance) and better mapping of specific instruments (such as tax incentives) is needed
The dimensions of climate finance mdash clarify net climate finance flows
The Landscape 2012 takes both incremental costs and investment capital into account It focuses on gross flows due to the difficulty of calculating incremental cost and net values of all finance flows due to the importance of understanding the full volume of finan-cial flows delivered Gross flows also tell a story about upfront support that is needed to encourage further investments Ultimately it is instructive to understand net contributions by countries and actors and to obtain a good understanding of incremental costs compared with business-as-usual or ldquobrownrdquo investments This is particularly important to understand how global efforts are tracking against the financing levels needed to stabilize average global temperature below two degrees Celsius Proxies are necessary to better understand these dimensions In this context the role of risk mitiga-tion and policy instruments in addressing incremental costs warrant further work
The impact mdash increase understanding of climate finance effectiveness
The biggest gap in todayrsquos climate finance landscape remains the lack of a sound understanding about whether finance flows are being used effectively and whether they adequately address the challenges posed by climate change and global needs We need more efforts to define and describe what constitutes effective climate finance starting with lessons from the important experiences of organizations already working to measure the impact of climate finance In fact a number of countries and DFIs are now actively developing frameworks to measure and evaluate the performance of the climate finance they are providing delivering andor receiving (Buchner et al 2012) fos-tering more streamlined reporting frameworks
64
The Landscape of Climate Finance 2012
65
The Landscape of Climate Finance 2012December 2012 December 2012
More rigorous monitoring and reporting can aid learn-ing planning and budgeting at the country level and thus drive effectiveness improvements However more than just tracking will be required analysis of policy effectiveness will also be critical In addition to CPIrsquos effort to build up an evidence-based bottom-up database of success and failure stories related to climate finance (the San Giorgio Group case studies)80 there is a need to explore how effectiveness can also be ascribed to the climate finance landscape Possibilities include the calculationindication of expected avoided carbon emissions carbon cost per unit and co-impacts A further option to increase the understanding about the effectiveness of climate finance is to relate public money contributions to estimates of incremental costs Finally disbursement channels are also key for effective climate finance spending and more information on this element could improve the understanding of climate finance effectiveness
The benchmark mdash exploration of business-as-usual (ldquobrownrdquo) finance flows
To put climate finance estimates into perspective com-parable estimates of traditional ldquobrownrdquo or business-as-usual finance are a useful benchmark to check whether there is real progress towards a low-carbon climate-resilient future
CPI remains committed to improving the understanding and transparency of todayrsquos climate finance landscape
80 Within the San Giorgio Group CPI works on concrete case studies to build up knowledge on elements that make investments successful from a financial environmental organizational and political perspective We aim to provide credible information on how to ramp up public expenditures integrate national and international capital streams leverage public funds with private flows efficiently and invest the aggregate wisely For more information see httpclimatepolicyinitiativeorgpublicationsan-giorgio-group-case-studies
64
The Landscape of Climate Finance 2012
65
The Landscape of Climate Finance 2012December 2012 December 2012
Index of acronyms AAU Assigned Amount UnitAsDB Asian Development BankAF Adaptation FundAFD Agence Franccedilaise de DeacuteveloppementAfDB African Development BankAGF High-Level Advisory Group on Climate Change FinancingBFI Bilateral Finance Institution BIPV Building Integrated PhotovoltaicBNDES Brazilian Development BankBNEF Bloomberg New Energy FinanceCAF Development Bank of Latin America CDB China Development BankCDC Caisse des DeacutepocirctsCDM Clean Development Mechanisms CEA California Environmental AssociationCER Certified Emissions Reductions CIF Climate Investment Funds CRS Creditor Reporting SystemDAC Development Assistance Committee DBSA Development Bank of Southern AfricaDFI Development Finance InstitutionsEBRD European Bank for Reconstruction and Development ECA Export Credit Agency EDF Environmental Defense FundEEA European Energy AgencyEEC European Economic CommunityEIB European Investment BankEU European UnionEU ETS European Union Emissions Trading SystemFDI Foreign Direct Investment FiT Feed-in TariffFYP Chinarsquos Five-Year PlanGEF Global Environmental Facility GHG Greenhouse Gas Emissions IBRD International Bank for Reconstruction and Development ICI International Climate InitiativeIDA International Development Association IDB Inter-American Development BankIEA International Energy AgencyIFC International Finance CorporationIFCI International Forest Carbon InitiativeIGES Institute for Global Environmental StrategiesIIED International Institute for Environment and DevelopmentIREDA Indian Renewable Energy Development AgencyJI Joint Implementation JICA Japan International Cooperation AgencyJVETS Japan Voluntary Emissions Trading SchemeKFW KFW Entwicklungsbank (German Development Bank)MDB Multilateral Development BankMFI Multilateral Finance InstitutionNAFIN Nacional Financiera Development Bank
NDF Nordic Development Fund NFI National Finance InstitutionODA Official Development Assistance ODI Overseas Development InstituteOECD Organization for Economic Co-operation and DevelopmentOPIC Overseas Private Investment CorporationOTC Over-the-CounterREDD Reducing Emissions from Deforestation and Forest
DegradationREN21 Renewable Energy Policy Network for the 21st Century RGGI Regional Greenhouse Gas InitiativeSOE State-Owned Enterprise including national provincial
and municipal level state-owned enterprises and their subsidiariesspinoffs
TNC The Nature ConservancyUNDP United Nations Development Programme UNEP United Nations Environment ProgrammeUNEP-Risoslash United Nations Environment Programme Risoslash Centre on
Energy Environment and Sustainable DevelopmentUNFCCC United Nations Framework Convention on Climate ChangeVER Voluntary Emissions ReductionsWB World Bank
66
The Landscape of Climate Finance 2012
67
The Landscape of Climate Finance 2012December 2012 December 2012
GlossaryCRS
The Creditor Reporting System is a database of individual aid activities which contains detailed quantitative and descrip-tive data on individual aid projects and programs It enables analysis of the sectoral and geographical breakdown of aid for selected years and donors
DAC
The Development Assistance Committee is the committee of the OECD which deals with development co-operation matters At present there are 24 members of the DAC Australia Austria Belgium Canada Denmark Finland France Germany Greece Italy Ireland Japan Korea Luxembourg the Netherlands New Zealand Norway Portugal Spain Sweden Switzerland the United Kingdom the United States and the European Commission
EXPORT CREDITExport credits are government financial support direct financing guarantees insurance or interest rate support provided to foreign buyers to assist in the financing of the purchase of goods from national exporters (OECD 2012d)
FAST-START FINANCE
The Copenhagen Accord obliges developed countries to collectively provide fast-start finance to developing countries in the amount ldquoapproaching USD 30 billion for the period 2010-2012rdquo for enhanced action on mitigation (including Reducing Emissions from Deforestation and forest Degradation REDD) adaptation technology development and transfer and capacity building
GRANT Transfers made in capital goods or services for which no repayment is required
INCREMENTAL COST AND
INVESTMENT CAPITAL
Incremental cost and investment capital are both important lenses for climate finance flows Incremental cost refers to financial resources provided to compensate the difference between a less costly more polluting option and a costlier more environmentally friendly andor climate-resilient one Investment capital refers to tangible investment in mitigation or adaptation projects Whereas investment capital is paid back to the investor incremental costs often are not and are often funded by public climate finance support either through policy support or concessional finance
INFRASTRUCTURE FUND
ldquoFunds focused on making direct financial investments in projects across the following sectors power (renewables coal-fired gas turbine and nuclear) water (treatment and distribution) transportation (airports ports roads parking lots and rail links) social (prisons hospitals and schools) and utilities (gas distribution electricity transmission fixed-line telephone and mobile telephone)rdquo (PFI Global Infrastructure Report 2007 ldquoThe rise of infra fundsrdquo retrieved from httpcrgpstanfordedupublicationsarticles_presentationsOrr_01_Infra_funds_2007pfiepdf)
JOINT IMPLEMENTATION
(JI)
Track 1 JI Simplified approval process for JI projects where the host Party is considered to fulfill all the eligibility require-ments of the Kyoto Protocol on emission reportingTrack 2 JI Parties that have not met the Kyoto Protocol requirements on emission reporting can carry out JI projects under a more rigorous approval regime
ODA
Official Development Assistance is defined as those flows to developing countries (countries and territories on the DAC List of ODA Recipients) and to multilateral agencies in the form of grants or loans which are provided by the official sec-tor aimed to promote economic development and welfare given at concessional financial terms (if a loan having a grant element of at least 25) In addition to financial flows technical co-operation is included in aid
PRIVATE EQUITYldquoPrivate equity invests in private companies (hellip) to distinguish it from lsquopublic equityrsquo investments in stock markets (hellip) Private equity funds acquire established companies in old industries with the aim of reviving their fortunes (hellip) Private equity funds come in all shapes and sizesrdquo (EVCA website httpevcaeuwhat-is-private-equity)
REDD+REDD+ goes beyond deforestation and forest degradation and includes the role of conservation sustainable management of forests and enhancement of forest carbon stocks
66
The Landscape of Climate Finance 2012
67
The Landscape of Climate Finance 2012December 2012 December 2012
RIO MARKERS(RMS)
The Rio Markers (RMs) are indicators of the degree of relevance of a given activity in addressing the objectives of the three ldquoRio Conventionsrdquo (the United Nations Convention on Biological Diversity (CBD) the United Nations Framework Convention on Climate Change (UNFCCC) and the UNCCD) The screening of an activity against the objectives of a Convention will result in the following scores0 (not targeted) means that the activity is found not to be targeted to the Convention1 (significant) means that targeting the objectives of the Convention is an important but secondary purpose of the activity (ie not one of the principal reasons for undertaking the activity)2 (principal) means that targeting the objectives of the Convention is an explicit objective of the activity and fundamental in its design (ie the activity would not have been undertaken without this objective)3 (Action ProgrammeAP-related) for desertification only It means that the activity was undertaken to combat desertifi-cationland degradation as a principal objective and in support of an action programme (NAP SRAP or RAP) to implement the UNCCD
VENTURE CAPITALldquoVenture capital is a type of private equity focused on start-up companies Venture capital funds often back entrepreneurs who have just the germ of a business ideardquo (EVCA website httpevcaeuwhat-is-private-equity)
68
The Landscape of Climate Finance 2012
69
The Landscape of Climate Finance 2012December 2012 December 2012
ReferencesAgence Franccedilaise de Developpement (AFD) (2011)
ldquoResults and Lessons Learned from AFDrsquos Opera-tions in the fight Against Climate Change from 2005 to 2010rdquo Paris France
Agence Franccedilaise de Developpement (AFD) (2012) ldquoLrsquoactivite Financiegravere du Groupe AFD Dans la Lutte Contre le Changement Climatique Resultats pour 2011rdquo Paris France
Agence Franccedilaise de Developpement (AFD) (2012) ldquoScreening Tool For Classification of laquo Adaptation raquo Projects From The AFD Grouprdquo Paris France
AGF (UN Advisory Group on Climate Change Financ-ing) (2010) ldquoReport of the Secretary-Generalrsquos High-level Advisory Group on Climate Change Financingrdquo New York United States United Nations
Asian Development Bank (ADB) (2012) ldquoAnnual Report 2011rdquo Manila Philippines
Atteridge A C Kehler Siebert R J T Klein C Butler and P Tella ldquoBilateral Finance Institutions and Climate Change A Mapping of Climate Portfoliosrdquo prepared by the Stockholm Environment Institute for the Climate Change Working Group for Bilat-eral Finance Institutions November 2009
Banco Estado (2012) ldquoAnnual Report 2011rdquo Chile
Bloomberg New Energy Finance (2011) ldquoThe Past and Future of Development Bank Finance to Clean Energy Projectsrdquo Clean energy Research Note April 2011
Bloomberg New Energy Finance (2012a) ldquoVital Sta-tistics of Development Bank Funding for Broad Clean Energyrdquo Louw A July 2012 London United Kingdom
Bloomberg New Energy Finance (2012b) ldquoMemo to Policy Makers Re-charge the Development Banksrdquo Monthly VIP Comment Monthly Clean Energy Comment for Senior Executives McCrone A Volume V Issue 60 April 2012
BNDES (2012) ldquoAnnual Report 2011rdquo available at httpwwwbndesgovbrSiteBNDESexportsitesdefaultbndes_ptGaleriasArquivosempresaRelAnualra2011relatorio_anual2011_trilinguepdf
BNDES (2012b) Personal Communications and direct reporting April-August 2012
Buchner B Brown L Corfee-Morlot J (2011) ldquoMoni-toring and Tracking Long-Term Finance to Support Climate Actionrdquo OECD COMENVEPOCIEASLT(2011)3
Buchner B Falconer A Herve-Mignucci M Trabacchi C Brinkman M (2011) ldquoThe Landscape of Climate Financerdquo CPI Report October 2011
Buchner B A Falconer C Trabacchi and J Wilkinson (2012) A Survey of Systems to Monitor and Evalu-ate Climate Finance Effectiveness A CPI Report July 2012
Buchner B J Brown and J Corfee-Morlot (2011) ldquoMonitoring and Tracking Long-Term Finance to Support Climate Action httpwwwoecdorgenvironmentclimatechange48073739pdf
Caijing News (2012) ldquoChinarsquos Photovoltaic Industry on Brink of Bankruptcy Reportrdquo httpenglishcaijingcomcn2012-08-08111998243html accessed online at 2012-09-06
CEA (2007) ldquoDesign to Win Philanthropyrsquos Role in the Fight against Global Warmingrdquo California Environ-mental Associates San Francisco August 2007 available at httpwwwclimateactionprojectcomdocsDesign_to_Win_8_01_07pdf
CEC (2011) ldquoLa taxe carbone de la theorie agrave la pra-tique Les problematiques liees agrave lrsquoinstauration drsquoune taxe carbonerdquo Chaire Economie du Climat Universite Paris-Dauphine CDC Climate FLM No 20 February 2011 available at httpwwwchaireeconomieduclimatorgwp-contentuploads20110211-02-12-FLM-n20-Elbeze-De-Perthuispdf
China Development Bank (CDB) ldquoAnnual Report 2011rdquo available at httpwwwjicagojpenglishpublica-tionsreportsannual2011indexhtml
China-Denmark Wind Energy Development ProjectChina Renewable Energy Association 2009 ldquoChina Wind Energy and Electricity Tariff Develop-ment Reportrdquo
Clapp C J Ellis J Benn and J Corfee-Morlot (2012) ldquoTracking Climate Finance What and Howrdquo 04-May-2012COMENVEPOCIEASLT(2012) Paris France OECD httpwwwoecdorgenvi-ronmentclimatechange50293494pdf
Climate Commission (2012) ldquoThe Critical Decade International Action on Climate Changerdquo Flan-nery T R Beale and G Hueston Commonwealth
68
The Landscape of Climate Finance 2012
69
The Landscape of Climate Finance 2012December 2012 December 2012
of Australia (Department of Climate Change and Energy Efficiency) 2012
Corfee-Morlot J Guay B and Larsen KM (2009) ldquoFinancing for Climate Change Mitigation Towards a Framework for Measurement Reporting and Verificationrdquo OECDIEA Information Paper Paris October 2009
CPI (2010) The State of International Climate Finance Is it Adequate and is it Productive Climate Policy Initiative Venice available at httpclimatepolicyinitiativeorgpublicationthe-state-of-international-climate-finance-is-it-adequate-and-is-it-productive
CPI (2011) Inaugural Meeting of the San Giorgio Group Expanding Green Low-Emissions Finance ldquoProposed Analytical Program to Support Green Low-Emissions Financerdquo Island of San Giorgio Maggiore Venice Italy October 2010
CPI (2012) ldquoThe Landscape of Climate Finance in Germanyrdquo I Juergens H Amecke R Boyd B Buchner A Novikova A Rosenberg K Stelmakh A Vasa CPI Report (forthcoming) CPI consulta-tion draft as of October 2012 available at httpclimatepolicyinitiativeorgberlin
CPI (2012b) ldquoSecond Annual San Giorgio Group Meeting Expanding Green Low-Emission Financerdquo httpclimatepolicyinitiativeorgveniceeventsecond-annual-san-giorgio-group-meeting-expanding-green-low-emissions-finance
CPI (2013) ldquoAnnual Review of Low-Carbon Develop-ment in China (2013)rdquo CPI Report (forthcoming)
Development Bank of Southern Africa (DBSA) (2012) ldquoAnnual Report 201011rdquo South Africa
Ecofys-IDFC (2012) ldquoMapping of Green Finance Deliv-ered by IDFC Members in 2011rdquo Houmlhne N Khosla S Fekete H Gilbert A
Elbeze J and C de Perthuis 2011 Twenty Years of Carbon Taxation in Europe some lessons learned Information and Debates Series No 9 April 2011 Chaire Economie di Climat
Environmental Grantmakers Association (EGA) 2012 Tracking the Field Volume 3 Exploring Environ-mental Grantmaking httpcymcdncomsiteswwwwingsweborgresourceresmgrfilesfinal_report_v3pdf
European Bank for Recontruction and Development (EBRD) Sustainable Energy Financing Facility
(SES) May 2012 available at httpwwwebrdcomdownloadsresearchfactsheetsseffpdf
European Commission (EC) (2011) ldquoProposal for a Council Directive Amending Directive 200396EC Restructuring The Community Framework for The Taxation of Energy Products and Electricityrdquo Brussels SEC(2011) 409 httpeceuropaeutax-ation_customsresourcesdocumentstaxationsec_2011_409_impact_assesment_part1_enpdf
Eurostat (2011) ldquoStatistic in Focus 672011rdquo Environ-ment and Energy httpeppeurostateceuropaeucacheITY_OFFPUBKS-SF-11-067ENKS-SF-11-067-ENPDF European Commission
Eurostat (2011b) Environmental Taxes httpeppeurostateceuropaeustatistics_explainedindexphpEnvironmental_taxes European Commission
Falconer A and G Frisari 2012 San Giorgio Group Case Study ldquoOuarzazate I CSPrdquo Climate Policy Initia-tive available at httpclimatepolicyinitiativeorgour-workpublications
Fransen T Stasio K S Nakhooda (2012) ldquoThe US Fast-Start Finance Contributionrdquo World Resource Institute Overseas Development Institute May 2012 Working Paper available at httpwwwodiorgukpublications6560-usa-america-fast-start-finance-unfccc-pledge
FS-UNEP and BNEF (2012) ldquoGlobal Trends in Renew-able Energy Investment 2012rdquo Frankfurt SchoolUNEP Collaborating Centre for Climate amp Sustain-able Energy Finance and Bloomberg New Energy Finance Available at httpfs-unep-centreorgpublicationsglobal-trends-renewable-energy-investment-2012
Gibbs D (2012) ldquoLessons Learnt from Fast‐Start Financerdquo Presentation at the First workshop on Long-term Finance UNFCCC July 2012 httpunfcccintfilescooperation_supportfinan-cial_mechanismlong-term_financeapplicationpdfgibbs11june2012pdf
Gomez-Echeverri L (2010) National Funding Entities Their Role in the Transition to a New Paradigm of Global Cooperation on Climate Change European Capacity Building Initiative httpwwweuroca-pacityorgdownloadsNFEsPolicyReportpdf
Inada K (2011) Presentation ldquoClimate Finance JICA Implications for the Green Climate Fundrdquo August 29 2011 Japan International Cooperation Agency (JICA) httpwwwdbsaorgConfrFCCWorkshop20Material2011208202920
70
The Landscape of Climate Finance 2012
71
The Landscape of Climate Finance 2012December 2012 December 2012
JICA20DBSA20Climate20Finance20(2)20[Compatibility20Mode]pdf
Independent Evaluation Group (IEG) World Bank IFC and MIGA Adapting to Climate Change Assess-ing the World Bank Group Experience Phase III of the World Bank Group and Climate Change Independent Evaluation Group Washington DC United States available at httpiegworldbank-grouporgcontentdamiegclimate_change3cc3_full_evalpdf
Indian Renewable Energy Development Agency (IREDA) ldquoAnnual Report 2010-2011rdquo
Inter-American Development Bank (IDB) African De-velopment Bank (AfDB) Asian Development Bank (ADB) European Bank for Reconstruction and Development (EBRD) European Investment Bank (EIB) World Bank (WB) International Finance Corporation (IFC) (2012) ldquoJoint MDB Report on Mitigation Finance 2011rdquo available at httpclimatechangeworldbankorgsitesdefaultfilesMMF_2011_version_21pdf
Inter-American Development Bank (IDB) (2011) ldquoMexico CTF Renewable Energy Financing Facility (CTF-REF)rdquo (ME-L1109 httpwwwclimateinvestmentfundsorgcifsitesclimatein-vestmentfundsorgfilesApproval20by20Mail20Mexico20Renewable20Energy20Program20Proposal20III20PIDpdf
International Development Finance Club (2012) ldquoWork Plan 2 Leverage Private and Public Funds Position Paper on Leverage of Public and Private Fundsrdquo IDFC 2012
International Energy Agency (IEA) (2012) ldquoWorld Energy Outlook 2012rdquo November 2012 Paris France
International Finance Corporation (IFC) (2012) ldquoMan-agementrsquos Discussion and Analysis and Con-solidated Financial Statementsrdquo June 30 2012 Washington DC United States
International Sustainability Unit (ISU) The Princes Charitiesrsquo (2012) ldquoInterim REDD+ Finance Current Status and Ways Forward for 2013-2020rdquo November 2012
Japan International Cooperation Agency (JICA) (2012) ldquoAnnual Report 2011rdquo
Japan International Cooperation Agency (JICA) (2012b) httpwwwjicagojppublicationspamphpdfreddpdf
Junghans L S Harmeling 2012 Different Tales from Different Countries A first assessment of the OECD ldquoAdaptation Markerrdquo Germanwatch httpgermanwatchorgdedownload6741pdf
KfW Bankengruppe Bank aus Verantwortung ldquoAnnual Report 2011rdquo and Exhibit (D) Germany available at httpwwwkfwdekfwenIIIDownload_CenterFinancial_PublicationsFinancial_publica-tions1_Geschaeftsberichte_E120706_006_RZ_KfW_GB11_EN_Webpdf
KfW Bankengruppe Bank aus Verantwortung ldquoFinancial Report 2011rdquo Germany
KfW Bankengruppe KfW Entwicklungsbank DEG ndash Deutsche Investitions- und Entwicklungsge-sellschaft mbH (2011) ldquoAdaptation to Climate Change Cooperation with Developing Countries ndash Climate and Developmentrdquo Frankfurt am Main Germany June 2011
Khan Hannan S M Doha S Haque S (2011) ldquoThe Ban-gladesh National Climate Funds A Brief History and Description of the Bangladesh Climate Change Trust Fundrdquo LDC paper series IIED and ECBI
Latt J (2011) ldquoMexico as an Emerging Donorrdquo EDC 2020 Policy Brief No18 March 2011
Marion V A Esch L Grieszlighaber F Fuller F Mers-mann F Fallasch L De Marez (2012) ldquoGerman Fast- Start Lessons Learned for Long-Term Financerdquo Climate Analytics Wuppertal Institute Germanwatch August 2012 httpwwwbmu-klimaschutzinitiativedefiles2012-German_FSF_Study_1076pdf
Michaelowa AMichaelowa K (2011) Coding Errors or Statistical Embellishment The Political Economy of Reporting Climate Aid In World Development Vol 39 No 11 2011 pp 2010ndash2020
Ministry of Economy Finance and Industry (Minefi) (2011) Ministry of Ecology Sustainable Develop-ment Transport and Housing Ministry of Foreign and European Affairs ldquoHow Francersquos Development Partnerships are Meeting the Challenge of Climate Change Fast-start implementation for 2011 Paris France
Nacional Financiera (2012) ldquoAnnual Report 2011rdquo Mexico
National Renewable Energy Laboratory (NREL) 2009 Carbon Taxes a Review of Experience and Policy Design Considerations Sumner J L Bird and H
70
The Landscape of Climate Finance 2012
71
The Landscape of Climate Finance 2012December 2012 December 2012
Smith Technical Report NRELTP-6A2-47312 December 2009
Nelson D G Shrimali G S Goel C Konda R Kumar (2012) ldquoMeeting Indiarsquos Renewable Energy Targets How Policy Can Help Overcome Financing Chal-lenges and Encourage Investmentrdquo CPI Report (forthcoming)
Nordic Development Fund (NDF) (2012) ldquoAnnual Report 2011rdquo Helsinki Finland
Oakes N Leggett M Cranford M Vickers H (eds) (2012) ldquoThe Little Forest Finance Bookrdquo Global Canopy Programme Oxford
OECD (2007) ldquoReporting Directive for the Creditor Reporting Systemrdquo DCDDAC(2007)39Final Organisation for Economic Co-operation and Development (OECD) Paris September 2007
OECD (2010) Statistics on Export Credits Trade and Agriculture Directorate (TAD) available at httpwwwoecdorgdepartment03355en_2649_34169_1_1_1_1_100html
OECD (2011) ldquoFirst-Ever Comprehensive Data on Aid For Climate Change Adaptationrdquo Organisation for Economic Co-operation and Development (OECD) November 2011 Paris available at httpwwwoecdorgdacaidstatistics49187939pdf
OECD (2011b) Creditor Reporting System _Full down-load file ldquoCRS 2009ziprdquo DAC Creditor Reporting System database httpstatsoecdorgIndex aspxDatasetCode=CRSNEW data down- loaded 5th April 2011
OECD (2012) Creditor Reporting System _Full down-load file ldquoCRS 2011ziprdquo DAC Creditor Reporting System database httpstatsoecdorgIndexaspxDatasetCode=CRSNEW version June 2012
OECD (2012b) Full list of climate change mitigation and climate change adaptation aid activities 2010 httpwwwoecdorgdacaidstatis-tics50089594xlsx
OECD (2012c) ldquoUnderstanding on Export Credits for Renewable Energy Climate Change Mitigation and Water Projects as new Annex IV available at httpsearchoecdorgofficialdocumentsdisplaydocumentpdfdoclanguage=enampcote=tadpg(2012)9
OECD (2012d) Glossary of Statistical Terms httpstatsoecdorgglossaryindexhtm
OECDEuropean Environment Agency Database on Instruments Used for Environmental Policy and Natural Resources Management httpwww2oecdorgecoinstqueriesindexhtm
Parker C J Brown J Pickering E Roynestad N Mardas A W Mitchell (2009) ldquoThe Little Climate Finance Bookrdquo Global Canopy Programme
Peters-Stanley M K Hamilton D Yin (2012) ldquoLeverag-ing the Landscape State of the Forest Carbon Markets 2012rdquo Ecosystem Marketplace
Pinheiro AC (2012) ldquoThe Role Of Concessionary Finance In Brazilrdquo CDE Insight June 2012
REN21 (2012) ldquoRenewables 2012 Global Status Reportrdquo at httpwwwren21netdefaultaspxtabid=5434
Republique Tunisienne Ministegravere du Developpement et de la Cooperation Internationale Institut National de La Statistique (INS) (2010) laquo Annuaire Statis-tique de La Tunisie 2005-2009rdquo December 2010
Ryan L Selmet N and Aarsud A (2012) ldquoPlugging the Energy Efficiency Gap with Climate Financerdquo IEA Insights Series 2012 OECDIEA Paris
Simula M (2010) ldquoAnalysis of REDD+ Financing Gaps and Overlapsrdquo Ardot available at httpreddplus-partnershiporg65563en
Smallridge D B Buchner C Trabacchi M Netto JJ Gomes L Serra (2012) ldquoThe Role of National Development Banks in Intermediating Interna-tional Climate Finance to Scale Up Private Sector Investmentsrdquo Inter-American Development Bank Working Paper 2012 (forthcoming)
Streck C and C Parker (2012) ldquoFinancing REDD+rdquo in Angelsen Arild Maria Brockhaus William D Sunderlin and Louis V Verchot 2012 Analysing REDD+ Challenges and choices httpwwwcifororgpublicationspdf_filesBooksBAngelsen1201pdf
Suennen R (2012) Contractual relationships between CMEs and CPAsrdquo Addis Ababa April 2012 KfW Bankengruppe Presentation available at httpaf-ricacarbonforumcom2012docsPresentationsd2_Training20Session202a_PoARainer20Suennenpdf
The Nature Conservancy (TNC) (2012) ldquoClimate Finance Readiness Lessons Learned in Developing Countriesrdquo J Gastelumndi The Nature Conser-vancy Available at httpwwweldisorggodisplayamptype=Documentampid=62706
72
The Landscape of Climate Finance 2012
73
The Landscape of Climate Finance 2012December 2012 December 2012
The World Bank (2011) ldquoAnnual Report 2011rdquo Washing-ton DC United States
Trabacchi C V Micale G Frisari (2012) San Giorgio Group Case Study ldquoPROSOL Tunisiardquo available at httpclimatepolicyinitiativeorgpublicationsan-giorgio-group-case-studies
UNDP (2011) ldquoBlending Climate Finance Through Na-tional Climate Funds A Guidebook for the Design and Establishment of National Funds to Achieve Climate Change Prioritiesrdquo United Nations Devel-opment Programme September 2011 httpwwwundporgcontentdamundplibraryEnviron-ment20and20EnergyClimate20ChangeCapacity20DevelopmentBlending_Climate_Finance_Through_National_Climate_Fundspdf
UNEP (2010) ldquoBilateral Finance Institutions amp Climate Change A Mapping of Public Financial Flows for Mitigation and Adaptation to Developing Countries in 2010rdquo United Nations Environment Programme Stockholm Environment Institute
UNFCCC (2010) ldquoCancun Agreementsldquo Art 71 available at httpunfcccintmeetingscancun_nov_2010items6005php
US PREF (2012) ldquoRamping up Renewables Leverag-ing State RPS Programs amid Uncertain Federal Supportrdquo US Partnership for Renewable Energy Finance White Paper authored by DB Climate Change Advisors (DBCCA) httpuspreforgwp-contentuploads201206Ramping-up-Renewables-Leveraging-State-RPS-Programs-amid-Uncertain-Federal-Support-US-PREF-White-Paper1pdf
Varadarajan U B Pierpont A Hobbs K Rowley (2012) ldquoSupporting Renewables while Saving Taxpayers Moneyrdquo CPI Report September 2012 available at httpclimatepolicyinitiativeorgwp-contentuploads201209Supporting-Renewables-while-Saving-Taxpayers-Moneypdf
Vieweg M Esch A Grieszlighaber L Fuller F Mersmann F Fallasch F De Marez L et al (2012) ldquoGerman Fast Start Finance Lessons Learned for Long-Term Financerdquo Climate Analytics Wuppertal Institute Germanwatch August 2012 available at httpwwwclimateanalyticsorgsitesdefaultfilesat-tachmentsnews2012-German_FSF_Studypdf
Visconti G M Netto JJ Gomes (2012) Presentation ldquoRole of National Development Banks in Promoting Climate Financerdquo Inter-American Development
Bank available at httpclimatepolicyinitiativeorgvenicefiles201209Viscontipdf
Vivid Economics (2012) ldquoCarbon taxation and Fiscal Consolidation the Potential of Carbon Pricing to Reduce Europersquos Fiscal Deficitsrdquo report prepared for the European Climate Foundation and Green Budget Europe May 2012
Vrana M and Cracknell J (2011) ldquoEnvironmental Funding by European Foundations A Snapshotrdquo Environmental Foundation Centre (ECF) Sep-tember 2011 available at httpwwwefcbeprogrammes_servicesresourcesDocumentsefc_environmental_finalpdf
World Bank (2012) ldquoState and Trends of the Carbon Markets 2012rdquo Washington DC May 2012
Weiss W and F Mauthner (2012) ldquoSolar Heat World-wide Markets and Contribution to the energy supply 2010 (edition 2012) at httpwwwiea-shcorgpublicationsdownloadsSolar_Heat_Worldwide-2012pdf
72
The Landscape of Climate Finance 2012
73
The Landscape of Climate Finance 2012December 2012 December 2012
WebsitesAfrican Development Bank (AfDB) website at http
wwwafdborgen
Agencia Financiera de Desarrollo (AfD) website at httpwwwafdgovpy
Asian Development Bank (AsDB) website at httpwwwadborg
Banco de Desarollo de America Latina Development Bank of Latin America (CAF) at httpwwwcafcomviewindexaspms=19
Banco Estado de Chile website at httpswwwban-coestadocl
Bancoldex Colombia website at httpwwwbancoldexcomportaldefaultaspx
Black Sea Trade amp Development Bank website at httpwwwbstdborg
Bloomberg New Energy Finance website at httpbnefcom
Brazilian Development Bank BNDES website at httpwwwbndesgovbrSiteBNDESbndesbndes_enInstitucionalPressNoticias201220120213_fun-doclimahtml
Caisse de Depot et de Gestion (CDG) httpwwwcdgma
China Development Bank (CDB) httpwwwcdbcomcnenglishindexasp
Climate Change Expert Group (CCXG) on the UNFCCC website at httpwwwoecdorgdocument4403746en_2649_34361_1904108_1_1_1_100html
Climate Investment Funds website at httpsclimatein-vestmentfundsorgcif
Development Bank of Southern Africa (DBSA) website at httpwwwdbsadrm-zacom
European Bank for Reconstruction and Development (EBRD) website at httpwwwebrdcompageshomepageshtmlamppanel1-2
European Bank for Reconstruction and Development (EBRD) Sustainable Energy Initiative (SEI) website at httpwwwebrdcompagessectorenergyef-ficiencyseishtml
European Commission Climate Action website at httpeceuropaeuclimapoliciesetsauction-ing_enhtm
European Investment Bank (EIB) website at httpwwweiborg
European Commission Eurostat (2012) Environmental and Energy data base accessed on September 2012 httpappssoeurostateceuropaeunuishowdo
European Commission Eurostat (2012) Environmental Taxes httpeppeurostateceuropaeustatis-tics_explainedindexphpEnvironmental_taxes
French Development Agency (AfD) Agence Franccedilaise de Developpement website at httpwwwafdfrlangenhome
Government of Brazil website at wwwbrasilgovbr
Green Climate Fund website at httpgcfundnethomehtml
International Development Finance Club website at httpwwwidfcorg
Indian Renewable Energy Development Agency (IREDA) website at httpwwwiredagovin
Indonesia Exim Bank website at httpwwwindonesi-aeximbankgoid
Industrial Development Bank of Turkey (TSKB) website at httpwwwtskbcom
Inter-American Development Bank (IDB) website at httpwwwiadborg
International Finance Corporation (IFC) website at httpswwwifcorg
Japan International Cooperation Agency (JICA) website at httpwwwjicagojpenglish
KfW Group website at httpwwwkfwdekfwenKfW_Groupindexjsp
Korea Finance Corporation (KOFC) httpwwwidfcorgMemberskofcaspx
Multi-Donor Trust Fund Office Gateway website at httpmdtfundporg
Nacional Financiera Banca de Desarollo (NAFIN) website at httpwwwnafincomportalnfcontenthomehomehtml
Nordic Development Fund website at wwwndffi
OANDA website at httpwwwoandacom
ODI HBF Climate Funds Update database at httpwwwclimatefundsupdateorg
74
The Landscape of Climate Finance 2012
75
The Landscape of Climate Finance 2012December 2012 December 2012
OECD DAC Creditor Reporting System database at httpwwwoecdorgdataoecd50175037721htm
OECD Glossary of Statistical Terms at httpstatoecdglossary
OECD Trade and Agriculture Directorate (TAD) Export Credits Database at httpwwwoecdorgdepartment03355en_2649_34169_1_1_1_1_100html
OECD Userrsquos Guide to the CRS Aid Activities database at wwwoecdorgdacstatscrsguide
OECD website ldquoFocus on Aid Targeting the Objectives of the Rio Conventionsrdquo at wwwoecdorgdacstatsrioconventions
OECD List of OECD Member Countries at httpwwwoecdorggenerallistofoecdmembercoun-tries-ratificationoftheconventionontheoecdhtm
OECDEEA database on instruments used for environ-mental policy and natural resources management httpwww2oecdorgecoinstqueriesindexhtm
Overseas Private Investment Corporation (OPIC) website at httpwwwopicgov
Small Industries Development Bank of India (SIDBI) website at httpwwwsidbicom
The Brazilian Development Bank website at httpwwwbndesgovbr
The Financial Times FDi Intelligence website at httpwwwfdiintelligencecom
The Foundation Center website at httpfoundation-centerorggpfclimatechangechart-oecdhtml
The Global Environmental Facility (GEF) project data-base at httpwwwgefonlineorg
The Nordic Development Fund (NDF) website at httpwwwndffi
UNCTAD interactive database of Division on Invest-ment and Enterprise at httpwwwunctadorgtemplatesPageaspintItemID=3199amplang=1
UNEP Risoslash Centre CDMJI Pipeline Analysis and Data-base at httpcdmpipelineorg
UNFCCC CDM Registry website at httpcdmunfcccintRegistryindexhtml
UNFCCC Finance Portal for Climate Change website at httpunfcccintcooperation_supportfinan-cial_mechanismfinance_portalitems5824php
Adaptation Private Sector Initiative (PSI) at httpunfcccintadaptationnairobi_work_programmeprivate_sector_initiativeitems4623php
Vnesheconombank (VEB) website at httpwwwvebru
World Bank Project amp Operations database at httpgoworldbankorgIAHNQIVK30
World Bank website at httpworldbankorg
74
The Landscape of Climate Finance 2012
75
The Landscape of Climate Finance 2012December 2012 December 2012
Appendix A - Main assumptions and methodologyThe Scope of Private Climate FinanceWe covered 1636 individual active projects from the Bloomberg New Energy Finance database representing 82 of the extra capacity in developed countries and 89 of the extra capacity in developing countries (539 GW in total)
For both developed and developing countries we looked at the most relevant ldquo2011 financing storiesrdquo each rep-resenting more than 1 GW of extra capacity financed in 2011
Developed countries (OECD) 45 of the projects for 45 of total capacity
The top 7 stories which represent 75 of the proj-ects for 82 of capacity in developed countries are as follows
bull US wind and solar financing
bull Canadian wind financing
bull German wind financing
bull UK wind and biomass amp waste financing
bull Spanish wind and solar financing
bull Italian solar financing
bull Korean wind and marine financing (one large-scale project)
Developing countries (non-OECD) 55 of the projects for 55 of total capacity
The top 3 stories which represent 85 of the projects for 89 of capacity in developing countries are as follows
bull Chinese wind solar and biomass amp waste financing
bull Indian wind financing and solar financing
bull Brazil wind financing
Small-scale distributed capacityData for small-scale distributed capacity (PV and Solar Water Heater) were retrieved from FS-UNEP and BNEF (2012) and Weiss and Mauthner (2012) and catego-rized by geography and category of actors based on the data available
ldquoGreenrdquo FDI dataThe data used in the Landscape 2012 were retrieved by UNCTAD experts from the fDi Markets database Figures covered greenfield investments occurred glob-ally in 2011 We decided to exclude cross-border MampA as we decided to focus on new investment in emission reductionstabilization only
The sectors covered were the following renewable gen-eration (biomass geothermal hydroelectric solar tidal and wind energy) and waste management
To avoid double counting with the data retrieved from the BNEF database FDI data were allocated as the range of uncertainty to the BNEF subtotal except for flows that are typically of domestic nature such as gov-ernmentsrsquo budget and households ones
CURRENCY ANNUAL AVERAGE
EURUSD (2010) 13277
EURUSD (2011) 13926
BR$USD (2011) 05997
TNDUSD (2009) 074654
Source Oanda (2012)
76
The Landscape of Climate Finance 2012
77
The Landscape of Climate Finance 2012December 2012 December 2012
Appendix B - A summary of the Landscape 2011FINANCE FLOWS AMOUNTS
(ON AVERAGE) METHODOLOGY
ALL usd 97 bIllIOn
bull Indicative estimates of annual flows for the latest year available 20092010 (variable according to the data source)
bull Estimates spanning multiple years adjusted to produce annual-equivalentsbull Includes incremental costs and capital investmentbull Most data presented related to commitments in a given year due to limited availability of
disbursement data
BILATERAL usd 228 bIllIOn
bull Bilateral contributions reported through the OECDrsquos Creditor Reporting System Aid Activities (OECD CRS) database
bull Bilateral Finance Institutions direct reporting (TC 2011 UNEP 2010 BNEF 2011)bull an estimate of the volume of green export credits (OECD statistics on export credits 2010
as cited in Buchner et al 2011b)
MULTILATERAL usd 144 bIllIOnbull Multilateral institutionsrsquo direct reporting and reporting by various tracking initiatives
including TC 2011 UNEP 2010 BNEF 2011
CLIMATE FUNDS usd 25 bIllIOn bull ODIHBF Climate Funds Update and reporting by Fund administrators
CARBON OFFSET FINANCE usd 22 bIllIOn
bull This range was calculated using data from the World Bank the UNFCCC and IGES to apply surveyed average annual primary carbon offset prices to the annual volume of offsets issued
PRIVATE FINANCE usd 55 bIllIOn
Range of 370-722 billion betweenbull lsquoGreenrsquo Foreign Direct Investments (FDI) Based on the United Nations Conference on Trade
and Development database (UNCTAD 2010)bull Renewable energy investments based on the United Nations Environment Programme
(UNEP) and BNEF (UNEP and BNEF 2011) regarding renewable energy investments in developing countries (from developed countries other developing countries and private investment from national investors)
VOLUNTARY PHILANTHROPIC CONTRIBUTIONS
usd 450 mIllIOn bull Voluntary philanthropic contributions based on CEA 2007 Ecosystem Marketplace 2011
76
The Landscape of Climate Finance 2012
77
The Landscape of Climate Finance 2012December 2012 December 2012
Appendix C - Existing climate finance tracking databases and major ongoing initiativesTracking public climate financeAdaptation Fund Funded Projects and Funding Status
data at httpswwwadaptation-fundorgfunded_projects
African Development Bank Group (AfDB) Project Portfolio database at httpwwwafdborgenprojects-and-operationsproject-portfolio
AidData Development Finance and Foreign Aid Portal at httpaiddataorg
Asian Development Bank project database at httpwwwadborgprojects
European Bank for Reconstruction and Development (EBRD) online project database at httpwwwebrdcomsafsearchhtmltype=project
European Commission Climate Action Fast-start Finance list of actions tracked at httpeceuropaeuclimapoliciesfinanceinternationalfaststartindex_enhtm
European Investment Bank (EIB) Project finance database at httpwwweiborgprojectsloanssectorsindexhtm
Global Climate Change Alliance (GCCA) Technical and Financial Support database at httpwwwgccaeutechnical-and-financial-support
GEF project database available at httpwwwgefon-lineorg
Federal Ministry for the Environment Nature Conserva-tion and Nuclear Safety Germany National and International Climate Initiative online project data-base at httpwwwbmu-klimaschutzinitiativedeindex_enhtml
Inter-American Development Bank (IDB) online project database at httpwwwiadborgenprojectsprojects1229html
Multi-Partner Trust Fund Office Development and Climate Change Fund at httpmptfundporgfactsheetfundMDG00
ODIHeinrich Boumlll Foundation Climate Funds Update at httpwwwclimatefundsupdateorg
OECD Creditor Reporting System (CRS) Aid Ac-tivities database at httpstatsoecdorgIndexaspxdatasetcode=CRS1
United Nations Development Programme (UNDP) United Nations Environment Programme UNFCCC World Bank Group Fast Start Finance website at (updated as of December 2011) httpwwwfaststartfinanceorg
UNDPGEF Small Grants Programme project database at httpwwwundporgnpenvironment--energyprogramsgp-35html
UNFCCC Finance Portal for Climate Change at httpunfcccintcooperation_supportfinan- cial_mech-anismfinance_portalitems5824php
_____Funding for Adaptation interface at httpunfcccintadaptationimplementing_adaptationadapta-tion_funding_interfaceitems4638php
US Government RecoveryGov Track the Money httpwwwrecoverygovPagesdefaultaspx
Voluntary REDD+ Database REDD+ Partnership at wwwreddplusdatabaseorg
World Bank OECD Aid flows at httpsiteresourcesworldbankorgCFPEXTResourc- es299947-1266002444164indexhtml
World Bank UNDP Climate Finance Options database at wwwclimatefinanceoptionsorgcfo
World Bank Project amp Operations database at httpwebworldbankorgWBSITEEXTERNALPROJECTS0menuPK51562~pagePK64133621~piPK64140076~theSitePK4094100html
WRI Summary of Developed Country lsquoFast-Startrsquo Climate Finance Pledges (updated as f November 2011) at httpwwwwriorgstories201002summary-developed-country-fast-start-climate-finance-pledges
Tracking private climate financeBloomberg New Energy Finance Industry Intelligence
Desktop httpbnefcomservicesindustry- intelligence-slash-desktop
Dealogic ProjectWare and Loan Analytics httpwwwdealogiccoukenmarketdatahtm
Ecosystem Marketplace Bloomberg New Energy Finance Voluntary Carbon Market data at httpmoderncmsecosystemmarketplacecomrepositorymoderncms_documentssovcm_postlaunchreport_20121pdf
78
The Landscape of Climate Finance 2012
79
The Landscape of Climate Finance 2012December 2012 December 2012
_____Publication at httpwwwforest-trendsorgpub-lication_detailsphppublicationID=3164
Environmental Finance Carbon Funds httpwwwenvironmental-financecombooks
European Commission Eurostat FDI Statistics httpeppeurostateceuropaeu
EEX European Energy Exchange data at httpwwweexcomen
Financial Times FDi Intelligence database httpwwwfdiintelligencecom
Foundation Centre research database httpfounda-tioncenterorgfindfundersstatistics
Institute for Global Environmental Strategies (IGES) CDM Programme database at httpwwwigesorjpencdmindexhtml
OECD Creditor Reporting System (CRS) Aid Ac-tivities database at httpstatsoecdorgIndexaspxdatasetcode=CRS1
OECD International Direct Investment Statistics data-base at httpwwwoecdorgdafinternationalin-vestment
Point Carbon - Carbon Project Manager Carbon Market Trader EU at httpwwwpointcarboncomtrading
Thomson Reuters Trader for Commodities Advanced at httptrainingthomsonreuterscomportalproductphppid=4
Thomson Reuters Eikon for Energy at httpthomson-reuterscomproducts_servicesfinancialfinan-cial_productsa-zeikon_for_energy
UNCTAD Interactive Database Division on Investment and Enterprise at httpstatsunctadorgfdi
UNEP-Risoslash CDMJI Pipeline Analysis and Database at httpcdmpipelineorg
UNFCCC CDM and JI Project Activities databases at httpcdmunfcccintProjectsprojsearchhtml
_____Adaptation Private Sector Initiative (PSI) at httpunfcccintadaptationnairobi_work_pro-grammeprivate_sector_initiativeitems4623php
World Bank Private Participation in Infrastructure (PPI) Project Database at httpppiworldbankorg
_____State and Trends of Carbon Market 2012 at httpsiteresourcesworldbankorgINTCARBON-
FINANCEResourcesState_and_Trends_2012_Web_Optimized_19035_CvrampTxt_LRpdf
_____ World Development Indicators and Global Development Finance at http httpdatabankworldbankorgddphomedoStep=1ampid=4
78
The Landscape of Climate Finance 2012
79
The Landscape of Climate Finance 2012December 2012 December 2012
Appendix D - Details on Development Finance Institutions
BILATERAL FINANCE INSTITUTIONS
REPORTING YEAR SOURCE AND NOTES
AfD Agence Franccedilaise de Deacuteveloppement- Proparco
2011
Self-reporting via CPI surveyGiven that some of the projects supported contributed to both mitigation and adaptation purposes we allocated the dual purpose money according to the total distribution between mitigation and adaptation projects
JICAJapan International Cooperation Agency
2011 Self-reporting via CPI survey
KfW - KfW Entwicklungsbank- DEG
2011 Self-reporting via CPI survey
OPICOverseas Private Investment Corporation
2011 Self-reporting via CPI survey
MULTILATERAL FINANCE INSTITUTIONS
REPORTING YEAR SOURCE AND NOTES
AfDB African Development Bank
2011 Self-reporting via CPI survey - mitigation data only
AsDB Asian Development Bank
2011Self-reporting via CPI survey - mitigation data onlyBased on the infornation retrieved on the Banks website and at the best of our knowledge we allocated 100 of the reported portion of equity financing to balance sheet finance
EBRDEuropean Bank for Reconstruction and Development
2011Self-reporting via CPI surveyThe reported portion of equity financing was allocated 5050 between balance sheet financing and project-level equity due to data availabiltiy constraints
EIB European Investment Bank
2011
Joint MDBs Mitigation Finance Report (IDB et al 2012) The figure included hence represents financing to mitigation projects onlyTo retrieve the breakdown by instruments sectors and geography we applyed the shares presented in UNEP-SEI (2011)
EU Institutions 2010
OECD CRS 2010 data (OECD 2012)The figure included in the Landscape 2012 represents aid marked both principal and significantFinancing with multi-purpose objectives (ie both mitigation and adaptation) was allocated according to the distribution between mitigation only and adaptation only projects (55 vs 45)
IDBInter-American Development Bank
2011Self-reporting via CPI surveyThe portion of cliamte finance committed to Mexico was allocated to Central America
IFC International Finance Corporation
2011Self-reporting via CPI survey - mitigation data only
The reported portion of equity financing was allocated 5050 between balance sheet financing and project-level equity due to data availabiltiy constraints
NDFThe Nordic Development Fund
2011
NDF Annual Report 2011To estimate the thematic breakdown between mitigation and adaptation we applied the share retrievd from the OECD CRS 2009 dataset (OECD 2011b)The geographical breakdown was derived from NDF Annual Report 2011 and specifically we allocated committed funds based on the distribution of approved projects at the end of 2011 ie Africa (42) Asia (28) and Latin America (30)
80
The Landscape of Climate Finance 2012
81
The Landscape of Climate Finance 2012December 2012 December 2012
World Bank (IDA and IREDA)
FY 2011
Self-reporting via CPI surveyTo estimate the breakdown by instruments we applied- for IDA 6 to grants 94 to concessional loans as presented in the OECD CRS 2010 data (OECD 2012)- for IBRD 100 market-rate loans as presented in the OECD CRS 2009 data (OECD 2011a)The Bank asseses mitigation and adaptation co-benefits independently Hence to split total 2011 climate financing avoiding double counting we allocated the dual purpose money according to the total distribu-tion between mitigation and adaptation
NATIONAL amp SUB-REGIONAL
DEVELOPMENT FINANCE INSTITUTIONS
REPORTING YEAR SOURCE AND NOTES
AfD Agencia Financiera de Desarollo
2011 Self-reporting via CPI survey
BNDESBrazilian Development Bank
2011
Self-reporting via CPI surveyData included in the report represent dirbursement rather than committmentsThe bank reported financing to renewable energies and energy efficiency as a combined category (see also BNDES 2012) To derive the allocation pertaining to each sector we applied the share on 2011 disclosed deals per sectors as presented in BNEF (2012)
CAFDevelopment Bank of Latin America
2011 Self-reporting via CPI survey
DBSADevelopment Bank of Southern Africa
2011
Self-reporting via CPI surveyGeographical breakdownDBSAs financing to South Africa was considered as domestic spending as occurred in the area where the institution is based in
FIRAFideicomisos Instituidos en Relacioacuten a la Agricultura (Mexico)
2011 Self-reporting via CPI survey
IREDAIndian Renewable Energy Development Agency
2011
IREDA Annual Report (2011)To avoid potential double counting with other DFIs flows total financing was reduced by 40 which is the share of international assistance in IREDAs resource base for 2010-2011 as reported in IREDA (2011)In our estimate we have included financing directed to projects in the following sectors wind hydro biomass power generation energy efficiency and energy conservation solar energy waste to energy Instruments breakdownTo estimate the portion of low-cost debt versus market-rate debt we associated to the former the total amount of finance committed to those sectors for which in 2011 IREDA received the interest rate subsi-dies provided by the Indian Ministry of New and Renewable Energy (IREDA 2012) To market-rate debt was allocated the remaining portion
NAFINNacional Financiera (Mexico)
2011 Self-reporting via CPI survey
80
The Landscape of Climate Finance 2012
81
The Landscape of Climate Finance 2012December 2012 December 2012
BEBanco del Estado de ChileBancoldex SA ColombiaBCIECABEICentral American Bank for Economic IntegrationBSTDB Black Sea Trade and Development Bank of Greece CDGCaisse de Deacutepocirct et de Gestion MoroccoCDB China Development BankHBORCroatian Bank for Reconstruction and DevelopmentIndonesia EximbankKoFCKorea Finance CorporationSIDBI Small Industries Development Bank of IndiaTSKB Industrial Development Bank of TurkeyVEB Vnesheconombank Russia
2011
Ecofys-IDFC (2012) The volume of green finance stated in the report was adjusted by- the 7 share reported as other environmental projects as we opted to include only what banks reported as mitigation and adaptation- climate finance spending data received in response to CPIrsquos survey by the other NFIs and BFI above listed only those covered in the report- climate finance spending data received in response to CPIrsquos survey by AFD KFW and JICA which was re-allocated to the BFIs category- the share of Lower carbon energy generation project as it may have included fuel-to-fuel swtich project (eg fuel to gas coal to gas) or fossil fuel based co-generation- an esitmated portion of guaranteesrisk management instrumentsThe volumed obtained was allocated to mitigation and adaptation assuming a 89 vs11 breakdown which is in line with the report and the share observed in the financing of other BFIs and MFIsNote Due to the above and the includions of KFW Entwicklungsbank and DEGrsquos climate financing rather than the entire KFW Bankengruppe our NFIs total climate financing is lower as compared to the Ecofys-IDFC (2012) report We decided to include KFW Entwicklungsbank and DEGrsquo financing only for two main reasons (a) to avoid double counting with the money captured in the private finance flows and (b) to avoid distortions in the presentation of the BFIsrsquo money given the domestic-oriented focus of the excluded business areas of the Group and the lack of analogous examples across the group of BFIs We acknowledge the presence of public money sitting behind private investments quantifying it whenever possible and highlighting the key role played by KfW domestically in the support of the German Energiewende (see Box 10)Instruments breakdownTo estimate the breakdown between the instruments categories featured in the Landscape 2012 the ag-gregated volume of climate financing was1) Broken down between loans and others instruments (95 versus 5) as indicated in Ecofys-IDFC (2012)2) The resulting amount was then further broken down based on the weighted average observed for the other NFIs + BFIs for which we had data for3) The resulting portion of equity was allocated 5050 between balance sheet financing and project-level equity due to data availabiltiy constraintsGeographical breakdownTo esitmate the breakdown between the various greographical recipients we (1) allocated the estimated portion pertaining to CDB to China assuming that it invested domestically (2) the remaining portion was allocated according to the average shares among the other BFIs and NDBs for which we had data
82
The Landscape of Climate Finance 2012
83
The Landscape of Climate Finance 2012December 2012 December 2012
Appendix E - Details on Climate Funds
FUND NAME TYPE INSTRUMENTS
ESTIMATED LATEST YEAR
VALUE(USD MILLION)
SOURCE AND DETAILS
Adaptation Fund Multilateral1 Grants 856
Approved funds to projects in 2011 Source UNFCCC Finance Portal - Adaptation Fund Database of Projects - httpunfcccintcooperation_and_supportfinancial_mechanismadapta-tion_funditems6668phpApproved20project20data and Adaptation Fund Portal - httpwwwadaptation-fundorg consulted on July 27 2012
Global Environmental Facility (GEF)bull GEF Trust Fundbull Least Developed Countries Fundbull Special Climate Change Fund
MultilateralMultilateralMultilateral
Grants
22051702322181
Projects approved or endorsed by the CEO during 2011 as of end July 2012 Source Personal communication with GEF Secretariat July 2012
UN-REDD Programme Multilateral Grants 352
Multi-Partner Trust Fund Office May 2012 Third Consolidated Annual Progress Report on Activities Implemented under the UN-REDD Programme Fund for the period 1 January ndash 31 December 2011 httpmptfundporg
MDG Achievement Fund ndash Environment and Climate Change thematic window
Multilateral Grants 154Approved budget in 2011 for projects in the Environment and Climate Change thematic windowSource httpmdtfundporg
Climate Investment Funds (CIFs) including
bull the Clean Technology Fund and bull the Strategic Climate Fund
Multilateral
Grants conces-sional loans
loans and guarantees
9295Approved spend in 2011Source wwwclimatefundsupdateorg
Forest Carbon Partnership Facility (FCPF)
Multilateral Grants 214Approved spend in 2011Source wwwclimatefundsupdateorg
Congo Basin Forest Fund Multilateral Grants 573Approved spend in 2011Source wwwclimatefundsupdateorg
Global Energy Efficiency and Renewable Energy Fund
Multilateral Equity 174Approved spend in 2011Source wwwclimatefundsupdateorg
Global Climate Change Alliance Multilateral Grants 770Approved spend in 2011Source wwwclimatefundsupdateorg
Amazon Fund (Fundo Amazocircnia) Bilateral Grants 269Approved spend in 2011Source wwwclimatefundsupdateorg
BNDES Mata Atlacircntica initiative Bilateral Grants 58
R$ 118m approved in 2011 for 3 reforestation projects (con-verted to USD using an exchange rate of USD 048860R$ oandacom 1 September 2012) Source Press Release 26 May 2011 httpwwwbndesgovbrSiteBNDESbndesbndes_enInstitucionalPressNoticias201120110526_mataatlanticahtml
Germanys International Climate Initiative
BilateralGrants and
concessional loans
897Approved spend in 2011Source wwwclimatefundsupdateorg
82
The Landscape of Climate Finance 2012
83
The Landscape of Climate Finance 2012December 2012 December 2012
Australias International Forest Carbon Initiative
Bilateral Grants 314
Total approved spend No annual data is available Cumulative total approved spend is therefore divided by four given four full years of operation since June 2008 Source wwwclimate-fundsupdateorg
Indonesia Climate Change Trust Fund Bilateral Grants 00Approved spend in 2011Source wwwclimatefundsupdateorg
UK Internatioanl Climate Fund Bilateral Grants 782Approved spend in 2011Source wwwclimatefundsupdateorg
Guyana REDD+ Investment Fund Bilateral Grants 04
Administrative fees for project proposal preparation grants for projects approved in 2011 including (1) Institutional Strengthening US$ 305168 Source (2) Micro and Small Enterprise Development $127476
Japans Fast-Start Finance Bilateral
Grants loans risk instru-ments and equity
7997Cumulative total approved spend divided by two to give an approximation of annual flows over two full years of operation to date Source wwwclimatefundsupdateorg
1 Countries can access resources directly through National Implementing Agencies (NIEs) or using the services of a multilateral implementing entity (MIEs)
84
The Landscape of Climate Finance 2012
PB
The Landscape of Climate Finance 2012December 2012 December 2012
Appendix F - Financial flows for REDD+
FUND
ESTIMATED ANNUAL
COMMITMENTS (USD MILLION)
SOURCE
Bilateral and EU Institution commitments marked for climate change and forest related purpose
7000 OECD DAC database data for 2010 (OECD 2012)
Additional Fast Start Finance for REDD+ 2437CPI analysis of Fast Start Finance reporting to UNFCCC for 2010 Gibbs (2012)
Norway-Indonesia REDD+ Partnership 00Phase I contribution equals USD 30 million however no funds have yet been disbursed to projects Source Personal Communication with Indonesian officials
Norway-Guyana REDD+ Investment Fund 04Administrative fees for project proposal preparation grants for projects approved in 2011 including (1) Institutional Strengthening US$ 305168
UN-REDD Programme 352
Multi-Partner Trust Fund Office May 2012 Third Consolidated Annual Progress Report on Activities Implemented under the UN-REDD Programme Fund for the period 1 January ndash 31 December 2011 httpmptfundporg
World BankForest Carbon Partnership Facility (FCPF)
214Approved spend in 2011Source wwwclimatefundsupdateorg
Congo Basin Forest Fund 573Approved spend in 2011Source wwwclimatefundsupdateorg
Forest Investment Program (FIP) 510Approved spend in 2011Source wwwclimatefundsupdateorg
Global Environment Facility (GEF) 109CPI identification of projects related to forests approved or endorsed by the CEO during 2011 as of end July 2012 Source Source data through personal communication with GEF Secretariat July 2012
Global Climate Change Alliance 247Approved spend in 2011 in the REDD area Source wwwclimatefundsup-dateorg
Amazon Fund 269Approved spend in 2011Source wwwclimatefundsupdateorg
BNDES Mata Atlacircntica initiative 58
R$ 118m approved in 2011 for 3 reforestation projects (converted to USD using an exchange rate of USD 048860R$ oandacom 1 September 2012) Source Press Release 26 May 2011 httpwwwbndesgovbrSiteBNDESbndesbndes_enInstitucionalPressNoticias201120110526_mataatlanticahtml
International Tropical Timber Organization (ITTO)
40 Macqueen (2010)
Forest Carbon Markets 1430Peters-Stanley et al (2012) Value of primary credits sold on the volun-tary and CDMJI markets in 2011
Total 13242Notes - The following donor funds are excluded from the table above due to their interaction with other funds presented Australian International Forest Carbon Initiative (USD 314 million annualized estimate based on data from wwwclimatefundsupdateorg) German International Climate Initiative (USD 076 million ap-proved for REDD projects in 2011 according to wwwclimatefundsupdateorg) Norwegian Climate and Forest Initiative (no data on 2011 approved projects at wwwclimatefundsupdateorg) Japan Fast-Start Finance - The estimate of bilateral and EU Institution commitments in the forest sector is based on filtering of OECD CRS data according to climate change marking and forest related purpose coding (forestry industries development educationtraining policy amp admin Management research and services) Project channels and titles were screened to remove potential overlaps with ITTO GEF FIP FCPF and UN-REDD The portion of Fast-Start finance we identified in 2010 data (about USD 18 billion) is estimated to have contributed an additional USD 250 million which was obtained by applying an aver-age 14 share of Fast-Start financing to REDD measures over the December 2010 and 2011 period (Gibbs 2012)
- 1Introduction
- 2Methodology
-
- 21 Definitions
- 22 Analytical focus
- 23 Innovations in this yearrsquos study
-
- 3The Current Landscape of Climate Finance Flows
-
- 31 Sources and intermediaries
- 32 Intermediaries
- 33 Instruments
- 34 Disbursement channels
- 35 Uses
-
- 4Conclusions and the way forward
- Index of acronyms
- Glossary
- References
- Websites
- Appendix A - Main assumptions and methodology
- Appendix B - A summary of the Landscape 2011
- Appendix C - Existing climate finance tracking databases and major ongoing initiatives
- Appendix D - Details on Development Finance Institutions
- Appendix E - Details on Climate Funds
- Appendix F - Financial flows for REDD+
-

4
The Landscape of Climate Finance 2012
5
The Landscape of Climate Finance 2012December 2012 December 2012
Box ES-1 Building an understanding of climate financeCPIrsquos Landscape of Climate Finance 2011 represented the first attempt to map the lifecycle of climate finance flows across the globe This yearrsquos study the Landscape 2012 builds and improves upon our previous work using data from the latest year available mostly 2011
Compared with the Landscape 2011 the Landscape 2012 aims to provide to the extent possible an expanded geographical scope covering more flows between and within countries expanded coverage of players including broader coverage of private and public actors a more detailed representation of private sector flows with a better picture of sources and uses an improved representation of uses by economic sector including flows toward adaptation improving land use and preventing deforestation and a better understanding of the final users of climate finance
While the Landscape 2012 provides real insights about global climate finance this exercise is still a work in progress External factors continue to hinder our collective understanding of the scope true magnitude nature and effectiveness of global climate finance flows
Future steps need to resolve the following key issues to build an understanding of climate finance
bull Further expansion of scope and coverage Climate finance configurations differ by country and circumstance and a variety of actors with distinctive responsibilities exist There needs to be a better understanding of the different actors including the various players in the private sector and Development Finance Institutions at the international national and local levels To inform the debate on climate finance effectiveness better sectoral and geographic information on the uses of money is also required
bull A net perspective The Landscape 2012 takes both incremental costs and investment capital into account and focuses on gross flows due to the difficulty of calculating incremental cost and net values of all finance flows To create a more precise picture we need more information about net flows and incremental costs compared to business-as-usual or lsquobrownrsquo investments
bull A sound understanding of how effectively financial flows are being used and whether they address the challenges posed by climate change and global needs In addition to CPIrsquos effort to build up an evidence-based bottom-up database of success and failure stories related to climate finance (the San Giorgio Group case studies) there is a need to explore whether finance flows represented in the Landscape have been effective
bull A benchmark on business-as-usual or lsquobrownrsquo finance flows To put climate finance estimates into perspective comparable estimates of traditional polluting investments are a useful benchmark to check whether there is real progress towards a low-carbon climate-resilient future
A comprehensive picture of climate finance flows is essential to ensure that governments and policymakers have the knowledge and tools to spend their money most effectively CPI remains committed to improving the understanding and transparency of todayrsquos climate finance landscape to help countries learn how to spend money wisely
The San Giorgio Group is a working group of key financial intermediaries and institutions actively engaged in green low-emissions finance Led by CPI the World Bank Group OECD and CLP the mission of the Group is to provide valuable insights on how to scale up climate finance and spend available resources more wisely To this end CPI is examining a series of case studies to determine how public money can catalyze and incentiv-ize private investment in low-carbon technologies and to provide lessons for scaling up green finance
6
The Landscape of Climate Finance 2012
7
The Landscape of Climate Finance 2012December 2012 December 2012
Private SourcesPrivate finance continued to represent the lionrsquos share of total climate finance flows with USD 217-243 billion or 63 of the total Close to two-thirds of private finance came from developed countries
In developed countries private actors contributed USD 143 billion with USD 68-70 billion in asset finance Fifty-five percent of projects were financed on a balance sheet basis while 45 were funded through project-level finance Commercial banks were the leading providers of project-level debt (77) while domestic public budgets contributed around 17 and corporate players contributed around 6 In devel-oped countries domestic private actors contributed the most to overall asset finance investment flows (84) Investment by private actors from other OECD members (almost exclusively developed countries) rep-resented around 12 of investment and investment by private actors from non-OECD countries made up the remaining 4
In developing countries private actors contributed USD 85 billion with USD 64-87 billion in asset finance Four out of five projects were financed on a balance sheet basis This headline obscures important country-specific trends such as the role of National Development Banks in encouraging private investments at the local level In particular the Brazilian National Development Bank (BNDES) played a central role in financing wind power generation in Brazil We estimate that domestic private actors contributed up to 83 of private investments in developing countries Private investors from OECD countries contributed 15 while non-OECD actors made up the remaining 2
The inclusion of small-scale renewable energy finance (almost exclusively in developed countries) in the Landscape 2012 highlights the significant contribution of households and corporate actors (USD 83 billion)
IntermediariesPublic and private financial institutions played an important role in the climate finance land-scape raising and channelling USD 110-120 billion Public intermediaries (such as Multilateral Bilateral and National Development Banks) distributed USD 77 billion or about 67 of these resources Public intermediaries can also enable private investment and help make projects viable
Development Finance Institutions (multilateral bilat-eral and national) continued to play a pivotal role dis-tributing climate finance of around USD 77 billion This represented about 21 of global climate finance flows In addition domestic and international development agencies played a critical role in channeling bilateral aid
Increased international focus on the role of National and Sub-regional Development Banks made it pos-sible to gather more detailed information about the climate finance flows and the role of these intermediar-ies in managing and disbursing funds Together with Bilateral Finance Institutions these banks distributed the majority of intermediated climate finance (USD 54 billion) and played a growing role enabling the transi-tion to low-carbon and climate resilient development in the countries where they operate In fact 89 of total climate finance from National and Sub-regional Development Banks was invested in the country in which these institutions are located
National Development Banks in emerging economies such as the Brazilian and the Chinese development banks channeled the largest share Local budget contributions to climate compatible activities in these countries was particularly evident in Brazil where the Brazilian Development Bankrsquos concessional support to renewable power generation projects reflected the governmentrsquos backing for the Bankrsquos operations in the pursuit of its policy targets
It is important to acknowledge the complex interplay between actors at different stages of the lifecycle of climate flows Multilateral and bilateral entities tend to rely on national actorsrsquo closer proximity and knowledge of the local market with the objective of channeling money more effectively National actors on the other hand benefit from the expertise of international inter-mediaries to develop their capacity to assess analyze and structure green investment projects or appraise the
6
The Landscape of Climate Finance 2012
7
The Landscape of Climate Finance 2012December 2012 December 2012
risk profiles of developers In turn this allows national institutions to pass knowledge to the local banking system to unlock its financing potential and exploit its ability to reach a wide group of recipients
Dedicated Climate Funds typically managed by multilateral bilateral and national intermediaries contributed at least USD 15 billion to overall flows Their importance is likely to grow given their capacity to catalyze and coordinate resources for co-financing including at national levels
Private commercial banks and infrastructure funds intermediated around USD 38 billion including project-level debt and direct investments Private intermediar-ies played a particularly critical role by providing the scale of finance and financial toolboxes able to address the specific needs of lsquogreenrsquo and innovative investment interventions (eg concentrated solar power etc) On the other hand project developers provided equity capital and know-how
InstrumentsOur analysis of instruments indicates that most climate finance USD 293-347 billion out of USD 364 billion can be classified as investments in which public or private financial institutions had an ownership interest or claim ndash that is money which has to be paid back ndash rather than as contri-butions to incremental costs
Public intermediaries enabled otherwise unviable projects through the use of instruments such as concessional loans and grants
Around USD 293 billion was in the form of market rate loans and equity of which USD 262 billion had been made by the private sector Green credit lines as well as support for institutional development were also intended to attract local financial institutions to on-lend to projects that would not otherwise be implemented and to favor private sector investment
Public intermediaries enabled investments by filling capacity and viability gaps that prevented private investors from engaging in capital-intensive riskier and in the short-term less profitable ventures Public intermediaries delivered more than 60 of their financ-ing through concessional loans and about 7 in grant form Lowering the cost of debt in this way is essential
for low-carbon technologies to compete with traditional fuel-based alternatives
Beyond grants loans equity and debt finance a variety of risk management instruments help to overcome risk barriers and encourage low-carbon technologies to scale up Public-private facilities and guarantees to assume regulatory credit or perceived technology risks are just some of the instruments that can remove the risks private actors are not willing or capable of bearing
Uses
Mitigation activities attracted USD 350 billion mostly related to renewable energy and energy efficiency Emerging economies were key recipi-ents of climate finance Close to 33 of mitiga-tion-related finance was invested in China Brazil and India
The majority of funding captured by the Landscape 2012 was spent on mitigation activities Compared to the Landscape 2011 there was progress in understanding adaptation finance due to increased tracking efforts However weaknesses in defining and tracking adap-tation finance partial reporting by some multilateral players and the inability of existing efforts to capture private flows dedicated to such activities hampered our understanding of adaptation finance flows
The bulk of financing captured went to renewable energy generation projects and energy efficiency accounting for 85 and 4 of the total respectively This reflects governmentsrsquo low-carbon growth ambi-tions the commercial viability of a broad range of proven technologies the profit-driven character of private investments and the data sources we had access to
This report confirms that public financial institutions are playing an essential role in financing clean energy allo-cating more than 60 of their intermediated financial flows to renewable energy and energy efficiency They are also essential for financing adaptation measures contributing up to USD 11 billion and even more impor-tantly managing and implementing some of the relevant adaptation funds
The allocation of climate finance between developed and developing countries was relatively balanced with USD 193 billion or 53 going to projects in developed
8
The Landscape of Climate Finance 2012
9
The Landscape of Climate Finance 2012December 2012 December 2012
countries and USD 172 billion or 47 to projects in developing countries
Emerging giants such as China Brazil and India were the largest recipients of global mitigation-directed climate finance flows with USD 171 billion close to 33 of the total This implies that investments have been made where they are needed most and where mitiga-tion potential is the greatest Notably a significant share of this was raised domestically and invested in pursuit of development mandates
8
The Landscape of Climate Finance 2012
9
The Landscape of Climate Finance 2012December 2012 December 2012
32
Venture Capital Priva
te E
GENERAL TAX REVENUES
CARBON-RELATED TAXES
CARBON MARKET
REVENUESDEVELOPM
ENT FINANCE INSTITUTIONS
VENTURE CAPITAL PRIVATE EQUITY amp INFRASTRUCTURE FUNDS
$214
$22
$57
$53
$13
$5
$14
$350
DIFFERENT DISBURSEM
ENT CHANNELS
$2$7
$2
$47
$23
$32
$17
$104
$70
$32
POLICY INCENTIVES
RISK MANAGEM
ENT
CARBON OFFSET FINANCE
GRANTS
LOW-COST
PROJECT DEBT
PROJECT-LEVEL M
ARKET RATE DEBT
PROJECT-LEVEL EQUITY
BALANCE SHEET FINANCING
DEBT PORTION
INSTITUTIONAL INVESTORS
PROJECT DEVELOPERS
CORPORATE ACTORS
HOUSEHOLDS
GOVERNMENT
BUDGETS
$19
MITIGATION
ADAPTATION
Notes Figures are indicative estimates of annual fl ow
s for the latest year available 2010 or 2011 (variable according to the data source) Flows are expressed in USD billions
and rounded to produce whole num
bers Estimates spanning m
ultiple years are adjusted to produce annual-equivalent estimates W
here ranges of estimates are available
the mid-point is presented The diagram
distinguishes between lsquoincrem
ental costsrsquo that is fi nancial resources that cover the price di erence between a cheaper m
ore polluting options and costlier clim
ate-friendly ones and do not need to be paid back mdash and lsquocapital investm
entrsquo which are tangible investm
ents in mitigation or adaptation projects that need to be paid
back Categories not representing capital investment or a m
ix of capital investment and increm
ental costs are incremental costs only The group of National Finance Institutions includes
Sub-regional entities Most data presented relates to com
mitm
ents in a given year due to limited availability of disbursem
ent data
COMM
ERCIAL FINANCIAL INSTITUTIONS
AGENCIES
THE C
LIMATE FINANCE FLOW
S DIAGRAM 2012
The Climate Finance Flow
s Diagram 2012 also know
n as the lsquospaghettirsquo diagram illustrates the landscape of clim
ate fi nance fl ows along their
life cycle for the latest year available mostly 2011 The w
idth of the arrows in the diagram represents the relative size of the fl ows
NE
lt$1
MULTILATERAL
NATIONALBILATERAL
NE
NE
NE
NE
NE
NE
$77
CLIMATE FUNDS
NE Not estimated
PUBLIC M
ONEYPRIVATE M
ONEYPUBLIC FINANCIAL INTERM
EDIARIES
PRIVATE FINANCIAL
INTERMEDIARIES
OFFSET M
ONEYCAPITAL INVESTM
ENTCAPITAL INVESTM
ENT AND INCREM
ENTAL COSTS
KEY
FINANCE FOR INVESTORS amp
LENDERS
REDD
SOU
RCES AN
D IN
TERMED
IARIES
INSTRU
MEN
TSCH
AN
NELS
USES
NE
NE
Figure 1 Climate Finance Flows Diagram
2012 (in USD billions)
10
The Landscape of Climate Finance 2012
11
The Landscape of Climate Finance 2012December 2012 December 2012
CO N T E N TS1 INTRODUCTION 1 1
2 METHODOLOGY 1221 Definitions 1222 Analytical focus 1 423 Innovations in this yearrsquos study 15
3 THE CURRENT LANDSCAPE OF CLIMATE FINANCE FLOWS 1 831 Sources and intermediaries 1 832 Intermediaries 3233 Instruments 4334 Disbursement channels 4935 Uses 49
4 CONCLUSIONS AND THE WAY FORWARD 61
INDEX OF ACRONYMS 6 5
GLOSSARY 6 6
REFERENCES 6 8
WEBSITES 7 3
APPENDIX A - MAIN ASSUMPTIONS AND METHODOLOGY 75
APPENDIX B - A SUMMARY OF THE LANDSCAPE 2011 76
APPENDIX C - EXISTING CLIMATE FINANCE TRACKING DATABASES AND MAJOR ONGOING INITIATIVES 7 7
APPENDIX D - DETAILS ON DEVELOPMENT FINANCE INSTITUTIONS 7 9
APPENDIX E - DETAILS ON CLIMATE FUNDS 8 2
APPENDIX F - FINANCIAL FLOWS FOR REDD+ 8 4
10
The Landscape of Climate Finance 2012
11
The Landscape of Climate Finance 2012December 2012 December 2012
1 IntroductionClimate change is a global challenge that requires a global response Failure to comprehend the global context of the financing challenge will undermine our ability to accurately assess whether current investments are on track and made where they can deliver the great-est impacts to limit global temperature rise to below two degrees Celsius To achieve this temperature goal the International Energy Agency projects that incre-mental investment in the energy sector alone will need to reach USD 36 trillion over the period of 2012-2050 ndash or approximately USD 1 trillion each year (IEA 2012)
The aim of this study is to contribute understanding on how much and what type of financial support is avail-able globally to advance action on low-carbon climate resilient development Ultimately building this under-standing is essential for ensuring that governments and investors everywhere have the knowledge and tools to spend their money in ways that optimize prospects for achieving the transition
The first Landscape of Climate Finance published in 2011 (Landscape 2011) was the most comprehensive over-view of the global climate finance landscape to-date This yearrsquos study (Landscape 2012) aims to improve on last yearrsquos estimates and add deeper insight into the nature of global climate finance It provides a more detailed breakdown of flows and sheds light on the latest trends
The Landscape 2012 aims to provide to the extent possible
bull An expanded geographical scope covering flows between developing countries (lsquoSouth-Southrsquo) from developed to developing countries and domestic climate finance flows
bull An expanded coverage of national sub-regional regional and international public actors
bull A more detailed representation of private sector climate finance flows with a better picture of sources and uses
bull An improved representation of climate finance uses by sector (sectoral uses) including flows to adaptation and to reducing emissions from deforestation and forest degradation ldquoplusrdquo the sustainable management and conservation of forests and the enhancement of carbon stocks in developing countries (known as REDD+ schemes) and
bull A better understanding of the recipients and final uses of climate finance both in terms of sectoral uses and of geographical destination
This report has three main sections Section 2 outlines our methodology including key definitions and differ-ences compared to the Landscape 2011 Section 3 the main body describes the current landscape of climate finance flows along their lifecycle from sources through to intermediaries instruments channels and end uses Section 4 summarizes our findings and provides brief recommendations to improve existing climate finance tracking efforts
12
The Landscape of Climate Finance 2012
13
The Landscape of Climate Finance 2012December 2012 December 2012
2 MethodologyThis study the Landscape 2012 aims to capture the most recent annual climate finance flows supporting (1) emis-sion reductions (2) climate resilience and (3) enabling environment projects1
Building upon the Landscape 2011 we adopt a two-dimensional framework for this study First flows are categorized alongside their lifecycle (sources interme-diaries instruments disbursement channels and final sectoral uses geographic destination of recipients) Second flows are categorized depending on whether they originate from public or private sources (see tax-onomy section in the Landscape 2011)
We gathered empirical data on climate finance flows from a wide range of sources (main assumptions and sources are listed in Appendix A and the References section) relying on (1) readily-available data (2) data-sets we analyzed and (3) our own estimates We also drew upon expert opinions to estimate certain flows
21 Definitions
Climate-specific versus climate-related investmentsThe lack of an internationally-acknowledged defini-tion of what qualifies as climate finance or even more narrowly what qualifies as a climate project presents a major challenge to understanding the scale of financial flows there is no established basis for a methodology or measurement system for tracking climate finance flows (Buchner et al 2011ab) This is particularly chal-lenging in the context of adaptation
For the purposes of this study finance flows are limited to lsquoclimate-specific financersquo referring specifically to capital flows targeting low-carbon and climate-resilient development It can have direct or indirect greenhouse gas mitigation or adaptation objectivesoutcomes Note that climate-specific finance excludes a broader set of capital from developed to developing countries that may influence directly or indirectly emissions andor vulnerability to climate change in developing countries
1 ldquoEnabling environment projectsrdquo typically include efforts to strengthen institutions to establish policies regulations or laws and to remove tech-nical legal and administrative barriers to investment The Landscape 2011 included some climate finance targeting enabling environment projects but was not labelled as such The Landscape 2012 instead explicitly cap-tures financing for capacity building and technical assistance measures such as for instance the financing of feasibility studies for projects and the development of local financial institutionsrsquo capacity
and which is typically referred to as lsquoclimate-relevantrsquo finance (see Corfee-Morlot et al 2009 and Buchner et al 2011)
Tangible versus intangible investments In the Landscape 2012 we included to the extent pos-sible (depending on the granularity of data available) only investment flows made toward tangible physical assets like for instance wind farms We excluded to the extent possible investment in measures such as research and development manufacturing or deploy-ment because these might not ultimately result in emission reductions and to reduce the risk of double counting money going to specific emission reductions2
The Landscape 2012rsquos focus on money for emission reductions climate resilience and enabling environment projects in the year 20102011 excludes future commit-ments such as policy incentives (that are not upfront capital grants) or risk management instruments (loan guarantees or insurance policies) The rationale is that we are tracking money actually in the system rather than potential future amounts that may pay for things other than investment costs (eg premiums for green electricity carbon credit purchases payments for loan defaults)3 The objective is to avoid double counting for example the face value of full loan guarantees and loans or discounted expected feed-in tariff payments with the investment cost4 The general roles of current policy mechanisms and risk management instruments are represented in the Climate Finance Flows Diagram 2012 as they play a central role in the investment and financing decision-making process but we do not esti-mate flow values for them
2 Examples such as Chinese solar panels that are deployed in Italy indicate the difficulty in attributing a specific technological breakthrough or spillover effects to RampD expenditures in a given country or year
3 The methodologies used in this report to calculate global finance flows are not intended to imply which (or which proportion) of these contributions to climate finance should count toward the goal to mobilize US 100 billion per year by 2020 to assist developing countriesrsquo climate responses and which (or which proportions) should not Nothing in this report is meant to infer that the goal (of mobilizing US 100 billion per year by 2020 to assist developing countriesrsquo climate responses) has already been achieved
4 Furthermore there is a potential gap between what institutions report at the time of offering risk management instruments (such as the face value of a full or a partial risk guarantee the premium collected on such instru-ments or corresponding accounting provisions) and the actual amount that may be spent in the future
12
The Landscape of Climate Finance 2012
13
The Landscape of Climate Finance 2012December 2012 December 2012
Incremental costs versus investment capitalIncremental cost and investment capital are both important lenses for climate finance flows Incremental cost refers to financial resources provided to compensate for the difference between a less costly more polluting option and a costlier more environmen-tally-friendly andor climate-resilient one Investment capital refers to tangible investment in mitigation or adaptation projects Whereas investment capital is paid back to the investor incremental costs often are not and are thus often funded with public climate funds either through policy support or concessional finance5 Whether incremental costs are covered by public support often make the difference in whether the private sector invests in a project Almost all costs asso-ciated with REDD+ measures are incremental costs
Our work captures mostly investment capital rather than incremental support (see previous sub-section) In order to get to the incremental cost value of emission reductions climate-resilience and enabling environ-ment projects we need assumptions for baselines against which we measure the incremental cost Such baselines are project-specific and would require us to make debatable assumptions on what fair baselines would be More efforts are needed to address this issue in-depth
Gross value versus net valueClimate finance can be measured in terms of lsquogrossrsquo or lsquonetrsquo metrics (AGF 2010)6 The Landscape 2012 focuses on gross flows which reflect the full volume of financial flows delivered through all instruments rather than net flows which provide an indication of the final net contribution of investors and countries Gross flows include money that has to be paid back by recipients ie concessional and non-concessional loans and equity Nonetheless they shed light on the level of mobilized international investments and the net contribution of countries
More efforts are needed to break down contributions by gross or net value As a first step into this direction
5 In the case of energy efficiency the additional upfront costs do need to be paid back but are expected to be compensated with energy savings over time Also they can be paid for by private investors since they do get paid back
6 Under the approach flows would represent the financial flows transferred to countries in any given year (these include grants concessional and non-concessional loans mobilised through the bilateral and multilateral institutions private capital flows and flows from GHG offset projects) Under the approach amounts repaid by the recipient countries would be deducted (eg repayments of loan principal repatriation of capital)
section 35 on climate finance sectoral uses specifies this information whenever available
Mixed reporting yearsOur estimates of climate finance are based on the most recent data available The Landscape 2012 uses a mix of 2010 and 2011 data7
We used different sources of information to map exist-ing flows of climate finance We had a choice of using 2010 data only or reporting 2011 data for a significant part of the Landscape (most importantly Bloomberg New Energy Finance data on private flows) We selected the latter option in order to (1) highlight the most current trends in financing despite reporting delays in some areas and (2) provide consistency from year to year so that the Landscape 2012 picks up where the Landscape 2011 left off Where flows span several years we annualized them to make them compatible with other data sources
Commitment versus disbursement dataWe report committed finance rather than disbursed finance New commitment signifies the concrete commitment of money by the means of a closure of a financing contract board decisions on investment loan award announcements or similar actions Commitment finance does not imply that money will immediately flow as a lump sum to project developers8 There might be a time lag between commitments and disbursement But while disbursement information provides a more accurate picture of actual climate finance flows than commitment information disbursement data is not as universally available9 In addition 20102011 disburse-ment data can reflect commitments spanning several years for projects with long construction periods Disbursement data would therefore require further refinement For these reasons we mostly use commit-ment data in the Landscape 201210
7 Data derived from OECDrsquos Creditor Reporting System Aid Activities data-base (OECD CRS) namely public budget and the EU Institutionsrsquo climate finance data refer to 2010 while the others are all 2011 data or presenting the fiscal year 2011 (eg July 2010-June 2011 depending on the accounting methodologies) Philanthropy data instead refer to 20082009
8 A complicating factor is that there is a range of interpretations of what commitment actually constitutes
9 In ldquoThe German Landscape of Climate Financerdquo (CPI 2012) the granularity of data at the national level allowed the authors to rely on disbursement data to a greater extent
10 Where available we used disbursement figures In the case of Climate Funds we include annual commitments approved for specific projects rather than total pledges to the Funds which are disbursed over a number
14
The Landscape of Climate Finance 2012
15
The Landscape of Climate Finance 2012December 2012 December 2012
Reporting currencyAll the flows in this report have been converted to USD billion when reported in other currencies Appendix A provides more details on the exchange rates used
22 Analytical focus
Project-level primary financingThe gold standard in our analysis is project-level financing data Project-level financing data is as close as we can get to emission reductions enhanced climate resilience and a stronger enabling environment In the instrument section we therefore define ldquoinstru-mentsrdquo as the instruments covering project costs in the reporting year or primary financing instruments We exclude instruments that cover financing costs that is secondary market instruments11 The exception to this rule relates to Development Finance Institutions whose flows can include instruments that cover committed money to a specific sector or actor
Secondary market transactions do not represent new money targeting climate finance but rather money changing hands Focusing on primary tangible invest-ments allows us to more accurately estimate financing that supports low-carbon climate-resilient activities
Finance flowsThis year we have solely captured flows among actors rather than (1) any ownership or claims one actor may have on another and (2) readily-available resources (net income debt secured and shareholdersrsquo equity from prior years)12
The flow-only representation has strong implications on what is being covered and represented in the Climate
of years Likewise for DFIs we include annual commitments ie funds ap-proved for projects in a given budget year (UNEP 2011 presents what dif-ferent BFIs mean as ldquocommittedrdquo funds) Only one organization surveyed provided disbursement data rather than commitments
11 For example consider a project in which a utility invests money from its own balance sheet to finance a new onshore wind farm With our focus on project-level financing we would categorize this investment as balance sheet financing We do not examine where the corporate money is coming from (borrowing programmes on-going activities capital increase or sale of non-strategic assets)
12 In this sense we are also capturing payments (or estimates of payments) for carbon finance
Finance Flows Diagram 2012 (also known as the lsquospa-ghettirsquo diagram) compared to the Climate Finance Flows Diagram 2011 In particular inflows need not match out-flows For example a development bank may have com-mitted USD 3 billion in 2011 even though it only received USD 500 million of aid contribution the same year from public budgets mdash this doesnrsquot mean this bank is par-ticularly good at leveraging money or in the opposite case that it is wasting money because the flows do not capture other ownership and assets By capturing flows in this way we are also able to highlight where money may be sitting with a given actor within the landscape of climate finance
The linearity of the lifecycle of flows is however a simplification Flows are categorized alongside the lifecycle of flows (sources intermediaries instruments disbursement channels and uses recipients) as though the lifecycle was a linear path In reality pathways for finance are more complex and involve (1) feedback loops ie money can go back and forth between differ-ent actors (2) multiple layers and cascades of equity ownership and (3) intermediate layers of instruments eg between government budgets and National Finance Institutions13
Ranges for estimated valuesGiven the uncertainty surrounding some data sources the multiple potential approaches to estimating specific climate finance flows and the lack of agreement on climate finance definitions and boundaries we opted to represent climate finance flows as ranges whenever possible rather than conveying a single-point estimate For example data ranges for renewable energy asset finance depends on data sources for non-domestic money (either Bloomberg New Energy Finance or UNCTAD Foreign Direct Investment data) For the sake of readability the numbers reproduced on the Climate Finance Flows Diagram 2012 correspond to mid-points
13 Depending on where you draw the line you could have many layers of source to instrument to recipient with each recipient becoming a source itself
The Landscape of climate finance focuses on tangible project-level primary financing flows
14
The Landscape of Climate Finance 2012
15
The Landscape of Climate Finance 2012December 2012 December 2012
23 Innovations in this yearrsquos study
Global geographical scopeThe Landscape 2011 focused on climate finance flows from developed to developing countries and included some developing countries and domestic sources although to a limited extent and independent of their origin (domestic money money from other develop-ing countries or from developed countries) To shed more light on where we stand compared to global financing needs to stabilize average temperature to below 2 degrees in the Landscape 2012 we extend the geographical coverage to feature estimates of climate finance flows to and in developed countries (domestic money and money from other developed countries or developing countries) The figures identified in the Landscape 2012 should therefore not be confused with amounts that count towards the USD 100 billion prom-ised by developed countries in the Copenhagen Accord but rather as indications compared to global financing needs to meet the two degrees goal
We categorize actors providing climate finance (lenders investors guarantors etc) as domestic or foreign enti-ties and as hailing from developing or developed coun-tries using the best information available This extended coverage allows us to map both sources and destina-tions more precisely and to compare financing trends in different regions Domestic finance coverage was improved by investigating the contribution of National Finance Institutions
More detailed representation of private sector climate finance flowsWith a more informative categorization of private climate finance flows the Landscape 2012 sheds more
light on private finance flows In the Landscape 2011 private flows were captured in two categories ldquoglobal capital marketsrdquo and ldquoprivate financerdquo In the Landscape 2012 we strove to better categorize private flows The Landscape 2011 ldquoglobal capital marketsrdquo category has been broken down into ldquocommercial financial institu-tionsrdquo ldquoinstitutional investorsrdquo and ldquoventure capital private equity and infrastructure fundsrdquo Likewise ldquoprivate financerdquo was broken down into ldquocorporate actorsrdquo ldquoproject developersrdquo and ldquohouseholdsrdquo
We started from the global private climate finance numbers and broke them down in distinctive geographi-cal and technology subgroups to the extent possible When we could not categorize any further we looked at individual projects from a representative sample and categorized them along three dimensions category of actor geography of origin first degree ndash ultimate degree ownership14
We used these dimensions to create a set of weights and applied those weights to the global numbers to obtain dollar values for different dimensions of the global figures
Extended coverage of public intermediariesThe Landscape of Climate Finance 2012 covers the follow-ing Development Finance Institutions (DFIs)15
bull Four Bilateral Finance Institutions (BFI) French Development Agency with Proparco (AFD) Japan International Cooperation Agency (JICA) KfW Entwicklungsbank and DEG and Overseas Private Investment Corporation (OPIC)
bull Nine Multilateral Finance Institutions (MFI) World Bank International Finance Corporation (IFC) EU Institutions16 European Investment Bank (EIB) European Development Bank for Reconstruction and Development (EBRD) Asian Development Bank (AsDB) African Development Bank (AfDB) Inter-American Development Bank (IDB) and Nordic Development Fund (NDF)
14 In addition to small-scale asset financing we covered 1636 individual proj-ects from the Bloomberg New Energy Finance database representing 82 of the extra capacity in developed countries and 89 of the extra capacity in developing countries (539 GW in total)
15 We opted to refer to the broad group of institutions covered in the report as Development Finance Institutions (DFI) given their development man-dates but we acknowledge that the term DFI is here used with a broad meaning
16 The European Commission and EU Development Fund
The Landscape 2012 improves on the Landscape 2011 by including a broader geographic scope that covers developed as well as developing countries and domestic flows better categorization of the actors involved a better understanding of whatrsquos behind private finance flows and extended coverage of Development Finance Institutions
While this implies that data from Landscape 2012 is not directly comparable to Landscape 2011 it provides more detail and sheds light on how global finance flows match global financing needs to support a low-carbon climate-resilient transition
16
The Landscape of Climate Finance 2012
17
The Landscape of Climate Finance 2012December 2012 December 2012
bull Nineteen National Finance Institutions Brazilian Development Bank (BNDES) Development Bank of Latin America (CAF) Nacional Financiera (Nafin) Fideicomisos Institudos en Relacion con la Agricultura (Fira) Agencia Financiera de Desarollo Development Bank of Southern Africa (DBSA) Indian Renewable Energy Development Agency (IREDA) Banco del Estado de Chile Central American Bank for Economic Integration (BCIECABEI) Bancoldex Colombia Black Sea Trade and Development Bank of Greece (BSTDB) China Development Bank (CDB) Caisse de Depot et de Gestion of Morocco (CDG) Eximbank Indonesia Croatian Bank for Reconstruction and Development (HBOR) Korea Finance Corporation (KoFC) Industrial Development Bank of Turkey (TSKB) Small Industries Development Bank of India (SIDBI) and Vnesheconombank of Russia (VEB)
These institutionsrsquo climate financing data were retrieved from a blend of primary and secondary data sources Sixteen organizations out of the 32 covered in the report provided their data for mitigation and adaptation activi-ties directly by the means of a financial survey
Acknowledging the challenges in determining what qualifies as mitigation or adaptation and to unequivo-cally attribute specific investments to only one of these two themes mitigation and adaptation were broken down by sectors The choice of the sectors was guided and informed by other methodologies and account-ing practices (eg OECDCRS UNEP-SEI 2011) In those cases where respondents provided different sectoral breakdowns the projectcategory description was considered for allocating data against the chosen categories In the presence of activities with multiple objectives (both mitigation and adaptation) this amount was allocated according to the weights of mitigation and adaptation on the given total of climate finance17 To the extent possible data were adjusted to exclude interventions not in line with our definition of climate finance (eg we carved out financing for RampD manu-facturing or lower carbon energy generation projects the latter because they may have included fuel-to-fuel
17 For instance of the USD 96 billion ODA marked as climate finance in the OECD CRS database and not channelled by AFD JICA or KfW USD 42 billion is marked as mitigation only USD 3 as adaptation only and USD 24 billion as both mitigation and adaptation related We allocated the dual purpose money according to the distribution between mitigation only and adaptation only projects (59 vs 41) For DFIs eg in the case of EU Institutions dual purpose money (USD 264 million) was allocated accord-ing to the share of mitigation and adaptation projects (55 vs 45)
switch project such as fuel to gas and coal to gas and fossil fuel based co-generation) We acknowledge the uncertainties associated with what qualifies as climate finance and what does not and the ldquoimmaturityrdquo of some institutionsrsquo tracking and reporting methodolo-gies which affects our understanding on the real magni-tude and nature of the climate finance delivered by these institutions
Extended coverage of sectoral usesThe Landscape 2011 focused on renewable energy While we did our best to capture energy efficiency energy smart technologies and infrastructure industrial processes transportation and other sectors reliable data sources in these fields that fit within our frame-work were limited Some of these missing data sources are now available at national levels and we therefore managed to include a broader sectoral coverage in the Landscape 201218
Note that coverage for climate-resilience is even patchier due to reporting and categorization issues which hamper our understanding of what constitutes adaptation finance
Other changesThe capital boxes in the Landscape 2011 have been recategorized into ldquomarket rate project-level debtrdquo ldquoproject-level equityrdquo and ldquobalance-sheet financingrdquo for the Landscape 2012 We also mapped primary carbon offset flows differently attributing flows directly to the actors involved in the acquisition of primary offsets Apart from these changes several categories have been renamed for the Landscape 2012 government budgets (previous domestic public budgets) Development Finance Institutions including bilateral multilateral and national financial institutions (previous bilateral multilateral agencies and banks) carbon offset finance (previous carbon offset flows) and low-cost project-level debt (previous concessional loans)
18 Note that nuclear was not included in either the Landscape 2011 or in the Landscape 2012 as we could not identify data sources highlighting financ-ing directed to this type of projects None of the DFIs surveyed included in their climate finance reporting financing for nuclear projects nor did donors in their reporting to the OECD DAC
16
The Landscape of Climate Finance 2012
17
The Landscape of Climate Finance 2012December 2012 December 2012
Box 1 ndash The Landscape 2012 compared to the Landscape 2011CPIrsquos Landscape of Climate Finance 2011 represented the first comprehensive review of the global climate finance landscape The study focused on climate finance flows from developed to developing countries with limited coverage of developing countries and domestic sources
Due to divergent definitions and data gaps we faced a number of methodological difficulties some of which we were able to account for (eg double counting of the same flows) others less so (eg differing definitions and time periods)
Based on this methodology we estimated total global climate finance flowing to the developing world at on average USD 97 billion a year in 20092010 Appendix B summarizes the Landscape 2011
When we apply the Landscape 2011 methodology and focus to the Landscape 2012 data to highlight as much comparability among flows as possible total climate finance flows predominantly directed towards developing countries in 20102011 is USD 112 billion The increase is a result of the following main factors
bull a 78 increase in bilateral ODA climate finance flows from developed to developing countries in 2010 compared to 2009 partly reflecting the impact of Fast-Start finance pledges and partly the new OECD Rio marker to track aid targeting climate change adaptation objectives
bull a 47 increase in financial flows from the Multilateral Finance Institutions considered in the Landscape 2011
bull a more than doubling of carbon offset finance reflecting almost doubled issuance of CERs in 2011 compared to 2010 (although there were lower prices) and improved data visibility on ERU issuance
An optimist might suggest that USD 112 billion in climate finance overachieves the USD 100 billion promised by developed countries in the Copenhagen Accord Yet we have to recognize that this might not be correct for multiple reasons mostly related to our scope We aim to provide a comprehensive overview of all the current financial resources for climate change action Consequently not all of the USD 112 billion counts as additional climate finance from what was available prior to the Copenhagen Accord The reality is that while climate finance has increased quickly over the past 10 years a significant share of the USD 112 billion provided in 20102011 was already committed prior to the Accord Further like in the Landscape 2012 the USD 112 billion total includes some developing countries and domestic sources although to a limited extent and considers both incremental cost and investment capital
In other words our climate finance estimates cannot and should not be compared with the USD 100 billion of the Copenhagen Accord The methodologies used in both the Landscape 2011 and Landscape 2012 are not intended to imply which (or which proportion) of these contributions to climate finance should count toward the goal to mobilize USD 100 billion per year by 2020 to assist developing countriesrsquo climate responses Nothing in this report is meant to infer that this goal has already been achieved
18
The Landscape of Climate Finance 2012
19
The Landscape of Climate Finance 2012December 2012 December 2012
3 The Current Landscape of Climate Finance FlowsIn this section we describe how climate finance breaks down along the lifecycle of financial flows from sources to end uses For each stage of global climate finance we aim to highlight the key reasons and motivations for finance flows ranges of finance involved where the money is coming from (geographies specific actors etc) where it is going (geographies specific actors technologies etc) and any issues specific to each life-cycle stage
31 Sources and intermediaries
Current sources of climate finance include
These various sources have multiple connections to each other There is also a strong interrelation between public and private sources of finance
Not captured in these figures are governmentsrsquo direct and indirect shareholdings and lending to private invest-ment structures as well as private contributions to International Financial Institutions (public contributions to Development Finance Institutions are captured only to a limited extent)
In the Landscape 2012 we have highlighted the contribu-tion of several categories of private stakeholders acting in the global landscape of climate finance namely corporate actors project developers households and institutional investors19 The contribution of public and private intermediaries (USD 110 ndash 120 billion) is dis-cussed in section 32
Carbon-related mechanisms Carbon-related mechanisms are comprised of (1) carbon market revenues and (2) all climate-related taxes raised by governments (ranging from explicit and implicit carbon taxes) Money collected from carbon markets and carbon-related taxes flows to government budgets though it is not clear how much is earmarked
19 Potential future sources of climate finance discussed in international forums are not mapped in the Landscape These include revenues from taxation of international aviation and shipping emissions revenues gener-ated by removing fossil fuel subsidies revenues generated by fossil fuel extraction royaltieslicenses revenues from a financial transaction tax (FTT) or allocation of Special Drawing Rights etc
SOURCES amp INTERMEDIARIES ()ANNUAL FLOWS OF DIRECT CLIMATE FINANCE
(2010 2011 USD BILLION)
PUBLIC
Government budgets (5) 160 - 226
Development Finance Institutions (21) 768
bull Climate Funds (lt1) 15
Sub-total public (26) 927 - 993
PRIVATE
Corporate actors (21) 693 - 805
Institutional investors (lt1) gt 06
Project developers (34) 1150 - 1293
Households (9) 323
Commercial financial institutions (10) 307 - 404
Venture capital private equity amp infrastructure funds (1) 24
Sub-total private (74) 2503 - 2855
TOTAL
Total 3430 - 3848bull Sub-total sources (68) 2332 - 2653
bull Sub-total intermediaries (32) 1099 - 1196
The sum of climate finance flows from all sources totals USD 343-385 billion The dominant source is the private sector which provides as much as USD 250-286 billion in climate finance or 74 of total climate finance (out of USD 364 billion on average) Of private actors project developers provide USD 122 billion or 34 of total climate finance while other corporate actors provide USD 75 billion or 21 of total climate finance Contributions from government budgets ranged between USD 16 and 23 billion including direct public investments and north-south aid flows Development Finance Institutions along with Climate Funds provided USD 77 billion
18
The Landscape of Climate Finance 2012
19
The Landscape of Climate Finance 2012December 2012 December 2012Figure 2 - 20102011 clim
ate finance flows (in USD billions)
32
Venture Capital Priva
te E
GENERAL TAX REVENUES
CARBON-RELATED TAXES
CARBON MARKET
REVENUESDEVELOPM
ENT FINANCE INSTITUTIONS
VENTURE CAPITAL PRIVATE EQUITY amp INFRASTRUCTURE FUNDS
$214
$22
$57
$53
$13
$5
$14
$350
DIFFERENT DISBURSEM
ENT CHANNELS
$2$7
$2
$47
$23
$32
$17
$104
$70
$32
POLICY INCENTIVES
RISK MANAGEM
ENT
CARBON OFFSET FINANCE
GRANTS
LOW-COST
PROJECT DEBT
PROJECT-LEVEL M
ARKET RATE DEBT
PROJECT-LEVEL EQUITY
BALANCE SHEET FINANCING
DEBT PORTION
INSTITUTIONAL INVESTORS
PROJECT DEVELOPERS
CORPORATE ACTORS
HOUSEHOLDS
GOVERNMENT
BUDGETS
$19
MITIGATION
ADAPTATION
Notes Figures are indicative estimates of annual fl ow
s for the latest year available 2010 or 2011 (variable according to the data source) Flows are expressed in USD billions
and rounded to produce whole num
bers Estimates spanning m
ultiple years are adjusted to produce annual-equivalent estimates W
here ranges of estimates are available
the mid-point is presented The diagram
distinguishes between lsquoincrem
ental costsrsquo that is fi nancial resources that cover the price di erence between a cheaper m
ore polluting options and costlier clim
ate-friendly ones and do not need to be paid back mdash and lsquocapital investm
entrsquo which are tangible investm
ents in mitigation or adaptation projects that need to be paid
back Categories not representing capital investment or a m
ix of capital investment and increm
ental costs are incremental costs only The group of National Finance Institutions includes
Sub-regional entities Most data presented relates to com
mitm
ents in a given year due to limited availability of disbursem
ent data
COMM
ERCIAL FINANCIAL INSTITUTIONS
AGENCIES
THE C
LIMATE FINANCE FLOW
S DIAGRAM 2012
The Climate Finance Flow
s Diagram 2012 also know
n as the lsquospaghettirsquo diagram illustrates the landscape of clim
ate fi nance fl ows along their
life cycle for the latest year available mostly 2011 The w
idth of the arrows in the diagram represents the relative size of the fl ows
NE
lt$1
MULTILATERAL
NATIONALBILATERAL
NE
NE
NE
NE
NE
NE
$77
CLIMATE FUNDS
NE Not estimated
PUBLIC M
ONEYPRIVATE M
ONEYPUBLIC FINANCIAL INTERM
EDIARIES
PRIVATE FINANCIAL
INTERMEDIARIES
OFFSET M
ONEYCAPITAL INVESTM
ENTCAPITAL INVESTM
ENT AND INCREM
ENTAL COSTS
KEY
FINANCE FOR INVESTORS amp
LENDERS
REDD
SOU
RCES AN
D IN
TERMED
IARIES
INSTRU
MEN
TSCH
AN
NELS
USES
NE
NE
Notes Figures are indicative estimates of annual flow
s for the latest year available 2010 or 2011 (variable according to the data source) Flows are expressed in USD billions and rounded to produce w
hole numbers Esti-
mates spanning m
ultiple years are adjusted to produce annual-equivalent estimates W
here ranges of estimates are available the m
id-point is presented The diagram distinguishes between lsquoincrem
ental costsrsquo that is financial resources that cover the price difference between a cheaper m
ore polluting options and costlier climate-friendly ones and do not need to be paid back mdash
and lsquocapital investmentrsquo w
hich are tangible investments
in mitigation or adaptation projects that need to be paid back Categories not representing capital investm
ent or a mix of capital investm
ent and incremental costs are increm
ental costs only The group of National Finance Institutions includes Sub-regional entities M
ost data presented relates to comm
itments in a given year due to lim
ited availability of disbursement data
20
The Landscape of Climate Finance 2012
21
The Landscape of Climate Finance 2012December 2012 December 2012
SOURCES ESTIMATED VALUE DESTINATIONS
ExtE
rnal
bull Auctioning of European Union Allowances (EUAs) USD 162 billion
bull Auction of allowances on the Regional Greenhouse Gas Initiative (RGGI) USD 017 billion
bull Transaction of Kyoto Assigned amount units (AAUs) USD 024 billion
USD 20 BILLION
Oth
Er ac
tOrs
bull Government budgets USD 20 billion
DESCRIPTION
Proceeds from sales and auctions of carbon assets to cap-and-trade compliance buyers Originate from carbon constrained economic sectors or countries In particular
bull Transactions of Kyoto assets between governmentsbull Sale of carbon allowances to cap-and-trade market participants in Europe and in the US
PRIMARY DATA
SOURCES
bull World Bank State and Trends of the Global Carbon Marketsbull European Energy Exchange (EEX) databull European Commission DG CLIMA
ISSUES AND FUTURE
ANALYSISbull No specific earmarking of the proceeds towards emission reductions projects
for climate finance purposes (ie how much will be spent by governments towards climate finance)
Carbon market revenuesCarbon market revenues comprise proceeds from sales and auctions of carbon assets to cap-and-trade compliance buyers and originate from carbon con-strained economic sectors or countries The current scale of these revenues can be estimated taking into account auctions organized in countries with cap-and-trade systems (most importantly the EU Emissions Trading System) and sales from Assigned Amount Units (AAUs) between countries bound by the Kyoto Protocol The Landscape 2012 figure is identical to the Landscape 2011 but sub-components changed significantly Notably EU ETS prices have come down but corresponding carbon allowances auctioned have increased 50
Carbon-related taxes In 2010 revenues generated by carbon taxation in selected European countries ndash Finland Norway Sweden Denmark Switzerland and Ireland ndash accounted for approximately USD 73 billion (Elbeze and Perthuis 2011) This possibly represents a lower-bound estimate as it does not cover the revenues generated by carbon tax schemes in a number of other jurisdictions such as for instance the Canadian provinces of Quebec and British Columbia the San Francisco Bay Area Air Quality Management District (BAAQMD) or India Australia recently introduced a carbon pricing scheme which came into force in July 2012 while other countries
have planned to introduce one after 2013 (eg South Africa)20
The associated revenues from these programs which are potentially considerable21 are not necessarily ear-marked for climate finance but are often distributed for other purposes Specifically proceeds from carbon taxation can be returned to taxpayers in the form of targeted or lump sum compensation for households and business (eg Switzerland)22 or to reduce income tax (eg Finland) or fund general government budgets (eg Sweden and Norway) in some cases revenues can also contribute to fiscal consolidation to reduce budget deficits (Vivid Economics 2012 Elbeze and de Perthuis 2011) Some countries allocate funds to support envi-ronmental policy measures Denmark for instance has allocated around 40 of carbon tax revenues to
20 The tax base and rates differ considerably between countries Most commonly carbon taxes are placed on fossil fuels such as coal gasoline or natural gas Several European countries combine carbon levies applied to CO2 emissions with resource taxes that is targeting energy consump-tion (eg Denmark Sweden and Finland) The highest rates (USD 150ton of CO2) are paid in Sweden while the lowest (USD 0045ton CO2) in California (Climate Commission 2012 NREL 2009)
21 The European Commission in its proposal for the Energy Taxation Direc-tive estimated that a minimum carbon tax of USD 28 (EUR 20) per ton of CO2 common in all 27 Member States would generate revenues in the order of USD 56 billion (or EUR 40 billion) Estimates are based on total CO2 emission of sectors not covered under the EU ETS scheme (eg households and services transport agriculture small installation) For additional information see EC (2011)
22 Until 2010 Switzerland returned all carbon taxes to households and businesses but since 2011 a third has been spent on financing emission reduction projects (Elbeze and de Perthuis 2011)
20
The Landscape of Climate Finance 2012
21
The Landscape of Climate Finance 2012December 2012 December 2012
support emission reduction projects while 60 is returned to industry Boulder Quebec and BAAQMD also use proceeds to support climate mitigation pro-grams (NREL 2009)
The estimated USD 73 billion is not counted against the total climate finance presented in the Landscape 2012 Our intent is to highlight the contribution of this mecha-nism as a source of finance for government budgets
SOURCES ESTIMATED VALUE DESTINATIONS
bull Taxes levied on households and businesses USD 73 BILLION bull Government budgets USD 73 billion
DESCRIPTIONbull Taxes applied on CO2 or GHG emissions andor on the amount of energy consumed For energy-related taxes only the share
accruing to carbon taxes was retained in the estimate
PRIMARY DATA
SOURCES
bull Elbeze and de Perthuis (2011) based on data from the Ministries of the Environment of the covered countriesbull The European Commission statistical office Eurostat maintains a database covering environmental tax revenues from energya
transport and pollution and resource taxes CO2 taxes are included in the energy taxes category but cannot be differentiatedbull The OECD and the European Environment Agency (EEA) maintain a database on environmentally-related taxesb fees and
charges
ISSUES ANDOR FUTURE ANALYSIS
bull Incompleteness Our estimate covers only selected European countriesbull The portion devoted to climate finance cannot be easily estimated Tax revenues can be distributed in several ways eg
returned to tax payers used to reduce levies from labor or capital or put toward general government budgets Only some countries use carbon-related tax revenues for carbon mitigation programs
bull Tracking gaps A single repository of data or recurrent effort to aggregate figures on carbon tax revenues has not been identified so far
a Energy taxes include those applied on energy products used for stationary (eg coal electricity natural gas fuel oils) as well as transport purposes In 2010 energy taxes levied in the 27 Member States of the European Union amounted to USD 291 billion 18 of the Union GDP (Eurostat 2012 2011a)
b For additional information see the OECDEEA database web page
General tax revenuesIt is challenging to calculate precisely the extent of general tax revenues directed towards climate finance as they generally pass through domestic public budgets before being allocated to particular programs and purposes Given the strong hypothesis that should be applied and in line with the approach adopted the Landscape 2011 report this study refrains from providing an estimate for this source
Evaluating the volume of general tax revenues associ-ated with climate-specific activities would be easier if sources of funding were specifically earmarked to climate change objectives
In Tunisia for instance revenues from a tax levied on the first license registration of vehicles and custom duties on air conditioning equipment are devoted by law to the National Fund for Energy Conservation (FNME) This Fund sustains renewable and energy efficiency measures in the country23 In 2009 in the Tunisian
23 Law 2005-82 Official Printing Office of the Republic of Tunisia
budget around USD 21 million were allocated against the Fund (INS 2010)
Another example can be found in Brazil where the resources collected via the National Fund on Climate Change (FNMC) which is partly financed with a levy on the profits made by the oil industry are earmarked to support mitigation and adaptation projects and studies on climate change and its adverse effects The resources of the Fund can also be used to leverage inter-national public and private climate finance to support the mitigation and adaptation activities laid out in the countryrsquos Policy on Climate Change In 2011 the initial budget of the Fund was estimated for USD 132 million (R$ 226 million) (BNDES 2011 UNDP 2011 BNDESgovbr Brasilgovbr)
22
The Landscape of Climate Finance 2012
23
The Landscape of Climate Finance 2012December 2012 December 2012
Government budgets
Contributions from government budgets are estimated at between USD 16 and 23 billion in 20102011 The estimate includes USD 111 ndash 112 billion of domestic funds for project finance reported in the Bloomberg New Energy Finance database largely origi-nating from developed countries for small-scale invest-ments (USD 28 billion) larger-scale investments (USD 83 billion) and carbon offset finance (USD 01 billion) A large part relates to the US governmentrsquos rsquogreenrsquo economic stimulus packages
The estimate also includes contributions from devel-oped country governments to developing countries of between USD 48 and 114 billion in 2010 excluding reporting of finance channelled through AFD JICA and KfW as discussed below The lower bound of this esti-mate considers only aid marked as ldquoprincipallyrdquo climate change-related in the OECDrsquos Creditor Reporting System (CRS) database The upper bound of the range includes an additional USD 18 billion of money identi-fied in Fast-Start Finance reporting for the same year The range includes bilateral Overseas Development
Assistance (ODA) and Fast-Start Finance commitments in 2010 from 28 OECD countries plus Cyprus Latvia Liechtenstein Lithuania Mata and the UAE Notably no data was available in the sources consulted for OECD countries such as Chile Estonia Hungary Israel Mexico24 or Turkey
For our estimates of government budget contributions we exclude government contributions (including ODA) delivered through national bilateral and multilateral intermediaries and funds due to the current lack of data required to do so across the full range of actors and to avoid double counting with other flows captured separately (see Intermediaries section) Our estimate is therefore conservative and can be considered as a minimum Further discussion on government contri-butions to Development Finance Institutions (DFIs) is included in Box 3 which attempts to highlight the extent of public sector contributions to funding for
24 Mexico is a member of the OECD with DAC observer status Latt (2011) discuss Mexicorsquos role as an ldquoemerging donorrdquo conducting technical and scientific cooperation projects in developing countries to a value of around USD 16 million in 2009
SOURCES ESIMATED VALUE DESTINATIONS
IntE
rnal bull Carbon market revenues USD 2 billion
bull Carbon taxes USD 73 billionbull General tax revenues NE
USD 16-23 BILLION In
stru
mEn
ts an
d usE
s
bull Policy incentives NEbull Risk management NEbull Carbon offset finance USD 01 billionbull Grants USD 42 ndash 99 billionbull Low cost debt USD 59 ndash 65 billionbull Project-level market rate debt USD 02 billionbull Project-level equity USD 02 ndash 05 billionbull Balance sheet financing USD 54 billion
Usesbull USD 149-182 billion mitigation bull USD 1-44 billion adaptation
ExtE
rnal
bull Changes in net debt from third-party NE
OthE
r act
Ors
bull Development Finance Institutions NEbull Climate Funds NEbull Ownership of other actors of the landscape NE
DESCRIPTIONDomestic and international government climate finance expenditures fed by conventional tax revenues ownership earnings or sovereign bond issuance as well as in some cases revenues raised from carbon pricing mechanisms
PRIMARY DATA
SOURCES
bull OECD Development Database on Aid Activities Creditor Reporting System bull Fast Start Finance Reporting to the UNFCCCbull Bloomberg New Energy Finance database
ISSUES AND FUTURE
ANALYSIS
There is a lack of information on the extent of government contributions to Development Finance Institutionsrsquo climate finance as well as domestic and developing country sources of climate finance General budget support is by definition not earmarked in any way but may be another source of climate finance not currently tracked
Note Carbon market revenues and taxes while included in this table are discussed in detail in previous sections and tables
22
The Landscape of Climate Finance 2012
23
The Landscape of Climate Finance 2012December 2012 December 2012
low-carbon climate-resilient development in recent years in spite of fiscal austerity and the tightening credit context
Indeed if we were to include these amounts we see that more than half ndash USD 116 billion of USD 23 billion ndash of bilateral ODA commitments in 2010 were reported as being delivered by just three Bilateral Finance Institutions (AFD KfW and JICA) We also see that climate-related bilateral Official Development Assistance grew from USD 95 billion in 2009 to an estimated USD 23 billion in 2010 reflecting the impact of Fast-Start finance pledges which we estimate accounted for around 36 of Official Development Assistance in 2010 as well as the introduction of the marker for adaptation finance in the OECD CRS data-base The top providers of bilateral ODA were Japan Germany France and the United States
Export credits which support export transactions by hedging risks for investors are excluded from our esti-mate of government contributions because the instru-ments may not be called upon and may not therefore represent a true flow They may however play a key role in stimulating private low-emission investments in developing countries (see Instrument section for further information)
Grants (USD 42-99 billion) low-cost debt (USD 59-65 billion) and ldquobalance sheetrdquo financing of owned emission reductions projects (municipalities public schools military installations etc) (USD 54 billion) are the most common forms of financing provided using government money Flows to policy incentives and risk management instruments are expected to be very large but are not quantified in the study
We find that 64-72 of that deployment occurs in developed countries and 28-36 in developing countries
a American Reinvestment and Recovery Act grants Georgia Environmental Finance Authority grants Voluntary Airport Low Emission grants State of Pennsylvania solar program grants Rhode Island Economic Development Corporation grants etc
ExampleThe US Governmentrsquos many roles in solar project financing include (1) federal and state-level policy incentives to promote the renewable energy deployment (2) risk management instruments such as US Department of Energy partial or full loan guarantees (3) project-specific grantsa and (4) low cost debt such as the US Department of the Treasuryrsquos Federal Financing Bank loans to some of the largest projects financed in 2011 These various roles highlight the diversity of financing instruments available
24
The Landscape of Climate Finance 2012
25
The Landscape of Climate Finance 2012December 2012 December 2012
Box 3 The role of Development Finance Institutions Development Finance Institutions play a complex and crucial role in the climate finance landscape operating as a pivotal link between public and private finance
Preliminary investigation of the ownership structure of private investments mapped in the climate finance landscape indicates that a large portion of these investments could be classified as governmentsrsquo direct and indirect shareholdings in and lending to private investment structures (see Box 5 for more information) Public finance institutions add significant value to financing packages by subsidizing interest rates transforming the maturity of loans to long-term and absorbing a share of the risks of the loans handed out to the private sector Without public backing many of these packages would be unviable
Likewise government backing of Development Finance Institutions underpins their ability to raise funds and provide a range of instruments specially tailored to the delivery of low-emissions climate-resilient finance
The ownership structure of DFIs is typically dominated by nationalmember governments that initially capitalized the institutionsrsquo capital base and govern their activities
Net budget inflows to Development Finance Institutions in a given year on the other hand are mainly driven by their own financial activities (for instance their equity holdings and earmarked returns on investments) and finance raised on capital markets andor borrowings from governments With high financial security profiles (AAA credit rating) DFIs are able to refinance their activities via very low interest rate bonds
Also thanks to their capital structure and high financial security DFIs can deliver a range of concessional and non-concessional instruments to finance investments in developing countries Budget inflows may also include specific grant contributions from governments or trust funds that can either be passed on directly or used to further soften lending conditions (the grant element) of low-cost debt in order to deliver loans with deep concessions adapted to recipient needs eg poor financial capacity or for projects with long-term economic returns The average level of grant element in concessional loans provided by DFIs varies considerably depending on institutional mandates
Given the complexities laid out above this study does not yet provide an estimate of the level of government contribution to DFIs The foremost difficulty encountered relates to quantifying the costs to governments of absorbing the risks associated with backing DFI activities In terms of budget flows on the other hand transparent reporting is not always available due to confidentiality requirements and the fact that finance is disbursed over a period of years rather than at the time of commitment also presents difficulties
Discussions with just three DFIs included in this study suggest average grant elements of concessional loans of between 12 and 20 but with a range up to 70 for individual loans with deep concessions If we were to assume that all grants are provided using 100 contributions from government sources and an average grant element contribution from governments to low-cost debt of 17 we would estimate a contribution of government budgets to all DFI activities captured in the Climate Finance Flows Diagram 2012 of USD $10924 million (15 or 17 leverage) This estimate is not included in the Climate Finance Flows Diagram 2012 at present due to the lack of detailed information available for the full range of institutions included in the study and the difficulties outlined above
Thus while annual government budget contributions to DFIs may be relatively low finance provided by DFIs is generally considered to be public For example in the case of bilateral ODA according to the OECD DACrsquos reporting directives where ldquoOfficial transactions are [defined as] those undertaken by central state or local government agencies at their own risk and responsibility regardless of whether these agencies have raised the funds through taxation or through borrowing from the private sectorrdquo
24
The Landscape of Climate Finance 2012
25
The Landscape of Climate Finance 2012December 2012 December 2012
Box 4 ndash Supporting Renewable Energy in the US
US federal tax incentives cash grants and loans sustained a boom in renewables investment through the depths of the worst financial crisis since the Great Depression
The US public and private sectors invested a total of USD 143 billion in renewable energy projects and installed 34 GW of new solar and wind capacity between 2008-2011 ndash with over USD 50 billion and 9 GW in 2011 alone While the bulk of the financing for these projects came from the private sector growth was underpinned by stable renewable deployment support policies at both the state and federal level
With relatively low US electricity market prices most renewable projects built over the last four years would not have attracted investors without additional support from governments or ratepayers Aggressive long-term state-level renewable energy obligations (such as Californiarsquos requirement that 33 of its electricity be generated from non-hydroelectric renewable energy sources by 2020) have driven demand However as the recession squeezed state and ratepayer budgets federal government supports became more important
Prior to the financial crisis two primary federal policies were available ndash a USD 22MWh production tax credit for wind and a 30 investment tax credit (ITC) for solar But tax incentives require substantial and predictable tax liabilities from profits to be useful ndash and once the crisis hit these were in short supply Twenty or so large financial firms had provided over USD 6 billion in tax equity financing for renewable projects in 2007 About half of them ndash including AIG Lehman Brothers Citi and John Hancock ndash had exited the tax equity market by 2009 Further the financial crisis left banks less willing and able to provide long-term low-cost debt for capital-intensive projects such as wind and solar farms
The US economic stimulus in early 2009 addressed these issues Instead of tax credits wind and solar projects starting construction by the end of 2011 could choose a 1603 Cash Grant equal to 30 of eligible project costs So far the program has provided USD 13 billion (USD 47 billion in 2011) to support renewable investment The federal government also offered direct federal loans and partial guarantees of private loans to address tightness in debt markets a total of USD 86 billion in direct loans (USD 7 billion in 2011) and USD 57 billion in partial guarantees (USD 42 billion in 2011) to date
These and other measures leveraged enough private investment to double US non-hydroelectric renewable energy generating capacity in four years And as the financial crisis has eased the tax equity market has recovered hitting the $6 billion level in 2011
The two stimulus programs ended in 2011 and the production tax credit for wind expires at the end of 2012 The cost of extending the production tax credit now stands as a significant barrier to continued renewable energy growth However there are ways to make these important federal policies more cost-effective Policies that expand the pool of investors could reduce costs for developers and for taxpayers CPI work suggests that replacing the current tax incentives with smaller cash incentives could provide the same benefits to projects at just over half the cost to government
Prepared by Uday Varadarajan (CPI San Francisco udayvaradarajancpisforg)
Based on Varadarajan et al ldquoSupporting Renewables while Saving Taxpayers Moneyrdquo CPI Report (2012)
26
The Landscape of Climate Finance 2012
27
The Landscape of Climate Finance 2012December 2012 December 2012
Corporate actorsIn the Landscape 2012 we have been better able to high-light the contribution of corporate actors in the global landscape of climate finance We find that corporate actors contributed 21 of global climate finance Corporate actors unlike project developers do not sell green electricity or related products and services We identified two main categories of corporate actors
First some non-energy corporate actors are eager to deploy emissions reduction assets to reduce their energy bills or meet voluntary commitments These include technology companies (eg Google) and com-panies with large warehouses installations or factories (eg IKEA) The estimate of contributions from non-energy corporate actors includes a very large share of small-scale renewable energy (solar PV and solar water heating amp cooling) of more than USD 51 billion Sometimes the investor is an industrial conglomerate for which it is hard to be able to identify a specific set of activities Apart from investing in emissions reduction
projects some of these corporate actors might be required to comply with GHG emissions cap-and-trade scheme allowing for the use of offsets
Second some manufacturers of (renewable) energy systems financed the deployment of their own systems (pilot amp demonstration plants vendor financing etc) Examples include wind turbine manufacturers (such as Chinarsquos Goldwin and Spainrsquos Gamesa) solar PV and thermal systems manufacturers (Japanrsquos Sharp Spainrsquos Gestamp USArsquos MEMC Indiarsquos Moser Baer and Chinarsquos CHINT Group) and electricity generation technology providers (USArsquos GE financial services Indiarsquos Crompton Greaves and South Korearsquos Samsung CampT Corp)
We find that 80-93 of corporate actorsrsquo contributions are sourced domestically 6-14 in other developed countries than the emissions reduction project host country and the remaining 2-6 in other developing countries than the emissions reduction project host country (technology developers notably) We find that
SOURCES ESTIMATED VALUE DESTINATIONS
IntE
rnal bull Reinvested earnings from recurrent and exceptional
income NEUSD 693 ndash
805 BILLION
Inst
rum
Ents bull Carbon offset finance USD 12 billion
bull Project-level market rate debt USD 15 ndash 26 billionbull Project-level equity USD 15 ndash 26 billionbull Balance sheet financing USD 650 ndash 741 billion
ExtE
rnal bull Changes in net debt and equity from third-partya
NE
OthE
r act
Ors
bull Ownership of other actors of the landscape NE
DESCRIPTIONCorporate actors whose activity cannot be categorized as ldquoproject developersrdquo comprised of
bull Non-energy corporate actorsbull Manufacturers of renewable energy systems
PRIMARY DATA
SOURCES
bull Bloomberg New Energy Finance and UNCTAD FDI databull Frankfurt School - UNEP Collaborating Centre for Climate amp Sustainable Energy Finance Global Trends in Renewable Energy
Investment 2012bull REN21 Renewables 2012 ndash Global Status Reportbull Weiss amp Mauthner Solar Heat Worldwide report (edition 2012)bull Ecosystem Marketplace State of the Voluntary Carbon Markets Report
ISSUES AND FUTURE
ANALYSIS
bull Motivation for investment The main driver for investment (energy savings opportunism synergies with other corporate activities promoting own technologies etc) is not always clear
bull Access to capital Sometimes corporate money helps overcome difficulties in accessing more traditional sources of capital such as banks
bull Definitional issues Boundaries with households can be difficult to delineate in the case of small family-based corporate actors Likewise geographical origin of corporate actors can be hard to identify in the case of multinational groups
a This corresponds to the net value of debt raised minus debt repaid for a given year This relates to commercial financial institutions mostly Please note that other actors of the landscape such as institutional investors can be interested in corporate debt issues (bonds medium-term notes etc) as an investment vehicle The same logic is applied to changes in net equity
26
The Landscape of Climate Finance 2012
27
The Landscape of Climate Finance 2012December 2012 December 2012
13-22 of the corporate actorsrsquo money went to devel-oping countries and 78-87 went to developed coun-tries (notably small scale PV in Italy and Germany)
ExampleIn 2009 Ferrari installed a rooftop PV system at one of its factories in Italy Large warehouses such as those for automotive factories are natural candidates for laying out solar panels on rooftops (General Motors did the same for one of its factory in Spain in 2008 with a total capacity of 12 MW) The main motivation is energy savings (expected savings of 200000 kWh per year) and potential return from installing a rooftop PV system Investment money was sourced from Ferrarirsquos own balance sheet and revenues and would be used to pay for the system and its installation
ExampleSiemens Financial Services and Siemens Bank the lending arms of the German technology manufacturer Siemens would be categorized as corporate actors Money would be sourced from the company balance sheet of parent companies and from their own revenues Money is then lent against projects using Siemens wind turbines For instance Siemens Financial Services provided a share of project-level market rate debt to the 272 MW Seigneurie de Beaupre onshore wind farms in Canada and phase I of the 288 MW Meerwind Sud und Ost offshore wind farm in Germany last year
28
The Landscape of Climate Finance 2012
29
The Landscape of Climate Finance 2012December 2012 December 2012
Institutional investors We find that the direct contribution of institutional investors to emissions reduction projects is in excess of USD 620 million for the year 2011 This number seems low compared to expectation but given the lack of trans-parency on institutional investorsrsquo involvement the fact that our representative sample excludes many countries where institutional investors have been active these last years (notably some North European countries) and our focus on primary equity stakes and not stakes taken in projects already running (secondary market transac-tions representing only money changing hands) this appears as a reasonable lower bound
In 2011 institutional investors have been active on both the debt and equity side For example on the debt side25 US insurance company Metlife provided debt to US onshore wind (EnXco Lakefield) and US solar (Webberville PV Plant) projects In Canada the Great-West Life Assurance Company and Ontario Pension Board provided debt to Sprott amp Firelight Amherst wind farm On the equity side Allianz and Munich Re invested in European solar and wind assets while Brazilrsquos workersrsquo severance fund provided equity to more than 200 MW of domestic onshore wind projects
25 Whenever project bonds have been issued (US solar projects) therersquos a possibility that institutional investors purchased such issues and therefore contribute to providing debt to emissions reduction projects
We find that nearly 37 of institutional investorsrsquo contributions are sourced domestically and the remain-der in developed countries other than the project host country We find that approximately 11 of institutional investorsrsquo money went to developing countries and 89 to developed countries (Europe and the US)
SOURCES ESTIMATED VALUE DESTINATIONS
IntE
rnal bull Reinvested earnings from recurrent and exceptional
income NEgt USD 06 BILLION
Inst
rum
Ents bull Project-level market rate debt gt USD 02 billion
bull Project-level equity gt USD 02 billionbull Balance sheet financing gt USD 02 billion
ExtE
rnal
bull Changes in net debt and equity from third-party NE
OthE
r act
Ors
bull Ownership of other actors of the landscape NE
DESCRIPTION
Theyrsquore comprised ofbull Insurance companiesbull Pension fundsbull Foundations amp endowments
PRIMARY DATA
SOURCESbull Bloomberg New Energy Finance and UNCTAD FDI data
ISSUES AND FUTURE
ANALYSIS
bull Improving coverage a more systematic and in-depth tracking of contributions to the landscape will be useful as more deals (both on the debt and the equity side) involve institutional investors
bull Indirect investment channels institutional investors also invest in emissions reduction projects via infrastructure amp private equity funds
bull Improving definitions distinguishing by sub-categories of institutional investors as they have different objectives and constraints
28
The Landscape of Climate Finance 2012
29
The Landscape of Climate Finance 2012December 2012 December 2012
Project developersWe highlight project developer contributions in the Landscape 2012 and find that they contributed 34 of global climate finance
We define project developers as dedicated entities with the ability to design commission and operate and maintain emissions reduction projects These include power and gas utilities and independent power produc-ers (Spainrsquos EDP Francersquos EDF US Duke Energy China Datang and Guodian for instance) energy companies (Francersquos Total UKrsquos BP or Brazilrsquos Petrobras) and engineering procurement construction contractors and independent developers of projects (NRG Energy in the US smaller Spanish and Italian project developers)
We find that 83-94 of project developersrsquo contri-butions are sourced domestically 6-16 from other developed countries other than the emissions reduc-tion project host country and the remaining 0-1 from other developing countries other than the emissions reduction project host country We find that 50-56 of the project developersrsquo money went to developing coun-tries and 44-50 went to developed countries
SOURCES ESTIMATED VALUE DESTINATIONS
IntE
rnal bull Reinvested earnings from recurrent and exceptional
income NEUSD 1150 ndash
1293 BILLION
Inst
rum
Ents bull Carbon offset finance USD 12 billion
bull Project-level equity USD 164 ndash 184 billionbull Balance sheet financing USD 974 ndash 1097 billion
ExtE
rnal
bull Changes in net debt and equity from third-party NE
OthE
r act
Ors
bull Ownership of other project developers NE
DESCRIPTION
Emissions reduction project developers includingbull Dedicated project developers amp EPC contractorsbull Utilities and independent power producersbull Energy companies
PRIMARY DATA
SOURCES
bull Bloomberg New Energy Finance and UNCTAD FDI databull Frankfurt School - UNEP Collaborating Centre for Climate amp Sustainable Energy Finance Global Trends in Renewable Energy
Investment 2012bull REN21 Renewables 2012 ndash Global Status Reportbull Weiss amp Mauthner Solar Heat Worldwide report (edition 2012)bull Ecosystem Marketplace State of the Voluntary Carbon Markets Report
ISSUES AND FUTURE
ANALYSIS
bull Definitional issues The boundaries of specific sub-categories and potential overlap with corporate actors (conglomerates for instance) needs to be easier to identify to better understand underlying drivers for investment
bull Non-energy projects the contributions of non-energy project developers is hard to assess
ExampleNRG Energy is a US project developer that has deployed roughly 15 GW of solar PV capacity in the US in 2011 directly and via its subsidiaries NRG Energy is able to invest thanks to its expertise own resources and ability to secure project finance and attract external equity investors (such as MidAmerican Energy Holdings Co) for its larger projects
Likewise EDF a French energy grouppower and gas utility invested in solar and wind projects throughout the world in 2011 (US Germany etc) directly and via its subsidiaries (EDF Energies Nouvelles EnXCo Inc etc) Money comes from its own resources and project-level financing (tax equity arrangement in the US for instance)
30
The Landscape of Climate Finance 2012
31
The Landscape of Climate Finance 2012December 2012 December 2012
Households Households represent a source of money that we did not explore in the Landscape 2012 We define house-holds as (1) family-level economic entities (2) high net worth individuals and (3) their intermediaries whether they are family offices investing on their behalf or dedi-cated foundations operating philanthropic programs Their money stems from income and savings including inherited or entrepreneurial wealth They are also able to borrow to invest into emissions reduction assets or support such investment via grants We find that households contributed 8-10 of global climate finance
SOURCES ESTIMATED VALUE DESTINATIONS
IntE
rnal
bull Income and savings NE
USD 323 BILLION
Inst
rum
Ents bull Grants USD 02 billiona
bull Carbon offset finance lt USD 01 billionbull Balance sheet financing USD 321 billion
ExtE
rnal
bull Changes in net debt NE
OthE
r act
Ors
bull Ownership of other actors of the landscape NE
DESCRIPTIONHouseholds and wealthy individuals involved in philanthropy and their intermediaries (family offices and dedicated foundations)
PRIMARY DATA
SOURCES
bull Bloomberg New Energy Finance and UNCTAD FDI databull Frankfurt School - UNEP Collaborating Centre for Climate amp Sustainable Energy Finance Global Trends in Renewable Energy
Investment 2012bull REN21 Renewables 2012 ndash Global Status Reportbull Weiss amp Mauthner Solar Heat Worldwide report (edition 2012)bull Ecosystem Marketplace State of the Voluntary Carbon Markets Report
ISSUES AND FUTURE
ANALYSIS
bull Householdsrsquo contribution is hard to measure Figures are estimates onlybull Sources of finance for households need to be better understoodbull The contribution of households in the field of energy efficiency and electric vehicles investments is not measured here
a This relates to philanthropy and is discussed in the dedicated instrument section
Householdsrsquo asset finance ndash USD 323 billion ndash cor-responds 993 to small scale installations USD 226 billion of solar PV in developed countries and USD 79 billion of solar thermal heating and cooling in devel-oping countries (mainly China) are the largest con-tributors A small share of householdsrsquo contribution to climate finance flows in 2011 relates to grants from US and European philanthropic programmes and an even smaller portion of it relates to voluntary carbon offsetting
As expected all of householdsrsquo contributions were sourced domestically We find that 75 of the house-holdsrsquo contributions were in developed countries and 25 were in developing countries
30
The Landscape of Climate Finance 2012
31
The Landscape of Climate Finance 2012December 2012 December 2012
Box 5 - Who actually sits behind the moneyIn the Landscape 2012 we explored who actually ldquosits behindrdquo climate finance actors That is a project developer can actually be the subsidiary of an entity located in another country or categorized as an actor The ldquoproject developersrdquo category is the one for which this information is most interesting and revealing The impact of such re-categorization is explored in more detail in the uses section of this report In particular we find that
bull Close to USD 410 billion of 2011 project developers investment flows (31-35) could be categorized as domestic public budget instead The largest contributor to this phenomenon is Peoplersquos Republic of Chinarsquos direct and indirect ownership of solar wind waste and biomass project developers
bull Close to USD 60 billion of 2011 project developers investment flows (around 5) is actually funded by (in almost equal parts) (1) venture capital private equity and infrastructure funds on the one hand and (2) corporate actors on the other hand
ExamplesChange in the geographical origin of money - In 2011 EDP Renewables North America LLC financed three onshore wind farms in the US for a cumulative capacity of close to 600 MW Categorizing the project based on first degree ownership implies that project has been financed by a domestic project developer As we dig into the cascading ownership structures of the equity holders and categorize the project based on the ultimate ownership we determine that project has been actually financed by a foreign project developer1
Change in the type of actor ndash In 2011 China Datang Corp Renewable Power Co Ltd financed more than 15 GW of onshore wind farms in mainland China At first sight we would categorize the equity holder of the project as a domestic project developer It turns out that the developer is owned by one of the large state-owned power generation entities and therefore should be categorized as being financed by the Chinese domestic public budget2
1 EDP Renewables North America LLC is owned by EDP Renovaveis SA (Spain) in turn owned by EDP - Energias de Portugal SA (Portugal)2 China Datang Corp Renewable Power Co Ltd is owned by China Datang Corp which is held by the State-owned Assets Supervision amp
Administration Commission of the State Council (SASAC) the Peoplersquos Republic of China holding for State-Owned Entities (SOEs)
32
The Landscape of Climate Finance 2012
33
The Landscape of Climate Finance 2012December 2012 December 2012
32 Intermediaries
finance flows of the last two in particular were partially captured and the category not specifically featured in the Landscape 201127
While until recently the role played by NFIs and Sub-Regional Development Banks in the climate finance architecture has received limited attention international donors are increasingly aware of their privileged position in knowledge of and relationship with local markets This increased international focus the International Development Finance Clubrsquos (IDFC) mapping initiative (Ecofys-IDFC 2012) and their direct disclosure of data made it possible to gather more detailed information about NFIsrsquo and Sub-Regional Banksrsquo climate finance flows and have lent visibility to their contribution to a wide range of climate-compatible activities
Although we have more information on intermediariesrsquo climate finance than we did in the Landscape 2011 our estimate still represents an incomplete figure due to the partial reporting28 of some entities and our inability to capture other playersrsquo flows due to data constraints
27 The Landscape 2011 included the Brazilian BNDES IREDA and the China Development Bankrsquos climate financing featuring these entities among Bilateral Finance Institutions This year we have broaden the coverage capturing a wider range of National players as well as Sub-Regional ones such as the Development Bank of Southern African (DBSA) the Develop-ment Bank of Latin America (CAF) and the BCIECABEI Central American Bank for Economic Integration See Appendix D for details
28 A number of MDB s currently engaged in a joint initiative aimed at harmonizing mitigation and adaptation finance reporting did not disclose their adaptation finance data as yet The Joint MDB Report on Mitigation
INTERMEDIARIES ANNUAL FLOWS OF DIRECT CLIMATE FINANCE(2010 2011 USD BILLION)
PUBLIC
Development Finance Institutions (67) 768bull National and Sub-Regional Finance Institutions (37) 427a
bull Bilateral Finance Institutions (10) 113bull Multilateral Finance Institutions (18) 212bull Climate Funds (1) 15
Sub-total public (67) 768
PRIVATE
Commercial financial institutions (31) 307 - 404Venture capital private equity amp infrastructure funds (2) 24Sub-total private (33) 331 - 428
TOTAL Total 1099 - 1196
Note To avoid double counting only USD 15 billion of the USD 25 billion Climate Fund money is included in the total Climate Finance (we excluded developed to developing countries bilateral funds which we assume are accounted for in bilateral reporting in the OECD-CRS database) We acknowledge that Climate Funds are not generally associated to Development Finance Institutions here are included in this category as typically managed by DFIs or operating in closed relationship with thema Total National and Sub-regional institutionsrsquo climate financing differs from that presented in the Ecofys-IDFC report (2012) See Appendix D for details
Public and private financial institutions play an important role in climate finance flows raising and channelling USD 110-120 billion of global climate finance Public intermediaries such as Multilateral Bilateral National and Sub-Regional Development Banks distribute USD 768 billion or about two-thirds of these resources
The Landscape 2012 seeks to present a comprehen-sive picture of public and private intermediaries While several initiatives track climate finance that flows through public intermediaries there is less informa-tion about climate finance distributed through private intermediaries Their engagement is critical to identify and finance climate projects particularly small-scale ones thereby to unlock private resources and scale-up finance26
Public sector intermediariesDevelopment Finance InstitutionsIn the Landscape 2012 the public intermediaries cat-egory covers a broad range of Development Finance Institutions (DFIs) including Multilateral Bilateral Sub-Regional and National Finance Institutions The climate
26 The San Giorgio Group ldquoProsol Tunisiardquo case study presents insights on this aspect See Trabacchi et al (2012) See also for instance the Turkish Sustainable Energy Finance initiative established by EBRD to help drive the transformation in the private banking sector in supports of small and medium sized energy efficiency and renewable energy investments For more information see (Ebrdcom and Tursefforg)
32
The Landscape of Climate Finance 2012
33
The Landscape of Climate Finance 2012December 2012 December 2012
UN agencies as well as countriesrsquo cooperation agen-cies are also active intermediaries in the climate finance architecture29 the flows managed and distributed by these entities have not been included in this section to avoid double counting Their resources ndash the portion complying with ODA criteria and hence reported in the OECD-CRS database ndash are in fact captured in the Governmentsrsquo budgets data An ad-hoc study should be pursued to highlight their actual contribute which typically goes beyond pure intermediation By working closely with recipient governments on national strate-gies and policy frameworks conducive to investment in fact these entities help develop demand for climate finance (AGF 2010) With the objective to enhance the effectiveness of their actions DFIs often partner with these agencies to coordinate interventions
The resources raised and channelled by DFIs can be both of public and private nature DFIs in fact do not only operate through public budget resources (ie direct contributions from donor countries) but can also raise funds on the capital markets reinvest earnings and mobilize additional funds through co-financing (either from commercial banks financial institutions develop-ment partners or other international finance institu-tions) This allows them to support investments that are much greater than public funds can provide alone
Sources of finance vary from bank to bank depend-ing on their structure and mandates30 It is difficult to determine the portion of public budgets flowing to DFIs each year in the pursuit of development coopera-tion activities or specific mandates It is also difficult to quantify how much global capital markets contribute
Finance 2011 (IDB et al 2012) released for Rio+20 provides preliminary insights on the methodology developed and the resulting mitigation figures A new version of the report with revised and more disaggregated data is planned to be released at COP 18 in Doha The release of a report describing the jointly agreed methodology for adaptation is also planned at the same time
29 Agencies like DIFID NORAD and USAID in 2010 channelled possibly up to USD 96 billion of the bilateral climate-marked aid featured in the OECD CRS database (OECD 2010) They also played a role in the delivery of Fast-Start Finance USAID for instance serviced 27 of the US Fast-Start Finance over the FY20102011 (Fransen 2012)
30 For instance the International Development Association (IDA) ndash the larg-est multilateral channel of concessional financing to the poorest countries ndash is largely funded through donor contributions The International Bank for Reconstruction and Development (IBRD) on the other hand obtains most of its funds by issuing bonds in international capital markets In addition to general bond issuance some institutions have also initiated the issuance of climate themed bonds so called ldquogreen bondsrdquo The World Bank Group for example has issued over USD 33 billion in green bonds since the inaugural issue in 2008 (Treasuryworldbankorg)
to DFIsrsquo climate financing in a given year Clarifying this could shed light on the extent of the so-called ldquoleverage effectrdquo exerted by these entities to public money
Box 3 on government contributions to DFIs presents additional insights on this aspect
National Finance InstitutionsThe NFIs category in the Climate Finance Flows Diagram 2012 reflects a variety of players including
bull Some of the largest National Development Banks such as the Brazilian BNDES31 and the Chinese Development Bank (CDB) which contribute more than 80 of NFIsrsquo finance
bull Sub-Regional Development Banks like the Development Bank of Latin America (CAF) and
bull Relatively smaller players such as the Mexican Nacional Financiera (NAFIN) whose involve-ment and expertise in the climate finance arena are growing rapidly
With 427 billion32 NFIs represented around 567 of the total climate finance distributed by public actors (DFIs) in 2011
Although diverse and at various stages of institutional readiness for climate finance NFIs have key charac-teristics in common They bridge critical funding gaps perform in areas underserved by the private sector and implement national strategies set by their governments By partnering with MFIs andor BFIs National enti-ties can acquire relevant experience in the preparation risk assessment evaluation and monitoring of climate projects33
NFIs can have general mandates to foster broad eco-nomic and social development objectives or they can have mandates focused on specific niches ndash such as financing small- and medium-sized enterprises encour-aging infrastructure development or supporting a countryrsquos agribusiness sector (IDFC 2012)
31 In 2011 BNDES had a capital base of nearly USD 33 billion (BNDES 2012b)32 Data refers to funds committed in 2011 except for one institution that
reported its annual disbursement instead of commitments To minimize potential double counting the climate finance flows of the Indian Renew-able Energy Development Agency (IREDA) were reduced by 40 since as reported in IREDA (2012) the institutionrsquos resource base for 20102012 draws approximately 40 on international assistance
33 For instance the Sustainable Project Directorate of NAFIN ndash the bankrsquos unit dedicated to support climate-related projects received technical assistance from the World Bank and uses its methodology and manuals to manage the risks associated with renewable energy projects (IDB 2011)
34
The Landscape of Climate Finance 2012
35
The Landscape of Climate Finance 2012December 2012 December 2012
SOURCES ESTIMATED VALUE DESTINATIONS
IntE
rnal
bull Proceeds from operations NEUSD 753 BILLION In
stru
mEn
ts an
d usE
s
bull Risk management NEa
bull Carbon offset finance USD 007 billionbull Grants USD 401 billionbull Low-cost debt USD 466 billion bull Project-level market-rate debt 234 billionbull Project-level equity USD 037 billionbull Balance sheet financing USD 078 billionb
Usesbull USD 644 billion mitigation (86)bull USD 109 billion adaptation (14)
Oth
Er a
ctOr
s bull Public finance institutions bull Commercial financial institutionsbull Funds (eg climate funds carbon funds venture
capital and private equity funds)c
bull Ultimate beneficiaries
ExtE
rnal bull Public Budgets NE
bull Capital markets NEbull Other Development Finance Institutionsd
DESCRIPTION
The Development Finance Institutions featured in this study include bull National Finance Institutions (NFIs) ie entities typically owned funded and governed by a single national government with
local development mandates The climate finance flows of this players also include Sub-Regional Development Banks ie those generally supported by a group of countries in the pursuit of sub-regional mandatese
bull Bilateral Finance Institutions (BFIs) ie an individual country with the aim of providing aid contributing technical support or investing in selected development activities in developing or emerging countries
bull multiple countries encompassing both developing borrower countries and developed donor countries with the aim to provide financial and technical support to developing and emerging countries andor coordinate support among their member countries Multilateral Finance Institutions (MFIs)f
PRIMARY DATA
SOURCES
bull Self-reporting via CPI surveybull IDFC Green Finance Work Program (Ecofys-IDFC 2012)bull UNEP Bilateral Financial Institutions Climate Change Working Group (UNEP 2011)bull Joint MDB Climate Finance Tracking Initiative (IDB et al 2012)bull OECD Creditor Reporting System Aid Activities Database (OECD 2010)bull Bloomberg New Energy Finance Desktop Analysis
ISSUES ANDOR FUTURE ANALYSIS
bull Non comparability The reported estimate is derived from institutionsrsquo self reporting and secondary data sources Given the various approaches currently in place for accounting and tracking climate finance finance flows cannot be fully compared amongst this diverse group of institutionsg
bull Incompleteness To capture the true magnitude of DFIs involvement in the global climate finance landscape additional entities should be included in the analysis as well as the entire spectrum of their mitigation and adaptation financing Our estimate in fact reflects partial reporting from some MFIs which disclose mitigation finance data onlyh
bull Confidentiality concerns or lack of transparency impede actual understanding on some institutionsrsquo flowsbull Double-counting Cross financing between institutions may occur possibly resulting in double counting more research is
needed to ensure that presented flows are not inflated by such cross flowsi
a The portion of climate finance distributed in the form of risk management instruments is not included in the total actually reaching mitigation andor adapta-tion projects (see the Landscape 2012 methodology in Section 2)
b The total climate finance retrieved from the Ecofys-IDFC (2012) report for a group of NFIs was broken down against our categories of instruments according to (1st) the share stated in the report itself (ie 95 to loans and 5 to ldquoother instrumentsrdquo) (2nd) the weights observed in the financing modalities applied by the NFIs and BFIs for which we had data Due to data availability issues we allocated half of the estimated equity portion to ldquoproject-level equityrdquo and the other half to ldquobalance sheet financingrdquo
c The BFIsrsquo volume of climate finance includes investments in carbon funds and investment funds for renewable energy and clean technology projects OPIC in particular provides support to private equity funds aimed at developing nations Bancoacuteldex for instance made an investment in a relatively small venture capital fund called lsquoProgresa Capitalrsquo which focuses in the area of inter alia alternative energy (Smallridge et al 2012)
d The Mexican Nafin for instance has access to lines of credit from the World Bank and the Inter-American Development Bank (TNC 2012)
34
The Landscape of Climate Finance 2012
35
The Landscape of Climate Finance 2012December 2012 December 2012
In 2011 NFIs and Sub-Regional Development banks supported key low-carbon development sectors renewable energy projects and energy conservation accounted in fact for 509 and 262 of their mitiga-tion financing respectively Projects spanned from wind farms large-scale hydro and sustainable transport modalities or infrastructures (10) to those aimed at reducing land-use emissions via re-forestation and afforestation (23) BNDES funding to wind projects in 2011 was remarkable with USD 2 billion approved (investments of USD 32 billion) for 43 wind parks its support to the sector increased by almost three times compared to 2010 levels (BNDES 2012 see Box 7)
NFIs and Sub-Regional Development Banks also played a role in building countriesrsquo resilience to climate change devoting 12 (or USD 52 billion) of their support to measures contributing to adaptation objectives 313 of this in infrastructure improvements and 309 in the agriculture and forestry sector
NFIs and Sub-Regional Development Banks financed these activities mainly through loans at interest rates below those charged by commercial banks Low interest rate loans represented 866 of NFIrsquos climate financing BNDES stands out as a major provider of concession-ary credit that accounted for 997 of its lending This practice has helped to lower the cost of debt in Brazil the cost of debt is relatively higher in other emerging countries where NFIs such as the South African DBSA and the Indian Renewable Energy Development Agency (IREDA) financed mostly at market rates34
Unsurprisingly NFIs tend to invest domestically In fact 89 of their total climate finance was invested in the country where they are located Climate finance origi-nating from NFIs and Sub-Regional Development banks based in non-OECD countries (96 of the total) was mostly (90) directed toward domestic actions in the home country of the institution The remaining went to other non-OECD countries
Bilateral Finance Institutions (BFIs)The BFIs considered in the study include Agence Franccedilaise de Developpement and Proparco (AFD) KfW Entwicklungsbank and DEG (KfW) Japan International Cooperation Agency (JICA) and Overseas Private Investment Corporation (OPIC) Each of these BFIs have different structural characteristics and mandates AFD KfW and JICA are chiefly responsible for allocat-ing their countriesrsquo bilateral ODA contributions to other countries whereas OPIC provides financing and insur-ance to private sector investors that may help recipient countriesrsquo businesses while favouring US business interests35
In 2011 BFIs channelled about USD 113 billion in support of mitigation and adaptation interventions
Comparisons between BFIsrsquo outflows reported in the Landscape 2012 and the Landscape 2011 should be made with caution because data were obtained from different
34 The South African Government is committed to expand concessionary finance to boost investment and influence the direction of the economy (Pinheiro 2012) BNEF (2011) states that the interest rates applied by IREDA are more or less in line with those of commercial lenders and that it cannot be viewed as a source of ldquosubsidisedrdquo lending To estimate its portion of low-cost debt versus market-rate debt we associated to the former the total amount of finance committed to those sectors that in 2011 received the interest rate subsidies provided by the Indian Ministry of New and Renewable Energy to the Agency (IREDA 2012) To market-rate debt we allocated the remaining portion With regard to the high cost of debt issue see Box 9 on ldquoThe Indiarsquos experience in Financing Renewablesrdquo
35 OPIC typically supports companiesprojects that are at least 25 US-owned (OPICgov)
e NFIs and Sub-Regional Development Banksrsquo climate finance data are presented jointly as the data retrieved for some of these entities was in an aggregated form and sourced from the Ecofys-IDFC (2012) report This prevented us from associating financing to a single entity or re-allocating the related financing to a different category Sub-Regional Banks eg the Development Bank of America Latina CAF in fact can be seen as multilat-eral institutions For details on the institutions included in our estimates see Appendix D We acknowledge the presence of private players amongst banksrsquo shareholders CAF for instance has 18 shareholder countries and 14 private banks
f This definition follows that of amongst others Atteridge et al (2009) the World Bank (see WB website) and the UNFCCC (see UNFCCC website)
g MDBs are currently developing a joint approach for climate finance track-ing which has been implemented and applied to the data we received from some of the institutions covered in the study According to IDB et al (2012) ndash the first outcome of the MFIsrsquo work with a focus on mitiga-tion finance ndash the newly developed approach strives to capture only the components of a project with climate co-benefits This might not be the case as yet for other intermediaries which may account for the whole value of the project Additional work is needed to harmonize accounting methodologies enabling comparability between flows across the entire spectrum of DFIs
h Both comprehensiveness and comparability issues will partially be addressed in the future as MFIs have harmonized their adaptation and mitigation finance tracking and will jointly report their climate finance numbers Some BFIs are engaged in the discussions and hopefully these approaches will be transferred to NFIs too
i In the Landscape 2012 we tried to minimize double counting to the maximum extent possible depending on the granularity of data available Nafin for instance in 2011 financed renewable energy generation projects with USD 71 million of KfW resources This resources were not included in the total to avoid double counting In addition we were ensured that cross financing did not occur between the institutions covered in the Ecofys-IDFC report (2012) used as a source for some NFIsrsquo data
36
The Landscape of Climate Finance 2012
37
The Landscape of Climate Finance 2012December 2012 December 2012
and disaster risk reduction which in total received approximately USD 337 million more than in 2010
BFIs proved significant in channelling Fast-Start Finance contributions to developing countries AFD for instance implemented 69 of Francersquos Fast-Start Finance commitments in 2011 (USD 585 million) and also a portion of the European Commission ones (EC 2012 Minefi 2011) KfW was entrusted with 19 of Germanyrsquos Fast-Start Finance (Vieweg et al 2012)39 while OPIC in FY 2011 delivered 36 of the US total (USD 31 billion) notably increasing its share as com-pared to the previous year (8 in 2010) In a period of budget pressures OPIC ndash which operates at no net cost to the American taxpayer ndash helped the US meet its commitments at no expense to the public budget (Fransen et al 2012)
infrastructure such as mangroves39 KfW Fast-Start Finance refers to 2010-2011 Germany committed USD 473
million in 2010 and USD 603 million in 2011 Actual allocation was higher by USD 7 million in 2010 and USD 89 million in 2011
sources and categorized in a different manner36 When looking at equivalent data self-reported by the institu-tions the year-to-year variation highlights a 23 drop37 This could be because of contingency factors andor fewer projects in the pipeline The sector that expe-rienced the most significant reduction in funding was the sustainable transport sector which received almost USD 3 billion less than in 2010 (a 78 decrease mostly due to the fact that some investments have been post-poned to the beginning of next year) The agriculture forestry and land use sector and the energy efficiency sector also experienced reduced support with a 34 and 20 decrease respectively On the other hand certain adaptation measures saw increased funding such as those related to infrastructure development38
36 In last yearrsquos study data were compiled from various second-party sources and BNDES CDB and IREDA were included in this category
37 DEG has not been included in the year-on-year comparisons due to data availability issues
38 Projects in these categories include for example water infrastructure measures to improve dikes but also projects to plant or restore ldquogreenrdquo
Box 6 ndash How do NFIs finance their operations The case of BNDESNFIs have a diversified funding sources that include long-term sources of reimbursable and non-reimbursable public resources public deposits other Development Finance Institutionsrsquo resources and capital market bonds Funding diversification and the possibility of blending market and concessional resources from different actors enables NFIs to establish more attractive financing conditions for projects that are in the publicrsquos best interest
The weight of the various sources of capital can vary between the Banksrsquo capital structure and the annual inflow of resources used to finance operations
In the case of BNDES for instance the Government of Brazil funded the predominant share of the Bankrsquos total capital 817 as of the end of 2011 This share is comprised of resources from the National Treasury which contributes 497 and has been the Bankrsquos main creditor since 2010 another 285 of the total is financed by the Workersrsquo Assistance Fund (FAT) a special payroll tax (the PIS-PASEP) the Audiovisual Sectorial Fund and the National Climate Change Fund Further 34 comes from other governmental sources These funds are complemented by resources raised in the foreign market through financial market activities as well as operations with international institutions such as the Japan Bank for International Cooperation (JBIC) and the European Investment Bank (EIB) In 2011 foreign fundraising represented 36 of the Bankrsquos financing structure The remaining 147 is related to assets monetization and other obligations (BNDES 2012)
In recent years there has been a noticeable increase in the funds that BNDES receives from the Treasury while the amount of funding from international institutions has decreased steadily
In terms of capital flows over the course of 2011 756 of BNDESrsquo total net resources (USD 85 billion) came from return on credit operations while 192 came from the National Treasury The remaining was sourced from the Workersrsquo Assistance Fund and other sources
Pinheiro (2012) reports that the Bank received an annual contribution of about USD 10 billion from the Brazilian Government which is then channelled to recipients to achieve the Bankrsquos mandate
36
The Landscape of Climate Finance 2012
37
The Landscape of Climate Finance 2012December 2012 December 2012
BFIs also operate through a range of dedicated Climate Funds40 and are also active in carbon markets playing a ldquocarbon brokering rolerdquo through carbon investment funds41 The KfW Carbon Fund for instance promotes the use of carbon credits for compliance with the obli-gation under the UNFCCC while enabling and simplify-ing access to the market for buyers and sellers It also assumes or mitigates market risks (eg EU ETS III) As of December 2011 the KfW Carbon Fund contracted credit of over USD 557 million (Suennen 2012 UNEP-SEI 2011)
Multilateral Finance Institutions (MFIs)MFIs include
bull Global players like the World Bank Group
bull Regionally-oriented agencies such as the African Development Bank (AfDB) and the Asian Development Bank (ADB) and
bull Entities without a banking basis such as the EU Institutions generally identified as multilateral bodies42
MFIsrsquo financial support to climate change activities amounted to about USD 212 billion in 2011
The list of MFIs covered in the Landscape 2012 is the same as in the Landscape 2011 but our current esti-mate reflects better data quality made possible by the improved data gathering approach we adopted (ie direct reporting from the majority of the institutions 6 out of 9) and the improvements in MFIsrsquo reporting Comparisons with last year study however are not possible as we relied on different data sources with difference in scope Self-reporting data for 2010 and 2011 have not been made consistently available in some cases due to changes implemented in the accounting methodologies
In 2011 MFIs proved critical in supporting renewable energy generation projects which received 518 of
40 In 2011 for instance KfW and the German Federal Ministry for the Environ-ment launched the Global Climate Change Partnership Fund (GCCPF) a public-private initiative focused on energy efficiency and renewable energy investment for SME and private households The Danish Govern-ment IFC and Deutsche Bank also committed financing to the partnership over the course of the year (GCCPF website)
41 Last April AFD ndash along with other partners ndash announced the upcoming launch of a Carbon Fund for Africa (CDC Climat 2012)
42 The EU Institutions namely the EU Commission and the EU Development Fund are treated as multilateral bodies in the OECD DAC statistics Their climate finance data included in the Landscape 2012 refer only to their direct (ldquobilateralrdquo) contributions to developing countries (OECD 2011d)
their total mitigation finance (approximately USD 95 billion) The other two sectors that benefitted the most were energy efficiency and sustainable transport which received 194 and 184 respectively In terms of adaptation financing MFIsrsquo support was mainly directed to interventions in the agriculture and forestry sector and to capacity buildingtechnical assistance measures which received 278 and 127 of their total support to adaptation (USD 29 billion)43 Among DFIs MFIs are the ones that devoted the highest share to capacity building measures
Market rate debt was the dominant means used by MFIs for distributing climate finance (78)
Asian and European countries were the principal recipients receiving 37 (or USD 78 billion) and 271 (USD 58 billion) of the total MFIsrsquo climate finance respectively
The European Bank for Reconstruction and Development (EBRD) and the European Investment Bank (EIB) provided the greatest support to Europe (734)44 These lenders have been particularly impor-tant at a time when a deteriorated financing environ-ment has threatened the European Unionrsquos low-carbon transition The higher cost of borrowing experienced by commercial banks has in fact hampered lending which is unfortunate in times when investment needs are sig-nificant45 and action cannot be delayed (BNEF 2012b)
43 Activities with adaptation co-benefits in the transportation sector also received significant support Among the measures supported eg develop-ment of climate-resilient design standards upgrade of existing roads and highways to climate resilient design standards etc
44 Germanyrsquos KfW Group has also been a lead lender in the European clean energy sector (see Box 12)
45 For instance BNEF (2012b) states that investments in renewable energy capacity amount to more than USD 600 billion between the 2011-20 period in European Union countries alone
38
The Landscape of Climate Finance 2012
39
The Landscape of Climate Finance 2012December 2012 December 2012
Box 7 - Brazilrsquos experience in financing renewable energy with a focus on wind power
The total amount of BNDESrsquo approved financing for wind power has been dramatically increasing in recent years reaching USD 2 billion (R$ 34 billion) in 2011 which represents a 173 increase compared to 2010 (BNDES 2011)
According to US PREF (2012) BNDES reduces borrowing costs for eligible wind projects by roughly 40 BNDESrsquo favourable financing conditions also apply to other alternative technologies like biomass and small hydro and have been improving particularly since 20061 as part as BNDESrsquo mandate to incentivize ldquogreenrdquo sources of electricity According to BNDESrsquo analysis its financing offerings have contributed to a 25 decrease in renewable electricity tariffs during the 2003-2011 period
In general BNDESrsquo loans to renewable power generation projects have interest rates at 14 below those practiced for coal or oil thermal plants They also have longer repayment terms 16-20 years for renewable energy versus 14 years for conventional plants Moreover BNDESrsquo participation in renewable energy projects can reach at maximum 70-90 while for coal or oil thermoelectric plants it is at 50 (IDFC 2012)
Further by keeping fossil fuel based generation like coal and fuel oil fired thermal plants under stricter loan terms BNDES provides a competitive edge to renewable energies
Given the favourable financing environment for clean projects wind is not the only renewable resource that has experienced growth Overall BNDESrsquo disbursements to all renewable energy technologies supported by Brazilrsquos national policy have showed an upward trend in the 2003-2011 period which reflect the significant increase in BNDESrsquo volume of disbursements in the same period
In 2011 BNDESrsquo disbursements to renewable energy and energy efficiency reached about USD 72 billion (R$ 123 billion) 31 higher than in 2008
Prepared by Joana Chiavari (CPI Rio joanachiavaricpirioorg)
Based on a forthcoming CPI Report on policy approaches for promoting onshore wind power in Brazil
1 By looking at the financing conditions applied by the Bank over the 2003-2011 period we noted that in 2006 for instance the amortization period increased from 12 to 14 years and then in 2007 to 16 years Moreover the Bank lowered its basic return requirement from 25 to 15 in 2006 decreasing this further in 2007 to 1 and 2008 to 09
The Brazilian development bank BNDES is essential to Brazilrsquos renewable energy energy efficiency and deforestation financing
38
The Landscape of Climate Finance 2012
39
The Landscape of Climate Finance 2012December 2012 December 2012
Climate Funds
In recent years a number of climate-specific funds have been set up46 which could also be categorized as
bull bilateral funds financed by single donor countries with one or more recipient country
bull multilateral funds financed by more than one donor country with more than one recipient country
bull national and regional funds established and managed by one or more recipient countries
46 In multiple cases pre-existing environmental and conservation trust funds are channeling climate related resources Some such funds have even been (or are in the process of being) accredited as National Implementing Enti-ties for the Adaptation Fund (eg ldquoProtected Areas Conservation Trustrdquo for Belize and the Micronesia Conservation Trust for the Federated States of Micronesia)
to channel resources from one or more donor country and or domestic resources
While our estimates show that Climate Funds com-mitted USD 25 billion in total to projects in 2011 we include only 15 billion in the Landscape 2012 after deducting bilateral funds (USD 1 billion) which are already accounted for under countriesrsquo bilateral reporting Our estimate is based on the Heinrich Boumlll Stiftung (HBF) and the Overseas Development Institute (ODI)rsquos Climate Funds Update database reporting by the organizations managing individual Funds as well as the UNDP Multi-Partner Trust Fund Office website We find that existing Climate Funds mostly channel donor money in the form of grants47 Our estimates
47 The Adaptation Fund is an exception in that while it channels grants its main source of finance is the monetization of 2 of CDM credits issued The Amazon Fund also has a particular model for raising finance ndash it is a
SOURCES ESTIMATED VALUE DESTINATIONS
IntE
rnal bull Government Budgets NE
USD 15 BILLION In
stru
mEn
ts an
d usE
s bull Grants USD 1446 millionbull Low-cost debt USD 8 millionbull Project-level equity USD 17 million
Usesbull USD 1142 million mitigation (76)bull USD 352 million adaptation (24)
ExtE
rnal
bull Government Budgets NEbull Commercial financial institutions NEbull Institutional investors NEbull Bilateral and Multilateral Financial Institutions NE Ot
hEr a
ctOr
s bull Channels multilateral regional and national implementing entities
bull End recipients governments NGOs and the private sector
DESCRIPTION
bull Climate funds pool resources from donors and domestic sources to support low-carbon climate-resilient development projects Funds usually have a finite lifetime and a specific sectoral focus eg renewable energy adaptation forestry etc In many cases multilateral financial institutions channel funds to recipients and provide financial environmental and social safeguards However there is a trend towards establishing greater national ownership and control of these funds
PRIMARY DATA
SOURCES
bull Self-reporting by Funds bull Overseas Development Institute (ODI) Heinrich Boumlll Stiftung (HBF) Climate Funds Update websitebull UNDP Multi-Partner Trust Fund Office Gatewaybull Fundsrsquo Annual Reports
ISSUES AND FUTURE
ANALYSIS
bull Challenges in tracking climate finance delivered through climate funds remain in particular there is a risk of double counting with reporting from bilateral and multilateral organizations
bull More tracking efforts are needed to unveil the current contribution and role of existing National Fundsa
Note To avoid double counting we carry forward in our calculations only USD 15 billion of Climate Fund money identified (USD 25 billion) excluding developed to developing country bilateral funds which we assume are accounted for in bilateral reporting and accounted for in the government budgets category It is assumed that multilateral institutions managing funds do not include climate fund money in their climate finance reporting and hence that there is no double counting Furthermore co-funding often provided by multilateral organizations is not considered in the above estimates of climate fund moneya For instance Bangladesh has two Climate Funds the Bangladesh Climate Change Trust Fund (BCCTF) established in 2010 by the local government and funded
with resources from the national budget and the Bangladesh Climate Change Resilience Fund (BCCRF) created at the same time to pull funds from donor countries The BCCTF is resourced entirely from the governmentrsquos own budget with USD 100 million in 2009 2010 and 2011 in the form of an endowment Other developing countries such as the Maldives have also established similar national funds (Khan Hannan et al 2011 Gomez-Echeverri 2010)
40
The Landscape of Climate Finance 2012
41
The Landscape of Climate Finance 2012December 2012 December 2012
do not include co-funding which is often provided at the project level A detailed breakdown of data by Fund is provided in Appendix E The Landscape 2012 esti-mate represents a reduction from the Landscape 2011 estimate (upper bound USD 32 billion) which is a reflection of improvements in data sources in particu-lar better annual project approval volume data not a reflection of a reduction in the contribution of the funds
Multilateral organizations such as the World Bank and other UN agencies typically provide trustee and administrative services to manage multilateral and some national funds lsquooff-balance sheetrsquo as well as act as lsquoImplementing Agenciesrsquo to channel funds to local recipients and monitor implementation Bilateral funds are typically administered by donor development agencies Recipient countries are however increasingly seeking lsquodirect accessrsquo to funds both through National Implementing Entities48 which can access project funds directly instead of through an international implement-ing entity and by setting up nationally governed Climate Funds
performance-based fund securing contributions from donors on the basis of demonstrated reductions in the annual deforestation rate The Climate Investment Funds while financed mainly with grant contributions also re-ceived donorsrsquo money in the form of capital and loans and extend grants concessional loans and guarantees via MFIs (Climateinvestmentfundsorg)
48 For instance the Adaptation Fund has now accredited 12 National 10 Multilateral and one Regional Implementing Entities
The Green Climate FundIn future years the Green Climate Fund may become an important additional climate fund but it is not yet operational In 2010 Parties to the UNFCCC established the Green Climate Fund with the aim of providing ldquoscaled-up predictable and adequate fundingrdquo to support projects programs policies and other climate-related activities in developing countries In 2011 the Conference of Parties approved the governing instrument for the Green Climate Fund and with the Fundrsquos first meeting in August 2012 the Board is now taking the first steps towards operationalizing the Fund It is not yet clear however how much and when finance will actually flow through the Green Climate Fund
ExampleThe Climate Investment Funds consist of two multi-donor trust funds the Clean Technology Fund and the Strategic Climate Fund The latter is made up of three programs the Forest Investment Program the Pilot Program for Climate Resilience and the Scaling Up Renewable Energy in Low Income Countries Program The Climate Investment Funds are the single biggest set of Funds dedicated to climate finance holding USD 72 billion in pledged funding from 14 donor countries So far they have programmed over USD 6 billion for 48 developing countries with over 200 projects already financed (Climateinvestmentsfundsorg EBRDcom)
Operational since 20082009 and administered by the World Bank each Fund has a specific purpose The Clean Technology Fund is aimed at projects with large-scale emissions reduction potential and provides loans at terms which are even more favourable than most development banks The Forest Investment Program supports the strengthening of enabling environments and investments addressing the drivers of deforestation in eight countries The Pilot Program for Climate Resilience pilots and demonstrates ways in which climate risk and resilience can be integrated into core development planning and implementation The Scaling Up Renewable Energy in Low Income Countries Program supports the deployment of renewable energy in the least developed countries According to HBF and ODIrsquos Climate Funds Update the Clean Investment Funds have so far disbursed USD 148 million to recipients
40
The Landscape of Climate Finance 2012
41
The Landscape of Climate Finance 2012December 2012 December 2012
Private sector intermediaries
Commercial financial institutionsIn the Landscape 2011 commercial banks were catego-rized without any estimates of amounts involved In the Landscape 2012 wersquove been able to estimate a portion of this category that relates to renewable energy project finance We find that commercial financial institutions contributed 9-10 of total global climate finance
We estimate that 38-50 of commercial financial institutions contributions come from domestic financial institutions while 50-62 of contributions are from institutions in foreign developed countries (European and Japanese investment banks are notable contribu-tors to other countries) Developing countries received 23-42 of this finance while developed countries received 58-77
SOURCES ESTIMATED VALUE DESTINATIONS
IntE
rnal bull Reinvested earnings from recurrent and exceptional
income NEUSD 307 ndash
404 BILLION
Inst
rum
Ents
bull Risk management NEbull Carbon offset finance USD 22 billionbull Low cost debt USD 01 ndash 11 billionbull Project-level market rate debt USD 274 ndash 357
billionbull Project-level equity USD 03 ndash 04 billionbull Balance sheet financing USD 08-11 billion
ExtE
rnal
bull Changes in net debt and equity from third-party NE
OthE
r act
Ors
bull Lending to all other actors of the landscape on a balance sheet basis NE
DESCRIPTION
Commercial financial institutions or commercial banks include all the sources of private debt capital These include but are not limited to
bull Profit-driven investment banksbull Carbon brokers and fundsbull Banks and insurance companies providing risk management solutions
PRIMARY DATA SOURCES
bull Bloomberg New Energy Finance and UNCTAD FDI databull Ecosystem Marketplace State of the Voluntary Carbon Markets Report
ISSUES AND FUTURE
ANALYSISbull Commercial financial institutionsrsquo contributions to ldquoactoror project sponsor-level debtrdquo are hard to measure and analyze
ExamplesClose to 600 MW of Spanish solar PV and thermal capacity was financed on a project finance basis in 2011 Spanish banks such as Banco Santander BBVA or Banco Espanol de Credito were instrumental in contributing project finance debt to solar project developers Other European (Portugal Germany France Italy and the Netherlands) and Japanese banks played an important role as well
For the Landscape 2012 we find that most of the projects developed are financed on a balance sheet basis ie the project developers raise money for all their activities without specifically earmarking projects Since we are unable to relate this funding to the emissions reduction projects and that information is scarce we do not include this in our estimate for commercial financial institutions
42
The Landscape of Climate Finance 2012
43
The Landscape of Climate Finance 2012December 2012 December 2012
Venture capital private equity and infrastructure fundsThe direct contribution of venture capital private equity and infrastructure funds to emissions reduc-tion projects is in excess of USD 24 billion for the year 2011
We estimate that 55-56 of venture capital private equity and infrastructure fundsrsquo contributions come from domestic sources while 44-45 come from foreign developed countries Developing countries received an estimated 15 of venture capital private equity and infrastructure climate finance while devel-oped countries received 85
SOURCES ESTIMATED VALUE DESTINATIONS
IntE
rnal bull Reinvested earnings from recurrent and exceptional
income NE
USD 24 BILLION
Inst
rum
Ents
bull Project-level equity USD 10 billionbull Balance sheet financing USD 14 billion
ExtE
rnal bull Changes in net debt and equity from third-party
(investors) NE
OthE
r act
Ors
bull Investing into other actors of the landscape on a balance sheet basis (corporate actors and project developers) NE
DESCRIPTION
This category capturesbull Venture capital fundsbull Private equity fundsbull Infrastructure funds
PRIMARY DATA SOURCES bull Bloomberg New Energy Finance and UNCTAD FDI data
ISSUES AND FUTURE
ANALYSIS
bull Private equity fundsrsquo investment into emissions reduction technology manufacturers (wind turbines solar panels etc) which are also involved in the deployment and financing of projects is difficult to estimate
ExamplesGroups such as Barclays Infrastructure Funds Management Ltd and Triodos Bank contributed to European wind and solar projects in 2011 They typically invest in a diversified portfolio of energy and or infrastructure assets or businesses (not necessarily all related to emissions reduction) on behalf of investors into such funds The investors behind these funds are typically institutional investors and wealthy individuals
42
The Landscape of Climate Finance 2012
43
The Landscape of Climate Finance 2012December 2012 December 2012
33 Instruments
Most climate finance ndash USD 276-310 billion out of a total USD 343-385 billion ndash can be classified as investment or more generally instruments that include ownership or claims Key instruments delivering these investments include balance sheet financing (59) project-level market rate debt (16) and low-cost debt (15) Other categories of instruments such as carbon offset flows grants and project-level equity make up the remainder of climate finance
The instruments considered in our analysis correspond to all the economic49 and financial instruments50 used in the deployment of emissions reduction projects Financial support can either be given directly to specific projects andor local implementing entities using a variety of instruments or it can assist national policy efforts Building upon the Landscape 2011 we consider six major categories of instruments (i) policy incen-tives (ii) risk management (iii) carbon offset finance (iv) grants (v) low-cost debt and (vi) capital instru-ments including project-level market rate debt project-level equity and balance sheet financing51 While not necessarily comprehensive these categories aim to capture the major instruments used to deliver climate finance
Policy IncentivesPolicy incentives include income-enhancing mecha-nisms such as feed-in tariffs tradable certificates tax incentives and clean energy subsidies which are most commonly funded domestically Many emerging economies in particular have started to use income-enhancing mechanisms to stimulate clean energy investment As discussed in the methodology section we do not report an estimate for total policy incentives finance given the risk of double counting (both invest-ment money and future revenues from the investment
49 ldquoA means by which decisions or actions of government affect the behav-iour of producers and consumers by causing changes in the prices to be paid for these activitiesrdquo (OECD Glossary of Statistical Terms available here httpstatsoecdorgglossarydetailaspID=6408)
50 ldquoA financial instrument is any contract that gives rise to a financial asset of one entity and a financial liability or equity instrument of another entityrdquo (IFRS IAS 32 Financial Instruments Presentation available here httpwwwifrsorgDocumentsIAS32pdf)
51 There is a large share of debt sitting behind balance sheet financing as project sponsors often obtain corporate loans or issue corporate bonds
to remunerate the investor) However the category of policy incentives is included in the Climate Finance Flows Diagram 2012 as policy incentives play a critical role in attracting climate finance at the investment stage
Risk Management
Official long-term export credits Export credits can be provided by or on behalf of gov-ernments and can take the following three forms (i) official direct support (loans) (ii) private export credit with repayment insurance (iii) private export credit with repayment guarantee (Buchner et al 2011)
In 2009 the share of export credits available to clean energy sectors (renewable energy and co-generationdistrict heating) rose to USD 07 billion (OECD statis-tics on export credits 2010 as cited in Buchner et al 2011) While more recent data is not yet available we might expect the proportion of climate specific export credits to increase given an agreement this year by OECD countries to incentivise export credit support for climate mitigation projects (including flexible repayment structures and longer tenors for advanced technologies and energy efficiency) while maintaining stricter financial terms and conditions for fossil-fuel based projects (OECD 2012)
It is worth noting that export credits of types (ii) and (iii) outlined above are paid to the exporter and there-fore technically represent a developed to developed country flow Furthermore these types of export credits may not be used and may not therefore represent a true flow of climate finance More detailed data is there-fore required to gain a better understanding of the role of export credits in stimulating private low-emission investments in developing countries
GuaranteesGuarantees are used to mitigate the risks involved in clean investments These can include risks related to non-payment technology performance or the fulfill-ment of obligations by government and affiliated agen-cies vis-agrave-vis a given project Based on our review of DFIrsquos flows we estimate annual guarantees in support of climate mitigation and adaptation to be at least USD 18 billion On top of this government budgets contributed a non-estimated amount of climate finance for loan guarantees (for instance through the US Department of Energy loan guarantee program for US solar projects in 2011)
Although money relative to guarantees is typically
44
The Landscape of Climate Finance 2012
45
The Landscape of Climate Finance 2012December 2012 December 2012
accounted for by financial institutions acting as guaran-tors52 we do not report the notional amounts relative to guarantees as tangible flows for in the course of our reporting period Guarantees do not need to be exer-cised there is a chance there will never be any outflow for the guarantor (for more details please refer to the methodology section) However guarantees certainly play a central role in clean investment decision-mak-ing and will be the focus of forthcoming CPI work
Carbon offset financeCarbon offsets aggregate public and private money for emissions reduction commitments or to meet voluntary objectives Payments for carbon offsets go to various offset projects currently most of these projects are related to the Kyoto Protocolrsquos Clean Development Mechanism (CDM) and Joint Implementation (JI) Apart from actors on the smaller but growing volun-tary market main players are compliance entities and
52 And they usually set aside provisions reducing their ability to invest in or lend to climate finance projects
intermediaries in regional and national systems (such as the EU Emissions Trading System - EU ETS - and the JVETS) and countries with Kyoto Protocol com-mitments Offset buyers can acquire offsets directly via carbon offset brokers or via carbon procurement funds This instrument category comprises all offsets markets in which primary carbon offsets can be pur-chased for cash
We estimate that carbon offset flows totalled between USD 465 and USD 475 billion in 2011 Our estimate includes only the incremental cost linked to carbon offsets not the investment costs of correspond-ing emissions reduction projects
This range is based on available data from the World Bank the UNFCCC IGES and Ecosystem Marketplace and is an increase compared to the Landscape 2011 estimate (USD 17 ndash 20 billion) mainly thanks to the increased CER issuance by the UNFCCC (although there were lower prices) and improved data visibility on ERU issuance
INSTRUMENTS ANNUAL FLOWS OF DIRECT CLIMATE FINANCE(2010 2011 USD BILLION)
INSTRUMENTS FOR INCREMENTAL COST
Policy incentives NOT ESTIMATED
Risk management NOT ESTIMATED
Carbon offset finance (1) 47 - 48
Grants (3) 98 - 156
Low-cost debt (15) 527 - 542
Sub-total instruments for incremental costs (19) 672 - 747bull public sources (4) 102 - 166bull private sources (1) 26
bull public intermediaries (14) 522bull private intermediaries (1) 23 - 33
INSTRUMENTS FOR CAPITAL COST
Project-level market rate debt (16) 527 - 621
Project-level equity (6) 200 - 235
Balance sheet financing (59) 2031 - 2248
Sub-total instruments for capital cost (81) 2758 - 3104bull public sources (2) 58 - 61
bull private sources (62) 2145 - 2401bull public intermediaries (7) 246
bull private intermediaries (10) 309 - 396
TOTAL
Total 3430 - 3850bull public sources (5) 160 - 227
bull private sources (63) 2171 -2427bull public intermediaries (21) 767
bull private intermediaries (10) 332 - 429
44
The Landscape of Climate Finance 2012
45
The Landscape of Climate Finance 2012December 2012 December 2012
GrantsGrants are transfers in cash or in kind for which recipi-ents do not incur any legal debt (OECD 2007b) Grants can play an important role in reducing upfront project investment costs and meeting viability gaps for projects that are more expensive than the business as usual Grants can also include support to enhance the enabling environment for investments through for instance knowledge management programs technical assistance and capacity building
In the Landscape 2012 we find that 35 (USD 13 billion) of total identified climate finance flows in 20102011 were delivered in the form of grants This is three times the amount of grants identified in the Landscape 2011 This figure can be considered an underestimate as it lacks data on grant contributions from developing country governmentsrsquo to domestic clean energy
In 2010 37 (USD 7 billion) on average of direct government budget flows were delivered in the form of ODA grants The top providers of grants as reported in the OECDrsquos CRS database were the UK Japan Norway and Germany Combined with grants provided by DFIs and Climate Funds we estimate on average 13 of total ldquopublicrdquo contributions were provided in the form of grants (USD 125 billion) Meanwhile just 02 of private finance was delivered as grants and originated from philanthropic contributions
While there is no comprehensive overview of the global extent of philanthropic contributions to climate-specific projects Vrana and Cracknell (2011) cite a range of studies which have reviewed environmental grant-making by foundations in the UK the US Canada Australia and New Zealand
Vrana and Cracknellrsquos (2011) review of environmental funding by European foundations suggests that climate change relevant grants reached around USD 53 million53 annually over the period 2008 ndash 2009 an estimated 13 of which flowed to end beneficiaries in develop-ing countries and the remainder to Europe and North America We assume a 5050 split between mitigation and adaptation activities for this figure54
Meanwhile the Environmental Grantmakers
53 This figure is expected to be an underestimate as it was based on a limited number of foundations and excluded environmental grants which were not more specifically marked for sector relevance
54 39 of EUR 37 million is reported as energy and transport It is not clear what percentage of activities reported as ldquoclimate and atmosphererdquo are for mitigation versus adaptation
Association (2012) estimates the contribution of US foundations to the ldquoclimate and atmosphererdquo area in 2009 to have been between USD 158 ndash 215 million55 60 of this finance stayed in the US 6 flowed to North America and Europe and 34 was directed to the rest of the world including Asia Africa Central and South America We exclude an additional USD 150 ndash 165 million worth of grants to energy and transport related activities given that there is no way to deter-mine the share of those grants that went to fossil fuel related activities We therefore estimate that a total of approximately USD 211 ndash 268 million in philanthropic contributions went to climate projects in 20082009
ExampleJICA supports a variety of climate projects around the world through grants In Kenya for example JICA supports a program that helps communities adapt to floods and develop infrastructure such as evacuation facilities In Vietnam JICA supports low-carbon development through integrated grant and project loan packages and technical assistance to support physical infrastructure development capacity building and policy development JICA also provides grants that encourage infrastructure projects to engage Japanese firms the Agency provides funding for preparatory studies and helps finance infrastructure that will be later operated by private players Source Inaka (2011)
Low-cost debtLow-cost debt is financing provided at terms prefer-able to those prevailing on the market including for example longer repayment terms lower interest rates and higher levels of participation in investments Low-cost debt includes concessional loans
The biggest low-cost debt providers are Development Finance Institutions and governments Loan conditions vary greatly between individual institutions and proj-ects The terms of loan repayments are important for engaging the private sector but at the same time providers need to avoid over-subsidization and to increase the value obtained for public money It is not however possible to comment on the terms of debt due
55 Lower value includes projects marked as pertaining to the specified focal area as a ldquoprimary issuerdquo while the higher value includes overall giving (primary and secondary issue)
46
The Landscape of Climate Finance 2012
47
The Landscape of Climate Finance 2012December 2012 December 2012
to a lack of aggregated data figures presented here are gross rather than net flows
Up to 146 (USD 535 billion) of total climate finance flows captured in the Landscape 2012 are delivered in the form of low-cost debt These flows are entirely from public sources in particular National Finance Institutions (indeed 866 of their financing or USD 37 billion is delivered through low-cost debt) Bilateral Finance Institutions (which use low-cost debt to deliver 62 or USD 7 billion of their climate financ-ing) and directly from governments (32 or USD 62 billion on average of government climate financing is delivered through low-cost debt) This compares to just USD 126 billion worth of concessional loans identified in the Landscape 2011 reflecting the extended coverage of DFIsrsquo flows and in particular NFIs in the Landscape 2012
The central role of BNDES in the rapid expansion of wind and other renewable energy sources in Brazil in
recent years is highlighted in Box 7 Here low-cost debt has reduced borrowing costs for investors by around 40 and in turn reduced renewable electricity tariffs by around 25
Capital instrumentsThe capital instrument category tracks the trans-formation of capital contributions into shareholder ownership (equity) creditor claims (debt loans bonds etc) and hybrid capital instruments Any source or intermediary may contribute capital Capital contributions are registered in specific mitigation and adaptation investment project balance sheets Capital is returned to contributors in two forms first as dividends and changes in the market value of the shares held for equity holders and second as coupons or interim inter-est payments and return of principal for debt holders
In the Landscape 2012 we split investment capital
Examples ndash Mexicorsquos Renewable Energy Financing Facility (REFF)1
The REFF was established within the Mexican Nacional Financiera (NAFIN) to address the renewable energy financing gap by encouraging private sector investment REFF provides
bull direct loans with long repayment terms (about 10-15 years) and fixed interest rates to project developers to finance the construction of new renewable energy projects and support their financing needs during their life and
bull contingent credit lines to cover transitory cash flow shortages during the project lifecycle (eg due to lower than expected energy generation or prices) up to the volume needed to service senior debt
As shown in the figure below NAFIN channels international funds from the Inter-American Development Bank and the Clean Technology Fund combining them with its own to attract private capital It is expected that the facility will ultimately reach a total value of USD 540 million Providing a maximum of USD 10 million to individual projects it is expected that the facility will contribute to investments with a total capital value of up to USD 1540 million2
1 Source Visconti et al (2012) Smallridge et al (2012) based on IDB (2011)
2 This figure is estimated considering a total 1000 MW of installed generation capacity and investment costs of USD 2-25 million per MW (IDB 2011)
Source Smallridge et al (2012) based on IDB (2011)
46
The Landscape of Climate Finance 2012
47
The Landscape of Climate Finance 2012December 2012 December 2012
sources into three major categories56 project-level market rate debt project-level equity and balance sheet financing
Project-level market rate debt worth USD 527 ndash 621 billion went towards emissions reduction projects in 2011 The debt is being repaid on the revenues gener-ated by the emissions reduction project rather than its sponsor (non-recourse debt) This is mostly project finance debt but by extension we include project bonds lease financing and other financing techniques in this category Unsurprisingly the largest contributors were commercial financial institutions (USD 274 ndash 357 billion) More interestingly a significant portion of project-level market rate debt came from other actors notably vendor financing for technology manufacturers
We find that project-level equity worth USD 200 ndash 235 billion was directed to emissions reduction projects in 2011 This is the equity counterpart of project-level market rate debt
Balance sheet financing (or sponsor-level financing) worth USD 2031 ndash 2248 billion went towards emis-sions reduction projects in the year 2011 This category corresponds to investment capital raised at the sponsor level rather than at the project level The largest con-tributors to this type of instrument are project develop-ers (USD 974 ndash 1097 billion) corporate actors (USD 650 ndash 741 billion) and households (around USD 321 billion) From an analytical standpoint it is impossible to determine the sources of balance sheet financing for several reasons First sponsor-level capital includes various sources of capital reinvested earnings from the sponsorrsquos activities equity from shareholders and debt from lenders (commercial financial institutions for loans and credit lines institutional investors and mutual funds for bond and notes) Second the money raised at the sponsor level is not earmarked Third it is challenging to come up with a simple estimate to break down balance sheet financing into debt and equity components Sponsor financing practices and economic circumstances vary across industries and countries For example in India project developers must overcome difficulties securing corporate debt whereas in Europe utilities can use regular borrowing programs more easily Moreover we cannot merely look at sponsorsrsquo balance sheets for guidance as the mix of capital sources for emissions reduction projects will not
56 In order to make the instrument categories mutually exclusive any amount categorized as lsquocapitalrsquo should be free of any form of support from other instruments (subsidies carbon offsets etc) and should only represent the net lsquocapitalrsquo dedicated to investments
necessarily be the same as the mix of capital sources for all projects
48
The Landscape of Climate Finance 2012
49
The Landscape of Climate Finance 2012December 2012 December 2012
Box 9 ndash Indiarsquos experience in financing renewable energy
India which is already the worldrsquos fifth-largest market for wind power has set ambitious targets for both wind and solar generation These targets of 20 GW for solar (by 2022) and 31 GW for wind (by 2017) will require massive investment for an economy already facing competing needs for investment in energy and infrastructure more generally A plethora of renewable policy abounds at the state level and the federal government offers its own policies ndash such as accelerated depreciation and the renewable energy certificate (REC) market ndash but all of these policies are likely to be undermined by the state of Indian financial markets and their regulation
In particular Nelson and Shrimali et al (2012) found that in the short term the interest rates and terms for debt may raise the cost of renewable energy by 24-32 compared to similar projects financed in the US and Europe The high cost of debt wipes out all or most of the cost advantages India might otherwise have and makes renewable energy much less competitive against conventional alternatives There are also signs that in the longer term debt will become increasingly hard to secure even at high costs which could put targets beyond reach for both cost and financing reasons
The main causes of high interest rates for renewable energy projects lie in the general financial market conditions of the country Growth high inflation competing investment needs and country risks all contribute A shallow bond market regulatory restrictions on foreign capital flows and heavy government borrowing add to the problem while the cost of currency swaps and country risk negate the advantages that could come from access to lower-cost foreign debt
While there is agreement in India that debt markets might be a problem there is less agreement as to the precise nature of this problem or potential solutions Discussions with analysts operating in the country revealed the existence of a gap between risks perceptions and expected returns from renewable energy projects in India To bridge this gap several initiatives have been taken by multilateral banks to establish risk guarantee funds For instance the Asian Development Bank and the Indian Government set up a partial risk guarantee fund in which they cover all risks and pay 50 of the default value at a nominal premium But such measures have struggled so far as project developers are unwilling to pay a high premium for such insurance coverage
In other rapidly developing countries facing high interests and competing investment demands such as Brazil renewable energy investors rely partly on concessionary support from National Development Finance Institutions However in India the deregulation of financial markets that occurred in the early lsquo90s has in fact led many National Finance Institutions to convert themselves into commercial banks that cannot make concessionary loans Further analysis is needed to evaluate what lessons can be learned from experience in places like Brazil or China and how these lessons could be adapted to the Indian context
Prepared by Shobhit Goel (CPI Hyderabad shobhitgoelcpihyderabadorg)
Based on Nelson Shrimali et al (2012) ldquoMeeting Indiarsquos Renewable Energy Targets The Financing Challengerdquo CPI Report (forthcoming)
The high cost of debt is the most pressing problem currently facing renewable energy financing in India
48
The Landscape of Climate Finance 2012
49
The Landscape of Climate Finance 2012December 2012 December 2012
34 Disbursement channelsDisbursement channels are organizations that work directly to disburse funds for climate mitigation and adaptation projects including organizations from the public57 and private sector public-private partnerships (PPPs) local financial institutions and banks multilat-eral organizations non-governmental organizations and civil society They may be local regional national or international organizations
There is no aggregated information available on the split of finance by type of disbursement organization but examples from specific investments or organizations can help to shed light on current patterns and best prac-tice For instance Germanyrsquos KfW collaborates with a range of local financial institutions including micro-banks commercial banks refinancing institutions village savings banks non-governmental organizations and regional and supra-regional micro-finance funds to build up micro and small enterprises
Public climate finance from developed to developing countries is sometimes provided directly to recipient governments or government agencies for distribution to end recipients More often however for efficiency and to ensure environmental social and economic safeguards are applied donors channel money through international organizations (eg UNDP UNEP or Multilateral Finance Institutions) or large reputable and often international non-governmental organiza-tions This has also been the operational mode of many international Climate Funds For instance the Clean Technology Fund the World Bank Group the African Development Bank the Asian Development Bank the European Bank for Reconstruction and Development and the Inter-American Development Bank act as implementing agencies working alongside local execut-ing agencies who actually implement projects The Adaptation Fund is an exception in that a number of National Implementing Entities have been accredited to receive money directly from the Fund (see Section 32 on Climate Funds)
There is often a complex web of relationships involved in implementing a project For instance the Clean Technology Fund awarded low-cost debt to Ouarzazate I a Moroccan Concentrated Solar Power plant However this debt is channeled through the African Development Bank and International Bank for Reconstruction and Development then passed to the Moroccan Agency for Solar Energy (MASEN) which
57 Public organizations including government ministries departments programs and agencies
provides debt financing to a public private partnership Special Purpose Vehicle which will build and operate the plant (see Falconer and Frisari 2012)
Regardless of the geographic nature of climate finance flows and whether they are public or private the types of organizations engaged to disburse and implement climate finance are of crucial importance shaping the capacity available to implement and scale up low emissions and climate resilient activities In particu-lar engagement of local organizations is important to ensure capabilities are transferred or built up locally rather than being isolated in international organizations
35 Uses
Mitigation measures received the bulk of climate finance around USD 350 billion The private sector money captured in the Landscape 2012 accounted on average for USD 268 billion about 73 of the total and was directed towards renewable energy generation projects wind and solar in particular
Governmentsrsquo climate finance was also strongly focused on mitigation measures (87) This reflects low-carbon development ambitions and commitment to supporting structural changes in energy systems seen as engines of economic growth
Public financial institutions also played a pivotal role in the support of clean energy investment allocating more than 60 of their climate flows to renewable energy and energy efficiency measures By packaging
In 20102011 mitigation measures attracted USD 350 billion out of USD 364 billion This is largely the result of significant capital investments in mitigation measures like renewable energy
Data on REDD+ finance are poor but suggests that flows could be around USD 118 billion per year predominantly from domestic government contributions
Adaptation interventions received USD 123 to USD 158 billion primarily in the form of incremental cost payments While there has been some progress in tracking adaptation finance since the Landscape 2011 weaknesses in defining and tracking adaptation finance partial reporting by some multilateral players and the inability of existing efforts to capture private flows dedicated to such activities continued to hamper our understanding of adaptation finance flows
50
The Landscape of Climate Finance 2012
51
The Landscape of Climate Finance 2012December 2012 December 2012
financing instruments tailored to address market fail-ures they can close the viability gap of clean technolo-gies to help them mature and become self-sustaining They can also provide access to long-term financing for these projects otherwise not readily available in local capital markets
MitigationWhat does the private sector finance
We find that the private sector (both private sources and intermediaries) contributed USD 2503 ndash 2855 billion towards the total of global climate finance in 20102011 (74 of the total) All that money went to climate change mitigation This reflects both the difficulties in estimating private sector adaptation finance (even though households and corporate actors do engage in autonomous adaptation activities) and the constraints of the global datasets to which we had access (Bloomberg New Energy Finance and UNCTAD Foreign Direct Investment data for renewable energy asset finance and REN21 and Frankfurt School of
Finance amp Bloomberg New Energy Finance for small-scale renewable energy)58
The total amount breaks down into
bull USD 833 billion for small-scale investment USD 737 billion for solar PV and USD 94 billion for solar water heaters and coolers
bull USD 1623 ndash 1975 billion for larger renewable energy asset finance corresponding to an extra capacity of 67 GW (more than 67 for wind and more than 20 for solar technologies) and
bull The remainder to carbon offset finance
The largest private contributors to mitigation invest-ment were project developers (USD 1160 ndash 1303 billion) corporate actors (USD 693 ndash 805 billion) and commercial financial institutions (USD 307 ndash 404 billion) Private sector investment relied on contributions from public sources and intermediaries
58 Please note that given the data constraints data on energy efficiency is lacking Ryan et al (2012) estimate that about USD 23 billion in DFIsrsquo financing leveraged about USD 46-184 billion in energy efficiency invest-ments in developing countries in 2011 depending on the leverage ratio (2 or 8)
Table 1 Climate finance breakdown of sources into mitigation and adaptation fundsa
SOURCES amp INTERMEDIARIES MITIGATION(USD BILLION)
ADAPTATION(USD BILLION)
TOTAL (USD BILLION)
PROJECT DEVELOPERS 1150 ndash 1293 NE 1150 ndash 1293
CORPORATE ACTORS 693 ndash 805 NE 693 ndash 805
HOUSEHOLDS 323 NE 323
INSTITUTIONAL INVESTORS 06 NE 06
COMMERCIAL FINANCIAL INSTITUTIONS 307 ndash 404 NE 307 ndash 404
VENTURE CAPITAL PRIVATE EQUITY AND INFRASTRUCTURE FUNDS 24 NE 24
GOVERNMENTS BUDGETS 149 ndash 182 10 ndash 44 159 - 226
NATIONAL FINANCE INSTITUTIONS 375 52 427
MULTILATERAL FINANCE INSTITUTIONS 183 29 212
BILATERAL FINANCE INSTITUTIONS 86 27 113
CLIMATE FUNDS 11 04 15
TOTAL 3307 ndash 3693 123 ndash 157 3430 ndash 3850
Note Figures represent annual flows for the latest available year (20102011) variable according to the data sources (2010 for OECD DAC members and EU Institu-tions 2011 for all the other organizations) Most data presented relate to commitments in the given year disbursement data are included for one DFI only The figures do not add up to the total exactly because of roundinga Philanthropy which is not included in the table due to the materiality of the flow accounts for about USD 211-268 million which due to lack of information we
assume is split equally between mitigation and adaptation (around USD 120 million to each)
50
The Landscape of Climate Finance 2012
51
The Landscape of Climate Finance 2012December 2012 December 2012
instruments addressing incremental costs but also access to debt financing both at the project level and at the sponsor level
What does the public sector finance
Governments and public financial intermediaries invested USD 804-837 billion in mitigation mea-sures in 20102011 Development Finance Institutions contributed USD 644 billion or 784 of the total Renewable energy and energy efficiency received 54 and 18 of total public mitigation financing respectively The sustainable transport sector received a significant amount of climate funds 10 of the total mainly from National Finance Institutions and Multilateral Finance Institutions
In particular NFIsrsquo climate finance activities highlight the domestic emphasis which is driven by the low-carbon development strategies of the countries they operate in or to which they are linked to About USD 289 billion (or 677 of the NFIsrsquo total climate financ-ing) was committed to renewable energy and energy efficiency measures implemented mainly domesti-cally We estimate that more than 80 of NFIsrsquo finance was spent in China and Brazil reflecting the relevant weights of CBD and BNDES in this category59 The transport sector of importance for socio-economic development represented 10 of NFIsrsquo mitigation finance The activities supported include rail and ship transportation waterways Bus Rapid Transit systems and vehicles substitution Acknowledging that these activities may ultimately result in emission reductions it is difficult to understand and compare them against
59 As described in Box 7 BNDES placed a particular emphasis on wind and hydropower projects in 2011 CDB too demonstrated its commitment in the support of wind farms and large-scale hydroelectric projects proac-tively implementing the governmentrsquos Green Credit Policies At year-end 2011 its outstanding loan portfolio in energy conservation emissions reduction as well as environmental protection sectors at USD 1018 billion (RMB 6583 billion) up by 33 year-on-year demonstrates its commit-ment The increase observed in the Banksrsquo support to the power sector in 2011 reflects the countryrsquos need to overcome chronic power shortages and optimize the supply mix Worth noting that nuclear and integrated or pithead coal-based plants were also the recipients of the Banksrsquo financing (CDB 2012) CDB does not invest domestically only it is also invests abroad playing an important role in the financing of overseas activities of state-owned enterprises with the aim of creating national champions and acquire advanced technologies (eg Brookingsedu) The Bank also con-tinued to provide financing to the China National Petroleum Corporation Group and SINOPEC Group to support their overseas oil field exploration efforts As of the end of 2011 CDBsrsquo outstanding loan balance in this sector stood at USD 598 billion (RMB 3865 billion) (CDB 2012)
a business-as-usual scenario and to understand if and what they should be qualified as climate finance60
MFIsrsquo mitigation financing was also strongly oriented towards renewable sources of energy and energy con-servation measures which received more than 614 of their total commitments (about USD 13 billion) This can partly be explained by the sectoral specializa-tion of some players such as the EBRD which devoted 938 of its 2011 mitigation finance to these sectors61 MFIsrsquo resources also financed measures aimed at strengthening regulatory and institutional frameworks supportive for clean-technologies62 They also worked with local financial institutions to embed capacity and create specific skills in the preparation risk evaluation and monitoring of these types of projects as well as in the identification of investment opportunities63
The development of the financial sectorrsquos capabilities was also one of the areas targeted by bilateral players such as KfW which dedicated 56 of its 2011 climate finance to capacity building measures in the mitigation area Overall in 2011 the largest shares of BFIs climate spending was directed to the energy (292 to renew-able 13 to energy efficiency) and waste management sectors (9) Transport and agriculture forestry and land use accounted for 122
The forestry sector is an area of emerging interest for some BFIs KfW for instance has a lsquoforest and climate protection programrsquo with Indonesia the largest single-sum beneficiary to date of Germanyrsquos Fast-Start financing (Vieweg et al 2012) The promotion of REDD initiatives is also an important objective for JICA and AfD (AfD 2012 JICA 2012b)
The largest share of bilateral ODA commitments marked as climate mitigation (38) which represented about 60-80 of 2010 DAC membersrsquo reporting was
60 The World Bank identifies the activities with mitigation co-benefits in the sector eg modal shifts traffic management etc (see Worldbankorg) Not all DFIs however have sophisticated systems and frameworks for accounting mitigation finance in place and this is particularly true with regard to the majority of NFIs whose approaches are still in their infancy (See Smallridge et al 2012)
61 Projects supported can range from energy efficiency interventions in the industrial and residential sector support to biomass technologies and the financing of standalone renewable energy projects such as wind and hydropower (EBRDcom 2012)
62 In 2011 capacity buildingtechnical assistance measures related to mitiga-tion received 05 billion of MFIsrsquo commitments
63 See eg the EBRD Sustainable Energy Financing Facilities which comprises a comprehensive technical assistance program intended to provide imple-mentation support to partner banks sub-borrowers and project sponsors (EBRDcom)
52
The Landscape of Climate Finance 2012
53
The Landscape of Climate Finance 2012December 2012 December 2012
committed to projects in the agriculture forestry and land use sector Capacity buildingenabling environ-ment measures received another significant 30 while renewable energy generation from hydro geothermal solar and wind sources captured 15 (OECD 2012)64 African and Asian countries accounted for almost 40 of overall bilateral spending (OECD 2012) This underscores the importance of addressing critical development issues jointly with mitigation measures to achieve growth in a sustainable manner
The volume of public money we found ldquositting behindrdquo project developersrsquo actions (about 11 billion see Box 5) largely originating from and delivered to developed countries (64-72 of the total) ndash mainly in Germany and the US ndash was directed to support and accelerate local deployment of renewable energy measures This reflects the large injection of funds as a result of the ldquogreenrdquo stimulus plans and the effect of policies incen-tivizing uptake Box 3 on the US Federal Tax Incentive Program provides insights on these aspects
REDD+The scope of activities considered ldquoREDD+rdquo65 is notori-ously difficult to delineate While REDD implies efforts to reduce deforestation and forest degradation the lsquoplusrsquo refers to the restoration and rehabilitation of forests and to addressing the drivers of the problem A broad range of activities is needed to tackle the drivers of deforestation and support transitions to more sus-tainable economic development pathways
REDD+ finance can support the creation of enabling environments (eg capacity and institution building and policy and regulatory reform) and mitigation projects (eg creating protected areas or rehabilitating ecosys-tems) Transitioning from a project-by-project approach toward landscape and industry scale approaches would improve prospects of achieving reductions at scale
64 Bilateral fundsrsquo focus are also starting to move towards Nationally Ap-propriate Mitigation Actions (NAMAs) as demonstrated from for instance the early initiative of a group of Nordic countries financing such programs in Vietnam and Peru In Peru USD 3 million (EUR 22 million) will be invested in the waste management sector with bilateral funds from Nordic countries (Denmark Finland Iceland Norway Sweden via the so-called Nordic Partnership Initiative) and domestic money from Peru itself but also from the Nordic Environmental Development Fund In Vietnam the USD 21 million (EUR 15 million) NAMA will focus on the cement manufac-turing sector with financing from Nordic countries and Vietnam itself For additional information see NEFCO website (NEFCOorg)
65 Reducing Emissions from Deforestation and forest Degradation the sus-tainable management and conservation of forests and the enhancement of carbon stocks
by shifting production practices commodity supply chains and land use patterns across jurisdictions and geographies For instance programs aimed at reform-ing policies and creating incentives to intensify agricul-tural productivity thereby reducing pressure to convert forests to achieve increased yields and programs to create alternative livelihoods should be considered part of an effective REDD+ strategy A wide range of actors and sources of finance will be required to realize this broad scale transition including national and interna-tional public and private finance
The potentially broad scope of REDD+ activities adds to the challenges of tracking global financing flows data on which are particularly poor (Buchner et al 2011 Simula 2010 Streck and Parker 2012 ISU 2012 PWC 2011) Fragments of information available on current REDD+ flows suggest they are lagging far behind needs projected by the 2008 Eliasch Review to be around USD 17-33 billion per year by 2030 for a 50 reduction in deforestation
Current flows of REDD+ finance come largely from national and international governments with smaller but growing contributions from non-governmental organi-zations philanthropic and private sector sources The majority of international REDD+ financing to date has focused on lsquoREDD+ readinessrsquo66 building capacity and institutions and some demonstration projects while REDD+ activities at scale and lsquopayment for perfor-mancersquo activities have yet to gather pace
Selected estimates of annual REDD+ finance flows are presented in Appendix F to give a sense of the possible scale of current commitments Estimates include bilat-eral and multilateral flows and dedicated funds as well as forest carbon market flows The data suggest that current REDD+ flows could be approximately USD 13 billion per year67 The figures highlight the dominance
66 ldquoREDD readinessrdquo generally means that all the preconditions ndash in terms of institutional policy and regulatory frameworks ndash necessary to enable countries implement REDD measures are in place Under the UNFCCC Cancun Agreements countries are requested to develop a national strategy or action plan a national forest reference level a robust and transparent national forest monitoring system and a system for providing information on how the safeguards are being addressed and respected (UNFCCC 2010 - Cancun Agreements Art 71)
67 Where possible the value of commitments to approved projects is counted rather than the full value of pledges to funds Higher estimates of international public finance tend to include pledges The International Sustainability Unit (ISU) estimates that total REDD+ financing pledges for the period 2010-2012 based on reporting by donors through the VRD of USD 4 billion Streck and Parker (2012) estimate that international public finance currently accounts for around USD 3 billion per annum including multiannual pledges and funds
52
The Landscape of Climate Finance 2012
53
The Landscape of Climate Finance 2012December 2012 December 2012
Box 10 - Sectoral breakdown of public mitigation financeFigure 3 presents the sectoral breakdown of countriesrsquo bilateral aid including Fast-Start finance1 and DFIsrsquo support targeting climate change mitigation activities It also includes the estimated portion of public funds tracked from project finance reporting in the BNEF database which was entirely directed towards renewable energy projects2
The allocation of the various activities listed in the OECD CRS database (OECD 2012) against the presented sectors was based on the best available information (ie project purpose and description)3 The weights obtained for each sector were then applied to allocate the identified portion of Fast-Start finance devoted to mitigation
We acknowledge the presence of financial flows directed to projects not in line with our definition of climate finance such as money invested in research and development gas-fired power plants or projects with apparently no link to abatement interventions but rather linked to activities like human rights (eg ldquoCSO campaign against poverty hunger exclusion and violation of human rights in South Asiardquo) or peace-building conflict prevention and resolution (both marked as ldquosignificantrdquo in the OECD CRS dataset) Support to such activities was allocated to the category ldquoothersrdquo which also include multi-sector or unspecified aid MichaelowaMichaelowa (2011) also highlights issues related to donors incorrect coding and reporting to OECD DAC (see OCED 2010 for comments on MichaelowaMichaelowa 2011)
With regard to DFIs the breakdown of mitigation finance reflects institutions self-reporting against the sectoral categories provided in the financial survey In those cases where respondents provided different sectoral breakdown the projectcategory description was considered for allocating data against the chosen categories
To estimate the sectoral allocation of DFIsrsquo climate finance sourced from secondary data we used ndash depending on the institutiongroup of institutions considered ndash the following Ecofys-IDFC (2012) UNEP-SEI (2011) Annual Reports and BNEF (2012)
1 To allocate to the mitigation theme the USD 18 billion identified in Fast-Start Finance reporting for 2010 we applied the average share observed in the distribution of money between mitigation and adaptation projects during the 2010-2011 period as per Gibbs (2012) (714 including REDD vs 225) To this we added a share of the money directed to projects with multiple objectives computed according to the weight of mitigation versus adaptation projects on the total
2 The sectoral breakdown does not include Climate Funds money due to data availability issues3 Climate finance commitments retrieved from the OECD CRS data set and allocated to the energy efficiency sector refer to a portion of those
flows directed to measures aimed at improving the ldquopower quality and reliabilityrdquo of electrical transmissiondistribution networks A specific example is for instance a project titled ldquoPacific Power Utilities improved energy efficiencyrdquo We acknowledge that more detailed analysis is needed to understand what is behind each specific project ldquolabelrdquo
Figure 3 Sectoral breakdown of governmentsrsquo and DFIsrsquo mitigation finance (USD 804-837 billion)
0
10
20
30
40
50
60 RENEWABLE ENERGY GENERATION
ENERGY EFFICIENCY
SUSTAINABLE TRANSPORT
AGRICULTURE FORESTRY amp LAND USEOTHERS
WASTE amp WASTE WATER
CAPACITY-BUILDING
FUEL SWITCH
Note The total include Climate Fundsrsquo mitigation financing which is however excluded from the sectoral allocation due to data availability The category ldquoothersrdquo can include unspecifid or multi-sector aid or unallocated portions of DFIsrsquo financing
54
The Landscape of Climate Finance 2012
55
The Landscape of Climate Finance 2012December 2012 December 2012
of bilateral finance and support claims that bilateral finance for REDD+ has so far been faster to disburse than multilateral finance (ISU 2012)
This estimate however largely based on data for inter-national public flows does not account for domestic REDD+ finance which some experts estimate could be several times greater than international donor flows It is particularly difficult to determine the volume of domestic flows and few reliable estimates are available Streck and Parker (2012) estimate that approximately USD 25 billion per year is spent in Brazil Mexico and Indonesia alone and a further USD 7 billion annually is spent in China on afforestation activities Meanwhile Brazil Cameroon the Democratic Republic of Congo Gabon Indonesia Laos Mexico and Papua New Guinea report REDD+ self-finance amounts to USD 24 billion in the Voluntary REDD+ Database68 database (ISU 2012)
Private sector motivations to invest in REDD+ activities include carbon market compliance pre-compliance positioning and corporate social responsibility includ-ing voluntary carbon market participation While the volume of forest credits traded on voluntary markets dropped by almost half between 2010 and 2011 the average price of credits almost doubled meaning that the market held its overall value On the other hand sales of CDMJI forestry credits rose considerably between 2010 and 2011 (as the end of the Kyoto compli-ance period drew near) but average prices fell slightly (Peters-Stanley 2012) Some new emerging compliance carbon markets notably in Australia as well as nascent bilateral markets may provide new sources of demand going forward Aside from carbon markets Streck and Parker (2012) estimate that the private sector is cur-rently generating more than USD 1 billion each year through premiums associated with certified forest products at least part of which goes towards conserva-tion programs
Taken together available estimates of domestic international and private flows imply total REDD+ flows of around USD 118 billion per year This figure is not presented in the Climate Finance Flows Diagram 2012 at present given the figurersquos high level of uncer-tainty and poor underlying data sources It would appear however that domestic governments are the most significant contributors to REDD+ finance Engaging the private sector to drive sustainable produc-tion practices will be crucial to meaningfully tackle the drivers of deforestation supported by clear government
68 Source httpreddplusdatabaseorg
incentives and policies and support from the interna-tional community
Adaptation
Little agreement exists on what qualifies as adapta-tion finance or more narrowly what qualifies as an adaptation intervention Adaptation in fact encom-passes various types of activities which may span the entire vulnerability reduction-response to impacts continuum and which can be applied to a wide range of sectors (agriculture water energy etc) As a result most institutions are not yet equipped with a proper methodology for measuring adaptation finance although relevant efforts to establish tracking and reporting approaches are currently underway (eg the MDBsrsquo initiative on joint adaptation finance tracking)
Hence weaknesses in defining measuring tracking and reporting adaptation finance partial data from some multilateral players and the inability of existing efforts to capture private resources dedicated to such activi-ties hampered our understanding of adaptation finance flows
Given the definitional and methodological complexity surrounding the topic there are few estimates available so far as few have actually tried to truly identify and assess adaptation financing
In the Landscape 2012 we aim to highlight the progress achieved so far on this matter as well as underscore the remaining gaps
Our estimate of about USD 123ndash157 billion of adapta-tion finance comprises donorsrsquo bilateral aid (USD 1-44 billion) (OECD 2012)69 including USD 428 million of
69 Data are adjusted to exclude Bilateral Finance Institutionsrsquo contributions to this field
In 20102011 USD 123 ndash 158 billion was directed towards activities with adaptation objectives Accounting for 775 of the total public financial institutions were the predominant sources These institutions are also the holders of long-standing expertise in the field given their past experience in the areas of development assistance with relevance to adaptation
The biggest knowledge gap in adaptation financing is the role of the private sector which is not estimated in this study
54
The Landscape of Climate Finance 2012
55
The Landscape of Climate Finance 2012December 2012 December 2012
Fast-Start finance70 Climate Funds (USD 04 bn) and
70 The portion of the identified USD 18 billion in Fast-Start Finance reporting for 2010 directed to adaptation (USD 441 million) was estimated by ap-plying the average share observed on the thematic allocation of Fast-Start money over the 2010-2012 period as per Gibbs (2012) (714 to mitiga-tion including REDD vs 225 to adaptation) To this we added a share of the money directed to projects with multiple objectives computed according to the weights of mitigation versus adaptation projects on the total
DFIsrsquo support targeting climate change adaptation activities (USD 109 billion) and philanthropic contribu-tion from Foundations71 (USD 1055-134 million)
With regard to bilateral assistance in November 2011 the OECD-DAC published the first-ever complete
71 We allocated 50 of the identified USD 211ndash268 million of philanthropic contributions to climate-specific projects to adaptation measures See paragraph on ldquoGrants instrumentsrdquo
Box 11 - Sectoral breakdown of public adaptation financeBased on the information gathered we attempted to categorize adaptation finance by recipient sectors despite an international agreement on this has not been reached as yet We found that the agriculture and forestry and the water preservation supply and sanitation sectors were the main recipients of climate-resilient finance in 20102011 receiving 27 (USD 44 billion) and 23 (USD 38 billion) of the total respectively (see Figure 4)
Among individual contributors Bilateral Financial Institutions allocated 513 of their adaptation finance to the water sector Disaster risk reduction initiatives also represented an area in which Bilateral Finance Institutions were particularly active receiving 156 of their adaptation finance National players appeared critical in supporting the strengthening of the resilience of local infrastructure assets as well as the agriculture and forestry sector which were the recipients of 313 and 309 respectively of their adaptation finance
Among DFIs multilateral organizations on the other hand were the major providers of financial support towards capacity building and technical assistance initiatives in this area which accounted for 127 of their total adaptation finance Activities included awareness raising programs training to address vulnerabilities early warning systems and strengthening of institutions policies and regulations
Dedicated Climate Funds also played a role in adaptation financing albeit limited compared to the total accounting for about 25 They are however proving critical in financing pilot and demonstration projects and in promoting the integration of climate risk and resilience into development policies and planning This is particularly the case of the Pilot Countries for Climate Resilience (PPCR) a program operating within the Climate Investment Funds framework which by channelling 45 of the total Climate Fundsrsquo finance (or USD 1548 million) stands out as the major contributor in this area
Figure 4 Sectoral breakdown of governmentsrsquo and DFIsrsquo adaptation finance
0
5
10
15
20
25
30
AGRICULTURE AND FORESTRY
WATER PRESERVATION SUPPLY AND SANITATION
OTHERSINFRASTRUCTURE
(CAPACITY-BUILDING TECHNICAL ASSISTANCE)
DISASTER RISKREDUCTION
Note Climate Fundsrsquo adaptation financing (USD 352 million) and the estimated portion of philanthropic contributions targeting adaptation (USD 120 million) are excluded from the sectoral breakdown due to data availability issues The category ldquoothersrdquo can include for instance unspeci-fied or multi-sector aid or unallocated portions of DFIsrsquo financing
56
The Landscape of Climate Finance 2012
57
The Landscape of Climate Finance 2012December 2012 December 2012
Creditor Reporting System dataset on aid for climate change adaptation whose ldquomarkerrdquo was approved by member countries in 2009 (OECD 2011)72 While donors inappropriate coding73 affects the true magni-tude of the identified flows (Junghans and Harmeling 2012) this has brought to light their contributions to the field advancing understanding on how much money is going to advance the adaptation agenda
Elaborating on the OECD-DAC methodology which is ldquoobjective basedrdquo74 the World Bank has developed an ldquoactivity-basedrdquo system that tracks spending on activi-ties with adaptation co-benefits at the sub-component level75 ldquoonly if they explicitly include climate adaptation reasoning and directly address vulnerability or impact from climate variability and changerdquo (IEG 2012) This system was introduced in 201276
This initiative feeds into the group of MDBs currently working on a joint approach for adaptation finance tracking (AfDBorg IDB et al 2012) The outcomes of this effort which will be released at COP 18 are hence not fully reflected in our figures
Four MDBs in fact opted to report on mitigation only while in the process of finalizing the above mentioned methodology others estimated adaptation financ-ing following the DAC Rio Marker as selection criteria for adaptation activities (eg EBRD KfW and JICA) The World Bankrsquos figures reflect instead the newly piloted methodology More information is needed on the approaches followed by NFIs for reporting to understand what is actually counted against this theme Those surveyed by us or under the Ecofys-IDFC (2012) initiative were requested to report according to the OECD definition
72 This marker captures those activities that aim ldquoto reduce the vulner-ability of human or natural systems to the impacts of climate change and climate-related risks by maintaining or increasing adaptive capacity and resiliencerdquo For additional information see OECD website (OECDorg)
73 Junghans and Harmeling (2012) reveal that about 65 of the activities in the adaptation dataset are unrelated to it or do not identify adaptation as a ldquosignificantrdquo or ldquoprincipalrdquo target while about half of the remaining 35 are over-coded eg reporting adaptation as a primary objective when it should have rather been reported as secondary
74 In the OECD CRS database a project is marked as having adaptation as a ldquoprincipal objectiverdquo if ldquothe activity would not have been funded but for that objectiverdquo or as having a ldquosignificant objectiverdquo if the intervention was ldquoformulated or adjusted to help meet climate concernsrdquo (OECD 2011 IEG 2012)
75 The typology of activities with climate co-benefits by World Bank sector can be consulted at the Worldbankorg website
76 For more information see also World Bank website at httpclimatechangeworldbankorgcontenttracking-finance
The biggest knowledge gap in adaptation financing is the role of the private sector Businesses house-holds and other private groups have a vested interest in engaging in climate initiatives particularly when climate change may directly affect their main sources of revenue The private sectorrsquos financial support can take the form of investments aimed at climate-proofing businesses and assets77 corporate social responsibility initiatives as well as philanthropic contribution
Geographical distribution of climate financeThe Landscape 2012 strives to unveil additional informa-tion on domestic climate finance flows This is reflected in the private flows categorization and the expanded coverage of Development Finance Institutionsrsquo climate expenditures
We find that USD 193 billion of global climate finance or 53 goes to projects in developed countries Some notable sources include the following
bull USD 62 billion comes from corporate actors (including a significant portion of small-scale renewable investment)
bull USD 58 billion comes from project developers
bull USD 24 billion comes from commercial financial banks (reflecting higher recourse to project-level debt financing) and
bull USD 24 billion comes from German and Italian households (investing in solar PV)
In developed countries the largest contributors are private actors (89)
We also find that USD 171 billion of global climate finance goes to projects in developing countries Some notable sources include the following
bull USD 70 billion comes from Development Finance Institutions
bull USD 65 billion comes from (mostly domestic) project developers
77 The UNFCCC maintains a database of private sector action on adaptation (PSI) Activities may encompass those aimed to ensuring the resilience of business operations or the supply of technologiesservices in support of vulnerable communities The PSI is a voluntary initiative intended to raise awareness about climate change adaptation in the private sector It also responds to the mandate given to the secretariat by the Parties of the Convention to engage stakeholders in enhancing the response to climate change Financial aspects related to the various cases presented is not readily available or whether specified not verified by the UNFCCC secretariat For additional information see UNFCCCint
56
The Landscape of Climate Finance 2012
57
The Landscape of Climate Finance 2012December 2012 December 2012
Box 12 - How is Germany financing its energy transition Financing the Energiewende
The private sector is proving pivotal in financing the German energy transition In 2010 the private sector financed contributed more than 95 of total climate finance invested in the country providing USD 478 billion
Germany plays a central role in European decarbonization The government has set ambitious climate and energy targets to reduce emissions 80-95 below 1990 levels by 2050 (Energy Concept 2010) while phasing-out nuclear energy by 2022 (2011 Energy Transition Energiewende)
In 2010 at least USD 491 billion (15 of GDP) was invested to support the German transition to a low-carbon economy (CPI 2012)
The private sector provided more than 95 of climate finance in Germany almost half of which was supported by concessionary loans from development banks Thus the public sector played an important role in supporting private investment The bulk of private money came from corporate investors (USD 292 billion) led by corporations in the energy sector Private households invested a significant USD 186 billion
Besides the concessionary loans the high share of private investment coincided with other incentives such as the Feed-in Tariff In 2010 the Feed-in tariff paid to households and corporate renewable energy generators amounted to approximately USD 174 billion equivalent to 49 of the actual total capital investment in renewable energy in that the same year This underlines the importance of the FiT in influencing renewable energy investorsrsquo decisions
The federal-level development banks KfW and Rentenbank provided at least USD 219 billion of concessional loans for climate-specific investments which represented a 43 share of total capital investment in renewable energy and 72 of total incremental investment in energy efficiency1 The significant role of concessionary loans highlights the importance of public finance instruments beyond just direct subsidies and grants
Renewable energy generation capital investments in buildings energy utilities agriculture and industry amounted to USD 353 billion Corporations across sectors invested USD 216 billion while private households invested a significant USD 131 billion in the building sector renewable energy capacity Energy efficiency amounted to USD 96 billion of incremental investment the householdsrsquo share of which was USD 54 billion (57) Investments in efficient buildings accounted for the largest share of energy efficiency investment with USD 77 billion
Is Germany on track Whether or not climate-specific finance in Germany was sufficient in 2010 to meet Germanyrsquos climate and energy targets is difficult to answer No comprehensive estimate is available for the total investment required for reaching these targets However CPI Report (2012) assessment of the distribution of climate finance across different uses provides a basis for focusing subsequent in-depth analysis on this regard
Prepared by Rodney Boyd (CPI Berlin rodneyboydcpiberlinorg)
Based on ldquoThe Landscape of Climate Finance in Germanyrdquo CPI (2012)
1 Please note the referenced study reports figures for total capital investments for renewable energy and incremental investments for energy efficiency
58
The Landscape of Climate Finance 2012
59
The Landscape of Climate Finance 2012December 2012 December 2012
Box 13 - Geographical distribution of public climate financeThe Figure 4 presents the geographical distribution of countriesrsquo bilateral aid including Fast-Start financing and DFIsrsquo money This graph highlights that with approximately USD 389 billion ndash 47 of total public finance ndash emerging giants like China and Brazil were the largest recipients of climate finance flows Notably this reflects the weight of the China Development Bank and Brazilrsquos BNDES in delivering domestic money in pursuit of development mandates In fact 333 of Development Finance Institutionsrsquo finance goes to China while 179 goes to Brazil
The governmentsrsquo budgets breakdown does not include the estimated portion of public funds tracked from project finance reporting from the BNEF database about USD 11 billion as the detailed split per country could not be retrieved We can however infer that 64-72 of that pertains to developed countries ndash mainly the US and Germany
ndash while the remaining 28-36 to developing countries mainly in Asia The allocation of bilateral aid per recipient countries was retrieved from the OECD CRS data set (OECD 2012)
With regard to DFIs the breakdown of their climate finance by beneficiary country reflects institutionsrsquo self-reporting against the geographic categories provided in the financial survey When respondents provided different sectoral breakdowns data were allocated against the selected macro-areas categories1
To estimate the breakdown by recipients countries for those DFIsrsquo we did not have detailed data for we used ndash depending on the institutiongroup of institutions considered ndash the information presented in the following Ecofys-IDFC (2012) UNEP-SEI (2011) and entitiesrsquo annual reports In some cases we applied the average share observed in other DFIs In particular we assumed that the China Development Bank ndash which accounts for the largest single share of NFIsrsquo climate finance ndash invested domestically (see also Ecofys-IDFC 2012)
1 For instance one respondent provided finance allocated for macro-regions such as ldquoEast Asia amp Pacificrdquo and ldquoSouth Asia Regionrdquo according to their tracking procedures In this case all money was allocated to our ldquoOther Asiardquo category
Figure 4 Geographical distribution of government budgets and Development Finance Institutionsrsquo climate financing
CHINA
BRAZIL
OTHER ASIAOTHER LAC
EUROPEOTHER AFRICA
INDIA
OTHERS
MENA
C AMERICA
S AFRICA
OCEANIA
N AMERICA
0
10
20
30
Note Government budgets data refers to OECD DAC money only (OECD 2012) Data do not include the estimated portion of public funds tracked from project finance reporting in the BNEF database for about UDS 11 billion The category ldquoothersrdquo refers to bilateral contributions whose recipients were not specifid or money distributed to transnationaltransregional projects
bull USD 13 billion comes from corporate actors
bull USD 12 billion comes from commercial financial banks
Compared to developed countries climate projects in developing countries rely more on balance sheet financing and instruments from development banks
The share of private sector contributions to climate finance in developing countries is around 57
58
The Landscape of Climate Finance 2012
59
The Landscape of Climate Finance 2012December 2012 December 2012
Box 14 - Financing Renewable Energy Generation and Energy Efficiency in China
Chinarsquos ambition to shift to a greener economy is reflected in the significant investments made in the renewable energy and energy efficiency sectors over the past few years
In terms of gross investment in renewable energy China has led the world for the past three years as gross investment in renewable energy increased 51 from USD 337 billion in 2009 to USD 51 billion in 2011 In 2011 877 of the total investment was devoted to wind power and solar PV which reached 624 GW (about 25 of worldrsquos capacity) and 31 GW (44 of the global market1) accumulated installed capacity respectively
With USD 396 billion or 886 of the total asset financing was the primary method of supporting wind and solar PV projects This is typically arranged with an 8020 debt to equity ratio in the case of wind where developers are requested by law to take at minimum a 20 equity stake and borrow the remaining from state-owned or policy-related banks The ratio is different for distributive PV projects where developers take equity stakes for 30 borrow 20 from banks and get the remaining 50 in the form of grants under the ldquoGolden Sun demonstrationrdquo and the Building-integrated PV (BIPV) subsidy programs introduced in 20092
State-owned enterprises (SOEs)3 are the major developers in both the wind and solar PV markets accounting for 799 and 61 of total installed capacities respectively SOEs have privileged access to credit from financial institutions thanks to their long-established relationship with state-owned banks
1 The National Development and Reform Commission has revised the 12th Five Year Plan solar PV target from 15 GW to 21 GW by the end of 2015 in order to boost the domestic solar PV market and to absorb the excess supply due to US anti-dumping and anti-subsidy tariffs On Oct24 2012 the Information Office of the State Council published the 2012 edition of white paper on Chinarsquos Energy Policy which claimed that Chinarsquos installed generating capacity of solar energy was expected to exceed 21GW by 2015
2 The BIPV subsidy program provides upfront subsidies for grid-connected rooftop and BIPV systems 3 SOEs include national provincial and municipal level state-owned enterprises and their subsidiariesspinoffs
bull State-backed enterprises shape the current outlook of Chinarsquos solar PV and wind power generation
bull China invested a sum of USD 142 billion to improve energy efficiency over the 11th Five-Year Plan (2006 to 2010) Private finance accounted for 83 of that total
Figure 5 Sectoral breakdown of Chinarsquos energy efficiency investments
0
20
40
60
80
INDUSTRY BUILDING TRANSPORT
Perce
nt o
f tot
al
CAPACITY BUILDING
60
The Landscape of Climate Finance 2012
61
The Landscape of Climate Finance 2012December 2012 December 2012
and their solid balance sheets which can serve as loan guarantees
China was also a leader in investment in the energy efficiency sector Investment in energy efficiency was driven by the mandatory targets set in the 11th Five-Year Plan (FYP) to reduce national energy intensity by 20 from 2005 levels by 2010 Over the course of the Plan (2006-2010) Chinarsquos energy efficiency investment reached a cumulative amount of USD 120 billion
Private finance represented the lionrsquos share of total energy efficiency finance 79 of the total USD 120 billion invested corporations provided USD 533 billion households contributed USD 19 billion commercial banks provided USD 38 billion and the stock market raised USD 16 billion Private funding was raised in the form of direct equity and debt investments
Public money contributed USD 229 billion (191) The central government supported energy efficiency programs in the industrial building and transport sectors with USD 152 billion (127) in the form of direct investment subsidies rewards transfer payments government procurements and concessional loans Provincial and lower-level governments provided USD 77 billion (64) as local supplements to support activities in their jurisdictions International institutions and international carbon market contributed additional USD 23 billion (19)
The industrial sector attracted the greatest share of money 89 or USD 107 billion to undergo energy audits technology upgrades facility retrofitting and closure of outdated plants
Energy efficiency investment in the 11th FYP surpassed the amount invested in any previous FYPs The vast scale of investment was critical to Chinarsquos energy target achievement in the 11th FYP period On average the ratio of public funding to ldquoprivate investmentrdquo was 1 to 423 This leverage effect should however be interpreted by keeping in mind that there are governmental resources ldquositting-behindrdquo private investments
Prepared by Dong Wenjuan and Yu Yuqing (CPI Beijing dongwenjuancpibeijingorg yuyuqingcpibeijingorg)
Based on forthcoming ldquoAnnual Review of Low-Carbon Development in China (2013)rdquo CPI Report
60
The Landscape of Climate Finance 2012
61
The Landscape of Climate Finance 2012December 2012 December 2012
4 Conclusions and the way forwardA comprehensive picture of todayrsquos climate finance flows will improve our collective understanding not only about how much and what type of finance is provided to promote low-carbon climate-resilient development but how the world stands in relation to global finance and temperature goals With a comprehensive picture we can begin to identify how different types of support cor-respond to different needs and whether resources are being spent productively This understanding is critical to highlight emerging trends and position policy makers and investors to respond to the challenges effectively
The Landscape 2012 builds and improves upon CPIrsquos initial effort to provide a snapshot of the current climate finance landscape Our methodology draws on a wide variety of tracking initiatives and information systems to estimate the possible scale of available finance This study highlights that there is not one single climate finance story climate finance archetypes differ by country and circumstance In addition a number of actors have distinctive responsibilities Public and private intermediaries continue to play a pivotal role in distributing climate finance National banks are playing a growing role in channeling resources Private com-mercial banks and infrastructure funds are also critical players they intermediate both project finance debt and direct investments In addition better information about private finance flows highlights the various private sector representatives that are active in climate invest-ments on the primary investment and lending sides mdash including institutional investors albeit to a small extent mdash and clean technology manufacturers engaged in vendor financing
The Landscape 2012 suggests that annual global climate finance flows reach between USD 343 - 385 billion in 2010-2011 or USD 364 billion on average Although close to 75 of this comes from private sources the public sector plays a pivotal role by providing funds that catalyze private sector investment These figures shed light on global efforts to match the global financing need Overall while money is clearly flowing to low-car-bon climate-resilient development investment levels fall far short of that required to limit global temperature rise to below two degrees Celsius The International Energy Agency projects that incremental investment in the energy sector will need to reach USD 36 trillion over the period of 2012-2050 ndash or approximately USD 1 tril-lion each year (IEA 2012) This estimate highlights just
how much more finance is required to fund the transi-tion toward a low-carbon climate resilient future
The amounts represented in the Landscape 2012 reflect better data and increased coverage The Landscape 2012 aimed to address some of the major information gaps identified in the Landscape 2011 Building upon the Landscape 2011 the Landscape 2012 better captures the magnitude and nature of climate finance flows between and within countries We expanded the geographic scope covered more types of actors and collected better information about the recipients of finance Most importantly by untangling private sector flows we have improved our understand-ing about the actual sources of money where it is going and through which financial instruments This has been particularly true in the case of domestic flows
Nonetheless there is room for improvement Reporting gaps and inconsistent labels and definitions hamper our ability to track and fully capture the scale and effective-ness of climate finance Climate Policy Initiative will con-tinue to build and improve upon this understanding in future Landscapes and through other ongoing efforts78
Emerging key issuesThis study confirms and elaborates upon several find-ings from the Landscape 2011
Private capital is essential and makes up the lionrsquos share of global climate investment flows
Public resources alone cannot finance the transition to a low-carbon climate-resilient future unlocking private sector capital will be essential The Landscape
78 To unlock sufficient climate finance for a low-carbon climate-resilient transition it is essential to increase climate finance effectiveness based on the optimal balance between public and private capital To shed light on how to do this CPI in collaboration with the World Bank Group CLP and the OECD established the San Giorgio Group a new working group of key financial intermediaries and institutions actively engaged in green low-emissions finance The core objective of the Group is to analyze how to mobilize and deploy adequate and effective finance to achieve low-carbon climate-resilient development To address the weak understanding of climate finance effectiveness CPI has initiated within the San Giorgio Group a work stream on concrete case studies to build up knowledge on elements that make investments successful from a financial environmen-tal organizational and political perspective By building up an evidence base what works and what doesnrsquot the goals is to learn from the wide range of existing and evolving financing practices to provide insights on how to scale up climate finance and spend available resources more wisely For more information see httpclimatepolicyinitiativeorgvenicesan-giorgio-group
62
The Landscape of Climate Finance 2012
63
The Landscape of Climate Finance 2012December 2012 December 2012
2012 highlights the relationship between public and private sources and suggests that a major portion of private investment relies on public finance to create an environment where investments are viable There is a clear incidence of public money standing behind private investments particularly in the emerging economies of China and Brazil
Well-targeted public capital can make investments go further
Well-targeted public resources are an essential element of transformational climate investment structures Most public money (almost 80) is currently delivered through national bilateral and multilateral organiza-tions While public institutions generally take the risk for money channeled through these organizations the money itself can be largely raised from private sources Our findings suggest a number of best practices are emerging in developing and developed countries where well-targeted public capital is starting to unlock
significant investment The Landscape 2012 also shows that bilateral public funding increased despite fiscal austerity and tightening credit context likely reflecting the impact of fast-start finance pledges
Looking forward public money remains essential but given its scarcity we need to understand its role (ie which risks should reside with the public sector and which should reside with the private sector and how the scale of these risks depends on the nature of the investments) to spend available resources wisely Public funds especially international public money should only pay for those risks the private or national public investments will not bear and the scale of these publicly offloaded or assumed risks depend on the nature of the investment
Domestic finance is a key element
Our findings underline the importance of domestic finance in addressing the global challenge of climate change The Landscape 2012 highlights that a large
Box 15 ndash Tracking issues
Many organizations maintain databases andor prepare reports about particular elements of the climate finance landscape However there is no integrated international system for storing this data many flows are not systematically measured reported or verified and where tracking efforts are in place granularity and consistency varies (cf Buchner et al 2011) This hampers efforts to compare and aggregate data and assess the effectiveness of finance
As the sources and volumes of climate finance increase the challenge to track and analyze flows will become greater While many organizations are working to improve these systems a number of areas require urgent attention
bull Transparency and consistency in definitions - what is counted and reported as climate finance including sectoral boundaries and whether total project value or only relevant portions of investments are counted
bull A clearer distinction between incremental costs and investment capital
bull Related to this a better understanding of how incremental support and specialized risk instruments stimulate investment and
bull Improved information about domestic and private flows of finance Most clean development investment will need to come from national private sources but data remains scarce
Based on ldquo The Landscape of Climate Financerdquo CPI Report (2011)
Many organizations are engaged in efforts to track aspects of the climate finance picture but several gaps remain
These gaps hamper efforts to compare and aggregate data and assess the overarching effectiveness of finance
62
The Landscape of Climate Finance 2012
63
The Landscape of Climate Finance 2012December 2012 December 2012
proportion of public investment reflected domestic gov-ernment support toward structural changes in energy systems as engines of economic growth Further infor-mation on private finance shows that domestic private actors play a key role
Emerging economies play a key role
Roughly one third of global mitigation investments are located in China Brazil and India Further a significant share of investment in these three countries is raised domestically and disbursed by state-owned entities in pursuit of development mandates We hope that these leaders signal a trend among other developing countries toward low-emissions climate-resilient growth as a practical and productive national development strategy
Understanding about adaptation finance is still scarce
While the large majority of climate finance is still used for mitigation measures we have been able to capture more money that is beginning to be invested in adapta-tion activities This reflects new tracking initiatives that specifically address the information gap on adaptation finance However data inconsistencies and the difficul-ties in defining what constitutes adaptation finance (and where the boundaries between adaptation and develop-ment finance are) hamper our understanding
Next steps for data gathering and analysisTo improve the worldrsquos understanding of climate finance and to put current climate finance flows in per-spective the following key issues need to be addressed
Comprehensiveness mdash further expansion of scope and coverage
This study emphasizes the relative importance of private finance Further information on private finance is needed particularly related to non-project level entry points for finance to better understand corporate sources of capital for balance sheet financing
The Landscape 2012 also confirms the essential role of a number of actors including international national and local financial institutions and households Additional detail on these institutionsrsquo financing including infor-mation about the new methodology that Multilateral Development Banks79 are developing for tracking and
79 Including the African Development Bank (AfDB) the Asian Development Bank (ADB) the European Bank for Reconstruction and Development (EBRD) the European Investment Bank (EIB) the Inter-American Develop-ment Bank (IDB) the World Bank (WB) and the International Finance Corporation (IFC)
accounting mitigation and adaptation finance will improve our understanding of their role in climate finance We also need better information on domestic-level finance and on financing channels for households A better overview of climate funds particularly national ones would further improve the comprehensiveness of the climate finance landscape
Finally better information on the role of specific sectors (such as energy efficiency and non-energy sectors) and uses (such as adaptation and enabling environment finance) and better mapping of specific instruments (such as tax incentives) is needed
The dimensions of climate finance mdash clarify net climate finance flows
The Landscape 2012 takes both incremental costs and investment capital into account It focuses on gross flows due to the difficulty of calculating incremental cost and net values of all finance flows due to the importance of understanding the full volume of finan-cial flows delivered Gross flows also tell a story about upfront support that is needed to encourage further investments Ultimately it is instructive to understand net contributions by countries and actors and to obtain a good understanding of incremental costs compared with business-as-usual or ldquobrownrdquo investments This is particularly important to understand how global efforts are tracking against the financing levels needed to stabilize average global temperature below two degrees Celsius Proxies are necessary to better understand these dimensions In this context the role of risk mitiga-tion and policy instruments in addressing incremental costs warrant further work
The impact mdash increase understanding of climate finance effectiveness
The biggest gap in todayrsquos climate finance landscape remains the lack of a sound understanding about whether finance flows are being used effectively and whether they adequately address the challenges posed by climate change and global needs We need more efforts to define and describe what constitutes effective climate finance starting with lessons from the important experiences of organizations already working to measure the impact of climate finance In fact a number of countries and DFIs are now actively developing frameworks to measure and evaluate the performance of the climate finance they are providing delivering andor receiving (Buchner et al 2012) fos-tering more streamlined reporting frameworks
64
The Landscape of Climate Finance 2012
65
The Landscape of Climate Finance 2012December 2012 December 2012
More rigorous monitoring and reporting can aid learn-ing planning and budgeting at the country level and thus drive effectiveness improvements However more than just tracking will be required analysis of policy effectiveness will also be critical In addition to CPIrsquos effort to build up an evidence-based bottom-up database of success and failure stories related to climate finance (the San Giorgio Group case studies)80 there is a need to explore how effectiveness can also be ascribed to the climate finance landscape Possibilities include the calculationindication of expected avoided carbon emissions carbon cost per unit and co-impacts A further option to increase the understanding about the effectiveness of climate finance is to relate public money contributions to estimates of incremental costs Finally disbursement channels are also key for effective climate finance spending and more information on this element could improve the understanding of climate finance effectiveness
The benchmark mdash exploration of business-as-usual (ldquobrownrdquo) finance flows
To put climate finance estimates into perspective com-parable estimates of traditional ldquobrownrdquo or business-as-usual finance are a useful benchmark to check whether there is real progress towards a low-carbon climate-resilient future
CPI remains committed to improving the understanding and transparency of todayrsquos climate finance landscape
80 Within the San Giorgio Group CPI works on concrete case studies to build up knowledge on elements that make investments successful from a financial environmental organizational and political perspective We aim to provide credible information on how to ramp up public expenditures integrate national and international capital streams leverage public funds with private flows efficiently and invest the aggregate wisely For more information see httpclimatepolicyinitiativeorgpublicationsan-giorgio-group-case-studies
64
The Landscape of Climate Finance 2012
65
The Landscape of Climate Finance 2012December 2012 December 2012
Index of acronyms AAU Assigned Amount UnitAsDB Asian Development BankAF Adaptation FundAFD Agence Franccedilaise de DeacuteveloppementAfDB African Development BankAGF High-Level Advisory Group on Climate Change FinancingBFI Bilateral Finance Institution BIPV Building Integrated PhotovoltaicBNDES Brazilian Development BankBNEF Bloomberg New Energy FinanceCAF Development Bank of Latin America CDB China Development BankCDC Caisse des DeacutepocirctsCDM Clean Development Mechanisms CEA California Environmental AssociationCER Certified Emissions Reductions CIF Climate Investment Funds CRS Creditor Reporting SystemDAC Development Assistance Committee DBSA Development Bank of Southern AfricaDFI Development Finance InstitutionsEBRD European Bank for Reconstruction and Development ECA Export Credit Agency EDF Environmental Defense FundEEA European Energy AgencyEEC European Economic CommunityEIB European Investment BankEU European UnionEU ETS European Union Emissions Trading SystemFDI Foreign Direct Investment FiT Feed-in TariffFYP Chinarsquos Five-Year PlanGEF Global Environmental Facility GHG Greenhouse Gas Emissions IBRD International Bank for Reconstruction and Development ICI International Climate InitiativeIDA International Development Association IDB Inter-American Development BankIEA International Energy AgencyIFC International Finance CorporationIFCI International Forest Carbon InitiativeIGES Institute for Global Environmental StrategiesIIED International Institute for Environment and DevelopmentIREDA Indian Renewable Energy Development AgencyJI Joint Implementation JICA Japan International Cooperation AgencyJVETS Japan Voluntary Emissions Trading SchemeKFW KFW Entwicklungsbank (German Development Bank)MDB Multilateral Development BankMFI Multilateral Finance InstitutionNAFIN Nacional Financiera Development Bank
NDF Nordic Development Fund NFI National Finance InstitutionODA Official Development Assistance ODI Overseas Development InstituteOECD Organization for Economic Co-operation and DevelopmentOPIC Overseas Private Investment CorporationOTC Over-the-CounterREDD Reducing Emissions from Deforestation and Forest
DegradationREN21 Renewable Energy Policy Network for the 21st Century RGGI Regional Greenhouse Gas InitiativeSOE State-Owned Enterprise including national provincial
and municipal level state-owned enterprises and their subsidiariesspinoffs
TNC The Nature ConservancyUNDP United Nations Development Programme UNEP United Nations Environment ProgrammeUNEP-Risoslash United Nations Environment Programme Risoslash Centre on
Energy Environment and Sustainable DevelopmentUNFCCC United Nations Framework Convention on Climate ChangeVER Voluntary Emissions ReductionsWB World Bank
66
The Landscape of Climate Finance 2012
67
The Landscape of Climate Finance 2012December 2012 December 2012
GlossaryCRS
The Creditor Reporting System is a database of individual aid activities which contains detailed quantitative and descrip-tive data on individual aid projects and programs It enables analysis of the sectoral and geographical breakdown of aid for selected years and donors
DAC
The Development Assistance Committee is the committee of the OECD which deals with development co-operation matters At present there are 24 members of the DAC Australia Austria Belgium Canada Denmark Finland France Germany Greece Italy Ireland Japan Korea Luxembourg the Netherlands New Zealand Norway Portugal Spain Sweden Switzerland the United Kingdom the United States and the European Commission
EXPORT CREDITExport credits are government financial support direct financing guarantees insurance or interest rate support provided to foreign buyers to assist in the financing of the purchase of goods from national exporters (OECD 2012d)
FAST-START FINANCE
The Copenhagen Accord obliges developed countries to collectively provide fast-start finance to developing countries in the amount ldquoapproaching USD 30 billion for the period 2010-2012rdquo for enhanced action on mitigation (including Reducing Emissions from Deforestation and forest Degradation REDD) adaptation technology development and transfer and capacity building
GRANT Transfers made in capital goods or services for which no repayment is required
INCREMENTAL COST AND
INVESTMENT CAPITAL
Incremental cost and investment capital are both important lenses for climate finance flows Incremental cost refers to financial resources provided to compensate the difference between a less costly more polluting option and a costlier more environmentally friendly andor climate-resilient one Investment capital refers to tangible investment in mitigation or adaptation projects Whereas investment capital is paid back to the investor incremental costs often are not and are often funded by public climate finance support either through policy support or concessional finance
INFRASTRUCTURE FUND
ldquoFunds focused on making direct financial investments in projects across the following sectors power (renewables coal-fired gas turbine and nuclear) water (treatment and distribution) transportation (airports ports roads parking lots and rail links) social (prisons hospitals and schools) and utilities (gas distribution electricity transmission fixed-line telephone and mobile telephone)rdquo (PFI Global Infrastructure Report 2007 ldquoThe rise of infra fundsrdquo retrieved from httpcrgpstanfordedupublicationsarticles_presentationsOrr_01_Infra_funds_2007pfiepdf)
JOINT IMPLEMENTATION
(JI)
Track 1 JI Simplified approval process for JI projects where the host Party is considered to fulfill all the eligibility require-ments of the Kyoto Protocol on emission reportingTrack 2 JI Parties that have not met the Kyoto Protocol requirements on emission reporting can carry out JI projects under a more rigorous approval regime
ODA
Official Development Assistance is defined as those flows to developing countries (countries and territories on the DAC List of ODA Recipients) and to multilateral agencies in the form of grants or loans which are provided by the official sec-tor aimed to promote economic development and welfare given at concessional financial terms (if a loan having a grant element of at least 25) In addition to financial flows technical co-operation is included in aid
PRIVATE EQUITYldquoPrivate equity invests in private companies (hellip) to distinguish it from lsquopublic equityrsquo investments in stock markets (hellip) Private equity funds acquire established companies in old industries with the aim of reviving their fortunes (hellip) Private equity funds come in all shapes and sizesrdquo (EVCA website httpevcaeuwhat-is-private-equity)
REDD+REDD+ goes beyond deforestation and forest degradation and includes the role of conservation sustainable management of forests and enhancement of forest carbon stocks
66
The Landscape of Climate Finance 2012
67
The Landscape of Climate Finance 2012December 2012 December 2012
RIO MARKERS(RMS)
The Rio Markers (RMs) are indicators of the degree of relevance of a given activity in addressing the objectives of the three ldquoRio Conventionsrdquo (the United Nations Convention on Biological Diversity (CBD) the United Nations Framework Convention on Climate Change (UNFCCC) and the UNCCD) The screening of an activity against the objectives of a Convention will result in the following scores0 (not targeted) means that the activity is found not to be targeted to the Convention1 (significant) means that targeting the objectives of the Convention is an important but secondary purpose of the activity (ie not one of the principal reasons for undertaking the activity)2 (principal) means that targeting the objectives of the Convention is an explicit objective of the activity and fundamental in its design (ie the activity would not have been undertaken without this objective)3 (Action ProgrammeAP-related) for desertification only It means that the activity was undertaken to combat desertifi-cationland degradation as a principal objective and in support of an action programme (NAP SRAP or RAP) to implement the UNCCD
VENTURE CAPITALldquoVenture capital is a type of private equity focused on start-up companies Venture capital funds often back entrepreneurs who have just the germ of a business ideardquo (EVCA website httpevcaeuwhat-is-private-equity)
68
The Landscape of Climate Finance 2012
69
The Landscape of Climate Finance 2012December 2012 December 2012
ReferencesAgence Franccedilaise de Developpement (AFD) (2011)
ldquoResults and Lessons Learned from AFDrsquos Opera-tions in the fight Against Climate Change from 2005 to 2010rdquo Paris France
Agence Franccedilaise de Developpement (AFD) (2012) ldquoLrsquoactivite Financiegravere du Groupe AFD Dans la Lutte Contre le Changement Climatique Resultats pour 2011rdquo Paris France
Agence Franccedilaise de Developpement (AFD) (2012) ldquoScreening Tool For Classification of laquo Adaptation raquo Projects From The AFD Grouprdquo Paris France
AGF (UN Advisory Group on Climate Change Financ-ing) (2010) ldquoReport of the Secretary-Generalrsquos High-level Advisory Group on Climate Change Financingrdquo New York United States United Nations
Asian Development Bank (ADB) (2012) ldquoAnnual Report 2011rdquo Manila Philippines
Atteridge A C Kehler Siebert R J T Klein C Butler and P Tella ldquoBilateral Finance Institutions and Climate Change A Mapping of Climate Portfoliosrdquo prepared by the Stockholm Environment Institute for the Climate Change Working Group for Bilat-eral Finance Institutions November 2009
Banco Estado (2012) ldquoAnnual Report 2011rdquo Chile
Bloomberg New Energy Finance (2011) ldquoThe Past and Future of Development Bank Finance to Clean Energy Projectsrdquo Clean energy Research Note April 2011
Bloomberg New Energy Finance (2012a) ldquoVital Sta-tistics of Development Bank Funding for Broad Clean Energyrdquo Louw A July 2012 London United Kingdom
Bloomberg New Energy Finance (2012b) ldquoMemo to Policy Makers Re-charge the Development Banksrdquo Monthly VIP Comment Monthly Clean Energy Comment for Senior Executives McCrone A Volume V Issue 60 April 2012
BNDES (2012) ldquoAnnual Report 2011rdquo available at httpwwwbndesgovbrSiteBNDESexportsitesdefaultbndes_ptGaleriasArquivosempresaRelAnualra2011relatorio_anual2011_trilinguepdf
BNDES (2012b) Personal Communications and direct reporting April-August 2012
Buchner B Brown L Corfee-Morlot J (2011) ldquoMoni-toring and Tracking Long-Term Finance to Support Climate Actionrdquo OECD COMENVEPOCIEASLT(2011)3
Buchner B Falconer A Herve-Mignucci M Trabacchi C Brinkman M (2011) ldquoThe Landscape of Climate Financerdquo CPI Report October 2011
Buchner B A Falconer C Trabacchi and J Wilkinson (2012) A Survey of Systems to Monitor and Evalu-ate Climate Finance Effectiveness A CPI Report July 2012
Buchner B J Brown and J Corfee-Morlot (2011) ldquoMonitoring and Tracking Long-Term Finance to Support Climate Action httpwwwoecdorgenvironmentclimatechange48073739pdf
Caijing News (2012) ldquoChinarsquos Photovoltaic Industry on Brink of Bankruptcy Reportrdquo httpenglishcaijingcomcn2012-08-08111998243html accessed online at 2012-09-06
CEA (2007) ldquoDesign to Win Philanthropyrsquos Role in the Fight against Global Warmingrdquo California Environ-mental Associates San Francisco August 2007 available at httpwwwclimateactionprojectcomdocsDesign_to_Win_8_01_07pdf
CEC (2011) ldquoLa taxe carbone de la theorie agrave la pra-tique Les problematiques liees agrave lrsquoinstauration drsquoune taxe carbonerdquo Chaire Economie du Climat Universite Paris-Dauphine CDC Climate FLM No 20 February 2011 available at httpwwwchaireeconomieduclimatorgwp-contentuploads20110211-02-12-FLM-n20-Elbeze-De-Perthuispdf
China Development Bank (CDB) ldquoAnnual Report 2011rdquo available at httpwwwjicagojpenglishpublica-tionsreportsannual2011indexhtml
China-Denmark Wind Energy Development ProjectChina Renewable Energy Association 2009 ldquoChina Wind Energy and Electricity Tariff Develop-ment Reportrdquo
Clapp C J Ellis J Benn and J Corfee-Morlot (2012) ldquoTracking Climate Finance What and Howrdquo 04-May-2012COMENVEPOCIEASLT(2012) Paris France OECD httpwwwoecdorgenvi-ronmentclimatechange50293494pdf
Climate Commission (2012) ldquoThe Critical Decade International Action on Climate Changerdquo Flan-nery T R Beale and G Hueston Commonwealth
68
The Landscape of Climate Finance 2012
69
The Landscape of Climate Finance 2012December 2012 December 2012
of Australia (Department of Climate Change and Energy Efficiency) 2012
Corfee-Morlot J Guay B and Larsen KM (2009) ldquoFinancing for Climate Change Mitigation Towards a Framework for Measurement Reporting and Verificationrdquo OECDIEA Information Paper Paris October 2009
CPI (2010) The State of International Climate Finance Is it Adequate and is it Productive Climate Policy Initiative Venice available at httpclimatepolicyinitiativeorgpublicationthe-state-of-international-climate-finance-is-it-adequate-and-is-it-productive
CPI (2011) Inaugural Meeting of the San Giorgio Group Expanding Green Low-Emissions Finance ldquoProposed Analytical Program to Support Green Low-Emissions Financerdquo Island of San Giorgio Maggiore Venice Italy October 2010
CPI (2012) ldquoThe Landscape of Climate Finance in Germanyrdquo I Juergens H Amecke R Boyd B Buchner A Novikova A Rosenberg K Stelmakh A Vasa CPI Report (forthcoming) CPI consulta-tion draft as of October 2012 available at httpclimatepolicyinitiativeorgberlin
CPI (2012b) ldquoSecond Annual San Giorgio Group Meeting Expanding Green Low-Emission Financerdquo httpclimatepolicyinitiativeorgveniceeventsecond-annual-san-giorgio-group-meeting-expanding-green-low-emissions-finance
CPI (2013) ldquoAnnual Review of Low-Carbon Develop-ment in China (2013)rdquo CPI Report (forthcoming)
Development Bank of Southern Africa (DBSA) (2012) ldquoAnnual Report 201011rdquo South Africa
Ecofys-IDFC (2012) ldquoMapping of Green Finance Deliv-ered by IDFC Members in 2011rdquo Houmlhne N Khosla S Fekete H Gilbert A
Elbeze J and C de Perthuis 2011 Twenty Years of Carbon Taxation in Europe some lessons learned Information and Debates Series No 9 April 2011 Chaire Economie di Climat
Environmental Grantmakers Association (EGA) 2012 Tracking the Field Volume 3 Exploring Environ-mental Grantmaking httpcymcdncomsiteswwwwingsweborgresourceresmgrfilesfinal_report_v3pdf
European Bank for Recontruction and Development (EBRD) Sustainable Energy Financing Facility
(SES) May 2012 available at httpwwwebrdcomdownloadsresearchfactsheetsseffpdf
European Commission (EC) (2011) ldquoProposal for a Council Directive Amending Directive 200396EC Restructuring The Community Framework for The Taxation of Energy Products and Electricityrdquo Brussels SEC(2011) 409 httpeceuropaeutax-ation_customsresourcesdocumentstaxationsec_2011_409_impact_assesment_part1_enpdf
Eurostat (2011) ldquoStatistic in Focus 672011rdquo Environ-ment and Energy httpeppeurostateceuropaeucacheITY_OFFPUBKS-SF-11-067ENKS-SF-11-067-ENPDF European Commission
Eurostat (2011b) Environmental Taxes httpeppeurostateceuropaeustatistics_explainedindexphpEnvironmental_taxes European Commission
Falconer A and G Frisari 2012 San Giorgio Group Case Study ldquoOuarzazate I CSPrdquo Climate Policy Initia-tive available at httpclimatepolicyinitiativeorgour-workpublications
Fransen T Stasio K S Nakhooda (2012) ldquoThe US Fast-Start Finance Contributionrdquo World Resource Institute Overseas Development Institute May 2012 Working Paper available at httpwwwodiorgukpublications6560-usa-america-fast-start-finance-unfccc-pledge
FS-UNEP and BNEF (2012) ldquoGlobal Trends in Renew-able Energy Investment 2012rdquo Frankfurt SchoolUNEP Collaborating Centre for Climate amp Sustain-able Energy Finance and Bloomberg New Energy Finance Available at httpfs-unep-centreorgpublicationsglobal-trends-renewable-energy-investment-2012
Gibbs D (2012) ldquoLessons Learnt from Fast‐Start Financerdquo Presentation at the First workshop on Long-term Finance UNFCCC July 2012 httpunfcccintfilescooperation_supportfinan-cial_mechanismlong-term_financeapplicationpdfgibbs11june2012pdf
Gomez-Echeverri L (2010) National Funding Entities Their Role in the Transition to a New Paradigm of Global Cooperation on Climate Change European Capacity Building Initiative httpwwweuroca-pacityorgdownloadsNFEsPolicyReportpdf
Inada K (2011) Presentation ldquoClimate Finance JICA Implications for the Green Climate Fundrdquo August 29 2011 Japan International Cooperation Agency (JICA) httpwwwdbsaorgConfrFCCWorkshop20Material2011208202920
70
The Landscape of Climate Finance 2012
71
The Landscape of Climate Finance 2012December 2012 December 2012
JICA20DBSA20Climate20Finance20(2)20[Compatibility20Mode]pdf
Independent Evaluation Group (IEG) World Bank IFC and MIGA Adapting to Climate Change Assess-ing the World Bank Group Experience Phase III of the World Bank Group and Climate Change Independent Evaluation Group Washington DC United States available at httpiegworldbank-grouporgcontentdamiegclimate_change3cc3_full_evalpdf
Indian Renewable Energy Development Agency (IREDA) ldquoAnnual Report 2010-2011rdquo
Inter-American Development Bank (IDB) African De-velopment Bank (AfDB) Asian Development Bank (ADB) European Bank for Reconstruction and Development (EBRD) European Investment Bank (EIB) World Bank (WB) International Finance Corporation (IFC) (2012) ldquoJoint MDB Report on Mitigation Finance 2011rdquo available at httpclimatechangeworldbankorgsitesdefaultfilesMMF_2011_version_21pdf
Inter-American Development Bank (IDB) (2011) ldquoMexico CTF Renewable Energy Financing Facility (CTF-REF)rdquo (ME-L1109 httpwwwclimateinvestmentfundsorgcifsitesclimatein-vestmentfundsorgfilesApproval20by20Mail20Mexico20Renewable20Energy20Program20Proposal20III20PIDpdf
International Development Finance Club (2012) ldquoWork Plan 2 Leverage Private and Public Funds Position Paper on Leverage of Public and Private Fundsrdquo IDFC 2012
International Energy Agency (IEA) (2012) ldquoWorld Energy Outlook 2012rdquo November 2012 Paris France
International Finance Corporation (IFC) (2012) ldquoMan-agementrsquos Discussion and Analysis and Con-solidated Financial Statementsrdquo June 30 2012 Washington DC United States
International Sustainability Unit (ISU) The Princes Charitiesrsquo (2012) ldquoInterim REDD+ Finance Current Status and Ways Forward for 2013-2020rdquo November 2012
Japan International Cooperation Agency (JICA) (2012) ldquoAnnual Report 2011rdquo
Japan International Cooperation Agency (JICA) (2012b) httpwwwjicagojppublicationspamphpdfreddpdf
Junghans L S Harmeling 2012 Different Tales from Different Countries A first assessment of the OECD ldquoAdaptation Markerrdquo Germanwatch httpgermanwatchorgdedownload6741pdf
KfW Bankengruppe Bank aus Verantwortung ldquoAnnual Report 2011rdquo and Exhibit (D) Germany available at httpwwwkfwdekfwenIIIDownload_CenterFinancial_PublicationsFinancial_publica-tions1_Geschaeftsberichte_E120706_006_RZ_KfW_GB11_EN_Webpdf
KfW Bankengruppe Bank aus Verantwortung ldquoFinancial Report 2011rdquo Germany
KfW Bankengruppe KfW Entwicklungsbank DEG ndash Deutsche Investitions- und Entwicklungsge-sellschaft mbH (2011) ldquoAdaptation to Climate Change Cooperation with Developing Countries ndash Climate and Developmentrdquo Frankfurt am Main Germany June 2011
Khan Hannan S M Doha S Haque S (2011) ldquoThe Ban-gladesh National Climate Funds A Brief History and Description of the Bangladesh Climate Change Trust Fundrdquo LDC paper series IIED and ECBI
Latt J (2011) ldquoMexico as an Emerging Donorrdquo EDC 2020 Policy Brief No18 March 2011
Marion V A Esch L Grieszlighaber F Fuller F Mers-mann F Fallasch L De Marez (2012) ldquoGerman Fast- Start Lessons Learned for Long-Term Financerdquo Climate Analytics Wuppertal Institute Germanwatch August 2012 httpwwwbmu-klimaschutzinitiativedefiles2012-German_FSF_Study_1076pdf
Michaelowa AMichaelowa K (2011) Coding Errors or Statistical Embellishment The Political Economy of Reporting Climate Aid In World Development Vol 39 No 11 2011 pp 2010ndash2020
Ministry of Economy Finance and Industry (Minefi) (2011) Ministry of Ecology Sustainable Develop-ment Transport and Housing Ministry of Foreign and European Affairs ldquoHow Francersquos Development Partnerships are Meeting the Challenge of Climate Change Fast-start implementation for 2011 Paris France
Nacional Financiera (2012) ldquoAnnual Report 2011rdquo Mexico
National Renewable Energy Laboratory (NREL) 2009 Carbon Taxes a Review of Experience and Policy Design Considerations Sumner J L Bird and H
70
The Landscape of Climate Finance 2012
71
The Landscape of Climate Finance 2012December 2012 December 2012
Smith Technical Report NRELTP-6A2-47312 December 2009
Nelson D G Shrimali G S Goel C Konda R Kumar (2012) ldquoMeeting Indiarsquos Renewable Energy Targets How Policy Can Help Overcome Financing Chal-lenges and Encourage Investmentrdquo CPI Report (forthcoming)
Nordic Development Fund (NDF) (2012) ldquoAnnual Report 2011rdquo Helsinki Finland
Oakes N Leggett M Cranford M Vickers H (eds) (2012) ldquoThe Little Forest Finance Bookrdquo Global Canopy Programme Oxford
OECD (2007) ldquoReporting Directive for the Creditor Reporting Systemrdquo DCDDAC(2007)39Final Organisation for Economic Co-operation and Development (OECD) Paris September 2007
OECD (2010) Statistics on Export Credits Trade and Agriculture Directorate (TAD) available at httpwwwoecdorgdepartment03355en_2649_34169_1_1_1_1_100html
OECD (2011) ldquoFirst-Ever Comprehensive Data on Aid For Climate Change Adaptationrdquo Organisation for Economic Co-operation and Development (OECD) November 2011 Paris available at httpwwwoecdorgdacaidstatistics49187939pdf
OECD (2011b) Creditor Reporting System _Full down-load file ldquoCRS 2009ziprdquo DAC Creditor Reporting System database httpstatsoecdorgIndex aspxDatasetCode=CRSNEW data down- loaded 5th April 2011
OECD (2012) Creditor Reporting System _Full down-load file ldquoCRS 2011ziprdquo DAC Creditor Reporting System database httpstatsoecdorgIndexaspxDatasetCode=CRSNEW version June 2012
OECD (2012b) Full list of climate change mitigation and climate change adaptation aid activities 2010 httpwwwoecdorgdacaidstatis-tics50089594xlsx
OECD (2012c) ldquoUnderstanding on Export Credits for Renewable Energy Climate Change Mitigation and Water Projects as new Annex IV available at httpsearchoecdorgofficialdocumentsdisplaydocumentpdfdoclanguage=enampcote=tadpg(2012)9
OECD (2012d) Glossary of Statistical Terms httpstatsoecdorgglossaryindexhtm
OECDEuropean Environment Agency Database on Instruments Used for Environmental Policy and Natural Resources Management httpwww2oecdorgecoinstqueriesindexhtm
Parker C J Brown J Pickering E Roynestad N Mardas A W Mitchell (2009) ldquoThe Little Climate Finance Bookrdquo Global Canopy Programme
Peters-Stanley M K Hamilton D Yin (2012) ldquoLeverag-ing the Landscape State of the Forest Carbon Markets 2012rdquo Ecosystem Marketplace
Pinheiro AC (2012) ldquoThe Role Of Concessionary Finance In Brazilrdquo CDE Insight June 2012
REN21 (2012) ldquoRenewables 2012 Global Status Reportrdquo at httpwwwren21netdefaultaspxtabid=5434
Republique Tunisienne Ministegravere du Developpement et de la Cooperation Internationale Institut National de La Statistique (INS) (2010) laquo Annuaire Statis-tique de La Tunisie 2005-2009rdquo December 2010
Ryan L Selmet N and Aarsud A (2012) ldquoPlugging the Energy Efficiency Gap with Climate Financerdquo IEA Insights Series 2012 OECDIEA Paris
Simula M (2010) ldquoAnalysis of REDD+ Financing Gaps and Overlapsrdquo Ardot available at httpreddplus-partnershiporg65563en
Smallridge D B Buchner C Trabacchi M Netto JJ Gomes L Serra (2012) ldquoThe Role of National Development Banks in Intermediating Interna-tional Climate Finance to Scale Up Private Sector Investmentsrdquo Inter-American Development Bank Working Paper 2012 (forthcoming)
Streck C and C Parker (2012) ldquoFinancing REDD+rdquo in Angelsen Arild Maria Brockhaus William D Sunderlin and Louis V Verchot 2012 Analysing REDD+ Challenges and choices httpwwwcifororgpublicationspdf_filesBooksBAngelsen1201pdf
Suennen R (2012) Contractual relationships between CMEs and CPAsrdquo Addis Ababa April 2012 KfW Bankengruppe Presentation available at httpaf-ricacarbonforumcom2012docsPresentationsd2_Training20Session202a_PoARainer20Suennenpdf
The Nature Conservancy (TNC) (2012) ldquoClimate Finance Readiness Lessons Learned in Developing Countriesrdquo J Gastelumndi The Nature Conser-vancy Available at httpwwweldisorggodisplayamptype=Documentampid=62706
72
The Landscape of Climate Finance 2012
73
The Landscape of Climate Finance 2012December 2012 December 2012
The World Bank (2011) ldquoAnnual Report 2011rdquo Washing-ton DC United States
Trabacchi C V Micale G Frisari (2012) San Giorgio Group Case Study ldquoPROSOL Tunisiardquo available at httpclimatepolicyinitiativeorgpublicationsan-giorgio-group-case-studies
UNDP (2011) ldquoBlending Climate Finance Through Na-tional Climate Funds A Guidebook for the Design and Establishment of National Funds to Achieve Climate Change Prioritiesrdquo United Nations Devel-opment Programme September 2011 httpwwwundporgcontentdamundplibraryEnviron-ment20and20EnergyClimate20ChangeCapacity20DevelopmentBlending_Climate_Finance_Through_National_Climate_Fundspdf
UNEP (2010) ldquoBilateral Finance Institutions amp Climate Change A Mapping of Public Financial Flows for Mitigation and Adaptation to Developing Countries in 2010rdquo United Nations Environment Programme Stockholm Environment Institute
UNFCCC (2010) ldquoCancun Agreementsldquo Art 71 available at httpunfcccintmeetingscancun_nov_2010items6005php
US PREF (2012) ldquoRamping up Renewables Leverag-ing State RPS Programs amid Uncertain Federal Supportrdquo US Partnership for Renewable Energy Finance White Paper authored by DB Climate Change Advisors (DBCCA) httpuspreforgwp-contentuploads201206Ramping-up-Renewables-Leveraging-State-RPS-Programs-amid-Uncertain-Federal-Support-US-PREF-White-Paper1pdf
Varadarajan U B Pierpont A Hobbs K Rowley (2012) ldquoSupporting Renewables while Saving Taxpayers Moneyrdquo CPI Report September 2012 available at httpclimatepolicyinitiativeorgwp-contentuploads201209Supporting-Renewables-while-Saving-Taxpayers-Moneypdf
Vieweg M Esch A Grieszlighaber L Fuller F Mersmann F Fallasch F De Marez L et al (2012) ldquoGerman Fast Start Finance Lessons Learned for Long-Term Financerdquo Climate Analytics Wuppertal Institute Germanwatch August 2012 available at httpwwwclimateanalyticsorgsitesdefaultfilesat-tachmentsnews2012-German_FSF_Studypdf
Visconti G M Netto JJ Gomes (2012) Presentation ldquoRole of National Development Banks in Promoting Climate Financerdquo Inter-American Development
Bank available at httpclimatepolicyinitiativeorgvenicefiles201209Viscontipdf
Vivid Economics (2012) ldquoCarbon taxation and Fiscal Consolidation the Potential of Carbon Pricing to Reduce Europersquos Fiscal Deficitsrdquo report prepared for the European Climate Foundation and Green Budget Europe May 2012
Vrana M and Cracknell J (2011) ldquoEnvironmental Funding by European Foundations A Snapshotrdquo Environmental Foundation Centre (ECF) Sep-tember 2011 available at httpwwwefcbeprogrammes_servicesresourcesDocumentsefc_environmental_finalpdf
World Bank (2012) ldquoState and Trends of the Carbon Markets 2012rdquo Washington DC May 2012
Weiss W and F Mauthner (2012) ldquoSolar Heat World-wide Markets and Contribution to the energy supply 2010 (edition 2012) at httpwwwiea-shcorgpublicationsdownloadsSolar_Heat_Worldwide-2012pdf
72
The Landscape of Climate Finance 2012
73
The Landscape of Climate Finance 2012December 2012 December 2012
WebsitesAfrican Development Bank (AfDB) website at http
wwwafdborgen
Agencia Financiera de Desarrollo (AfD) website at httpwwwafdgovpy
Asian Development Bank (AsDB) website at httpwwwadborg
Banco de Desarollo de America Latina Development Bank of Latin America (CAF) at httpwwwcafcomviewindexaspms=19
Banco Estado de Chile website at httpswwwban-coestadocl
Bancoldex Colombia website at httpwwwbancoldexcomportaldefaultaspx
Black Sea Trade amp Development Bank website at httpwwwbstdborg
Bloomberg New Energy Finance website at httpbnefcom
Brazilian Development Bank BNDES website at httpwwwbndesgovbrSiteBNDESbndesbndes_enInstitucionalPressNoticias201220120213_fun-doclimahtml
Caisse de Depot et de Gestion (CDG) httpwwwcdgma
China Development Bank (CDB) httpwwwcdbcomcnenglishindexasp
Climate Change Expert Group (CCXG) on the UNFCCC website at httpwwwoecdorgdocument4403746en_2649_34361_1904108_1_1_1_100html
Climate Investment Funds website at httpsclimatein-vestmentfundsorgcif
Development Bank of Southern Africa (DBSA) website at httpwwwdbsadrm-zacom
European Bank for Reconstruction and Development (EBRD) website at httpwwwebrdcompageshomepageshtmlamppanel1-2
European Bank for Reconstruction and Development (EBRD) Sustainable Energy Initiative (SEI) website at httpwwwebrdcompagessectorenergyef-ficiencyseishtml
European Commission Climate Action website at httpeceuropaeuclimapoliciesetsauction-ing_enhtm
European Investment Bank (EIB) website at httpwwweiborg
European Commission Eurostat (2012) Environmental and Energy data base accessed on September 2012 httpappssoeurostateceuropaeunuishowdo
European Commission Eurostat (2012) Environmental Taxes httpeppeurostateceuropaeustatis-tics_explainedindexphpEnvironmental_taxes
French Development Agency (AfD) Agence Franccedilaise de Developpement website at httpwwwafdfrlangenhome
Government of Brazil website at wwwbrasilgovbr
Green Climate Fund website at httpgcfundnethomehtml
International Development Finance Club website at httpwwwidfcorg
Indian Renewable Energy Development Agency (IREDA) website at httpwwwiredagovin
Indonesia Exim Bank website at httpwwwindonesi-aeximbankgoid
Industrial Development Bank of Turkey (TSKB) website at httpwwwtskbcom
Inter-American Development Bank (IDB) website at httpwwwiadborg
International Finance Corporation (IFC) website at httpswwwifcorg
Japan International Cooperation Agency (JICA) website at httpwwwjicagojpenglish
KfW Group website at httpwwwkfwdekfwenKfW_Groupindexjsp
Korea Finance Corporation (KOFC) httpwwwidfcorgMemberskofcaspx
Multi-Donor Trust Fund Office Gateway website at httpmdtfundporg
Nacional Financiera Banca de Desarollo (NAFIN) website at httpwwwnafincomportalnfcontenthomehomehtml
Nordic Development Fund website at wwwndffi
OANDA website at httpwwwoandacom
ODI HBF Climate Funds Update database at httpwwwclimatefundsupdateorg
74
The Landscape of Climate Finance 2012
75
The Landscape of Climate Finance 2012December 2012 December 2012
OECD DAC Creditor Reporting System database at httpwwwoecdorgdataoecd50175037721htm
OECD Glossary of Statistical Terms at httpstatoecdglossary
OECD Trade and Agriculture Directorate (TAD) Export Credits Database at httpwwwoecdorgdepartment03355en_2649_34169_1_1_1_1_100html
OECD Userrsquos Guide to the CRS Aid Activities database at wwwoecdorgdacstatscrsguide
OECD website ldquoFocus on Aid Targeting the Objectives of the Rio Conventionsrdquo at wwwoecdorgdacstatsrioconventions
OECD List of OECD Member Countries at httpwwwoecdorggenerallistofoecdmembercoun-tries-ratificationoftheconventionontheoecdhtm
OECDEEA database on instruments used for environ-mental policy and natural resources management httpwww2oecdorgecoinstqueriesindexhtm
Overseas Private Investment Corporation (OPIC) website at httpwwwopicgov
Small Industries Development Bank of India (SIDBI) website at httpwwwsidbicom
The Brazilian Development Bank website at httpwwwbndesgovbr
The Financial Times FDi Intelligence website at httpwwwfdiintelligencecom
The Foundation Center website at httpfoundation-centerorggpfclimatechangechart-oecdhtml
The Global Environmental Facility (GEF) project data-base at httpwwwgefonlineorg
The Nordic Development Fund (NDF) website at httpwwwndffi
UNCTAD interactive database of Division on Invest-ment and Enterprise at httpwwwunctadorgtemplatesPageaspintItemID=3199amplang=1
UNEP Risoslash Centre CDMJI Pipeline Analysis and Data-base at httpcdmpipelineorg
UNFCCC CDM Registry website at httpcdmunfcccintRegistryindexhtml
UNFCCC Finance Portal for Climate Change website at httpunfcccintcooperation_supportfinan-cial_mechanismfinance_portalitems5824php
Adaptation Private Sector Initiative (PSI) at httpunfcccintadaptationnairobi_work_programmeprivate_sector_initiativeitems4623php
Vnesheconombank (VEB) website at httpwwwvebru
World Bank Project amp Operations database at httpgoworldbankorgIAHNQIVK30
World Bank website at httpworldbankorg
74
The Landscape of Climate Finance 2012
75
The Landscape of Climate Finance 2012December 2012 December 2012
Appendix A - Main assumptions and methodologyThe Scope of Private Climate FinanceWe covered 1636 individual active projects from the Bloomberg New Energy Finance database representing 82 of the extra capacity in developed countries and 89 of the extra capacity in developing countries (539 GW in total)
For both developed and developing countries we looked at the most relevant ldquo2011 financing storiesrdquo each rep-resenting more than 1 GW of extra capacity financed in 2011
Developed countries (OECD) 45 of the projects for 45 of total capacity
The top 7 stories which represent 75 of the proj-ects for 82 of capacity in developed countries are as follows
bull US wind and solar financing
bull Canadian wind financing
bull German wind financing
bull UK wind and biomass amp waste financing
bull Spanish wind and solar financing
bull Italian solar financing
bull Korean wind and marine financing (one large-scale project)
Developing countries (non-OECD) 55 of the projects for 55 of total capacity
The top 3 stories which represent 85 of the projects for 89 of capacity in developing countries are as follows
bull Chinese wind solar and biomass amp waste financing
bull Indian wind financing and solar financing
bull Brazil wind financing
Small-scale distributed capacityData for small-scale distributed capacity (PV and Solar Water Heater) were retrieved from FS-UNEP and BNEF (2012) and Weiss and Mauthner (2012) and catego-rized by geography and category of actors based on the data available
ldquoGreenrdquo FDI dataThe data used in the Landscape 2012 were retrieved by UNCTAD experts from the fDi Markets database Figures covered greenfield investments occurred glob-ally in 2011 We decided to exclude cross-border MampA as we decided to focus on new investment in emission reductionstabilization only
The sectors covered were the following renewable gen-eration (biomass geothermal hydroelectric solar tidal and wind energy) and waste management
To avoid double counting with the data retrieved from the BNEF database FDI data were allocated as the range of uncertainty to the BNEF subtotal except for flows that are typically of domestic nature such as gov-ernmentsrsquo budget and households ones
CURRENCY ANNUAL AVERAGE
EURUSD (2010) 13277
EURUSD (2011) 13926
BR$USD (2011) 05997
TNDUSD (2009) 074654
Source Oanda (2012)
76
The Landscape of Climate Finance 2012
77
The Landscape of Climate Finance 2012December 2012 December 2012
Appendix B - A summary of the Landscape 2011FINANCE FLOWS AMOUNTS
(ON AVERAGE) METHODOLOGY
ALL usd 97 bIllIOn
bull Indicative estimates of annual flows for the latest year available 20092010 (variable according to the data source)
bull Estimates spanning multiple years adjusted to produce annual-equivalentsbull Includes incremental costs and capital investmentbull Most data presented related to commitments in a given year due to limited availability of
disbursement data
BILATERAL usd 228 bIllIOn
bull Bilateral contributions reported through the OECDrsquos Creditor Reporting System Aid Activities (OECD CRS) database
bull Bilateral Finance Institutions direct reporting (TC 2011 UNEP 2010 BNEF 2011)bull an estimate of the volume of green export credits (OECD statistics on export credits 2010
as cited in Buchner et al 2011b)
MULTILATERAL usd 144 bIllIOnbull Multilateral institutionsrsquo direct reporting and reporting by various tracking initiatives
including TC 2011 UNEP 2010 BNEF 2011
CLIMATE FUNDS usd 25 bIllIOn bull ODIHBF Climate Funds Update and reporting by Fund administrators
CARBON OFFSET FINANCE usd 22 bIllIOn
bull This range was calculated using data from the World Bank the UNFCCC and IGES to apply surveyed average annual primary carbon offset prices to the annual volume of offsets issued
PRIVATE FINANCE usd 55 bIllIOn
Range of 370-722 billion betweenbull lsquoGreenrsquo Foreign Direct Investments (FDI) Based on the United Nations Conference on Trade
and Development database (UNCTAD 2010)bull Renewable energy investments based on the United Nations Environment Programme
(UNEP) and BNEF (UNEP and BNEF 2011) regarding renewable energy investments in developing countries (from developed countries other developing countries and private investment from national investors)
VOLUNTARY PHILANTHROPIC CONTRIBUTIONS
usd 450 mIllIOn bull Voluntary philanthropic contributions based on CEA 2007 Ecosystem Marketplace 2011
76
The Landscape of Climate Finance 2012
77
The Landscape of Climate Finance 2012December 2012 December 2012
Appendix C - Existing climate finance tracking databases and major ongoing initiativesTracking public climate financeAdaptation Fund Funded Projects and Funding Status
data at httpswwwadaptation-fundorgfunded_projects
African Development Bank Group (AfDB) Project Portfolio database at httpwwwafdborgenprojects-and-operationsproject-portfolio
AidData Development Finance and Foreign Aid Portal at httpaiddataorg
Asian Development Bank project database at httpwwwadborgprojects
European Bank for Reconstruction and Development (EBRD) online project database at httpwwwebrdcomsafsearchhtmltype=project
European Commission Climate Action Fast-start Finance list of actions tracked at httpeceuropaeuclimapoliciesfinanceinternationalfaststartindex_enhtm
European Investment Bank (EIB) Project finance database at httpwwweiborgprojectsloanssectorsindexhtm
Global Climate Change Alliance (GCCA) Technical and Financial Support database at httpwwwgccaeutechnical-and-financial-support
GEF project database available at httpwwwgefon-lineorg
Federal Ministry for the Environment Nature Conserva-tion and Nuclear Safety Germany National and International Climate Initiative online project data-base at httpwwwbmu-klimaschutzinitiativedeindex_enhtml
Inter-American Development Bank (IDB) online project database at httpwwwiadborgenprojectsprojects1229html
Multi-Partner Trust Fund Office Development and Climate Change Fund at httpmptfundporgfactsheetfundMDG00
ODIHeinrich Boumlll Foundation Climate Funds Update at httpwwwclimatefundsupdateorg
OECD Creditor Reporting System (CRS) Aid Ac-tivities database at httpstatsoecdorgIndexaspxdatasetcode=CRS1
United Nations Development Programme (UNDP) United Nations Environment Programme UNFCCC World Bank Group Fast Start Finance website at (updated as of December 2011) httpwwwfaststartfinanceorg
UNDPGEF Small Grants Programme project database at httpwwwundporgnpenvironment--energyprogramsgp-35html
UNFCCC Finance Portal for Climate Change at httpunfcccintcooperation_supportfinan- cial_mech-anismfinance_portalitems5824php
_____Funding for Adaptation interface at httpunfcccintadaptationimplementing_adaptationadapta-tion_funding_interfaceitems4638php
US Government RecoveryGov Track the Money httpwwwrecoverygovPagesdefaultaspx
Voluntary REDD+ Database REDD+ Partnership at wwwreddplusdatabaseorg
World Bank OECD Aid flows at httpsiteresourcesworldbankorgCFPEXTResourc- es299947-1266002444164indexhtml
World Bank UNDP Climate Finance Options database at wwwclimatefinanceoptionsorgcfo
World Bank Project amp Operations database at httpwebworldbankorgWBSITEEXTERNALPROJECTS0menuPK51562~pagePK64133621~piPK64140076~theSitePK4094100html
WRI Summary of Developed Country lsquoFast-Startrsquo Climate Finance Pledges (updated as f November 2011) at httpwwwwriorgstories201002summary-developed-country-fast-start-climate-finance-pledges
Tracking private climate financeBloomberg New Energy Finance Industry Intelligence
Desktop httpbnefcomservicesindustry- intelligence-slash-desktop
Dealogic ProjectWare and Loan Analytics httpwwwdealogiccoukenmarketdatahtm
Ecosystem Marketplace Bloomberg New Energy Finance Voluntary Carbon Market data at httpmoderncmsecosystemmarketplacecomrepositorymoderncms_documentssovcm_postlaunchreport_20121pdf
78
The Landscape of Climate Finance 2012
79
The Landscape of Climate Finance 2012December 2012 December 2012
_____Publication at httpwwwforest-trendsorgpub-lication_detailsphppublicationID=3164
Environmental Finance Carbon Funds httpwwwenvironmental-financecombooks
European Commission Eurostat FDI Statistics httpeppeurostateceuropaeu
EEX European Energy Exchange data at httpwwweexcomen
Financial Times FDi Intelligence database httpwwwfdiintelligencecom
Foundation Centre research database httpfounda-tioncenterorgfindfundersstatistics
Institute for Global Environmental Strategies (IGES) CDM Programme database at httpwwwigesorjpencdmindexhtml
OECD Creditor Reporting System (CRS) Aid Ac-tivities database at httpstatsoecdorgIndexaspxdatasetcode=CRS1
OECD International Direct Investment Statistics data-base at httpwwwoecdorgdafinternationalin-vestment
Point Carbon - Carbon Project Manager Carbon Market Trader EU at httpwwwpointcarboncomtrading
Thomson Reuters Trader for Commodities Advanced at httptrainingthomsonreuterscomportalproductphppid=4
Thomson Reuters Eikon for Energy at httpthomson-reuterscomproducts_servicesfinancialfinan-cial_productsa-zeikon_for_energy
UNCTAD Interactive Database Division on Investment and Enterprise at httpstatsunctadorgfdi
UNEP-Risoslash CDMJI Pipeline Analysis and Database at httpcdmpipelineorg
UNFCCC CDM and JI Project Activities databases at httpcdmunfcccintProjectsprojsearchhtml
_____Adaptation Private Sector Initiative (PSI) at httpunfcccintadaptationnairobi_work_pro-grammeprivate_sector_initiativeitems4623php
World Bank Private Participation in Infrastructure (PPI) Project Database at httpppiworldbankorg
_____State and Trends of Carbon Market 2012 at httpsiteresourcesworldbankorgINTCARBON-
FINANCEResourcesState_and_Trends_2012_Web_Optimized_19035_CvrampTxt_LRpdf
_____ World Development Indicators and Global Development Finance at http httpdatabankworldbankorgddphomedoStep=1ampid=4
78
The Landscape of Climate Finance 2012
79
The Landscape of Climate Finance 2012December 2012 December 2012
Appendix D - Details on Development Finance Institutions
BILATERAL FINANCE INSTITUTIONS
REPORTING YEAR SOURCE AND NOTES
AfD Agence Franccedilaise de Deacuteveloppement- Proparco
2011
Self-reporting via CPI surveyGiven that some of the projects supported contributed to both mitigation and adaptation purposes we allocated the dual purpose money according to the total distribution between mitigation and adaptation projects
JICAJapan International Cooperation Agency
2011 Self-reporting via CPI survey
KfW - KfW Entwicklungsbank- DEG
2011 Self-reporting via CPI survey
OPICOverseas Private Investment Corporation
2011 Self-reporting via CPI survey
MULTILATERAL FINANCE INSTITUTIONS
REPORTING YEAR SOURCE AND NOTES
AfDB African Development Bank
2011 Self-reporting via CPI survey - mitigation data only
AsDB Asian Development Bank
2011Self-reporting via CPI survey - mitigation data onlyBased on the infornation retrieved on the Banks website and at the best of our knowledge we allocated 100 of the reported portion of equity financing to balance sheet finance
EBRDEuropean Bank for Reconstruction and Development
2011Self-reporting via CPI surveyThe reported portion of equity financing was allocated 5050 between balance sheet financing and project-level equity due to data availabiltiy constraints
EIB European Investment Bank
2011
Joint MDBs Mitigation Finance Report (IDB et al 2012) The figure included hence represents financing to mitigation projects onlyTo retrieve the breakdown by instruments sectors and geography we applyed the shares presented in UNEP-SEI (2011)
EU Institutions 2010
OECD CRS 2010 data (OECD 2012)The figure included in the Landscape 2012 represents aid marked both principal and significantFinancing with multi-purpose objectives (ie both mitigation and adaptation) was allocated according to the distribution between mitigation only and adaptation only projects (55 vs 45)
IDBInter-American Development Bank
2011Self-reporting via CPI surveyThe portion of cliamte finance committed to Mexico was allocated to Central America
IFC International Finance Corporation
2011Self-reporting via CPI survey - mitigation data only
The reported portion of equity financing was allocated 5050 between balance sheet financing and project-level equity due to data availabiltiy constraints
NDFThe Nordic Development Fund
2011
NDF Annual Report 2011To estimate the thematic breakdown between mitigation and adaptation we applied the share retrievd from the OECD CRS 2009 dataset (OECD 2011b)The geographical breakdown was derived from NDF Annual Report 2011 and specifically we allocated committed funds based on the distribution of approved projects at the end of 2011 ie Africa (42) Asia (28) and Latin America (30)
80
The Landscape of Climate Finance 2012
81
The Landscape of Climate Finance 2012December 2012 December 2012
World Bank (IDA and IREDA)
FY 2011
Self-reporting via CPI surveyTo estimate the breakdown by instruments we applied- for IDA 6 to grants 94 to concessional loans as presented in the OECD CRS 2010 data (OECD 2012)- for IBRD 100 market-rate loans as presented in the OECD CRS 2009 data (OECD 2011a)The Bank asseses mitigation and adaptation co-benefits independently Hence to split total 2011 climate financing avoiding double counting we allocated the dual purpose money according to the total distribu-tion between mitigation and adaptation
NATIONAL amp SUB-REGIONAL
DEVELOPMENT FINANCE INSTITUTIONS
REPORTING YEAR SOURCE AND NOTES
AfD Agencia Financiera de Desarollo
2011 Self-reporting via CPI survey
BNDESBrazilian Development Bank
2011
Self-reporting via CPI surveyData included in the report represent dirbursement rather than committmentsThe bank reported financing to renewable energies and energy efficiency as a combined category (see also BNDES 2012) To derive the allocation pertaining to each sector we applied the share on 2011 disclosed deals per sectors as presented in BNEF (2012)
CAFDevelopment Bank of Latin America
2011 Self-reporting via CPI survey
DBSADevelopment Bank of Southern Africa
2011
Self-reporting via CPI surveyGeographical breakdownDBSAs financing to South Africa was considered as domestic spending as occurred in the area where the institution is based in
FIRAFideicomisos Instituidos en Relacioacuten a la Agricultura (Mexico)
2011 Self-reporting via CPI survey
IREDAIndian Renewable Energy Development Agency
2011
IREDA Annual Report (2011)To avoid potential double counting with other DFIs flows total financing was reduced by 40 which is the share of international assistance in IREDAs resource base for 2010-2011 as reported in IREDA (2011)In our estimate we have included financing directed to projects in the following sectors wind hydro biomass power generation energy efficiency and energy conservation solar energy waste to energy Instruments breakdownTo estimate the portion of low-cost debt versus market-rate debt we associated to the former the total amount of finance committed to those sectors for which in 2011 IREDA received the interest rate subsi-dies provided by the Indian Ministry of New and Renewable Energy (IREDA 2012) To market-rate debt was allocated the remaining portion
NAFINNacional Financiera (Mexico)
2011 Self-reporting via CPI survey
80
The Landscape of Climate Finance 2012
81
The Landscape of Climate Finance 2012December 2012 December 2012
BEBanco del Estado de ChileBancoldex SA ColombiaBCIECABEICentral American Bank for Economic IntegrationBSTDB Black Sea Trade and Development Bank of Greece CDGCaisse de Deacutepocirct et de Gestion MoroccoCDB China Development BankHBORCroatian Bank for Reconstruction and DevelopmentIndonesia EximbankKoFCKorea Finance CorporationSIDBI Small Industries Development Bank of IndiaTSKB Industrial Development Bank of TurkeyVEB Vnesheconombank Russia
2011
Ecofys-IDFC (2012) The volume of green finance stated in the report was adjusted by- the 7 share reported as other environmental projects as we opted to include only what banks reported as mitigation and adaptation- climate finance spending data received in response to CPIrsquos survey by the other NFIs and BFI above listed only those covered in the report- climate finance spending data received in response to CPIrsquos survey by AFD KFW and JICA which was re-allocated to the BFIs category- the share of Lower carbon energy generation project as it may have included fuel-to-fuel swtich project (eg fuel to gas coal to gas) or fossil fuel based co-generation- an esitmated portion of guaranteesrisk management instrumentsThe volumed obtained was allocated to mitigation and adaptation assuming a 89 vs11 breakdown which is in line with the report and the share observed in the financing of other BFIs and MFIsNote Due to the above and the includions of KFW Entwicklungsbank and DEGrsquos climate financing rather than the entire KFW Bankengruppe our NFIs total climate financing is lower as compared to the Ecofys-IDFC (2012) report We decided to include KFW Entwicklungsbank and DEGrsquo financing only for two main reasons (a) to avoid double counting with the money captured in the private finance flows and (b) to avoid distortions in the presentation of the BFIsrsquo money given the domestic-oriented focus of the excluded business areas of the Group and the lack of analogous examples across the group of BFIs We acknowledge the presence of public money sitting behind private investments quantifying it whenever possible and highlighting the key role played by KfW domestically in the support of the German Energiewende (see Box 10)Instruments breakdownTo estimate the breakdown between the instruments categories featured in the Landscape 2012 the ag-gregated volume of climate financing was1) Broken down between loans and others instruments (95 versus 5) as indicated in Ecofys-IDFC (2012)2) The resulting amount was then further broken down based on the weighted average observed for the other NFIs + BFIs for which we had data for3) The resulting portion of equity was allocated 5050 between balance sheet financing and project-level equity due to data availabiltiy constraintsGeographical breakdownTo esitmate the breakdown between the various greographical recipients we (1) allocated the estimated portion pertaining to CDB to China assuming that it invested domestically (2) the remaining portion was allocated according to the average shares among the other BFIs and NDBs for which we had data
82
The Landscape of Climate Finance 2012
83
The Landscape of Climate Finance 2012December 2012 December 2012
Appendix E - Details on Climate Funds
FUND NAME TYPE INSTRUMENTS
ESTIMATED LATEST YEAR
VALUE(USD MILLION)
SOURCE AND DETAILS
Adaptation Fund Multilateral1 Grants 856
Approved funds to projects in 2011 Source UNFCCC Finance Portal - Adaptation Fund Database of Projects - httpunfcccintcooperation_and_supportfinancial_mechanismadapta-tion_funditems6668phpApproved20project20data and Adaptation Fund Portal - httpwwwadaptation-fundorg consulted on July 27 2012
Global Environmental Facility (GEF)bull GEF Trust Fundbull Least Developed Countries Fundbull Special Climate Change Fund
MultilateralMultilateralMultilateral
Grants
22051702322181
Projects approved or endorsed by the CEO during 2011 as of end July 2012 Source Personal communication with GEF Secretariat July 2012
UN-REDD Programme Multilateral Grants 352
Multi-Partner Trust Fund Office May 2012 Third Consolidated Annual Progress Report on Activities Implemented under the UN-REDD Programme Fund for the period 1 January ndash 31 December 2011 httpmptfundporg
MDG Achievement Fund ndash Environment and Climate Change thematic window
Multilateral Grants 154Approved budget in 2011 for projects in the Environment and Climate Change thematic windowSource httpmdtfundporg
Climate Investment Funds (CIFs) including
bull the Clean Technology Fund and bull the Strategic Climate Fund
Multilateral
Grants conces-sional loans
loans and guarantees
9295Approved spend in 2011Source wwwclimatefundsupdateorg
Forest Carbon Partnership Facility (FCPF)
Multilateral Grants 214Approved spend in 2011Source wwwclimatefundsupdateorg
Congo Basin Forest Fund Multilateral Grants 573Approved spend in 2011Source wwwclimatefundsupdateorg
Global Energy Efficiency and Renewable Energy Fund
Multilateral Equity 174Approved spend in 2011Source wwwclimatefundsupdateorg
Global Climate Change Alliance Multilateral Grants 770Approved spend in 2011Source wwwclimatefundsupdateorg
Amazon Fund (Fundo Amazocircnia) Bilateral Grants 269Approved spend in 2011Source wwwclimatefundsupdateorg
BNDES Mata Atlacircntica initiative Bilateral Grants 58
R$ 118m approved in 2011 for 3 reforestation projects (con-verted to USD using an exchange rate of USD 048860R$ oandacom 1 September 2012) Source Press Release 26 May 2011 httpwwwbndesgovbrSiteBNDESbndesbndes_enInstitucionalPressNoticias201120110526_mataatlanticahtml
Germanys International Climate Initiative
BilateralGrants and
concessional loans
897Approved spend in 2011Source wwwclimatefundsupdateorg
82
The Landscape of Climate Finance 2012
83
The Landscape of Climate Finance 2012December 2012 December 2012
Australias International Forest Carbon Initiative
Bilateral Grants 314
Total approved spend No annual data is available Cumulative total approved spend is therefore divided by four given four full years of operation since June 2008 Source wwwclimate-fundsupdateorg
Indonesia Climate Change Trust Fund Bilateral Grants 00Approved spend in 2011Source wwwclimatefundsupdateorg
UK Internatioanl Climate Fund Bilateral Grants 782Approved spend in 2011Source wwwclimatefundsupdateorg
Guyana REDD+ Investment Fund Bilateral Grants 04
Administrative fees for project proposal preparation grants for projects approved in 2011 including (1) Institutional Strengthening US$ 305168 Source (2) Micro and Small Enterprise Development $127476
Japans Fast-Start Finance Bilateral
Grants loans risk instru-ments and equity
7997Cumulative total approved spend divided by two to give an approximation of annual flows over two full years of operation to date Source wwwclimatefundsupdateorg
1 Countries can access resources directly through National Implementing Agencies (NIEs) or using the services of a multilateral implementing entity (MIEs)
84
The Landscape of Climate Finance 2012
PB
The Landscape of Climate Finance 2012December 2012 December 2012
Appendix F - Financial flows for REDD+
FUND
ESTIMATED ANNUAL
COMMITMENTS (USD MILLION)
SOURCE
Bilateral and EU Institution commitments marked for climate change and forest related purpose
7000 OECD DAC database data for 2010 (OECD 2012)
Additional Fast Start Finance for REDD+ 2437CPI analysis of Fast Start Finance reporting to UNFCCC for 2010 Gibbs (2012)
Norway-Indonesia REDD+ Partnership 00Phase I contribution equals USD 30 million however no funds have yet been disbursed to projects Source Personal Communication with Indonesian officials
Norway-Guyana REDD+ Investment Fund 04Administrative fees for project proposal preparation grants for projects approved in 2011 including (1) Institutional Strengthening US$ 305168
UN-REDD Programme 352
Multi-Partner Trust Fund Office May 2012 Third Consolidated Annual Progress Report on Activities Implemented under the UN-REDD Programme Fund for the period 1 January ndash 31 December 2011 httpmptfundporg
World BankForest Carbon Partnership Facility (FCPF)
214Approved spend in 2011Source wwwclimatefundsupdateorg
Congo Basin Forest Fund 573Approved spend in 2011Source wwwclimatefundsupdateorg
Forest Investment Program (FIP) 510Approved spend in 2011Source wwwclimatefundsupdateorg
Global Environment Facility (GEF) 109CPI identification of projects related to forests approved or endorsed by the CEO during 2011 as of end July 2012 Source Source data through personal communication with GEF Secretariat July 2012
Global Climate Change Alliance 247Approved spend in 2011 in the REDD area Source wwwclimatefundsup-dateorg
Amazon Fund 269Approved spend in 2011Source wwwclimatefundsupdateorg
BNDES Mata Atlacircntica initiative 58
R$ 118m approved in 2011 for 3 reforestation projects (converted to USD using an exchange rate of USD 048860R$ oandacom 1 September 2012) Source Press Release 26 May 2011 httpwwwbndesgovbrSiteBNDESbndesbndes_enInstitucionalPressNoticias201120110526_mataatlanticahtml
International Tropical Timber Organization (ITTO)
40 Macqueen (2010)
Forest Carbon Markets 1430Peters-Stanley et al (2012) Value of primary credits sold on the volun-tary and CDMJI markets in 2011
Total 13242Notes - The following donor funds are excluded from the table above due to their interaction with other funds presented Australian International Forest Carbon Initiative (USD 314 million annualized estimate based on data from wwwclimatefundsupdateorg) German International Climate Initiative (USD 076 million ap-proved for REDD projects in 2011 according to wwwclimatefundsupdateorg) Norwegian Climate and Forest Initiative (no data on 2011 approved projects at wwwclimatefundsupdateorg) Japan Fast-Start Finance - The estimate of bilateral and EU Institution commitments in the forest sector is based on filtering of OECD CRS data according to climate change marking and forest related purpose coding (forestry industries development educationtraining policy amp admin Management research and services) Project channels and titles were screened to remove potential overlaps with ITTO GEF FIP FCPF and UN-REDD The portion of Fast-Start finance we identified in 2010 data (about USD 18 billion) is estimated to have contributed an additional USD 250 million which was obtained by applying an aver-age 14 share of Fast-Start financing to REDD measures over the December 2010 and 2011 period (Gibbs 2012)
- 1Introduction
- 2Methodology
-
- 21 Definitions
- 22 Analytical focus
- 23 Innovations in this yearrsquos study
-
- 3The Current Landscape of Climate Finance Flows
-
- 31 Sources and intermediaries
- 32 Intermediaries
- 33 Instruments
- 34 Disbursement channels
- 35 Uses
-
- 4Conclusions and the way forward
- Index of acronyms
- Glossary
- References
- Websites
- Appendix A - Main assumptions and methodology
- Appendix B - A summary of the Landscape 2011
- Appendix C - Existing climate finance tracking databases and major ongoing initiatives
- Appendix D - Details on Development Finance Institutions
- Appendix E - Details on Climate Funds
- Appendix F - Financial flows for REDD+
-

6
The Landscape of Climate Finance 2012
7
The Landscape of Climate Finance 2012December 2012 December 2012
risk profiles of developers In turn this allows national institutions to pass knowledge to the local banking system to unlock its financing potential and exploit its ability to reach a wide group of recipients
Dedicated Climate Funds typically managed by multilateral bilateral and national intermediaries contributed at least USD 15 billion to overall flows Their importance is likely to grow given their capacity to catalyze and coordinate resources for co-financing including at national levels
Private commercial banks and infrastructure funds intermediated around USD 38 billion including project-level debt and direct investments Private intermediar-ies played a particularly critical role by providing the scale of finance and financial toolboxes able to address the specific needs of lsquogreenrsquo and innovative investment interventions (eg concentrated solar power etc) On the other hand project developers provided equity capital and know-how
InstrumentsOur analysis of instruments indicates that most climate finance USD 293-347 billion out of USD 364 billion can be classified as investments in which public or private financial institutions had an ownership interest or claim ndash that is money which has to be paid back ndash rather than as contri-butions to incremental costs
Public intermediaries enabled otherwise unviable projects through the use of instruments such as concessional loans and grants
Around USD 293 billion was in the form of market rate loans and equity of which USD 262 billion had been made by the private sector Green credit lines as well as support for institutional development were also intended to attract local financial institutions to on-lend to projects that would not otherwise be implemented and to favor private sector investment
Public intermediaries enabled investments by filling capacity and viability gaps that prevented private investors from engaging in capital-intensive riskier and in the short-term less profitable ventures Public intermediaries delivered more than 60 of their financ-ing through concessional loans and about 7 in grant form Lowering the cost of debt in this way is essential
for low-carbon technologies to compete with traditional fuel-based alternatives
Beyond grants loans equity and debt finance a variety of risk management instruments help to overcome risk barriers and encourage low-carbon technologies to scale up Public-private facilities and guarantees to assume regulatory credit or perceived technology risks are just some of the instruments that can remove the risks private actors are not willing or capable of bearing
Uses
Mitigation activities attracted USD 350 billion mostly related to renewable energy and energy efficiency Emerging economies were key recipi-ents of climate finance Close to 33 of mitiga-tion-related finance was invested in China Brazil and India
The majority of funding captured by the Landscape 2012 was spent on mitigation activities Compared to the Landscape 2011 there was progress in understanding adaptation finance due to increased tracking efforts However weaknesses in defining and tracking adap-tation finance partial reporting by some multilateral players and the inability of existing efforts to capture private flows dedicated to such activities hampered our understanding of adaptation finance flows
The bulk of financing captured went to renewable energy generation projects and energy efficiency accounting for 85 and 4 of the total respectively This reflects governmentsrsquo low-carbon growth ambi-tions the commercial viability of a broad range of proven technologies the profit-driven character of private investments and the data sources we had access to
This report confirms that public financial institutions are playing an essential role in financing clean energy allo-cating more than 60 of their intermediated financial flows to renewable energy and energy efficiency They are also essential for financing adaptation measures contributing up to USD 11 billion and even more impor-tantly managing and implementing some of the relevant adaptation funds
The allocation of climate finance between developed and developing countries was relatively balanced with USD 193 billion or 53 going to projects in developed
8
The Landscape of Climate Finance 2012
9
The Landscape of Climate Finance 2012December 2012 December 2012
countries and USD 172 billion or 47 to projects in developing countries
Emerging giants such as China Brazil and India were the largest recipients of global mitigation-directed climate finance flows with USD 171 billion close to 33 of the total This implies that investments have been made where they are needed most and where mitiga-tion potential is the greatest Notably a significant share of this was raised domestically and invested in pursuit of development mandates
8
The Landscape of Climate Finance 2012
9
The Landscape of Climate Finance 2012December 2012 December 2012
32
Venture Capital Priva
te E
GENERAL TAX REVENUES
CARBON-RELATED TAXES
CARBON MARKET
REVENUESDEVELOPM
ENT FINANCE INSTITUTIONS
VENTURE CAPITAL PRIVATE EQUITY amp INFRASTRUCTURE FUNDS
$214
$22
$57
$53
$13
$5
$14
$350
DIFFERENT DISBURSEM
ENT CHANNELS
$2$7
$2
$47
$23
$32
$17
$104
$70
$32
POLICY INCENTIVES
RISK MANAGEM
ENT
CARBON OFFSET FINANCE
GRANTS
LOW-COST
PROJECT DEBT
PROJECT-LEVEL M
ARKET RATE DEBT
PROJECT-LEVEL EQUITY
BALANCE SHEET FINANCING
DEBT PORTION
INSTITUTIONAL INVESTORS
PROJECT DEVELOPERS
CORPORATE ACTORS
HOUSEHOLDS
GOVERNMENT
BUDGETS
$19
MITIGATION
ADAPTATION
Notes Figures are indicative estimates of annual fl ow
s for the latest year available 2010 or 2011 (variable according to the data source) Flows are expressed in USD billions
and rounded to produce whole num
bers Estimates spanning m
ultiple years are adjusted to produce annual-equivalent estimates W
here ranges of estimates are available
the mid-point is presented The diagram
distinguishes between lsquoincrem
ental costsrsquo that is fi nancial resources that cover the price di erence between a cheaper m
ore polluting options and costlier clim
ate-friendly ones and do not need to be paid back mdash and lsquocapital investm
entrsquo which are tangible investm
ents in mitigation or adaptation projects that need to be paid
back Categories not representing capital investment or a m
ix of capital investment and increm
ental costs are incremental costs only The group of National Finance Institutions includes
Sub-regional entities Most data presented relates to com
mitm
ents in a given year due to limited availability of disbursem
ent data
COMM
ERCIAL FINANCIAL INSTITUTIONS
AGENCIES
THE C
LIMATE FINANCE FLOW
S DIAGRAM 2012
The Climate Finance Flow
s Diagram 2012 also know
n as the lsquospaghettirsquo diagram illustrates the landscape of clim
ate fi nance fl ows along their
life cycle for the latest year available mostly 2011 The w
idth of the arrows in the diagram represents the relative size of the fl ows
NE
lt$1
MULTILATERAL
NATIONALBILATERAL
NE
NE
NE
NE
NE
NE
$77
CLIMATE FUNDS
NE Not estimated
PUBLIC M
ONEYPRIVATE M
ONEYPUBLIC FINANCIAL INTERM
EDIARIES
PRIVATE FINANCIAL
INTERMEDIARIES
OFFSET M
ONEYCAPITAL INVESTM
ENTCAPITAL INVESTM
ENT AND INCREM
ENTAL COSTS
KEY
FINANCE FOR INVESTORS amp
LENDERS
REDD
SOU
RCES AN
D IN
TERMED
IARIES
INSTRU
MEN
TSCH
AN
NELS
USES
NE
NE
Figure 1 Climate Finance Flows Diagram
2012 (in USD billions)
10
The Landscape of Climate Finance 2012
11
The Landscape of Climate Finance 2012December 2012 December 2012
CO N T E N TS1 INTRODUCTION 1 1
2 METHODOLOGY 1221 Definitions 1222 Analytical focus 1 423 Innovations in this yearrsquos study 15
3 THE CURRENT LANDSCAPE OF CLIMATE FINANCE FLOWS 1 831 Sources and intermediaries 1 832 Intermediaries 3233 Instruments 4334 Disbursement channels 4935 Uses 49
4 CONCLUSIONS AND THE WAY FORWARD 61
INDEX OF ACRONYMS 6 5
GLOSSARY 6 6
REFERENCES 6 8
WEBSITES 7 3
APPENDIX A - MAIN ASSUMPTIONS AND METHODOLOGY 75
APPENDIX B - A SUMMARY OF THE LANDSCAPE 2011 76
APPENDIX C - EXISTING CLIMATE FINANCE TRACKING DATABASES AND MAJOR ONGOING INITIATIVES 7 7
APPENDIX D - DETAILS ON DEVELOPMENT FINANCE INSTITUTIONS 7 9
APPENDIX E - DETAILS ON CLIMATE FUNDS 8 2
APPENDIX F - FINANCIAL FLOWS FOR REDD+ 8 4
10
The Landscape of Climate Finance 2012
11
The Landscape of Climate Finance 2012December 2012 December 2012
1 IntroductionClimate change is a global challenge that requires a global response Failure to comprehend the global context of the financing challenge will undermine our ability to accurately assess whether current investments are on track and made where they can deliver the great-est impacts to limit global temperature rise to below two degrees Celsius To achieve this temperature goal the International Energy Agency projects that incre-mental investment in the energy sector alone will need to reach USD 36 trillion over the period of 2012-2050 ndash or approximately USD 1 trillion each year (IEA 2012)
The aim of this study is to contribute understanding on how much and what type of financial support is avail-able globally to advance action on low-carbon climate resilient development Ultimately building this under-standing is essential for ensuring that governments and investors everywhere have the knowledge and tools to spend their money in ways that optimize prospects for achieving the transition
The first Landscape of Climate Finance published in 2011 (Landscape 2011) was the most comprehensive over-view of the global climate finance landscape to-date This yearrsquos study (Landscape 2012) aims to improve on last yearrsquos estimates and add deeper insight into the nature of global climate finance It provides a more detailed breakdown of flows and sheds light on the latest trends
The Landscape 2012 aims to provide to the extent possible
bull An expanded geographical scope covering flows between developing countries (lsquoSouth-Southrsquo) from developed to developing countries and domestic climate finance flows
bull An expanded coverage of national sub-regional regional and international public actors
bull A more detailed representation of private sector climate finance flows with a better picture of sources and uses
bull An improved representation of climate finance uses by sector (sectoral uses) including flows to adaptation and to reducing emissions from deforestation and forest degradation ldquoplusrdquo the sustainable management and conservation of forests and the enhancement of carbon stocks in developing countries (known as REDD+ schemes) and
bull A better understanding of the recipients and final uses of climate finance both in terms of sectoral uses and of geographical destination
This report has three main sections Section 2 outlines our methodology including key definitions and differ-ences compared to the Landscape 2011 Section 3 the main body describes the current landscape of climate finance flows along their lifecycle from sources through to intermediaries instruments channels and end uses Section 4 summarizes our findings and provides brief recommendations to improve existing climate finance tracking efforts
12
The Landscape of Climate Finance 2012
13
The Landscape of Climate Finance 2012December 2012 December 2012
2 MethodologyThis study the Landscape 2012 aims to capture the most recent annual climate finance flows supporting (1) emis-sion reductions (2) climate resilience and (3) enabling environment projects1
Building upon the Landscape 2011 we adopt a two-dimensional framework for this study First flows are categorized alongside their lifecycle (sources interme-diaries instruments disbursement channels and final sectoral uses geographic destination of recipients) Second flows are categorized depending on whether they originate from public or private sources (see tax-onomy section in the Landscape 2011)
We gathered empirical data on climate finance flows from a wide range of sources (main assumptions and sources are listed in Appendix A and the References section) relying on (1) readily-available data (2) data-sets we analyzed and (3) our own estimates We also drew upon expert opinions to estimate certain flows
21 Definitions
Climate-specific versus climate-related investmentsThe lack of an internationally-acknowledged defini-tion of what qualifies as climate finance or even more narrowly what qualifies as a climate project presents a major challenge to understanding the scale of financial flows there is no established basis for a methodology or measurement system for tracking climate finance flows (Buchner et al 2011ab) This is particularly chal-lenging in the context of adaptation
For the purposes of this study finance flows are limited to lsquoclimate-specific financersquo referring specifically to capital flows targeting low-carbon and climate-resilient development It can have direct or indirect greenhouse gas mitigation or adaptation objectivesoutcomes Note that climate-specific finance excludes a broader set of capital from developed to developing countries that may influence directly or indirectly emissions andor vulnerability to climate change in developing countries
1 ldquoEnabling environment projectsrdquo typically include efforts to strengthen institutions to establish policies regulations or laws and to remove tech-nical legal and administrative barriers to investment The Landscape 2011 included some climate finance targeting enabling environment projects but was not labelled as such The Landscape 2012 instead explicitly cap-tures financing for capacity building and technical assistance measures such as for instance the financing of feasibility studies for projects and the development of local financial institutionsrsquo capacity
and which is typically referred to as lsquoclimate-relevantrsquo finance (see Corfee-Morlot et al 2009 and Buchner et al 2011)
Tangible versus intangible investments In the Landscape 2012 we included to the extent pos-sible (depending on the granularity of data available) only investment flows made toward tangible physical assets like for instance wind farms We excluded to the extent possible investment in measures such as research and development manufacturing or deploy-ment because these might not ultimately result in emission reductions and to reduce the risk of double counting money going to specific emission reductions2
The Landscape 2012rsquos focus on money for emission reductions climate resilience and enabling environment projects in the year 20102011 excludes future commit-ments such as policy incentives (that are not upfront capital grants) or risk management instruments (loan guarantees or insurance policies) The rationale is that we are tracking money actually in the system rather than potential future amounts that may pay for things other than investment costs (eg premiums for green electricity carbon credit purchases payments for loan defaults)3 The objective is to avoid double counting for example the face value of full loan guarantees and loans or discounted expected feed-in tariff payments with the investment cost4 The general roles of current policy mechanisms and risk management instruments are represented in the Climate Finance Flows Diagram 2012 as they play a central role in the investment and financing decision-making process but we do not esti-mate flow values for them
2 Examples such as Chinese solar panels that are deployed in Italy indicate the difficulty in attributing a specific technological breakthrough or spillover effects to RampD expenditures in a given country or year
3 The methodologies used in this report to calculate global finance flows are not intended to imply which (or which proportion) of these contributions to climate finance should count toward the goal to mobilize US 100 billion per year by 2020 to assist developing countriesrsquo climate responses and which (or which proportions) should not Nothing in this report is meant to infer that the goal (of mobilizing US 100 billion per year by 2020 to assist developing countriesrsquo climate responses) has already been achieved
4 Furthermore there is a potential gap between what institutions report at the time of offering risk management instruments (such as the face value of a full or a partial risk guarantee the premium collected on such instru-ments or corresponding accounting provisions) and the actual amount that may be spent in the future
12
The Landscape of Climate Finance 2012
13
The Landscape of Climate Finance 2012December 2012 December 2012
Incremental costs versus investment capitalIncremental cost and investment capital are both important lenses for climate finance flows Incremental cost refers to financial resources provided to compensate for the difference between a less costly more polluting option and a costlier more environmen-tally-friendly andor climate-resilient one Investment capital refers to tangible investment in mitigation or adaptation projects Whereas investment capital is paid back to the investor incremental costs often are not and are thus often funded with public climate funds either through policy support or concessional finance5 Whether incremental costs are covered by public support often make the difference in whether the private sector invests in a project Almost all costs asso-ciated with REDD+ measures are incremental costs
Our work captures mostly investment capital rather than incremental support (see previous sub-section) In order to get to the incremental cost value of emission reductions climate-resilience and enabling environ-ment projects we need assumptions for baselines against which we measure the incremental cost Such baselines are project-specific and would require us to make debatable assumptions on what fair baselines would be More efforts are needed to address this issue in-depth
Gross value versus net valueClimate finance can be measured in terms of lsquogrossrsquo or lsquonetrsquo metrics (AGF 2010)6 The Landscape 2012 focuses on gross flows which reflect the full volume of financial flows delivered through all instruments rather than net flows which provide an indication of the final net contribution of investors and countries Gross flows include money that has to be paid back by recipients ie concessional and non-concessional loans and equity Nonetheless they shed light on the level of mobilized international investments and the net contribution of countries
More efforts are needed to break down contributions by gross or net value As a first step into this direction
5 In the case of energy efficiency the additional upfront costs do need to be paid back but are expected to be compensated with energy savings over time Also they can be paid for by private investors since they do get paid back
6 Under the approach flows would represent the financial flows transferred to countries in any given year (these include grants concessional and non-concessional loans mobilised through the bilateral and multilateral institutions private capital flows and flows from GHG offset projects) Under the approach amounts repaid by the recipient countries would be deducted (eg repayments of loan principal repatriation of capital)
section 35 on climate finance sectoral uses specifies this information whenever available
Mixed reporting yearsOur estimates of climate finance are based on the most recent data available The Landscape 2012 uses a mix of 2010 and 2011 data7
We used different sources of information to map exist-ing flows of climate finance We had a choice of using 2010 data only or reporting 2011 data for a significant part of the Landscape (most importantly Bloomberg New Energy Finance data on private flows) We selected the latter option in order to (1) highlight the most current trends in financing despite reporting delays in some areas and (2) provide consistency from year to year so that the Landscape 2012 picks up where the Landscape 2011 left off Where flows span several years we annualized them to make them compatible with other data sources
Commitment versus disbursement dataWe report committed finance rather than disbursed finance New commitment signifies the concrete commitment of money by the means of a closure of a financing contract board decisions on investment loan award announcements or similar actions Commitment finance does not imply that money will immediately flow as a lump sum to project developers8 There might be a time lag between commitments and disbursement But while disbursement information provides a more accurate picture of actual climate finance flows than commitment information disbursement data is not as universally available9 In addition 20102011 disburse-ment data can reflect commitments spanning several years for projects with long construction periods Disbursement data would therefore require further refinement For these reasons we mostly use commit-ment data in the Landscape 201210
7 Data derived from OECDrsquos Creditor Reporting System Aid Activities data-base (OECD CRS) namely public budget and the EU Institutionsrsquo climate finance data refer to 2010 while the others are all 2011 data or presenting the fiscal year 2011 (eg July 2010-June 2011 depending on the accounting methodologies) Philanthropy data instead refer to 20082009
8 A complicating factor is that there is a range of interpretations of what commitment actually constitutes
9 In ldquoThe German Landscape of Climate Financerdquo (CPI 2012) the granularity of data at the national level allowed the authors to rely on disbursement data to a greater extent
10 Where available we used disbursement figures In the case of Climate Funds we include annual commitments approved for specific projects rather than total pledges to the Funds which are disbursed over a number
14
The Landscape of Climate Finance 2012
15
The Landscape of Climate Finance 2012December 2012 December 2012
Reporting currencyAll the flows in this report have been converted to USD billion when reported in other currencies Appendix A provides more details on the exchange rates used
22 Analytical focus
Project-level primary financingThe gold standard in our analysis is project-level financing data Project-level financing data is as close as we can get to emission reductions enhanced climate resilience and a stronger enabling environment In the instrument section we therefore define ldquoinstru-mentsrdquo as the instruments covering project costs in the reporting year or primary financing instruments We exclude instruments that cover financing costs that is secondary market instruments11 The exception to this rule relates to Development Finance Institutions whose flows can include instruments that cover committed money to a specific sector or actor
Secondary market transactions do not represent new money targeting climate finance but rather money changing hands Focusing on primary tangible invest-ments allows us to more accurately estimate financing that supports low-carbon climate-resilient activities
Finance flowsThis year we have solely captured flows among actors rather than (1) any ownership or claims one actor may have on another and (2) readily-available resources (net income debt secured and shareholdersrsquo equity from prior years)12
The flow-only representation has strong implications on what is being covered and represented in the Climate
of years Likewise for DFIs we include annual commitments ie funds ap-proved for projects in a given budget year (UNEP 2011 presents what dif-ferent BFIs mean as ldquocommittedrdquo funds) Only one organization surveyed provided disbursement data rather than commitments
11 For example consider a project in which a utility invests money from its own balance sheet to finance a new onshore wind farm With our focus on project-level financing we would categorize this investment as balance sheet financing We do not examine where the corporate money is coming from (borrowing programmes on-going activities capital increase or sale of non-strategic assets)
12 In this sense we are also capturing payments (or estimates of payments) for carbon finance
Finance Flows Diagram 2012 (also known as the lsquospa-ghettirsquo diagram) compared to the Climate Finance Flows Diagram 2011 In particular inflows need not match out-flows For example a development bank may have com-mitted USD 3 billion in 2011 even though it only received USD 500 million of aid contribution the same year from public budgets mdash this doesnrsquot mean this bank is par-ticularly good at leveraging money or in the opposite case that it is wasting money because the flows do not capture other ownership and assets By capturing flows in this way we are also able to highlight where money may be sitting with a given actor within the landscape of climate finance
The linearity of the lifecycle of flows is however a simplification Flows are categorized alongside the lifecycle of flows (sources intermediaries instruments disbursement channels and uses recipients) as though the lifecycle was a linear path In reality pathways for finance are more complex and involve (1) feedback loops ie money can go back and forth between differ-ent actors (2) multiple layers and cascades of equity ownership and (3) intermediate layers of instruments eg between government budgets and National Finance Institutions13
Ranges for estimated valuesGiven the uncertainty surrounding some data sources the multiple potential approaches to estimating specific climate finance flows and the lack of agreement on climate finance definitions and boundaries we opted to represent climate finance flows as ranges whenever possible rather than conveying a single-point estimate For example data ranges for renewable energy asset finance depends on data sources for non-domestic money (either Bloomberg New Energy Finance or UNCTAD Foreign Direct Investment data) For the sake of readability the numbers reproduced on the Climate Finance Flows Diagram 2012 correspond to mid-points
13 Depending on where you draw the line you could have many layers of source to instrument to recipient with each recipient becoming a source itself
The Landscape of climate finance focuses on tangible project-level primary financing flows
14
The Landscape of Climate Finance 2012
15
The Landscape of Climate Finance 2012December 2012 December 2012
23 Innovations in this yearrsquos study
Global geographical scopeThe Landscape 2011 focused on climate finance flows from developed to developing countries and included some developing countries and domestic sources although to a limited extent and independent of their origin (domestic money money from other develop-ing countries or from developed countries) To shed more light on where we stand compared to global financing needs to stabilize average temperature to below 2 degrees in the Landscape 2012 we extend the geographical coverage to feature estimates of climate finance flows to and in developed countries (domestic money and money from other developed countries or developing countries) The figures identified in the Landscape 2012 should therefore not be confused with amounts that count towards the USD 100 billion prom-ised by developed countries in the Copenhagen Accord but rather as indications compared to global financing needs to meet the two degrees goal
We categorize actors providing climate finance (lenders investors guarantors etc) as domestic or foreign enti-ties and as hailing from developing or developed coun-tries using the best information available This extended coverage allows us to map both sources and destina-tions more precisely and to compare financing trends in different regions Domestic finance coverage was improved by investigating the contribution of National Finance Institutions
More detailed representation of private sector climate finance flowsWith a more informative categorization of private climate finance flows the Landscape 2012 sheds more
light on private finance flows In the Landscape 2011 private flows were captured in two categories ldquoglobal capital marketsrdquo and ldquoprivate financerdquo In the Landscape 2012 we strove to better categorize private flows The Landscape 2011 ldquoglobal capital marketsrdquo category has been broken down into ldquocommercial financial institu-tionsrdquo ldquoinstitutional investorsrdquo and ldquoventure capital private equity and infrastructure fundsrdquo Likewise ldquoprivate financerdquo was broken down into ldquocorporate actorsrdquo ldquoproject developersrdquo and ldquohouseholdsrdquo
We started from the global private climate finance numbers and broke them down in distinctive geographi-cal and technology subgroups to the extent possible When we could not categorize any further we looked at individual projects from a representative sample and categorized them along three dimensions category of actor geography of origin first degree ndash ultimate degree ownership14
We used these dimensions to create a set of weights and applied those weights to the global numbers to obtain dollar values for different dimensions of the global figures
Extended coverage of public intermediariesThe Landscape of Climate Finance 2012 covers the follow-ing Development Finance Institutions (DFIs)15
bull Four Bilateral Finance Institutions (BFI) French Development Agency with Proparco (AFD) Japan International Cooperation Agency (JICA) KfW Entwicklungsbank and DEG and Overseas Private Investment Corporation (OPIC)
bull Nine Multilateral Finance Institutions (MFI) World Bank International Finance Corporation (IFC) EU Institutions16 European Investment Bank (EIB) European Development Bank for Reconstruction and Development (EBRD) Asian Development Bank (AsDB) African Development Bank (AfDB) Inter-American Development Bank (IDB) and Nordic Development Fund (NDF)
14 In addition to small-scale asset financing we covered 1636 individual proj-ects from the Bloomberg New Energy Finance database representing 82 of the extra capacity in developed countries and 89 of the extra capacity in developing countries (539 GW in total)
15 We opted to refer to the broad group of institutions covered in the report as Development Finance Institutions (DFI) given their development man-dates but we acknowledge that the term DFI is here used with a broad meaning
16 The European Commission and EU Development Fund
The Landscape 2012 improves on the Landscape 2011 by including a broader geographic scope that covers developed as well as developing countries and domestic flows better categorization of the actors involved a better understanding of whatrsquos behind private finance flows and extended coverage of Development Finance Institutions
While this implies that data from Landscape 2012 is not directly comparable to Landscape 2011 it provides more detail and sheds light on how global finance flows match global financing needs to support a low-carbon climate-resilient transition
16
The Landscape of Climate Finance 2012
17
The Landscape of Climate Finance 2012December 2012 December 2012
bull Nineteen National Finance Institutions Brazilian Development Bank (BNDES) Development Bank of Latin America (CAF) Nacional Financiera (Nafin) Fideicomisos Institudos en Relacion con la Agricultura (Fira) Agencia Financiera de Desarollo Development Bank of Southern Africa (DBSA) Indian Renewable Energy Development Agency (IREDA) Banco del Estado de Chile Central American Bank for Economic Integration (BCIECABEI) Bancoldex Colombia Black Sea Trade and Development Bank of Greece (BSTDB) China Development Bank (CDB) Caisse de Depot et de Gestion of Morocco (CDG) Eximbank Indonesia Croatian Bank for Reconstruction and Development (HBOR) Korea Finance Corporation (KoFC) Industrial Development Bank of Turkey (TSKB) Small Industries Development Bank of India (SIDBI) and Vnesheconombank of Russia (VEB)
These institutionsrsquo climate financing data were retrieved from a blend of primary and secondary data sources Sixteen organizations out of the 32 covered in the report provided their data for mitigation and adaptation activi-ties directly by the means of a financial survey
Acknowledging the challenges in determining what qualifies as mitigation or adaptation and to unequivo-cally attribute specific investments to only one of these two themes mitigation and adaptation were broken down by sectors The choice of the sectors was guided and informed by other methodologies and account-ing practices (eg OECDCRS UNEP-SEI 2011) In those cases where respondents provided different sectoral breakdowns the projectcategory description was considered for allocating data against the chosen categories In the presence of activities with multiple objectives (both mitigation and adaptation) this amount was allocated according to the weights of mitigation and adaptation on the given total of climate finance17 To the extent possible data were adjusted to exclude interventions not in line with our definition of climate finance (eg we carved out financing for RampD manu-facturing or lower carbon energy generation projects the latter because they may have included fuel-to-fuel
17 For instance of the USD 96 billion ODA marked as climate finance in the OECD CRS database and not channelled by AFD JICA or KfW USD 42 billion is marked as mitigation only USD 3 as adaptation only and USD 24 billion as both mitigation and adaptation related We allocated the dual purpose money according to the distribution between mitigation only and adaptation only projects (59 vs 41) For DFIs eg in the case of EU Institutions dual purpose money (USD 264 million) was allocated accord-ing to the share of mitigation and adaptation projects (55 vs 45)
switch project such as fuel to gas and coal to gas and fossil fuel based co-generation) We acknowledge the uncertainties associated with what qualifies as climate finance and what does not and the ldquoimmaturityrdquo of some institutionsrsquo tracking and reporting methodolo-gies which affects our understanding on the real magni-tude and nature of the climate finance delivered by these institutions
Extended coverage of sectoral usesThe Landscape 2011 focused on renewable energy While we did our best to capture energy efficiency energy smart technologies and infrastructure industrial processes transportation and other sectors reliable data sources in these fields that fit within our frame-work were limited Some of these missing data sources are now available at national levels and we therefore managed to include a broader sectoral coverage in the Landscape 201218
Note that coverage for climate-resilience is even patchier due to reporting and categorization issues which hamper our understanding of what constitutes adaptation finance
Other changesThe capital boxes in the Landscape 2011 have been recategorized into ldquomarket rate project-level debtrdquo ldquoproject-level equityrdquo and ldquobalance-sheet financingrdquo for the Landscape 2012 We also mapped primary carbon offset flows differently attributing flows directly to the actors involved in the acquisition of primary offsets Apart from these changes several categories have been renamed for the Landscape 2012 government budgets (previous domestic public budgets) Development Finance Institutions including bilateral multilateral and national financial institutions (previous bilateral multilateral agencies and banks) carbon offset finance (previous carbon offset flows) and low-cost project-level debt (previous concessional loans)
18 Note that nuclear was not included in either the Landscape 2011 or in the Landscape 2012 as we could not identify data sources highlighting financ-ing directed to this type of projects None of the DFIs surveyed included in their climate finance reporting financing for nuclear projects nor did donors in their reporting to the OECD DAC
16
The Landscape of Climate Finance 2012
17
The Landscape of Climate Finance 2012December 2012 December 2012
Box 1 ndash The Landscape 2012 compared to the Landscape 2011CPIrsquos Landscape of Climate Finance 2011 represented the first comprehensive review of the global climate finance landscape The study focused on climate finance flows from developed to developing countries with limited coverage of developing countries and domestic sources
Due to divergent definitions and data gaps we faced a number of methodological difficulties some of which we were able to account for (eg double counting of the same flows) others less so (eg differing definitions and time periods)
Based on this methodology we estimated total global climate finance flowing to the developing world at on average USD 97 billion a year in 20092010 Appendix B summarizes the Landscape 2011
When we apply the Landscape 2011 methodology and focus to the Landscape 2012 data to highlight as much comparability among flows as possible total climate finance flows predominantly directed towards developing countries in 20102011 is USD 112 billion The increase is a result of the following main factors
bull a 78 increase in bilateral ODA climate finance flows from developed to developing countries in 2010 compared to 2009 partly reflecting the impact of Fast-Start finance pledges and partly the new OECD Rio marker to track aid targeting climate change adaptation objectives
bull a 47 increase in financial flows from the Multilateral Finance Institutions considered in the Landscape 2011
bull a more than doubling of carbon offset finance reflecting almost doubled issuance of CERs in 2011 compared to 2010 (although there were lower prices) and improved data visibility on ERU issuance
An optimist might suggest that USD 112 billion in climate finance overachieves the USD 100 billion promised by developed countries in the Copenhagen Accord Yet we have to recognize that this might not be correct for multiple reasons mostly related to our scope We aim to provide a comprehensive overview of all the current financial resources for climate change action Consequently not all of the USD 112 billion counts as additional climate finance from what was available prior to the Copenhagen Accord The reality is that while climate finance has increased quickly over the past 10 years a significant share of the USD 112 billion provided in 20102011 was already committed prior to the Accord Further like in the Landscape 2012 the USD 112 billion total includes some developing countries and domestic sources although to a limited extent and considers both incremental cost and investment capital
In other words our climate finance estimates cannot and should not be compared with the USD 100 billion of the Copenhagen Accord The methodologies used in both the Landscape 2011 and Landscape 2012 are not intended to imply which (or which proportion) of these contributions to climate finance should count toward the goal to mobilize USD 100 billion per year by 2020 to assist developing countriesrsquo climate responses Nothing in this report is meant to infer that this goal has already been achieved
18
The Landscape of Climate Finance 2012
19
The Landscape of Climate Finance 2012December 2012 December 2012
3 The Current Landscape of Climate Finance FlowsIn this section we describe how climate finance breaks down along the lifecycle of financial flows from sources to end uses For each stage of global climate finance we aim to highlight the key reasons and motivations for finance flows ranges of finance involved where the money is coming from (geographies specific actors etc) where it is going (geographies specific actors technologies etc) and any issues specific to each life-cycle stage
31 Sources and intermediaries
Current sources of climate finance include
These various sources have multiple connections to each other There is also a strong interrelation between public and private sources of finance
Not captured in these figures are governmentsrsquo direct and indirect shareholdings and lending to private invest-ment structures as well as private contributions to International Financial Institutions (public contributions to Development Finance Institutions are captured only to a limited extent)
In the Landscape 2012 we have highlighted the contribu-tion of several categories of private stakeholders acting in the global landscape of climate finance namely corporate actors project developers households and institutional investors19 The contribution of public and private intermediaries (USD 110 ndash 120 billion) is dis-cussed in section 32
Carbon-related mechanisms Carbon-related mechanisms are comprised of (1) carbon market revenues and (2) all climate-related taxes raised by governments (ranging from explicit and implicit carbon taxes) Money collected from carbon markets and carbon-related taxes flows to government budgets though it is not clear how much is earmarked
19 Potential future sources of climate finance discussed in international forums are not mapped in the Landscape These include revenues from taxation of international aviation and shipping emissions revenues gener-ated by removing fossil fuel subsidies revenues generated by fossil fuel extraction royaltieslicenses revenues from a financial transaction tax (FTT) or allocation of Special Drawing Rights etc
SOURCES amp INTERMEDIARIES ()ANNUAL FLOWS OF DIRECT CLIMATE FINANCE
(2010 2011 USD BILLION)
PUBLIC
Government budgets (5) 160 - 226
Development Finance Institutions (21) 768
bull Climate Funds (lt1) 15
Sub-total public (26) 927 - 993
PRIVATE
Corporate actors (21) 693 - 805
Institutional investors (lt1) gt 06
Project developers (34) 1150 - 1293
Households (9) 323
Commercial financial institutions (10) 307 - 404
Venture capital private equity amp infrastructure funds (1) 24
Sub-total private (74) 2503 - 2855
TOTAL
Total 3430 - 3848bull Sub-total sources (68) 2332 - 2653
bull Sub-total intermediaries (32) 1099 - 1196
The sum of climate finance flows from all sources totals USD 343-385 billion The dominant source is the private sector which provides as much as USD 250-286 billion in climate finance or 74 of total climate finance (out of USD 364 billion on average) Of private actors project developers provide USD 122 billion or 34 of total climate finance while other corporate actors provide USD 75 billion or 21 of total climate finance Contributions from government budgets ranged between USD 16 and 23 billion including direct public investments and north-south aid flows Development Finance Institutions along with Climate Funds provided USD 77 billion
18
The Landscape of Climate Finance 2012
19
The Landscape of Climate Finance 2012December 2012 December 2012Figure 2 - 20102011 clim
ate finance flows (in USD billions)
32
Venture Capital Priva
te E
GENERAL TAX REVENUES
CARBON-RELATED TAXES
CARBON MARKET
REVENUESDEVELOPM
ENT FINANCE INSTITUTIONS
VENTURE CAPITAL PRIVATE EQUITY amp INFRASTRUCTURE FUNDS
$214
$22
$57
$53
$13
$5
$14
$350
DIFFERENT DISBURSEM
ENT CHANNELS
$2$7
$2
$47
$23
$32
$17
$104
$70
$32
POLICY INCENTIVES
RISK MANAGEM
ENT
CARBON OFFSET FINANCE
GRANTS
LOW-COST
PROJECT DEBT
PROJECT-LEVEL M
ARKET RATE DEBT
PROJECT-LEVEL EQUITY
BALANCE SHEET FINANCING
DEBT PORTION
INSTITUTIONAL INVESTORS
PROJECT DEVELOPERS
CORPORATE ACTORS
HOUSEHOLDS
GOVERNMENT
BUDGETS
$19
MITIGATION
ADAPTATION
Notes Figures are indicative estimates of annual fl ow
s for the latest year available 2010 or 2011 (variable according to the data source) Flows are expressed in USD billions
and rounded to produce whole num
bers Estimates spanning m
ultiple years are adjusted to produce annual-equivalent estimates W
here ranges of estimates are available
the mid-point is presented The diagram
distinguishes between lsquoincrem
ental costsrsquo that is fi nancial resources that cover the price di erence between a cheaper m
ore polluting options and costlier clim
ate-friendly ones and do not need to be paid back mdash and lsquocapital investm
entrsquo which are tangible investm
ents in mitigation or adaptation projects that need to be paid
back Categories not representing capital investment or a m
ix of capital investment and increm
ental costs are incremental costs only The group of National Finance Institutions includes
Sub-regional entities Most data presented relates to com
mitm
ents in a given year due to limited availability of disbursem
ent data
COMM
ERCIAL FINANCIAL INSTITUTIONS
AGENCIES
THE C
LIMATE FINANCE FLOW
S DIAGRAM 2012
The Climate Finance Flow
s Diagram 2012 also know
n as the lsquospaghettirsquo diagram illustrates the landscape of clim
ate fi nance fl ows along their
life cycle for the latest year available mostly 2011 The w
idth of the arrows in the diagram represents the relative size of the fl ows
NE
lt$1
MULTILATERAL
NATIONALBILATERAL
NE
NE
NE
NE
NE
NE
$77
CLIMATE FUNDS
NE Not estimated
PUBLIC M
ONEYPRIVATE M
ONEYPUBLIC FINANCIAL INTERM
EDIARIES
PRIVATE FINANCIAL
INTERMEDIARIES
OFFSET M
ONEYCAPITAL INVESTM
ENTCAPITAL INVESTM
ENT AND INCREM
ENTAL COSTS
KEY
FINANCE FOR INVESTORS amp
LENDERS
REDD
SOU
RCES AN
D IN
TERMED
IARIES
INSTRU
MEN
TSCH
AN
NELS
USES
NE
NE
Notes Figures are indicative estimates of annual flow
s for the latest year available 2010 or 2011 (variable according to the data source) Flows are expressed in USD billions and rounded to produce w
hole numbers Esti-
mates spanning m
ultiple years are adjusted to produce annual-equivalent estimates W
here ranges of estimates are available the m
id-point is presented The diagram distinguishes between lsquoincrem
ental costsrsquo that is financial resources that cover the price difference between a cheaper m
ore polluting options and costlier climate-friendly ones and do not need to be paid back mdash
and lsquocapital investmentrsquo w
hich are tangible investments
in mitigation or adaptation projects that need to be paid back Categories not representing capital investm
ent or a mix of capital investm
ent and incremental costs are increm
ental costs only The group of National Finance Institutions includes Sub-regional entities M
ost data presented relates to comm
itments in a given year due to lim
ited availability of disbursement data
20
The Landscape of Climate Finance 2012
21
The Landscape of Climate Finance 2012December 2012 December 2012
SOURCES ESTIMATED VALUE DESTINATIONS
ExtE
rnal
bull Auctioning of European Union Allowances (EUAs) USD 162 billion
bull Auction of allowances on the Regional Greenhouse Gas Initiative (RGGI) USD 017 billion
bull Transaction of Kyoto Assigned amount units (AAUs) USD 024 billion
USD 20 BILLION
Oth
Er ac
tOrs
bull Government budgets USD 20 billion
DESCRIPTION
Proceeds from sales and auctions of carbon assets to cap-and-trade compliance buyers Originate from carbon constrained economic sectors or countries In particular
bull Transactions of Kyoto assets between governmentsbull Sale of carbon allowances to cap-and-trade market participants in Europe and in the US
PRIMARY DATA
SOURCES
bull World Bank State and Trends of the Global Carbon Marketsbull European Energy Exchange (EEX) databull European Commission DG CLIMA
ISSUES AND FUTURE
ANALYSISbull No specific earmarking of the proceeds towards emission reductions projects
for climate finance purposes (ie how much will be spent by governments towards climate finance)
Carbon market revenuesCarbon market revenues comprise proceeds from sales and auctions of carbon assets to cap-and-trade compliance buyers and originate from carbon con-strained economic sectors or countries The current scale of these revenues can be estimated taking into account auctions organized in countries with cap-and-trade systems (most importantly the EU Emissions Trading System) and sales from Assigned Amount Units (AAUs) between countries bound by the Kyoto Protocol The Landscape 2012 figure is identical to the Landscape 2011 but sub-components changed significantly Notably EU ETS prices have come down but corresponding carbon allowances auctioned have increased 50
Carbon-related taxes In 2010 revenues generated by carbon taxation in selected European countries ndash Finland Norway Sweden Denmark Switzerland and Ireland ndash accounted for approximately USD 73 billion (Elbeze and Perthuis 2011) This possibly represents a lower-bound estimate as it does not cover the revenues generated by carbon tax schemes in a number of other jurisdictions such as for instance the Canadian provinces of Quebec and British Columbia the San Francisco Bay Area Air Quality Management District (BAAQMD) or India Australia recently introduced a carbon pricing scheme which came into force in July 2012 while other countries
have planned to introduce one after 2013 (eg South Africa)20
The associated revenues from these programs which are potentially considerable21 are not necessarily ear-marked for climate finance but are often distributed for other purposes Specifically proceeds from carbon taxation can be returned to taxpayers in the form of targeted or lump sum compensation for households and business (eg Switzerland)22 or to reduce income tax (eg Finland) or fund general government budgets (eg Sweden and Norway) in some cases revenues can also contribute to fiscal consolidation to reduce budget deficits (Vivid Economics 2012 Elbeze and de Perthuis 2011) Some countries allocate funds to support envi-ronmental policy measures Denmark for instance has allocated around 40 of carbon tax revenues to
20 The tax base and rates differ considerably between countries Most commonly carbon taxes are placed on fossil fuels such as coal gasoline or natural gas Several European countries combine carbon levies applied to CO2 emissions with resource taxes that is targeting energy consump-tion (eg Denmark Sweden and Finland) The highest rates (USD 150ton of CO2) are paid in Sweden while the lowest (USD 0045ton CO2) in California (Climate Commission 2012 NREL 2009)
21 The European Commission in its proposal for the Energy Taxation Direc-tive estimated that a minimum carbon tax of USD 28 (EUR 20) per ton of CO2 common in all 27 Member States would generate revenues in the order of USD 56 billion (or EUR 40 billion) Estimates are based on total CO2 emission of sectors not covered under the EU ETS scheme (eg households and services transport agriculture small installation) For additional information see EC (2011)
22 Until 2010 Switzerland returned all carbon taxes to households and businesses but since 2011 a third has been spent on financing emission reduction projects (Elbeze and de Perthuis 2011)
20
The Landscape of Climate Finance 2012
21
The Landscape of Climate Finance 2012December 2012 December 2012
support emission reduction projects while 60 is returned to industry Boulder Quebec and BAAQMD also use proceeds to support climate mitigation pro-grams (NREL 2009)
The estimated USD 73 billion is not counted against the total climate finance presented in the Landscape 2012 Our intent is to highlight the contribution of this mecha-nism as a source of finance for government budgets
SOURCES ESTIMATED VALUE DESTINATIONS
bull Taxes levied on households and businesses USD 73 BILLION bull Government budgets USD 73 billion
DESCRIPTIONbull Taxes applied on CO2 or GHG emissions andor on the amount of energy consumed For energy-related taxes only the share
accruing to carbon taxes was retained in the estimate
PRIMARY DATA
SOURCES
bull Elbeze and de Perthuis (2011) based on data from the Ministries of the Environment of the covered countriesbull The European Commission statistical office Eurostat maintains a database covering environmental tax revenues from energya
transport and pollution and resource taxes CO2 taxes are included in the energy taxes category but cannot be differentiatedbull The OECD and the European Environment Agency (EEA) maintain a database on environmentally-related taxesb fees and
charges
ISSUES ANDOR FUTURE ANALYSIS
bull Incompleteness Our estimate covers only selected European countriesbull The portion devoted to climate finance cannot be easily estimated Tax revenues can be distributed in several ways eg
returned to tax payers used to reduce levies from labor or capital or put toward general government budgets Only some countries use carbon-related tax revenues for carbon mitigation programs
bull Tracking gaps A single repository of data or recurrent effort to aggregate figures on carbon tax revenues has not been identified so far
a Energy taxes include those applied on energy products used for stationary (eg coal electricity natural gas fuel oils) as well as transport purposes In 2010 energy taxes levied in the 27 Member States of the European Union amounted to USD 291 billion 18 of the Union GDP (Eurostat 2012 2011a)
b For additional information see the OECDEEA database web page
General tax revenuesIt is challenging to calculate precisely the extent of general tax revenues directed towards climate finance as they generally pass through domestic public budgets before being allocated to particular programs and purposes Given the strong hypothesis that should be applied and in line with the approach adopted the Landscape 2011 report this study refrains from providing an estimate for this source
Evaluating the volume of general tax revenues associ-ated with climate-specific activities would be easier if sources of funding were specifically earmarked to climate change objectives
In Tunisia for instance revenues from a tax levied on the first license registration of vehicles and custom duties on air conditioning equipment are devoted by law to the National Fund for Energy Conservation (FNME) This Fund sustains renewable and energy efficiency measures in the country23 In 2009 in the Tunisian
23 Law 2005-82 Official Printing Office of the Republic of Tunisia
budget around USD 21 million were allocated against the Fund (INS 2010)
Another example can be found in Brazil where the resources collected via the National Fund on Climate Change (FNMC) which is partly financed with a levy on the profits made by the oil industry are earmarked to support mitigation and adaptation projects and studies on climate change and its adverse effects The resources of the Fund can also be used to leverage inter-national public and private climate finance to support the mitigation and adaptation activities laid out in the countryrsquos Policy on Climate Change In 2011 the initial budget of the Fund was estimated for USD 132 million (R$ 226 million) (BNDES 2011 UNDP 2011 BNDESgovbr Brasilgovbr)
22
The Landscape of Climate Finance 2012
23
The Landscape of Climate Finance 2012December 2012 December 2012
Government budgets
Contributions from government budgets are estimated at between USD 16 and 23 billion in 20102011 The estimate includes USD 111 ndash 112 billion of domestic funds for project finance reported in the Bloomberg New Energy Finance database largely origi-nating from developed countries for small-scale invest-ments (USD 28 billion) larger-scale investments (USD 83 billion) and carbon offset finance (USD 01 billion) A large part relates to the US governmentrsquos rsquogreenrsquo economic stimulus packages
The estimate also includes contributions from devel-oped country governments to developing countries of between USD 48 and 114 billion in 2010 excluding reporting of finance channelled through AFD JICA and KfW as discussed below The lower bound of this esti-mate considers only aid marked as ldquoprincipallyrdquo climate change-related in the OECDrsquos Creditor Reporting System (CRS) database The upper bound of the range includes an additional USD 18 billion of money identi-fied in Fast-Start Finance reporting for the same year The range includes bilateral Overseas Development
Assistance (ODA) and Fast-Start Finance commitments in 2010 from 28 OECD countries plus Cyprus Latvia Liechtenstein Lithuania Mata and the UAE Notably no data was available in the sources consulted for OECD countries such as Chile Estonia Hungary Israel Mexico24 or Turkey
For our estimates of government budget contributions we exclude government contributions (including ODA) delivered through national bilateral and multilateral intermediaries and funds due to the current lack of data required to do so across the full range of actors and to avoid double counting with other flows captured separately (see Intermediaries section) Our estimate is therefore conservative and can be considered as a minimum Further discussion on government contri-butions to Development Finance Institutions (DFIs) is included in Box 3 which attempts to highlight the extent of public sector contributions to funding for
24 Mexico is a member of the OECD with DAC observer status Latt (2011) discuss Mexicorsquos role as an ldquoemerging donorrdquo conducting technical and scientific cooperation projects in developing countries to a value of around USD 16 million in 2009
SOURCES ESIMATED VALUE DESTINATIONS
IntE
rnal bull Carbon market revenues USD 2 billion
bull Carbon taxes USD 73 billionbull General tax revenues NE
USD 16-23 BILLION In
stru
mEn
ts an
d usE
s
bull Policy incentives NEbull Risk management NEbull Carbon offset finance USD 01 billionbull Grants USD 42 ndash 99 billionbull Low cost debt USD 59 ndash 65 billionbull Project-level market rate debt USD 02 billionbull Project-level equity USD 02 ndash 05 billionbull Balance sheet financing USD 54 billion
Usesbull USD 149-182 billion mitigation bull USD 1-44 billion adaptation
ExtE
rnal
bull Changes in net debt from third-party NE
OthE
r act
Ors
bull Development Finance Institutions NEbull Climate Funds NEbull Ownership of other actors of the landscape NE
DESCRIPTIONDomestic and international government climate finance expenditures fed by conventional tax revenues ownership earnings or sovereign bond issuance as well as in some cases revenues raised from carbon pricing mechanisms
PRIMARY DATA
SOURCES
bull OECD Development Database on Aid Activities Creditor Reporting System bull Fast Start Finance Reporting to the UNFCCCbull Bloomberg New Energy Finance database
ISSUES AND FUTURE
ANALYSIS
There is a lack of information on the extent of government contributions to Development Finance Institutionsrsquo climate finance as well as domestic and developing country sources of climate finance General budget support is by definition not earmarked in any way but may be another source of climate finance not currently tracked
Note Carbon market revenues and taxes while included in this table are discussed in detail in previous sections and tables
22
The Landscape of Climate Finance 2012
23
The Landscape of Climate Finance 2012December 2012 December 2012
low-carbon climate-resilient development in recent years in spite of fiscal austerity and the tightening credit context
Indeed if we were to include these amounts we see that more than half ndash USD 116 billion of USD 23 billion ndash of bilateral ODA commitments in 2010 were reported as being delivered by just three Bilateral Finance Institutions (AFD KfW and JICA) We also see that climate-related bilateral Official Development Assistance grew from USD 95 billion in 2009 to an estimated USD 23 billion in 2010 reflecting the impact of Fast-Start finance pledges which we estimate accounted for around 36 of Official Development Assistance in 2010 as well as the introduction of the marker for adaptation finance in the OECD CRS data-base The top providers of bilateral ODA were Japan Germany France and the United States
Export credits which support export transactions by hedging risks for investors are excluded from our esti-mate of government contributions because the instru-ments may not be called upon and may not therefore represent a true flow They may however play a key role in stimulating private low-emission investments in developing countries (see Instrument section for further information)
Grants (USD 42-99 billion) low-cost debt (USD 59-65 billion) and ldquobalance sheetrdquo financing of owned emission reductions projects (municipalities public schools military installations etc) (USD 54 billion) are the most common forms of financing provided using government money Flows to policy incentives and risk management instruments are expected to be very large but are not quantified in the study
We find that 64-72 of that deployment occurs in developed countries and 28-36 in developing countries
a American Reinvestment and Recovery Act grants Georgia Environmental Finance Authority grants Voluntary Airport Low Emission grants State of Pennsylvania solar program grants Rhode Island Economic Development Corporation grants etc
ExampleThe US Governmentrsquos many roles in solar project financing include (1) federal and state-level policy incentives to promote the renewable energy deployment (2) risk management instruments such as US Department of Energy partial or full loan guarantees (3) project-specific grantsa and (4) low cost debt such as the US Department of the Treasuryrsquos Federal Financing Bank loans to some of the largest projects financed in 2011 These various roles highlight the diversity of financing instruments available
24
The Landscape of Climate Finance 2012
25
The Landscape of Climate Finance 2012December 2012 December 2012
Box 3 The role of Development Finance Institutions Development Finance Institutions play a complex and crucial role in the climate finance landscape operating as a pivotal link between public and private finance
Preliminary investigation of the ownership structure of private investments mapped in the climate finance landscape indicates that a large portion of these investments could be classified as governmentsrsquo direct and indirect shareholdings in and lending to private investment structures (see Box 5 for more information) Public finance institutions add significant value to financing packages by subsidizing interest rates transforming the maturity of loans to long-term and absorbing a share of the risks of the loans handed out to the private sector Without public backing many of these packages would be unviable
Likewise government backing of Development Finance Institutions underpins their ability to raise funds and provide a range of instruments specially tailored to the delivery of low-emissions climate-resilient finance
The ownership structure of DFIs is typically dominated by nationalmember governments that initially capitalized the institutionsrsquo capital base and govern their activities
Net budget inflows to Development Finance Institutions in a given year on the other hand are mainly driven by their own financial activities (for instance their equity holdings and earmarked returns on investments) and finance raised on capital markets andor borrowings from governments With high financial security profiles (AAA credit rating) DFIs are able to refinance their activities via very low interest rate bonds
Also thanks to their capital structure and high financial security DFIs can deliver a range of concessional and non-concessional instruments to finance investments in developing countries Budget inflows may also include specific grant contributions from governments or trust funds that can either be passed on directly or used to further soften lending conditions (the grant element) of low-cost debt in order to deliver loans with deep concessions adapted to recipient needs eg poor financial capacity or for projects with long-term economic returns The average level of grant element in concessional loans provided by DFIs varies considerably depending on institutional mandates
Given the complexities laid out above this study does not yet provide an estimate of the level of government contribution to DFIs The foremost difficulty encountered relates to quantifying the costs to governments of absorbing the risks associated with backing DFI activities In terms of budget flows on the other hand transparent reporting is not always available due to confidentiality requirements and the fact that finance is disbursed over a period of years rather than at the time of commitment also presents difficulties
Discussions with just three DFIs included in this study suggest average grant elements of concessional loans of between 12 and 20 but with a range up to 70 for individual loans with deep concessions If we were to assume that all grants are provided using 100 contributions from government sources and an average grant element contribution from governments to low-cost debt of 17 we would estimate a contribution of government budgets to all DFI activities captured in the Climate Finance Flows Diagram 2012 of USD $10924 million (15 or 17 leverage) This estimate is not included in the Climate Finance Flows Diagram 2012 at present due to the lack of detailed information available for the full range of institutions included in the study and the difficulties outlined above
Thus while annual government budget contributions to DFIs may be relatively low finance provided by DFIs is generally considered to be public For example in the case of bilateral ODA according to the OECD DACrsquos reporting directives where ldquoOfficial transactions are [defined as] those undertaken by central state or local government agencies at their own risk and responsibility regardless of whether these agencies have raised the funds through taxation or through borrowing from the private sectorrdquo
24
The Landscape of Climate Finance 2012
25
The Landscape of Climate Finance 2012December 2012 December 2012
Box 4 ndash Supporting Renewable Energy in the US
US federal tax incentives cash grants and loans sustained a boom in renewables investment through the depths of the worst financial crisis since the Great Depression
The US public and private sectors invested a total of USD 143 billion in renewable energy projects and installed 34 GW of new solar and wind capacity between 2008-2011 ndash with over USD 50 billion and 9 GW in 2011 alone While the bulk of the financing for these projects came from the private sector growth was underpinned by stable renewable deployment support policies at both the state and federal level
With relatively low US electricity market prices most renewable projects built over the last four years would not have attracted investors without additional support from governments or ratepayers Aggressive long-term state-level renewable energy obligations (such as Californiarsquos requirement that 33 of its electricity be generated from non-hydroelectric renewable energy sources by 2020) have driven demand However as the recession squeezed state and ratepayer budgets federal government supports became more important
Prior to the financial crisis two primary federal policies were available ndash a USD 22MWh production tax credit for wind and a 30 investment tax credit (ITC) for solar But tax incentives require substantial and predictable tax liabilities from profits to be useful ndash and once the crisis hit these were in short supply Twenty or so large financial firms had provided over USD 6 billion in tax equity financing for renewable projects in 2007 About half of them ndash including AIG Lehman Brothers Citi and John Hancock ndash had exited the tax equity market by 2009 Further the financial crisis left banks less willing and able to provide long-term low-cost debt for capital-intensive projects such as wind and solar farms
The US economic stimulus in early 2009 addressed these issues Instead of tax credits wind and solar projects starting construction by the end of 2011 could choose a 1603 Cash Grant equal to 30 of eligible project costs So far the program has provided USD 13 billion (USD 47 billion in 2011) to support renewable investment The federal government also offered direct federal loans and partial guarantees of private loans to address tightness in debt markets a total of USD 86 billion in direct loans (USD 7 billion in 2011) and USD 57 billion in partial guarantees (USD 42 billion in 2011) to date
These and other measures leveraged enough private investment to double US non-hydroelectric renewable energy generating capacity in four years And as the financial crisis has eased the tax equity market has recovered hitting the $6 billion level in 2011
The two stimulus programs ended in 2011 and the production tax credit for wind expires at the end of 2012 The cost of extending the production tax credit now stands as a significant barrier to continued renewable energy growth However there are ways to make these important federal policies more cost-effective Policies that expand the pool of investors could reduce costs for developers and for taxpayers CPI work suggests that replacing the current tax incentives with smaller cash incentives could provide the same benefits to projects at just over half the cost to government
Prepared by Uday Varadarajan (CPI San Francisco udayvaradarajancpisforg)
Based on Varadarajan et al ldquoSupporting Renewables while Saving Taxpayers Moneyrdquo CPI Report (2012)
26
The Landscape of Climate Finance 2012
27
The Landscape of Climate Finance 2012December 2012 December 2012
Corporate actorsIn the Landscape 2012 we have been better able to high-light the contribution of corporate actors in the global landscape of climate finance We find that corporate actors contributed 21 of global climate finance Corporate actors unlike project developers do not sell green electricity or related products and services We identified two main categories of corporate actors
First some non-energy corporate actors are eager to deploy emissions reduction assets to reduce their energy bills or meet voluntary commitments These include technology companies (eg Google) and com-panies with large warehouses installations or factories (eg IKEA) The estimate of contributions from non-energy corporate actors includes a very large share of small-scale renewable energy (solar PV and solar water heating amp cooling) of more than USD 51 billion Sometimes the investor is an industrial conglomerate for which it is hard to be able to identify a specific set of activities Apart from investing in emissions reduction
projects some of these corporate actors might be required to comply with GHG emissions cap-and-trade scheme allowing for the use of offsets
Second some manufacturers of (renewable) energy systems financed the deployment of their own systems (pilot amp demonstration plants vendor financing etc) Examples include wind turbine manufacturers (such as Chinarsquos Goldwin and Spainrsquos Gamesa) solar PV and thermal systems manufacturers (Japanrsquos Sharp Spainrsquos Gestamp USArsquos MEMC Indiarsquos Moser Baer and Chinarsquos CHINT Group) and electricity generation technology providers (USArsquos GE financial services Indiarsquos Crompton Greaves and South Korearsquos Samsung CampT Corp)
We find that 80-93 of corporate actorsrsquo contributions are sourced domestically 6-14 in other developed countries than the emissions reduction project host country and the remaining 2-6 in other developing countries than the emissions reduction project host country (technology developers notably) We find that
SOURCES ESTIMATED VALUE DESTINATIONS
IntE
rnal bull Reinvested earnings from recurrent and exceptional
income NEUSD 693 ndash
805 BILLION
Inst
rum
Ents bull Carbon offset finance USD 12 billion
bull Project-level market rate debt USD 15 ndash 26 billionbull Project-level equity USD 15 ndash 26 billionbull Balance sheet financing USD 650 ndash 741 billion
ExtE
rnal bull Changes in net debt and equity from third-partya
NE
OthE
r act
Ors
bull Ownership of other actors of the landscape NE
DESCRIPTIONCorporate actors whose activity cannot be categorized as ldquoproject developersrdquo comprised of
bull Non-energy corporate actorsbull Manufacturers of renewable energy systems
PRIMARY DATA
SOURCES
bull Bloomberg New Energy Finance and UNCTAD FDI databull Frankfurt School - UNEP Collaborating Centre for Climate amp Sustainable Energy Finance Global Trends in Renewable Energy
Investment 2012bull REN21 Renewables 2012 ndash Global Status Reportbull Weiss amp Mauthner Solar Heat Worldwide report (edition 2012)bull Ecosystem Marketplace State of the Voluntary Carbon Markets Report
ISSUES AND FUTURE
ANALYSIS
bull Motivation for investment The main driver for investment (energy savings opportunism synergies with other corporate activities promoting own technologies etc) is not always clear
bull Access to capital Sometimes corporate money helps overcome difficulties in accessing more traditional sources of capital such as banks
bull Definitional issues Boundaries with households can be difficult to delineate in the case of small family-based corporate actors Likewise geographical origin of corporate actors can be hard to identify in the case of multinational groups
a This corresponds to the net value of debt raised minus debt repaid for a given year This relates to commercial financial institutions mostly Please note that other actors of the landscape such as institutional investors can be interested in corporate debt issues (bonds medium-term notes etc) as an investment vehicle The same logic is applied to changes in net equity
26
The Landscape of Climate Finance 2012
27
The Landscape of Climate Finance 2012December 2012 December 2012
13-22 of the corporate actorsrsquo money went to devel-oping countries and 78-87 went to developed coun-tries (notably small scale PV in Italy and Germany)
ExampleIn 2009 Ferrari installed a rooftop PV system at one of its factories in Italy Large warehouses such as those for automotive factories are natural candidates for laying out solar panels on rooftops (General Motors did the same for one of its factory in Spain in 2008 with a total capacity of 12 MW) The main motivation is energy savings (expected savings of 200000 kWh per year) and potential return from installing a rooftop PV system Investment money was sourced from Ferrarirsquos own balance sheet and revenues and would be used to pay for the system and its installation
ExampleSiemens Financial Services and Siemens Bank the lending arms of the German technology manufacturer Siemens would be categorized as corporate actors Money would be sourced from the company balance sheet of parent companies and from their own revenues Money is then lent against projects using Siemens wind turbines For instance Siemens Financial Services provided a share of project-level market rate debt to the 272 MW Seigneurie de Beaupre onshore wind farms in Canada and phase I of the 288 MW Meerwind Sud und Ost offshore wind farm in Germany last year
28
The Landscape of Climate Finance 2012
29
The Landscape of Climate Finance 2012December 2012 December 2012
Institutional investors We find that the direct contribution of institutional investors to emissions reduction projects is in excess of USD 620 million for the year 2011 This number seems low compared to expectation but given the lack of trans-parency on institutional investorsrsquo involvement the fact that our representative sample excludes many countries where institutional investors have been active these last years (notably some North European countries) and our focus on primary equity stakes and not stakes taken in projects already running (secondary market transac-tions representing only money changing hands) this appears as a reasonable lower bound
In 2011 institutional investors have been active on both the debt and equity side For example on the debt side25 US insurance company Metlife provided debt to US onshore wind (EnXco Lakefield) and US solar (Webberville PV Plant) projects In Canada the Great-West Life Assurance Company and Ontario Pension Board provided debt to Sprott amp Firelight Amherst wind farm On the equity side Allianz and Munich Re invested in European solar and wind assets while Brazilrsquos workersrsquo severance fund provided equity to more than 200 MW of domestic onshore wind projects
25 Whenever project bonds have been issued (US solar projects) therersquos a possibility that institutional investors purchased such issues and therefore contribute to providing debt to emissions reduction projects
We find that nearly 37 of institutional investorsrsquo contributions are sourced domestically and the remain-der in developed countries other than the project host country We find that approximately 11 of institutional investorsrsquo money went to developing countries and 89 to developed countries (Europe and the US)
SOURCES ESTIMATED VALUE DESTINATIONS
IntE
rnal bull Reinvested earnings from recurrent and exceptional
income NEgt USD 06 BILLION
Inst
rum
Ents bull Project-level market rate debt gt USD 02 billion
bull Project-level equity gt USD 02 billionbull Balance sheet financing gt USD 02 billion
ExtE
rnal
bull Changes in net debt and equity from third-party NE
OthE
r act
Ors
bull Ownership of other actors of the landscape NE
DESCRIPTION
Theyrsquore comprised ofbull Insurance companiesbull Pension fundsbull Foundations amp endowments
PRIMARY DATA
SOURCESbull Bloomberg New Energy Finance and UNCTAD FDI data
ISSUES AND FUTURE
ANALYSIS
bull Improving coverage a more systematic and in-depth tracking of contributions to the landscape will be useful as more deals (both on the debt and the equity side) involve institutional investors
bull Indirect investment channels institutional investors also invest in emissions reduction projects via infrastructure amp private equity funds
bull Improving definitions distinguishing by sub-categories of institutional investors as they have different objectives and constraints
28
The Landscape of Climate Finance 2012
29
The Landscape of Climate Finance 2012December 2012 December 2012
Project developersWe highlight project developer contributions in the Landscape 2012 and find that they contributed 34 of global climate finance
We define project developers as dedicated entities with the ability to design commission and operate and maintain emissions reduction projects These include power and gas utilities and independent power produc-ers (Spainrsquos EDP Francersquos EDF US Duke Energy China Datang and Guodian for instance) energy companies (Francersquos Total UKrsquos BP or Brazilrsquos Petrobras) and engineering procurement construction contractors and independent developers of projects (NRG Energy in the US smaller Spanish and Italian project developers)
We find that 83-94 of project developersrsquo contri-butions are sourced domestically 6-16 from other developed countries other than the emissions reduc-tion project host country and the remaining 0-1 from other developing countries other than the emissions reduction project host country We find that 50-56 of the project developersrsquo money went to developing coun-tries and 44-50 went to developed countries
SOURCES ESTIMATED VALUE DESTINATIONS
IntE
rnal bull Reinvested earnings from recurrent and exceptional
income NEUSD 1150 ndash
1293 BILLION
Inst
rum
Ents bull Carbon offset finance USD 12 billion
bull Project-level equity USD 164 ndash 184 billionbull Balance sheet financing USD 974 ndash 1097 billion
ExtE
rnal
bull Changes in net debt and equity from third-party NE
OthE
r act
Ors
bull Ownership of other project developers NE
DESCRIPTION
Emissions reduction project developers includingbull Dedicated project developers amp EPC contractorsbull Utilities and independent power producersbull Energy companies
PRIMARY DATA
SOURCES
bull Bloomberg New Energy Finance and UNCTAD FDI databull Frankfurt School - UNEP Collaborating Centre for Climate amp Sustainable Energy Finance Global Trends in Renewable Energy
Investment 2012bull REN21 Renewables 2012 ndash Global Status Reportbull Weiss amp Mauthner Solar Heat Worldwide report (edition 2012)bull Ecosystem Marketplace State of the Voluntary Carbon Markets Report
ISSUES AND FUTURE
ANALYSIS
bull Definitional issues The boundaries of specific sub-categories and potential overlap with corporate actors (conglomerates for instance) needs to be easier to identify to better understand underlying drivers for investment
bull Non-energy projects the contributions of non-energy project developers is hard to assess
ExampleNRG Energy is a US project developer that has deployed roughly 15 GW of solar PV capacity in the US in 2011 directly and via its subsidiaries NRG Energy is able to invest thanks to its expertise own resources and ability to secure project finance and attract external equity investors (such as MidAmerican Energy Holdings Co) for its larger projects
Likewise EDF a French energy grouppower and gas utility invested in solar and wind projects throughout the world in 2011 (US Germany etc) directly and via its subsidiaries (EDF Energies Nouvelles EnXCo Inc etc) Money comes from its own resources and project-level financing (tax equity arrangement in the US for instance)
30
The Landscape of Climate Finance 2012
31
The Landscape of Climate Finance 2012December 2012 December 2012
Households Households represent a source of money that we did not explore in the Landscape 2012 We define house-holds as (1) family-level economic entities (2) high net worth individuals and (3) their intermediaries whether they are family offices investing on their behalf or dedi-cated foundations operating philanthropic programs Their money stems from income and savings including inherited or entrepreneurial wealth They are also able to borrow to invest into emissions reduction assets or support such investment via grants We find that households contributed 8-10 of global climate finance
SOURCES ESTIMATED VALUE DESTINATIONS
IntE
rnal
bull Income and savings NE
USD 323 BILLION
Inst
rum
Ents bull Grants USD 02 billiona
bull Carbon offset finance lt USD 01 billionbull Balance sheet financing USD 321 billion
ExtE
rnal
bull Changes in net debt NE
OthE
r act
Ors
bull Ownership of other actors of the landscape NE
DESCRIPTIONHouseholds and wealthy individuals involved in philanthropy and their intermediaries (family offices and dedicated foundations)
PRIMARY DATA
SOURCES
bull Bloomberg New Energy Finance and UNCTAD FDI databull Frankfurt School - UNEP Collaborating Centre for Climate amp Sustainable Energy Finance Global Trends in Renewable Energy
Investment 2012bull REN21 Renewables 2012 ndash Global Status Reportbull Weiss amp Mauthner Solar Heat Worldwide report (edition 2012)bull Ecosystem Marketplace State of the Voluntary Carbon Markets Report
ISSUES AND FUTURE
ANALYSIS
bull Householdsrsquo contribution is hard to measure Figures are estimates onlybull Sources of finance for households need to be better understoodbull The contribution of households in the field of energy efficiency and electric vehicles investments is not measured here
a This relates to philanthropy and is discussed in the dedicated instrument section
Householdsrsquo asset finance ndash USD 323 billion ndash cor-responds 993 to small scale installations USD 226 billion of solar PV in developed countries and USD 79 billion of solar thermal heating and cooling in devel-oping countries (mainly China) are the largest con-tributors A small share of householdsrsquo contribution to climate finance flows in 2011 relates to grants from US and European philanthropic programmes and an even smaller portion of it relates to voluntary carbon offsetting
As expected all of householdsrsquo contributions were sourced domestically We find that 75 of the house-holdsrsquo contributions were in developed countries and 25 were in developing countries
30
The Landscape of Climate Finance 2012
31
The Landscape of Climate Finance 2012December 2012 December 2012
Box 5 - Who actually sits behind the moneyIn the Landscape 2012 we explored who actually ldquosits behindrdquo climate finance actors That is a project developer can actually be the subsidiary of an entity located in another country or categorized as an actor The ldquoproject developersrdquo category is the one for which this information is most interesting and revealing The impact of such re-categorization is explored in more detail in the uses section of this report In particular we find that
bull Close to USD 410 billion of 2011 project developers investment flows (31-35) could be categorized as domestic public budget instead The largest contributor to this phenomenon is Peoplersquos Republic of Chinarsquos direct and indirect ownership of solar wind waste and biomass project developers
bull Close to USD 60 billion of 2011 project developers investment flows (around 5) is actually funded by (in almost equal parts) (1) venture capital private equity and infrastructure funds on the one hand and (2) corporate actors on the other hand
ExamplesChange in the geographical origin of money - In 2011 EDP Renewables North America LLC financed three onshore wind farms in the US for a cumulative capacity of close to 600 MW Categorizing the project based on first degree ownership implies that project has been financed by a domestic project developer As we dig into the cascading ownership structures of the equity holders and categorize the project based on the ultimate ownership we determine that project has been actually financed by a foreign project developer1
Change in the type of actor ndash In 2011 China Datang Corp Renewable Power Co Ltd financed more than 15 GW of onshore wind farms in mainland China At first sight we would categorize the equity holder of the project as a domestic project developer It turns out that the developer is owned by one of the large state-owned power generation entities and therefore should be categorized as being financed by the Chinese domestic public budget2
1 EDP Renewables North America LLC is owned by EDP Renovaveis SA (Spain) in turn owned by EDP - Energias de Portugal SA (Portugal)2 China Datang Corp Renewable Power Co Ltd is owned by China Datang Corp which is held by the State-owned Assets Supervision amp
Administration Commission of the State Council (SASAC) the Peoplersquos Republic of China holding for State-Owned Entities (SOEs)
32
The Landscape of Climate Finance 2012
33
The Landscape of Climate Finance 2012December 2012 December 2012
32 Intermediaries
finance flows of the last two in particular were partially captured and the category not specifically featured in the Landscape 201127
While until recently the role played by NFIs and Sub-Regional Development Banks in the climate finance architecture has received limited attention international donors are increasingly aware of their privileged position in knowledge of and relationship with local markets This increased international focus the International Development Finance Clubrsquos (IDFC) mapping initiative (Ecofys-IDFC 2012) and their direct disclosure of data made it possible to gather more detailed information about NFIsrsquo and Sub-Regional Banksrsquo climate finance flows and have lent visibility to their contribution to a wide range of climate-compatible activities
Although we have more information on intermediariesrsquo climate finance than we did in the Landscape 2011 our estimate still represents an incomplete figure due to the partial reporting28 of some entities and our inability to capture other playersrsquo flows due to data constraints
27 The Landscape 2011 included the Brazilian BNDES IREDA and the China Development Bankrsquos climate financing featuring these entities among Bilateral Finance Institutions This year we have broaden the coverage capturing a wider range of National players as well as Sub-Regional ones such as the Development Bank of Southern African (DBSA) the Develop-ment Bank of Latin America (CAF) and the BCIECABEI Central American Bank for Economic Integration See Appendix D for details
28 A number of MDB s currently engaged in a joint initiative aimed at harmonizing mitigation and adaptation finance reporting did not disclose their adaptation finance data as yet The Joint MDB Report on Mitigation
INTERMEDIARIES ANNUAL FLOWS OF DIRECT CLIMATE FINANCE(2010 2011 USD BILLION)
PUBLIC
Development Finance Institutions (67) 768bull National and Sub-Regional Finance Institutions (37) 427a
bull Bilateral Finance Institutions (10) 113bull Multilateral Finance Institutions (18) 212bull Climate Funds (1) 15
Sub-total public (67) 768
PRIVATE
Commercial financial institutions (31) 307 - 404Venture capital private equity amp infrastructure funds (2) 24Sub-total private (33) 331 - 428
TOTAL Total 1099 - 1196
Note To avoid double counting only USD 15 billion of the USD 25 billion Climate Fund money is included in the total Climate Finance (we excluded developed to developing countries bilateral funds which we assume are accounted for in bilateral reporting in the OECD-CRS database) We acknowledge that Climate Funds are not generally associated to Development Finance Institutions here are included in this category as typically managed by DFIs or operating in closed relationship with thema Total National and Sub-regional institutionsrsquo climate financing differs from that presented in the Ecofys-IDFC report (2012) See Appendix D for details
Public and private financial institutions play an important role in climate finance flows raising and channelling USD 110-120 billion of global climate finance Public intermediaries such as Multilateral Bilateral National and Sub-Regional Development Banks distribute USD 768 billion or about two-thirds of these resources
The Landscape 2012 seeks to present a comprehen-sive picture of public and private intermediaries While several initiatives track climate finance that flows through public intermediaries there is less informa-tion about climate finance distributed through private intermediaries Their engagement is critical to identify and finance climate projects particularly small-scale ones thereby to unlock private resources and scale-up finance26
Public sector intermediariesDevelopment Finance InstitutionsIn the Landscape 2012 the public intermediaries cat-egory covers a broad range of Development Finance Institutions (DFIs) including Multilateral Bilateral Sub-Regional and National Finance Institutions The climate
26 The San Giorgio Group ldquoProsol Tunisiardquo case study presents insights on this aspect See Trabacchi et al (2012) See also for instance the Turkish Sustainable Energy Finance initiative established by EBRD to help drive the transformation in the private banking sector in supports of small and medium sized energy efficiency and renewable energy investments For more information see (Ebrdcom and Tursefforg)
32
The Landscape of Climate Finance 2012
33
The Landscape of Climate Finance 2012December 2012 December 2012
UN agencies as well as countriesrsquo cooperation agen-cies are also active intermediaries in the climate finance architecture29 the flows managed and distributed by these entities have not been included in this section to avoid double counting Their resources ndash the portion complying with ODA criteria and hence reported in the OECD-CRS database ndash are in fact captured in the Governmentsrsquo budgets data An ad-hoc study should be pursued to highlight their actual contribute which typically goes beyond pure intermediation By working closely with recipient governments on national strate-gies and policy frameworks conducive to investment in fact these entities help develop demand for climate finance (AGF 2010) With the objective to enhance the effectiveness of their actions DFIs often partner with these agencies to coordinate interventions
The resources raised and channelled by DFIs can be both of public and private nature DFIs in fact do not only operate through public budget resources (ie direct contributions from donor countries) but can also raise funds on the capital markets reinvest earnings and mobilize additional funds through co-financing (either from commercial banks financial institutions develop-ment partners or other international finance institu-tions) This allows them to support investments that are much greater than public funds can provide alone
Sources of finance vary from bank to bank depend-ing on their structure and mandates30 It is difficult to determine the portion of public budgets flowing to DFIs each year in the pursuit of development coopera-tion activities or specific mandates It is also difficult to quantify how much global capital markets contribute
Finance 2011 (IDB et al 2012) released for Rio+20 provides preliminary insights on the methodology developed and the resulting mitigation figures A new version of the report with revised and more disaggregated data is planned to be released at COP 18 in Doha The release of a report describing the jointly agreed methodology for adaptation is also planned at the same time
29 Agencies like DIFID NORAD and USAID in 2010 channelled possibly up to USD 96 billion of the bilateral climate-marked aid featured in the OECD CRS database (OECD 2010) They also played a role in the delivery of Fast-Start Finance USAID for instance serviced 27 of the US Fast-Start Finance over the FY20102011 (Fransen 2012)
30 For instance the International Development Association (IDA) ndash the larg-est multilateral channel of concessional financing to the poorest countries ndash is largely funded through donor contributions The International Bank for Reconstruction and Development (IBRD) on the other hand obtains most of its funds by issuing bonds in international capital markets In addition to general bond issuance some institutions have also initiated the issuance of climate themed bonds so called ldquogreen bondsrdquo The World Bank Group for example has issued over USD 33 billion in green bonds since the inaugural issue in 2008 (Treasuryworldbankorg)
to DFIsrsquo climate financing in a given year Clarifying this could shed light on the extent of the so-called ldquoleverage effectrdquo exerted by these entities to public money
Box 3 on government contributions to DFIs presents additional insights on this aspect
National Finance InstitutionsThe NFIs category in the Climate Finance Flows Diagram 2012 reflects a variety of players including
bull Some of the largest National Development Banks such as the Brazilian BNDES31 and the Chinese Development Bank (CDB) which contribute more than 80 of NFIsrsquo finance
bull Sub-Regional Development Banks like the Development Bank of Latin America (CAF) and
bull Relatively smaller players such as the Mexican Nacional Financiera (NAFIN) whose involve-ment and expertise in the climate finance arena are growing rapidly
With 427 billion32 NFIs represented around 567 of the total climate finance distributed by public actors (DFIs) in 2011
Although diverse and at various stages of institutional readiness for climate finance NFIs have key charac-teristics in common They bridge critical funding gaps perform in areas underserved by the private sector and implement national strategies set by their governments By partnering with MFIs andor BFIs National enti-ties can acquire relevant experience in the preparation risk assessment evaluation and monitoring of climate projects33
NFIs can have general mandates to foster broad eco-nomic and social development objectives or they can have mandates focused on specific niches ndash such as financing small- and medium-sized enterprises encour-aging infrastructure development or supporting a countryrsquos agribusiness sector (IDFC 2012)
31 In 2011 BNDES had a capital base of nearly USD 33 billion (BNDES 2012b)32 Data refers to funds committed in 2011 except for one institution that
reported its annual disbursement instead of commitments To minimize potential double counting the climate finance flows of the Indian Renew-able Energy Development Agency (IREDA) were reduced by 40 since as reported in IREDA (2012) the institutionrsquos resource base for 20102012 draws approximately 40 on international assistance
33 For instance the Sustainable Project Directorate of NAFIN ndash the bankrsquos unit dedicated to support climate-related projects received technical assistance from the World Bank and uses its methodology and manuals to manage the risks associated with renewable energy projects (IDB 2011)
34
The Landscape of Climate Finance 2012
35
The Landscape of Climate Finance 2012December 2012 December 2012
SOURCES ESTIMATED VALUE DESTINATIONS
IntE
rnal
bull Proceeds from operations NEUSD 753 BILLION In
stru
mEn
ts an
d usE
s
bull Risk management NEa
bull Carbon offset finance USD 007 billionbull Grants USD 401 billionbull Low-cost debt USD 466 billion bull Project-level market-rate debt 234 billionbull Project-level equity USD 037 billionbull Balance sheet financing USD 078 billionb
Usesbull USD 644 billion mitigation (86)bull USD 109 billion adaptation (14)
Oth
Er a
ctOr
s bull Public finance institutions bull Commercial financial institutionsbull Funds (eg climate funds carbon funds venture
capital and private equity funds)c
bull Ultimate beneficiaries
ExtE
rnal bull Public Budgets NE
bull Capital markets NEbull Other Development Finance Institutionsd
DESCRIPTION
The Development Finance Institutions featured in this study include bull National Finance Institutions (NFIs) ie entities typically owned funded and governed by a single national government with
local development mandates The climate finance flows of this players also include Sub-Regional Development Banks ie those generally supported by a group of countries in the pursuit of sub-regional mandatese
bull Bilateral Finance Institutions (BFIs) ie an individual country with the aim of providing aid contributing technical support or investing in selected development activities in developing or emerging countries
bull multiple countries encompassing both developing borrower countries and developed donor countries with the aim to provide financial and technical support to developing and emerging countries andor coordinate support among their member countries Multilateral Finance Institutions (MFIs)f
PRIMARY DATA
SOURCES
bull Self-reporting via CPI surveybull IDFC Green Finance Work Program (Ecofys-IDFC 2012)bull UNEP Bilateral Financial Institutions Climate Change Working Group (UNEP 2011)bull Joint MDB Climate Finance Tracking Initiative (IDB et al 2012)bull OECD Creditor Reporting System Aid Activities Database (OECD 2010)bull Bloomberg New Energy Finance Desktop Analysis
ISSUES ANDOR FUTURE ANALYSIS
bull Non comparability The reported estimate is derived from institutionsrsquo self reporting and secondary data sources Given the various approaches currently in place for accounting and tracking climate finance finance flows cannot be fully compared amongst this diverse group of institutionsg
bull Incompleteness To capture the true magnitude of DFIs involvement in the global climate finance landscape additional entities should be included in the analysis as well as the entire spectrum of their mitigation and adaptation financing Our estimate in fact reflects partial reporting from some MFIs which disclose mitigation finance data onlyh
bull Confidentiality concerns or lack of transparency impede actual understanding on some institutionsrsquo flowsbull Double-counting Cross financing between institutions may occur possibly resulting in double counting more research is
needed to ensure that presented flows are not inflated by such cross flowsi
a The portion of climate finance distributed in the form of risk management instruments is not included in the total actually reaching mitigation andor adapta-tion projects (see the Landscape 2012 methodology in Section 2)
b The total climate finance retrieved from the Ecofys-IDFC (2012) report for a group of NFIs was broken down against our categories of instruments according to (1st) the share stated in the report itself (ie 95 to loans and 5 to ldquoother instrumentsrdquo) (2nd) the weights observed in the financing modalities applied by the NFIs and BFIs for which we had data Due to data availability issues we allocated half of the estimated equity portion to ldquoproject-level equityrdquo and the other half to ldquobalance sheet financingrdquo
c The BFIsrsquo volume of climate finance includes investments in carbon funds and investment funds for renewable energy and clean technology projects OPIC in particular provides support to private equity funds aimed at developing nations Bancoacuteldex for instance made an investment in a relatively small venture capital fund called lsquoProgresa Capitalrsquo which focuses in the area of inter alia alternative energy (Smallridge et al 2012)
d The Mexican Nafin for instance has access to lines of credit from the World Bank and the Inter-American Development Bank (TNC 2012)
34
The Landscape of Climate Finance 2012
35
The Landscape of Climate Finance 2012December 2012 December 2012
In 2011 NFIs and Sub-Regional Development banks supported key low-carbon development sectors renewable energy projects and energy conservation accounted in fact for 509 and 262 of their mitiga-tion financing respectively Projects spanned from wind farms large-scale hydro and sustainable transport modalities or infrastructures (10) to those aimed at reducing land-use emissions via re-forestation and afforestation (23) BNDES funding to wind projects in 2011 was remarkable with USD 2 billion approved (investments of USD 32 billion) for 43 wind parks its support to the sector increased by almost three times compared to 2010 levels (BNDES 2012 see Box 7)
NFIs and Sub-Regional Development Banks also played a role in building countriesrsquo resilience to climate change devoting 12 (or USD 52 billion) of their support to measures contributing to adaptation objectives 313 of this in infrastructure improvements and 309 in the agriculture and forestry sector
NFIs and Sub-Regional Development Banks financed these activities mainly through loans at interest rates below those charged by commercial banks Low interest rate loans represented 866 of NFIrsquos climate financing BNDES stands out as a major provider of concession-ary credit that accounted for 997 of its lending This practice has helped to lower the cost of debt in Brazil the cost of debt is relatively higher in other emerging countries where NFIs such as the South African DBSA and the Indian Renewable Energy Development Agency (IREDA) financed mostly at market rates34
Unsurprisingly NFIs tend to invest domestically In fact 89 of their total climate finance was invested in the country where they are located Climate finance origi-nating from NFIs and Sub-Regional Development banks based in non-OECD countries (96 of the total) was mostly (90) directed toward domestic actions in the home country of the institution The remaining went to other non-OECD countries
Bilateral Finance Institutions (BFIs)The BFIs considered in the study include Agence Franccedilaise de Developpement and Proparco (AFD) KfW Entwicklungsbank and DEG (KfW) Japan International Cooperation Agency (JICA) and Overseas Private Investment Corporation (OPIC) Each of these BFIs have different structural characteristics and mandates AFD KfW and JICA are chiefly responsible for allocat-ing their countriesrsquo bilateral ODA contributions to other countries whereas OPIC provides financing and insur-ance to private sector investors that may help recipient countriesrsquo businesses while favouring US business interests35
In 2011 BFIs channelled about USD 113 billion in support of mitigation and adaptation interventions
Comparisons between BFIsrsquo outflows reported in the Landscape 2012 and the Landscape 2011 should be made with caution because data were obtained from different
34 The South African Government is committed to expand concessionary finance to boost investment and influence the direction of the economy (Pinheiro 2012) BNEF (2011) states that the interest rates applied by IREDA are more or less in line with those of commercial lenders and that it cannot be viewed as a source of ldquosubsidisedrdquo lending To estimate its portion of low-cost debt versus market-rate debt we associated to the former the total amount of finance committed to those sectors that in 2011 received the interest rate subsidies provided by the Indian Ministry of New and Renewable Energy to the Agency (IREDA 2012) To market-rate debt we allocated the remaining portion With regard to the high cost of debt issue see Box 9 on ldquoThe Indiarsquos experience in Financing Renewablesrdquo
35 OPIC typically supports companiesprojects that are at least 25 US-owned (OPICgov)
e NFIs and Sub-Regional Development Banksrsquo climate finance data are presented jointly as the data retrieved for some of these entities was in an aggregated form and sourced from the Ecofys-IDFC (2012) report This prevented us from associating financing to a single entity or re-allocating the related financing to a different category Sub-Regional Banks eg the Development Bank of America Latina CAF in fact can be seen as multilat-eral institutions For details on the institutions included in our estimates see Appendix D We acknowledge the presence of private players amongst banksrsquo shareholders CAF for instance has 18 shareholder countries and 14 private banks
f This definition follows that of amongst others Atteridge et al (2009) the World Bank (see WB website) and the UNFCCC (see UNFCCC website)
g MDBs are currently developing a joint approach for climate finance track-ing which has been implemented and applied to the data we received from some of the institutions covered in the study According to IDB et al (2012) ndash the first outcome of the MFIsrsquo work with a focus on mitiga-tion finance ndash the newly developed approach strives to capture only the components of a project with climate co-benefits This might not be the case as yet for other intermediaries which may account for the whole value of the project Additional work is needed to harmonize accounting methodologies enabling comparability between flows across the entire spectrum of DFIs
h Both comprehensiveness and comparability issues will partially be addressed in the future as MFIs have harmonized their adaptation and mitigation finance tracking and will jointly report their climate finance numbers Some BFIs are engaged in the discussions and hopefully these approaches will be transferred to NFIs too
i In the Landscape 2012 we tried to minimize double counting to the maximum extent possible depending on the granularity of data available Nafin for instance in 2011 financed renewable energy generation projects with USD 71 million of KfW resources This resources were not included in the total to avoid double counting In addition we were ensured that cross financing did not occur between the institutions covered in the Ecofys-IDFC report (2012) used as a source for some NFIsrsquo data
36
The Landscape of Climate Finance 2012
37
The Landscape of Climate Finance 2012December 2012 December 2012
and disaster risk reduction which in total received approximately USD 337 million more than in 2010
BFIs proved significant in channelling Fast-Start Finance contributions to developing countries AFD for instance implemented 69 of Francersquos Fast-Start Finance commitments in 2011 (USD 585 million) and also a portion of the European Commission ones (EC 2012 Minefi 2011) KfW was entrusted with 19 of Germanyrsquos Fast-Start Finance (Vieweg et al 2012)39 while OPIC in FY 2011 delivered 36 of the US total (USD 31 billion) notably increasing its share as com-pared to the previous year (8 in 2010) In a period of budget pressures OPIC ndash which operates at no net cost to the American taxpayer ndash helped the US meet its commitments at no expense to the public budget (Fransen et al 2012)
infrastructure such as mangroves39 KfW Fast-Start Finance refers to 2010-2011 Germany committed USD 473
million in 2010 and USD 603 million in 2011 Actual allocation was higher by USD 7 million in 2010 and USD 89 million in 2011
sources and categorized in a different manner36 When looking at equivalent data self-reported by the institu-tions the year-to-year variation highlights a 23 drop37 This could be because of contingency factors andor fewer projects in the pipeline The sector that expe-rienced the most significant reduction in funding was the sustainable transport sector which received almost USD 3 billion less than in 2010 (a 78 decrease mostly due to the fact that some investments have been post-poned to the beginning of next year) The agriculture forestry and land use sector and the energy efficiency sector also experienced reduced support with a 34 and 20 decrease respectively On the other hand certain adaptation measures saw increased funding such as those related to infrastructure development38
36 In last yearrsquos study data were compiled from various second-party sources and BNDES CDB and IREDA were included in this category
37 DEG has not been included in the year-on-year comparisons due to data availability issues
38 Projects in these categories include for example water infrastructure measures to improve dikes but also projects to plant or restore ldquogreenrdquo
Box 6 ndash How do NFIs finance their operations The case of BNDESNFIs have a diversified funding sources that include long-term sources of reimbursable and non-reimbursable public resources public deposits other Development Finance Institutionsrsquo resources and capital market bonds Funding diversification and the possibility of blending market and concessional resources from different actors enables NFIs to establish more attractive financing conditions for projects that are in the publicrsquos best interest
The weight of the various sources of capital can vary between the Banksrsquo capital structure and the annual inflow of resources used to finance operations
In the case of BNDES for instance the Government of Brazil funded the predominant share of the Bankrsquos total capital 817 as of the end of 2011 This share is comprised of resources from the National Treasury which contributes 497 and has been the Bankrsquos main creditor since 2010 another 285 of the total is financed by the Workersrsquo Assistance Fund (FAT) a special payroll tax (the PIS-PASEP) the Audiovisual Sectorial Fund and the National Climate Change Fund Further 34 comes from other governmental sources These funds are complemented by resources raised in the foreign market through financial market activities as well as operations with international institutions such as the Japan Bank for International Cooperation (JBIC) and the European Investment Bank (EIB) In 2011 foreign fundraising represented 36 of the Bankrsquos financing structure The remaining 147 is related to assets monetization and other obligations (BNDES 2012)
In recent years there has been a noticeable increase in the funds that BNDES receives from the Treasury while the amount of funding from international institutions has decreased steadily
In terms of capital flows over the course of 2011 756 of BNDESrsquo total net resources (USD 85 billion) came from return on credit operations while 192 came from the National Treasury The remaining was sourced from the Workersrsquo Assistance Fund and other sources
Pinheiro (2012) reports that the Bank received an annual contribution of about USD 10 billion from the Brazilian Government which is then channelled to recipients to achieve the Bankrsquos mandate
36
The Landscape of Climate Finance 2012
37
The Landscape of Climate Finance 2012December 2012 December 2012
BFIs also operate through a range of dedicated Climate Funds40 and are also active in carbon markets playing a ldquocarbon brokering rolerdquo through carbon investment funds41 The KfW Carbon Fund for instance promotes the use of carbon credits for compliance with the obli-gation under the UNFCCC while enabling and simplify-ing access to the market for buyers and sellers It also assumes or mitigates market risks (eg EU ETS III) As of December 2011 the KfW Carbon Fund contracted credit of over USD 557 million (Suennen 2012 UNEP-SEI 2011)
Multilateral Finance Institutions (MFIs)MFIs include
bull Global players like the World Bank Group
bull Regionally-oriented agencies such as the African Development Bank (AfDB) and the Asian Development Bank (ADB) and
bull Entities without a banking basis such as the EU Institutions generally identified as multilateral bodies42
MFIsrsquo financial support to climate change activities amounted to about USD 212 billion in 2011
The list of MFIs covered in the Landscape 2012 is the same as in the Landscape 2011 but our current esti-mate reflects better data quality made possible by the improved data gathering approach we adopted (ie direct reporting from the majority of the institutions 6 out of 9) and the improvements in MFIsrsquo reporting Comparisons with last year study however are not possible as we relied on different data sources with difference in scope Self-reporting data for 2010 and 2011 have not been made consistently available in some cases due to changes implemented in the accounting methodologies
In 2011 MFIs proved critical in supporting renewable energy generation projects which received 518 of
40 In 2011 for instance KfW and the German Federal Ministry for the Environ-ment launched the Global Climate Change Partnership Fund (GCCPF) a public-private initiative focused on energy efficiency and renewable energy investment for SME and private households The Danish Govern-ment IFC and Deutsche Bank also committed financing to the partnership over the course of the year (GCCPF website)
41 Last April AFD ndash along with other partners ndash announced the upcoming launch of a Carbon Fund for Africa (CDC Climat 2012)
42 The EU Institutions namely the EU Commission and the EU Development Fund are treated as multilateral bodies in the OECD DAC statistics Their climate finance data included in the Landscape 2012 refer only to their direct (ldquobilateralrdquo) contributions to developing countries (OECD 2011d)
their total mitigation finance (approximately USD 95 billion) The other two sectors that benefitted the most were energy efficiency and sustainable transport which received 194 and 184 respectively In terms of adaptation financing MFIsrsquo support was mainly directed to interventions in the agriculture and forestry sector and to capacity buildingtechnical assistance measures which received 278 and 127 of their total support to adaptation (USD 29 billion)43 Among DFIs MFIs are the ones that devoted the highest share to capacity building measures
Market rate debt was the dominant means used by MFIs for distributing climate finance (78)
Asian and European countries were the principal recipients receiving 37 (or USD 78 billion) and 271 (USD 58 billion) of the total MFIsrsquo climate finance respectively
The European Bank for Reconstruction and Development (EBRD) and the European Investment Bank (EIB) provided the greatest support to Europe (734)44 These lenders have been particularly impor-tant at a time when a deteriorated financing environ-ment has threatened the European Unionrsquos low-carbon transition The higher cost of borrowing experienced by commercial banks has in fact hampered lending which is unfortunate in times when investment needs are sig-nificant45 and action cannot be delayed (BNEF 2012b)
43 Activities with adaptation co-benefits in the transportation sector also received significant support Among the measures supported eg develop-ment of climate-resilient design standards upgrade of existing roads and highways to climate resilient design standards etc
44 Germanyrsquos KfW Group has also been a lead lender in the European clean energy sector (see Box 12)
45 For instance BNEF (2012b) states that investments in renewable energy capacity amount to more than USD 600 billion between the 2011-20 period in European Union countries alone
38
The Landscape of Climate Finance 2012
39
The Landscape of Climate Finance 2012December 2012 December 2012
Box 7 - Brazilrsquos experience in financing renewable energy with a focus on wind power
The total amount of BNDESrsquo approved financing for wind power has been dramatically increasing in recent years reaching USD 2 billion (R$ 34 billion) in 2011 which represents a 173 increase compared to 2010 (BNDES 2011)
According to US PREF (2012) BNDES reduces borrowing costs for eligible wind projects by roughly 40 BNDESrsquo favourable financing conditions also apply to other alternative technologies like biomass and small hydro and have been improving particularly since 20061 as part as BNDESrsquo mandate to incentivize ldquogreenrdquo sources of electricity According to BNDESrsquo analysis its financing offerings have contributed to a 25 decrease in renewable electricity tariffs during the 2003-2011 period
In general BNDESrsquo loans to renewable power generation projects have interest rates at 14 below those practiced for coal or oil thermal plants They also have longer repayment terms 16-20 years for renewable energy versus 14 years for conventional plants Moreover BNDESrsquo participation in renewable energy projects can reach at maximum 70-90 while for coal or oil thermoelectric plants it is at 50 (IDFC 2012)
Further by keeping fossil fuel based generation like coal and fuel oil fired thermal plants under stricter loan terms BNDES provides a competitive edge to renewable energies
Given the favourable financing environment for clean projects wind is not the only renewable resource that has experienced growth Overall BNDESrsquo disbursements to all renewable energy technologies supported by Brazilrsquos national policy have showed an upward trend in the 2003-2011 period which reflect the significant increase in BNDESrsquo volume of disbursements in the same period
In 2011 BNDESrsquo disbursements to renewable energy and energy efficiency reached about USD 72 billion (R$ 123 billion) 31 higher than in 2008
Prepared by Joana Chiavari (CPI Rio joanachiavaricpirioorg)
Based on a forthcoming CPI Report on policy approaches for promoting onshore wind power in Brazil
1 By looking at the financing conditions applied by the Bank over the 2003-2011 period we noted that in 2006 for instance the amortization period increased from 12 to 14 years and then in 2007 to 16 years Moreover the Bank lowered its basic return requirement from 25 to 15 in 2006 decreasing this further in 2007 to 1 and 2008 to 09
The Brazilian development bank BNDES is essential to Brazilrsquos renewable energy energy efficiency and deforestation financing
38
The Landscape of Climate Finance 2012
39
The Landscape of Climate Finance 2012December 2012 December 2012
Climate Funds
In recent years a number of climate-specific funds have been set up46 which could also be categorized as
bull bilateral funds financed by single donor countries with one or more recipient country
bull multilateral funds financed by more than one donor country with more than one recipient country
bull national and regional funds established and managed by one or more recipient countries
46 In multiple cases pre-existing environmental and conservation trust funds are channeling climate related resources Some such funds have even been (or are in the process of being) accredited as National Implementing Enti-ties for the Adaptation Fund (eg ldquoProtected Areas Conservation Trustrdquo for Belize and the Micronesia Conservation Trust for the Federated States of Micronesia)
to channel resources from one or more donor country and or domestic resources
While our estimates show that Climate Funds com-mitted USD 25 billion in total to projects in 2011 we include only 15 billion in the Landscape 2012 after deducting bilateral funds (USD 1 billion) which are already accounted for under countriesrsquo bilateral reporting Our estimate is based on the Heinrich Boumlll Stiftung (HBF) and the Overseas Development Institute (ODI)rsquos Climate Funds Update database reporting by the organizations managing individual Funds as well as the UNDP Multi-Partner Trust Fund Office website We find that existing Climate Funds mostly channel donor money in the form of grants47 Our estimates
47 The Adaptation Fund is an exception in that while it channels grants its main source of finance is the monetization of 2 of CDM credits issued The Amazon Fund also has a particular model for raising finance ndash it is a
SOURCES ESTIMATED VALUE DESTINATIONS
IntE
rnal bull Government Budgets NE
USD 15 BILLION In
stru
mEn
ts an
d usE
s bull Grants USD 1446 millionbull Low-cost debt USD 8 millionbull Project-level equity USD 17 million
Usesbull USD 1142 million mitigation (76)bull USD 352 million adaptation (24)
ExtE
rnal
bull Government Budgets NEbull Commercial financial institutions NEbull Institutional investors NEbull Bilateral and Multilateral Financial Institutions NE Ot
hEr a
ctOr
s bull Channels multilateral regional and national implementing entities
bull End recipients governments NGOs and the private sector
DESCRIPTION
bull Climate funds pool resources from donors and domestic sources to support low-carbon climate-resilient development projects Funds usually have a finite lifetime and a specific sectoral focus eg renewable energy adaptation forestry etc In many cases multilateral financial institutions channel funds to recipients and provide financial environmental and social safeguards However there is a trend towards establishing greater national ownership and control of these funds
PRIMARY DATA
SOURCES
bull Self-reporting by Funds bull Overseas Development Institute (ODI) Heinrich Boumlll Stiftung (HBF) Climate Funds Update websitebull UNDP Multi-Partner Trust Fund Office Gatewaybull Fundsrsquo Annual Reports
ISSUES AND FUTURE
ANALYSIS
bull Challenges in tracking climate finance delivered through climate funds remain in particular there is a risk of double counting with reporting from bilateral and multilateral organizations
bull More tracking efforts are needed to unveil the current contribution and role of existing National Fundsa
Note To avoid double counting we carry forward in our calculations only USD 15 billion of Climate Fund money identified (USD 25 billion) excluding developed to developing country bilateral funds which we assume are accounted for in bilateral reporting and accounted for in the government budgets category It is assumed that multilateral institutions managing funds do not include climate fund money in their climate finance reporting and hence that there is no double counting Furthermore co-funding often provided by multilateral organizations is not considered in the above estimates of climate fund moneya For instance Bangladesh has two Climate Funds the Bangladesh Climate Change Trust Fund (BCCTF) established in 2010 by the local government and funded
with resources from the national budget and the Bangladesh Climate Change Resilience Fund (BCCRF) created at the same time to pull funds from donor countries The BCCTF is resourced entirely from the governmentrsquos own budget with USD 100 million in 2009 2010 and 2011 in the form of an endowment Other developing countries such as the Maldives have also established similar national funds (Khan Hannan et al 2011 Gomez-Echeverri 2010)
40
The Landscape of Climate Finance 2012
41
The Landscape of Climate Finance 2012December 2012 December 2012
do not include co-funding which is often provided at the project level A detailed breakdown of data by Fund is provided in Appendix E The Landscape 2012 esti-mate represents a reduction from the Landscape 2011 estimate (upper bound USD 32 billion) which is a reflection of improvements in data sources in particu-lar better annual project approval volume data not a reflection of a reduction in the contribution of the funds
Multilateral organizations such as the World Bank and other UN agencies typically provide trustee and administrative services to manage multilateral and some national funds lsquooff-balance sheetrsquo as well as act as lsquoImplementing Agenciesrsquo to channel funds to local recipients and monitor implementation Bilateral funds are typically administered by donor development agencies Recipient countries are however increasingly seeking lsquodirect accessrsquo to funds both through National Implementing Entities48 which can access project funds directly instead of through an international implement-ing entity and by setting up nationally governed Climate Funds
performance-based fund securing contributions from donors on the basis of demonstrated reductions in the annual deforestation rate The Climate Investment Funds while financed mainly with grant contributions also re-ceived donorsrsquo money in the form of capital and loans and extend grants concessional loans and guarantees via MFIs (Climateinvestmentfundsorg)
48 For instance the Adaptation Fund has now accredited 12 National 10 Multilateral and one Regional Implementing Entities
The Green Climate FundIn future years the Green Climate Fund may become an important additional climate fund but it is not yet operational In 2010 Parties to the UNFCCC established the Green Climate Fund with the aim of providing ldquoscaled-up predictable and adequate fundingrdquo to support projects programs policies and other climate-related activities in developing countries In 2011 the Conference of Parties approved the governing instrument for the Green Climate Fund and with the Fundrsquos first meeting in August 2012 the Board is now taking the first steps towards operationalizing the Fund It is not yet clear however how much and when finance will actually flow through the Green Climate Fund
ExampleThe Climate Investment Funds consist of two multi-donor trust funds the Clean Technology Fund and the Strategic Climate Fund The latter is made up of three programs the Forest Investment Program the Pilot Program for Climate Resilience and the Scaling Up Renewable Energy in Low Income Countries Program The Climate Investment Funds are the single biggest set of Funds dedicated to climate finance holding USD 72 billion in pledged funding from 14 donor countries So far they have programmed over USD 6 billion for 48 developing countries with over 200 projects already financed (Climateinvestmentsfundsorg EBRDcom)
Operational since 20082009 and administered by the World Bank each Fund has a specific purpose The Clean Technology Fund is aimed at projects with large-scale emissions reduction potential and provides loans at terms which are even more favourable than most development banks The Forest Investment Program supports the strengthening of enabling environments and investments addressing the drivers of deforestation in eight countries The Pilot Program for Climate Resilience pilots and demonstrates ways in which climate risk and resilience can be integrated into core development planning and implementation The Scaling Up Renewable Energy in Low Income Countries Program supports the deployment of renewable energy in the least developed countries According to HBF and ODIrsquos Climate Funds Update the Clean Investment Funds have so far disbursed USD 148 million to recipients
40
The Landscape of Climate Finance 2012
41
The Landscape of Climate Finance 2012December 2012 December 2012
Private sector intermediaries
Commercial financial institutionsIn the Landscape 2011 commercial banks were catego-rized without any estimates of amounts involved In the Landscape 2012 wersquove been able to estimate a portion of this category that relates to renewable energy project finance We find that commercial financial institutions contributed 9-10 of total global climate finance
We estimate that 38-50 of commercial financial institutions contributions come from domestic financial institutions while 50-62 of contributions are from institutions in foreign developed countries (European and Japanese investment banks are notable contribu-tors to other countries) Developing countries received 23-42 of this finance while developed countries received 58-77
SOURCES ESTIMATED VALUE DESTINATIONS
IntE
rnal bull Reinvested earnings from recurrent and exceptional
income NEUSD 307 ndash
404 BILLION
Inst
rum
Ents
bull Risk management NEbull Carbon offset finance USD 22 billionbull Low cost debt USD 01 ndash 11 billionbull Project-level market rate debt USD 274 ndash 357
billionbull Project-level equity USD 03 ndash 04 billionbull Balance sheet financing USD 08-11 billion
ExtE
rnal
bull Changes in net debt and equity from third-party NE
OthE
r act
Ors
bull Lending to all other actors of the landscape on a balance sheet basis NE
DESCRIPTION
Commercial financial institutions or commercial banks include all the sources of private debt capital These include but are not limited to
bull Profit-driven investment banksbull Carbon brokers and fundsbull Banks and insurance companies providing risk management solutions
PRIMARY DATA SOURCES
bull Bloomberg New Energy Finance and UNCTAD FDI databull Ecosystem Marketplace State of the Voluntary Carbon Markets Report
ISSUES AND FUTURE
ANALYSISbull Commercial financial institutionsrsquo contributions to ldquoactoror project sponsor-level debtrdquo are hard to measure and analyze
ExamplesClose to 600 MW of Spanish solar PV and thermal capacity was financed on a project finance basis in 2011 Spanish banks such as Banco Santander BBVA or Banco Espanol de Credito were instrumental in contributing project finance debt to solar project developers Other European (Portugal Germany France Italy and the Netherlands) and Japanese banks played an important role as well
For the Landscape 2012 we find that most of the projects developed are financed on a balance sheet basis ie the project developers raise money for all their activities without specifically earmarking projects Since we are unable to relate this funding to the emissions reduction projects and that information is scarce we do not include this in our estimate for commercial financial institutions
42
The Landscape of Climate Finance 2012
43
The Landscape of Climate Finance 2012December 2012 December 2012
Venture capital private equity and infrastructure fundsThe direct contribution of venture capital private equity and infrastructure funds to emissions reduc-tion projects is in excess of USD 24 billion for the year 2011
We estimate that 55-56 of venture capital private equity and infrastructure fundsrsquo contributions come from domestic sources while 44-45 come from foreign developed countries Developing countries received an estimated 15 of venture capital private equity and infrastructure climate finance while devel-oped countries received 85
SOURCES ESTIMATED VALUE DESTINATIONS
IntE
rnal bull Reinvested earnings from recurrent and exceptional
income NE
USD 24 BILLION
Inst
rum
Ents
bull Project-level equity USD 10 billionbull Balance sheet financing USD 14 billion
ExtE
rnal bull Changes in net debt and equity from third-party
(investors) NE
OthE
r act
Ors
bull Investing into other actors of the landscape on a balance sheet basis (corporate actors and project developers) NE
DESCRIPTION
This category capturesbull Venture capital fundsbull Private equity fundsbull Infrastructure funds
PRIMARY DATA SOURCES bull Bloomberg New Energy Finance and UNCTAD FDI data
ISSUES AND FUTURE
ANALYSIS
bull Private equity fundsrsquo investment into emissions reduction technology manufacturers (wind turbines solar panels etc) which are also involved in the deployment and financing of projects is difficult to estimate
ExamplesGroups such as Barclays Infrastructure Funds Management Ltd and Triodos Bank contributed to European wind and solar projects in 2011 They typically invest in a diversified portfolio of energy and or infrastructure assets or businesses (not necessarily all related to emissions reduction) on behalf of investors into such funds The investors behind these funds are typically institutional investors and wealthy individuals
42
The Landscape of Climate Finance 2012
43
The Landscape of Climate Finance 2012December 2012 December 2012
33 Instruments
Most climate finance ndash USD 276-310 billion out of a total USD 343-385 billion ndash can be classified as investment or more generally instruments that include ownership or claims Key instruments delivering these investments include balance sheet financing (59) project-level market rate debt (16) and low-cost debt (15) Other categories of instruments such as carbon offset flows grants and project-level equity make up the remainder of climate finance
The instruments considered in our analysis correspond to all the economic49 and financial instruments50 used in the deployment of emissions reduction projects Financial support can either be given directly to specific projects andor local implementing entities using a variety of instruments or it can assist national policy efforts Building upon the Landscape 2011 we consider six major categories of instruments (i) policy incen-tives (ii) risk management (iii) carbon offset finance (iv) grants (v) low-cost debt and (vi) capital instru-ments including project-level market rate debt project-level equity and balance sheet financing51 While not necessarily comprehensive these categories aim to capture the major instruments used to deliver climate finance
Policy IncentivesPolicy incentives include income-enhancing mecha-nisms such as feed-in tariffs tradable certificates tax incentives and clean energy subsidies which are most commonly funded domestically Many emerging economies in particular have started to use income-enhancing mechanisms to stimulate clean energy investment As discussed in the methodology section we do not report an estimate for total policy incentives finance given the risk of double counting (both invest-ment money and future revenues from the investment
49 ldquoA means by which decisions or actions of government affect the behav-iour of producers and consumers by causing changes in the prices to be paid for these activitiesrdquo (OECD Glossary of Statistical Terms available here httpstatsoecdorgglossarydetailaspID=6408)
50 ldquoA financial instrument is any contract that gives rise to a financial asset of one entity and a financial liability or equity instrument of another entityrdquo (IFRS IAS 32 Financial Instruments Presentation available here httpwwwifrsorgDocumentsIAS32pdf)
51 There is a large share of debt sitting behind balance sheet financing as project sponsors often obtain corporate loans or issue corporate bonds
to remunerate the investor) However the category of policy incentives is included in the Climate Finance Flows Diagram 2012 as policy incentives play a critical role in attracting climate finance at the investment stage
Risk Management
Official long-term export credits Export credits can be provided by or on behalf of gov-ernments and can take the following three forms (i) official direct support (loans) (ii) private export credit with repayment insurance (iii) private export credit with repayment guarantee (Buchner et al 2011)
In 2009 the share of export credits available to clean energy sectors (renewable energy and co-generationdistrict heating) rose to USD 07 billion (OECD statis-tics on export credits 2010 as cited in Buchner et al 2011) While more recent data is not yet available we might expect the proportion of climate specific export credits to increase given an agreement this year by OECD countries to incentivise export credit support for climate mitigation projects (including flexible repayment structures and longer tenors for advanced technologies and energy efficiency) while maintaining stricter financial terms and conditions for fossil-fuel based projects (OECD 2012)
It is worth noting that export credits of types (ii) and (iii) outlined above are paid to the exporter and there-fore technically represent a developed to developed country flow Furthermore these types of export credits may not be used and may not therefore represent a true flow of climate finance More detailed data is there-fore required to gain a better understanding of the role of export credits in stimulating private low-emission investments in developing countries
GuaranteesGuarantees are used to mitigate the risks involved in clean investments These can include risks related to non-payment technology performance or the fulfill-ment of obligations by government and affiliated agen-cies vis-agrave-vis a given project Based on our review of DFIrsquos flows we estimate annual guarantees in support of climate mitigation and adaptation to be at least USD 18 billion On top of this government budgets contributed a non-estimated amount of climate finance for loan guarantees (for instance through the US Department of Energy loan guarantee program for US solar projects in 2011)
Although money relative to guarantees is typically
44
The Landscape of Climate Finance 2012
45
The Landscape of Climate Finance 2012December 2012 December 2012
accounted for by financial institutions acting as guaran-tors52 we do not report the notional amounts relative to guarantees as tangible flows for in the course of our reporting period Guarantees do not need to be exer-cised there is a chance there will never be any outflow for the guarantor (for more details please refer to the methodology section) However guarantees certainly play a central role in clean investment decision-mak-ing and will be the focus of forthcoming CPI work
Carbon offset financeCarbon offsets aggregate public and private money for emissions reduction commitments or to meet voluntary objectives Payments for carbon offsets go to various offset projects currently most of these projects are related to the Kyoto Protocolrsquos Clean Development Mechanism (CDM) and Joint Implementation (JI) Apart from actors on the smaller but growing volun-tary market main players are compliance entities and
52 And they usually set aside provisions reducing their ability to invest in or lend to climate finance projects
intermediaries in regional and national systems (such as the EU Emissions Trading System - EU ETS - and the JVETS) and countries with Kyoto Protocol com-mitments Offset buyers can acquire offsets directly via carbon offset brokers or via carbon procurement funds This instrument category comprises all offsets markets in which primary carbon offsets can be pur-chased for cash
We estimate that carbon offset flows totalled between USD 465 and USD 475 billion in 2011 Our estimate includes only the incremental cost linked to carbon offsets not the investment costs of correspond-ing emissions reduction projects
This range is based on available data from the World Bank the UNFCCC IGES and Ecosystem Marketplace and is an increase compared to the Landscape 2011 estimate (USD 17 ndash 20 billion) mainly thanks to the increased CER issuance by the UNFCCC (although there were lower prices) and improved data visibility on ERU issuance
INSTRUMENTS ANNUAL FLOWS OF DIRECT CLIMATE FINANCE(2010 2011 USD BILLION)
INSTRUMENTS FOR INCREMENTAL COST
Policy incentives NOT ESTIMATED
Risk management NOT ESTIMATED
Carbon offset finance (1) 47 - 48
Grants (3) 98 - 156
Low-cost debt (15) 527 - 542
Sub-total instruments for incremental costs (19) 672 - 747bull public sources (4) 102 - 166bull private sources (1) 26
bull public intermediaries (14) 522bull private intermediaries (1) 23 - 33
INSTRUMENTS FOR CAPITAL COST
Project-level market rate debt (16) 527 - 621
Project-level equity (6) 200 - 235
Balance sheet financing (59) 2031 - 2248
Sub-total instruments for capital cost (81) 2758 - 3104bull public sources (2) 58 - 61
bull private sources (62) 2145 - 2401bull public intermediaries (7) 246
bull private intermediaries (10) 309 - 396
TOTAL
Total 3430 - 3850bull public sources (5) 160 - 227
bull private sources (63) 2171 -2427bull public intermediaries (21) 767
bull private intermediaries (10) 332 - 429
44
The Landscape of Climate Finance 2012
45
The Landscape of Climate Finance 2012December 2012 December 2012
GrantsGrants are transfers in cash or in kind for which recipi-ents do not incur any legal debt (OECD 2007b) Grants can play an important role in reducing upfront project investment costs and meeting viability gaps for projects that are more expensive than the business as usual Grants can also include support to enhance the enabling environment for investments through for instance knowledge management programs technical assistance and capacity building
In the Landscape 2012 we find that 35 (USD 13 billion) of total identified climate finance flows in 20102011 were delivered in the form of grants This is three times the amount of grants identified in the Landscape 2011 This figure can be considered an underestimate as it lacks data on grant contributions from developing country governmentsrsquo to domestic clean energy
In 2010 37 (USD 7 billion) on average of direct government budget flows were delivered in the form of ODA grants The top providers of grants as reported in the OECDrsquos CRS database were the UK Japan Norway and Germany Combined with grants provided by DFIs and Climate Funds we estimate on average 13 of total ldquopublicrdquo contributions were provided in the form of grants (USD 125 billion) Meanwhile just 02 of private finance was delivered as grants and originated from philanthropic contributions
While there is no comprehensive overview of the global extent of philanthropic contributions to climate-specific projects Vrana and Cracknell (2011) cite a range of studies which have reviewed environmental grant-making by foundations in the UK the US Canada Australia and New Zealand
Vrana and Cracknellrsquos (2011) review of environmental funding by European foundations suggests that climate change relevant grants reached around USD 53 million53 annually over the period 2008 ndash 2009 an estimated 13 of which flowed to end beneficiaries in develop-ing countries and the remainder to Europe and North America We assume a 5050 split between mitigation and adaptation activities for this figure54
Meanwhile the Environmental Grantmakers
53 This figure is expected to be an underestimate as it was based on a limited number of foundations and excluded environmental grants which were not more specifically marked for sector relevance
54 39 of EUR 37 million is reported as energy and transport It is not clear what percentage of activities reported as ldquoclimate and atmosphererdquo are for mitigation versus adaptation
Association (2012) estimates the contribution of US foundations to the ldquoclimate and atmosphererdquo area in 2009 to have been between USD 158 ndash 215 million55 60 of this finance stayed in the US 6 flowed to North America and Europe and 34 was directed to the rest of the world including Asia Africa Central and South America We exclude an additional USD 150 ndash 165 million worth of grants to energy and transport related activities given that there is no way to deter-mine the share of those grants that went to fossil fuel related activities We therefore estimate that a total of approximately USD 211 ndash 268 million in philanthropic contributions went to climate projects in 20082009
ExampleJICA supports a variety of climate projects around the world through grants In Kenya for example JICA supports a program that helps communities adapt to floods and develop infrastructure such as evacuation facilities In Vietnam JICA supports low-carbon development through integrated grant and project loan packages and technical assistance to support physical infrastructure development capacity building and policy development JICA also provides grants that encourage infrastructure projects to engage Japanese firms the Agency provides funding for preparatory studies and helps finance infrastructure that will be later operated by private players Source Inaka (2011)
Low-cost debtLow-cost debt is financing provided at terms prefer-able to those prevailing on the market including for example longer repayment terms lower interest rates and higher levels of participation in investments Low-cost debt includes concessional loans
The biggest low-cost debt providers are Development Finance Institutions and governments Loan conditions vary greatly between individual institutions and proj-ects The terms of loan repayments are important for engaging the private sector but at the same time providers need to avoid over-subsidization and to increase the value obtained for public money It is not however possible to comment on the terms of debt due
55 Lower value includes projects marked as pertaining to the specified focal area as a ldquoprimary issuerdquo while the higher value includes overall giving (primary and secondary issue)
46
The Landscape of Climate Finance 2012
47
The Landscape of Climate Finance 2012December 2012 December 2012
to a lack of aggregated data figures presented here are gross rather than net flows
Up to 146 (USD 535 billion) of total climate finance flows captured in the Landscape 2012 are delivered in the form of low-cost debt These flows are entirely from public sources in particular National Finance Institutions (indeed 866 of their financing or USD 37 billion is delivered through low-cost debt) Bilateral Finance Institutions (which use low-cost debt to deliver 62 or USD 7 billion of their climate financ-ing) and directly from governments (32 or USD 62 billion on average of government climate financing is delivered through low-cost debt) This compares to just USD 126 billion worth of concessional loans identified in the Landscape 2011 reflecting the extended coverage of DFIsrsquo flows and in particular NFIs in the Landscape 2012
The central role of BNDES in the rapid expansion of wind and other renewable energy sources in Brazil in
recent years is highlighted in Box 7 Here low-cost debt has reduced borrowing costs for investors by around 40 and in turn reduced renewable electricity tariffs by around 25
Capital instrumentsThe capital instrument category tracks the trans-formation of capital contributions into shareholder ownership (equity) creditor claims (debt loans bonds etc) and hybrid capital instruments Any source or intermediary may contribute capital Capital contributions are registered in specific mitigation and adaptation investment project balance sheets Capital is returned to contributors in two forms first as dividends and changes in the market value of the shares held for equity holders and second as coupons or interim inter-est payments and return of principal for debt holders
In the Landscape 2012 we split investment capital
Examples ndash Mexicorsquos Renewable Energy Financing Facility (REFF)1
The REFF was established within the Mexican Nacional Financiera (NAFIN) to address the renewable energy financing gap by encouraging private sector investment REFF provides
bull direct loans with long repayment terms (about 10-15 years) and fixed interest rates to project developers to finance the construction of new renewable energy projects and support their financing needs during their life and
bull contingent credit lines to cover transitory cash flow shortages during the project lifecycle (eg due to lower than expected energy generation or prices) up to the volume needed to service senior debt
As shown in the figure below NAFIN channels international funds from the Inter-American Development Bank and the Clean Technology Fund combining them with its own to attract private capital It is expected that the facility will ultimately reach a total value of USD 540 million Providing a maximum of USD 10 million to individual projects it is expected that the facility will contribute to investments with a total capital value of up to USD 1540 million2
1 Source Visconti et al (2012) Smallridge et al (2012) based on IDB (2011)
2 This figure is estimated considering a total 1000 MW of installed generation capacity and investment costs of USD 2-25 million per MW (IDB 2011)
Source Smallridge et al (2012) based on IDB (2011)
46
The Landscape of Climate Finance 2012
47
The Landscape of Climate Finance 2012December 2012 December 2012
sources into three major categories56 project-level market rate debt project-level equity and balance sheet financing
Project-level market rate debt worth USD 527 ndash 621 billion went towards emissions reduction projects in 2011 The debt is being repaid on the revenues gener-ated by the emissions reduction project rather than its sponsor (non-recourse debt) This is mostly project finance debt but by extension we include project bonds lease financing and other financing techniques in this category Unsurprisingly the largest contributors were commercial financial institutions (USD 274 ndash 357 billion) More interestingly a significant portion of project-level market rate debt came from other actors notably vendor financing for technology manufacturers
We find that project-level equity worth USD 200 ndash 235 billion was directed to emissions reduction projects in 2011 This is the equity counterpart of project-level market rate debt
Balance sheet financing (or sponsor-level financing) worth USD 2031 ndash 2248 billion went towards emis-sions reduction projects in the year 2011 This category corresponds to investment capital raised at the sponsor level rather than at the project level The largest con-tributors to this type of instrument are project develop-ers (USD 974 ndash 1097 billion) corporate actors (USD 650 ndash 741 billion) and households (around USD 321 billion) From an analytical standpoint it is impossible to determine the sources of balance sheet financing for several reasons First sponsor-level capital includes various sources of capital reinvested earnings from the sponsorrsquos activities equity from shareholders and debt from lenders (commercial financial institutions for loans and credit lines institutional investors and mutual funds for bond and notes) Second the money raised at the sponsor level is not earmarked Third it is challenging to come up with a simple estimate to break down balance sheet financing into debt and equity components Sponsor financing practices and economic circumstances vary across industries and countries For example in India project developers must overcome difficulties securing corporate debt whereas in Europe utilities can use regular borrowing programs more easily Moreover we cannot merely look at sponsorsrsquo balance sheets for guidance as the mix of capital sources for emissions reduction projects will not
56 In order to make the instrument categories mutually exclusive any amount categorized as lsquocapitalrsquo should be free of any form of support from other instruments (subsidies carbon offsets etc) and should only represent the net lsquocapitalrsquo dedicated to investments
necessarily be the same as the mix of capital sources for all projects
48
The Landscape of Climate Finance 2012
49
The Landscape of Climate Finance 2012December 2012 December 2012
Box 9 ndash Indiarsquos experience in financing renewable energy
India which is already the worldrsquos fifth-largest market for wind power has set ambitious targets for both wind and solar generation These targets of 20 GW for solar (by 2022) and 31 GW for wind (by 2017) will require massive investment for an economy already facing competing needs for investment in energy and infrastructure more generally A plethora of renewable policy abounds at the state level and the federal government offers its own policies ndash such as accelerated depreciation and the renewable energy certificate (REC) market ndash but all of these policies are likely to be undermined by the state of Indian financial markets and their regulation
In particular Nelson and Shrimali et al (2012) found that in the short term the interest rates and terms for debt may raise the cost of renewable energy by 24-32 compared to similar projects financed in the US and Europe The high cost of debt wipes out all or most of the cost advantages India might otherwise have and makes renewable energy much less competitive against conventional alternatives There are also signs that in the longer term debt will become increasingly hard to secure even at high costs which could put targets beyond reach for both cost and financing reasons
The main causes of high interest rates for renewable energy projects lie in the general financial market conditions of the country Growth high inflation competing investment needs and country risks all contribute A shallow bond market regulatory restrictions on foreign capital flows and heavy government borrowing add to the problem while the cost of currency swaps and country risk negate the advantages that could come from access to lower-cost foreign debt
While there is agreement in India that debt markets might be a problem there is less agreement as to the precise nature of this problem or potential solutions Discussions with analysts operating in the country revealed the existence of a gap between risks perceptions and expected returns from renewable energy projects in India To bridge this gap several initiatives have been taken by multilateral banks to establish risk guarantee funds For instance the Asian Development Bank and the Indian Government set up a partial risk guarantee fund in which they cover all risks and pay 50 of the default value at a nominal premium But such measures have struggled so far as project developers are unwilling to pay a high premium for such insurance coverage
In other rapidly developing countries facing high interests and competing investment demands such as Brazil renewable energy investors rely partly on concessionary support from National Development Finance Institutions However in India the deregulation of financial markets that occurred in the early lsquo90s has in fact led many National Finance Institutions to convert themselves into commercial banks that cannot make concessionary loans Further analysis is needed to evaluate what lessons can be learned from experience in places like Brazil or China and how these lessons could be adapted to the Indian context
Prepared by Shobhit Goel (CPI Hyderabad shobhitgoelcpihyderabadorg)
Based on Nelson Shrimali et al (2012) ldquoMeeting Indiarsquos Renewable Energy Targets The Financing Challengerdquo CPI Report (forthcoming)
The high cost of debt is the most pressing problem currently facing renewable energy financing in India
48
The Landscape of Climate Finance 2012
49
The Landscape of Climate Finance 2012December 2012 December 2012
34 Disbursement channelsDisbursement channels are organizations that work directly to disburse funds for climate mitigation and adaptation projects including organizations from the public57 and private sector public-private partnerships (PPPs) local financial institutions and banks multilat-eral organizations non-governmental organizations and civil society They may be local regional national or international organizations
There is no aggregated information available on the split of finance by type of disbursement organization but examples from specific investments or organizations can help to shed light on current patterns and best prac-tice For instance Germanyrsquos KfW collaborates with a range of local financial institutions including micro-banks commercial banks refinancing institutions village savings banks non-governmental organizations and regional and supra-regional micro-finance funds to build up micro and small enterprises
Public climate finance from developed to developing countries is sometimes provided directly to recipient governments or government agencies for distribution to end recipients More often however for efficiency and to ensure environmental social and economic safeguards are applied donors channel money through international organizations (eg UNDP UNEP or Multilateral Finance Institutions) or large reputable and often international non-governmental organiza-tions This has also been the operational mode of many international Climate Funds For instance the Clean Technology Fund the World Bank Group the African Development Bank the Asian Development Bank the European Bank for Reconstruction and Development and the Inter-American Development Bank act as implementing agencies working alongside local execut-ing agencies who actually implement projects The Adaptation Fund is an exception in that a number of National Implementing Entities have been accredited to receive money directly from the Fund (see Section 32 on Climate Funds)
There is often a complex web of relationships involved in implementing a project For instance the Clean Technology Fund awarded low-cost debt to Ouarzazate I a Moroccan Concentrated Solar Power plant However this debt is channeled through the African Development Bank and International Bank for Reconstruction and Development then passed to the Moroccan Agency for Solar Energy (MASEN) which
57 Public organizations including government ministries departments programs and agencies
provides debt financing to a public private partnership Special Purpose Vehicle which will build and operate the plant (see Falconer and Frisari 2012)
Regardless of the geographic nature of climate finance flows and whether they are public or private the types of organizations engaged to disburse and implement climate finance are of crucial importance shaping the capacity available to implement and scale up low emissions and climate resilient activities In particu-lar engagement of local organizations is important to ensure capabilities are transferred or built up locally rather than being isolated in international organizations
35 Uses
Mitigation measures received the bulk of climate finance around USD 350 billion The private sector money captured in the Landscape 2012 accounted on average for USD 268 billion about 73 of the total and was directed towards renewable energy generation projects wind and solar in particular
Governmentsrsquo climate finance was also strongly focused on mitigation measures (87) This reflects low-carbon development ambitions and commitment to supporting structural changes in energy systems seen as engines of economic growth
Public financial institutions also played a pivotal role in the support of clean energy investment allocating more than 60 of their climate flows to renewable energy and energy efficiency measures By packaging
In 20102011 mitigation measures attracted USD 350 billion out of USD 364 billion This is largely the result of significant capital investments in mitigation measures like renewable energy
Data on REDD+ finance are poor but suggests that flows could be around USD 118 billion per year predominantly from domestic government contributions
Adaptation interventions received USD 123 to USD 158 billion primarily in the form of incremental cost payments While there has been some progress in tracking adaptation finance since the Landscape 2011 weaknesses in defining and tracking adaptation finance partial reporting by some multilateral players and the inability of existing efforts to capture private flows dedicated to such activities continued to hamper our understanding of adaptation finance flows
50
The Landscape of Climate Finance 2012
51
The Landscape of Climate Finance 2012December 2012 December 2012
financing instruments tailored to address market fail-ures they can close the viability gap of clean technolo-gies to help them mature and become self-sustaining They can also provide access to long-term financing for these projects otherwise not readily available in local capital markets
MitigationWhat does the private sector finance
We find that the private sector (both private sources and intermediaries) contributed USD 2503 ndash 2855 billion towards the total of global climate finance in 20102011 (74 of the total) All that money went to climate change mitigation This reflects both the difficulties in estimating private sector adaptation finance (even though households and corporate actors do engage in autonomous adaptation activities) and the constraints of the global datasets to which we had access (Bloomberg New Energy Finance and UNCTAD Foreign Direct Investment data for renewable energy asset finance and REN21 and Frankfurt School of
Finance amp Bloomberg New Energy Finance for small-scale renewable energy)58
The total amount breaks down into
bull USD 833 billion for small-scale investment USD 737 billion for solar PV and USD 94 billion for solar water heaters and coolers
bull USD 1623 ndash 1975 billion for larger renewable energy asset finance corresponding to an extra capacity of 67 GW (more than 67 for wind and more than 20 for solar technologies) and
bull The remainder to carbon offset finance
The largest private contributors to mitigation invest-ment were project developers (USD 1160 ndash 1303 billion) corporate actors (USD 693 ndash 805 billion) and commercial financial institutions (USD 307 ndash 404 billion) Private sector investment relied on contributions from public sources and intermediaries
58 Please note that given the data constraints data on energy efficiency is lacking Ryan et al (2012) estimate that about USD 23 billion in DFIsrsquo financing leveraged about USD 46-184 billion in energy efficiency invest-ments in developing countries in 2011 depending on the leverage ratio (2 or 8)
Table 1 Climate finance breakdown of sources into mitigation and adaptation fundsa
SOURCES amp INTERMEDIARIES MITIGATION(USD BILLION)
ADAPTATION(USD BILLION)
TOTAL (USD BILLION)
PROJECT DEVELOPERS 1150 ndash 1293 NE 1150 ndash 1293
CORPORATE ACTORS 693 ndash 805 NE 693 ndash 805
HOUSEHOLDS 323 NE 323
INSTITUTIONAL INVESTORS 06 NE 06
COMMERCIAL FINANCIAL INSTITUTIONS 307 ndash 404 NE 307 ndash 404
VENTURE CAPITAL PRIVATE EQUITY AND INFRASTRUCTURE FUNDS 24 NE 24
GOVERNMENTS BUDGETS 149 ndash 182 10 ndash 44 159 - 226
NATIONAL FINANCE INSTITUTIONS 375 52 427
MULTILATERAL FINANCE INSTITUTIONS 183 29 212
BILATERAL FINANCE INSTITUTIONS 86 27 113
CLIMATE FUNDS 11 04 15
TOTAL 3307 ndash 3693 123 ndash 157 3430 ndash 3850
Note Figures represent annual flows for the latest available year (20102011) variable according to the data sources (2010 for OECD DAC members and EU Institu-tions 2011 for all the other organizations) Most data presented relate to commitments in the given year disbursement data are included for one DFI only The figures do not add up to the total exactly because of roundinga Philanthropy which is not included in the table due to the materiality of the flow accounts for about USD 211-268 million which due to lack of information we
assume is split equally between mitigation and adaptation (around USD 120 million to each)
50
The Landscape of Climate Finance 2012
51
The Landscape of Climate Finance 2012December 2012 December 2012
instruments addressing incremental costs but also access to debt financing both at the project level and at the sponsor level
What does the public sector finance
Governments and public financial intermediaries invested USD 804-837 billion in mitigation mea-sures in 20102011 Development Finance Institutions contributed USD 644 billion or 784 of the total Renewable energy and energy efficiency received 54 and 18 of total public mitigation financing respectively The sustainable transport sector received a significant amount of climate funds 10 of the total mainly from National Finance Institutions and Multilateral Finance Institutions
In particular NFIsrsquo climate finance activities highlight the domestic emphasis which is driven by the low-carbon development strategies of the countries they operate in or to which they are linked to About USD 289 billion (or 677 of the NFIsrsquo total climate financ-ing) was committed to renewable energy and energy efficiency measures implemented mainly domesti-cally We estimate that more than 80 of NFIsrsquo finance was spent in China and Brazil reflecting the relevant weights of CBD and BNDES in this category59 The transport sector of importance for socio-economic development represented 10 of NFIsrsquo mitigation finance The activities supported include rail and ship transportation waterways Bus Rapid Transit systems and vehicles substitution Acknowledging that these activities may ultimately result in emission reductions it is difficult to understand and compare them against
59 As described in Box 7 BNDES placed a particular emphasis on wind and hydropower projects in 2011 CDB too demonstrated its commitment in the support of wind farms and large-scale hydroelectric projects proac-tively implementing the governmentrsquos Green Credit Policies At year-end 2011 its outstanding loan portfolio in energy conservation emissions reduction as well as environmental protection sectors at USD 1018 billion (RMB 6583 billion) up by 33 year-on-year demonstrates its commit-ment The increase observed in the Banksrsquo support to the power sector in 2011 reflects the countryrsquos need to overcome chronic power shortages and optimize the supply mix Worth noting that nuclear and integrated or pithead coal-based plants were also the recipients of the Banksrsquo financing (CDB 2012) CDB does not invest domestically only it is also invests abroad playing an important role in the financing of overseas activities of state-owned enterprises with the aim of creating national champions and acquire advanced technologies (eg Brookingsedu) The Bank also con-tinued to provide financing to the China National Petroleum Corporation Group and SINOPEC Group to support their overseas oil field exploration efforts As of the end of 2011 CDBsrsquo outstanding loan balance in this sector stood at USD 598 billion (RMB 3865 billion) (CDB 2012)
a business-as-usual scenario and to understand if and what they should be qualified as climate finance60
MFIsrsquo mitigation financing was also strongly oriented towards renewable sources of energy and energy con-servation measures which received more than 614 of their total commitments (about USD 13 billion) This can partly be explained by the sectoral specializa-tion of some players such as the EBRD which devoted 938 of its 2011 mitigation finance to these sectors61 MFIsrsquo resources also financed measures aimed at strengthening regulatory and institutional frameworks supportive for clean-technologies62 They also worked with local financial institutions to embed capacity and create specific skills in the preparation risk evaluation and monitoring of these types of projects as well as in the identification of investment opportunities63
The development of the financial sectorrsquos capabilities was also one of the areas targeted by bilateral players such as KfW which dedicated 56 of its 2011 climate finance to capacity building measures in the mitigation area Overall in 2011 the largest shares of BFIs climate spending was directed to the energy (292 to renew-able 13 to energy efficiency) and waste management sectors (9) Transport and agriculture forestry and land use accounted for 122
The forestry sector is an area of emerging interest for some BFIs KfW for instance has a lsquoforest and climate protection programrsquo with Indonesia the largest single-sum beneficiary to date of Germanyrsquos Fast-Start financing (Vieweg et al 2012) The promotion of REDD initiatives is also an important objective for JICA and AfD (AfD 2012 JICA 2012b)
The largest share of bilateral ODA commitments marked as climate mitigation (38) which represented about 60-80 of 2010 DAC membersrsquo reporting was
60 The World Bank identifies the activities with mitigation co-benefits in the sector eg modal shifts traffic management etc (see Worldbankorg) Not all DFIs however have sophisticated systems and frameworks for accounting mitigation finance in place and this is particularly true with regard to the majority of NFIs whose approaches are still in their infancy (See Smallridge et al 2012)
61 Projects supported can range from energy efficiency interventions in the industrial and residential sector support to biomass technologies and the financing of standalone renewable energy projects such as wind and hydropower (EBRDcom 2012)
62 In 2011 capacity buildingtechnical assistance measures related to mitiga-tion received 05 billion of MFIsrsquo commitments
63 See eg the EBRD Sustainable Energy Financing Facilities which comprises a comprehensive technical assistance program intended to provide imple-mentation support to partner banks sub-borrowers and project sponsors (EBRDcom)
52
The Landscape of Climate Finance 2012
53
The Landscape of Climate Finance 2012December 2012 December 2012
committed to projects in the agriculture forestry and land use sector Capacity buildingenabling environ-ment measures received another significant 30 while renewable energy generation from hydro geothermal solar and wind sources captured 15 (OECD 2012)64 African and Asian countries accounted for almost 40 of overall bilateral spending (OECD 2012) This underscores the importance of addressing critical development issues jointly with mitigation measures to achieve growth in a sustainable manner
The volume of public money we found ldquositting behindrdquo project developersrsquo actions (about 11 billion see Box 5) largely originating from and delivered to developed countries (64-72 of the total) ndash mainly in Germany and the US ndash was directed to support and accelerate local deployment of renewable energy measures This reflects the large injection of funds as a result of the ldquogreenrdquo stimulus plans and the effect of policies incen-tivizing uptake Box 3 on the US Federal Tax Incentive Program provides insights on these aspects
REDD+The scope of activities considered ldquoREDD+rdquo65 is notori-ously difficult to delineate While REDD implies efforts to reduce deforestation and forest degradation the lsquoplusrsquo refers to the restoration and rehabilitation of forests and to addressing the drivers of the problem A broad range of activities is needed to tackle the drivers of deforestation and support transitions to more sus-tainable economic development pathways
REDD+ finance can support the creation of enabling environments (eg capacity and institution building and policy and regulatory reform) and mitigation projects (eg creating protected areas or rehabilitating ecosys-tems) Transitioning from a project-by-project approach toward landscape and industry scale approaches would improve prospects of achieving reductions at scale
64 Bilateral fundsrsquo focus are also starting to move towards Nationally Ap-propriate Mitigation Actions (NAMAs) as demonstrated from for instance the early initiative of a group of Nordic countries financing such programs in Vietnam and Peru In Peru USD 3 million (EUR 22 million) will be invested in the waste management sector with bilateral funds from Nordic countries (Denmark Finland Iceland Norway Sweden via the so-called Nordic Partnership Initiative) and domestic money from Peru itself but also from the Nordic Environmental Development Fund In Vietnam the USD 21 million (EUR 15 million) NAMA will focus on the cement manufac-turing sector with financing from Nordic countries and Vietnam itself For additional information see NEFCO website (NEFCOorg)
65 Reducing Emissions from Deforestation and forest Degradation the sus-tainable management and conservation of forests and the enhancement of carbon stocks
by shifting production practices commodity supply chains and land use patterns across jurisdictions and geographies For instance programs aimed at reform-ing policies and creating incentives to intensify agricul-tural productivity thereby reducing pressure to convert forests to achieve increased yields and programs to create alternative livelihoods should be considered part of an effective REDD+ strategy A wide range of actors and sources of finance will be required to realize this broad scale transition including national and interna-tional public and private finance
The potentially broad scope of REDD+ activities adds to the challenges of tracking global financing flows data on which are particularly poor (Buchner et al 2011 Simula 2010 Streck and Parker 2012 ISU 2012 PWC 2011) Fragments of information available on current REDD+ flows suggest they are lagging far behind needs projected by the 2008 Eliasch Review to be around USD 17-33 billion per year by 2030 for a 50 reduction in deforestation
Current flows of REDD+ finance come largely from national and international governments with smaller but growing contributions from non-governmental organi-zations philanthropic and private sector sources The majority of international REDD+ financing to date has focused on lsquoREDD+ readinessrsquo66 building capacity and institutions and some demonstration projects while REDD+ activities at scale and lsquopayment for perfor-mancersquo activities have yet to gather pace
Selected estimates of annual REDD+ finance flows are presented in Appendix F to give a sense of the possible scale of current commitments Estimates include bilat-eral and multilateral flows and dedicated funds as well as forest carbon market flows The data suggest that current REDD+ flows could be approximately USD 13 billion per year67 The figures highlight the dominance
66 ldquoREDD readinessrdquo generally means that all the preconditions ndash in terms of institutional policy and regulatory frameworks ndash necessary to enable countries implement REDD measures are in place Under the UNFCCC Cancun Agreements countries are requested to develop a national strategy or action plan a national forest reference level a robust and transparent national forest monitoring system and a system for providing information on how the safeguards are being addressed and respected (UNFCCC 2010 - Cancun Agreements Art 71)
67 Where possible the value of commitments to approved projects is counted rather than the full value of pledges to funds Higher estimates of international public finance tend to include pledges The International Sustainability Unit (ISU) estimates that total REDD+ financing pledges for the period 2010-2012 based on reporting by donors through the VRD of USD 4 billion Streck and Parker (2012) estimate that international public finance currently accounts for around USD 3 billion per annum including multiannual pledges and funds
52
The Landscape of Climate Finance 2012
53
The Landscape of Climate Finance 2012December 2012 December 2012
Box 10 - Sectoral breakdown of public mitigation financeFigure 3 presents the sectoral breakdown of countriesrsquo bilateral aid including Fast-Start finance1 and DFIsrsquo support targeting climate change mitigation activities It also includes the estimated portion of public funds tracked from project finance reporting in the BNEF database which was entirely directed towards renewable energy projects2
The allocation of the various activities listed in the OECD CRS database (OECD 2012) against the presented sectors was based on the best available information (ie project purpose and description)3 The weights obtained for each sector were then applied to allocate the identified portion of Fast-Start finance devoted to mitigation
We acknowledge the presence of financial flows directed to projects not in line with our definition of climate finance such as money invested in research and development gas-fired power plants or projects with apparently no link to abatement interventions but rather linked to activities like human rights (eg ldquoCSO campaign against poverty hunger exclusion and violation of human rights in South Asiardquo) or peace-building conflict prevention and resolution (both marked as ldquosignificantrdquo in the OECD CRS dataset) Support to such activities was allocated to the category ldquoothersrdquo which also include multi-sector or unspecified aid MichaelowaMichaelowa (2011) also highlights issues related to donors incorrect coding and reporting to OECD DAC (see OCED 2010 for comments on MichaelowaMichaelowa 2011)
With regard to DFIs the breakdown of mitigation finance reflects institutions self-reporting against the sectoral categories provided in the financial survey In those cases where respondents provided different sectoral breakdown the projectcategory description was considered for allocating data against the chosen categories
To estimate the sectoral allocation of DFIsrsquo climate finance sourced from secondary data we used ndash depending on the institutiongroup of institutions considered ndash the following Ecofys-IDFC (2012) UNEP-SEI (2011) Annual Reports and BNEF (2012)
1 To allocate to the mitigation theme the USD 18 billion identified in Fast-Start Finance reporting for 2010 we applied the average share observed in the distribution of money between mitigation and adaptation projects during the 2010-2011 period as per Gibbs (2012) (714 including REDD vs 225) To this we added a share of the money directed to projects with multiple objectives computed according to the weight of mitigation versus adaptation projects on the total
2 The sectoral breakdown does not include Climate Funds money due to data availability issues3 Climate finance commitments retrieved from the OECD CRS data set and allocated to the energy efficiency sector refer to a portion of those
flows directed to measures aimed at improving the ldquopower quality and reliabilityrdquo of electrical transmissiondistribution networks A specific example is for instance a project titled ldquoPacific Power Utilities improved energy efficiencyrdquo We acknowledge that more detailed analysis is needed to understand what is behind each specific project ldquolabelrdquo
Figure 3 Sectoral breakdown of governmentsrsquo and DFIsrsquo mitigation finance (USD 804-837 billion)
0
10
20
30
40
50
60 RENEWABLE ENERGY GENERATION
ENERGY EFFICIENCY
SUSTAINABLE TRANSPORT
AGRICULTURE FORESTRY amp LAND USEOTHERS
WASTE amp WASTE WATER
CAPACITY-BUILDING
FUEL SWITCH
Note The total include Climate Fundsrsquo mitigation financing which is however excluded from the sectoral allocation due to data availability The category ldquoothersrdquo can include unspecifid or multi-sector aid or unallocated portions of DFIsrsquo financing
54
The Landscape of Climate Finance 2012
55
The Landscape of Climate Finance 2012December 2012 December 2012
of bilateral finance and support claims that bilateral finance for REDD+ has so far been faster to disburse than multilateral finance (ISU 2012)
This estimate however largely based on data for inter-national public flows does not account for domestic REDD+ finance which some experts estimate could be several times greater than international donor flows It is particularly difficult to determine the volume of domestic flows and few reliable estimates are available Streck and Parker (2012) estimate that approximately USD 25 billion per year is spent in Brazil Mexico and Indonesia alone and a further USD 7 billion annually is spent in China on afforestation activities Meanwhile Brazil Cameroon the Democratic Republic of Congo Gabon Indonesia Laos Mexico and Papua New Guinea report REDD+ self-finance amounts to USD 24 billion in the Voluntary REDD+ Database68 database (ISU 2012)
Private sector motivations to invest in REDD+ activities include carbon market compliance pre-compliance positioning and corporate social responsibility includ-ing voluntary carbon market participation While the volume of forest credits traded on voluntary markets dropped by almost half between 2010 and 2011 the average price of credits almost doubled meaning that the market held its overall value On the other hand sales of CDMJI forestry credits rose considerably between 2010 and 2011 (as the end of the Kyoto compli-ance period drew near) but average prices fell slightly (Peters-Stanley 2012) Some new emerging compliance carbon markets notably in Australia as well as nascent bilateral markets may provide new sources of demand going forward Aside from carbon markets Streck and Parker (2012) estimate that the private sector is cur-rently generating more than USD 1 billion each year through premiums associated with certified forest products at least part of which goes towards conserva-tion programs
Taken together available estimates of domestic international and private flows imply total REDD+ flows of around USD 118 billion per year This figure is not presented in the Climate Finance Flows Diagram 2012 at present given the figurersquos high level of uncer-tainty and poor underlying data sources It would appear however that domestic governments are the most significant contributors to REDD+ finance Engaging the private sector to drive sustainable produc-tion practices will be crucial to meaningfully tackle the drivers of deforestation supported by clear government
68 Source httpreddplusdatabaseorg
incentives and policies and support from the interna-tional community
Adaptation
Little agreement exists on what qualifies as adapta-tion finance or more narrowly what qualifies as an adaptation intervention Adaptation in fact encom-passes various types of activities which may span the entire vulnerability reduction-response to impacts continuum and which can be applied to a wide range of sectors (agriculture water energy etc) As a result most institutions are not yet equipped with a proper methodology for measuring adaptation finance although relevant efforts to establish tracking and reporting approaches are currently underway (eg the MDBsrsquo initiative on joint adaptation finance tracking)
Hence weaknesses in defining measuring tracking and reporting adaptation finance partial data from some multilateral players and the inability of existing efforts to capture private resources dedicated to such activi-ties hampered our understanding of adaptation finance flows
Given the definitional and methodological complexity surrounding the topic there are few estimates available so far as few have actually tried to truly identify and assess adaptation financing
In the Landscape 2012 we aim to highlight the progress achieved so far on this matter as well as underscore the remaining gaps
Our estimate of about USD 123ndash157 billion of adapta-tion finance comprises donorsrsquo bilateral aid (USD 1-44 billion) (OECD 2012)69 including USD 428 million of
69 Data are adjusted to exclude Bilateral Finance Institutionsrsquo contributions to this field
In 20102011 USD 123 ndash 158 billion was directed towards activities with adaptation objectives Accounting for 775 of the total public financial institutions were the predominant sources These institutions are also the holders of long-standing expertise in the field given their past experience in the areas of development assistance with relevance to adaptation
The biggest knowledge gap in adaptation financing is the role of the private sector which is not estimated in this study
54
The Landscape of Climate Finance 2012
55
The Landscape of Climate Finance 2012December 2012 December 2012
Fast-Start finance70 Climate Funds (USD 04 bn) and
70 The portion of the identified USD 18 billion in Fast-Start Finance reporting for 2010 directed to adaptation (USD 441 million) was estimated by ap-plying the average share observed on the thematic allocation of Fast-Start money over the 2010-2012 period as per Gibbs (2012) (714 to mitiga-tion including REDD vs 225 to adaptation) To this we added a share of the money directed to projects with multiple objectives computed according to the weights of mitigation versus adaptation projects on the total
DFIsrsquo support targeting climate change adaptation activities (USD 109 billion) and philanthropic contribu-tion from Foundations71 (USD 1055-134 million)
With regard to bilateral assistance in November 2011 the OECD-DAC published the first-ever complete
71 We allocated 50 of the identified USD 211ndash268 million of philanthropic contributions to climate-specific projects to adaptation measures See paragraph on ldquoGrants instrumentsrdquo
Box 11 - Sectoral breakdown of public adaptation financeBased on the information gathered we attempted to categorize adaptation finance by recipient sectors despite an international agreement on this has not been reached as yet We found that the agriculture and forestry and the water preservation supply and sanitation sectors were the main recipients of climate-resilient finance in 20102011 receiving 27 (USD 44 billion) and 23 (USD 38 billion) of the total respectively (see Figure 4)
Among individual contributors Bilateral Financial Institutions allocated 513 of their adaptation finance to the water sector Disaster risk reduction initiatives also represented an area in which Bilateral Finance Institutions were particularly active receiving 156 of their adaptation finance National players appeared critical in supporting the strengthening of the resilience of local infrastructure assets as well as the agriculture and forestry sector which were the recipients of 313 and 309 respectively of their adaptation finance
Among DFIs multilateral organizations on the other hand were the major providers of financial support towards capacity building and technical assistance initiatives in this area which accounted for 127 of their total adaptation finance Activities included awareness raising programs training to address vulnerabilities early warning systems and strengthening of institutions policies and regulations
Dedicated Climate Funds also played a role in adaptation financing albeit limited compared to the total accounting for about 25 They are however proving critical in financing pilot and demonstration projects and in promoting the integration of climate risk and resilience into development policies and planning This is particularly the case of the Pilot Countries for Climate Resilience (PPCR) a program operating within the Climate Investment Funds framework which by channelling 45 of the total Climate Fundsrsquo finance (or USD 1548 million) stands out as the major contributor in this area
Figure 4 Sectoral breakdown of governmentsrsquo and DFIsrsquo adaptation finance
0
5
10
15
20
25
30
AGRICULTURE AND FORESTRY
WATER PRESERVATION SUPPLY AND SANITATION
OTHERSINFRASTRUCTURE
(CAPACITY-BUILDING TECHNICAL ASSISTANCE)
DISASTER RISKREDUCTION
Note Climate Fundsrsquo adaptation financing (USD 352 million) and the estimated portion of philanthropic contributions targeting adaptation (USD 120 million) are excluded from the sectoral breakdown due to data availability issues The category ldquoothersrdquo can include for instance unspeci-fied or multi-sector aid or unallocated portions of DFIsrsquo financing
56
The Landscape of Climate Finance 2012
57
The Landscape of Climate Finance 2012December 2012 December 2012
Creditor Reporting System dataset on aid for climate change adaptation whose ldquomarkerrdquo was approved by member countries in 2009 (OECD 2011)72 While donors inappropriate coding73 affects the true magni-tude of the identified flows (Junghans and Harmeling 2012) this has brought to light their contributions to the field advancing understanding on how much money is going to advance the adaptation agenda
Elaborating on the OECD-DAC methodology which is ldquoobjective basedrdquo74 the World Bank has developed an ldquoactivity-basedrdquo system that tracks spending on activi-ties with adaptation co-benefits at the sub-component level75 ldquoonly if they explicitly include climate adaptation reasoning and directly address vulnerability or impact from climate variability and changerdquo (IEG 2012) This system was introduced in 201276
This initiative feeds into the group of MDBs currently working on a joint approach for adaptation finance tracking (AfDBorg IDB et al 2012) The outcomes of this effort which will be released at COP 18 are hence not fully reflected in our figures
Four MDBs in fact opted to report on mitigation only while in the process of finalizing the above mentioned methodology others estimated adaptation financ-ing following the DAC Rio Marker as selection criteria for adaptation activities (eg EBRD KfW and JICA) The World Bankrsquos figures reflect instead the newly piloted methodology More information is needed on the approaches followed by NFIs for reporting to understand what is actually counted against this theme Those surveyed by us or under the Ecofys-IDFC (2012) initiative were requested to report according to the OECD definition
72 This marker captures those activities that aim ldquoto reduce the vulner-ability of human or natural systems to the impacts of climate change and climate-related risks by maintaining or increasing adaptive capacity and resiliencerdquo For additional information see OECD website (OECDorg)
73 Junghans and Harmeling (2012) reveal that about 65 of the activities in the adaptation dataset are unrelated to it or do not identify adaptation as a ldquosignificantrdquo or ldquoprincipalrdquo target while about half of the remaining 35 are over-coded eg reporting adaptation as a primary objective when it should have rather been reported as secondary
74 In the OECD CRS database a project is marked as having adaptation as a ldquoprincipal objectiverdquo if ldquothe activity would not have been funded but for that objectiverdquo or as having a ldquosignificant objectiverdquo if the intervention was ldquoformulated or adjusted to help meet climate concernsrdquo (OECD 2011 IEG 2012)
75 The typology of activities with climate co-benefits by World Bank sector can be consulted at the Worldbankorg website
76 For more information see also World Bank website at httpclimatechangeworldbankorgcontenttracking-finance
The biggest knowledge gap in adaptation financing is the role of the private sector Businesses house-holds and other private groups have a vested interest in engaging in climate initiatives particularly when climate change may directly affect their main sources of revenue The private sectorrsquos financial support can take the form of investments aimed at climate-proofing businesses and assets77 corporate social responsibility initiatives as well as philanthropic contribution
Geographical distribution of climate financeThe Landscape 2012 strives to unveil additional informa-tion on domestic climate finance flows This is reflected in the private flows categorization and the expanded coverage of Development Finance Institutionsrsquo climate expenditures
We find that USD 193 billion of global climate finance or 53 goes to projects in developed countries Some notable sources include the following
bull USD 62 billion comes from corporate actors (including a significant portion of small-scale renewable investment)
bull USD 58 billion comes from project developers
bull USD 24 billion comes from commercial financial banks (reflecting higher recourse to project-level debt financing) and
bull USD 24 billion comes from German and Italian households (investing in solar PV)
In developed countries the largest contributors are private actors (89)
We also find that USD 171 billion of global climate finance goes to projects in developing countries Some notable sources include the following
bull USD 70 billion comes from Development Finance Institutions
bull USD 65 billion comes from (mostly domestic) project developers
77 The UNFCCC maintains a database of private sector action on adaptation (PSI) Activities may encompass those aimed to ensuring the resilience of business operations or the supply of technologiesservices in support of vulnerable communities The PSI is a voluntary initiative intended to raise awareness about climate change adaptation in the private sector It also responds to the mandate given to the secretariat by the Parties of the Convention to engage stakeholders in enhancing the response to climate change Financial aspects related to the various cases presented is not readily available or whether specified not verified by the UNFCCC secretariat For additional information see UNFCCCint
56
The Landscape of Climate Finance 2012
57
The Landscape of Climate Finance 2012December 2012 December 2012
Box 12 - How is Germany financing its energy transition Financing the Energiewende
The private sector is proving pivotal in financing the German energy transition In 2010 the private sector financed contributed more than 95 of total climate finance invested in the country providing USD 478 billion
Germany plays a central role in European decarbonization The government has set ambitious climate and energy targets to reduce emissions 80-95 below 1990 levels by 2050 (Energy Concept 2010) while phasing-out nuclear energy by 2022 (2011 Energy Transition Energiewende)
In 2010 at least USD 491 billion (15 of GDP) was invested to support the German transition to a low-carbon economy (CPI 2012)
The private sector provided more than 95 of climate finance in Germany almost half of which was supported by concessionary loans from development banks Thus the public sector played an important role in supporting private investment The bulk of private money came from corporate investors (USD 292 billion) led by corporations in the energy sector Private households invested a significant USD 186 billion
Besides the concessionary loans the high share of private investment coincided with other incentives such as the Feed-in Tariff In 2010 the Feed-in tariff paid to households and corporate renewable energy generators amounted to approximately USD 174 billion equivalent to 49 of the actual total capital investment in renewable energy in that the same year This underlines the importance of the FiT in influencing renewable energy investorsrsquo decisions
The federal-level development banks KfW and Rentenbank provided at least USD 219 billion of concessional loans for climate-specific investments which represented a 43 share of total capital investment in renewable energy and 72 of total incremental investment in energy efficiency1 The significant role of concessionary loans highlights the importance of public finance instruments beyond just direct subsidies and grants
Renewable energy generation capital investments in buildings energy utilities agriculture and industry amounted to USD 353 billion Corporations across sectors invested USD 216 billion while private households invested a significant USD 131 billion in the building sector renewable energy capacity Energy efficiency amounted to USD 96 billion of incremental investment the householdsrsquo share of which was USD 54 billion (57) Investments in efficient buildings accounted for the largest share of energy efficiency investment with USD 77 billion
Is Germany on track Whether or not climate-specific finance in Germany was sufficient in 2010 to meet Germanyrsquos climate and energy targets is difficult to answer No comprehensive estimate is available for the total investment required for reaching these targets However CPI Report (2012) assessment of the distribution of climate finance across different uses provides a basis for focusing subsequent in-depth analysis on this regard
Prepared by Rodney Boyd (CPI Berlin rodneyboydcpiberlinorg)
Based on ldquoThe Landscape of Climate Finance in Germanyrdquo CPI (2012)
1 Please note the referenced study reports figures for total capital investments for renewable energy and incremental investments for energy efficiency
58
The Landscape of Climate Finance 2012
59
The Landscape of Climate Finance 2012December 2012 December 2012
Box 13 - Geographical distribution of public climate financeThe Figure 4 presents the geographical distribution of countriesrsquo bilateral aid including Fast-Start financing and DFIsrsquo money This graph highlights that with approximately USD 389 billion ndash 47 of total public finance ndash emerging giants like China and Brazil were the largest recipients of climate finance flows Notably this reflects the weight of the China Development Bank and Brazilrsquos BNDES in delivering domestic money in pursuit of development mandates In fact 333 of Development Finance Institutionsrsquo finance goes to China while 179 goes to Brazil
The governmentsrsquo budgets breakdown does not include the estimated portion of public funds tracked from project finance reporting from the BNEF database about USD 11 billion as the detailed split per country could not be retrieved We can however infer that 64-72 of that pertains to developed countries ndash mainly the US and Germany
ndash while the remaining 28-36 to developing countries mainly in Asia The allocation of bilateral aid per recipient countries was retrieved from the OECD CRS data set (OECD 2012)
With regard to DFIs the breakdown of their climate finance by beneficiary country reflects institutionsrsquo self-reporting against the geographic categories provided in the financial survey When respondents provided different sectoral breakdowns data were allocated against the selected macro-areas categories1
To estimate the breakdown by recipients countries for those DFIsrsquo we did not have detailed data for we used ndash depending on the institutiongroup of institutions considered ndash the information presented in the following Ecofys-IDFC (2012) UNEP-SEI (2011) and entitiesrsquo annual reports In some cases we applied the average share observed in other DFIs In particular we assumed that the China Development Bank ndash which accounts for the largest single share of NFIsrsquo climate finance ndash invested domestically (see also Ecofys-IDFC 2012)
1 For instance one respondent provided finance allocated for macro-regions such as ldquoEast Asia amp Pacificrdquo and ldquoSouth Asia Regionrdquo according to their tracking procedures In this case all money was allocated to our ldquoOther Asiardquo category
Figure 4 Geographical distribution of government budgets and Development Finance Institutionsrsquo climate financing
CHINA
BRAZIL
OTHER ASIAOTHER LAC
EUROPEOTHER AFRICA
INDIA
OTHERS
MENA
C AMERICA
S AFRICA
OCEANIA
N AMERICA
0
10
20
30
Note Government budgets data refers to OECD DAC money only (OECD 2012) Data do not include the estimated portion of public funds tracked from project finance reporting in the BNEF database for about UDS 11 billion The category ldquoothersrdquo refers to bilateral contributions whose recipients were not specifid or money distributed to transnationaltransregional projects
bull USD 13 billion comes from corporate actors
bull USD 12 billion comes from commercial financial banks
Compared to developed countries climate projects in developing countries rely more on balance sheet financing and instruments from development banks
The share of private sector contributions to climate finance in developing countries is around 57
58
The Landscape of Climate Finance 2012
59
The Landscape of Climate Finance 2012December 2012 December 2012
Box 14 - Financing Renewable Energy Generation and Energy Efficiency in China
Chinarsquos ambition to shift to a greener economy is reflected in the significant investments made in the renewable energy and energy efficiency sectors over the past few years
In terms of gross investment in renewable energy China has led the world for the past three years as gross investment in renewable energy increased 51 from USD 337 billion in 2009 to USD 51 billion in 2011 In 2011 877 of the total investment was devoted to wind power and solar PV which reached 624 GW (about 25 of worldrsquos capacity) and 31 GW (44 of the global market1) accumulated installed capacity respectively
With USD 396 billion or 886 of the total asset financing was the primary method of supporting wind and solar PV projects This is typically arranged with an 8020 debt to equity ratio in the case of wind where developers are requested by law to take at minimum a 20 equity stake and borrow the remaining from state-owned or policy-related banks The ratio is different for distributive PV projects where developers take equity stakes for 30 borrow 20 from banks and get the remaining 50 in the form of grants under the ldquoGolden Sun demonstrationrdquo and the Building-integrated PV (BIPV) subsidy programs introduced in 20092
State-owned enterprises (SOEs)3 are the major developers in both the wind and solar PV markets accounting for 799 and 61 of total installed capacities respectively SOEs have privileged access to credit from financial institutions thanks to their long-established relationship with state-owned banks
1 The National Development and Reform Commission has revised the 12th Five Year Plan solar PV target from 15 GW to 21 GW by the end of 2015 in order to boost the domestic solar PV market and to absorb the excess supply due to US anti-dumping and anti-subsidy tariffs On Oct24 2012 the Information Office of the State Council published the 2012 edition of white paper on Chinarsquos Energy Policy which claimed that Chinarsquos installed generating capacity of solar energy was expected to exceed 21GW by 2015
2 The BIPV subsidy program provides upfront subsidies for grid-connected rooftop and BIPV systems 3 SOEs include national provincial and municipal level state-owned enterprises and their subsidiariesspinoffs
bull State-backed enterprises shape the current outlook of Chinarsquos solar PV and wind power generation
bull China invested a sum of USD 142 billion to improve energy efficiency over the 11th Five-Year Plan (2006 to 2010) Private finance accounted for 83 of that total
Figure 5 Sectoral breakdown of Chinarsquos energy efficiency investments
0
20
40
60
80
INDUSTRY BUILDING TRANSPORT
Perce
nt o
f tot
al
CAPACITY BUILDING
60
The Landscape of Climate Finance 2012
61
The Landscape of Climate Finance 2012December 2012 December 2012
and their solid balance sheets which can serve as loan guarantees
China was also a leader in investment in the energy efficiency sector Investment in energy efficiency was driven by the mandatory targets set in the 11th Five-Year Plan (FYP) to reduce national energy intensity by 20 from 2005 levels by 2010 Over the course of the Plan (2006-2010) Chinarsquos energy efficiency investment reached a cumulative amount of USD 120 billion
Private finance represented the lionrsquos share of total energy efficiency finance 79 of the total USD 120 billion invested corporations provided USD 533 billion households contributed USD 19 billion commercial banks provided USD 38 billion and the stock market raised USD 16 billion Private funding was raised in the form of direct equity and debt investments
Public money contributed USD 229 billion (191) The central government supported energy efficiency programs in the industrial building and transport sectors with USD 152 billion (127) in the form of direct investment subsidies rewards transfer payments government procurements and concessional loans Provincial and lower-level governments provided USD 77 billion (64) as local supplements to support activities in their jurisdictions International institutions and international carbon market contributed additional USD 23 billion (19)
The industrial sector attracted the greatest share of money 89 or USD 107 billion to undergo energy audits technology upgrades facility retrofitting and closure of outdated plants
Energy efficiency investment in the 11th FYP surpassed the amount invested in any previous FYPs The vast scale of investment was critical to Chinarsquos energy target achievement in the 11th FYP period On average the ratio of public funding to ldquoprivate investmentrdquo was 1 to 423 This leverage effect should however be interpreted by keeping in mind that there are governmental resources ldquositting-behindrdquo private investments
Prepared by Dong Wenjuan and Yu Yuqing (CPI Beijing dongwenjuancpibeijingorg yuyuqingcpibeijingorg)
Based on forthcoming ldquoAnnual Review of Low-Carbon Development in China (2013)rdquo CPI Report
60
The Landscape of Climate Finance 2012
61
The Landscape of Climate Finance 2012December 2012 December 2012
4 Conclusions and the way forwardA comprehensive picture of todayrsquos climate finance flows will improve our collective understanding not only about how much and what type of finance is provided to promote low-carbon climate-resilient development but how the world stands in relation to global finance and temperature goals With a comprehensive picture we can begin to identify how different types of support cor-respond to different needs and whether resources are being spent productively This understanding is critical to highlight emerging trends and position policy makers and investors to respond to the challenges effectively
The Landscape 2012 builds and improves upon CPIrsquos initial effort to provide a snapshot of the current climate finance landscape Our methodology draws on a wide variety of tracking initiatives and information systems to estimate the possible scale of available finance This study highlights that there is not one single climate finance story climate finance archetypes differ by country and circumstance In addition a number of actors have distinctive responsibilities Public and private intermediaries continue to play a pivotal role in distributing climate finance National banks are playing a growing role in channeling resources Private com-mercial banks and infrastructure funds are also critical players they intermediate both project finance debt and direct investments In addition better information about private finance flows highlights the various private sector representatives that are active in climate invest-ments on the primary investment and lending sides mdash including institutional investors albeit to a small extent mdash and clean technology manufacturers engaged in vendor financing
The Landscape 2012 suggests that annual global climate finance flows reach between USD 343 - 385 billion in 2010-2011 or USD 364 billion on average Although close to 75 of this comes from private sources the public sector plays a pivotal role by providing funds that catalyze private sector investment These figures shed light on global efforts to match the global financing need Overall while money is clearly flowing to low-car-bon climate-resilient development investment levels fall far short of that required to limit global temperature rise to below two degrees Celsius The International Energy Agency projects that incremental investment in the energy sector will need to reach USD 36 trillion over the period of 2012-2050 ndash or approximately USD 1 tril-lion each year (IEA 2012) This estimate highlights just
how much more finance is required to fund the transi-tion toward a low-carbon climate resilient future
The amounts represented in the Landscape 2012 reflect better data and increased coverage The Landscape 2012 aimed to address some of the major information gaps identified in the Landscape 2011 Building upon the Landscape 2011 the Landscape 2012 better captures the magnitude and nature of climate finance flows between and within countries We expanded the geographic scope covered more types of actors and collected better information about the recipients of finance Most importantly by untangling private sector flows we have improved our understand-ing about the actual sources of money where it is going and through which financial instruments This has been particularly true in the case of domestic flows
Nonetheless there is room for improvement Reporting gaps and inconsistent labels and definitions hamper our ability to track and fully capture the scale and effective-ness of climate finance Climate Policy Initiative will con-tinue to build and improve upon this understanding in future Landscapes and through other ongoing efforts78
Emerging key issuesThis study confirms and elaborates upon several find-ings from the Landscape 2011
Private capital is essential and makes up the lionrsquos share of global climate investment flows
Public resources alone cannot finance the transition to a low-carbon climate-resilient future unlocking private sector capital will be essential The Landscape
78 To unlock sufficient climate finance for a low-carbon climate-resilient transition it is essential to increase climate finance effectiveness based on the optimal balance between public and private capital To shed light on how to do this CPI in collaboration with the World Bank Group CLP and the OECD established the San Giorgio Group a new working group of key financial intermediaries and institutions actively engaged in green low-emissions finance The core objective of the Group is to analyze how to mobilize and deploy adequate and effective finance to achieve low-carbon climate-resilient development To address the weak understanding of climate finance effectiveness CPI has initiated within the San Giorgio Group a work stream on concrete case studies to build up knowledge on elements that make investments successful from a financial environmen-tal organizational and political perspective By building up an evidence base what works and what doesnrsquot the goals is to learn from the wide range of existing and evolving financing practices to provide insights on how to scale up climate finance and spend available resources more wisely For more information see httpclimatepolicyinitiativeorgvenicesan-giorgio-group
62
The Landscape of Climate Finance 2012
63
The Landscape of Climate Finance 2012December 2012 December 2012
2012 highlights the relationship between public and private sources and suggests that a major portion of private investment relies on public finance to create an environment where investments are viable There is a clear incidence of public money standing behind private investments particularly in the emerging economies of China and Brazil
Well-targeted public capital can make investments go further
Well-targeted public resources are an essential element of transformational climate investment structures Most public money (almost 80) is currently delivered through national bilateral and multilateral organiza-tions While public institutions generally take the risk for money channeled through these organizations the money itself can be largely raised from private sources Our findings suggest a number of best practices are emerging in developing and developed countries where well-targeted public capital is starting to unlock
significant investment The Landscape 2012 also shows that bilateral public funding increased despite fiscal austerity and tightening credit context likely reflecting the impact of fast-start finance pledges
Looking forward public money remains essential but given its scarcity we need to understand its role (ie which risks should reside with the public sector and which should reside with the private sector and how the scale of these risks depends on the nature of the investments) to spend available resources wisely Public funds especially international public money should only pay for those risks the private or national public investments will not bear and the scale of these publicly offloaded or assumed risks depend on the nature of the investment
Domestic finance is a key element
Our findings underline the importance of domestic finance in addressing the global challenge of climate change The Landscape 2012 highlights that a large
Box 15 ndash Tracking issues
Many organizations maintain databases andor prepare reports about particular elements of the climate finance landscape However there is no integrated international system for storing this data many flows are not systematically measured reported or verified and where tracking efforts are in place granularity and consistency varies (cf Buchner et al 2011) This hampers efforts to compare and aggregate data and assess the effectiveness of finance
As the sources and volumes of climate finance increase the challenge to track and analyze flows will become greater While many organizations are working to improve these systems a number of areas require urgent attention
bull Transparency and consistency in definitions - what is counted and reported as climate finance including sectoral boundaries and whether total project value or only relevant portions of investments are counted
bull A clearer distinction between incremental costs and investment capital
bull Related to this a better understanding of how incremental support and specialized risk instruments stimulate investment and
bull Improved information about domestic and private flows of finance Most clean development investment will need to come from national private sources but data remains scarce
Based on ldquo The Landscape of Climate Financerdquo CPI Report (2011)
Many organizations are engaged in efforts to track aspects of the climate finance picture but several gaps remain
These gaps hamper efforts to compare and aggregate data and assess the overarching effectiveness of finance
62
The Landscape of Climate Finance 2012
63
The Landscape of Climate Finance 2012December 2012 December 2012
proportion of public investment reflected domestic gov-ernment support toward structural changes in energy systems as engines of economic growth Further infor-mation on private finance shows that domestic private actors play a key role
Emerging economies play a key role
Roughly one third of global mitigation investments are located in China Brazil and India Further a significant share of investment in these three countries is raised domestically and disbursed by state-owned entities in pursuit of development mandates We hope that these leaders signal a trend among other developing countries toward low-emissions climate-resilient growth as a practical and productive national development strategy
Understanding about adaptation finance is still scarce
While the large majority of climate finance is still used for mitigation measures we have been able to capture more money that is beginning to be invested in adapta-tion activities This reflects new tracking initiatives that specifically address the information gap on adaptation finance However data inconsistencies and the difficul-ties in defining what constitutes adaptation finance (and where the boundaries between adaptation and develop-ment finance are) hamper our understanding
Next steps for data gathering and analysisTo improve the worldrsquos understanding of climate finance and to put current climate finance flows in per-spective the following key issues need to be addressed
Comprehensiveness mdash further expansion of scope and coverage
This study emphasizes the relative importance of private finance Further information on private finance is needed particularly related to non-project level entry points for finance to better understand corporate sources of capital for balance sheet financing
The Landscape 2012 also confirms the essential role of a number of actors including international national and local financial institutions and households Additional detail on these institutionsrsquo financing including infor-mation about the new methodology that Multilateral Development Banks79 are developing for tracking and
79 Including the African Development Bank (AfDB) the Asian Development Bank (ADB) the European Bank for Reconstruction and Development (EBRD) the European Investment Bank (EIB) the Inter-American Develop-ment Bank (IDB) the World Bank (WB) and the International Finance Corporation (IFC)
accounting mitigation and adaptation finance will improve our understanding of their role in climate finance We also need better information on domestic-level finance and on financing channels for households A better overview of climate funds particularly national ones would further improve the comprehensiveness of the climate finance landscape
Finally better information on the role of specific sectors (such as energy efficiency and non-energy sectors) and uses (such as adaptation and enabling environment finance) and better mapping of specific instruments (such as tax incentives) is needed
The dimensions of climate finance mdash clarify net climate finance flows
The Landscape 2012 takes both incremental costs and investment capital into account It focuses on gross flows due to the difficulty of calculating incremental cost and net values of all finance flows due to the importance of understanding the full volume of finan-cial flows delivered Gross flows also tell a story about upfront support that is needed to encourage further investments Ultimately it is instructive to understand net contributions by countries and actors and to obtain a good understanding of incremental costs compared with business-as-usual or ldquobrownrdquo investments This is particularly important to understand how global efforts are tracking against the financing levels needed to stabilize average global temperature below two degrees Celsius Proxies are necessary to better understand these dimensions In this context the role of risk mitiga-tion and policy instruments in addressing incremental costs warrant further work
The impact mdash increase understanding of climate finance effectiveness
The biggest gap in todayrsquos climate finance landscape remains the lack of a sound understanding about whether finance flows are being used effectively and whether they adequately address the challenges posed by climate change and global needs We need more efforts to define and describe what constitutes effective climate finance starting with lessons from the important experiences of organizations already working to measure the impact of climate finance In fact a number of countries and DFIs are now actively developing frameworks to measure and evaluate the performance of the climate finance they are providing delivering andor receiving (Buchner et al 2012) fos-tering more streamlined reporting frameworks
64
The Landscape of Climate Finance 2012
65
The Landscape of Climate Finance 2012December 2012 December 2012
More rigorous monitoring and reporting can aid learn-ing planning and budgeting at the country level and thus drive effectiveness improvements However more than just tracking will be required analysis of policy effectiveness will also be critical In addition to CPIrsquos effort to build up an evidence-based bottom-up database of success and failure stories related to climate finance (the San Giorgio Group case studies)80 there is a need to explore how effectiveness can also be ascribed to the climate finance landscape Possibilities include the calculationindication of expected avoided carbon emissions carbon cost per unit and co-impacts A further option to increase the understanding about the effectiveness of climate finance is to relate public money contributions to estimates of incremental costs Finally disbursement channels are also key for effective climate finance spending and more information on this element could improve the understanding of climate finance effectiveness
The benchmark mdash exploration of business-as-usual (ldquobrownrdquo) finance flows
To put climate finance estimates into perspective com-parable estimates of traditional ldquobrownrdquo or business-as-usual finance are a useful benchmark to check whether there is real progress towards a low-carbon climate-resilient future
CPI remains committed to improving the understanding and transparency of todayrsquos climate finance landscape
80 Within the San Giorgio Group CPI works on concrete case studies to build up knowledge on elements that make investments successful from a financial environmental organizational and political perspective We aim to provide credible information on how to ramp up public expenditures integrate national and international capital streams leverage public funds with private flows efficiently and invest the aggregate wisely For more information see httpclimatepolicyinitiativeorgpublicationsan-giorgio-group-case-studies
64
The Landscape of Climate Finance 2012
65
The Landscape of Climate Finance 2012December 2012 December 2012
Index of acronyms AAU Assigned Amount UnitAsDB Asian Development BankAF Adaptation FundAFD Agence Franccedilaise de DeacuteveloppementAfDB African Development BankAGF High-Level Advisory Group on Climate Change FinancingBFI Bilateral Finance Institution BIPV Building Integrated PhotovoltaicBNDES Brazilian Development BankBNEF Bloomberg New Energy FinanceCAF Development Bank of Latin America CDB China Development BankCDC Caisse des DeacutepocirctsCDM Clean Development Mechanisms CEA California Environmental AssociationCER Certified Emissions Reductions CIF Climate Investment Funds CRS Creditor Reporting SystemDAC Development Assistance Committee DBSA Development Bank of Southern AfricaDFI Development Finance InstitutionsEBRD European Bank for Reconstruction and Development ECA Export Credit Agency EDF Environmental Defense FundEEA European Energy AgencyEEC European Economic CommunityEIB European Investment BankEU European UnionEU ETS European Union Emissions Trading SystemFDI Foreign Direct Investment FiT Feed-in TariffFYP Chinarsquos Five-Year PlanGEF Global Environmental Facility GHG Greenhouse Gas Emissions IBRD International Bank for Reconstruction and Development ICI International Climate InitiativeIDA International Development Association IDB Inter-American Development BankIEA International Energy AgencyIFC International Finance CorporationIFCI International Forest Carbon InitiativeIGES Institute for Global Environmental StrategiesIIED International Institute for Environment and DevelopmentIREDA Indian Renewable Energy Development AgencyJI Joint Implementation JICA Japan International Cooperation AgencyJVETS Japan Voluntary Emissions Trading SchemeKFW KFW Entwicklungsbank (German Development Bank)MDB Multilateral Development BankMFI Multilateral Finance InstitutionNAFIN Nacional Financiera Development Bank
NDF Nordic Development Fund NFI National Finance InstitutionODA Official Development Assistance ODI Overseas Development InstituteOECD Organization for Economic Co-operation and DevelopmentOPIC Overseas Private Investment CorporationOTC Over-the-CounterREDD Reducing Emissions from Deforestation and Forest
DegradationREN21 Renewable Energy Policy Network for the 21st Century RGGI Regional Greenhouse Gas InitiativeSOE State-Owned Enterprise including national provincial
and municipal level state-owned enterprises and their subsidiariesspinoffs
TNC The Nature ConservancyUNDP United Nations Development Programme UNEP United Nations Environment ProgrammeUNEP-Risoslash United Nations Environment Programme Risoslash Centre on
Energy Environment and Sustainable DevelopmentUNFCCC United Nations Framework Convention on Climate ChangeVER Voluntary Emissions ReductionsWB World Bank
66
The Landscape of Climate Finance 2012
67
The Landscape of Climate Finance 2012December 2012 December 2012
GlossaryCRS
The Creditor Reporting System is a database of individual aid activities which contains detailed quantitative and descrip-tive data on individual aid projects and programs It enables analysis of the sectoral and geographical breakdown of aid for selected years and donors
DAC
The Development Assistance Committee is the committee of the OECD which deals with development co-operation matters At present there are 24 members of the DAC Australia Austria Belgium Canada Denmark Finland France Germany Greece Italy Ireland Japan Korea Luxembourg the Netherlands New Zealand Norway Portugal Spain Sweden Switzerland the United Kingdom the United States and the European Commission
EXPORT CREDITExport credits are government financial support direct financing guarantees insurance or interest rate support provided to foreign buyers to assist in the financing of the purchase of goods from national exporters (OECD 2012d)
FAST-START FINANCE
The Copenhagen Accord obliges developed countries to collectively provide fast-start finance to developing countries in the amount ldquoapproaching USD 30 billion for the period 2010-2012rdquo for enhanced action on mitigation (including Reducing Emissions from Deforestation and forest Degradation REDD) adaptation technology development and transfer and capacity building
GRANT Transfers made in capital goods or services for which no repayment is required
INCREMENTAL COST AND
INVESTMENT CAPITAL
Incremental cost and investment capital are both important lenses for climate finance flows Incremental cost refers to financial resources provided to compensate the difference between a less costly more polluting option and a costlier more environmentally friendly andor climate-resilient one Investment capital refers to tangible investment in mitigation or adaptation projects Whereas investment capital is paid back to the investor incremental costs often are not and are often funded by public climate finance support either through policy support or concessional finance
INFRASTRUCTURE FUND
ldquoFunds focused on making direct financial investments in projects across the following sectors power (renewables coal-fired gas turbine and nuclear) water (treatment and distribution) transportation (airports ports roads parking lots and rail links) social (prisons hospitals and schools) and utilities (gas distribution electricity transmission fixed-line telephone and mobile telephone)rdquo (PFI Global Infrastructure Report 2007 ldquoThe rise of infra fundsrdquo retrieved from httpcrgpstanfordedupublicationsarticles_presentationsOrr_01_Infra_funds_2007pfiepdf)
JOINT IMPLEMENTATION
(JI)
Track 1 JI Simplified approval process for JI projects where the host Party is considered to fulfill all the eligibility require-ments of the Kyoto Protocol on emission reportingTrack 2 JI Parties that have not met the Kyoto Protocol requirements on emission reporting can carry out JI projects under a more rigorous approval regime
ODA
Official Development Assistance is defined as those flows to developing countries (countries and territories on the DAC List of ODA Recipients) and to multilateral agencies in the form of grants or loans which are provided by the official sec-tor aimed to promote economic development and welfare given at concessional financial terms (if a loan having a grant element of at least 25) In addition to financial flows technical co-operation is included in aid
PRIVATE EQUITYldquoPrivate equity invests in private companies (hellip) to distinguish it from lsquopublic equityrsquo investments in stock markets (hellip) Private equity funds acquire established companies in old industries with the aim of reviving their fortunes (hellip) Private equity funds come in all shapes and sizesrdquo (EVCA website httpevcaeuwhat-is-private-equity)
REDD+REDD+ goes beyond deforestation and forest degradation and includes the role of conservation sustainable management of forests and enhancement of forest carbon stocks
66
The Landscape of Climate Finance 2012
67
The Landscape of Climate Finance 2012December 2012 December 2012
RIO MARKERS(RMS)
The Rio Markers (RMs) are indicators of the degree of relevance of a given activity in addressing the objectives of the three ldquoRio Conventionsrdquo (the United Nations Convention on Biological Diversity (CBD) the United Nations Framework Convention on Climate Change (UNFCCC) and the UNCCD) The screening of an activity against the objectives of a Convention will result in the following scores0 (not targeted) means that the activity is found not to be targeted to the Convention1 (significant) means that targeting the objectives of the Convention is an important but secondary purpose of the activity (ie not one of the principal reasons for undertaking the activity)2 (principal) means that targeting the objectives of the Convention is an explicit objective of the activity and fundamental in its design (ie the activity would not have been undertaken without this objective)3 (Action ProgrammeAP-related) for desertification only It means that the activity was undertaken to combat desertifi-cationland degradation as a principal objective and in support of an action programme (NAP SRAP or RAP) to implement the UNCCD
VENTURE CAPITALldquoVenture capital is a type of private equity focused on start-up companies Venture capital funds often back entrepreneurs who have just the germ of a business ideardquo (EVCA website httpevcaeuwhat-is-private-equity)
68
The Landscape of Climate Finance 2012
69
The Landscape of Climate Finance 2012December 2012 December 2012
ReferencesAgence Franccedilaise de Developpement (AFD) (2011)
ldquoResults and Lessons Learned from AFDrsquos Opera-tions in the fight Against Climate Change from 2005 to 2010rdquo Paris France
Agence Franccedilaise de Developpement (AFD) (2012) ldquoLrsquoactivite Financiegravere du Groupe AFD Dans la Lutte Contre le Changement Climatique Resultats pour 2011rdquo Paris France
Agence Franccedilaise de Developpement (AFD) (2012) ldquoScreening Tool For Classification of laquo Adaptation raquo Projects From The AFD Grouprdquo Paris France
AGF (UN Advisory Group on Climate Change Financ-ing) (2010) ldquoReport of the Secretary-Generalrsquos High-level Advisory Group on Climate Change Financingrdquo New York United States United Nations
Asian Development Bank (ADB) (2012) ldquoAnnual Report 2011rdquo Manila Philippines
Atteridge A C Kehler Siebert R J T Klein C Butler and P Tella ldquoBilateral Finance Institutions and Climate Change A Mapping of Climate Portfoliosrdquo prepared by the Stockholm Environment Institute for the Climate Change Working Group for Bilat-eral Finance Institutions November 2009
Banco Estado (2012) ldquoAnnual Report 2011rdquo Chile
Bloomberg New Energy Finance (2011) ldquoThe Past and Future of Development Bank Finance to Clean Energy Projectsrdquo Clean energy Research Note April 2011
Bloomberg New Energy Finance (2012a) ldquoVital Sta-tistics of Development Bank Funding for Broad Clean Energyrdquo Louw A July 2012 London United Kingdom
Bloomberg New Energy Finance (2012b) ldquoMemo to Policy Makers Re-charge the Development Banksrdquo Monthly VIP Comment Monthly Clean Energy Comment for Senior Executives McCrone A Volume V Issue 60 April 2012
BNDES (2012) ldquoAnnual Report 2011rdquo available at httpwwwbndesgovbrSiteBNDESexportsitesdefaultbndes_ptGaleriasArquivosempresaRelAnualra2011relatorio_anual2011_trilinguepdf
BNDES (2012b) Personal Communications and direct reporting April-August 2012
Buchner B Brown L Corfee-Morlot J (2011) ldquoMoni-toring and Tracking Long-Term Finance to Support Climate Actionrdquo OECD COMENVEPOCIEASLT(2011)3
Buchner B Falconer A Herve-Mignucci M Trabacchi C Brinkman M (2011) ldquoThe Landscape of Climate Financerdquo CPI Report October 2011
Buchner B A Falconer C Trabacchi and J Wilkinson (2012) A Survey of Systems to Monitor and Evalu-ate Climate Finance Effectiveness A CPI Report July 2012
Buchner B J Brown and J Corfee-Morlot (2011) ldquoMonitoring and Tracking Long-Term Finance to Support Climate Action httpwwwoecdorgenvironmentclimatechange48073739pdf
Caijing News (2012) ldquoChinarsquos Photovoltaic Industry on Brink of Bankruptcy Reportrdquo httpenglishcaijingcomcn2012-08-08111998243html accessed online at 2012-09-06
CEA (2007) ldquoDesign to Win Philanthropyrsquos Role in the Fight against Global Warmingrdquo California Environ-mental Associates San Francisco August 2007 available at httpwwwclimateactionprojectcomdocsDesign_to_Win_8_01_07pdf
CEC (2011) ldquoLa taxe carbone de la theorie agrave la pra-tique Les problematiques liees agrave lrsquoinstauration drsquoune taxe carbonerdquo Chaire Economie du Climat Universite Paris-Dauphine CDC Climate FLM No 20 February 2011 available at httpwwwchaireeconomieduclimatorgwp-contentuploads20110211-02-12-FLM-n20-Elbeze-De-Perthuispdf
China Development Bank (CDB) ldquoAnnual Report 2011rdquo available at httpwwwjicagojpenglishpublica-tionsreportsannual2011indexhtml
China-Denmark Wind Energy Development ProjectChina Renewable Energy Association 2009 ldquoChina Wind Energy and Electricity Tariff Develop-ment Reportrdquo
Clapp C J Ellis J Benn and J Corfee-Morlot (2012) ldquoTracking Climate Finance What and Howrdquo 04-May-2012COMENVEPOCIEASLT(2012) Paris France OECD httpwwwoecdorgenvi-ronmentclimatechange50293494pdf
Climate Commission (2012) ldquoThe Critical Decade International Action on Climate Changerdquo Flan-nery T R Beale and G Hueston Commonwealth
68
The Landscape of Climate Finance 2012
69
The Landscape of Climate Finance 2012December 2012 December 2012
of Australia (Department of Climate Change and Energy Efficiency) 2012
Corfee-Morlot J Guay B and Larsen KM (2009) ldquoFinancing for Climate Change Mitigation Towards a Framework for Measurement Reporting and Verificationrdquo OECDIEA Information Paper Paris October 2009
CPI (2010) The State of International Climate Finance Is it Adequate and is it Productive Climate Policy Initiative Venice available at httpclimatepolicyinitiativeorgpublicationthe-state-of-international-climate-finance-is-it-adequate-and-is-it-productive
CPI (2011) Inaugural Meeting of the San Giorgio Group Expanding Green Low-Emissions Finance ldquoProposed Analytical Program to Support Green Low-Emissions Financerdquo Island of San Giorgio Maggiore Venice Italy October 2010
CPI (2012) ldquoThe Landscape of Climate Finance in Germanyrdquo I Juergens H Amecke R Boyd B Buchner A Novikova A Rosenberg K Stelmakh A Vasa CPI Report (forthcoming) CPI consulta-tion draft as of October 2012 available at httpclimatepolicyinitiativeorgberlin
CPI (2012b) ldquoSecond Annual San Giorgio Group Meeting Expanding Green Low-Emission Financerdquo httpclimatepolicyinitiativeorgveniceeventsecond-annual-san-giorgio-group-meeting-expanding-green-low-emissions-finance
CPI (2013) ldquoAnnual Review of Low-Carbon Develop-ment in China (2013)rdquo CPI Report (forthcoming)
Development Bank of Southern Africa (DBSA) (2012) ldquoAnnual Report 201011rdquo South Africa
Ecofys-IDFC (2012) ldquoMapping of Green Finance Deliv-ered by IDFC Members in 2011rdquo Houmlhne N Khosla S Fekete H Gilbert A
Elbeze J and C de Perthuis 2011 Twenty Years of Carbon Taxation in Europe some lessons learned Information and Debates Series No 9 April 2011 Chaire Economie di Climat
Environmental Grantmakers Association (EGA) 2012 Tracking the Field Volume 3 Exploring Environ-mental Grantmaking httpcymcdncomsiteswwwwingsweborgresourceresmgrfilesfinal_report_v3pdf
European Bank for Recontruction and Development (EBRD) Sustainable Energy Financing Facility
(SES) May 2012 available at httpwwwebrdcomdownloadsresearchfactsheetsseffpdf
European Commission (EC) (2011) ldquoProposal for a Council Directive Amending Directive 200396EC Restructuring The Community Framework for The Taxation of Energy Products and Electricityrdquo Brussels SEC(2011) 409 httpeceuropaeutax-ation_customsresourcesdocumentstaxationsec_2011_409_impact_assesment_part1_enpdf
Eurostat (2011) ldquoStatistic in Focus 672011rdquo Environ-ment and Energy httpeppeurostateceuropaeucacheITY_OFFPUBKS-SF-11-067ENKS-SF-11-067-ENPDF European Commission
Eurostat (2011b) Environmental Taxes httpeppeurostateceuropaeustatistics_explainedindexphpEnvironmental_taxes European Commission
Falconer A and G Frisari 2012 San Giorgio Group Case Study ldquoOuarzazate I CSPrdquo Climate Policy Initia-tive available at httpclimatepolicyinitiativeorgour-workpublications
Fransen T Stasio K S Nakhooda (2012) ldquoThe US Fast-Start Finance Contributionrdquo World Resource Institute Overseas Development Institute May 2012 Working Paper available at httpwwwodiorgukpublications6560-usa-america-fast-start-finance-unfccc-pledge
FS-UNEP and BNEF (2012) ldquoGlobal Trends in Renew-able Energy Investment 2012rdquo Frankfurt SchoolUNEP Collaborating Centre for Climate amp Sustain-able Energy Finance and Bloomberg New Energy Finance Available at httpfs-unep-centreorgpublicationsglobal-trends-renewable-energy-investment-2012
Gibbs D (2012) ldquoLessons Learnt from Fast‐Start Financerdquo Presentation at the First workshop on Long-term Finance UNFCCC July 2012 httpunfcccintfilescooperation_supportfinan-cial_mechanismlong-term_financeapplicationpdfgibbs11june2012pdf
Gomez-Echeverri L (2010) National Funding Entities Their Role in the Transition to a New Paradigm of Global Cooperation on Climate Change European Capacity Building Initiative httpwwweuroca-pacityorgdownloadsNFEsPolicyReportpdf
Inada K (2011) Presentation ldquoClimate Finance JICA Implications for the Green Climate Fundrdquo August 29 2011 Japan International Cooperation Agency (JICA) httpwwwdbsaorgConfrFCCWorkshop20Material2011208202920
70
The Landscape of Climate Finance 2012
71
The Landscape of Climate Finance 2012December 2012 December 2012
JICA20DBSA20Climate20Finance20(2)20[Compatibility20Mode]pdf
Independent Evaluation Group (IEG) World Bank IFC and MIGA Adapting to Climate Change Assess-ing the World Bank Group Experience Phase III of the World Bank Group and Climate Change Independent Evaluation Group Washington DC United States available at httpiegworldbank-grouporgcontentdamiegclimate_change3cc3_full_evalpdf
Indian Renewable Energy Development Agency (IREDA) ldquoAnnual Report 2010-2011rdquo
Inter-American Development Bank (IDB) African De-velopment Bank (AfDB) Asian Development Bank (ADB) European Bank for Reconstruction and Development (EBRD) European Investment Bank (EIB) World Bank (WB) International Finance Corporation (IFC) (2012) ldquoJoint MDB Report on Mitigation Finance 2011rdquo available at httpclimatechangeworldbankorgsitesdefaultfilesMMF_2011_version_21pdf
Inter-American Development Bank (IDB) (2011) ldquoMexico CTF Renewable Energy Financing Facility (CTF-REF)rdquo (ME-L1109 httpwwwclimateinvestmentfundsorgcifsitesclimatein-vestmentfundsorgfilesApproval20by20Mail20Mexico20Renewable20Energy20Program20Proposal20III20PIDpdf
International Development Finance Club (2012) ldquoWork Plan 2 Leverage Private and Public Funds Position Paper on Leverage of Public and Private Fundsrdquo IDFC 2012
International Energy Agency (IEA) (2012) ldquoWorld Energy Outlook 2012rdquo November 2012 Paris France
International Finance Corporation (IFC) (2012) ldquoMan-agementrsquos Discussion and Analysis and Con-solidated Financial Statementsrdquo June 30 2012 Washington DC United States
International Sustainability Unit (ISU) The Princes Charitiesrsquo (2012) ldquoInterim REDD+ Finance Current Status and Ways Forward for 2013-2020rdquo November 2012
Japan International Cooperation Agency (JICA) (2012) ldquoAnnual Report 2011rdquo
Japan International Cooperation Agency (JICA) (2012b) httpwwwjicagojppublicationspamphpdfreddpdf
Junghans L S Harmeling 2012 Different Tales from Different Countries A first assessment of the OECD ldquoAdaptation Markerrdquo Germanwatch httpgermanwatchorgdedownload6741pdf
KfW Bankengruppe Bank aus Verantwortung ldquoAnnual Report 2011rdquo and Exhibit (D) Germany available at httpwwwkfwdekfwenIIIDownload_CenterFinancial_PublicationsFinancial_publica-tions1_Geschaeftsberichte_E120706_006_RZ_KfW_GB11_EN_Webpdf
KfW Bankengruppe Bank aus Verantwortung ldquoFinancial Report 2011rdquo Germany
KfW Bankengruppe KfW Entwicklungsbank DEG ndash Deutsche Investitions- und Entwicklungsge-sellschaft mbH (2011) ldquoAdaptation to Climate Change Cooperation with Developing Countries ndash Climate and Developmentrdquo Frankfurt am Main Germany June 2011
Khan Hannan S M Doha S Haque S (2011) ldquoThe Ban-gladesh National Climate Funds A Brief History and Description of the Bangladesh Climate Change Trust Fundrdquo LDC paper series IIED and ECBI
Latt J (2011) ldquoMexico as an Emerging Donorrdquo EDC 2020 Policy Brief No18 March 2011
Marion V A Esch L Grieszlighaber F Fuller F Mers-mann F Fallasch L De Marez (2012) ldquoGerman Fast- Start Lessons Learned for Long-Term Financerdquo Climate Analytics Wuppertal Institute Germanwatch August 2012 httpwwwbmu-klimaschutzinitiativedefiles2012-German_FSF_Study_1076pdf
Michaelowa AMichaelowa K (2011) Coding Errors or Statistical Embellishment The Political Economy of Reporting Climate Aid In World Development Vol 39 No 11 2011 pp 2010ndash2020
Ministry of Economy Finance and Industry (Minefi) (2011) Ministry of Ecology Sustainable Develop-ment Transport and Housing Ministry of Foreign and European Affairs ldquoHow Francersquos Development Partnerships are Meeting the Challenge of Climate Change Fast-start implementation for 2011 Paris France
Nacional Financiera (2012) ldquoAnnual Report 2011rdquo Mexico
National Renewable Energy Laboratory (NREL) 2009 Carbon Taxes a Review of Experience and Policy Design Considerations Sumner J L Bird and H
70
The Landscape of Climate Finance 2012
71
The Landscape of Climate Finance 2012December 2012 December 2012
Smith Technical Report NRELTP-6A2-47312 December 2009
Nelson D G Shrimali G S Goel C Konda R Kumar (2012) ldquoMeeting Indiarsquos Renewable Energy Targets How Policy Can Help Overcome Financing Chal-lenges and Encourage Investmentrdquo CPI Report (forthcoming)
Nordic Development Fund (NDF) (2012) ldquoAnnual Report 2011rdquo Helsinki Finland
Oakes N Leggett M Cranford M Vickers H (eds) (2012) ldquoThe Little Forest Finance Bookrdquo Global Canopy Programme Oxford
OECD (2007) ldquoReporting Directive for the Creditor Reporting Systemrdquo DCDDAC(2007)39Final Organisation for Economic Co-operation and Development (OECD) Paris September 2007
OECD (2010) Statistics on Export Credits Trade and Agriculture Directorate (TAD) available at httpwwwoecdorgdepartment03355en_2649_34169_1_1_1_1_100html
OECD (2011) ldquoFirst-Ever Comprehensive Data on Aid For Climate Change Adaptationrdquo Organisation for Economic Co-operation and Development (OECD) November 2011 Paris available at httpwwwoecdorgdacaidstatistics49187939pdf
OECD (2011b) Creditor Reporting System _Full down-load file ldquoCRS 2009ziprdquo DAC Creditor Reporting System database httpstatsoecdorgIndex aspxDatasetCode=CRSNEW data down- loaded 5th April 2011
OECD (2012) Creditor Reporting System _Full down-load file ldquoCRS 2011ziprdquo DAC Creditor Reporting System database httpstatsoecdorgIndexaspxDatasetCode=CRSNEW version June 2012
OECD (2012b) Full list of climate change mitigation and climate change adaptation aid activities 2010 httpwwwoecdorgdacaidstatis-tics50089594xlsx
OECD (2012c) ldquoUnderstanding on Export Credits for Renewable Energy Climate Change Mitigation and Water Projects as new Annex IV available at httpsearchoecdorgofficialdocumentsdisplaydocumentpdfdoclanguage=enampcote=tadpg(2012)9
OECD (2012d) Glossary of Statistical Terms httpstatsoecdorgglossaryindexhtm
OECDEuropean Environment Agency Database on Instruments Used for Environmental Policy and Natural Resources Management httpwww2oecdorgecoinstqueriesindexhtm
Parker C J Brown J Pickering E Roynestad N Mardas A W Mitchell (2009) ldquoThe Little Climate Finance Bookrdquo Global Canopy Programme
Peters-Stanley M K Hamilton D Yin (2012) ldquoLeverag-ing the Landscape State of the Forest Carbon Markets 2012rdquo Ecosystem Marketplace
Pinheiro AC (2012) ldquoThe Role Of Concessionary Finance In Brazilrdquo CDE Insight June 2012
REN21 (2012) ldquoRenewables 2012 Global Status Reportrdquo at httpwwwren21netdefaultaspxtabid=5434
Republique Tunisienne Ministegravere du Developpement et de la Cooperation Internationale Institut National de La Statistique (INS) (2010) laquo Annuaire Statis-tique de La Tunisie 2005-2009rdquo December 2010
Ryan L Selmet N and Aarsud A (2012) ldquoPlugging the Energy Efficiency Gap with Climate Financerdquo IEA Insights Series 2012 OECDIEA Paris
Simula M (2010) ldquoAnalysis of REDD+ Financing Gaps and Overlapsrdquo Ardot available at httpreddplus-partnershiporg65563en
Smallridge D B Buchner C Trabacchi M Netto JJ Gomes L Serra (2012) ldquoThe Role of National Development Banks in Intermediating Interna-tional Climate Finance to Scale Up Private Sector Investmentsrdquo Inter-American Development Bank Working Paper 2012 (forthcoming)
Streck C and C Parker (2012) ldquoFinancing REDD+rdquo in Angelsen Arild Maria Brockhaus William D Sunderlin and Louis V Verchot 2012 Analysing REDD+ Challenges and choices httpwwwcifororgpublicationspdf_filesBooksBAngelsen1201pdf
Suennen R (2012) Contractual relationships between CMEs and CPAsrdquo Addis Ababa April 2012 KfW Bankengruppe Presentation available at httpaf-ricacarbonforumcom2012docsPresentationsd2_Training20Session202a_PoARainer20Suennenpdf
The Nature Conservancy (TNC) (2012) ldquoClimate Finance Readiness Lessons Learned in Developing Countriesrdquo J Gastelumndi The Nature Conser-vancy Available at httpwwweldisorggodisplayamptype=Documentampid=62706
72
The Landscape of Climate Finance 2012
73
The Landscape of Climate Finance 2012December 2012 December 2012
The World Bank (2011) ldquoAnnual Report 2011rdquo Washing-ton DC United States
Trabacchi C V Micale G Frisari (2012) San Giorgio Group Case Study ldquoPROSOL Tunisiardquo available at httpclimatepolicyinitiativeorgpublicationsan-giorgio-group-case-studies
UNDP (2011) ldquoBlending Climate Finance Through Na-tional Climate Funds A Guidebook for the Design and Establishment of National Funds to Achieve Climate Change Prioritiesrdquo United Nations Devel-opment Programme September 2011 httpwwwundporgcontentdamundplibraryEnviron-ment20and20EnergyClimate20ChangeCapacity20DevelopmentBlending_Climate_Finance_Through_National_Climate_Fundspdf
UNEP (2010) ldquoBilateral Finance Institutions amp Climate Change A Mapping of Public Financial Flows for Mitigation and Adaptation to Developing Countries in 2010rdquo United Nations Environment Programme Stockholm Environment Institute
UNFCCC (2010) ldquoCancun Agreementsldquo Art 71 available at httpunfcccintmeetingscancun_nov_2010items6005php
US PREF (2012) ldquoRamping up Renewables Leverag-ing State RPS Programs amid Uncertain Federal Supportrdquo US Partnership for Renewable Energy Finance White Paper authored by DB Climate Change Advisors (DBCCA) httpuspreforgwp-contentuploads201206Ramping-up-Renewables-Leveraging-State-RPS-Programs-amid-Uncertain-Federal-Support-US-PREF-White-Paper1pdf
Varadarajan U B Pierpont A Hobbs K Rowley (2012) ldquoSupporting Renewables while Saving Taxpayers Moneyrdquo CPI Report September 2012 available at httpclimatepolicyinitiativeorgwp-contentuploads201209Supporting-Renewables-while-Saving-Taxpayers-Moneypdf
Vieweg M Esch A Grieszlighaber L Fuller F Mersmann F Fallasch F De Marez L et al (2012) ldquoGerman Fast Start Finance Lessons Learned for Long-Term Financerdquo Climate Analytics Wuppertal Institute Germanwatch August 2012 available at httpwwwclimateanalyticsorgsitesdefaultfilesat-tachmentsnews2012-German_FSF_Studypdf
Visconti G M Netto JJ Gomes (2012) Presentation ldquoRole of National Development Banks in Promoting Climate Financerdquo Inter-American Development
Bank available at httpclimatepolicyinitiativeorgvenicefiles201209Viscontipdf
Vivid Economics (2012) ldquoCarbon taxation and Fiscal Consolidation the Potential of Carbon Pricing to Reduce Europersquos Fiscal Deficitsrdquo report prepared for the European Climate Foundation and Green Budget Europe May 2012
Vrana M and Cracknell J (2011) ldquoEnvironmental Funding by European Foundations A Snapshotrdquo Environmental Foundation Centre (ECF) Sep-tember 2011 available at httpwwwefcbeprogrammes_servicesresourcesDocumentsefc_environmental_finalpdf
World Bank (2012) ldquoState and Trends of the Carbon Markets 2012rdquo Washington DC May 2012
Weiss W and F Mauthner (2012) ldquoSolar Heat World-wide Markets and Contribution to the energy supply 2010 (edition 2012) at httpwwwiea-shcorgpublicationsdownloadsSolar_Heat_Worldwide-2012pdf
72
The Landscape of Climate Finance 2012
73
The Landscape of Climate Finance 2012December 2012 December 2012
WebsitesAfrican Development Bank (AfDB) website at http
wwwafdborgen
Agencia Financiera de Desarrollo (AfD) website at httpwwwafdgovpy
Asian Development Bank (AsDB) website at httpwwwadborg
Banco de Desarollo de America Latina Development Bank of Latin America (CAF) at httpwwwcafcomviewindexaspms=19
Banco Estado de Chile website at httpswwwban-coestadocl
Bancoldex Colombia website at httpwwwbancoldexcomportaldefaultaspx
Black Sea Trade amp Development Bank website at httpwwwbstdborg
Bloomberg New Energy Finance website at httpbnefcom
Brazilian Development Bank BNDES website at httpwwwbndesgovbrSiteBNDESbndesbndes_enInstitucionalPressNoticias201220120213_fun-doclimahtml
Caisse de Depot et de Gestion (CDG) httpwwwcdgma
China Development Bank (CDB) httpwwwcdbcomcnenglishindexasp
Climate Change Expert Group (CCXG) on the UNFCCC website at httpwwwoecdorgdocument4403746en_2649_34361_1904108_1_1_1_100html
Climate Investment Funds website at httpsclimatein-vestmentfundsorgcif
Development Bank of Southern Africa (DBSA) website at httpwwwdbsadrm-zacom
European Bank for Reconstruction and Development (EBRD) website at httpwwwebrdcompageshomepageshtmlamppanel1-2
European Bank for Reconstruction and Development (EBRD) Sustainable Energy Initiative (SEI) website at httpwwwebrdcompagessectorenergyef-ficiencyseishtml
European Commission Climate Action website at httpeceuropaeuclimapoliciesetsauction-ing_enhtm
European Investment Bank (EIB) website at httpwwweiborg
European Commission Eurostat (2012) Environmental and Energy data base accessed on September 2012 httpappssoeurostateceuropaeunuishowdo
European Commission Eurostat (2012) Environmental Taxes httpeppeurostateceuropaeustatis-tics_explainedindexphpEnvironmental_taxes
French Development Agency (AfD) Agence Franccedilaise de Developpement website at httpwwwafdfrlangenhome
Government of Brazil website at wwwbrasilgovbr
Green Climate Fund website at httpgcfundnethomehtml
International Development Finance Club website at httpwwwidfcorg
Indian Renewable Energy Development Agency (IREDA) website at httpwwwiredagovin
Indonesia Exim Bank website at httpwwwindonesi-aeximbankgoid
Industrial Development Bank of Turkey (TSKB) website at httpwwwtskbcom
Inter-American Development Bank (IDB) website at httpwwwiadborg
International Finance Corporation (IFC) website at httpswwwifcorg
Japan International Cooperation Agency (JICA) website at httpwwwjicagojpenglish
KfW Group website at httpwwwkfwdekfwenKfW_Groupindexjsp
Korea Finance Corporation (KOFC) httpwwwidfcorgMemberskofcaspx
Multi-Donor Trust Fund Office Gateway website at httpmdtfundporg
Nacional Financiera Banca de Desarollo (NAFIN) website at httpwwwnafincomportalnfcontenthomehomehtml
Nordic Development Fund website at wwwndffi
OANDA website at httpwwwoandacom
ODI HBF Climate Funds Update database at httpwwwclimatefundsupdateorg
74
The Landscape of Climate Finance 2012
75
The Landscape of Climate Finance 2012December 2012 December 2012
OECD DAC Creditor Reporting System database at httpwwwoecdorgdataoecd50175037721htm
OECD Glossary of Statistical Terms at httpstatoecdglossary
OECD Trade and Agriculture Directorate (TAD) Export Credits Database at httpwwwoecdorgdepartment03355en_2649_34169_1_1_1_1_100html
OECD Userrsquos Guide to the CRS Aid Activities database at wwwoecdorgdacstatscrsguide
OECD website ldquoFocus on Aid Targeting the Objectives of the Rio Conventionsrdquo at wwwoecdorgdacstatsrioconventions
OECD List of OECD Member Countries at httpwwwoecdorggenerallistofoecdmembercoun-tries-ratificationoftheconventionontheoecdhtm
OECDEEA database on instruments used for environ-mental policy and natural resources management httpwww2oecdorgecoinstqueriesindexhtm
Overseas Private Investment Corporation (OPIC) website at httpwwwopicgov
Small Industries Development Bank of India (SIDBI) website at httpwwwsidbicom
The Brazilian Development Bank website at httpwwwbndesgovbr
The Financial Times FDi Intelligence website at httpwwwfdiintelligencecom
The Foundation Center website at httpfoundation-centerorggpfclimatechangechart-oecdhtml
The Global Environmental Facility (GEF) project data-base at httpwwwgefonlineorg
The Nordic Development Fund (NDF) website at httpwwwndffi
UNCTAD interactive database of Division on Invest-ment and Enterprise at httpwwwunctadorgtemplatesPageaspintItemID=3199amplang=1
UNEP Risoslash Centre CDMJI Pipeline Analysis and Data-base at httpcdmpipelineorg
UNFCCC CDM Registry website at httpcdmunfcccintRegistryindexhtml
UNFCCC Finance Portal for Climate Change website at httpunfcccintcooperation_supportfinan-cial_mechanismfinance_portalitems5824php
Adaptation Private Sector Initiative (PSI) at httpunfcccintadaptationnairobi_work_programmeprivate_sector_initiativeitems4623php
Vnesheconombank (VEB) website at httpwwwvebru
World Bank Project amp Operations database at httpgoworldbankorgIAHNQIVK30
World Bank website at httpworldbankorg
74
The Landscape of Climate Finance 2012
75
The Landscape of Climate Finance 2012December 2012 December 2012
Appendix A - Main assumptions and methodologyThe Scope of Private Climate FinanceWe covered 1636 individual active projects from the Bloomberg New Energy Finance database representing 82 of the extra capacity in developed countries and 89 of the extra capacity in developing countries (539 GW in total)
For both developed and developing countries we looked at the most relevant ldquo2011 financing storiesrdquo each rep-resenting more than 1 GW of extra capacity financed in 2011
Developed countries (OECD) 45 of the projects for 45 of total capacity
The top 7 stories which represent 75 of the proj-ects for 82 of capacity in developed countries are as follows
bull US wind and solar financing
bull Canadian wind financing
bull German wind financing
bull UK wind and biomass amp waste financing
bull Spanish wind and solar financing
bull Italian solar financing
bull Korean wind and marine financing (one large-scale project)
Developing countries (non-OECD) 55 of the projects for 55 of total capacity
The top 3 stories which represent 85 of the projects for 89 of capacity in developing countries are as follows
bull Chinese wind solar and biomass amp waste financing
bull Indian wind financing and solar financing
bull Brazil wind financing
Small-scale distributed capacityData for small-scale distributed capacity (PV and Solar Water Heater) were retrieved from FS-UNEP and BNEF (2012) and Weiss and Mauthner (2012) and catego-rized by geography and category of actors based on the data available
ldquoGreenrdquo FDI dataThe data used in the Landscape 2012 were retrieved by UNCTAD experts from the fDi Markets database Figures covered greenfield investments occurred glob-ally in 2011 We decided to exclude cross-border MampA as we decided to focus on new investment in emission reductionstabilization only
The sectors covered were the following renewable gen-eration (biomass geothermal hydroelectric solar tidal and wind energy) and waste management
To avoid double counting with the data retrieved from the BNEF database FDI data were allocated as the range of uncertainty to the BNEF subtotal except for flows that are typically of domestic nature such as gov-ernmentsrsquo budget and households ones
CURRENCY ANNUAL AVERAGE
EURUSD (2010) 13277
EURUSD (2011) 13926
BR$USD (2011) 05997
TNDUSD (2009) 074654
Source Oanda (2012)
76
The Landscape of Climate Finance 2012
77
The Landscape of Climate Finance 2012December 2012 December 2012
Appendix B - A summary of the Landscape 2011FINANCE FLOWS AMOUNTS
(ON AVERAGE) METHODOLOGY
ALL usd 97 bIllIOn
bull Indicative estimates of annual flows for the latest year available 20092010 (variable according to the data source)
bull Estimates spanning multiple years adjusted to produce annual-equivalentsbull Includes incremental costs and capital investmentbull Most data presented related to commitments in a given year due to limited availability of
disbursement data
BILATERAL usd 228 bIllIOn
bull Bilateral contributions reported through the OECDrsquos Creditor Reporting System Aid Activities (OECD CRS) database
bull Bilateral Finance Institutions direct reporting (TC 2011 UNEP 2010 BNEF 2011)bull an estimate of the volume of green export credits (OECD statistics on export credits 2010
as cited in Buchner et al 2011b)
MULTILATERAL usd 144 bIllIOnbull Multilateral institutionsrsquo direct reporting and reporting by various tracking initiatives
including TC 2011 UNEP 2010 BNEF 2011
CLIMATE FUNDS usd 25 bIllIOn bull ODIHBF Climate Funds Update and reporting by Fund administrators
CARBON OFFSET FINANCE usd 22 bIllIOn
bull This range was calculated using data from the World Bank the UNFCCC and IGES to apply surveyed average annual primary carbon offset prices to the annual volume of offsets issued
PRIVATE FINANCE usd 55 bIllIOn
Range of 370-722 billion betweenbull lsquoGreenrsquo Foreign Direct Investments (FDI) Based on the United Nations Conference on Trade
and Development database (UNCTAD 2010)bull Renewable energy investments based on the United Nations Environment Programme
(UNEP) and BNEF (UNEP and BNEF 2011) regarding renewable energy investments in developing countries (from developed countries other developing countries and private investment from national investors)
VOLUNTARY PHILANTHROPIC CONTRIBUTIONS
usd 450 mIllIOn bull Voluntary philanthropic contributions based on CEA 2007 Ecosystem Marketplace 2011
76
The Landscape of Climate Finance 2012
77
The Landscape of Climate Finance 2012December 2012 December 2012
Appendix C - Existing climate finance tracking databases and major ongoing initiativesTracking public climate financeAdaptation Fund Funded Projects and Funding Status
data at httpswwwadaptation-fundorgfunded_projects
African Development Bank Group (AfDB) Project Portfolio database at httpwwwafdborgenprojects-and-operationsproject-portfolio
AidData Development Finance and Foreign Aid Portal at httpaiddataorg
Asian Development Bank project database at httpwwwadborgprojects
European Bank for Reconstruction and Development (EBRD) online project database at httpwwwebrdcomsafsearchhtmltype=project
European Commission Climate Action Fast-start Finance list of actions tracked at httpeceuropaeuclimapoliciesfinanceinternationalfaststartindex_enhtm
European Investment Bank (EIB) Project finance database at httpwwweiborgprojectsloanssectorsindexhtm
Global Climate Change Alliance (GCCA) Technical and Financial Support database at httpwwwgccaeutechnical-and-financial-support
GEF project database available at httpwwwgefon-lineorg
Federal Ministry for the Environment Nature Conserva-tion and Nuclear Safety Germany National and International Climate Initiative online project data-base at httpwwwbmu-klimaschutzinitiativedeindex_enhtml
Inter-American Development Bank (IDB) online project database at httpwwwiadborgenprojectsprojects1229html
Multi-Partner Trust Fund Office Development and Climate Change Fund at httpmptfundporgfactsheetfundMDG00
ODIHeinrich Boumlll Foundation Climate Funds Update at httpwwwclimatefundsupdateorg
OECD Creditor Reporting System (CRS) Aid Ac-tivities database at httpstatsoecdorgIndexaspxdatasetcode=CRS1
United Nations Development Programme (UNDP) United Nations Environment Programme UNFCCC World Bank Group Fast Start Finance website at (updated as of December 2011) httpwwwfaststartfinanceorg
UNDPGEF Small Grants Programme project database at httpwwwundporgnpenvironment--energyprogramsgp-35html
UNFCCC Finance Portal for Climate Change at httpunfcccintcooperation_supportfinan- cial_mech-anismfinance_portalitems5824php
_____Funding for Adaptation interface at httpunfcccintadaptationimplementing_adaptationadapta-tion_funding_interfaceitems4638php
US Government RecoveryGov Track the Money httpwwwrecoverygovPagesdefaultaspx
Voluntary REDD+ Database REDD+ Partnership at wwwreddplusdatabaseorg
World Bank OECD Aid flows at httpsiteresourcesworldbankorgCFPEXTResourc- es299947-1266002444164indexhtml
World Bank UNDP Climate Finance Options database at wwwclimatefinanceoptionsorgcfo
World Bank Project amp Operations database at httpwebworldbankorgWBSITEEXTERNALPROJECTS0menuPK51562~pagePK64133621~piPK64140076~theSitePK4094100html
WRI Summary of Developed Country lsquoFast-Startrsquo Climate Finance Pledges (updated as f November 2011) at httpwwwwriorgstories201002summary-developed-country-fast-start-climate-finance-pledges
Tracking private climate financeBloomberg New Energy Finance Industry Intelligence
Desktop httpbnefcomservicesindustry- intelligence-slash-desktop
Dealogic ProjectWare and Loan Analytics httpwwwdealogiccoukenmarketdatahtm
Ecosystem Marketplace Bloomberg New Energy Finance Voluntary Carbon Market data at httpmoderncmsecosystemmarketplacecomrepositorymoderncms_documentssovcm_postlaunchreport_20121pdf
78
The Landscape of Climate Finance 2012
79
The Landscape of Climate Finance 2012December 2012 December 2012
_____Publication at httpwwwforest-trendsorgpub-lication_detailsphppublicationID=3164
Environmental Finance Carbon Funds httpwwwenvironmental-financecombooks
European Commission Eurostat FDI Statistics httpeppeurostateceuropaeu
EEX European Energy Exchange data at httpwwweexcomen
Financial Times FDi Intelligence database httpwwwfdiintelligencecom
Foundation Centre research database httpfounda-tioncenterorgfindfundersstatistics
Institute for Global Environmental Strategies (IGES) CDM Programme database at httpwwwigesorjpencdmindexhtml
OECD Creditor Reporting System (CRS) Aid Ac-tivities database at httpstatsoecdorgIndexaspxdatasetcode=CRS1
OECD International Direct Investment Statistics data-base at httpwwwoecdorgdafinternationalin-vestment
Point Carbon - Carbon Project Manager Carbon Market Trader EU at httpwwwpointcarboncomtrading
Thomson Reuters Trader for Commodities Advanced at httptrainingthomsonreuterscomportalproductphppid=4
Thomson Reuters Eikon for Energy at httpthomson-reuterscomproducts_servicesfinancialfinan-cial_productsa-zeikon_for_energy
UNCTAD Interactive Database Division on Investment and Enterprise at httpstatsunctadorgfdi
UNEP-Risoslash CDMJI Pipeline Analysis and Database at httpcdmpipelineorg
UNFCCC CDM and JI Project Activities databases at httpcdmunfcccintProjectsprojsearchhtml
_____Adaptation Private Sector Initiative (PSI) at httpunfcccintadaptationnairobi_work_pro-grammeprivate_sector_initiativeitems4623php
World Bank Private Participation in Infrastructure (PPI) Project Database at httpppiworldbankorg
_____State and Trends of Carbon Market 2012 at httpsiteresourcesworldbankorgINTCARBON-
FINANCEResourcesState_and_Trends_2012_Web_Optimized_19035_CvrampTxt_LRpdf
_____ World Development Indicators and Global Development Finance at http httpdatabankworldbankorgddphomedoStep=1ampid=4
78
The Landscape of Climate Finance 2012
79
The Landscape of Climate Finance 2012December 2012 December 2012
Appendix D - Details on Development Finance Institutions
BILATERAL FINANCE INSTITUTIONS
REPORTING YEAR SOURCE AND NOTES
AfD Agence Franccedilaise de Deacuteveloppement- Proparco
2011
Self-reporting via CPI surveyGiven that some of the projects supported contributed to both mitigation and adaptation purposes we allocated the dual purpose money according to the total distribution between mitigation and adaptation projects
JICAJapan International Cooperation Agency
2011 Self-reporting via CPI survey
KfW - KfW Entwicklungsbank- DEG
2011 Self-reporting via CPI survey
OPICOverseas Private Investment Corporation
2011 Self-reporting via CPI survey
MULTILATERAL FINANCE INSTITUTIONS
REPORTING YEAR SOURCE AND NOTES
AfDB African Development Bank
2011 Self-reporting via CPI survey - mitigation data only
AsDB Asian Development Bank
2011Self-reporting via CPI survey - mitigation data onlyBased on the infornation retrieved on the Banks website and at the best of our knowledge we allocated 100 of the reported portion of equity financing to balance sheet finance
EBRDEuropean Bank for Reconstruction and Development
2011Self-reporting via CPI surveyThe reported portion of equity financing was allocated 5050 between balance sheet financing and project-level equity due to data availabiltiy constraints
EIB European Investment Bank
2011
Joint MDBs Mitigation Finance Report (IDB et al 2012) The figure included hence represents financing to mitigation projects onlyTo retrieve the breakdown by instruments sectors and geography we applyed the shares presented in UNEP-SEI (2011)
EU Institutions 2010
OECD CRS 2010 data (OECD 2012)The figure included in the Landscape 2012 represents aid marked both principal and significantFinancing with multi-purpose objectives (ie both mitigation and adaptation) was allocated according to the distribution between mitigation only and adaptation only projects (55 vs 45)
IDBInter-American Development Bank
2011Self-reporting via CPI surveyThe portion of cliamte finance committed to Mexico was allocated to Central America
IFC International Finance Corporation
2011Self-reporting via CPI survey - mitigation data only
The reported portion of equity financing was allocated 5050 between balance sheet financing and project-level equity due to data availabiltiy constraints
NDFThe Nordic Development Fund
2011
NDF Annual Report 2011To estimate the thematic breakdown between mitigation and adaptation we applied the share retrievd from the OECD CRS 2009 dataset (OECD 2011b)The geographical breakdown was derived from NDF Annual Report 2011 and specifically we allocated committed funds based on the distribution of approved projects at the end of 2011 ie Africa (42) Asia (28) and Latin America (30)
80
The Landscape of Climate Finance 2012
81
The Landscape of Climate Finance 2012December 2012 December 2012
World Bank (IDA and IREDA)
FY 2011
Self-reporting via CPI surveyTo estimate the breakdown by instruments we applied- for IDA 6 to grants 94 to concessional loans as presented in the OECD CRS 2010 data (OECD 2012)- for IBRD 100 market-rate loans as presented in the OECD CRS 2009 data (OECD 2011a)The Bank asseses mitigation and adaptation co-benefits independently Hence to split total 2011 climate financing avoiding double counting we allocated the dual purpose money according to the total distribu-tion between mitigation and adaptation
NATIONAL amp SUB-REGIONAL
DEVELOPMENT FINANCE INSTITUTIONS
REPORTING YEAR SOURCE AND NOTES
AfD Agencia Financiera de Desarollo
2011 Self-reporting via CPI survey
BNDESBrazilian Development Bank
2011
Self-reporting via CPI surveyData included in the report represent dirbursement rather than committmentsThe bank reported financing to renewable energies and energy efficiency as a combined category (see also BNDES 2012) To derive the allocation pertaining to each sector we applied the share on 2011 disclosed deals per sectors as presented in BNEF (2012)
CAFDevelopment Bank of Latin America
2011 Self-reporting via CPI survey
DBSADevelopment Bank of Southern Africa
2011
Self-reporting via CPI surveyGeographical breakdownDBSAs financing to South Africa was considered as domestic spending as occurred in the area where the institution is based in
FIRAFideicomisos Instituidos en Relacioacuten a la Agricultura (Mexico)
2011 Self-reporting via CPI survey
IREDAIndian Renewable Energy Development Agency
2011
IREDA Annual Report (2011)To avoid potential double counting with other DFIs flows total financing was reduced by 40 which is the share of international assistance in IREDAs resource base for 2010-2011 as reported in IREDA (2011)In our estimate we have included financing directed to projects in the following sectors wind hydro biomass power generation energy efficiency and energy conservation solar energy waste to energy Instruments breakdownTo estimate the portion of low-cost debt versus market-rate debt we associated to the former the total amount of finance committed to those sectors for which in 2011 IREDA received the interest rate subsi-dies provided by the Indian Ministry of New and Renewable Energy (IREDA 2012) To market-rate debt was allocated the remaining portion
NAFINNacional Financiera (Mexico)
2011 Self-reporting via CPI survey
80
The Landscape of Climate Finance 2012
81
The Landscape of Climate Finance 2012December 2012 December 2012
BEBanco del Estado de ChileBancoldex SA ColombiaBCIECABEICentral American Bank for Economic IntegrationBSTDB Black Sea Trade and Development Bank of Greece CDGCaisse de Deacutepocirct et de Gestion MoroccoCDB China Development BankHBORCroatian Bank for Reconstruction and DevelopmentIndonesia EximbankKoFCKorea Finance CorporationSIDBI Small Industries Development Bank of IndiaTSKB Industrial Development Bank of TurkeyVEB Vnesheconombank Russia
2011
Ecofys-IDFC (2012) The volume of green finance stated in the report was adjusted by- the 7 share reported as other environmental projects as we opted to include only what banks reported as mitigation and adaptation- climate finance spending data received in response to CPIrsquos survey by the other NFIs and BFI above listed only those covered in the report- climate finance spending data received in response to CPIrsquos survey by AFD KFW and JICA which was re-allocated to the BFIs category- the share of Lower carbon energy generation project as it may have included fuel-to-fuel swtich project (eg fuel to gas coal to gas) or fossil fuel based co-generation- an esitmated portion of guaranteesrisk management instrumentsThe volumed obtained was allocated to mitigation and adaptation assuming a 89 vs11 breakdown which is in line with the report and the share observed in the financing of other BFIs and MFIsNote Due to the above and the includions of KFW Entwicklungsbank and DEGrsquos climate financing rather than the entire KFW Bankengruppe our NFIs total climate financing is lower as compared to the Ecofys-IDFC (2012) report We decided to include KFW Entwicklungsbank and DEGrsquo financing only for two main reasons (a) to avoid double counting with the money captured in the private finance flows and (b) to avoid distortions in the presentation of the BFIsrsquo money given the domestic-oriented focus of the excluded business areas of the Group and the lack of analogous examples across the group of BFIs We acknowledge the presence of public money sitting behind private investments quantifying it whenever possible and highlighting the key role played by KfW domestically in the support of the German Energiewende (see Box 10)Instruments breakdownTo estimate the breakdown between the instruments categories featured in the Landscape 2012 the ag-gregated volume of climate financing was1) Broken down between loans and others instruments (95 versus 5) as indicated in Ecofys-IDFC (2012)2) The resulting amount was then further broken down based on the weighted average observed for the other NFIs + BFIs for which we had data for3) The resulting portion of equity was allocated 5050 between balance sheet financing and project-level equity due to data availabiltiy constraintsGeographical breakdownTo esitmate the breakdown between the various greographical recipients we (1) allocated the estimated portion pertaining to CDB to China assuming that it invested domestically (2) the remaining portion was allocated according to the average shares among the other BFIs and NDBs for which we had data
82
The Landscape of Climate Finance 2012
83
The Landscape of Climate Finance 2012December 2012 December 2012
Appendix E - Details on Climate Funds
FUND NAME TYPE INSTRUMENTS
ESTIMATED LATEST YEAR
VALUE(USD MILLION)
SOURCE AND DETAILS
Adaptation Fund Multilateral1 Grants 856
Approved funds to projects in 2011 Source UNFCCC Finance Portal - Adaptation Fund Database of Projects - httpunfcccintcooperation_and_supportfinancial_mechanismadapta-tion_funditems6668phpApproved20project20data and Adaptation Fund Portal - httpwwwadaptation-fundorg consulted on July 27 2012
Global Environmental Facility (GEF)bull GEF Trust Fundbull Least Developed Countries Fundbull Special Climate Change Fund
MultilateralMultilateralMultilateral
Grants
22051702322181
Projects approved or endorsed by the CEO during 2011 as of end July 2012 Source Personal communication with GEF Secretariat July 2012
UN-REDD Programme Multilateral Grants 352
Multi-Partner Trust Fund Office May 2012 Third Consolidated Annual Progress Report on Activities Implemented under the UN-REDD Programme Fund for the period 1 January ndash 31 December 2011 httpmptfundporg
MDG Achievement Fund ndash Environment and Climate Change thematic window
Multilateral Grants 154Approved budget in 2011 for projects in the Environment and Climate Change thematic windowSource httpmdtfundporg
Climate Investment Funds (CIFs) including
bull the Clean Technology Fund and bull the Strategic Climate Fund
Multilateral
Grants conces-sional loans
loans and guarantees
9295Approved spend in 2011Source wwwclimatefundsupdateorg
Forest Carbon Partnership Facility (FCPF)
Multilateral Grants 214Approved spend in 2011Source wwwclimatefundsupdateorg
Congo Basin Forest Fund Multilateral Grants 573Approved spend in 2011Source wwwclimatefundsupdateorg
Global Energy Efficiency and Renewable Energy Fund
Multilateral Equity 174Approved spend in 2011Source wwwclimatefundsupdateorg
Global Climate Change Alliance Multilateral Grants 770Approved spend in 2011Source wwwclimatefundsupdateorg
Amazon Fund (Fundo Amazocircnia) Bilateral Grants 269Approved spend in 2011Source wwwclimatefundsupdateorg
BNDES Mata Atlacircntica initiative Bilateral Grants 58
R$ 118m approved in 2011 for 3 reforestation projects (con-verted to USD using an exchange rate of USD 048860R$ oandacom 1 September 2012) Source Press Release 26 May 2011 httpwwwbndesgovbrSiteBNDESbndesbndes_enInstitucionalPressNoticias201120110526_mataatlanticahtml
Germanys International Climate Initiative
BilateralGrants and
concessional loans
897Approved spend in 2011Source wwwclimatefundsupdateorg
82
The Landscape of Climate Finance 2012
83
The Landscape of Climate Finance 2012December 2012 December 2012
Australias International Forest Carbon Initiative
Bilateral Grants 314
Total approved spend No annual data is available Cumulative total approved spend is therefore divided by four given four full years of operation since June 2008 Source wwwclimate-fundsupdateorg
Indonesia Climate Change Trust Fund Bilateral Grants 00Approved spend in 2011Source wwwclimatefundsupdateorg
UK Internatioanl Climate Fund Bilateral Grants 782Approved spend in 2011Source wwwclimatefundsupdateorg
Guyana REDD+ Investment Fund Bilateral Grants 04
Administrative fees for project proposal preparation grants for projects approved in 2011 including (1) Institutional Strengthening US$ 305168 Source (2) Micro and Small Enterprise Development $127476
Japans Fast-Start Finance Bilateral
Grants loans risk instru-ments and equity
7997Cumulative total approved spend divided by two to give an approximation of annual flows over two full years of operation to date Source wwwclimatefundsupdateorg
1 Countries can access resources directly through National Implementing Agencies (NIEs) or using the services of a multilateral implementing entity (MIEs)
84
The Landscape of Climate Finance 2012
PB
The Landscape of Climate Finance 2012December 2012 December 2012
Appendix F - Financial flows for REDD+
FUND
ESTIMATED ANNUAL
COMMITMENTS (USD MILLION)
SOURCE
Bilateral and EU Institution commitments marked for climate change and forest related purpose
7000 OECD DAC database data for 2010 (OECD 2012)
Additional Fast Start Finance for REDD+ 2437CPI analysis of Fast Start Finance reporting to UNFCCC for 2010 Gibbs (2012)
Norway-Indonesia REDD+ Partnership 00Phase I contribution equals USD 30 million however no funds have yet been disbursed to projects Source Personal Communication with Indonesian officials
Norway-Guyana REDD+ Investment Fund 04Administrative fees for project proposal preparation grants for projects approved in 2011 including (1) Institutional Strengthening US$ 305168
UN-REDD Programme 352
Multi-Partner Trust Fund Office May 2012 Third Consolidated Annual Progress Report on Activities Implemented under the UN-REDD Programme Fund for the period 1 January ndash 31 December 2011 httpmptfundporg
World BankForest Carbon Partnership Facility (FCPF)
214Approved spend in 2011Source wwwclimatefundsupdateorg
Congo Basin Forest Fund 573Approved spend in 2011Source wwwclimatefundsupdateorg
Forest Investment Program (FIP) 510Approved spend in 2011Source wwwclimatefundsupdateorg
Global Environment Facility (GEF) 109CPI identification of projects related to forests approved or endorsed by the CEO during 2011 as of end July 2012 Source Source data through personal communication with GEF Secretariat July 2012
Global Climate Change Alliance 247Approved spend in 2011 in the REDD area Source wwwclimatefundsup-dateorg
Amazon Fund 269Approved spend in 2011Source wwwclimatefundsupdateorg
BNDES Mata Atlacircntica initiative 58
R$ 118m approved in 2011 for 3 reforestation projects (converted to USD using an exchange rate of USD 048860R$ oandacom 1 September 2012) Source Press Release 26 May 2011 httpwwwbndesgovbrSiteBNDESbndesbndes_enInstitucionalPressNoticias201120110526_mataatlanticahtml
International Tropical Timber Organization (ITTO)
40 Macqueen (2010)
Forest Carbon Markets 1430Peters-Stanley et al (2012) Value of primary credits sold on the volun-tary and CDMJI markets in 2011
Total 13242Notes - The following donor funds are excluded from the table above due to their interaction with other funds presented Australian International Forest Carbon Initiative (USD 314 million annualized estimate based on data from wwwclimatefundsupdateorg) German International Climate Initiative (USD 076 million ap-proved for REDD projects in 2011 according to wwwclimatefundsupdateorg) Norwegian Climate and Forest Initiative (no data on 2011 approved projects at wwwclimatefundsupdateorg) Japan Fast-Start Finance - The estimate of bilateral and EU Institution commitments in the forest sector is based on filtering of OECD CRS data according to climate change marking and forest related purpose coding (forestry industries development educationtraining policy amp admin Management research and services) Project channels and titles were screened to remove potential overlaps with ITTO GEF FIP FCPF and UN-REDD The portion of Fast-Start finance we identified in 2010 data (about USD 18 billion) is estimated to have contributed an additional USD 250 million which was obtained by applying an aver-age 14 share of Fast-Start financing to REDD measures over the December 2010 and 2011 period (Gibbs 2012)
- 1Introduction
- 2Methodology
-
- 21 Definitions
- 22 Analytical focus
- 23 Innovations in this yearrsquos study
-
- 3The Current Landscape of Climate Finance Flows
-
- 31 Sources and intermediaries
- 32 Intermediaries
- 33 Instruments
- 34 Disbursement channels
- 35 Uses
-
- 4Conclusions and the way forward
- Index of acronyms
- Glossary
- References
- Websites
- Appendix A - Main assumptions and methodology
- Appendix B - A summary of the Landscape 2011
- Appendix C - Existing climate finance tracking databases and major ongoing initiatives
- Appendix D - Details on Development Finance Institutions
- Appendix E - Details on Climate Funds
- Appendix F - Financial flows for REDD+
-