the language of well -being: tracking fluctuations in
TRANSCRIPT

Running head: EMOTION FLUCTUATIONS AND EVERYDAY SPEECH 1
The Language of Well-Being: Tracking Fluctuations in Emotion Experience through Everyday
Speech
[author details withheld]

EMOTION FLUCTUATIONS AND EVERYDAY SPEECH 2
Abstract
The words that people use have been found to reflect stable psychological traits, but less is
known about the extent to which everyday fluctuations in spoken language reflect transient
psychological states. We explored within-person associations between spoken words and self-
reported state emotion among 185 participants who wore the Electronically Activated Recorder
(EAR; an unobtrusive audio recording device) and completed experience sampling reports of
their positive and negative emotions four times per day for seven days (1,579 observations). We
examined language using the Linguistic Inquiry and Word Count program (LIWC; theoretically
created dictionaries) and open-vocabulary themes (clusters of data-driven semantically-related
words). Although some studies give the impression that LIWC’s positive and negative emotion
dictionaries can be used as indicators of emotion experience, we found that when computed on
spoken language, LIWC emotion scores were not significantly associated with self-reports of
state emotion experience. Exploration of other categories of language variables suggests a
number of hypotheses about substantive everyday correlates of momentary positive and negative
emotion that can be tested in future studies. These findings (1) suggest that LIWC positive and
negative emotion dictionaries may not capture self-reported subjective emotion experience when
applied to everyday speech, (2) emphasize the importance of establishing the validity of
language-based measures within one’s target domain, (3) demonstrate the potential for
developing new hypotheses about personality processes from the open-ended words that occur in
everyday speech, and (4) extend perspectives on intra-individual variability to the domain of
spoken language.

EMOTION FLUCTUATIONS AND EVERYDAY SPEECH 3
Keywords: spoken language; emotion; experience sampling; naturalistic observation; within-
person variability
The Language of Well-Being: Tracking Fluctuations in Emotion Experience through Everyday
Speech
Personality psychology has long considered how natural language might provide insights
into psychological aspects of a person (e.g., Allport & Odbert, 1936; Norman, 1967). Indeed, the
dominant Big Five model of personality traits was developed through factor analyses of the
words that people use to describe themselves and others (Goldberg, 1993; John, Naumann, &
Soto, 2008). Advances in computational linguistics have since facilitated the study of how the
words that people use in their everyday communications reflect meaningful individual
differences. Such work demonstrates that there is moderate stability in how people express
themselves linguistically across time, locations, activities, and modes of interaction (Mehl &
Pennebaker, 2003; Mehl, Pennebaker, Crow, Dabbs, & Price, 2001; Park et al., 2015;
Pennebaker & King, 1999), and that between-person differences in language use are correlated
with between-person differences in stable psychological and demographic characteristics and life
outcomes, including personality, age, gender, mental health, and longevity (Danner, Snowdon, &
Friesen, 2001; Fast & Funder, 2008; Guntuku, Yaden, Kern, Ungar, & Eichstaedt, 2017; Hirsh &
Peterson, 2009; Kern, Eichstaedt, Schwartz, Dziurzynski, et al., 2014; Kern, Eichstaedt,
Schwartz, Park, et al., 2014; Mehl, Gosling, & Pennebaker, 2006; Park et al., 2015, 2016,
Pressman & Cohen, 2012, 2007; Rude, Gortner, & Pennebaker, 2004; Schwartz et al., 2016;
Schwartz, Eichstaedt, Kern, Dziurzynski, Ramones, et al., 2013; Yarkoni, 2010; Ziemer &
Korkmaz, 2017).

EMOTION FLUCTUATIONS AND EVERYDAY SPEECH 4
Although there are meaningful between-person differences in the words that people use,
people often use different words from one moment to the next (linguistic fluctuations). This is an
instance of the distinction between personality traits and states. Whereas a trait describes a
person’s typical patterns of affects, behaviors, and cognitions across a range of situations and
contexts, a state describes those affects, behaviors, and cognitions at a particular moment, within
a specific context (Fleeson, 2001). For example, although some people generally experience
more positive emotions compared to other people (between-person variation), people also
fluctuate in how much positive emotion they experience on a moment-to-moment basis (within-
person fluctuations).
Studies have established the value of not only investigating between-person differences
in personality traits, but also investigating within-person fluctuations in personality states (e.g.,
Fleeson, 2001, 2017; Kuppens, 2015; Wilson & Vazire, 2015), and correlates of momentary
affects, behaviors, and cognitions. For example, people tend to feel happier when they are around
others and when they are acting more extraverted than usual, even if they are dispositional
introverts (Lucas, Le, & Dyrenforth, 2008; Sun, Stevenson, Kabbani, Richardson, & Smillie,
2017; Zelenski et al., 2013). We propose that this dynamic within-person perspective can be
extended to spoken language use; linguistic fluctuations may be systematically related to within-
person fluctuations in other personality states, including affective states.
Detecting Emotion Experience Through Language
Although there are experiential, physiological, and behavioral components to emotions
(Mauss & Robinson, 2009), in line with the subjective well-being tradition (Diener, 1984), we
focus here on the subjective experience of emotion. Self-report is an obvious method for
assessing subjective, internal experiences. Yet, as subjective feelings are also expressed

EMOTION FLUCTUATIONS AND EVERYDAY SPEECH 5
externally through observable behaviors (Ekman, 1993; Mauss & Robinson, 2009), passive
sources of data such as social media posts (Guntuku et al., 2017), smartphone sensing methods
(Harari et al., 2016), and audio recordings of everyday life (Weidman et al., in press) might also
contain information that could be used to measure emotion without asking people directly.
Unobtrusive methods of tracking emotion states could provide psychological insight at large
scale, be deployed when self-report methods are impractical (e.g., immediately after a tragedy;
Doré, Ort, Braverman, & Ochsner, 2015), and continuously monitor people for early signs of
declines in mental health without burdening them with repeated questionnaires.
Numerous approaches to detecting emotion through language exist (for reviews, see Pang
& Lee, 2008; Ribeiro, Araújo, Gonçalves, Gonçalves, & Benevenuto, 2016), but the majority of
studies in psychology have used the emotion dictionaries contained within the Linguistic Inquiry
and Word Count (LIWC) language analysis program (Pennebaker, Booth, Boyd, & Francis,
2015; Pennebaker, Booth, & Francis, 2007; Pennebaker, Francis, & Booth, 2001). LIWC
contains dictionaries—groups of words that were intended to represent various topics (e.g.,
emotion, personal concerns, social and cognitive processes)—and were developed using human
judgments of theoretical relevance. Several versions of LIWC (2001, 2007, 2015) have included
and refined various dictionaries over time, but all versions have included broad positive and
negative emotion categories, as well as sub-categories of anxiety, anger, and sadness (within the
negative emotion category). One goal of this paper is to examine the extent to which this
commonly-used approach for summarizing language can capture fluctuations in self-reported
emotion experience, specifically when applied to everyday spoken language.
Do Spoken LIWC Emotion Words Measure Fluctuations in Emotion Experience?

EMOTION FLUCTUATIONS AND EVERYDAY SPEECH 6
Establishing a measure of a construct within a new context (e.g., everyday spoken
language) requires showing that the measure is correlated with a previously validated measure of
the construct, at the intended level of measurement (e.g., between persons or within-persons;
Kievit, Frankenhuis, Waldorp, & Borsboom, 2013). Although far from perfect, self-report
measures are considered to be a valid method for assessing subjective emotion experience
(Mauss & Robinson, 2009). Thus, if LIWC emotion dictionaries can assess changes in a person’s
emotion experience, changes in LIWC emotion scores should be associated with changes in self-
reported emotion. Testing this requires multiple samples of language and self-reported emotion
from each person, and an analytic strategy that examines how within-person changes in LIWC
emotion scores are related to within-person changes in self-reported emotion experience.
Several published studies have used LIWC emotion scores as the only indicators of
changes in emotion, and give the impression that changes in LIWC emotion scores reflect
changes in underlying emotional experience (e.g., Back, Küfner, & Egloff, 2010; Cohn, Mehl, &
Pennebaker, 2004; De Choudhury & Gloria, 2014; Doré et al., 2015; Golder & Macy, 2011;
Jones, Wojcik, Sweeting, & Silver, 2016). For example, Cohn and colleagues (2004) concluded
that changes in LIWC negative emotion scores in journal entries had implications for theories of
how long emotion states linger after traumatic events. Golder and Macy (2011) interpreted
fluctuations in LIWC positive and negative emotion words in Tweets throughout the day as
evidence for circadian effects on mood. Others have investigated the time course of specific
negative emotions (Back et al., 2010; Doré et al., 2015). Yet, as summarized in Table 1, evidence
that LIWC emotion scores correlate with self-reported emotion is inconsistent across contexts,
and very little work has examined associations in the context of everyday spoken language.
Moreover, the majority of studies have only examined associations between LIWC emotion

EMOTION FLUCTUATIONS AND EVERYDAY SPEECH 7
dictionaries and self-reported emotion at the between-person level, which is only indirectly
relevant to the question of whether LIWC emotion scores can assess within-person changes in
experienced emotion (Kievit et al., 2013; Molenaar & Campbell, 2009).
To our knowledge, only one study has directly tested the extent to which LIWC emotion
dictionaries can track within-person fluctuations in a person’s emotion experience (Kross et al.,
2018). By obtaining repeated samples of Facebook posts and self-reported affect from 311
people, Kross and colleagues (2018) found that LIWC positive and negative emotions scores
expressed in Facebook posts neither predicted, nor were predicted by, people’s self-reports of
how they felt around the time of those posts. Eliminating the possibility that Facebook posts
contained no information on people’s emotion experience (e.g., due to self-presentation
concerns), the study found that human judges’ ratings of the emotionality of participants’
Facebook posts were consistently associated with participants’ self-reported emotion in those
moments. In other words, this study showed that Facebook posts contained valid information
about people’s self-reported emotion experience that LIWC emotion dictionaries were not able to
detect. We began the current study before we knew of Kross and colleagues’ study, but
fortuitously, one of our goals was to test a similar question (i.e., whether LIWC emotion
dictionaries can measure fluctuations in self-reported emotion experience) in a different and
pervasive language context: everyday spoken language.
Insert [Table 1 here]
Direct and Indirect Linguistic Markers of Emotion
As illustrated in Figure 1, emotions can be reflected through direct and indirect linguistic
markers. People can directly reveal how they are feeling using positive and negative emotion
words (e.g., “I’m feeling happy”, “I’m so angry”). Language can also carry indirect traces of a
EMOTION FLUCTUATIONS AND EVERYDAY SPEECH 8
person’s emotion experience. For instance, people tend to feel happier when they are socializing
than when they are alone (e.g., Lucas et al., 2008). If people talk or write about what they are
thinking or doing, words that are direct markers of affect-relevant behaviors and cognitions (e.g.,
“I’m hanging out with friends”) might serve as indirect markers of emotion. The combination of
direct and indirect markers may better capture a person’s momentary emotion experience than
direct expression alone. Beyond the goal of measuring emotion experience, indirect linguistic
markers might also provide insight into the thoughts and behaviors that are associated with
emotion experience. Some insights might simply corroborate existing self-report-based findings;
others may point to new and unexpected hypotheses about the experiences associated with
momentary emotional well-being. Thus, considering indirect linguistic markers opens up new
possibilities for what we can learn about emotion fluctuations from everyday speech.
Insert [Figure 1 here]
In the current study, we use two complementary strategies to explore indirect linguistic
markers of emotion. First, LIWC includes a number of non-emotion dictionaries that are
potentially relevant to experienced emotions (e.g., social processes, temporal orientation,
motivations, personal concerns). This is a closed-vocabulary approach, in the sense that LIWC
dictionaries rely on a priori human judgments of which words belong in each category, and the
categories themselves are defined and constrained by the imagination of researchers (Kern et al.,
2016; Schwartz, Eichstaedt, Kern, Dziurzynski, Ramones, et al., 2013). Analogous to traditional
questionnaire research in which researchers generate questions targeting constructs of interest,
closed-vocabulary approaches assume that human judgments of word relevance to a category are
valid, and limit discoveries to predefined language categories.

EMOTION FLUCTUATIONS AND EVERYDAY SPEECH 9
To provide a complementary open-vocabulary approach, we also use unsupervised
machine learning methods to automatically derive topics and themes from the data (Kern et al.,
2016; Schwartz, Eichstaedt, Kern, Dziurzynski, Ramones, et al., 2013; Schwartz & Ungar,
2015). Topics are theory-free clusters of related words that tend to co-occur with each other or
with the same words in everyday conversations. The topics can also be grouped into themes
based on the co-occurrence of topics in the data. Because topics are automatically generated
based on word co-occurrences in a large language sample, the words that reflect these topics are
based on real-world distributions of words, rather than subjective human assumptions about how
words are used (Schwartz & Ungar, 2015). Equally important, as the resulting topics and themes
capture what people actually talk about in everyday life—including categories that researchers
may not have thought of—they allow us to capitalize on the rich, open-ended nature of everyday
speech, beyond what is possible with theoretically-developed categories. Topics and themes thus
provide a resource for data-driven hypothesis generation. Still, human judgment is necessary for
interpretation, as this atheoretical approach may sometimes generate clusters of words that are
uninterpretable. In addition, topics and themes that are derived from one sample of transcripts
may not generalize to other samples. Thus, topic analyses are exploratory and the results are
merely suggestive until they can be cross-validated in a new sample.
Two previous studies (Schwartz et al., 2016; Schwartz, Eichstaedt, Kern, Dziurzynski,
Agrawal, et al., 2013) examined correlations between open-vocabulary topics and life
satisfaction. Schwartz, Eichstaedt, Kern, Dziurzynski, Agrawal, and colleagues (2013) predicted
county-level life satisfaction from Tweets that were geolocated to those counties (the Tweeters
were not the same people who provided the life satisfaction data). Schwartz and colleagues
(2016) predicted self-reported life satisfaction from each person’s Facebook status updates. Both

EMOTION FLUCTUATIONS AND EVERYDAY SPEECH 10
studies found a number of intriguing correlations. For example, topics that contained words
relating to philanthropy and spirituality were positively correlated with county-level life
satisfaction, whereas topics that indicated boredom and disengagement were related to lower
county-level and person-level life satisfaction. Topics have therefore been shown to be useful for
understanding between-community and between-person differences in life satisfaction (i.e., the
cognitive component of subjective well-being). However, no study has examined whether
within-person fluctuations in topic use are associated with within-person fluctuations in emotion
experience (i.e., the affective component of subjective well-being).
The Present Study
In this study, we examine associations between within-person fluctuations in everyday
spoken language and within-person fluctuations in self-reported emotion experience. We use a
dataset that contains repeated recordings of everyday conversations (captured using the
Electronically Activated Recorder [EAR]; Mehl, 2017), closely matched in time with self-reports
of momentary emotion experience from the same people (obtained using the Experience
Sampling Method; ESM).
We first examine the extent to which LIWC emotion dictionaries applied to everyday
speech track within-person fluctuations in self-reported emotion experience. Several studies have
demonstrated that LIWC emotion scores are correlated with a number of interesting outcomes
(e.g., war and economic hardships, Iliev, Hoover, Dehghani, & Axelrod, 2016; stock market
performance, Bollen, Mao, & Zeng, 2011; social network size, Lin, Tov, & Qiu, 2014; the
weather, Baylis et al., 2018; for a review, see Tausczik and Pennebaker, 2010). Such studies
show that LIWC emotion scores map onto meaningful phenomena, but leave open the question
of how much they capture subjective emotion experience. If we find that LIWC emotion scores
EMOTION FLUCTUATIONS AND EVERYDAY SPEECH 11
computed from spoken language correlate strongly with self-reported emotion fluctuations, then
this would suggest that they can be used not only to track interesting outcomes, but also to
directly measure fluctuations in emotion experience via spoken language. Conversely, if LIWC
emotion scores correlate weakly or not at all with self-reported emotion, this would suggest that
LIWC emotion scores computed on everyday speech cannot be used as proxies for emotion
experience, and might capture a different aspect of emotion than what is captured by self-reports.
We also use everyday language to generate new hypotheses about the everyday behaviors
and cognitions associated with momentary emotion experience. Even weak correlations between
everyday spoken language and emotion experience may deepen our understanding of what
people are thinking and doing when they are experiencing positive or negative emotions in
everyday life. Thus, our second aim is to explore indirect linguistic markers of emotions, using
non-emotion LIWC dictionaries and open-vocabulary themes. Grounded in an approach that
values comprehensive description of real-world phenomena (Rozin, 2001), the study is
exploratory in nature with no specific hypotheses.
Method
Data collection and transcription procedures were approved by Institutional Review
Boards at Washington University in St. Louis (IRB ID: 201206090; Study Title: Personality and
Intimate Relationships Study) and University of California, Davis (IRB ID: 669518-15; Study
Title: Personality and Interpersonal Roles Study). The data were part of a larger investigation.
Other published manuscripts have used the ESM happiness or positive and negative emotion
variables (Weidman et al., in press; Wilson, Thompson, & Vazire, 2016), one language variable
(first-person pronouns; Edwards & Holtzman, 2017), and other variables from this dataset that
are not used in the present manuscript (Breil et al., in press; Colman, Vineyard, & Letzring,

EMOTION FLUCTUATIONS AND EVERYDAY SPEECH 12
2018; Finnigan & Vazire, 2017; Solomon & Vazire, 2016; Sun & Vazire, in press; Wilson,
Harris, & Vazire, 2015). Weidman et al. (in press, Study 3) used the current dataset to predict
self-reported momentary happiness from raw audio features (e.g., amplitude, pitch, loudness)
extracted from the same EAR files, but the study did not examine any language variables. Apart
from the univariate descriptive statistics for the ESM variables, no analyses reported here have
been reported elsewhere—this is the first manuscript to examine within-person associations
between self-reported emotion and spoken language using this dataset.
As we had some knowledge of various parts of the dataset, we could not pre-register
data-independent analyses. However, we conducted sensitivity analyses using a range of
specifications to explore whether our results are robust to several alternative analytic decisions.
Although ethical considerations prevent us from making the audio files and the full set of
transcripts publicly available, the quantitative data and R scripts required to reproduce the
analyses reported in this paper are available at https://osf.io/3jkhu. This OSF repository also
contains a password-protected file that contains transcripts (along with the corresponding
language and self-reported emotion scores) for the time points included in the within-person
analyses, from the 93 participants who consented to have their EAR recordings shared. Interested
researchers can obtain the password from the first author.
Participants
The current investigation uses data from the first wave of the longitudinal Personality and
Interpersonal Roles Study (PAIRS; codebooks available at https://osf.io/akbfj/). The main study
involved 434 students at Washington University in St. Louis who were recruited via flyer
advertisements and classroom announcements across the campus. As compensation, participants
earned $20 for the initial laboratory-based assessment, were entered into a lottery with the

EMOTION FLUCTUATIONS AND EVERYDAY SPEECH 13
opportunity to win $100 for completing ESM surveys (with a 1 in 10 chance of winning if all
ESM surveys were completed), earned an additional $20 for wearing the Electronically
Activated Recorder (EAR), and received a “time capsule” that contained feedback on how their
personality changed across the seven waves of the study. Data collection ended at the end of the
semester in which at least 400 participants had been recruited.
For the current study, after exclusions (described below and in Figure 2), the final subset
of 185 participants (137 women, 48 men) used in the main within-person analyses ranged in age
from 18 to 29 years (M = 19.09, SD = 1.78) and identified as Caucasian (n = 110), Asian (n =
37), Black (n = 17), American Indian or Alaska Native (n = 1), other or multiple (n = 13), or did
not disclose their ethnicity (n = 7). Demographics for participants who were included in or
excluded from different analyses are reported in Appendix A.
Insert [Figure 2 here]
Procedure Overview
The study began with a two-hour laboratory session in which participants completed a
battery of questionnaires (available at https://osf.io/akbfj/) and a series of tasks unrelated to the
current investigation. During the laboratory session, participants were given instructions for the
ESM and EAR portions of the study. Participants subsequently completed ESM self-reports of
momentary emotion for up to two weeks, while wearing an unobtrusive recording device (the
EAR) for the first week. After data collection was complete, one team of research assistants
transcribed the participant’s speech from the EAR recordings. A separate team of research
assistants listened to the EAR recordings that matched the hours for which participants provided
ESM self-reports, and provided ratings of participants’ momentary emotion (without knowing
how the participants rated their own emotions on the ESM surveys). Although there was some

EMOTION FLUCTUATIONS AND EVERYDAY SPEECH 14
overlap in the two teams, the research assistants who transcribed a given participant’s speech did
not overlap with those who provided observer ratings of the same participant’s emotion states.
The ESM-based self-report measures provided the data for our measure of subjective
emotion experience, and the EAR transcripts provided the data for our language measures
(LIWC dictionaries and open-vocabulary themes). The EAR-based observer ratings of emotion
were used for auxiliary analyses described in the Results.
ESM Protocol
For the ESM component, four times per day (at exactly 12pm, 3pm, 6pm, and 9pm) for
14 days, participants received a text message notification and were emailed a link to a survey
(available at https://osf.io/3jkhu) that contained measures of positive and negative emotion.
Specifically, participants reported on how much happiness (“how happy were you?”; 1 = Not at
all, 3 = Somewhat, 5 = Very) and positive and negative emotions (“how much [positive/negative]
emotion did you experience?”; 1 = None at all, 3 = Some, 5 = A lot) they experienced during the
designated hour (e.g., “from 11am to 12pm”).
Following the criteria applied in previous studies that used this dataset (Finnigan &
Vazire, 2017; Wilson et al., 2016), ESM surveys were excluded if the survey was completed
more than three hours after the notification was sent, if participants indicated that they were
sleeping during the target hour, if participants completed fewer than 75% of the items, or if the
participant gave the same response for at least 70% of the items. In addition, we excluded the
practice ESM surveys that were completed in the lab (due to lack of variability in context).
All participants had data on the happiness item, but data on the positive and negative
emotion items were missing for 39 of the 185 participants, as these items were added after data
collection had begun. As the “happy” and “positive emotion” items had almost identical

EMOTION FLUCTUATIONS AND EVERYDAY SPEECH 15
distributions (aggregate Ms = 3.63 and 3.58; SDWPs = 0.86 and 0.88; SDBPs = 0.45 and 0.41) and
reliably assessed within-person change (ωWP = .84; computed using methods described by Shrout
& Lane, 2012, implemented in Mplus Version 8.1; Muthén & Muthén, 1998–2017), we
combined the two items into a positive emotion composite. Thus, we had estimates of positive
emotion experience for 185 participants (based on both items for 146 participants, and only the
“happy” item for 39 participants), and estimates of negative emotion experience for 146
participants.
EAR Recordings
For the first week of the ESM assessment period, 311 participants wore a locked iPod
Touch equipped with a microphone and iEAR app, programmed to sample 30 seconds of
participants’ ambient sounds every 9.5 minutes between 7am and 2am for up to eight days
(median = six days). This component of the study was optional, was only offered during the
academic year, and was not offered when all devices were in use. Participants were encouraged
to wear the EAR as much as possible, with the device clipped to their waistband or the outside of
their pockets (i.e., not inside a bag or pocket). Participants had no way of telling when the device
was recording, but were told that they could decide not to wear the EAR at any time for any
reason. After 3–4 days, participants returned to the lab to upload their recordings (due to device
memory limits), continued wearing the device, and returned it after another 3–4 days. We
obtained usable recordings from 304 of the 311 participants who wore the EAR (six participants
withdrew, and all files for another participant were completely silent, suggesting that the
microphone malfunctioned). When participants returned the device, they were given a compact
disc with their recordings so that they could listen to and erase any recordings they did not want

EMOTION FLUCTUATIONS AND EVERYDAY SPEECH 16
the researchers to hear. A few participants (n = 15) chose to erase files (99 total files removed),
resulting in 152,592 files.
Speech transcription. A team of research assistants transcribed all utterances by the
participants captured by the EAR. Transcribers were trained to recognize the participant’s voice,
to handle ambiguities such as repetitions, filler words, nonfluencies, and slang, and to use special
characters to indicate when participants were singing or acting (see instructions at
https://osf.io/3jkhu). Most files went through two rounds of transcription. In the first round,
research assistants transcribed all files in which participants spoke. In the second round, a
different research assistant checked and corrected the Round 1 transcripts for accuracy. Due to
human error during the two-year transcription process, some files were transcribed but not
checked by a second person, and a small percentage of the files (0.91%) were accidentally
skipped. Overall, transcribers listened to 151,205 unique files, of which 117,870 were valid
waking files (i.e., were not coded as completely silent, uninterpretable, or sleeping).
We made the following exclusions in the transcript data. First, we excluded text strings
which indicated speech that could not be transcribed because of poor audio quality or foreign
language (transcribed as “xxxx” and “ffff”, respectively). Second, as our interest was in the
content of naturalistic everyday speech, we excluded words that were marked as singing or
acting. Third, we excluded the two 30 second transcripts that corresponded to participants’ two
recordings in the lab, as all participants were instructed to say the same sentence (“My
participant number is [#] and this is my [first/reset] session”). This left 31,209 transcripts
containing at least one decipherable word spoken by the participant.
Observer-rated emotion. To supplement the ESM self-reported emotion measures, a
second team of research assistants provided observer ratings of participants’ happiness and

EMOTION FLUCTUATIONS AND EVERYDAY SPEECH 17
positive and negative emotions (and other measures available at https://osf.io/3jkhu) during the
same hours as participants’ ESM self-reports (11am–12pm, 2pm–3pm, 5pm–6pm, and 8pm–
9pm). For each participant that they were assigned, observers listened to the six or seven 30
second files for each hour corresponding to an ESM survey (3–3.5 min total per target hour). If
these files contained sufficient acoustic information, observers then rated participants’ happiness
and positive and negative emotions during the designated hour. Observer ratings used the same
items and 5-point scale (“happy”: 1 = Not at all, 3 = Somewhat, 5 = Very; positive and negative
emotion; 1 = None at all, 3 = Some, 5 = A lot) that participants used in their ESM self-reports,
but the items were worded in the third-person (i.e., “In this hour, the participant seemed
[happy/to experience positive emotion/to experience negative emotion]”). The observers also had
a “No way to tell” option that they were instructed to use sparingly.
Each participant was rated by a different set of observers, as research assistants joined
and left the lab at different times. We initially aimed to have each participant rated by three
observers. However, due to low reliability of composites based on three observers, we increased
the reliability of the composites by adding three more observers per participant (for a total of six
observers per participant), and making minor changes to the coding protocol in between the two
sets of ratings (see Supplemental Materials). Thus, our observer composites were based on the
average of up to six observers per participant.
We only kept hours that at least 3 coders rated as containing sufficient information (see
Supplemental Materials for details). Based on these criteria, 807 out of 5,222 hours (15.45%)
were categorized as uninformative (and excluded from further analyses). Of the remaining hours,
we only kept the observer ratings that corresponded to the time points in the main within-person
dataset (described below). For the final 1,511 hours included in the analyses, reliability estimates
EMOTION FLUCTUATIONS AND EVERYDAY SPEECH 18
computed from multi-level confirmatory factor analysis (described in the Supplemental
Materials) showed that the multi-observer composites reliably assessed within-person
fluctuations in participants’ positive (ωWP = .85) and negative emotion states (ωWP = .72).
Aggregation of Language Data
Because the audio files (and corresponding transcripts) were recorded throughout the day,
whereas the self-reports of emotion experience were only collected four times per day, we
aggregated the language data to match them with the self-reported emotion scores. For all
language measures (described below), we computed scores for each 30 second transcript that had
at least five words. Then, we computed the mean scores across the 30 second transcripts for the
three-hour period surrounding each ESM report (for within-person analyses) or for each person
(for between-person analyses). In this way, each 30 second transcript with at least five words
was weighted equally in computing the aggregate scores at each level, so that a particularly
verbose 30 seconds would not disproportionately outweigh the other samples from the same
three-hour period or the same week.
Within-person subset. We created linguistic aggregates for the within-person analyses
that included all language data in each target hour, plus the hour before and after the target hour
(e.g., we matched the 11am–12pm ESM report with all valid language transcripts from 10am–
1pm). We decided that having three times more potential language samples per time point (by
including the hour before and after the target hour) was more important than exactly matching
the time periods of the language and self-reported emotion samples, as having more words per
time point increases the accuracy of the estimated dictionary and topic usages (Kern at al., 2016).
To ensure that each time point contained a sufficient number of words, we also excluded three-
hour blocks that had fewer than three 30 second transcripts (with at least five words each). As

EMOTION FLUCTUATIONS AND EVERYDAY SPEECH 19
summarized in Figure 2, after excluding three-hour blocks that were not matched with ESM
reports, and participants with fewer than five observations that contained both ESM and
language data, the final within-person subset of 185 participants had a mean of 8.54 (SD = 3.24)
observations that included matched ESM reports and three-hour transcripts (1,579 observations)
with a mean of 176.62 words each (median = 149, SD = 118.74). Of these 1,579 observations,
1,511 observations (from 181 participants) had observer ratings of emotion experience (after
excluding participants who had fewer than five time points with observer-ratings of emotion).
Between-person subset. Although our key interest is in within-person correlates, we
repeated our analyses at the between-person level for comparison. For the between-person
dataset, we computed aggregate scores for each person across all 30 second transcripts that had
at least five words. We also aggregated the ESM reports that were made between the first and
last day of EAR recordings for each participant to compute person-level self-reported emotion
experience. This makes use of a greater amount of language and ESM data compared to the
within-person dataset, as it does not require that the transcripts and ESM reports be matched at
the same time points within the EAR recording period. As people are generally with other people
when they are talking, the within-person subset mostly includes ESM reports that were made in
close proximity to a social interaction. In contrast, the between-person subset also includes ESM
reports that were made when participants did not talk (i.e., had not been interacting with others),
and therefore captures a broader range of everyday experiences.
We restricted the sample to participants who had at least 30 transcripts (each containing
at least five words) and at least five ESM reports across the recording period, resulting in a final
sample of n = 248 (n = 200 for analyses involving negative emotion, due to data collection
errors). The resulting ESM aggregates were based on a mean of 16.26 (SD = 6.36) time points.

EMOTION FLUCTUATIONS AND EVERYDAY SPEECH 20
Each person had an average of 2,486.76 (median = 2,343.5, SD = 1,214.81) total decipherable
words. We also had aggregated observer-ratings of positive and negative emotion for all 248
participants, which were based on a mean of 15.43 time points (SD = 4.13; minimum 5).
Language Measures
We used the following strategies to generate quantitative summaries of the language data.
LIWC dictionaries. All transcripts were processed through the 2015 version of the
LIWC text analysis program (Pennebaker et al., 2015). Along with the affect categories (positive
emotion, negative emotion, anger, anxiety, and sadness), we selected an additional 29
psychologically interesting LIWC categories (see Table 3), plus a custom social ties dictionary
(Pressman & Cohen, 2012) to provide additional insights on social roles.
When large groups of words are abstracted into a single category and all are assumed to
be equally-valid indicators of that category (as is true with the LIWC categories), the category
label can mask what is truly being measured (Schwartz & Ungar, 2015). For example, results
could be driven by only one or two high-frequency words in each category, and these words may
be used in ways that do not reflect the category label (e.g., great in the positive emotion
dictionary being used as in “a great amount” rather than “I’m doing great!”). To provide some
idea of which words are likely to be driving the effects, we identified the top 10 most frequent
words for each dictionary that occurred in the current dataset (see Appendix C). Readers can also
explore the full set of shareable transcripts (posted in our OSF repository, with the password
available upon request), which better illustrate what the transcripts that correspond to high and
low scores on each language variable actually look like.
Open-vocabulary topics and themes. A detailed description of how we modeled the
topics, calculated the topic scores, and grouped them into themes, is available in the
EMOTION FLUCTUATIONS AND EVERYDAY SPEECH 21
Supplemental Materials. Briefly, we used Latent Dirichlet Allocation (LDA; Blei et al., 2003;
see Atkins et al., 2012, for an introduction to topic models) to create topics from the 30 second
transcripts. This procedure is similar to factor analysis, finding clusters of words that co-occur
within similar contexts, based on the distributions of words across all transcripts (i.e., blind to the
self-reported emotion scores and which person transcripts correspond to). We ran LDA on one-
to three-word phrases, rather than individual words alone, so that phrases such as “New York”
are treated as a single term. Specifically, we used pointwise mutual information (PMI; Church &
Hanks, 1990; Lin, 1998) to identify multiword collocations—two- or three-word phrases that co-
occur together more than the individual probabilities would suggest by chance. Then, we fit the
LDA model using MALLET (McCallum, 2002) via the Differential Language Analysis ToolKit
(DLATK; Schwartz et al., 2017), setting the number of topics to 300.
Next, using DLATK (Schwartz et al., 2017), we calculated the probability of using each
of the 300 topics in each 30 second transcript as the sum of all weighted word-frequencies over
each transcript. To provide more reliable estimates given our relatively limited number of
observations and number of words per time point, we further reduced the 300 topic scores into
30 dimensional “themes” using non-negative matrix factorization (Lee & Seung, 1999). We used
these 30 themes (rather than the 300 topics) for our subsequent analyses. Finally, to aid
interpretation, we added labels that summarized our impressions of what each theme represented.
Three judges suggested potential labels for the 30 themes, then the first author generated a
summary label. Five themes were not coherent enough for judges to suggest a label. Thus, labels
were assigned for 25 themes that were coherent enough for at least two of the three judges to
suggest a label (see Table S1 for the final labels and most frequent 20 words for each theme, as
well as the full set of shareable transcripts in our OSF repository for more context).

EMOTION FLUCTUATIONS AND EVERYDAY SPEECH 22
Theme replication. To provide greater confidence in the themes, we had transcripts from
a second wave of data, collected from a subset of the same participants one year later.1 As
detailed in the Supplemental Materials, we used these transcripts to model 30 themes (using the
same procedures as for the first wave of data), which allowed us to examine whether
qualitatively similar themes emerged, and to quantitatively evaluate the similarity between the
two sets of themes. After pairing each theme from the first wave of data with its most similar
theme from the second wave of data, we quantified their similarity by finding the correlation
between each pair of aligned themes between Year 1 and Year 2 (this is conceptually similar to
inter-rater reliability, where each theme contains a set of “ratings” for words, and we are
correlating these sets of ratings across the two years). Across the 30 aligned pairs of themes, we
found a median of r = .50 (SD = .27, p = .008 from a permutation test). Examples of similar
themes included schedules, food and drink, outfits, swearing, classes, and gossip. This provided
some reassurance that similar themes would emerge in a new (though not independent) dataset.
Word count. Finally, we explored associations between word count (computed using the
LIWC 2015 program) and self-reported positive and negative emotion experience. For the
within-person analyses, we used the total number of words across the transcripts included in each
three-hour block. As we only included three-hour blocks that comprised at least three 30 second
transcripts with a minimum of five words, we did not consider the correlates of speaking little
(fewer than five words) or not at all. For the between-person analyses, we used the average word
1 Although we have data from a subset of participants from a second wave of data collected one
year later, there was not enough data available for us to attempt replications of analyses for all of
our research questions. This is due to high attrition, resulting in too small of a sample to estimate
precise effect sizes in the second wave of data. However, as the development of the open-
vocabulary themes did not involve the ESM reports, and used the full set of 30 s transcripts with
more than five words, we had enough data to provide an initial replication of the themes.

EMOTION FLUCTUATIONS AND EVERYDAY SPEECH 23
count across all valid waking 30 second files (including files in which participants spoke fewer
than five words or not at all). We used average word count (instead of total word count) to avoid
confounding talkativeness with the number of valid recordings that each participant had.
Data Analysis
Within-person models. With observations (Level 1) nested within participants (Level 2),
we used multilevel models, implemented in the R package nlme (Pinheiro, Bates, DebRoy,
Sarkar, & R Core Team, 2017), with a maximum likelihood estimator. All language variables
were person-mean centered (to separate the within- and between-person effects), and all models
included random intercepts (to allow participants to have different average levels of positive and
negative emotion). In each model, either positive or negative emotion was regressed onto one
language variable and a time covariate, with both effects modeled as random slopes. The time
covariate represents the number of days that had elapsed since the start of the study, to rule out
the possibility that the association between a language variable and emotion is a consequence of
time or a confounder that changes linearly with time (Bolger & Laurenceau, 2013).
All inferences were made based on unstandardized coefficients. However, due to the
different scales and ranges of the language and emotion measures, we report standardized
regression coefficients and 95% confidence intervals (CIs) to aid interpretation of effect sizes.
We derived these standardized estimates by applying the following formula to the
unstandardized point estimates and their 95% CIs (as recommended by Hox, 2010):
Where is the standardized coefficient, b is the unstandardized coefficient, and and
are the within-person standard deviations of the predictor and outcome variables.

EMOTION FLUCTUATIONS AND EVERYDAY SPEECH 24
Between-person models. We computed the Spearman correlation (ρ) between average
self-reported positive or negative emotion and each language variable (we used the Spearman,
rather than Pearson correlation, as the language variable distributions could sometimes be very
skewed). We computed bootstrapped 95% CIs (with 1,000 resamples) around ρ using the R
package RVAideMemoire (Hervé, 2017).
Inference criteria. We include confidence intervals and uncorrected p-values, using the
conventional p < .05 threshold as a heuristic for identifying new hypotheses to be tested in future
studies (Kern et al., 2016). This prioritizes reducing Type II error over Type I error, aligned with
the exploratory nature of the study. However, to avoid overinterpreting patterns that may be due
to chance, we also indicate which correlations survive a false discovery rate (FDR) correction
(Benjamini & Hochberg, 1995), which was applied across all analyses involving correlations
between language variables (including word count) and emotion experience (across both self-
and observer ratings), separately at the within- and between-person levels (i.e., 142 analyses at
each level). The FDR criterion controls the overall proportion of false positives among all
rejections of the null hypothesis (rather than the probability of at least one false positive out of
all tests conducted, as is the case for the Bonferroni correction).
Power analysis. We used Monte Carlo simulation (described in the Supplemental
Materials) to provide a sense of the smallest within-person effect sizes we could reasonably
detect, given our sample sizes, across a range of assumed slope variances, and using an alpha of
.05 without correction for multiple tests. The most conservative estimates suggested that we had
at least 80% power to detect relatively small minimum standardized sizes of β = 0.11 for positive
emotion and β = 0.12 for negative emotion. We also used the pwr package (Champely et al.,
2017) to conduct sensitivity power analyses for the between-person correlations. Although this

EMOTION FLUCTUATIONS AND EVERYDAY SPEECH 25
power analysis assumes Pearson correlations (which has similar, but slightly smaller sample size
requirements than Spearman correlations; Bonett & Wright, 2000), these suggested that had we
approximately 80% power to detect correlations > .18 for positive emotion and > .20 for negative
emotion. However, we had substantially less power to detect FDR-corrected effects.
Results
Descriptive Statistics
Descriptive statistics for all variables are reported in Appendix B (for ESM and
dictionary variables) and Table S1 (for the 30 themes). The intra-class correlations (ICC(1)s;
Shrout & Fleiss, 1979) show that there was substantial (> 84%) within-person variability for the
language variables, comparable to the within-person variability in self-reported emotion states
(~80%). This supports the feasibility of studying the correlates of within-person fluctuations in
language use.
Within-Person Analyses
LIWC emotion dictionaries. We first examined whether within-person fluctuations in
LIWC emotion scores (positive emotion, negative emotion, sadness, anxiety, and anger) were
associated with within-person fluctuations in self-reported emotion experience. As shown in
Table 2 (see also Figure 3), none of the LIWC emotion dictionaries were significantly or
meaningfully associated with self-reported positive or negative emotion states at the within-
person level. That is, we found no evidence that the LIWC emotion scores, computed on
everyday speech, tracked people’s self-reported emotion experience.
Auxiliary analyses. We explored one potential explanation for the null associations
between LIWC emotion scores and self-reported emotion: perhaps one or both of these measures
were not valid measures of emotion experience. When two measures of a construct disagree,

EMOTION FLUCTUATIONS AND EVERYDAY SPEECH 26
comparison with a third measure can provide further context on the validity of both measures
(e.g., Vazire, 2010). We therefore examined how LIWC emotion scores and self-reported
emotion are associated with a third measure of emotion experience—observer ratings. Although
observer ratings are far from a perfect measure of emotion experience, if the LIWC emotion
scores and self-report are associated with this third criterion, this would provide further evidence
of their validity as measures of emotion experience.
We found that participants agreed with observers to a large extent on within-person
fluctuations in positive emotion experience, = 0.37, 95% CI [0.32, 0.42], p < .001. Participants
also showed some agreement with observers on within-person fluctuations in negative emotion
experience, = 0.16, 95% CI [0.09, 0.22], p < .001. This suggests that these self-report measures
of state emotion do capture systematic fluctuations in emotion experience that outside observers
can detect from brief audio recordings (which also rules out the possibility that the EAR
recordings contained no behavioral indicators of emotion experience).
In contrast, as shown in Table 2, none of the LIWC emotion scores were associated with
observer-rated positive emotion at the within-person level. The LIWC negative emotion and
anger scores had significant—but small—within-person associations with observer ratings of
negative emotion ( = 0.07 and = 0.09, respectively). This suggests that, at best, fluctuations in
LIWC emotion scores are only minimally related with an alternative measure of momentary
emotion experience.
Insert [Table 2 here]
Insert [Figure 3 here]
Indirect linguistic markers. We next explored indirect linguistic markers of emotion
states, using closed-vocabulary (LIWC dictionaries) and open-vocabulary (themes) approaches.
EMOTION FLUCTUATIONS AND EVERYDAY SPEECH 27
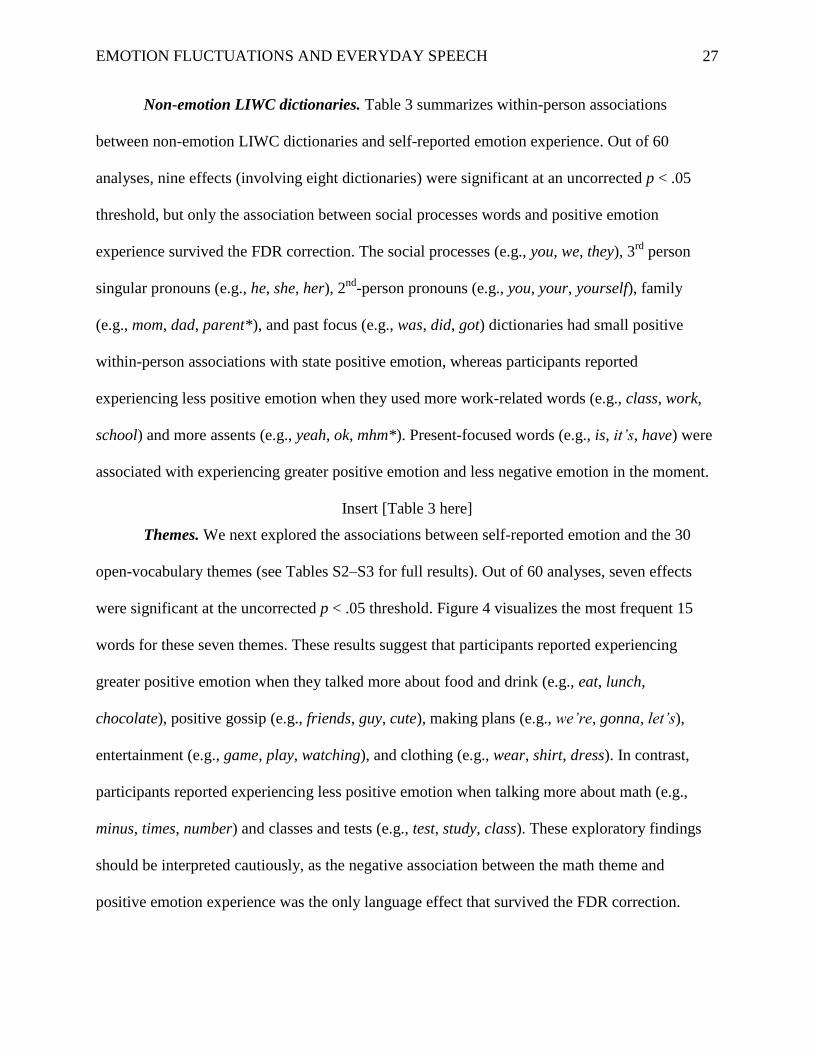
Non-emotion LIWC dictionaries. Table 3 summarizes within-person associations
between non-emotion LIWC dictionaries and self-reported emotion experience. Out of 60
analyses, nine effects (involving eight dictionaries) were significant at an uncorrected p < .05
threshold, but only the association between social processes words and positive emotion
experience survived the FDR correction. The social processes (e.g., you, we, they), 3rd
person
singular pronouns (e.g., he, she, her), 2nd
-person pronouns (e.g., you, your, yourself), family
(e.g., mom, dad, parent*), and past focus (e.g., was, did, got) dictionaries had small positive
within-person associations with state positive emotion, whereas participants reported
experiencing less positive emotion when they used more work-related words (e.g., class, work,
school) and more assents (e.g., yeah, ok, mhm*). Present-focused words (e.g., is, it’s, have) were
associated with experiencing greater positive emotion and less negative emotion in the moment.
Insert [Table 3 here]
Themes. We next explored the associations between self-reported emotion and the 30
open-vocabulary themes (see Tables S2–S3 for full results). Out of 60 analyses, seven effects
were significant at the uncorrected p < .05 threshold. Figure 4 visualizes the most frequent 15
words for these seven themes. These results suggest that participants reported experiencing
greater positive emotion when they talked more about food and drink (e.g., eat, lunch,
chocolate), positive gossip (e.g., friends, guy, cute), making plans (e.g., we’re, gonna, let’s),
entertainment (e.g., game, play, watching), and clothing (e.g., wear, shirt, dress). In contrast,
participants reported experiencing less positive emotion when talking more about math (e.g.,
minus, times, number) and classes and tests (e.g., test, study, class). These exploratory findings
should be interpreted cautiously, as the negative association between the math theme and
positive emotion experience was the only language effect that survived the FDR correction.

EMOTION FLUCTUATIONS AND EVERYDAY SPEECH 28
Word count. Word count was a substantial predictor of greater state positive emotion (
= 0.20, 95% CI [0.14, 0.25], p < .001) and less negative emotion ( = –0.08, 95% CI [–0.14, –
0.02], p = .011). That is, participants either felt happier when they talked more or talked more
when they felt happier, even though we restricted the analysis to time points in which
participants spoke at least five words in at least three 30 second files during the three hours
surrounding an ESM report. The within-person association between word count and state
positive emotion also survived a FDR correction, suggesting that regardless of content, quantity
of speech may be a robust predictor of state positive emotion experience.
Insert [Figure 4 here]
Between-Person Analyses
Although the primary focus of our research was on within-person fluctuations, we
repeated all analyses at the between-person level. First, we examined whether between-person
differences in LIWC emotion scores were correlated with between-person differences in self-
reported emotion experience. Consistent with our results at the within-person level, none of the
LIWC emotion scores were significantly associated with average self-reported positive or
negative emotion states at the between-person level (see Table 4 and Figure 5). For
completeness, we also repeated the auxiliary analyses involving the observer ratings of emotion.
Participants agreed with observers to a modest extent on average levels of positive emotion
experience, ρ =.13, 95% CI [+.00, .26], p =.046, but did not show significant agreement on
average levels of negative emotion, ρ =.11, 95% CI [–.03, .25], p = .106. The LIWC emotion
dictionaries did show two associations with observer-ratings, but one of these was in the opposite
direction than what might be expected (LIWC anxiety was positively correlated with self-
reported positive emotion; see Table 4).
EMOTION FLUCTUATIONS AND EVERYDAY SPEECH 29
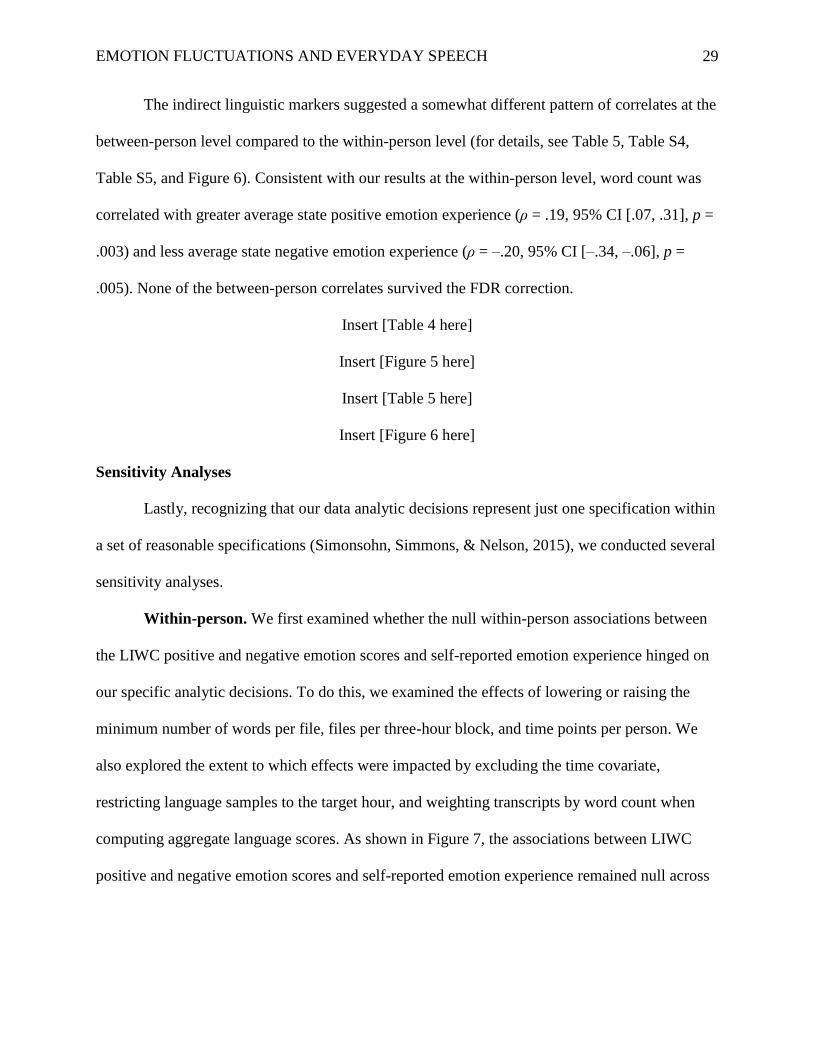
The indirect linguistic markers suggested a somewhat different pattern of correlates at the
between-person level compared to the within-person level (for details, see Table 5, Table S4,
Table S5, and Figure 6). Consistent with our results at the within-person level, word count was
correlated with greater average state positive emotion experience (ρ = .19, 95% CI [.07, .31], p =
.003) and less average state negative emotion experience (ρ = –.20, 95% CI [–.34, –.06], p =
.005). None of the between-person correlates survived the FDR correction.
Insert [Table 4 here]
Insert [Figure 5 here]
Insert [Table 5 here]
Insert [Figure 6 here]
Sensitivity Analyses
Lastly, recognizing that our data analytic decisions represent just one specification within
a set of reasonable specifications (Simonsohn, Simmons, & Nelson, 2015), we conducted several
sensitivity analyses.
Within-person. We first examined whether the null within-person associations between
the LIWC positive and negative emotion scores and self-reported emotion experience hinged on
our specific analytic decisions. To do this, we examined the effects of lowering or raising the
minimum number of words per file, files per three-hour block, and time points per person. We
also explored the extent to which effects were impacted by excluding the time covariate,
restricting language samples to the target hour, and weighting transcripts by word count when
computing aggregate language scores. As shown in Figure 7, the associations between LIWC
positive and negative emotion scores and self-reported emotion experience remained null across
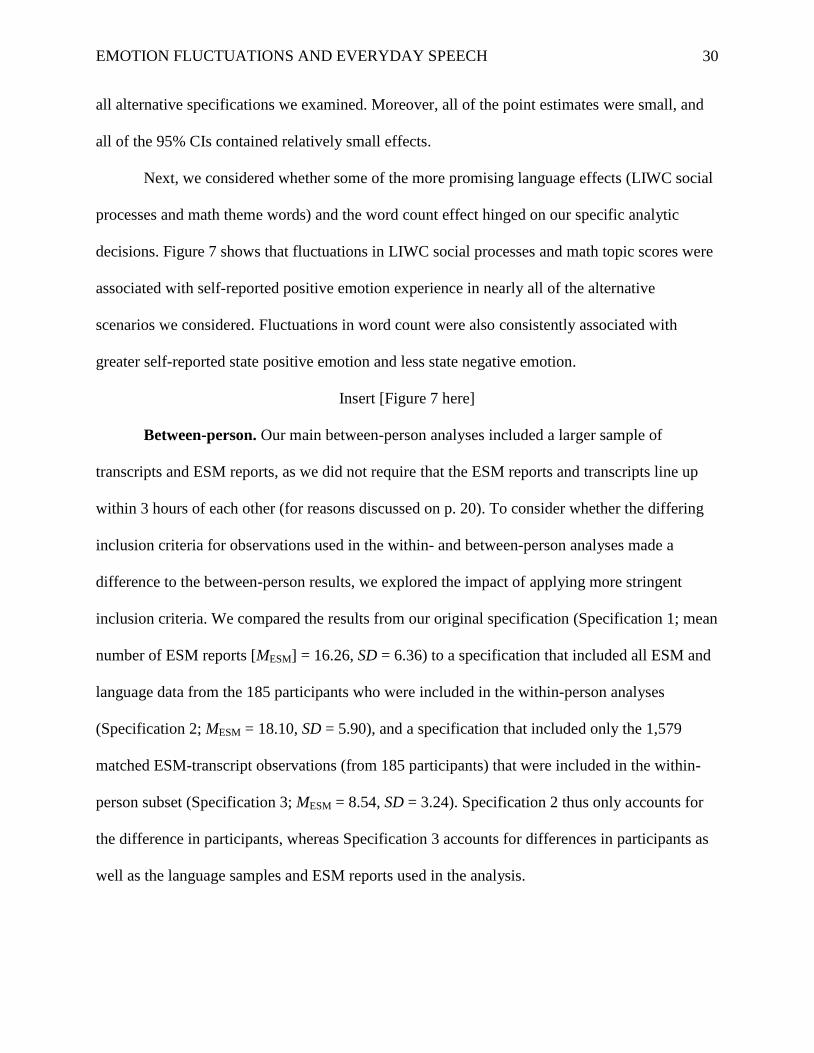
EMOTION FLUCTUATIONS AND EVERYDAY SPEECH 30
all alternative specifications we examined. Moreover, all of the point estimates were small, and
all of the 95% CIs contained relatively small effects.
Next, we considered whether some of the more promising language effects (LIWC social
processes and math theme words) and the word count effect hinged on our specific analytic
decisions. Figure 7 shows that fluctuations in LIWC social processes and math topic scores were
associated with self-reported positive emotion experience in nearly all of the alternative
scenarios we considered. Fluctuations in word count were also consistently associated with
greater self-reported state positive emotion and less state negative emotion.
Insert [Figure 7 here]
Between-person. Our main between-person analyses included a larger sample of
transcripts and ESM reports, as we did not require that the ESM reports and transcripts line up
within 3 hours of each other (for reasons discussed on p. 20). To consider whether the differing
inclusion criteria for observations used in the within- and between-person analyses made a
difference to the between-person results, we explored the impact of applying more stringent
inclusion criteria. We compared the results from our original specification (Specification 1; mean
number of ESM reports [MESM] = 16.26, SD = 6.36) to a specification that included all ESM and
language data from the 185 participants who were included in the within-person analyses
(Specification 2; MESM = 18.10, SD = 5.90), and a specification that included only the 1,579
matched ESM-transcript observations (from 185 participants) that were included in the within-
person subset (Specification 3; MESM = 8.54, SD = 3.24). Specification 2 thus only accounts for
the difference in participants, whereas Specification 3 accounts for differences in participants as
well as the language samples and ESM reports used in the analysis.

EMOTION FLUCTUATIONS AND EVERYDAY SPEECH 31
We first compared the ESM scores for Specifications 2 and 3 (Specification 1 had
different participants so was not comparable). The scores correlated at ρ = .87 for positive affect
and ρ = .87 for negative affect. This suggests that there is a slight difference in the rank-ordering
of the same participants’ average self-reported emotion experience, depending on whether we
included all ESM reports (Specification 2) or only those that were matched with sufficient
amounts of speech (Specification 3). Average levels of positive emotion were also lower in
Specification 2 (M = 3.46, SD = 0.50) compared to Specification 3 (M = 3.62, SD = 0.51), d = –
0.66, 95% CI [–0.87, –0.45]. Similarly, average levels of negative emotion were slightly higher
in Specification 2 (M = 2.15, SD = 0.52) compared to Specification 3 (M = 2.08, SD = 0.53), d =
0.28, 95% CI [0.05, 0.52]. This suggests that including ESM reports across time points when
participants were not talking much (or at all) captures a greater number of relatively unhappy
moments, providing a more representative sample of participants’ emotion experience across the
week.
Next, we examined whether there were systematic differences in the correlations between
the 65 language variables and self-reported emotion across the three specifications. Compared to
Specification 1, the rank-ordering of the 130 correlations (65 for positive affect and 65 for
negative affect) was very similar for Specification 2 (ρ = .92), but somewhat different for
Specification 3 (ρ = .59). This suggests that the pattern of correlates depends on whether we only
aggregate across language samples and emotion reports that are closely matched in time. We
therefore report the full results for the Model 3 specification in Tables S7 to S9. Finally, we
explored systematic differences in the size of relationships between sampling approaches which
might provide direction for aggregation decisions in future studies. The average absolute
correlation strength was slightly lower for Specification 1 (M =.068, SD = .047) compared to

EMOTION FLUCTUATIONS AND EVERYDAY SPEECH 32
Specification 2 (M = .08, SD = .06), d = –0.33, 95% CI [–0.58, –0.08]. Specification 2 produced
a slightly higher average absolute correlation strength compared to Specification 3 (M = .058, SD
= .041; d = 0.37, 95% CI [0.12, 0.62] (all comparisons were after applying the Fisher r-to-z
transformation).
Discussion
The present research explored whether people leave traces of their subjective emotion
states through fluctuations in everyday spoken language, extending perspectives on within-
person personality processes to the domain of spoken language. We found no evidence that
LIWC emotion dictionary scores based on transcripts of students’ spoken language over one
week were associated with self-reported emotion experience assessed repeatedly during the same
period, at either the within- or between-person levels. Our findings suggest that researchers
should not assume that fluctuations in LIWC emotion scores can be used as a proxy for
subjective emotion experience, at least for spoken language. These findings are exploratory and
need to be corroborated by future studies that use different populations and denser samples of
everyday spoken language. However, even if LIWC emotion scores based on everyday spoken
language turn out not to be valid proxies of subjective emotion experience, people may still leave
behavioral traces of their momentary emotion experience through other aspects of their everyday
conversations. Indeed, our results suggest some potential indirect linguistic markers of subjective
emotion states, pointing to new hypotheses and insights about what people are thinking and
doing when they are experiencing ups and downs in their momentary emotions.
Validity of LIWC Emotion Scores for Measuring Fluctuations in Emotion Experience
A number of recent studies have used LIWC positive and negative emotion scores as the
basis for conclusions that have implications for theories of emotion experience (e.g., Doré et al.,
EMOTION FLUCTUATIONS AND EVERYDAY SPEECH 33
2015; Golder & Macy, 2011). But to date, only one other study has directly tested whether
LIWC emotion scores are valid indicators of subjective emotion experience, finding no evidence
that LIWC emotion scores computed on Facebook posts track fluctuations in self-reported
emotion experience (Kross et al., 2018). Testing this assumption in a different language
context—everyday speech—we similarly did not find evidence that LIWC emotion scores
validly captured fluctuations in, or average levels of, state emotion experience. Across both our
main and sensitivity analyses, the within-person associations between LIWC positive and
negative emotion scores and self-reported emotion experience remained small and null.
Moreover, none of the effect sizes captured in the 95% confidence intervals were large enough to
justify using LIWC emotion scores based on spoken language as a substitute for self-reports of
emotion experience. In contrast, some of the alternative language variables we explored (LIWC
social processes, math theme) appeared to be more promising as potential correlates of state
emotion experience.
We evaluated the convergent validity of LIWC emotion scores based on spoken language
by comparing them with one- or two-item self-reports of state emotion experience, which we
treated as the criterion measure of how participants actually felt in the moment. In doing so, our
interpretations rest on the assumption that these self-reports contain a substantial amount of valid
variance. It is possible that the lack of agreement between LIWC emotion scores and self-
reported emotion experience was because our self-report measures were not valid. However,
fluctuations in self-reported emotion experience were moderately to strongly correlated with
fluctuations in observer ratings of participants’ emotion states. This suggests that the self-
reported positive and negative emotion measures contain valid within-person variance that even
outside observers can detect, supporting our interpretation that ESM self-reports measure some
EMOTION FLUCTUATIONS AND EVERYDAY SPEECH 34
aspect of emotion (broadly construed) that is different from what LIWC emotion scores
(computed on everyday speech) may be capturing.
The null associations could be due, in part, to words within the LIWC emotion
dictionaries that are often used in ways that do not reflect their intended emotional sense. A
weakness of manually-created dictionaries (such as the LIWC emotion dictionaries) is that words
that seem like a good fit with a category (e.g., great, in the sense of “that’s great!”) are often
used in ways that do not convey positive emotion (e.g., “it was a great disaster”; Schwartz &
Ungar, 2015). For instance, Cohen (2011) modified the LIWC 2007 emotion dictionaries by
excluding words with common non-emotional meanings (e.g., pretty, like), and found that scores
from the modified dictionaries were more strongly associated with psychological distress and
depression than were scores from the original dictionaries. Similarly, Schwartz, Eichstaedt,
Blanco, Dziurzyński, Kern, and colleagues (2013) asked three people to evaluate whether 1,000
instances of LIWC positive and negative emotion words conveyed the intended emotional state
(in the context of the sentences they occurred in). Around 30% of occurrences of LIWC emotion
words were judged as having incorrect signals (e.g., wrong part of speech, wrong word sense,
overly-inclusive stems), but modifying the dictionaries by automatically removing lexically
ambiguous words reduced human-rated signal error by approximately 23%.
Importantly, given that the psychological correlates of language use may differ depending
on the communication context (Mehl, Robbins, & Holleran, 2012), everyday speech likely
differs in important ways from other language contexts in which the association between
language use and emotion experience has been examined. By observing people in their everyday
lives, the EAR captures not only emotionally-charged conversations (e.g., emotional outbursts,
arguments, confiding in or celebrating with a friend), but also many more mundane exchanges,

EMOTION FLUCTUATIONS AND EVERYDAY SPEECH 35
such as ordering food and coordinating logistics. Thus, daily conversations may better capture
the full range of what people actually do and what is on their mind in their everyday lives,
compared with laboratory-based writing and interview tasks (where participants are asked to
respond to specific prompts), and social media language (where people may only post thoughts
that they believe are noteworthy). Everyday conversations also provide non-verbal avenues for
expressing emotion (e.g., intonation, volume, facial expression), which may reduce people’s
reliance on emotion words for communicating emotions, and might explain why observers were
able to detect emotion better than the language-only measures.
Another difference between EAR-based language measures and many written language
measures is that EAR transcripts contain fewer words than typical samples of written language,
especially when data from shorter time periods (e.g., 9–10 minutes of recordings across three
hours) are used for within-person analyses. Thus, it is possible that the associations we observed
are weakened by the sparsity of words, particularly for categories with low base rates. Finally,
when people are speaking, they are typically interacting with other people, so are more likely to
already be in a relatively positive mood (e.g., Lucas et al., 2008), compared to social media posts
that people might make when they are alone and in a negative mood (Seabrook, Kern, &
Rickard, 2016). Thus, rather than suggesting that LIWC emotion dictionaries do not capture
fluctuations in emotion experience in general, our findings point to a potential boundary
condition for when these dictionaries might not be valid indicators of emotion experience.
Our findings also illustrate the general psychometric principle that validity cannot be
taken for granted. Like any other psychological measure, researchers need to validate language-
based measures in specific language contexts (e.g., social media vs. everyday conversations), and
for specific purposes (e.g., measuring vs. discovering correlates of emotion experience; see

EMOTION FLUCTUATIONS AND EVERYDAY SPEECH 36
Grimmer & Stewart, 2013). We emphasize that our findings do not challenge the existence of
associations between LIWC emotion dictionaries and various outcomes of interest reviewed in
the introduction. Instead, we concur with Kross and colleagues’ (2018) conclusion that LIWC
emotion scores may have predictive validity, without capturing subjective emotion experience.
In addition, as different measures of emotion (e.g., self-report, physiological, behavioral)
typically show weak convergence (for a review, see Mauss & Robinson, 2009), LIWC emotion
scores might capture a different component of emotion that is expressed linguistically but is not
accessible to conscious awareness (e.g., Wojcik, Hovasapian, Graham, Motyl, & Ditto, 2015).
Insights from Indirect Linguistic Markers
We considered the possibility that language in everyday conversations could provide
indirect clues to people's emotion states by reflecting the everyday thoughts and behaviors that
are associated with ups and downs in emotion experience. The indirect linguistic markers we
examined were only weakly associated, in isolation, with experienced emotion, suggesting they
are likely not useful as sole markers of emotion experience. This pattern may also be influenced
by the sparsity issue raised above (i.e., people may speak too few words per time point to provide
reliable estimates of language use), or the timing and reliability of the ESM measures. Still,
though individual dictionaries and themes may carry too little signal to be viable measures of
emotion, they can nevertheless be a useful source of open-ended insights into potential cognitive
and behavioral correlates of state emotional well-being. In this hypothesis-generating role, the
size of the correlation between the language variable and emotion is less important, because the
emotion-relevant thoughts or behaviors that the words might reflect are more interesting than the
words themselves. For example, some hypotheses suggested by this study—some of which are
consistent with existing theories and empirical evidence—include the possibilities that people

EMOTION FLUCTUATIONS AND EVERYDAY SPEECH 37
feel happier when anticipating a meal (food and drink theme), discussing entertainment
(entertainment theme), and feeling socially connected (positive gossip theme). In contrast, people
might feel less happy when they are studying (math and classes and tests themes). These
hypotheses could be tested using more direct measures of these thoughts and behaviors (e.g.,
self-report, behavioral codings), which, if the hypotheses are supported, would likely yield larger
effect sizes than the language-based measures.
Although there was some overlap, we found a somewhat different set of
linguistic correlates at the between-person level. As these analyses included additional language
and self-reported emotion samples that were not matched in time, this suggests that the
alignment of timing between language and self-reports of emotional states might make a
difference, and should be considered carefully. More broadly, the differences between the results
at the within- and between-person level provide a reminder that effects that apply at one level
may not hold at another level. Thus, we should not extrapolate from the trait level to the state
level (i.e., commit the ecological fallacy; Kievit et al., 2013; Molenaar & Campbell, 2009).
This also illustrates the importance of demonstrating the validity of linguistic markers at the
appropriate level (e.g., evidence for the validity of LIWC emotion dictionaries at the between-
person level does not imply validity for assessing within-person change).
Opportunities of Combining Multiple Daily Life Methods
For the past few decades, psychologists have focused on studying stable individual
differences in the words that people use (e.g., Pennebaker & King, 1999). Recent theoretical
advancements in personality science have established the value of examining within-person
variability in personality states (Fleeson, 2017; Vazire & Sherman, 2017). The current study
demonstrates that this within-person perspective can be usefully applied to understand the
EMOTION FLUCTUATIONS AND EVERYDAY SPEECH 38
psychological correlates of fluctuations in language use. The general methodological strategy we
used—combining repeated, matched assessments of objective naturalistic behaviors (everyday
speech, captured by the EAR) and subjective perceptions of momentary experiences (captured
through ESM self-reports)—also extends the study of within-person personality variability
beyond self-report, and paves the way for novel future studies of intra-individual variability.
For example, future studies might examine trait and situational moderators of within-
person associations (e.g., is there a stronger link between LIWC emotion scores and self-reported
emotion for people who suppress their emotions less, or in private vs. public communication
contexts?). With enough time points per person, future studies could use time series analyses
(Jebb, Tay, Wang, & Huang, 2015) to forecast future emotion states from language use at a
previous time point. Finally, this within-person perspective could be extended to constructs other
than emotion experience, and behaviors other than language. For example, what are the linguistic
correlates of Big Five personality states? Do people use different words when they have more
social status, compared to when they have less social status? Beyond language, are other
behavioral markers that can be used to track fluctuations in state emotion, such as tone of voice?
In a related paper, we found little evidence that acoustic features could be used to automatically
track momentary happiness (Weidman et al., in press). This points to the difficulty, and
continued importance, of discovering feasible alternatives to self-report measures of subjective
emotion experience.
Limitations
We acknowledge several limitations of our study. Due to privacy and feasibility concerns
(e.g., the human effort required to transcribe the recordings), we only recorded 30 seconds every
9.5 minutes, which limits the number of words we were able to capture for each observation in
EMOTION FLUCTUATIONS AND EVERYDAY SPEECH 39
the within-person analyses. Considering the amount of noise inherent in natural language data,
plus additional noise from human error in transcription, we decided to use as much language data
as possible by including transcripts sampled in the three-hour period surrounding each ESM
report. Even so, our minimum threshold of three 30 second transcripts with at least five words
each per three-hour transcript was relatively low. Ideally, we would set a higher minimum
threshold, but this comes with a trade-off of fewer time points per person, fewer people in the
analysis, and a less representative sample of time points and people (e.g., introverts, who are
generally less talkative, would be more likely to be excluded). Indeed, the finding that people
feel happier when they talk more suggests that excluding relatively quiet moments would restrict
the range of emotional experiences that are sampled. Such tradeoffs can be seen in Figure 7,
which shows the number of people and time points that are available for analysis when different
decisions are made.
There are also limitations with the self-report method. Our two-item positive and one-
item negative emotion self-report measures were crude. Although one-item measures are
commonly used in ESM studies (e.g., Choi, Catapano, & Choi, 2016; Weidman & Dunn, 2016),
at least three items are typically needed to reliably assess change (Shrout & Lane, 2012). Our
broad assessment of positive and negative emotion also prevented us from validating the more
specific LIWC emotion categories of sadness, anxiety, and anger against self-reported
experiences of these discrete emotions.
As mentioned throughout, this study was exploratory, and only two language effects
survived the FDR correction. In addition, as we conducted many statistical tests, the uncorrected
p-values can only be used as a rough heuristic for potentially meaningful findings to be tested in
future studies. Sensitivity analyses provide some reassurance that the within-person associations

EMOTION FLUCTUATIONS AND EVERYDAY SPEECH 40
between state positive emotion experience and both the social processes and math theme scores
are robust to several alternative reasonable specifications (see Figure 7). However, new data will
be needed to determine the robustness of the specific linguistic correlates that emerged in this
dataset.
Constraints on Generality
Finally, we recognize two key constraints on generality (Simons, Shoda, & Lindsay,
2017). First, previous work in both computational linguistics (Daumé & Marcu, 2006) and in the
use of LIWC (Mehl et al., 2012) has suggested that models and correlates found in the context of
written language do not generalize well to spoken language and vice-versa. As we only
examined everyday spoken language, we do not have evidence that the open-vocabulary themes
or linguistic correlates that we found in this study would generalize to other language contexts
(e.g., social media posts, diary entries).
Second, our sample of college students at a selective, private US university represents a
WEIRD (Western, Educated, Industrialized, Rich, Democratic; Henrich, Heine, & Norenzayan,
2010) sample. As the open-vocabulary themes were created based on the transcripts in this study,
some of the themes likely would not emerge in other samples. However, we suspect that some
similar themes would emerge in other university students (e.g., college assessments, math) and
non-student WEIRD samples (e.g., gossip, food and drink). Furthermore, we predict that similar
associations between LIWC emotion dictionaries and self-reported emotion would generalize to
other non-student WEIRD samples. However, it is possible that other populations differ in the
within-person variability of their everyday emotion experience, or in the extent to which they
express their emotion fluctuations verbally. We suspect that, if anything, our sample would be
particularly likely to express their emotions verbally, as they are in a relatively comfortable

EMOTION FLUCTUATIONS AND EVERYDAY SPEECH 41
environment to do so, and have strong language skills. However, this is mere speculation and
these questions need to be tested in a range of samples. We have no reason to believe that the
results depend on other characteristics of the participants, materials, or context, but this would
need to be tested in subsequent studies across a range of samples.
Conclusion
The present research explored the possibility that people leave traces of their momentary
emotional well-being through the words they use in their spontaneous everyday conversations.
We found that LIWC positive and negative emotion dictionary scores computed on everyday
speech did not correlate with self-reported emotion experience at either the within- or between-
person levels. In contrast, we found robust evidence that people talk more when they are feeling
happier, and suggestive evidence that other word patterns (e.g., social words) may be related to
subjective emotion experience. These findings emphasize the importance of establishing (rather
than assuming) the validity of emotion dictionaries as measures of emotion experience within
each language context of interest, and suggest that alternative, open-ended approaches to
linguistic analysis may uncover new insights about what people are thinking and doing when
they are experiencing positive or negative emotions in everyday life.
EMOTION FLUCTUATIONS AND EVERYDAY SPEECH 42
References
Aletras, N., & Stevenson, M. (2014). Measuring the similarity between automatically generated
topics. In Proceedings of the 14th Conference of the European Chapter of the Association
for Computational Linguistics, Volume 2: Short Papers. http://doi.org/10.3115/v1/e14-4005
Allport, G. W., & Odbert, H. S. (1936). Trait-names: A psycho-lexical study. Psychological
Monographs, 47(1), i-171. http://doi.org/10.1037/h0093360
Alvarez-Conrad, J., Zoellner, L. A., & Foa, E. B. (2001). Linguistic predictors of trauma
pathology and physical health. Applied Cognitive Psychology, 15(7).
http://doi.org/10.1002/acp.839
Atkins, D. C., Rubin, T. N., Steyvers, M., Doeden, M. A., Baucom, B. R., & Christensen, A.
(2012). Topic models: A novel method for modeling couple and family text data. Journal of
Family Psychology, 26(5), 816–827. http://doi.org/10.1037/a0029607
Back, M. D., Küfner, A. C. P., & Egloff, B. (2010). The emotional timeline of September 11,
2001. Psychological Science, 21(10), 1417–1419.
http://doi.org/10.1177/0956797610382124
Baylis, P., Obradovich, N., Kryvasheyeu, Y., Chen, H., Coviello, L., Moro, E., … Fowler, J. H.
(2018). Weather impacts expressed sentiment. PLoS ONE, 13(4), e0195750.
http://doi.org/10.1371/journal.pone.0195750
Benjamini, Y., & Hochberg, Y. (1995). Controlling the false discovery rate: A practical and
powerful approach to multiple testing. Journal of the Royal Statistical Society. Series B
(Methodological). http://doi.org/10.2307/2346101
Blei, D. M., Ng, A. Y., & Jordan, M. I. (2003). Latent Dirichlet Allocation. Journal of Machine
Learning Research, 3, 993–1022. http://doi.org/10.1162/jmlr.2003.3.4-5.993

EMOTION FLUCTUATIONS AND EVERYDAY SPEECH 43
Bolger, N., & Laurenceau, J.-P. (2013). Fundamentals of intensive longitudinal data. In N.
Bolger & J.-P. Laurenceau (Eds.), Intensive longitudinal methods: An introduction to diary
and experience sampling research (pp. 27–39). New York: Guilford Press.
Bollen, J., Mao, H., & Zeng, X. (2011). Twitter mood predicts the stock market. Journal of
Computational Science, 107, 730–743. http://doi.org/10.1016/j.jocs.2010.12.007
Bonett, D. G., & Wright, T. A. (2000). Sample size requirements for estimating Pearson, Kendall
and Spearman correlations. Psychometrika. http://doi.org/10.1007/BF02294183
Breil, S. M., Geukes, K., Wilson, R. E., Nestler, S., Vazire, S., & Back, M. (in press). Zooming
into real-life extraversion–How personality and situation shape sociability in social
interactions. Collabra: Psychology.
Champely, S., Ekstrom, C., Dalgaard, P., Gill, J., Weibelzahl, S., Anandkumar, A., … De
Rosario, H. (2017). pwr: Basic functions for power analysis (R package version 1.1–2).
Retrieved from https://cran.r-project.org/package=pwr
Church, K. W., & Hanks, P. (1990). Word association norms, mutual information, and
lexicography. Computational Linguistics, 16(1), 22–29.
http://doi.org/10.3115/981623.981633
Cohen, A. S., Minor, K. S., Baillie, L. E., & Dahir, A. M. (2008). Clarifying the linguistic
signature: Measuring personality from natural speech. Journal of Personality Assessment,
90(6), 559–63. http://doi.org/10.1080/00223890802388459
Cohen, S. J. (2011). Measurement of negativity bias in personal narratives using corpus-based
emotion dictionaries. Journal of Psycholinguistic Research, 40(2), 119–135.
http://doi.org/10.1007/s10936-010-9158-7
Colman, D. E., Vineyard, J., & Letzring, T. D. (2018). Exploring beyond simple demographic

EMOTION FLUCTUATIONS AND EVERYDAY SPEECH 44
variables: Differences between traditional laboratory samples and crowdsourced online
samples on the Big Five personality traits. Personality and Individual Differences, 133, 41–
46. http://doi.org/10.1016/j.paid.2017.06.023
Cohn, M. A., Mehl, M. R., & Pennebaker, J. W. (2004). Markers of linguistic psychological
change surrounding September 11, 2001. Psychological Science, 15(10), 687–693.
http://doi.org/10.1111/j.0956-7976.2004.00741.x
Danner, D. D., Snowdon, D. A., & Friesen, W. V. (2001). Positive emotions in early life and
longevity: Findings from the nun study. Journal of Personality and Social Psychology,
80(5), 804–13. http://doi.org/10.1037/0022-3514.80.5.804
Daumé, H., & Marcu, D. (2006). Domain adaptation for statistical classifiers. Journal of
Artificial Intelligence Research, 26, 101–126. http://doi.org/10.1613/jair.1872
De Choudhury, M., & Gloria, A. M. (2014). “Narco” emotions: Affect and desensitization in
social media during the Mexican drug war. In Conference on Human Factors in Computing
Systems (pp. 1–10). http://doi.org/10.1145/2556288.2557197
Diener, E. (1984). Subjective well-being. Psychological Bulletin, 95(3), 542–75.
http://doi.org/10.1037/0033-2909.95.3.542
Doré, B., Ort, L., Braverman, O., & Ochsner, K. N. (2015). Sadness shifts to anxiety over time
and distance from the national tragedy in Newtown, Connecticut. Psychological Science,
26(4), 363–373. http://doi.org/10.1177/0956797614562218
Edwards, T., & Holtzman, N. S. (2017). A meta-analysis of correlations between depression and
first person singular pronoun use. Journal of Research in Personality, 68, 63–
68. http://doi.org/10.1016/j.jrp.2017.02.005
Ekman, P. (1993). Facial expression and emotion. American Psychologist, 48(4), 384–392.
EMOTION FLUCTUATIONS AND EVERYDAY SPEECH 45
http://doi.org/10.1037/0003-066X.48.4.384
Fast, L. A., & Funder, D. C. (2008). Personality as manifest in word use: Correlations with self-
report, acquaintance report, and behavior. Journal of Personality and Social Psychology,
94(2), 334–346. http://doi.org/10.1037/0022-3514.94.2.334
Finnigan, K. M., & Vazire, S. (2018). The incremental validity of average state self-reports over
global self-reports of personality. Journal of Personality and Social Psychology, 115(2),
321–337. http://doi.org/10.1037/pspp0000136
Fleeson, W. (2001). Toward a structure- and process-integrated view of personality: Traits as
density distributions of states. Journal of Personality and Social Psychology, 80(6), 1011–
1027. http://doi.org/10.1037//0022-3514.80.6.1011
Fleeson, W. (2017). The production mechanisms of traits: Reflections on two amazing decades.
Journal of Research in Personality, 69, 4–12. http://doi.org/10.1016/j.jrp.2017.07.003
Geldhof, G. J., Preacher, K. J., & Zyphur, M. J. (2014). Reliability estimation in a multilevel
confirmatory factor analysis framework. Psychological Methods, 19(1), 72–91.
http://doi.org/10.1037/a0032138
Goldberg, L. R. (1993). The structure of phenotypic personality traits. American Psychologist,
48(12), 1302–1303. http://doi.org/10.1037/0003-066X.48.1.26
Golder, S. A., & Macy, M. W. (2011). Diurnal and seasonal mood vary with work, sleep, and
daylength across diverse cultures. Science, 333(6051), 1878–1881.
http://doi.org/10.1126/science.1225053
Grimmer, J., & Stewart, B. M. (2013). Text as data: The promise and pitfalls of automatic
content analysis methods for political texts. Political Analysis, 21(3), 267–297.
http://doi.org/10.1093/pan/mps028
EMOTION FLUCTUATIONS AND EVERYDAY SPEECH 46
Guntuku, S. C., Yaden, D. B., Kern, M. L., Ungar, L. H., & Eichstaedt, J. C. (2017). Detecting
depression and mental illness on social media: An integrative review. Current Opinion in
Behavioral Sciences, 18, 43–49. http://doi.org/10.1016/j.cobeha.2017.07.005
Harari, G. M., Lane, N. D., Wang, R., Crosier, B. S., Campbell, A. T., & Gosling, S. D. (2016).
Using smartphones to collect behavioral data in psychological science: Opportunities,
practical considerations, and challenges. Perspectives on Psychological Science, 11(6),
838–854. http://doi.org/10.1177/1745691616650285
Henrich, J., Heine, S. J., & Norenzayan, A. (2010). The weirdest people in the world? The
Behavioral and Brain Sciences, 33(2–3), 61–83.
http://doi.org/10.1017/s0140525x0999152x
Hervé, M. (2017). RVAideMemoire: Testing and plotting procedures for biostatistics (R package
version 0.9–68). Retrieved from https://cran.r-project.org/package=RVAideMemoire
Hirsh, J. B., & Peterson, J. B. (2009). Personality and language use in self-narratives. Journal of
Research in Personality, 43(3), 524–527. http://doi.org/10.1016/j.jrp.2009.01.006
Hox, J. (2010). The basic two-level regression model. In Multilevel analysis: Techniques and
applications (2nd ed., pp. 11–39). New York and Hove: Routledge.
Iliev, R., Hoover, J., Dehghani, M., & Axelrod, R. (2016). Linguistic positivity in historical texts
reflects dynamic environmental and psychological factors. Proceedings of the National
Academy of Sciences, 113(49), E7871–E7879. http://doi.org/10.1073/pnas.1612058113
Ireland, M. E., & Mehl, M. R. (2014). Natural language use as a marker of personality. In T. M.
Holtgraves (Ed.), The Oxford handbook of language and social psychology. (pp. 201–218).
http://doi.org/10.1093/oxfordhb/9780199838639.013.034
Jebb, A. T., Tay, L., Wang, W., & Huang, Q. (2015). Time series analysis for psychological

EMOTION FLUCTUATIONS AND EVERYDAY SPEECH 47
research: Examining and forecasting change. Frontiers in Psychology, 6, 1–24.
http://doi.org/10.3389/fpsyg.2015.00727
John, O. P., Naumann, L. P., & Soto, C. J. (2008). Paradigm shift to the integrative big five trait
taxonomy: History, measurement, and conceptual issues. In O. P. John, R. W. Robins, & L.
A. Pervin (Eds.), Handbook of personality: Theory and research (3rd ed., pp. 114–158).
New York: Guilford Press.
Jones, N. M., Wojcik, S. P., Sweeting, J., & Silver, R. C. (2016). Tweeting negative emotion :
An investigation of Twitter data in the aftermath of violence on college campuses.
Psychological Methods, 21(4), 1–16. http://doi.org/10.1037/met0000099
Kahn, J. H., Tobin, R. M., Massey, A. E., & Anderson, J. A. (2007). Measuring emotional
expression with the Linguistic Inquiry and Word Count. American Journal of Psychology,
120(2), 263–286. http://doi.org/10.2307/20445398
Kern, M. L., Eichstaedt, J. C., Schwartz, H. A., Dziurzynski, L., Ungar, L. H., Stillwell, D. J., …
Seligman, M. E. P. (2014). The online social self. Assessment, 21(2), 158–169.
http://doi.org/10.1177/1073191113514104
Kern, M. L., Eichstaedt, J. C., Schwartz, H. A., Park, G., Ungar, L. H., Stillwell, D. J., …
Seligman, M. E. P. (2014). From “sooo excited!!!” to “so proud”: Using language to study
development. Developmental Psychology, 50(1), 178–88. http://doi.org/10.1037/a0035048
Kern, M. L., Park, G., Eichstaedt, J. C., Schwartz, H. A., Sap, M., Smith, L. K., & Ungar, L. H.
(2016). Gaining insights from social media language: Methodologies and challenges.
Psychological Methods, 21(4), 507–525. http://doi.org/10.1037/met0000091
Kievit, R. A., Frankenhuis, W. E., Waldorp, L. J., & Borsboom, D. (2013). Simpson’s paradox in
psychological science: A practical guide. Frontiers in Psychology, 4(AUG).
EMOTION FLUCTUATIONS AND EVERYDAY SPEECH 48
http://doi.org/10.3389/fpsyg.2013.00513
Kuppens, P. (2015). It’s about time: A special section on affect dynamics. Emotion Review, 7(4),
297–300. http://doi.org/10.1177/1754073915590947
Lee, D. D., & Seung, H. S. (1999). Learning the parts of objects by non-negative matrix
factorization. Nature, 401(6755), 788. http://doi.org/10.1038/44565
Lin, D. (1998). Automatic retrieval and clustering of similar words. In Proceedings of the 36th
annual meeting on Association for Computational Linguistics - (Vol. 2, pp. 768–774).
http://doi.org/10.3115/980691.980696
Lin, H., Tov, W., & Qiu, L. (2014). Emotional disclosure on social networking sites: The role of
network structure and psychological needs. Computers in Human Behavior, 41, 342–350.
http://doi.org/10.1016/j.chb.2014.09.045
Lucas, R. E., Le, K., & Dyrenforth, P. S. (2008). Explaining the extraversion/positive affect
relation: Sociability cannot account for extraverts’ greater happiness. Journal of
Personality, 76(3), 385–414. http://doi.org/10.1111/j.1467-6494.2008.00490.x
Luhmann, M. (2017). Using Big Data to study subjective well-being. Current Opinion in
Behavioral Sciences, 18, 28–33. http://doi.org/10.1016/j.cobeha.2017.07.006
Mauss, I. B., & Robinson, M. D. (2009). Measures of emotion: A review. Cognition and
Emotion. http://doi.org/10.1080/02699930802204677
McCallum, A. K. (2002). MALLET: A Machine Learning for Language Toolkit. Retrieved from
http://mallet.cs.umass.edu
Mehl, M. R. (2006). The lay assessment of subclinical depression in daily life. Psychological
Assessment, 18(3), 340–345. http://doi.org/10.1037/1040-3590.18.3.340
Mehl, M. R. (2017). The Electronically Activated Recorder (EAR). Current Directions in

EMOTION FLUCTUATIONS AND EVERYDAY SPEECH 49
Psychological Science, 26(2), 184–190. http://doi.org/10.1177/0963721416680611
Mehl, M. R., Gosling, S. D., & Pennebaker, J. W. (2006). Personality in its natural habitat:
Manifestations and implicit folk theories of personality in daily life. Journal of Personality
and Social Psychology, 90(5), 862–877. http://doi.org/10.1037/0022-3514.90.5.862
Mehl, M. R., & Pennebaker, J. W. (2003). The sounds of social life: A psychometric analysis of
students’ daily social environments and natural conversations. Journal of Personality and
Social Psychology, 84(4), 857–870. http://doi.org/10.1037/0022-3514.84.4.857
Mehl, M. R., Pennebaker, J. W., Crow, D. M., Dabbs, J., & Price, J. H. (2001). The
Electronically Activated Recorder (EAR): A device for sampling naturalistic daily activities
and conversations. Behavior Research Methods, Instruments, & Computers, 33(4), 517–
523. http://doi.org/10.3758/BF03195410
Molenaar, P. C. M., & Campbell, C. G. (2009). The new person-specific paradigm in
psychology. Current Directions in Psychological Science, 18(2), 112–117.
http://doi.org/10.1111/j.1467-8721.2009.01619.x
Muthén, L., & Muthén, B. O. (1998–2017). Mplus user’s guide (8th ed.). Los Angeles: Muthén
& Muthén.
Pang, B., & Lee, L. (2008). Opinion mining and sentiment analysis. Foundations and Trends in
Information Retrieval, 2(1–2), 1–135.
Park, G., Schwartz, H. A., Eichstaedt, J. C., Kern, M. L., Kosinski, M., Stillwell, D. J., …
Seligman, M. E. P. (2015). Automatic personality assessment through social media
language. Journal of Personality and Social Psychology, 108(6), 1–25.
http://doi.org/10.1037/pspp0000020
Park, G., Yaden, D. B., Schwartz, H. A., Kern, M. L., Eichstaedt, J. C., Kosinski, M., …

EMOTION FLUCTUATIONS AND EVERYDAY SPEECH 50
Seligman, M. E. P. (2016). Women are warmer but no less assertive than men: Gender and
language on Facebook. PLoS ONE, 11(5), e0155885.
http://doi.org/10.1371/journal.pone.0155885
Pennebaker, J. W., Booth, R. J., Boyd, R. L., & Francis, M. E. (2015). Linguistic Inquiry and
Word Count: LIWC2015. Austin, TX: Pennebaker Conglomerates (www.LIWC.net).
Pennebaker, J. W., Booth, R. J., & Francis, M. E. (2007). Linguistic Inquiry and Word Count:
LIWC2007. Austin, TX: LIWC.net.
Pennebaker, J. W., Francis, M. E., & Booth, R. J. (2001). Linguistic Inquiry and Word Count:
LIWC2001. Mahwah: Lawrence Erlbaum Associates.
Pennebaker, J. W., & King, L. A. (1999). Linguistic styles: Language use as an individual
difference. Journal of Personality and Social Psychology, 77(6), 1296–1312.
http://doi.org/10.1037/0022-3514.77.6.1296
Pinheiro, J., Bates, D., DebRoy, S., Sarkar, D., & Team, R. C. (2017). nlme: Linear and
nonlinear mixed effects models (R package version 3.1–131). Retrieved from
https://CRAN.R-project.org/package=nlme
Pressman, S. D., & Cohen, S. (2007). Use of social words in autobiographies and longevity.
Psychosomatic Medicine, 69(17), 262–269. http://doi.org/10.1097/PSY.0b013e31803cb919
Pressman, S. D., & Cohen, S. (2012). Positive emotion word use and longevity in famous
deceased psychologists. Health Psychology, 31(3), 297–305.
http://doi.org/10.1037/a0025339
Ribeiro, F. N., Araújo, M., Gonçalves, P., André Gonçalves, M., & Benevenuto, F. (2016).
SentiBench - a benchmark comparison of state-of-the-practice sentiment analysis methods.
EPJ Data Science, 5(1), 1–29. http://doi.org/10.1140/epjds/s13688-016-0085-1
EMOTION FLUCTUATIONS AND EVERYDAY SPEECH 51
Rodriguez, A. J., Holleran, S. E., & Mehl, M. R. (2010). Reading between the lines: The lay
assessment of subclinical depression from written self-descriptions. Journal of Personality,
78(2), 575–598. http://doi.org/10.1111/j.1467-6494.2010.00627.x
Rozin, P. (2001). Social psychology and science: Some lessons from Solomon Asch. Personality
and Social Psychology Review, 5(1), 2–14. http://doi.org/10.1207/S15327957PSPR0501_1
Rude, S., Gortner, E.-M., & Pennebaker, J. W. (2004). Language use of depressed and
depression-vulnerable college students. Cognition & Emotion, 18(8), 1121–1133.
http://doi.org/10.1080/02699930441000030
Schwartz, H. A., Eichstaedt, J., Blanco, E., Dziurzyński, L., Kern, M. L., Ramones, S., … Ungar,
L. (2013). Choosing the right words: Characterizing and reducing error of the word count
approach. In Second Joint Conference on Lexical and Computational Semantics (*SEM),
Volume 1: Proceedings of the Main Conference and the Shared Task: Semantic Textual
Similarity (Vol. 1, pp. 296–305).
Schwartz, H. A., Eichstaedt, J. C., Kern, M. L., Dziurzynski, L., Agrawal, M., Park, G. J., …
Ungar, L. (2013). Characterizing geographic variation in well-being using tweets. In
Proceedings of the Seventh International AAAI Conference on Weblogs and Social Media
(pp. 583–591). http://doi.org/papers3://publication/uuid/43E3E88F-EFDC-4F9C-85AC-
C60B4B8C8BCA
Schwartz, H. A., Eichstaedt, J. C., Kern, M. L., Dziurzynski, L., Ramones, S. M., Agrawal, M.,
… Ungar, L. H. (2013). Personality, gender, and age in the language of social media: The
open-vocabulary approach. PLoS ONE, 8(9), e73791.
http://doi.org/10.1371/journal.pone.0073791
Schwartz, H. A., Giorgi, S., Sap, M., Crutchley, P., Ungar, L. H., & Eichstaedt, J. C. (2017).
EMOTION FLUCTUATIONS AND EVERYDAY SPEECH 52
DLATK: Differential Language Analysis ToolKit. In Proceedings of the 2017 Conference
on Empirical Methods in Natural Language Processing: System Demonstrations (pp. 55–
60).
Schwartz, H. A., Sap, M., Kern, M. L., Eichstaedt, J. C., Kapelner, A., Agrawal, M., … Ungar,
L. H. (2016). Predicting individual well-being through the language of social media. In
Pacific Symposium on Biocomputing. Pacific Symposium on Biocomputing (Vol. 21, pp.
516–27). http://doi.org/10.1142/9789814749411_0047
Schwartz, H. A., & Ungar, L. H. (2015). Data-driven content analysis of social media. The
ANNALS of the American Academy of Political and Social Science, 659(1), 78–94.
http://doi.org/10.1177/0002716215569197
Seabrook, E. M., Kern, M. L., & Rickard, N. S. (2016). Social networking sites, depression, and
anxiety: A systematic review. JMIR Mental Health, 3(4), e50.
http://doi.org/10.2196/mental.5842
Settanni, M., & Marengo, D. (2015). Sharing feelings online: Studying emotional well-being via
automated text analysis of Facebook posts. Frontiers in Psychology, 6:1045.
http://doi.org/10.3389/fpsyg.2015.01045
Shrout, P. E., & Fleiss, J. L. (1979). Intraclass correlations: Uses in assessing rater reliability.
Psychological Bulletin, 86(2), 420–428. http://doi.org/10.1037/0033-2909.86.2.420
Shrout, P. E., & Lane, S. P. (2012). Psychometrics. In M. R. Mehl & T. S. Conner (Eds.),
Handbook of research methods for studying daily life (pp. 302–320). New York, NY:
Guilford Press.
Simons, D. J., Shoda, Y., & Lindsay, D. S. (2017). Constraints on Generality (COG): A proposed
addition to all empirical papers. Perspectives on Psychological Science, 12(6), 1123–1128.

EMOTION FLUCTUATIONS AND EVERYDAY SPEECH 53
http://doi.org/10.1177/1745691617708630
Simonsohn, U., Simmons, J. P., & Nelson, L. D. (2015). Specification Curve: Descriptive and
inferential statistics on all reasonable specifications. SSRN Electronic Journal, (November),
1–18. http://doi.org/10.2139/ssrn.2694998
Solomon, B. C., & Vazire, S. (2016). Knowledge of identity and reputation: Do people have
knowledge of others’ perceptions? Journal of Personality and Social Psychology, 111(3),
341–366. http://doi.org/10.1037/pspi0000061
Sun, J., Stevenson, K., Kabbani, R., Richardson, B., & Smillie, L. D. (2017). The pleasure of
making a difference: Perceived social contribution explains the relation between extraverted
behavior and positive affect. Emotion, 17(5), 794–810. http://doi.org/10.1037/emo0000273
Sun, J., & Vazire, S. (2019). Do people know what they’re like in the moment? Psychological
Science. Advance online publication. https://doi.org/10.1177/0956797618818476
Tackman, A. M., Sbarra, D. A., Carey, A. L., Donnellan, M. B., Horn, A. B., Holtzman, N. S., …
Mehl, M. R. (2018). Depression, negative emotionality, and self-referential language: A
multi-lab, multi-measure, and multi-language-task research synthesis. Journal of
Personality and Social Psychology. http://doi.org/10.1037/pspp0000187
Tausczik, Y. R., & Pennebaker, J. W. (2010). The psychological meaning of words: LIWC and
computerized text analysis methods. Journal of Language and Social Psychology, 29(1),
24–54. http://doi.org/10.1177/0261927X09351676
Tov, W., Ng, K. L., Lin, H., & Qiu, L. (2013). Detecting well-being via computerized content
analysis of brief diary entries. Psychological Assessment, 25(4), 1069–78.
http://doi.org/10.1037/a0033007
Van de Cruys, T., Poibeau, T., & Korhonen, A. (2011). Latent vector weighting for word

EMOTION FLUCTUATIONS AND EVERYDAY SPEECH 54
meaning in context. In In Proceedings of the 2011 Conference on Empirical Methods in
Natural Language Processing, Edinburgh, Scotland, UK, July 27–31, 2011.
Vazire, S., & Sherman, R. A. (2017). Introduction to the special issue on within-person
variability in personality. Journal of Research in Personality, 69, 1–3.
http://doi.org/10.1016/j.jrp.2017.07.004
Weidman, A. C., Sun, J., Vazire, S., Quoidbach, J., Ungar, L. H., & Dunn, E. W. (in press).
(Not) hearing happiness: Predicting fluctuations in happy mood from acoustic cues using
machine learning. Emotion.
Weintraub, W. (1981). Verbal behavior: Adaptation and psychopathology. New York: Springer.
Wilson, R. E., Harris, K., & Vazire, S. (2015). Personality and friendship satisfaction in daily
life: Do everyday social interactions account for individual differences in friendship
satisfaction? European Journal of Personality, 29(2), 173–
186. http://doi.org/10.1002/per.1996
Wilson, R. E., Thompson, R. J., & Vazire, S. (2016). Are fluctuations in personality states more
than fluctuations in affect? Journal of Research in Personality, 69, 110–
123. http://doi.org/10.1016/j.jrp.2016.06.006
Wilson, R. E., & Vazire, S. (2015). Taking personality to the next level: What does it mean to
know a person? Emerging Trends in the Social and Behavioral Sciences: An
Interdisciplinary, Searchable, and Linkable Resource, 1–13.
http://doi.org/10.1002/9781118900772.etrds0327
Yarkoni, T. (2010). Personality in 100,000 words: A large-scale analysis of personality and word
use among bloggers. Journal of Research in Personality, 44(3), 363–373.
http://doi.org/10.1016/j.jrp.2010.04.001

EMOTION FLUCTUATIONS AND EVERYDAY SPEECH 55
Zelenski, J. M., Whelan, D. C., Nealis, L. J., Besner, C. M., Santoro, M. S., & Wynn, J. E.
(2013). Personality and affective forecasting: Trait introverts underpredict the hedonic
benefits of acting extraverted. Journal of Personality and Social Psychology, 104(6), 1092–
1108. http://doi.org/10.1037/a0032281
Ziemer, K. S., & Korkmaz, G. (2017). Using text to predict psychological and physical health: A
comparison of human raters and computerized text analysis. Computers in Human
Behavior, 76, 122–127. http://doi.org/10.1016/j.chb.2017.06.038
Wojcik, S. P., Hovasapian, A., Graham, J., Motyl, M., & Ditto, P. H. (2015). Conservatives
report, but liberals display, greater happiness. Science, 347(6227), 1243–1246.
http://doi.org/10.1126/science.1260817
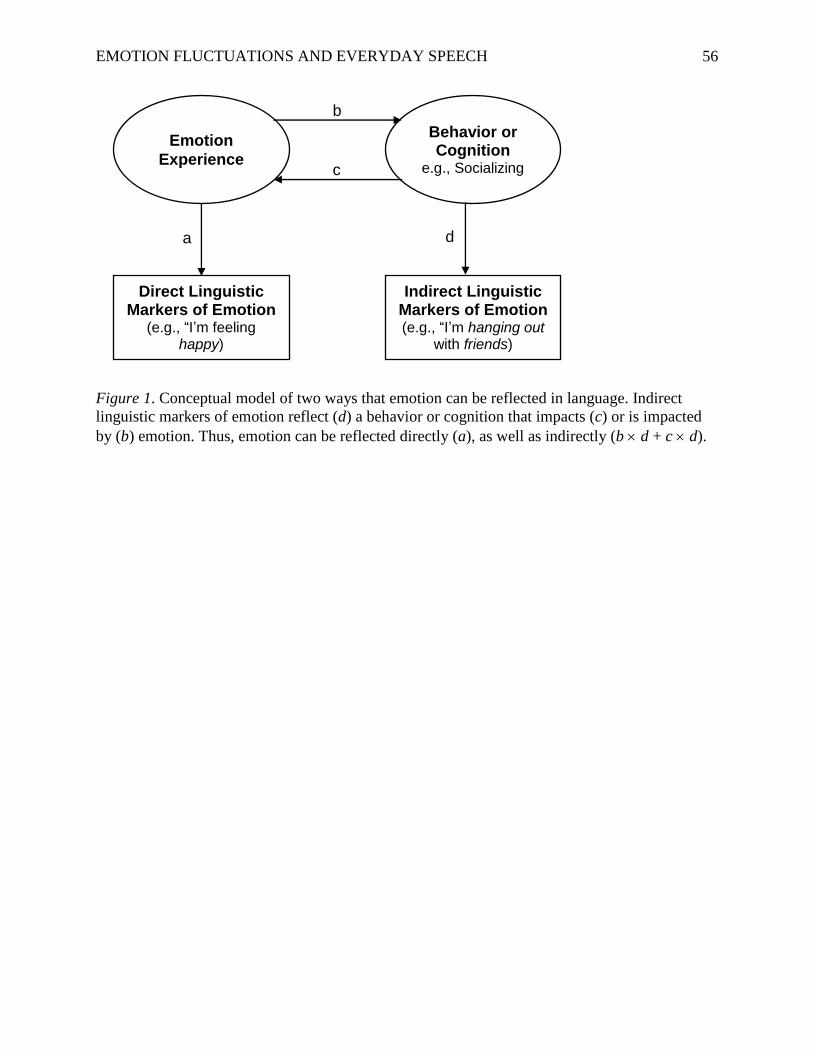
EMOTION FLUCTUATIONS AND EVERYDAY SPEECH 56
Figure 1. Conceptual model of two ways that emotion can be reflected in language. Indirect
linguistic markers of emotion reflect (d) a behavior or cognition that impacts (c) or is impacted
by (b) emotion. Thus, emotion can be reflected directly (a), as well as indirectly (b d + c d).
Emotion
Experience
Behavior or Cognition
e.g., Socializing
Direct Linguistic Markers of Emotion
(e.g., “I’m feeling happy)
Indirect Linguistic Markers of Emotion (e.g., “I’m hanging out
with friends)
b
a
c
d
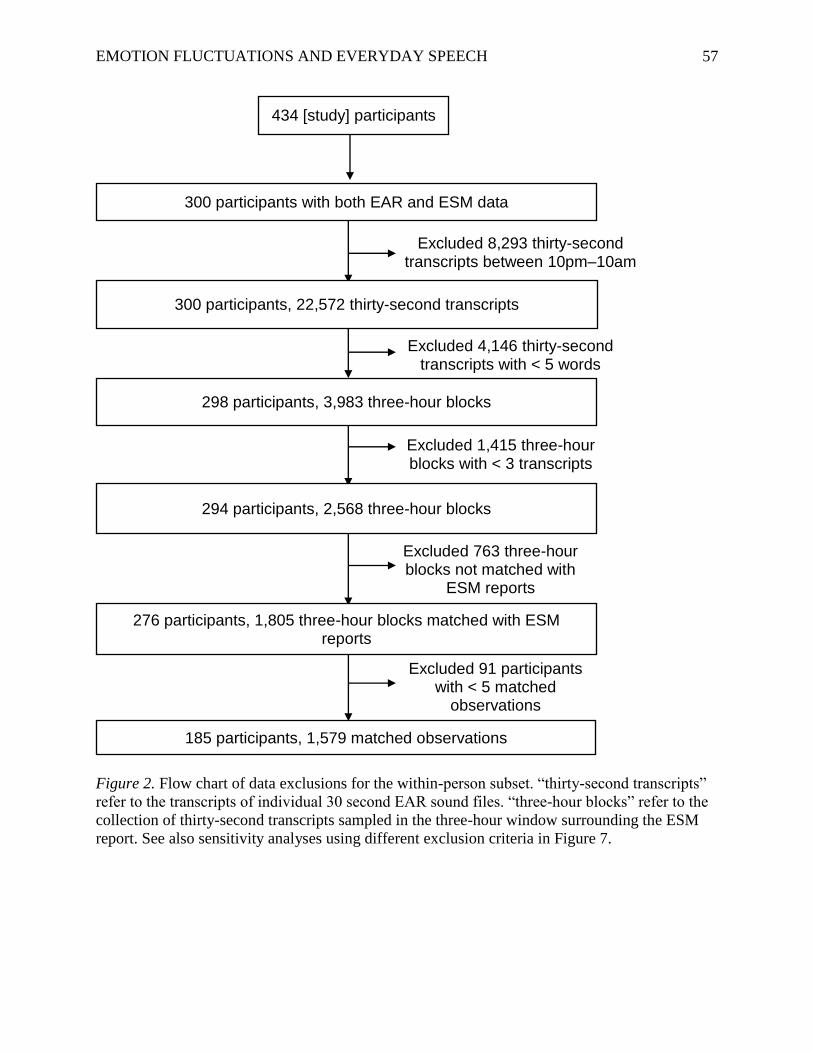
EMOTION FLUCTUATIONS AND EVERYDAY SPEECH 57
Figure 2. Flow chart of data exclusions for the within-person subset. “thirty-second transcripts”
refer to the transcripts of individual 30 second EAR sound files. “three-hour blocks” refer to the
collection of thirty-second transcripts sampled in the three-hour window surrounding the ESM
report. See also sensitivity analyses using different exclusion criteria in Figure 7.
Excluded 91 participants with < 5 matched
observations
Excluded 1,415 three-hour blocks with < 3 transcripts
Excluded 4,146 thirty-second transcripts with < 5 words
Excluded 8,293 thirty-second transcripts between 10pm–10am
434 [study] participants
300 participants with both EAR and ESM data
300 participants, 22,572 thirty-second transcripts
298 participants, 3,983 three-hour blocks
Excluded 763 three-hour blocks not matched with
ESM reports
294 participants, 2,568 three-hour blocks
276 participants, 1,805 three-hour blocks matched with ESM reports
185 participants, 1,579 matched observations
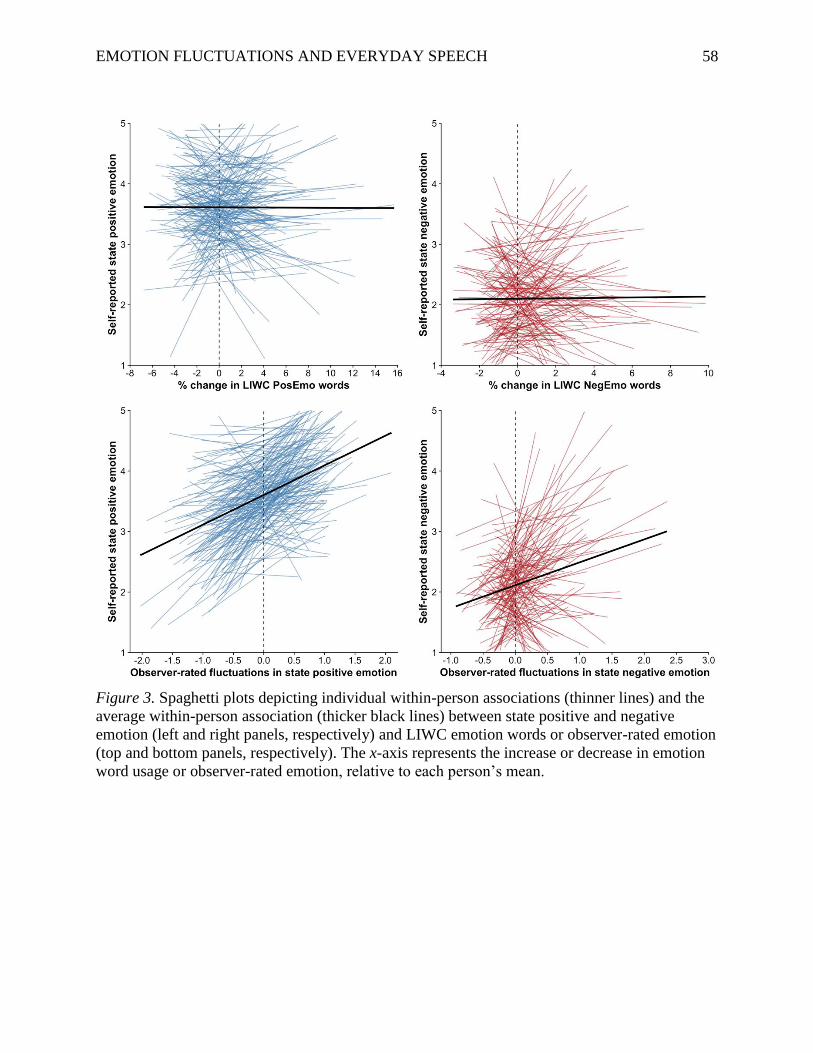
EMOTION FLUCTUATIONS AND EVERYDAY SPEECH 58
Figure 3. Spaghetti plots depicting individual within-person associations (thinner lines) and the
average within-person association (thicker black lines) between state positive and negative
emotion (left and right panels, respectively) and LIWC emotion words or observer-rated emotion
(top and bottom panels, respectively). The x-axis represents the increase or decrease in emotion
word usage or observer-rated emotion, relative to each person’s mean.

EMOTION FLUCTUATIONS AND EVERYDAY SPEECH 59
Figure 4. The most frequent 15 words within the 7 themes that were most strongly correlated
with state emotion. Blue word clouds (top row and first panel on the bottom row) denote themes
that were correlated with more positive or less negative emotion; red word clouds (second and
third panels on the bottom row) denote themes that were correlated with more negative or less
positive emotion. Larger and darker words are more frequent representatives of each theme. PA
and NA denote the standardized regression coefficients for the within-person effect of the theme
on positive emotion or negative emotion, respectively. *p < .05,
**p < .01,
***p < .001, not
corrected for multiple comparisons.

EMOTION FLUCTUATIONS AND EVERYDAY SPEECH 60
Figure 5. Scatterplots depicting the between-person associations that overall use of LIWC
positive and negative emotion words (top panels) and average observer-rated positive and
negative emotion (bottom panels) had with average self-reported positive and negative emotion
(left and right panels, respectively). The gray bands depict the 95% confidence interval for
predictions using a linear model.

EMOTION FLUCTUATIONS AND EVERYDAY SPEECH 61
Figure 6. Most frequent 15 words for the 7 themes most strongly correlated with between-person
differences in average state emotion. Larger and darker words are more frequent representatives
of each theme. ρPA and ρNA denote the Spearman correlation between the theme and average
positive emotion or negative emotion, respectively. *p < .05,
**p < .01,
***p < .001, not corrected
for multiple comparisons.

EMOTION FLUCTUATIONS AND EVERYDAY SPEECH 62
Figure 7. Within-person associations that LIWC positive and negative emotion scores (left panels) and two other language variables
and word count (right panels, selected post-hoc) had with self-reported positive and negative emotion across alternative reasonable
specifications. = standardized coefficient. Error bars represent the 95% confidence intervals for (obtained by standardizing the
lower and upper bounds of the unstandardized 95% CI)

EMOTION FLUCTUATIONS AND EVERYDAY SPEECH 63
Table 1
Summary of Between-Person Self-Reported Emotion Correlates of LIWC Positive and Negative Emotion Dictionaries in the Published
Literature
Study N Language Sample LIWC Positive Emotion LIWC Negative Emotion
Tackman et al.
(2018)
4,319–
4,632
Meta-analysis across
several laboratory-based
written and spoken
language tasks
Negative emotionality (+), Depression (+)
Settanni &
Marengo (2015)
201 Facebook status updates
and associated comments
Anxiety (ns), Depression (ns), Stress (ns) Anxiety (+), Depression (+), Stress (+)
Tov et al. (2013,
Study 1)
206 Aggregated daily positive
and negative events
Positive emotion (+), Sad (–), Angry (ns),
Stressed (–), Depressed (–)
Positive emotion (ns), Sad (+), Angry (+),
Stressed (ns), Depressed (+)
Tov et al. (2013,
Study 2)
139 Aggregated biweekly
positive and negative
events
Positive emotion (ns), Sad (ns), Angry (ns),
Stressed (ns)
Positive emotion (–), Sad (+), Angry (+),
Stressed (+)
Cohen (2011) 483 Story of recent
disagreement
General psychological distress (ns),
Depressive symptoms (ns)
General psychological distress (ns),
Depressive symptoms (+)
Rodriguez et al.
(2010)
57 Self-description as if
personal diary
Depressive symptoms (–) Depressive symptoms (ns)
Self-description as if online
blog
Depressive symptoms (–) Depressive symptoms (ns)
Cohen et al.
(2008)
68 Speech task (open-ended,
with suggested topics)
Positive affect (+), Negative affect (ns) Positive affect (ns), Negative affect (+)
Kahn et al.
(2007,
Experiment 3)
66 Verbal reflections on
feelings after watching a
comedy film
Positive affect (ns), Amusement (+)
Verbal reflections on
feelings after watching a
funeral film
Negative affect (ns), Sadness (ns)
Mehl (2006) 96 Everyday speech Depressive symptoms (ns) Depressive symptoms (ns)
Alvarez-Conrad
et al. (2001)
22 Trauma narratives Depressive symptoms (ns), Anxiety (ns),
Anger (+)
Depressive symptoms (ns), Anxiety (ns),
Anger (ns)

EMOTION FLUCTUATIONS AND EVERYDAY SPEECH 64
Note. (+) and (–) indicate significant positive and negative correlations, respectively, whereas (ns) indicates a nonsignificant association.
Apart from the Tackman et al. (2018) meta-analysis, these studies were identified in reviews by Tov et al. (2013), Ireland and Mehl (2014),
and Luhmann (2017).

EMOTION FLUCTUATIONS AND EVERYDAY SPEECH 65
Table 2
Within-Person Associations between LIWC Emotion Dictionaries and Self-Reported and Observer-Rated Emotion
Self-Reported Positive Emotion Self-Reported Negative Emotion
LIWC Dictionary 95% CI p 95% CI p
Positive emotion 0.00 [–0.06, 0.05] .923 –0.01 [–0.07, 0.05] .732
Negative emotion –0.01 [–0.06, 0.04] .684 0.01 [–0.05, 0.07] .783
Anxiety 0.00 [–0.06, 0.06] .982 0.01 [–0.05, 0.07] .686
Anger –0.01 [–0.06, 0.05] .804 0.04 [–0.02, 0.10] .176
Sadness 0.00 [–0.05, 0.06] .932 –0.03 [–0.09, 0.03] .356
Observer-Rated Positive Emotion Observer-Rated Negative Emotion
LIWC Dictionary 95% CI p 95% CI p
Positive emotion –0.02 [–0.08, 0.04] .502 –0.04 [–0.10, 0.01] .126
Negative emotion 0.05 [–0.01, 0.10] .09 0.07* [0.01, 0.13] .029
Anxiety 0.04 [–0.03, 0.10] .256 0.00 [–0.06, 0.06] .987
Anger 0.04 [–0.02, 0.10] .167 0.09**
[0.02, 0.16] .009
Sadness –0.01 [–0.07, 0.04] .679 0.06 [–0.02, 0.13] .119
Note. *p < .05,
**p < .01,
***p < .001, not corrected for multiple comparisons. No effects survived the FDR correction. LIWC = Linguistic
Inquiry and Word Count. = standardized coefficient. 95% CI = 95% confidence interval for (obtained by standardizing the lower and
upper bounds of the unstandardized 95% CI).

EMOTION FLUCTUATIONS AND EVERYDAY SPEECH 66
Table 3
Within-Person Associations Between Non-Emotion LIWC Dictionaries and Self-Reported Emotion
Self–Reported Positive Emotion Self–Reported Negative Emotion
LIWC Dictionary 95% CI p LIWC Dictionary 95% CI p
Social processes 0.10***
[0.05, 0.16] < .001 Social processes –0.06 [–0.12, 0.01] .075
3rd pers. singular 0.08**
[0.02, 0.13] .005 Present focus –0.06* [–0.12, 0.00] .041
Assent –0.07* [–0.13, –0.01] .015 3rd pers. singular –0.05 [–0.12, 0.02] .186
2nd pers. 0.07* [0.01, 0.12] .016 Social ties –0.05 [–0.11, 0.01] .116
Present focus 0.07**
[0.02, 0.12] .010 Achievement –0.04 [–0.11, 0.03] .306
Family 0.06* [0.00, 0.11] .035 Death 0.04 [–0.04, 0.13] .323
Past focus 0.05* [0.00, 0.11] .046 Family –0.04 [–0.10, 0.02] .170
Work –0.05* [–0.11, 0.00] .044 Negations 0.03 [–0.04, 0.09] .377
Reward 0.04 [–0.01, 0.10] .128 Work 0.03 [–0.03, 0.09] .367
Achievement 0.04 [–0.01, 0.10] .109 Future focus –0.03 [–0.09, 0.03] .277
Discrepancy –0.04 [–0.09, 0.01] .133 Friend 0.02 [–0.04, 0.08] .565
Insight –0.03 [–0.08, 0.03] .343 Leisure –0.02 [–0.08, 0.04] .479
Friend 0.03 [–0.02, 0.09] .229 Affiliation –0.02 [–0.08, 0.04] .576
Social ties 0.03 [–0.03, 0.08] .306 Power –0.02 [–0.08, 0.04] .535
1st pers. plural 0.03 [–0.02, 0.08] .286 Swear words 0.02 [–0.04, 0.08] .481
Religion 0.03 [–0.02, 0.09] .237 Insight 0.01 [–0.06, 0.08] .747
Power –0.02 [–0.07, 0.04] .612 2nd pers. –0.01 [–0.08, 0.05] .645
Death –0.02 [–0.09, 0.05] .522 Past focus –0.01 [–0.07, 0.05] .808
Negations 0.02 [–0.04, 0.08] .471 Tentative –0.01 [–0.07, 0.05] .808
Risk –0.02 [–0.08, 0.03] .427 Money –0.01 [–0.07, 0.05] .791
Swear words –0.02 [–0.07, 0.04] .554 Home 0.01 [–0.05, 0.08] .690
1st pers. singular –0.02 [–0.07, 0.03] .505 1st pers. plural –0.01 [–0.07, 0.04] .626
Leisure 0.02 [–0.03, 0.08] .404 Discrepancy 0.01 [–0.05, 0.07] .680
Future focus 0.01 [–0.04, 0.07] .612 3rd pers. plural –0.01 [–0.06, 0.05] .831

EMOTION FLUCTUATIONS AND EVERYDAY SPEECH 67
Self–Reported Positive Emotion Self–Reported Negative Emotion
LIWC Dictionary 95% CI p LIWC Dictionary 95% CI p
3rd pers. plural –0.01 [–0.07, 0.04] .614 Reward 0.00 [–0.06, 0.06] .962
Money 0.01 [–0.05, 0.07] .739 1st pers. singular 0.00 [–0.06, 0.06] .960
Affiliation 0.01 [–0.04, 0.07] .636 Assent 0.00 [–0.06, 0.06] .910
Tentative 0.00 [–0.05, 0.05] .937 Certainty 0.00 [–0.06, 0.06] .877
Home 0.00 [–0.05, 0.05] .994 Risk 0.00 [–0.05, 0.06] .883
Certainty 0.00 [–0.05, 0.05] .934 Religion 0.00 [–0.05, 0.06] .947
Note. *p < .05,
**p < .01,
***p < .001, not corrected for multiple comparisons. Effects in bold survived the FDR correction. LIWC =
Linguistic Inquiry and Word Count. = standardized coefficient. 95% CI = 95% confidence interval for (obtained by standardizing the
lower and upper bounds of the unstandardized 95% CI). Results are sorted by the absolute magnitude of the standardized point estimate.
Note that the Social Ties dictionary was custom–created (Pressman & Cohen, 2012) and not part of the original set of LIWC dictionaries.

EMOTION FLUCTUATIONS AND EVERYDAY SPEECH 68
Table 4
Between-Person Associations (Spearman’s ρ) between LIWC Emotion Dictionaries and Average Self-Reported and Observer-Rated
Emotion
Average Self-Reported
Positive Emotion
Average Self-Reported
Negative Emotion
LIWC Dictionary ρ 95% CI p ρ 95% CI p
Positive emotion .02 [–.10, .14] .740 .04 [–.11, .20] .544
Negative emotion .00 [–.13, .12] .996 –.03 [–.17, .11] .688
Anxiety .04 [–.09, .16] .486 .04 [–.10, .18] .562
Anger .06 [–.06, .18] .316 –.12 [–.25, .01] .083
Sadness –.12 [–.23, .01] .065 .07 [–.07, .21] .302
Average Observer-Rated
Positive Emotion
Average Observer-Rated
Negative Emotion
LIWC Dictionary ρ 95% CI p ρ 95% CI p
Positive emotion .03 [–.10, .15] .680 –.06 [–.19, .06] .325
Negative emotion –.08 [–.19, .05] .221 .06 [–.06, .19] .376
Anxiety .15* [.01, .26] .019 .07 [–.06, .20] .276
Anger –.12 [–.23, .01] .070 .05 [–.07, .17] .440
Sadness .11 [–.01, .23] .090 .14* [.01, .26] .025
Note. *p < .05,
**p < .01,
***p < .001, not corrected for multiple comparisons. No effects survived the FDR correction. LIWC = Linguistic
Inquiry and Word Count.

EMOTION FLUCTUATIONS AND EVERYDAY SPEECH 69
Table 5
Between-Person Associations (Spearman’s ρ) between Non-Emotion LIWC Dictionaries and Average Self-Reported Emotion
Average Self-Reported Positive Emotion Average Self-Reported Negative Emotion
LIWC Dictionary ρ 95% CI p LIWC Dictionary ρ 95% CI p
1st pers. plural .16* [.03, .28] .01 Future focus –.16
* [–.29, –.02] .025
Social processes .16* [.02, .27] .014 Religion –.16
* [–.28, –.02] .023
Insight –.14* [–.26, –.01] .028 Insight .15
* [.02, .29] .031
Future focus .14* [.02, .26] .022 Power –.14
* [–.28, .00] .041
3rd pers. plural .13* [.01, .24] .044 3rd pers. plural –.12 [–.25, .01] .083
Negations –.10 [–.22, .02] .106 Money –.09 [–.24, .04] .205
Affiliation .10 [–.03, .22] .113 Swear words –.09 [–.22, .04] .204
Reward .10 [–.03, .22] .122 1st pers. plural –.08 [–.22, .05] .238
Home .10 [–.03, .23] .100 Risk .08 [–.06, .23] .259
Tentative –.09 [–.21, .02] .147 Death –.07 [–.20, .06] .358
Power .09 [–.03, .21] .168 Social ties –.07 [–.21, .07] .346
Leisure .09 [–.02, .21] .146 Achievement –.06 [–.20, .08] .424
Social ties .09 [–.05, .21] .156 2nd pers. .05 [–.09, .19] .477
2nd pers. .08 [–.05, .20] .228 Negations .05 [–.09, .18] .448
Family .08 [–.04, .22] .204 Friend –.05 [–.18, .08] .525
Past focus .07 [–.05, .19] .266 Assent .05 [–.09, .19] .493
Discrepancy –.06 [–.19, .06] .315 Certainty –.04 [–.17, .10] .603
Risk –.06 [–.18, .06] .373 Reward –.04 [–.18, .11] .596
Friend .05 [–.08, .18] .477 Present focus .04 [–.11, .17] .599
Achievement –.05 [–.18, .06] .402 3rd pers. singular .03 [–.11, .17] .629
Religion –.05 [–.17, .07] .399 Home .03 [–.12, .17] .656
Certainty .04 [–.09, .17] .512 1st pers. singular –.01 [–.16, .14] .921
Present focus –.04 [–.15, .08] .578 Family –.01 [–.14, .14] .934
1st pers. singular .03 [–.09, .15] .602 Discrepancy –.01 [–.16, .12] .840

EMOTION FLUCTUATIONS AND EVERYDAY SPEECH 70
Average Self-Reported Positive Emotion Average Self-Reported Negative Emotion
LIWC Dictionary ρ 95% CI p LIWC Dictionary ρ 95% CI p
Swear words .03 [–.08, .15] .595 Tentative .01 [–.12, .13] .894
3rd pers. singular .01 [–.13, .13] .911 Affiliation .01 [–.15, .14] .913
Work .01 [–.12, .13] .863 Leisure .01 [–.13, .14] .924
Assent –.01 [–.14, .11] .818 Social processes .00 [–.13, .14] .959
Money .00 [–.12, .12] .949 Past focus .00 [–.13, .14] .970
Death .00 [–.13, .12] .972 Work .00 [–.15, .14] .970
Note. *p < .05,
**p < .01,
***p < .001, not corrected for multiple comparisons. No effects survived the FDR correction. LIWC = Linguistic
Inquiry and Word Count. ρ = Spearman correlation computed across all transcripts. Results are sorted by the absolute magnitude of the point
estimate. Note that the Social Ties dictionary was custom–created (Pressman & Cohen, 2012) and not part of the original set of LIWC
dictionaries.

EMOTION FLUCTUATIONS AND EVERYDAY SPEECH 71
Appendix A
Demographic Characteristics of Included and Excluded Participants
Within-Person Subset Between-Person Subset
Included
(n = 185)
Excluded
(n = 232)
Included
(n = 248)
Excluded
(n = 169)
Gender (%)
Female 74.05 60.78 68.55 63.91
Male 25.95 38.36 30.65 36.09
Not reported 0 0.86 0.81 0
Mean (SD) age in years 19.09
(1.78)
19.72
(2.66)
19.11
(1.75)
19.93
(2.92)
Ethnicity (%)
White 59.46 49.14 59.68 44.97
Asian or Asian American 20 26.72 19.76 29.59
Black or African American 9.19 11.64 10.48 10.65
Other or Multiple 7.03 10.34 6.85 11.83
Not Reported 3.78 1.29 2.82 1.78
American Indian or Alaska Native 0.54 0.43 0.4 0.59
Native Hawaiian or Other Pacific Islander 0 0.43 0 0.59

EMOTION FLUCTUATIONS AND EVERYDAY SPEECH 72
Appendix B
Descriptive Statistics for ESM, EAR, Dictionary, and Word Count Variables
Within–Persons Between–Persons
Variable M Med. SDWP SDBP
1–
ICC(1)
Min–
Max Skew M Med. SD Min–Max Skew
ESM Pos. Emotion 3.62 3.64 0.82 0.43 .79 1–5 –0.13 3.44 3.42 0.53 1.7–5 0.04
ESM Neg. Emotion 2.08 1.88 0.93 0.42 .83 1–5 0.47 2.18 2.2 0.53 1–3.75 0.26
EAR Pos. Emotion 3.01 3.03 0.63 0.25 .87 1–5 –0.09 2.78 2.75 0.36 1.82–3.59 0.02
EAR Neg. Emotion 1.51 1.43 0.44 0.24 .77 1–5 0.52 1.48 1.44 0.25 1.07–2.34 0.73
Positive Emotion 4.38 3.95 2.95 0.75 .94 0–22.85 0.36 4.39 4.34 1.14 1.8–9.02 0.63
Negative Emotion 1.79 1.41 1.82 0.4 .96 0–13.26 0.63 1.83 1.71 0.65 0.34–4.43 0.93
Anxiety 0.19 0.02 0.54 0.07 .98 0–5.56 1.44 0.18 0.15 0.14 0–0.86 1.19
Anger 0.68 0.32 1.16 0.34 .92 0–13.03 1.06 0.73 0.57 0.53 0–3.13 1.52
Sadness 0.31 0.07 0.69 0.13 .97 0–7.07 1.29 0.32 0.29 0.20 0–1.47 1.38
1st pers. singular 7.48 7.27 3.22 1.02 .91 0–23.59 0.14 7.36 7.26 1.29 3.85–12.53 0.47
1st pers. plural 0.93 0.63 1.20 0.26 .96 0–9.72 0.76 0.95 0.96 0.39 0.03–2.25 0.24
2nd pers. 3.54 3.25 2.47 0.51 .96 0–17.35 0.37 3.66 3.56 0.92 1.95–7.28 0.70
3rd pers. singular 1.34 0.88 1.68 0.22 .98 0–15.28 0.71 1.35 1.27 0.55 0.29–3.22 0.64
3rd pers. plural 0.74 0.46 1.04 0.24 .95 0–11.96 0.75 0.72 0.67 0.32 0–1.82 0.68
Negations 3.43 3.12 2.49 0.45 .97 0–26.98 0.38 3.62 3.60 0.81 1.67–6.54 0.57
Social processes 10.5 10.26 4.27 1.05 .94 0–32.22 0.19 10.56 10.44 1.60 6.08–16.22 0.44
Family 0.22 0.03 0.60 0.10 .97 0–5.88 1.46 0.22 0.17 0.21 0–1.45 2.17
Friend 0.40 0.16 0.75 0.16 .96 0–6.67 1.13 0.42 0.38 0.27 0–1.52 1.24
Insight 2.49 2.24 1.84 0.25 .98 0–12.48 0.38 2.44 2.45 0.56 1.04–4.35 0.09
Discrepancy 1.74 1.52 1.55 0.15 .99 0–16.19 0.43 1.71 1.71 0.41 0.86–2.95 0.30
Tentative 2.44 2.16 1.90 0.31 .97 0–17.62 0.37 2.42 2.40 0.60 1.13–4.92 0.57
Certainty 1.24 0.98 1.30 0.10 .99 0–9.38 0.59 1.20 1.17 0.37 0.33–2.41 0.35
Affiliation 1.78 1.45 1.70 0.35 .96 0–12.22 0.57 1.80 1.73 0.51 0.53–3.5 0.39
Achievement 0.78 0.50 1.00 0.10 .99 0–7.65 0.73 0.80 0.78 0.29 0–1.79 0.53

EMOTION FLUCTUATIONS AND EVERYDAY SPEECH 73
Within–Persons Between–Persons
Variable M Med. SDWP SDBP
1–
ICC(1)
Min–
Max Skew M Med. SD Min–Max Skew
Power 1.49 1.17 1.51 0.26 .97 0–10.09 0.60 1.42 1.39 0.41 0.53–2.45 0.30
Reward 1.71 1.39 1.66 0.03 >.99 0–11.82 0.56 1.69 1.64 0.45 0.34–3.16 0.30
Risk 0.38 0.10 0.84 0.01 >.99 0–14.81 1.15 0.38 0.37 0.21 0–1.27 0.81
Past focus 3.89 3.66 2.53 0.55 .95 0–16.95 0.28 3.82 3.83 0.77 1.93–6.19 0.30
Present focus 16.9 16.71 4.36 0.96 .95 0–38.25 0.05 17.12 17.06 1.44 13.12–21.1 0.04
Future focus 1.85 1.53 1.61 0.26 .98 0–9.52 0.49 1.82 1.77 0.48 0.61–3.56 0.35
Work 1.57 1.23 1.68 0.31 .97 0–13.89 0.58 1.45 1.39 0.53 0.35–3.28 0.55
Leisure 0.87 0.52 1.18 0.20 .97 0–10.26 0.80 0.87 0.83 0.36 0.1–1.78 0.45
Home 0.33 0.08 0.80 0.10 .98 0–13.04 1.17 0.32 0.29 0.22 0–1.40 1.42
Money 0.36 0.09 0.75 0.12 .98 0–8.35 1.20 0.34 0.30 0.23 0–1.30 1.33
Religion 0.37 0.07 1.24 0.31 .94 0–38.33 1.35 0.34 0.27 0.41 0–5.64 8.99
Death 0.09 0.00 0.41 0.04 .99 0–5.71 1.79 0.10 0.06 0.13 0–0.94 2.57
Swear words 0.48 0.18 0.99 0.31 .91 0–13.03 1.21 0.55 0.41 0.52 0–3.20 1.95
Assent 4.51 3.88 3.79 1.28 .90 0–43.33 0.52 4.34 3.94 1.59 1.22–10.92 1.02
Social ties 0.34 0.10 0.71 0.09 .98 0–8.33 1.17 0.33 0.30 0.21 0–1.43 1.62
Word Count 174.35 156.05 112.03 38.68 .89 20–793 0.48 2486.76 2343.5 1214.81 533–8730 1.08
Note. For the within-person means, medians, and skews, we first computed each statistic on each person’s set of observations (e.g., each
person had a mean and median for each variable), then computed the mean across these statistics. Minimums and maximums are across the
entire set of 1,579 observations. SDWP = within-person SD, SDBP = between-person SD, Med. = median. The intraclass correlation (ICC(1))
represents the proportion of total variance (σ2
BP + σ2
WP) that is due to variance between-persons (σ2
BP; i.e., mean-level differences on a
variable across the week), so 1–ICC(1) denotes the % of total variance due to within-person variance (i.e., σ2
WP; i.e., fluctuations around a
person’s mean emotions or typical word use).
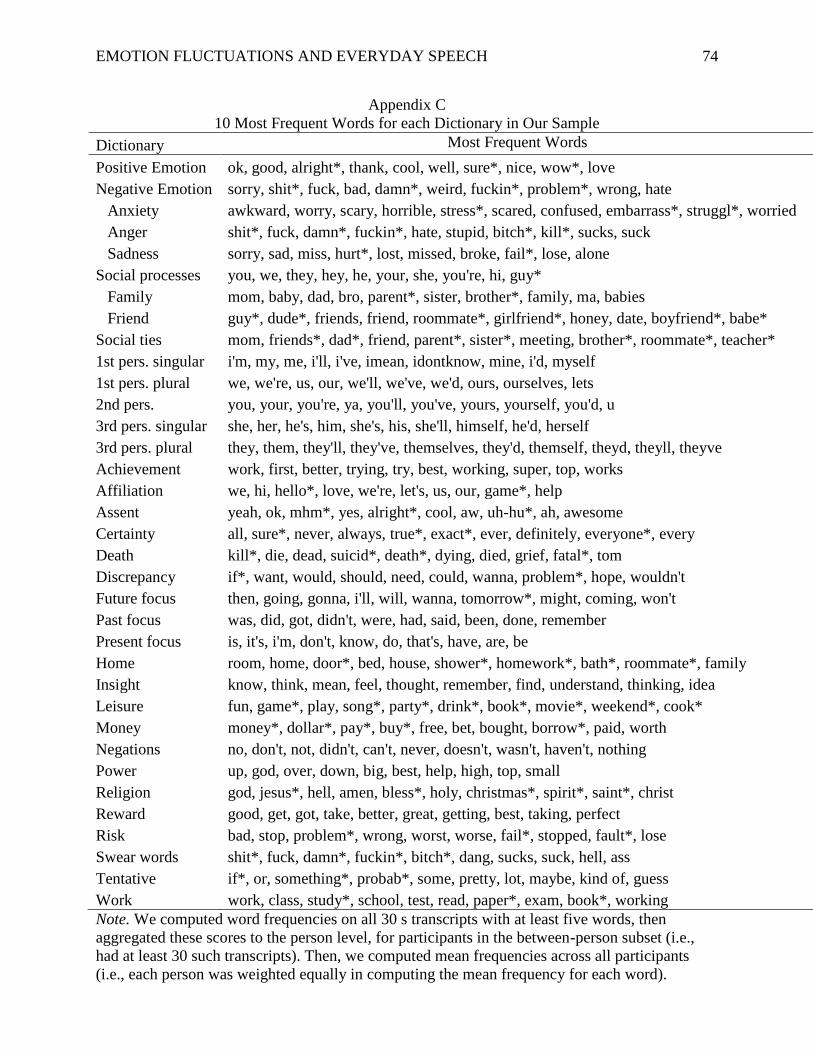
EMOTION FLUCTUATIONS AND EVERYDAY SPEECH 74
Appendix C
10 Most Frequent Words for each Dictionary in Our Sample
Dictionary Most Frequent Words
Positive Emotion ok, good, alright*, thank, cool, well, sure*, nice, wow*, love
Negative Emotion sorry, shit*, fuck, bad, damn*, weird, fuckin*, problem*, wrong, hate
Anxiety awkward, worry, scary, horrible, stress*, scared, confused, embarrass*, struggl*, worried
Anger shit*, fuck, damn*, fuckin*, hate, stupid, bitch*, kill*, sucks, suck
Sadness sorry, sad, miss, hurt*, lost, missed, broke, fail*, lose, alone
Social processes you, we, they, hey, he, your, she, you're, hi, guy*
Family mom, baby, dad, bro, parent*, sister, brother*, family, ma, babies
Friend guy*, dude*, friends, friend, roommate*, girlfriend*, honey, date, boyfriend*, babe*
Social ties mom, friends*, dad*, friend, parent*, sister*, meeting, brother*, roommate*, teacher*
1st pers. singular i'm, my, me, i'll, i've, imean, idontknow, mine, i'd, myself
1st pers. plural we, we're, us, our, we'll, we've, we'd, ours, ourselves, lets
2nd pers. you, your, you're, ya, you'll, you've, yours, yourself, you'd, u
3rd pers. singular she, her, he's, him, she's, his, she'll, himself, he'd, herself
3rd pers. plural they, them, they'll, they've, themselves, they'd, themself, theyd, theyll, theyve
Achievement work, first, better, trying, try, best, working, super, top, works
Affiliation we, hi, hello*, love, we're, let's, us, our, game*, help
Assent yeah, ok, mhm*, yes, alright*, cool, aw, uh-hu*, ah, awesome
Certainty all, sure*, never, always, true*, exact*, ever, definitely, everyone*, every
Death kill*, die, dead, suicid*, death*, dying, died, grief, fatal*, tom
Discrepancy if*, want, would, should, need, could, wanna, problem*, hope, wouldn't
Future focus then, going, gonna, i'll, will, wanna, tomorrow*, might, coming, won't
Past focus was, did, got, didn't, were, had, said, been, done, remember
Present focus is, it's, i'm, don't, know, do, that's, have, are, be
Home room, home, door*, bed, house, shower*, homework*, bath*, roommate*, family
Insight know, think, mean, feel, thought, remember, find, understand, thinking, idea
Leisure fun, game*, play, song*, party*, drink*, book*, movie*, weekend*, cook*
Money money*, dollar*, pay*, buy*, free, bet, bought, borrow*, paid, worth
Negations no, don't, not, didn't, can't, never, doesn't, wasn't, haven't, nothing
Power up, god, over, down, big, best, help, high, top, small
Religion god, jesus*, hell, amen, bless*, holy, christmas*, spirit*, saint*, christ
Reward good, get, got, take, better, great, getting, best, taking, perfect
Risk bad, stop, problem*, wrong, worst, worse, fail*, stopped, fault*, lose
Swear words shit*, fuck, damn*, fuckin*, bitch*, dang, sucks, suck, hell, ass
Tentative if*, or, something*, probab*, some, pretty, lot, maybe, kind of, guess
Work work, class, study*, school, test, read, paper*, exam, book*, working
Note. We computed word frequencies on all 30 s transcripts with at least five words, then
aggregated these scores to the person level, for participants in the between-person subset (i.e.,
had at least 30 such transcripts). Then, we computed mean frequencies across all participants
(i.e., each person was weighted equally in computing the mean frequency for each word).

Minerva Access is the Institutional Repository of The University of Melbourne
Author/s:
Sun, J; Schwartz, HA; Son, Y; Kern, ML; Vazire, S
Title:
The Language of Well-Being: Tracking Fluctuations in Emotion Experience Through
Everyday Speech
Date:
2020-02-01
Citation:
Sun, J., Schwartz, H. A., Son, Y., Kern, M. L. & Vazire, S. (2020). The Language of Well-
Being: Tracking Fluctuations in Emotion Experience Through Everyday Speech. JOURNAL
OF PERSONALITY AND SOCIAL PSYCHOLOGY, 118 (2), pp.364-387.
https://doi.org/10.1037/pspp0000244.
Persistent Link:
http://hdl.handle.net/11343/253830
File Description:
Accepted version