the late cenozoic eridanos delta system in the southern ...overeem/eridanos/bre151.pdf ·...
TRANSCRIPT

The Late Cenozoic Eridanos delta system inthe Southern North Sea Basin: a climate signalin sediment supply?I. Overeem,* G. J. Weltje,* C. Bishop-Kay² and S. B. Kroonenberg*
*Department of Applied Earth Sciences, Delft University of
Technology, The Netherlands, PO Box 5028, NL-2600 GA Delft,
The Netherlands
²Woodside Energy Ltd, 1 Adelaide Terrace, Perth WA 6000,
Australia
ABSTRACT
The Eridanos ¯uvio-deltaic system, draining most of north-western Europe, developed during
the Late Cenozoic as a result of simultaneous uplift of the Fennoscandian shield and
accelerated subsidence in the North Sea Basin. This seismo-stratigraphic study aims to
reconstruct the large-scale depositional architecture of the deltaic portion of the basin ®ll and
relate it to external controls. A total of 27 units have been recognized. They comprise over
62r103 km3 in the Southern North Sea Basin alone, and have an average delta surface area of
28r103 km2, which suggests that the size of the drainage area was about 1.1r106 km2. Water
depth in the depocentre is seen to decrease systematically over time. This trend is interrupted
by a deepening phase between 6.5 and 4.5 Ma that can be correlated with the simultaneous
occurrence of increased uplift of the Fennoscandian shield, increased subsidence of the
Southern North Sea Basin, and a long-term eustatic highstand. All these observations point
to a tectonic control on long-term average rates of accommodation and supply. Controls on
short-term variations are inferred from variations in rates of sediment supply and bifurcation
of the delta channel network. Both rates were initially low under warm, moist, relatively stable
climate conditions. The straight wave-dominated delta front gradually developed into a lobate
¯uvial-dominated delta front. Two high-amplitude sea-level falls affected the Pliocene units,
which are characterized by widespread delta-front failures. Changes in relative sea level and
climate became more frequent from the late Pliocene onward, as the system experienced the
effects of glacial±interglacial transitions. Peaks in sedimentation and bifurcation rates were
coeval with cold (glacial) conditions. The positive correlation between rates of supply and
bifurcation on the one hand, and climate proxies (pollen and d18O records) on the other hand
is highly signi®cant. The evidence presented in this study convincingly demonstrates the
control of climate on time-averaged sediment supply and channel-network characteristics,
despite the expected nonuniformity and time lags in system response. The presence of a clearly
discernible climate signal in time-averaged sediment supply illustrates the usefulness of
integrated seismo-stratigraphic studies for basin-wide analysis of delta evolution on geological
time scales.
INTRODUCTION AND OBJECTIVE
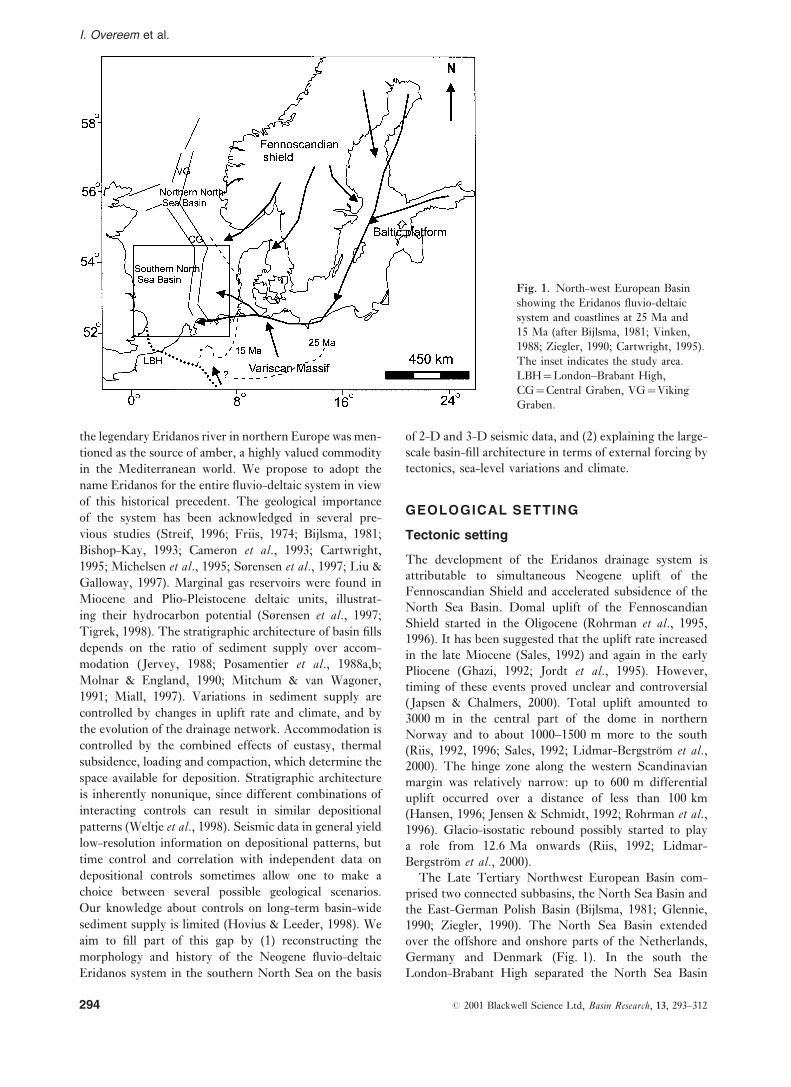
During the Late Cenozoic the North Sea Basin was
dominated by an extensive ¯uvial system that drained the
Fennoscandian and Baltic shield through the present
Baltic Sea (Fig. 1). The dimensions of the drainage area
and the thickness of the deltaic deposits in the present
North Sea are comparable to those of the present Orinoco
delta system (Coleman & Roberts, 1989). Its drainage
system has been referred to as the Baltic river (Bijlsma,
1981) and its proto-delta in Poland as the Eridanos delta
(Kosmowska-Ceranowicz, 1988). The latter designation is
based on ancient Greek records (7th century BC) in which
Correspondence: Irina Overeem, Department of Applied EarthSciences, Delft University of Technology, The Netherlands,PO Box 5028, NL-2600 GA Delft, The Netherlands.E-mail: [email protected]
Basin Research (2001) 13, 293±312
# 2001 Blackwell Science Ltd 293
the legendary Eridanos river in northern Europe was men-
tioned as the source of amber, a highly valued commodity
in the Mediterranean world. We propose to adopt the
name Eridanos for the entire ¯uvio-deltaic system in view
of this historical precedent. The geological importance
of the system has been acknowledged in several pre-
vious studies (Streif, 1996; Friis, 1974; Bijlsma, 1981;
Bishop-Kay, 1993; Cameron et al., 1993; Cartwright,
1995; Michelsen et al., 1995; Sùrensen et al., 1997; Liu &
Galloway, 1997). Marginal gas reservoirs were found in
Miocene and Plio-Pleistocene deltaic units, illustrat-
ing their hydrocarbon potential (Sùrensen et al., 1997;
Tigrek, 1998). The stratigraphic architecture of basin ®lls
depends on the ratio of sediment supply over accom-
modation (Jervey, 1988; Posamentier et al., 1988a,b;
Molnar & England, 1990; Mitchum & van Wagoner,
1991; Miall, 1997). Variations in sediment supply are
controlled by changes in uplift rate and climate, and by
the evolution of the drainage network. Accommodation is
controlled by the combined effects of eustasy, thermal
subsidence, loading and compaction, which determine the
space available for deposition. Stratigraphic architecture
is inherently nonunique, since different combinations of
interacting controls can result in similar depositional
patterns (Weltje et al., 1998). Seismic data in general yield
low-resolution information on depositional patterns, but
time control and correlation with independent data on
depositional controls sometimes allow one to make a
choice between several possible geological scenarios.
Our knowledge about controls on long-term basin-wide
sediment supply is limited (Hovius & Leeder, 1998). We
aim to ®ll part of this gap by (1) reconstructing the
morphology and history of the Neogene ¯uvio-deltaic
Eridanos system in the southern North Sea on the basis
of 2-D and 3-D seismic data, and (2) explaining the large-
scale basin-®ll architecture in terms of external forcing by
tectonics, sea-level variations and climate.
GEOLOGICAL SETTING
Tectonic setting
The development of the Eridanos drainage system is
attributable to simultaneous Neogene uplift of the
Fennoscandian Shield and accelerated subsidence of the
North Sea Basin. Domal uplift of the Fennoscandian
Shield started in the Oligocene (Rohrman et al., 1995,
1996). It has been suggested that the uplift rate increased
in the late Miocene (Sales, 1992) and again in the early
Pliocene (Ghazi, 1992; Jordt et al., 1995). However,
timing of these events proved unclear and controversial
( Japsen & Chalmers, 2000). Total uplift amounted to
3000 m in the central part of the dome in northern
Norway and to about 1000±1500 m more to the south
(Riis, 1992, 1996; Sales, 1992; Lidmar-BergstroÈm et al.,2000). The hinge zone along the western Scandinavian
margin was relatively narrow: up to 600 m differential
uplift occurred over a distance of less than 100 km
(Hansen, 1996; Jensen & Schmidt, 1992; Rohrman et al.,1996). Glacio-isostatic rebound possibly started to play
a role from 12.6 Ma onwards (Riis, 1992; Lidmar-
BergstroÈm et al., 2000).
The Late Tertiary Northwest European Basin com-
prised two connected subbasins, the North Sea Basin and
the East-German Polish Basin (Bijlsma, 1981; Glennie,
1990; Ziegler, 1990). The North Sea Basin extended
over the offshore and onshore parts of the Netherlands,
Germany and Denmark (Fig. 1). In the south the
London-Brabant High separated the North Sea Basin
Fig. 1. North-west European Basin
showing the Eridanos ¯uvio-deltaic
system and coastlines at 25 Ma and
15 Ma (after Bijlsma, 1981; Vinken,
1988; Ziegler, 1990; Cartwright, 1995).
The inset indicates the study area.
LBH=London±Brabant High,
CG=Central Graben, VG=Viking
Graben.
I. Overeem et al.
294 # 2001 Blackwell Science Ltd, Basin Research, 13, 293±312

from the Atlantic Ocean, although at some periods a
connection through the English Channel may have
existed (Wood et al., 1993; Funnell, 1996). While Early
Tertiary subsidence in the southern North Sea was relat-
ively slow, it accelerated at least an order of magnitude
in the Neogene (Kooi et al., 1989; Joy, 1992; Liu &
Galloway, 1997). Isopach maps of Quaternary deposits
suggest that the pre-existing Viking Graben and Central
Graben acted as depocentres (Caston, 1977; Cameron,
1993). However, the overall saucer-shaped geometry
of the southern North Sea Basin indicates that the major
faults have not been actively controlling sediment
distribution (Huuse, 2000). Differential movements,
i.e. rapid subsidence in the centre of the basin and less
subsidence or even uplift along the margins, have been
attributed to intraplate stresses (Kooi et al., 1991;
Cloetingh et al., 1992).
Development of the ¯uvial drainage system
The drainage basin in its earliest form was already
present during the late Oligocene ± early Miocene, as
evidenced by the amber-bearing deltaic deposits in the
Polish basin (Kosmowska-Czeranowicz, 1988). Rivers
that drained to the SE had started to strip the deeply
weathered Fennoscandian Shield (Lidmar-BergstroÈm,
1996). Coarse sediments were supplied from southern
Norway (Michelsen et al., 1995, 1998) and sedimentation
shifted clockwise around the eastern margin of the basin
in the Oligo-Miocene (Clausen et al., 1999; Huuse, 2000).
The depocentres of the system migrated westwards
through north-western Europe, as demonstrated by
deposition of lignite-bearing sediments in Poland and
Eastern Germany in the early Miocene, and in western
Germany and Denmark in the middle and late Miocene
(Vinken, 1988). The sediments exposed onshore have a
distinctive gravel assemblage (Baltic Gravel Assemblage)
traceable to source areas in Fennoscandinavia, the present
northern Baltic Sea and the present Skagerrak (Bijlsma,
1981). The proto-Elbe and proto-Weser formed tribut-
aries to the main system, as deduced from the heavy
mineral composition of the ¯uvial deposits (Bijlsma, 1981;
Streif, 1996).
Early Pliocene coarse sands and gravels, known as
the Kaolin Sands, were deposited in a narrow zone in
Germany and The Netherlands. During the late Pliocene
and Praetiglian (early Pleistocene) deposition of coarse
sands continued in NW Germany, while ®ne sands were
deposited in the Netherlands. During the Tiglian braided
rivers developed in The Netherlands, re¯ecting rapid
westward expansion of the system. During the Waalian,
these rivers covered a large part of the Netherlands.
German rivers were probably still tributaries to the
Eridanos river system and in the southern part the Rhine±
Meuse system started to join in at this time (Bijlsma,
1981; Gibbard, 1988). Around 1.0 Ma the Baltic Gravel
Assemblage started to mix with gravel and sands
originating from the Variscan Massif (Zandstra, 1971).
The Menapian ice sheet most likely destroyed the upper
course of the river system, because the Baltic Gravel
Assemblage disappeared at that time. The North German
rivers continued to ¯ow into the Eastern Netherlands
until the middle Pleistocene (Gibbard, 1988).
DATA AND METHODS
Subsurface data base
Seismic data, both 2-D and 3-D, represent the main
source of information for this study. 2-D seismic lines of
different NOPEC surveys (SNSTI-86 and SNSTI-UK-
87 in the British sector, SNSTI-NL-87 in the Dutch
sector, GR-86 in the German sector and CGD-85 in the
Fig. 2. Study area with NOPEC 2-D
seismic lines and 3-D data sets in the
M09, L08 and F09 blocks. Two
cross-sections, indicated with dotted
lines, are used to illustrate the regional
seismics: 87-06 (Fig. 6) and 87-26
(Fig. 7). Black squares are locations
of wells discussed in the text.
The Cenozoic Eridanos delta, southern North Sea
# 2001 Blackwell Science Ltd, Basin Research, 13, 293±312 295
Danish sector) were used (Fig. 2). These lines have a
60-fold coverage. The uppermost interval (sea bottom to
300±400 ms) of the data is of poor quality. Vertical
resolution estimates, based on interval velocities and
frequencies used by NOPEC during processing, are about
11.5 m for the interval 400±900 ms and about 13 m for
the interval 900±1700 ms. A total of 85 commercial wells
studied by Bishop-Kay (1993) contained little information
on the shallow Cenozoic deposits. The low information
content of these commercial wells is due to the limited
number of samples analysed and the possibility of
contamination associated with the drilling technology
used (Gradstein et al., 1992). The available gamma-ray
logs covering the intervals of interest failed to provide
straightforward grain-size information, because the sands
are in general rich in mica and glauconite (Sha et al., 1996;
Streif, 1996). However, data from nine boreholes drilled
by the Southern North Sea Project did contain
sedimentological, biostratigraphic and magnetostrati-
graphic information to support our interpretations of
the uppermost intervals of the studied delta system (Sha
et al., 1996; Streif, 1996). Three 3-D seismic surveys,
located in the M09, L08 and F09 blocks, were used for
more detailed interpretation (Fig. 2). Line spacing in
these blocks is 12.5 m at best and the sampling rate is
4 ms. Furthermore, these data sets have been time-
migrated to enhance image quality. Vertical and lateral
resolution is estimated to be about 10 m and 100±150 m,
respectively. Gamma-ray and sonic logs in the 3-D blocks
(M09-1, M09-2, L08-4, L08-10, L08-G-01, L08-H-01,
F09-1 and F09-2) were used for time±depth conversion.
Seismo-stratigraphic interpretation
Interpretation of seismic lines is based on the assump-
tion that re¯ectors follow bedding planes, that bedding
planes are isochronous and hence that seismic re¯ectors
approximate time lines (Payton, 1977; Emery & Myers,
1996). Depositional sequences are bounded by re¯ectors
and their mutual relations are determined by re¯ector
terminations (Payton, 1977; Posamentier et al., 1988a,b;
Van Wagoner et al., 1988; Emery & Myers, 1996).
Intrasequence re¯ector con®guration has been studied to
assess depositional facies. The con®guration of the
re¯ectors depends on the depositional regime (Payton,
1977; Mitchum & Van Wagoner, 1991) because sequence
geometry is a function of the ratio of sediment supply
over accommodation. Signi®cant basinward shifts of
coastal onlap were used to identify sequence boundaries.
Re¯ectors considered sequence boundaries are character-
ized by consistent onlap terminations of the overlying
deposits. Galloway (1989) has questioned the validity of
using unconformities as sequence boundaries, since the
hiatus represented by an unconformity may vary signi-
®cantly. Marine ¯ooding surfaces would be a better (iso-
chronous) alternative. However, identi®cation of ¯ooding
surfaces relies on well interpretations and these were
found to be of limited usefulness. Salt tectonics and
postdepositional tectonic movements locally complicated
seismic interpretation. In addition, gas occurrences
`blanked' the signal in some areas.
A 3-D framework was constructed by interpolation of
the re¯ectors interpreted from the 2-D lines. Interpola-
tion on a 12.5r12.5-km grid was carried out by means of
a weighted least squares contouring algorithm in the
software package ZMAP. Palaeosurfaces, isopachs and
channel network maps were constructed from the
interpolated data. No correction for loading or compac-
tion was made, so that the actual depth of the seismic
surfaces is shown. Volumes and surface areas of the
deltaic units were calculated from the isopach maps.
Mapping of the delta channel network was based on
interpreted channels and further inferred from contour
bulges in the isopach maps of each unit. Since the vertical
resolution of the data is approximately 13 m and the
lateral resolution 100±150 m, only larger channels could
be identi®ed. Wherever possible, the 3-D seismic data
have been used to investigate the channels in more detail
(van de Bilt, 2000; Steeghs et al., 2001).
Chronostratigraphic control
A chronostratigraphic framework was provided by
combining various types of stratigraphic data from
wells in the study area (Fig. 2). Biostratigraphic data
comprise foraminifera (wells Kim-1, Cleo-1, M10:
Knudsen, 1985; Knudsen & Asbjùrndottir, 1991;
Konradi, 1995, 1996), Azolla species (wells A-1 and
A-2: Bertelsen, 1972) and molluscs (wells R-1 and 89/5:
Streif, 1996). In addition, we used magnetostratigraphic
datings (wells 89/2 and 89/3: Sha et al., 1996; Streif,
1996) and lithostratigraphic correlations based on Dutch
Geological Survey gamma-ray log interpretations (wells
A16-1 and A12-1). Age data for the studied deposits are
sparse. Furthermore, the seismic data were interpolated
over 12.5r12.5-km blocks and depth-converted with the
stacking velocities of the NOPEC data with a few sonic
logs only, hampering an exact correlation of unit
boundaries with the age data. The correlation problems
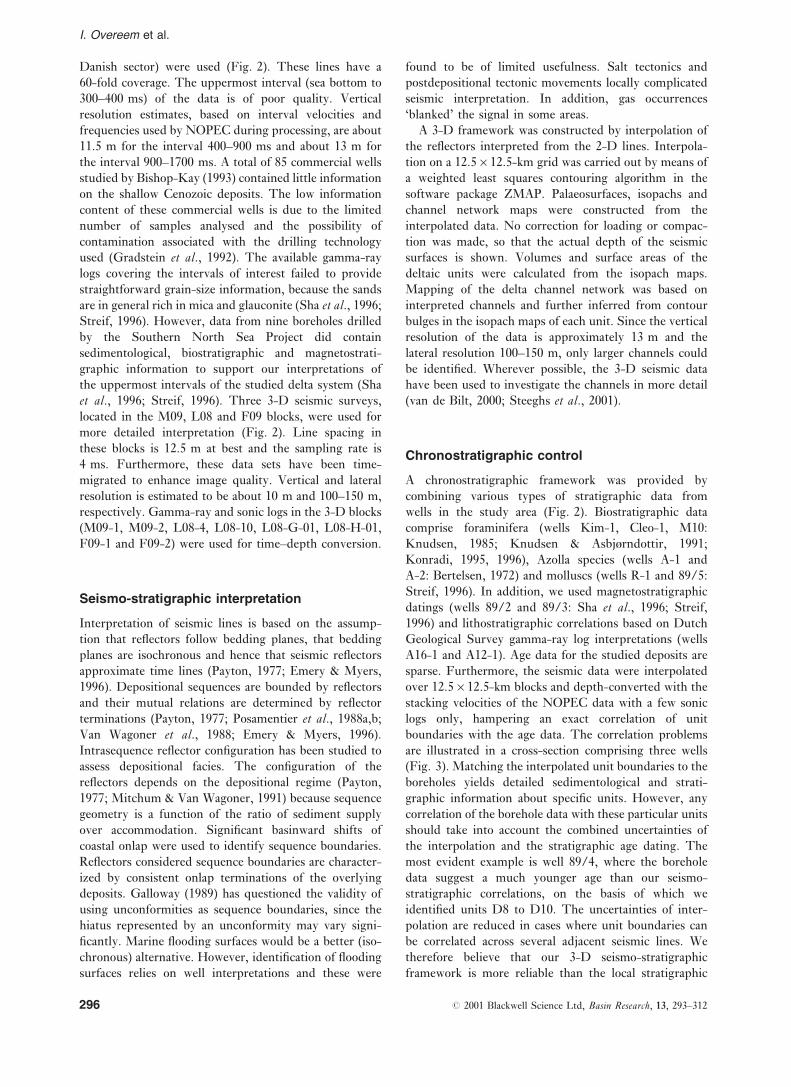
are illustrated in a cross-section comprising three wells
(Fig. 3). Matching the interpolated unit boundaries to the
boreholes yields detailed sedimentological and strati-
graphic information about speci®c units. However, any
correlation of the borehole data with these particular units
should take into account the combined uncertainties of
the interpolation and the stratigraphic age dating. The
most evident example is well 89/4, where the borehole
data suggest a much younger age than our seismo-
stratigraphic correlations, on the basis of which we
identi®ed units D8 to D10. The uncertainties of inter-
polation are reduced in cases where unit boundaries can
be correlated across several adjacent seismic lines. We
therefore believe that our 3-D seismo-stratigraphic
framework is more reliable than the local stratigraphic
I. Overeem et al.
296 # 2001 Blackwell Science Ltd, Basin Research, 13, 293±312
evidence obtained in isolated wells. Consequently, a
scatter in unit ages is unavoidable.
The Eridanos delta deposits are bounded below by a
major unconformity discernible on all seismic pro®les, the
Mid-Miocene Unconformity (MMU). The age of down-
lap onto the MMU becomes gradually younger towards
the central part of the North Sea Basin. This introduces a
range of uncertainty in the onset of deposition, which has
been estimated as 12.4 Ma in the Danish sector (Sùrensen
et al., 1997; Michelsen et al., 1998) and 10.7 Ma in the
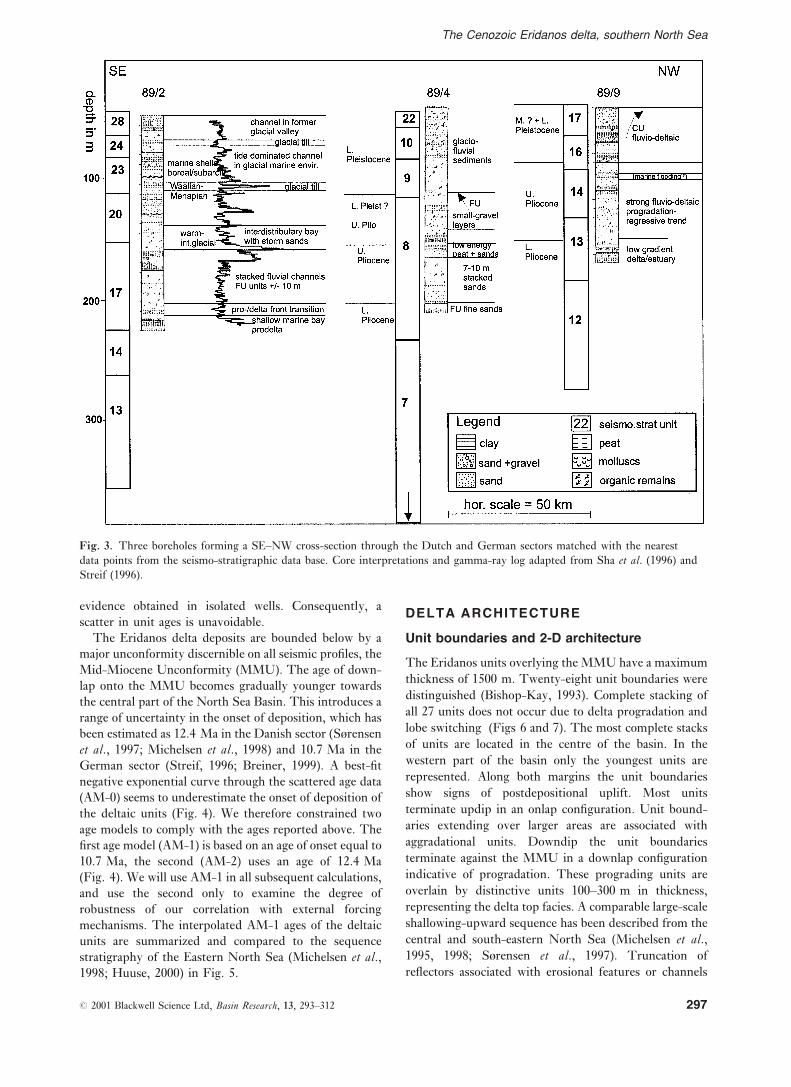
German sector (Streif, 1996; Breiner, 1999). A best-®t
negative exponential curve through the scattered age data
(AM-0) seems to underestimate the onset of deposition of
the deltaic units (Fig. 4). We therefore constrained two
age models to comply with the ages reported above. The
®rst age model (AM-1) is based on an age of onset equal to
10.7 Ma, the second (AM-2) uses an age of 12.4 Ma
(Fig. 4). We will use AM-1 in all subsequent calculations,
and use the second only to examine the degree of
robustness of our correlation with external forcing
mechanisms. The interpolated AM-1 ages of the deltaic
units are summarized and compared to the sequence
stratigraphy of the Eastern North Sea (Michelsen et al.,1998; Huuse, 2000) in Fig. 5.
DELTA ARCHITECTURE
Unit boundaries and 2-D architecture
The Eridanos units overlying the MMU have a maximum
thickness of 1500 m. Twenty-eight unit boundaries were
distinguished (Bishop-Kay, 1993). Complete stacking of
all 27 units does not occur due to delta progradation and
lobe switching (Figs 6 and 7). The most complete stacks
of units are located in the centre of the basin. In the
western part of the basin only the youngest units are
represented. Along both margins the unit boundaries
show signs of postdepositional uplift. Most units
terminate updip in an onlap con®guration. Unit bound-
aries extending over larger areas are associated with
aggradational units. Downdip the unit boundaries
terminate against the MMU in a downlap con®guration
indicative of progradation. These prograding units are
overlain by distinctive units 100±300 m in thickness,
representing the delta top facies. A comparable large-scale
shallowing-upward sequence has been described from the
central and south-eastern North Sea (Michelsen et al.,
1995, 1998; Sùrensen et al., 1997). Truncation of
re¯ectors associated with erosional features or channels
Fig. 3. Three boreholes forming a SE±NW cross-section through the Dutch and German sectors matched with the nearest
data points from the seismo-stratigraphic data base. Core interpretations and gamma-ray log adapted from Sha et al. (1996) and
Streif (1996).
The Cenozoic Eridanos delta, southern North Sea
# 2001 Blackwell Science Ltd, Basin Research, 13, 293±312 297
at the top of units along the delta front has been observed
(Fig. 8).
The lowermost units are dominated by oblique
clinoforms with dips of up to 10u. Distinct packages of
oblique clinoforms have been recognized, representing
either parasequences or lateral shifts of the system. The
estimated water depth, based on the assumption that the
of¯ap break coincides approximately with sea level, is up
to 300 m in the centre of the basin. This type of
architecture indicates a high-energy regime with a high
rate of sediment supply and a relatively low rate of
accommodation (suggesting a fairly stable sea level and
limited subsidence). Near the margins of the basin, coeval
shingled clinoforms with planar, gently dipping, pro-
gradational geometry have been identi®ed. Hummocky
clinoforms with irregular, discontinuous and subparallel
re¯ectors occur toward the landward limit of the units
dominated by high-angle oblique clinoforms. These
smaller units are interpreted as small interdeltaic lobes
or channel-levee systems in the ¯uvial part of the delta.
Typical dips of such hummocky clinoforms are 2.5u as
observed in the 3-D seismic data of the L08 block
(Steeghs et al., 2001). The limited thickness of stacked
beds (10 m) suggests that this type of clinoform is typical
of deltas that prograde in shallow water, which is
corroborated by the thickness of stacked units deduced
from the gamma-ray log of the L08 block (Fig. 8).
Characteristic chaotic re¯ector con®gurations have been
observed in units D10±D14. This seismic facies has
been interpreted as slump deposits, i.e. a recorder of
synsedimentary deformation due to slope instability
Fig. 4. Age models for the
seismo-stratigraphic units based on all
available stratigraphic data. AM-0 is
the unconstrained least-squares best ®t,
predicting an age of onset of
deposition onto the Mid Miocene
Unconformity (MMU) of 8 Ma. Two
reported ages of onset of deposition on
the MMU have been used to establish
two constrained time scenarios
(AM-1: 10.7 Ma; AM-2: 12.4 Ma).
Fig. 5. Chronostratigraphic scheme (after Berggren et al.,
1995; Harland et al., 1990). The sequence-stratigraphic
scheme of the Southern North Sea Basin proposed in this
paper is compared to the scheme of the Eastern North Sea
(Michelsen et al., 1998).
I. Overeem et al.
298 # 2001 Blackwell Science Ltd, Basin Research, 13, 293±312
(Cameron et al., 1993; Sùrensen et al., 1997; Overeem
et al., 2001). In units D15 and higher, gently dipping
sigmoidal clinoforms are the dominant seismic facies in
the depocentre. Examples of such sigmoidal clinoforms
encountered in the L08 block are shown in Fig. 8. Water
depth estimated from heights of these sigmoidal clino-
form reaches a maximum of 130 m in the Central Graben
area. Parallel re¯ectors, bounding thinner units, dominate
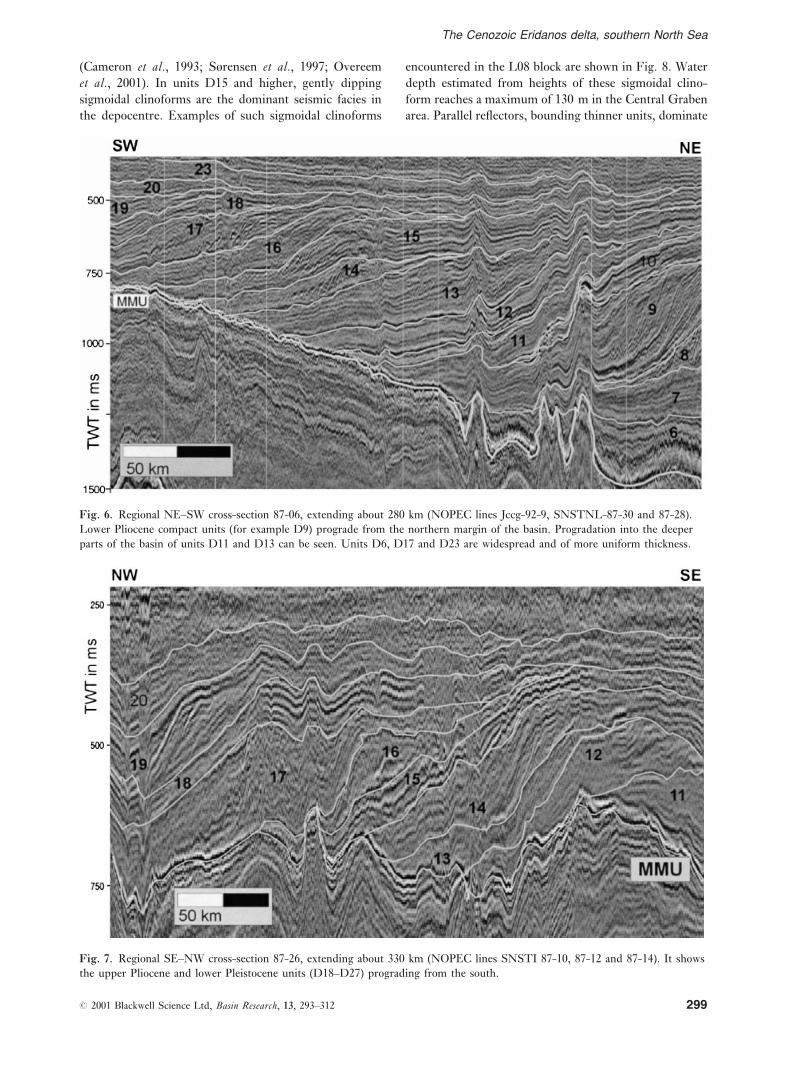
Fig. 6. Regional NE±SW cross-section 87-06, extending about 280 km (NOPEC lines Jccg-92-9, SNSTNL-87-30 and 87-28).
Lower Pliocene compact units (for example D9) prograde from the northern margin of the basin. Progradation into the deeper
parts of the basin of units D11 and D13 can be seen. Units D6, D17 and D23 are widespread and of more uniform thickness.
Fig. 7. Regional SE±NW cross-section 87-26, extending about 330 km (NOPEC lines SNSTI 87-10, 87-12 and 87-14). It shows
the upper Pliocene and lower Pleistocene units (D18±D27) prograding from the south.
The Cenozoic Eridanos delta, southern North Sea
# 2001 Blackwell Science Ltd, Basin Research, 13, 293±312 299
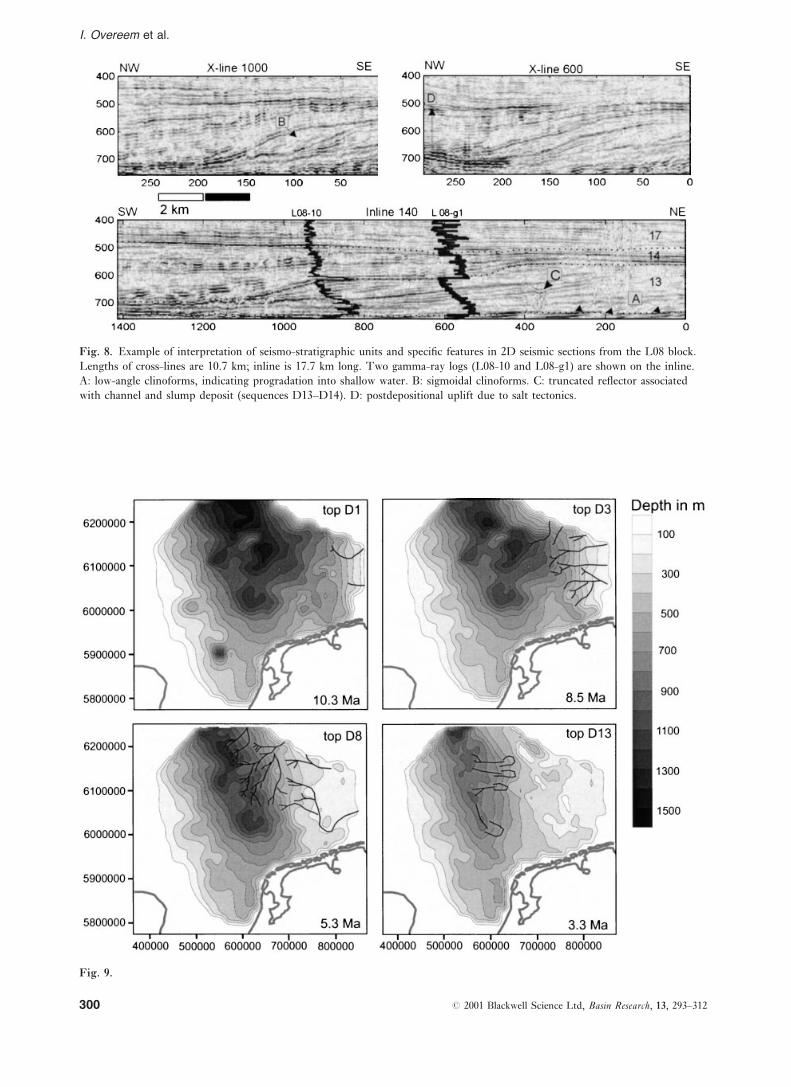
Fig. 8. Example of interpretation of seismo-stratigraphic units and speci®c features in 2D seismic sections from the L08 block.
Lengths of cross-lines are 10.7 km; inline is 17.7 km long. Two gamma-ray logs (L08-10 and L08-g1) are shown on the inline.
A: low-angle clinoforms, indicating progradation into shallow water. B: sigmoidal clinoforms. C: truncated re¯ector associated
with channel and slump deposit (sequences D13±D14). D: postdepositional uplift due to salt tectonics.
Fig. 9.
I. Overeem et al.
300 # 2001 Blackwell Science Ltd, Basin Research, 13, 293±312
the uppermost units. These are generally dif®cult to
correlate regionally due to poor data quality in the upper
part of the seismic pro®les.
Morphological evolution of theEridanos delta system
Straight delta front (upper Miocene, units D1±D8)
Palaeosurface maps show a gradual shift of the depo-
centres towards the west. A straight N±S-orientated delta
front was located in the German and Danish sectors
during the earliest units D1±D4 (Fig. 9; Sùrensen et al.,1997; Clausen et al., 1999). The Eridanos river system
probably comprised two active branches that together
acted as a line source. The northward ¯owing North-
German rivers were either tributaries of the Eridanos
river system or discharged into the Southern North Sea
Basin separately. The locus of deposition was limited to
the area between the delta front and the foot of the delta
slope. All channels were relatively straight, whereas only
a few isolated distributaries developed a branching net-
work. The predominance of single-thread channels,
indicative for steep offshore slopes and high wave
energy, in conjunction with the straight delta front,
point to a wave-dominated delta regime. The delta
migrated slowly westward during unit D5 and D6.
Development of a delta plain with bifurcating channels is
con®rmed by sedimentological interpretation of borehole
data from the German sector (Fig. 3, borehole 89/4). The
locus of deposition shifted to the north during unit D7,
but during unit D8 deposition returned to the previous
site, suggesting reoccupation of the channel belt. The
oldest unit boundaries are therefore not necessarily
coupled with relative sea-level changes.
Lobate delta front (lower Pliocene, unit D9-D11)
Westward progradation continued and several large lobes
started to develop. The lobate morphology indicates a
shift in depositional regime from a wave- to a ¯uvial-
dominated delta. Rivers coming from the north-east
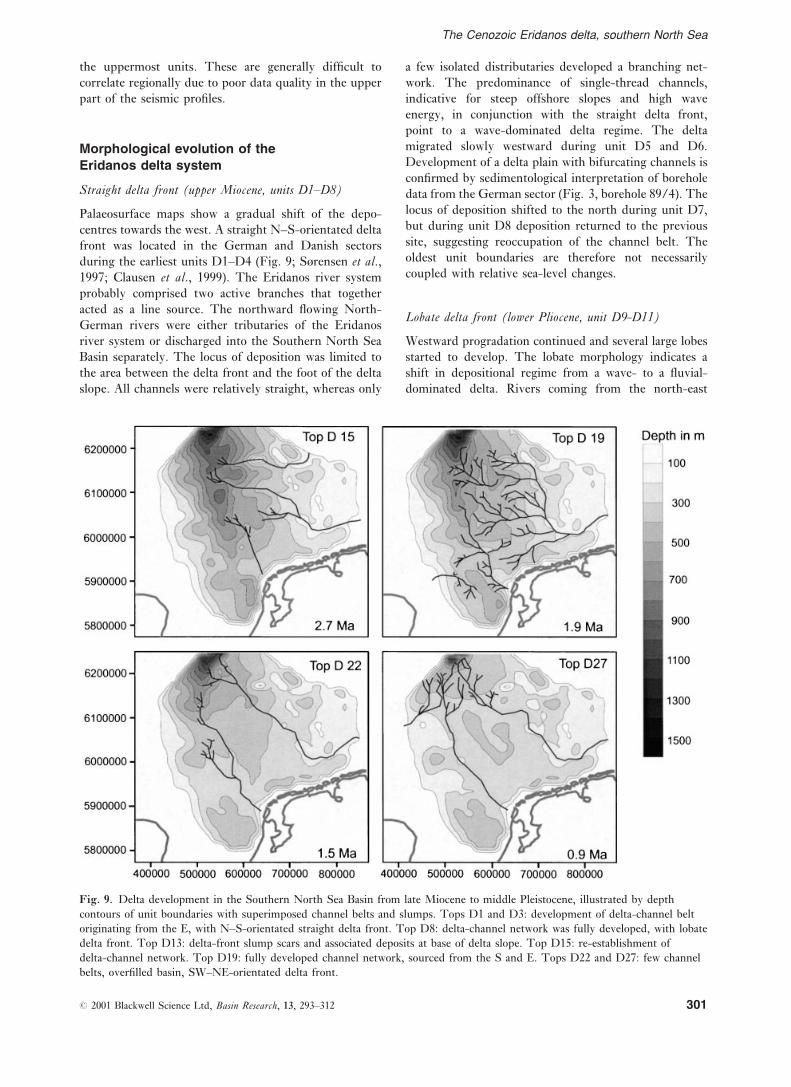
Fig. 9. Delta development in the Southern North Sea Basin from late Miocene to middle Pleistocene, illustrated by depth
contours of unit boundaries with superimposed channel belts and slumps. Tops D1 and D3: development of delta-channel belt
originating from the E, with N±S-orientated straight delta front. Top D8: delta-channel network was fully developed, with lobate
delta front. Top D13: delta-front slump scars and associated deposits at base of delta slope. Top D15: re-establishment of
delta-channel network. Top D19: fully developed channel network, sourced from the S and E. Tops D22 and D27: few channel
belts, over®lled basin, SW±NE-orientated delta front.
The Cenozoic Eridanos delta, southern North Sea
# 2001 Blackwell Science Ltd, Basin Research, 13, 293±312 301

continued to be the main sources. During unit D10 and
D11 the lobes prograded further. From unit D11 onwards
sediment accumulated mainly at the base of the delta
slope. Mass movements were important, because chaotic
re¯ectors within these units are common, especially in the
centre of the basin.
Large erosional features (upper Pliocene, unit D12±D14)
A signi®cant southward shift in depocentre location of
150 km occurred during unit D12. Deposits of that stage
represent the ®rst Eridanos sediments in the M09 block,
where south to westward progradation was mapped. Two
major lobes now dominated the system. The south-
eastern lobe became the main depocentre from unit D13
onwards. Depositional environments in the eastern part of
the basin have been characterized as low-gradient deltaic
or estuarine (Fig. 3, borehole 89/9). Distributary channel
networks could not be identi®ed, but features interpreted
as lowstand wedges consisting of slump deposits and
slump scars have been observed. Interpretation of the
slump scars was facilitated by the presence of small feeder
channels testifying to headward erosion of the scars. The
slump fans and associated feeder systems are clearly
visible in the 3-D data (Fig. 10, Steeghs et al., 2001;
Overeem et al., 2001). Widespread mass movements
occurred in several phases and appear to be related to a
high rate of progradation and a persistent prodelta current
regime (Cartwright, 1995). The isopach map of unit D14
shows a large delta lobe with the apex pointing towards
the east. The combination of erosional features and the
fan-shaped geometry of the delta lobe are attributed to a
sea-level fall and subsequent lowstand.
Re-establishment of channel network(upper Pliocene ± lower Pleistocene, unit D15±D18)
During unit D15 and D16 deposition resumed at the
N±S-orientated delta front, and the distributary network
started to re-establish itself. During deposition of unit
D16 the delta front split into an upper segment
dominated by lobe features and a lower segment
formed by a base of slope fan. The N±S-orientated zone
of maximum sediment accumulation was narrow and
almost ribbon-like. The architecture of unit D17 seems
to vary laterally from aggradational in borehole 89/2 to
progradational (CU) in borehole 89/9 (Fig. 3). Sediment
input from the south increased signi®cantly during unit
D18, suggesting that the proto-Weser system became
part of the ¯uvial channel network (Gibbard, 1988). The
N±S-orientated depocentres during deposition of units
D15±D18 were located preferentially above the Central
Graben area, suggesting that local accommodation was the
principal control on delta architecture.
In®ll of isolated depressions(lower Pleistocene, units D19±D27)
Deposition became restricted to small isolated depres-
sions during unit D19. Lateral thickness variations on a
local scale, suggesting deposition in a ¯uvial environment,
are clearly visible in the M09 and L08 blocks. Unit D20 is
thin and exceptionally widespread. It represents a phase
of aggradation of the delta plain, most likely in response to
sea-level rise. Sediment was also supplied from the British
mainland during units D19±D21 (Fig. 9). The main
direction of progradation was de¯ected towards the
north-west in the later units (D22±D27), due to the
Fig. 10. Examples of delta-front failure in the 3-D seismic data of the L08 block (units D13±D14). A: slump-fan deposit
(T=724 ms). B: slump scar and feeder channel (T=644 ms).
I. Overeem et al.
302 # 2001 Blackwell Science Ltd, Basin Research, 13, 293±312
increasing importance of the proto-Weser and Elbe
source, in conjunction with an increasing subsidence
rate of the Central Graben. Units D22±D27 show a
generally convex delta front. Borehole 89/2 (Fig. 3)
shows a vertical alternation of delta-top facies (channels)
and glacial tills in these units. The base of the tills may
form the dominant re¯ectors identi®ed as unit bound-
aries. It is thought that the proto-Weser and Rhine±
Meuse system became the dominant sediment sources in
the ®nal units. Only two major channel belts crossing the
delta plain were identi®ed. One of these originates from
the south-west, draining through the present Netherlands
onshore. On the local 3-D seismics these features have
been recognized as well. A single channel belt was
encountered in the L08 block (Steeghs et al., 2001) as well
as in the F09 block (Fig. 11, van de Bilt, 2000). According
to Zagwijn (1989), the Rhine started to contribute
sediment to the Eridanos delta only in the Late Tiglian
(about 1.7 million years BP, which corresponds to unit
D21). Earlier, deposition of Rhine sediment was restricted
to the Lower Rhine Graben. In addition, a southward-
¯owing distributary of the Eridanos river and an ancient
¯uvial system draining the British High continued to
supply sediment.
ANALYSIS OF DELTA PARAMETERS
De®nitions
Quantitative parameters have been extracted from the
seismic data to investigate the possible effects of
autocyclic and allocyclic controls on the formation and
stacking patterns of the 27 units. The information carried
by each of these parameters partly re¯ects the spatial and
temporal resolution of the data. Secular trends of
parameter values may therefore be more informative
than their absolute values. The following primary
parameters were measured and calculated for each unit:
V: volume of sediments between successive unit
boundaries (km3);
At: total delta plain area of the upper unit boundary (km2);
Ar: reduced delta plain area of upper unit boundary (km2);
N: number of coexisting channels in each unit (±);
L: total length of the channels in each unit (km).
The reduced delta plain area Ar is de®ned as the newly
formed surface in the time interval corresponding to
a unit, which may be much smaller than At for units
without appreciable aggradation. The reduced area is
calculated by subtracting the area where sediment
thickness is below seismic resolution (20 m) from At.
The average reduction in unit volume resulting from this
operation is 1.5%, which is well within the measurement
error of the volumes. The following parameters were
derived from the above:
D=LrAtx1: drainage density (kmx1);
H=VrArx1: average clinoform height (km).
The average clinoform height H is a measure of average
water depth in the depocentre. We believe that this
method of estimating water depth is more robust than the
conventional method, which is based on estimation of
local clinoform heights between toeset and of¯ap break.
The latter may be dif®cult to locate, and its palaeobathy-
metry is not well constrained (Huuse, 2000).
By introducing the age models shown in Fig. 4, the
following parameters were de®ned as a function of time
T (kyr):
S=VrTx1: net sediment accumulation rate
(km3 kyrx1);
F=NrTx1: bifurcation rate (kyrx1);
P=ArrTx1: rate of progradation (km2 kyrx1).
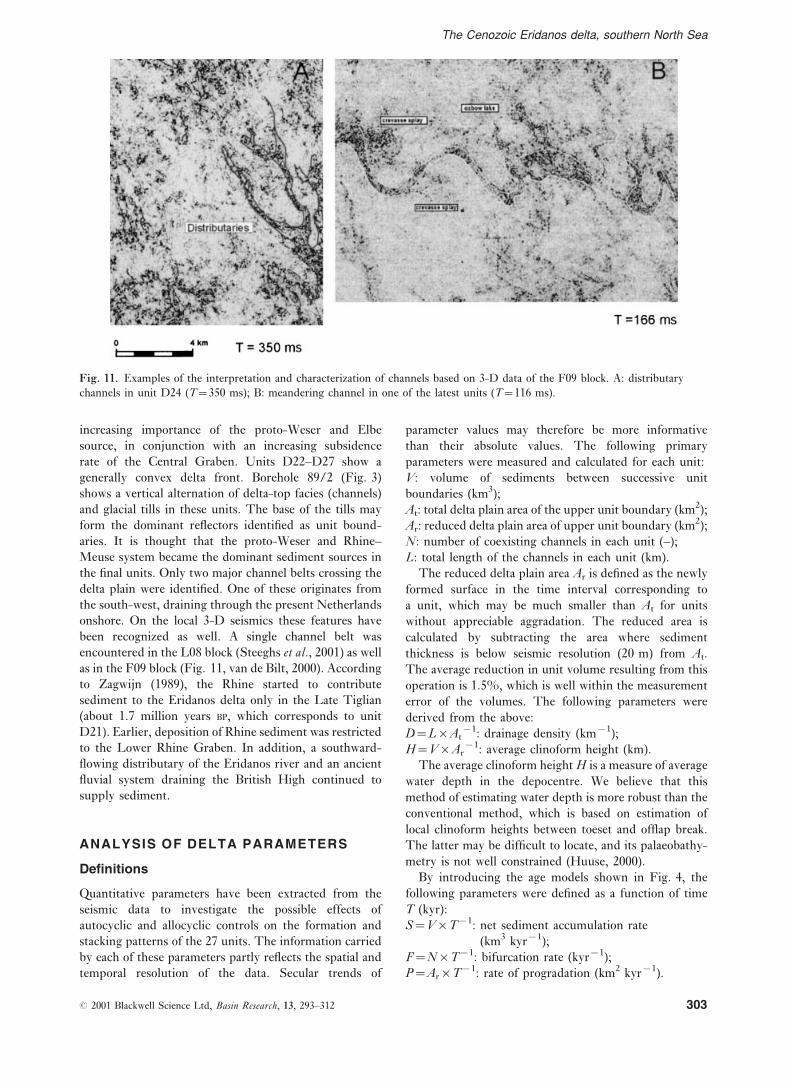
Fig. 11. Examples of the interpretation and characterization of channels based on 3-D data of the F09 block. A: distributary
channels in unit D24 (T=350 ms); B: meandering channel in one of the latest units (T=116 ms).
The Cenozoic Eridanos delta, southern North Sea
# 2001 Blackwell Science Ltd, Basin Research, 13, 293±312 303
The bifurcation rate F is a crude measure of the rate at
which delta distributaries have formed in the time interval
corresponding to a unit. Unfortunately, our data do
not allow an assessment of the extent of inheritance of
delta distributaries from previous units. The rate of pro-
gradation P represents the average rate of growth of
delta surface area within each unit. This differs from the
term progradation as used in the conventional sequence-
stratigraphic context, which is cast in terms of distance
perpendicular to the shoreline. Moreover, the resolution
of our data does not allow us to study intra-unit
architecture, so we cannot distinguish aggradation from
progradation. The time-averaged rate of progradation
of a unit, represented by P, thus underestimates the
`true' rate of progradation in cases where progradation
alternated with aggradation.
Volumes, areas and growth rates
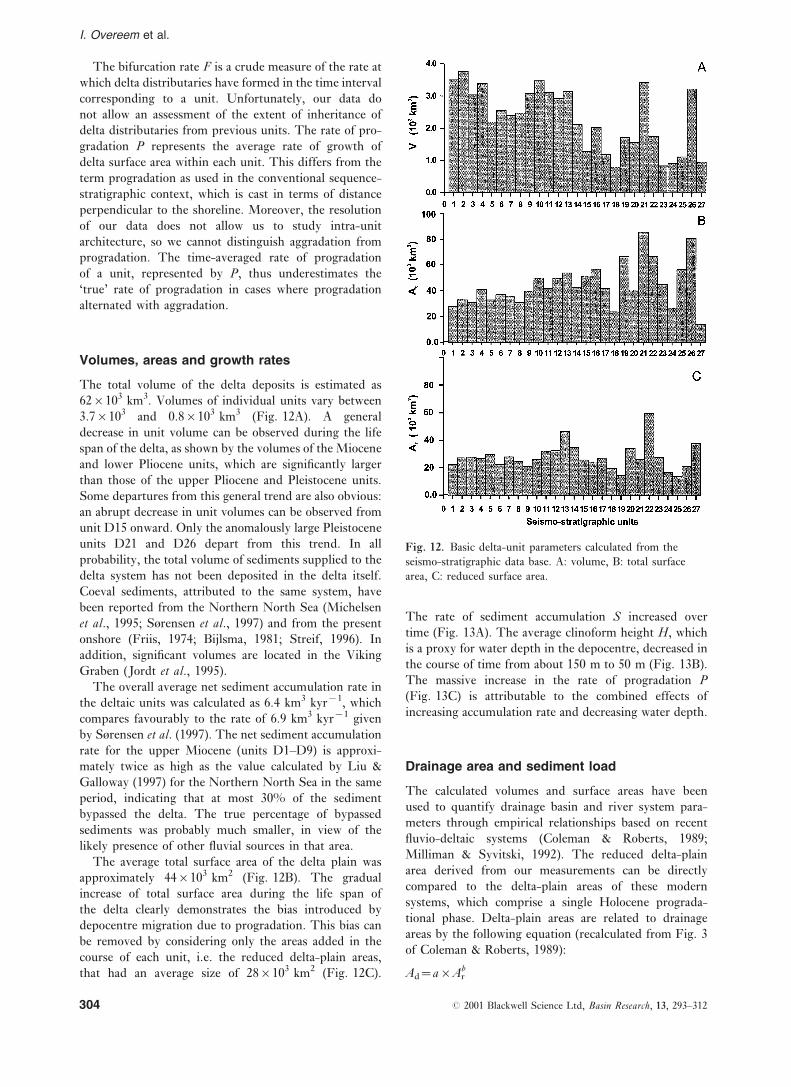
The total volume of the delta deposits is estimated as
62r103 km3. Volumes of individual units vary between
3.7r103 and 0.8r103 km3 (Fig. 12A). A general
decrease in unit volume can be observed during the life
span of the delta, as shown by the volumes of the Miocene
and lower Pliocene units, which are signi®cantly larger
than those of the upper Pliocene and Pleistocene units.
Some departures from this general trend are also obvious:
an abrupt decrease in unit volumes can be observed from
unit D15 onward. Only the anomalously large Pleistocene
units D21 and D26 depart from this trend. In all
probability, the total volume of sediments supplied to the
delta system has not been deposited in the delta itself.
Coeval sediments, attributed to the same system, have
been reported from the Northern North Sea (Michelsen
et al., 1995; Sùrensen et al., 1997) and from the present
onshore (Friis, 1974; Bijlsma, 1981; Streif, 1996). In
addition, signi®cant volumes are located in the Viking
Graben (Jordt et al., 1995).
The overall average net sediment accumulation rate in
the deltaic units was calculated as 6.4 km3 kyrx1, which
compares favourably to the rate of 6.9 km3 kyrx1 given
by Sùrensen et al. (1997). The net sediment accumulation
rate for the upper Miocene (units D1±D9) is approxi-
mately twice as high as the value calculated by Liu &
Galloway (1997) for the Northern North Sea in the same
period, indicating that at most 30% of the sediment
bypassed the delta. The true percentage of bypassed
sediments was probably much smaller, in view of the
likely presence of other ¯uvial sources in that area.
The average total surface area of the delta plain was
approximately 44r103 km2 (Fig. 12B). The gradual
increase of total surface area during the life span of
the delta clearly demonstrates the bias introduced by
depocentre migration due to progradation. This bias can
be removed by considering only the areas added in the
course of each unit, i.e. the reduced delta-plain areas,
that had an average size of 28r103 km2 (Fig. 12C).
The rate of sediment accumulation S increased over
time (Fig. 13A). The average clinoform height H, which
is a proxy for water depth in the depocentre, decreased in
the course of time from about 150 m to 50 m (Fig. 13B).
The massive increase in the rate of progradation P(Fig. 13C) is attributable to the combined effects of
increasing accumulation rate and decreasing water depth.
Drainage area and sediment load
The calculated volumes and surface areas have been
used to quantify drainage basin and river system para-
meters through empirical relationships based on recent
¯uvio-deltaic systems (Coleman & Roberts, 1989;
Milliman & Syvitski, 1992). The reduced delta-plain
area derived from our measurements can be directly
compared to the delta-plain areas of these modern
systems, which comprise a single Holocene prograda-
tional phase. Delta-plain areas are related to drainage
areas by the following equation (recalculated from Fig. 3
of Coleman & Roberts, 1989):
Ad=arArb
Fig. 12. Basic delta-unit parameters calculated from the
seismo-stratigraphic data base. A: volume, B: total surface
area, C: reduced surface area.
I. Overeem et al.
304 # 2001 Blackwell Science Ltd, Basin Research, 13, 293±312

where Ar is the delta area in km2, Ad is the drainage
area in km2, a=1.15r103 and b=0.669. The average
drainage area resulting from this calculation is
1.1r106 km2, comparable in size to the Niger, Ganges
and Volga drainage basins (Coleman & Roberts, 1989).
For comparison, the drainage basin of the Rhine is only
0.18r106 km2, almost an order of magnitude smaller
(Middelkoop, 1998).
The drainage area has been related to the sediment load
by the following equation (Milliman & Syvitski, 1992):
Qs=crAdd
where Qs is the sediment load in 106 t yrx1. The values of
c and d vary with the maximum topographic elevation
in the drainage basin. In basins with a maximum topo-
graphic elevation of less than 1000 m, c=12 and d=0.42.
In basins with a maximum topographic elevation in excess
of 1000 m, c=50 and d=0.73. As the actual maximum
topographic elevation in the Eridanos drainage basin is
unknown, we calculated the predicted sediment load for
both scenarios (Fig. 14). According to the ®rst scenario,
the predicted sediment load ranges from 7r106 t yrx1
to 22r106 t yrx1, comparable to that of the Volga
(19r106 t yrx1). These estimations closely match the
sediment accumulation rates calculated from the unit
volumes. According to the second scenario, which is not
unlikely given the total uplift and present-day relief
of Fennoscandinavia, predicted sediment loads range
from 25r106 t yrx1 to 145r106 t yrx1, comparable to
those of the Niger (40r106 t yrx1) and Orinoco
(79r106 t yrx1). The latter estimates are clearly too
high. The anomalously large volumes of the Pleistocene
units D21 and D26 are probably attributable to a large
in¯ux of glacially derived material.
EXTERNAL CONTROLS ONDELTA EVOLUTION
Rank-correlation tests
We have assessed the in¯uence of external controls on
delta evolution by correlation of delta parameters with
various curves compiled from the literature (Figs 16±18
and Table 1). Relations between delta parameters have
been quanti®ed with Spearman's rank correlation coef®-
cient, which is a distribution-free and robust version of
Pearson's linear product-moment correlation coef®cient
(Davis, 1986; Press et al., 1992). The procedure consists
of replacing the absolute values of the parameters of
interest by their relative values or ranks. The ranks are
uniformly distributed, so that the presence of a monotone
relation between two sets of ranks can be statistically
evaluated through calculation of Pearson's linear correla-
tion coef®cient. Correlations exceeding the critical limit
for Student's t at a 95% con®dence level are considered
statistically signi®cant. The results for the most relevant
delta parameters and external factors are shown in
Table 1.
Tectonics
Uplift of the Fennoscandian Shield
Variations in sediment accumulation rates (Fig. 15A)
have been compared with a curve of relative uplift rates
compiled from various sources (Jensen & Schmidt, 1992;
Rohrman et al., 1995, 1996; Hansen, 1996; Stuevold &
Eldholm, 1996). As yet, few reliable data are available to
constrain the uplift rate of Fennoscandinavia (Japsen &
Chalmers, 2000). We have been careful not to include
estimates of uplift rates based on offshore sediment
volumes in our compilation (Fig. 15B), as this would lead
to circular reasoning. Figure 15A,B show that net
sediment accumulation rates approximately follow the
uplift pattern of Fennoscandinavia over the late Cenozoic,
apart from the anomalously high rates corresponding to
Pleistocene units D21 and D26 (1.8 and 1.0 Ma). It seems
likely that the high rate of uplift of the Fennoscandian
shield ensured a high rate of sediment supply to the
Eridanos delta, similar to the situation at the Norwegian
margin (Evans et al., 2000). Because tectonic uplift is the
ultimate driving force of erosion, these results are not
surprising. However, Clausen et al. (1999) could not
Fig. 13. Derived delta-unit parameters. A: sediment
accumulation rate; B: average clinoform height, representing
water depth in depocentre, C: rate of progradation.
The Cenozoic Eridanos delta, southern North Sea
# 2001 Blackwell Science Ltd, Basin Research, 13, 293±312 305

demonstrate a direct impact of uplift on sedimentation
rate from the Miocene onwards.
Subsidence of the Southern North Sea Basin
Correlation of our seismo-stratigraphic data with sub-
sidence records turned out to be problematic for two
reasons. The ®rst is that subsidence records with
suf®ciently detailed time control are not available.
According to various authors, the average Miocene
subsidence rate of 5 m Myrx1 increased dramatically to
about 100 m Myrx1 during the Pliocene (Kooi et al.,1989, 1991; Joy, 1992). The available data on subsidence
rates in the study area do not allow the onset of this
acceleration to be clearly recognized (Fig. 15D). If
subsidence would have been the dominant control on
accommodation, one expects the increase of subsidence
rate at the Mio-Pliocene transition to be re¯ected in H(Fig. 15C), which essentially captures the variation of
water depth in the depocentre. The overall shallowing
trend indicates that supply exceeded accommodation.
However, there is a clear indication of deepening between
6.5 and 4.5 Ma. The second problem is that subsidence
in the North Sea Basin was not spatially uniform (Jordt
et al., 1995). High rates of subsidence in the basin centre
tended to coincide with low rates of subsidence or even
uplift along the basin margins (Cloetingh et al., 1992).
The phase of deepening in the depocentre (Fig. 15C) also
coincides with the peak in uplift of Fennoscandinavia
(Fig. 15B), testifying to the existence of this spatial
pattern of vertical movements. The comparison of our
data with the published tectonic curves thus supports
the idea that long-term average rates of supply and
accommodation are controlled by tectonics.
Sea level and climate
Introduction
The overall trend in Neogene climate is one of
deterioration, attributable to the feedback between
global tectonics, circulation patterns and growth of ice
sheets, modulated by changes in the Earth's orbital
parameters. The global climate deterioration culminated
Fig. 14. Sediment load (Qs)
calculations based on inferred drainage
area for two topographic scenarios
compared to sediment-load estimates
from unit volumes. Present-day
sediment loads for rivers with drainage
areas of comparable dimensions are
also indicated.
Table 1. Rank-correlation tests of delta parameters and external controls (using AM-1). Signi®cant correlations
(95% con®dence level) are indicated by bold type.
External controls (AM-1)
Sea level
(Haq, 1991)
Climate
(pollen)
Climate
(d18O)
D Channel network density 0.01 0.28 0.02
H Palaeo water depth 0.36 0.55 x0.70
P Rate of progradation 0.02 x0.54 0.75
S Sediment accumulation rate 0.19 x0.30 0.65
F Rate of bifurcation x0.31 x0.67 0.86
I. Overeem et al.
306 # 2001 Blackwell Science Ltd, Basin Research, 13, 293±312

in the formation of extensive northern hemisphere ice
sheets from about 5 Ma onwards (Jansen et al., 1990;
Zubakov & Borzenkova, 1990; Eyles, 1993). The onset of
southern hemisphere glaciations was much earlier (Miller
et al., 1987), implying that global sea level has been
in¯uenced by glacio-eustasy throughout the Neogene. A
correlation between global sea level and climate proxies
such as oxygen-isotope records is thus to be expected, and
has indeed been reported (Eyles, 1993). Nevertheless,
unravelling of eustatic and climatic signatures in Neogene
basin ®lls may be possible if useful measures of
accommodation and supply can be extracted from the
seismo-stratigraphic data. Below we will compare two
accommodation proxies, i.e. the rate of progradation (P)
and palaeo water depth (H ) to global sea level.
Furthermore, we will compare the rate of sediment
accumulation (S) and the parameters of the delta-channel
network, which are closely related to sediment supply, to
climate proxies.
Eustatic sea-level change
The in¯uence of eustatic sea-level changes on unit
architecture was investigated by comparing our accom-
modation proxies P and H to the global sea-level curve
published by Haq (1991), as shown in Fig. 16. In spite
of the low correlation coef®cients between sea level
and delta parameters (Table 1), some remarkable simi-
larities between our data and the sea-level signal deserve
to be mentioned. The rate of progradation (Fig. 16A)
shows two distinct peaks at 1.7 and 1.0 Ma, which corre-
spond well with high-amplitude Pleistocene sea-level
falls (Fig. 16C). These same peaks are also visible in
Fig. 13(A) as intervals with anomalously high rates of
sediment accumulation. The long-term sea-level high-
stand between 6 and 3 Ma is clearly visible as a distinct
`bulge' on the water-depth curve, superimposed on the
overall gradual shallowing over time (Fig. 16B). The
plausibility of a tectonic control on this deepening phase,
which seems to have coincided with increased uplift
and sediment supply, suggests that the long-term eustatic
highstand also represents a tectonic signal. Other
signi®cant in¯uence of relative sea-level variations is
provided by the Pliocene phases of widespread mass
movement (units D12 and D14), which correlate well
with the two high-amplitude sea-level falls at 4.0 and
3.0 Ma (indicated by arrows on the water-depth curve).
Clausen et al. (1999) concluded that relative sea-level
variations correlate well with the ratio of sediment supply
over accommodation in the eastern part of the North Sea
Basin. Our data do not allow such assessments to be made,
because time control and seismic resolution are insuf®-
cient to couple intrasequence architecture to variations in
the rate of sea-level change.
Climate change
In addition to S, the rate of sediment accumulation,
several parameters of the delta-channel network have
been compared to climate proxies in order to detect a
possible climate control on the sedimentation pattern in
the Eridanos delta. The basic delta-channel parameters
are shown in Fig. 17(A,B). The channel network density
D is shown in Fig. 17(C). A general increase of channel
network density can be observed, starting from single
thread channels in the early units and culminating in unit
Fig. 15. Tectonic control on sediment supply and accommodation. A: sediment accumulation rate. B: estimated rate of uplift of
the Fennoscandian shield (based on various sources, see text for discussion). C: water depth in depocentre. D: estimated total
subsidence in the Southern North Sea Basin (after Kooi et al., 1989, 1991).
The Cenozoic Eridanos delta, southern North Sea
# 2001 Blackwell Science Ltd, Basin Research, 13, 293±312 307

D10. Destruction of the delta-channel network during
the period of widespread delta-slope erosion and mass
movements is evident (D12±D14). Re-establishment of
the channel network is recorded by an initial phase
of drainage in a few active channel belts, followed by a
second density peak in the ®nal phases of delta evolution.
Figure 18 shows the rate of sediment accumula-
tion (Fig. 18A) and the bifurcation rate, a derived
delta-channel parameter (Fig. 18B). The climate proxies
consist of a North Atlantic d18O record (Shackleton &
Opdyke, 1977; Shackleton, 1987; Jansen et al., 1988;
Jansen et al., 1990) shown in Fig. 18(C) and a NW
European pollen record (Zagwijn & Doppert, 1987;
Zagwijn & Hager, 1987; Zagwijn, 1989) shown in
Fig. 18(D).
Variations in oxygen isotope composition have been
employed to estimate Neogene temperature changes
(Miller et al., 1987). The palynological data from the
NW European Mio-Pliocene indicate a warm moist
climate with generally low proportions of nonarboreal
pollen (herbs) and varying proportions of evergreens,
deciduous trees and conifers. The proportion of (sub-
tropical) evergreen vegetation, which is regarded as
proportional to palaeotemperature records a stepwise
cooling culminating in the glacial±interglacial ¯uctua-
tions of the late Pleistocene. There is little evidence for
major variations in precipitation during the late Neogene
(Schwarzbach, 1974), which is corroborated by the
widespread occurrence of lignite and the absence of
evaporites in this period. The terrestrial palaeotempera-
tures estimated from pollen assemblages are consistent
with evidence from marine ostracod assemblages (Wood
et al., 1993). Not surprisingly, a highly signi®cant
Fig. 16. Accommodation control on basin-®ll architecture. A: rate of progradation. B: water depth in depocentre.
C: global sea level (Haq, 1991).
Fig. 17. Delta-channel network characteristics of the units.
A: number of coexisting tributaries. B: total channel length.
C: drainage density.
I. Overeem et al.
308 # 2001 Blackwell Science Ltd, Basin Research, 13, 293±312

negative correlation exists between the two climate
records shown in Fig. 18(C,D).
Table 1 shows that signi®cant correlations exist
between the climate records on the one hand, and rates
of sediment accumulation and bifurcation on the other
hand. The same analyses carried out with the alternat-
ive age model (AM-2) provide equally signi®cant cor-
relations. These relations indicate that rates of supply
and bifurcation were relatively low under subtropical and
warm temperate conditions, and relatively high during
cool periods and glacials. This seems logical, as high
sedimentation rates are typical of (cold) arid climate zones
with sparse vegetation (Kirkby, 1994). For instance, the
extremely high sedimentation rate at 1.8 Ma coincides
with the onset of glaciation of the Fennoscandian shield.
The bulldozer mechanism of the glaciers added large
amounts of sediment to the ¯uvial system (cf. Bloom,
1991; Leeder et al., 1998). The increasing bifurcation rate
over time may also be explained in terms of an increase in
the rate of sediment supply combined with the loss of
vegetation cover, because such conditions would have
favoured the development of extensive ¯uvial braid belts
and the repeated switching of delta distributaries.
DISCUSSION AND CONCLUSIONS
This seismo-stratigraphic study has documented the
evolution of the Eridanos delta in the Southern North Sea
Basin on the basis of careful integration of seismics,
logs, cores and stratigraphic age data. Analysis of the
delta-channel network resulted in estimates of channel
bifurcation rate (F ). From volumetrics and surface areas
we obtained the rate of sediment accumulation (S),
the 2-D time-averaged rate of progradation (P) and the
time- and space-averaged palaeobathymetry (H ). The
latter was helpful in identifying tectonically controlled
variations in the rate of subsidence, which seem to coin-
cide with a peak in the rate of uplift of Fennoscandinavia
and long-term eustatic highstand.
Although long-term average rates of supply and
accommodation are clearly controlled by tectonics,
there is still a lot of debate about the dominant controls
on the short-term ¯uctuations. Assessing the effects of
eustatic variations was not feasible in the absence of
suf®cient information to constrain intrasequence archi-
tecture. The most important result of our study is the
inferred climate control on rates of sediment supply and
bifurcation of the delta-channel network. Rates of supply
and bifurcation were relatively low under subtropical and
warm temperate conditions, and relatively high during
cool periods and glacials. The combination of increasing
sediment supply and decreasing vegetation density under
conditions of climate deterioration would have favoured
the development of extensive ¯uvial braid belts and the
repeated switching of delta distributaries.
This straightforward response of the system to climate
change is surprising, but not unlikely. Non-deterministic
and non-linear responses of hill slopes and drainage basins
(Bull, 1991; Weltje et al., 1998; Blum & ToÈrnqvist, 2000)
may cancel out on the large spatial and temporal scales
associated with the Eridanos system. Our study shows
that the seismic architecture of large delta systems can
provide valuable information about basinwide controls
on accommodation and supply. However, accurate
datings of North Sea Neogene sediments are needed to
reconstruct the response of this major delta to internal
Fig. 18. Climate control on delta evolution. A: sediment accumulation rate. B: bifurcation rate. C: oxygen isotope record
(Shackleton & Opdyke, 1977; Shackleton, 1987; Jansen et al., 1988, 1990). D: NW European pollen record
(Zagwijn & Doppert, 1987; Zagwijn & Hager, 1987; Zagwijn, 1989).
The Cenozoic Eridanos delta, southern North Sea
# 2001 Blackwell Science Ltd, Basin Research, 13, 293±312 309

and external controls in more detail, and to test the
hypotheses presented above.
ACKNOWLEDGMENTS
This study is a contribution to component 6B of the
NEESDI project (Netherlands Environmental Earth
System Dynamics Initiative). The 3D seismic data
sets and well logs were made available by TNO-NITG
(National Geological Survey of the Netherlands).
Discussions with C. Mesdag, R. J. van Leeuwen and
R. Giessen (TNO-NITG) signi®cantly improved some of
the ideas presented in this paper. Their commitment to
this research is gratefully acknowledged. P. Steeghs,
S. Tigrek (DUT) and B. van de Bilt (VUA) are thanked
for their help with the 3-D seismic data interpretation.
The present paper is a continuation of previous PhD work
of C.B.K. at Edinburgh University under the supervision
of Professor Boulton, Dr Cameron and Dr Fannin. The
British Geological Survey and NOPEC are thanked for
supplying data and for their help in interpretation. We
thank J. Storms, C. van der Zwan and BR reviewers
J. Cartwright and M. Huuse for helpful comments on
an earlier version of the manuscript.
REFERENCES
BERGGREN, W.A., HILGEN, F.J., LANGEREIS, C.G., KENT, D.V.,
OBRADOVICH, J.D., RAFFI, I., RAYMO, M.E. & SHACKLETON,
N.J. (1995) Late Neogene chronology: new perspectives
in high-resolution stratigraphy. Geol. Soc. Am. Bull., 107,
1272±1287.
BERTELSEN, F. (1972) Azolla species from the Pleistocene of the
Central North Sea area. Grana, 12, 131±145.
BIJLSMA, S. (1981) Fluvial sedimentation from the Fenno-
scandian area into the north-west European basin during
the late Cenozoic. Geol. Mijnb., 60, 337±345.
BISHOP-KAY, C.J. (1993) The growth and gross morphology of
Quaternary deltas in the southern North Sea. Unpublished
PhD Thesis, University of Edinburgh.
BLOOM, A.L. (1991) Geomorphology: Systematic Analysis of Late
Cenozoic Landforms, 2nd edn. Prentice Hall, Englewood
Cliffs, NJ.
BLUM, M.D. & TOÈ RNQVIST, T.E. (2000) Fluvial responses to
climate and sea-level change; a review and look forward.
Sedimentology, 47 (Suppl. 1), 2±48.
BREINER, M. (1999) A sequence stratigraphic study of the Dutch
offshore sector blocks E,F, G, K,L and M of Neogene and
younger sequences ± interpretation, mapping and plotting.
Unpublished MSc Thesis, University of AÊ rhus, Department
of Marine Geology.
BULL., W.B. (1991) Geomorphic Responses to Climatic Change.
Oxford University Press, New York.
CAMERON, T.D.J. (1993) Late Cenozoic evolution of the
Southern North Sea Basin. Terra Nova, 5, Abstract
Suppl., No 1.
CAMERON, T.D.J., BULAT, J. & MESDAG, C.S. (1993) A high
resolution seismic pro®le through a Cenozoic delta
complex in the Southern North Sea. Mar. Petrol. Geol.,
10, 591±599.
CARTWRIGHT, J.A. (1995) Seismic-stratigraphical analysis of
large-scale ridge-though sedimentary structures in the
Late Miocene to early Pliocene of the central North Sea.
In: Sedimentary Facies Analysis; a Tribute to the Research &
Teaching of Harold, G. Reading (Ed. by G.A. Plint),
Spec. Publ. Int. Ass. Sedimentol., 22, 285±303.
CASTON, V.N.D. (1977) Quaternary deposits of the Central
North Sea, 1: a new isopach map of the Quaternary of the
North Sea. Report Inst. Geol. Sci., N0 77/11.
CLAUSEN, O.R., GREGERSEN, U., MICHELSEN, O. & SéRENSEN, J.C.
(1999) Factors controlling the Cenozoic sequence devel-
opment in the eastern parts of the North Sea. J. Geol. Soc.
London, 156, 809±816.
CLOETINGH, S., REEMST, P., KOOI, H. & FANAVOLL, S. (1992)
Intraplate stresses and the post-Cretaceous uplift and
subsidence in northern Atlantic basins. Norsk Geol.
Tidsskrift, 72, 229±235.
COLEMAN, J.M. & ROBERTS, H.H. (1989) Deltaic coastal
wetlands. Geol. Mijnb., 68, 1±24.
DAVIS, J.C. (1986). Statistics and Data Analysis in Geology,
2nd edn. John Wiley & Sons, Inc.
EMERY, D. & MYERS, K., Eds (1996) Sequence Stratigraphy.
Blackwell Science Ltd, Oxford.
EVANS, D., MCGIVERON, S., MCNEILL, A.E., HARRISON, Z.H.,
éSTMO, S.R. & WILD, J.B.L. (2000) Plio-Pleistocene deposits
on the mid-Norwegian margin and their implications for
Late Cenozoic uplift of the Norwegian mainland. Global
Planetary Change, 24, 233±237.
EYLES, N. (1993) Earth's glacial record and its tectonic setting.
Earth-Sci. Rev., 35, 1±248.
FRIIS, H. (1974) Weathered heavy mineral associations from
the young Tertiary deposits of Jutland, Denmark. Sediment.
Geol., 12, 199±213.
FUNNELL, B.M. (1996) Plio-Pleistocene paleogeography of the
Southern North Sea basin (3.75±0.60 Ma). Quat. Sci. Rev.,
15, 391±405.
GALLOWAY, W.E. (1989) Genetic stratigraphic sequences in
basin analysis I: architecture and genesis of ¯ooding-
surface bounded depositional units. AAPG Bull., 73,
143±154.
GHAZI, S.A. (1992) Cenozoic uplift in the Stord Basin area and
its consequences for exploration. Norsk Geol. Tidsskrift, 72,
285±290.
GIBBARD, P.L. (1988) The history of the great northwest
European rivers during the past three million years. Phil.
Trans. R. Soc. London B, 318, 559±602.
GLENNIE, K.W. (1990) Introduction to the Petroleum Geology of
the North Sea, 3rd edn. Blackwell Science, Oxford.
GRADSTEIN, F.M., KRISTIANSEN, I.L., LOEMO, L. & KAMINSKI, M.
(1992) Cenozoic foraminiferal and dino¯agellate cyst bio-
graphy of the Central North Sea. Micropaleontology, 38,
101±137.
HANSEN, S. (1996) Quanti®cation of net uplift and erosion on
the Norwegian Shelf south of 66ù N from sonic transit
times of shale. Norsk Geol. Tidsskrift, 76, 245±252.
HAQ, B.U. (1991) Sequence stratigraphy, sea-level change,
and signi®cance for the deep sea. In: Sedimentation, Tectonics
and Eustasy; Sea-Level Changes at Active Margins (Ed. by
D.I.M. Macdonald), Spec. Publ. Int. Ass. Sedimentol., 12.
HARLAND, W.B., ARMSTRONG, R.A., COX, A.V., CRAIG,
L.E., SMITH, A.G. & SMITH, D.G. (1990). A Geological Time
Scale 1989. Cambridge University Press, Cambridge, UK.
I. Overeem et al.
310 # 2001 Blackwell Science Ltd, Basin Research, 13, 293±312

HOVIUS, N. & LEEDER, M. (1998) Clastic sediment supply to
basins. Basin Res., 10, 1±5.
HUUSE, M. (2000) Late Cenozoic paleogeography of the eastern
North Sea Basin: climatic vs tectonic forcing of basin margin
uplift and deltaic progradation. Bull. Geol. Soc. Denmark, 47.
JANSEN, E., BLEIL, U., HENRICH, R., KRINGSTAD, L. &
SLETTEMARK, B. (1988) Paleoenvironmental changes in the
Norwegian Sea and the Northeast Atlantic during the last
2.8 m.y., Deep Sea Drilling Project/ODP sites 610, 642,
643 and 644. Paleocenanography, 3, 563±581.
JANSEN, E., SJOHOLM, J., BLEIL, U. & ERICHSEN, J.A. (1990)
Neogene and Pleistocene glaciations in the Northern
Hemisphere and late Miocene-Pliocene global ice Volume
¯uctuations; evidence from the Norwegian Sea. In:
Geological History of the Polar Oceans; Arctic Versus Antarctic
(Ed. by U. Bleil & J. Thiede). Kluwer, Dordrecht.
JAPSEN, P. & CHALMERS, J.A. (2000) Neogene uplift and tectonics
around the North Atlantic: overview. Global Planetary
Change, 24, 165±173.
JENSEN, L.N. & SCHMIDT, B.J. (1992) Late Tertiary uplift and
erosion in the Skagerak area; magnitude and consequences.
Norsk Geol. Tidsskrift, 72, 275±279.
JERVEY, M.T. (1988) Quantitative geological modelling of
siliclastic rock sequences and their seismic expression. In:
Sea Level Changes ± an Integrated Approach (Ed. by
C.K. Wilgus, H. Posamentier, C.A. Roos & C. Kendall),
SEPM Spec. Publ., 42.
JORDT, H., FALEIDE, J.I., BJéRLYKKE, K. & IBRAHIM, M.T.
(1995) Cenozoic sequence stratigraphy of the central and
northern North Sea Basin: tectonic development, sediment
distribution and povenance areas. Mar. Petrol. Geol., 12,
845±879.
JOY, A.M. (1992) Right place, wrong time: anamalous post-rift
subsidence in sedimentary basins around the North Atlantic
Ocean. In: Magmatism and the Causes of Continental Break-up
(Ed. by B.C. Storey, T. Alabaster & R.J. Pankhurst),
Geol. Soc. Spec. Publ., 68, 387±393.
KIRKBY, M.J. (1994) Process Models and Theoretical
Geomorphology. John Wiley, New York.
KNUDSEN, K.L. (1985) Foraminiferal stratigraphy of Quaternary
deposits in the Roar, Skjold and Dan ®elds, central North
Sea. Boreas, 14, 311±324.
KNUDSEN, K.L. & ASBJéRNDOTTIR, L. (1991) Plio-Pleistocene
foraminiferal stratigraphy and correlation in the Central
North Sea. Mar. Geol., 101, 113±124.
KONRADI, P.B. (1995) Foraminiferal biostratigraphy of the
post mid-Miocene in two boreholes in the Danish North
Sea. In: Proceedings of the 2nd Symposium on Marine
Geology, Geology of the North Sea and Skagerak (Ed. by
O. Michelsen). Aarhus Universitet.
KONRADI, P.B. (1996) Foraminiferal biostratigraphy of the
post-mid Miocene in the Danish Central Trough,
North Sea. In: Geology of Siliciclastic Shelf Seas (Ed. by
M. De Batist & P. Jacobs), Geol. Soc. Spec. Publ., 117,
000±000.
KOOI, H., CLOETINGH, S. & REMMELTS, G. (1989) Intraplate
stresses and the stratigraphic evolution of the North Sea
Central Graben. Geol. Mijnb., 68, 49±72.
KOOI, H., HETTEMA, M. & CLOETINGH, S. (1991) Lithosperic
dynamics and the rapid Pliocene-Quaternary subsidence
phase in the southern North Sea Basin. Tectonophysics, 192,
245±259.
KOSMOWSKA-CZERANOWICZ, B. (1988) Geheimnisse und
Schonheit des Bernsteins. In: Ganzelewski, M. and
Slotta, R. (1996) Bernstein; Traner der Gotter. Katalog der
Ausstellung Des Deutschen Bergbau- Museums, Bochum.
LEEDER, M.R., HARRIS, T. & KIRKBY, M.J. (1998) Sediment
supply and climate change: implications for basin
stratigraphy. Basin Res., 10, 7±18.
LIDMAR-BERGSTROÈ M, K. (1996) Long term morphotectonic
evolution in Sweden. Geomorphology, 16, 33±59.
LIDMAR-BERGSTROÈ M, K., OLLIER, C.D. & SULEBAK, J.R. (2000)
Landforms and uplift history of Southern Norway. Global
Planetary Change, 24, 211±231.
LIU, X. & GALLOWAY, W.E. (1997) Quantitative determination
of Tertiary sediment supply to the North Sea Basin. AAPG
Bull., 81, 1482±1509.
MIALL, A.D. (1997). The Geology of Stratigraphic Sequences.
Springer-Verlag, Berlin.
MICHELSEN, O., DANIELSEN, M., HEILMANN-CLAUSEN, C.,
JORDT, H., LAURSEN, G. & THOMSEN, E. (1995) Occurrence
of major sequence boundaries in relation to basin devel-
opment in Cenozoic deposits of the southeastern North Sea.
In: Sequence Stratigraphy; Advances and Applications for
Exploration and Production in North West Europe (Ed. by
R.J. Stell, W.L. Felt, E.P. Johannessen & C. Mathieu),
pp. 415±427. Norwegian Petroleum Society/Elsevier,
Amsterdam.
MICHELSEN, O., THOMSEN, E., DANIELSEN, M., HEILMAN-
CLAUSEN, C., JORDT, H. & LAURSEN, G.V. (1998) Cenozoic
stratigraphy in the Eastern North Sea. In: Mesozoic and
Cenozoic Sequence Stratigraphy of European Basins, Society
for Sedimentary Geology, SEPM Spec. Publ., 60, 91±118.
MIDDELKOOP, H. (Ed.) (1998) Twee Rivieren: Rijn En Maas in
Nederland. RIZA rapportno 98.041. RIZA, Arnhem.
MILLER, K.G., FAIRBANKS, R.G. & MOUNTAIN, G.S. (1987)
Tertiary oxygen isotope synthesis, sea level history and
continental margin erosion. Paleoceanography, 2, 1±19.
MILLIMAN, J.D. & SYVITSKI, P.M. (1992) Geomorphic/Tectonic
control of sediment discharge to the ocean; the importance of
small mountaineous rivers. J. Geol., 100, 525±544.
MITCHUM, R.M. & VAN WAGONER, J.C. (1991) High frequency
sequences and their stacking patterns; sequence stratigraphic
evidence of high frequency eustatic changes. Sediment. Geol.,
70, 131±160.
MOLNAR, P. & ENGLAND, P. (1990) Late Cenozoic uplift of
mountain ranges and global climate change; chicken or egg?
Nature, 346, 29±34.
OVEREEM. I., DRIJKONINGEN, G.G., STEEGHS, T.P.H. & VAN DE
BILT, B.D. (2001) Modeling mass movements along
Cenozoic delta lobes, 3D seismic data analysis in the F09
block, North Sea. 63rd Annual Conference of European
Association of Geoscientists & Engineers, Amsterdam, 11±15
June 2001, in press.
PAYTON, C.E. (Ed.) (1977) Seismic Stratigraphy ± Applications
to Hydrocarbon Exploration. AAPG Memoir 26. AAPG,
Tulsa, OK.
POSAMENTIER, H.W., JERVEY, M.T. & VAIL, P.R. (1988a)
Eustatic controls on clastic deposition conceptual frame-
work. In: Sea Level Changes ± an Integrated Approach
(Ed. by C.K. Wilgus, H. Posamentier, C.A. Roos &
C. Kendall), SEPM Spec. Publ., 42.
POSAMENTIER, H.W., JERVEY, M.T. & VAIL, P.R. (1988b) Eustatic
controls on clastic deposition-sequence and system tract
The Cenozoic Eridanos delta, southern North Sea
# 2001 Blackwell Science Ltd, Basin Research, 13, 293±312 311

models. In: Sea Level Changes ± an Integrated Approach (Ed.
by C.K. Wilgus, H. Posamentier, C.A. Roos & C. Kendall),
SEPM Spec. Publ., 42.
PRESS, W.H., TEUKOLSKY, S.A., VETTERLING, W.T. &
FLANNERY, B.P. (1992) Numerical Recipes in C; The Art of
Scienti®c Computing, 2nd edn. Cambridge University Press,
Cambridge.
RIIS, F. (1992) Dating and measuring of erosion, uplift and
subsidence in Norway and the Norwegian shelf in glacial
periods. Norsk Geol. Tidsskrift, 72, 325±331.
RIIS, F. (1996) Quanti®cation of Cenozoic vertical movements
of Scandinavia by correlation of morphological surfaces with
offshore data. Global Planetary Change, 12, 331±357.
ROHRMAN, M., ANDRIESSEN, P. & VAN DER BEEK, P. (1996) The
relationship between basin and margin thermal evolution
assessed by ®ssion track thermochronology; an application to
offshore southern Norway. Basin Res., 8, 45±63.
ROHRMAN, M., VAN DER BEEK, P., ANDRIESSEN, P. &
CLOETINGH, S. (1995) Meso-Cenozoic evolution of southern
Norway; Neogene domal uplift inferred from apatite ®ssion
track thermochronology. Tectonics, 14, 704±718.
SALES, J.K. (1992) Uplift and subsidence of northwestern
Europe; possible causes and in¯uence on hydrocarbon
productivity. Norsk Geol. Tidsskrift, 72, 253±258.
SCHWARZBACH, M. (1974) Das Klima der vorzeit;. Eine EinfuÈhrung
in die PalaÈoklimatologie. Ferdinand Enke-Verlag. Stuttgart.
SHA, L.P., SCHWARTZ, C., MAENHOUT VAN LEMBERGE, V.,
CAMERON, T.D.J., ZáLLMER, V., KONRADI, P., LABAN, C.,
STREIF, H. & SCHUÈ TTENHELM, R.T.E. (1996) Quaternary
Sedimentary Sequences in the Southern North Sea Basin.
Sedimentological Working Group of the Southern North
Sea Project. Commission of the European communities:
directorate general, XII, Science Programme Contract no.
Sci.* -128-C 9 EDB. Dutch Geological Survey, Haarlem,
The Netherlands.
SHACKLETON, N.J. (1987) Oxygen isotopes, ice volume and sea
level. Quat. Sci. Rev., 6, 183±190.
SHACKLETON, N.J. & OPDYKE, N.D. (1977) Oxygen isotope and
palaeomagnetic evidence for early Northern Hemisphere
glaciation. Nature, 270, 216±219.
SéRENSEN, J.C., GREGERSEN, U., BREINER, M. & MICHELSEN, O.
(1997) High frequency sequence stratigraphy of upper
Cenozoic deposits. Mar. Petrol. Geol., 14, 99±123.
STEEGHS, T.P.H., OVEREEM, I. & TIGREK, S. (2001) Seismic
volume attribute analysis of the Cenozoic succession in the
L08 block (Southern North Sea). Global Planetary Change,
in press.
STREIF, H. & (koordinator) (1996) Deutsche BeitraÈge zur
QuartaÈrforschung in der SuÈdlichen Nordsee. Geol. Jbh,
Reihe A, Heft 146.
STUEVOLD, L.M. & ELDHOLM, O. (1996) Cenozoic uplift of
Fennoscandia inferred from a study of the mid-Norwegian
margin. Global Planetary Change, 12, 359±386.
TIGREK, S. (1998) 3D seismic interpretation and attribute analysis
of the L08-block, Southern North Sea Basin. Unpublished
MSc Thesis, Faculty of Applied Earth Sciences, Delft
University of Technology, The Netherlands.
VAN DE BILT, B.D. (2000) The architectural evolution of
Late Cenozoic delta lobes in the F09 block, North Sea.
Unpublished MSc Thesis, Free University, Amsterdam,
The Netherlands.
VAN WAGONER, J.C., POSAMENTIER, H.W., MITCHUM, R.M.,
VAIL, P.R., SARG, J.F., LOUTIT, T.S. & HARDENBOL, J.
(1988) An overview of the fundamentals of sequence strati-
graphy and key de®nitions. In: Sea Level Changes ± an
Integrated Approach (Ed. by C.K. Wilgus, H. Posamentier,
C.A. Roos & C. Kendall), SEPM Spec. Publ., 42, 39±45.
VINKEN, R. (Ed.) (1988) The Northwest European Tertiary
Basin; results of the international geological correlation
programme. Geol. Jbh., Reihe A, Heft 100.
WELTJE, G.J., MEIJER, X. & DE BOER, P.L. (1998) Stratigraphic
inversion of siliciclastic basin ®lls: a note on the distinction
between supply signals resulting from tectonic and climatic
forcing. Basin Res., 10, 129±153.
WOOD, A.M., WHATLEY, R.C., CRONIN, T.M. & HOLTZ, T. (1993)
Pliocene paleotemperature reconstruction for the Southern
NorthSeabasedonOstracoda.Quat.Sci.Reviews,12,747±767.
ZAGWIJN, W.H. (1989) The Netherlands during the Tertiary
and the Quaternary; a case history of coastal lowland
evolution. Geol. Mijnb., 68, 107±120.
ZAGWIJN, W.H. & DOPPERT, J.W.C. (1987) Upper Cenozoic of
the southern North Sea Basin: Paleoclimatic and paleo-
geographic evolution. Geol. Mijnb., 57, 577±588.
ZAGWIJN, W.H. & HAGER, H. (1987) Correlations of continental
and marine Neogene deposits in the south-eastern
Netherlands and the Lower Rhine District. Meded. Werkgr.
Tert, Kwart. Geol., 24, 59±78.
ZANDSTRA, J.G. (1971) Geologisch onderzoek in de stuwwal van
de oostelijke Veluwe bij Hattem en Wapenfeld. Mededelingen
Van Rijks Geologische Dienst., 22, 215±258.
ZIEGLER, P.A. (1990) Geological Atlas of Western and Central
Europe, 2nd edn. Shell internationale Petroleum
maatschappij, BV, Geological Society.
ZUBAKOV, V.A. & BORZENKOVA, I.I. (1990) Global Palaeoclimate
of the Late Cenozoic. Developments in Palaeontology and
Stratigraphy 12. Elsevier. Amsterdam.
Revision accepted 9 April 2001
I. Overeem et al.
312 # 2001 Blackwell Science Ltd, Basin Research, 13, 293±312