the learning analytics blueprint -...
TRANSCRIPT
The Learning Analytics Blueprint
Moving your data strategy from concept to practice
Welcome to the World of Data-Driven Opportunities
From visualizing a student’s level of engagement within a course or program
to pinpointing those students at risk and in need of quick intervention,
learning analytics have the potential to make a huge impact on an
educational institution’s overall learning outcomes. In a recent study, 87% of
college students reported that having access to data analytics
regarding their academic performance would have a positive impact on
their learning experience.1 Predictive analytics can also help K-12
educators improve instruction, optimize resource allocation and predict the
likelihood of college readiness.2
At the same time, educational institutions are facing new unprecedented
pressures. Non-traditional students now make up a large percentage of the
student population. There is increased competition from institutions for
mindshare and funding. And budgets are flat–if not shrinking. Institutional
leaders need to face off against these challenges by leveraging the data at
hand to work smarter, think more innovatively, and to ultimately better
advance student success.
Learning analytics can help boost an educational institution’s accountability,
affordability, productivity, and student success. But the million-dollar
question for most institutions lies in the how? Not the why. While they know
that the data they’ve gathered is a high-value asset, the ability to analyze
and interpret meaning from those numbers is, for most educational
institutions, still an unmet goal.
1Are Learning Analytics the New ‘Likes’? 87% of College Students Perform Better with Access to Personalized Data, New Research Finds. McGraw-Hill Education. McGraw-Hill Education, 28 Oct. 2015. Web.2Rethinam, Vasuki. “Predictive Analytics in K-12: Advantages, Limitations & Implementation.” The Journal. Public Sector Media Group, 06 Dec. 2014. Web.
The importance and significance of senior leadership buy-in and support
around these initiatives can not be overstated. That backing provides a solid
foundation, not only for endorsing the goal that the organization wants to
achieve but also in endorsing all of the downstream activities, enablement,
and change required to enact a strategy to achieve the goal. The leader plays
an extremely important role in evangelizing and supporting all of the
activities that will take place around this initiative.
Furthermore, every institution is on its own unique path of discovery when it
comes to business analytics, meaning a “one-size-fits-all” data management
solution is not the answer. Every institution has its own plans and desires for
how data will be consumed and stored. However, every institution also has an
obligation to diligently manage data privacy and the ethical use of the data
that is collected. Student learning data can provide great learning analytic
insight but must also be used properly with appropriate considerations for
student privacy and anonymity. A clear and concise data strategy should be
created to govern the use of data within each institution.
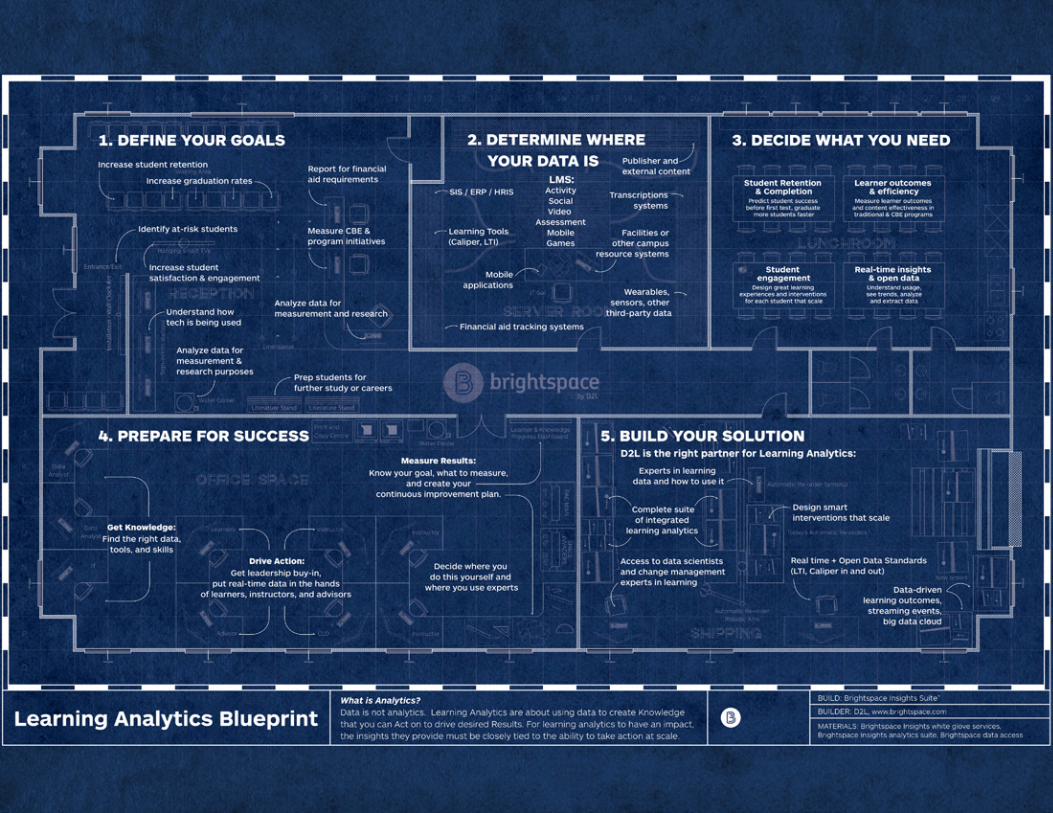
Developed by D2L experts in learning, the Learning Analytics Blueprint is
designed to help educational institutions move their analytics strategy from
concept to practice, and use data to derive Knowledge they can Act on to
drive desired Results. Backed by the industry’s most comprehensive suite
of integrated learning analytics this step-by-step guide answers the pressing
questions institutions have about harnessing the power of analytics for
improved insights and enhanced learning outcomes.
8"ASAE The Center for Association Leadership." The Global Knowledge Economy Continues to Grow in Importance. The Center for Association Leadership, n.d. Web.
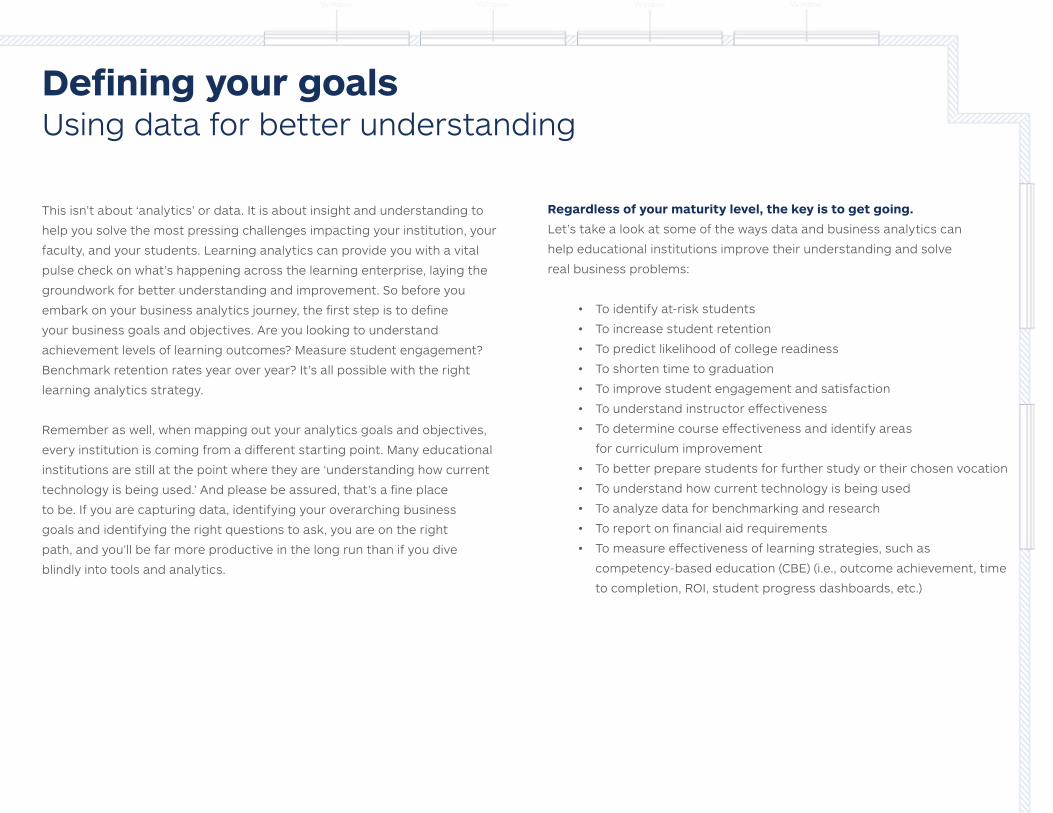
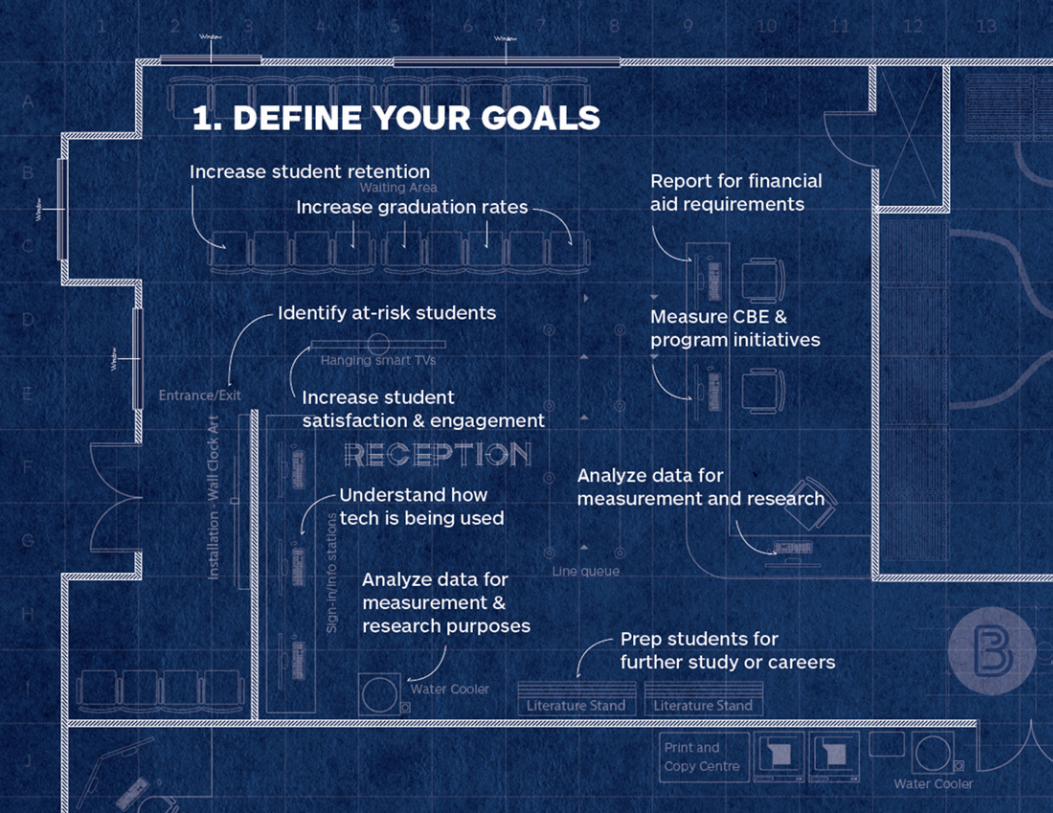
Defining your goals Using data for better understanding
This isn’t about ‘analytics’ or data. It is about insight and understanding to
help you solve the most pressing challenges impacting your institution, your
faculty, and your students. Learning analytics can provide you with a vital
pulse check on what’s happening across the learning enterprise, laying the
groundwork for better understanding and improvement. So before you
embark on your business analytics journey, the first step is to define
your business goals and objectives. Are you looking to understand
achievement levels of learning outcomes? Measure student engagement?
Benchmark retention rates year over year? It’s all possible with the right
learning analytics strategy.
Remember as well, when mapping out your analytics goals and objectives,
every institution is coming from a different starting point. Many educational
institutions are still at the point where they are ‘understanding how current
technology is being used.’ And please be assured, that’s a fine place
to be. If you are capturing data, identifying your overarching business
goals and identifying the right questions to ask, you are on the right
path, and you’ll be far more productive in the long run than if you dive
blindly into tools and analytics.
Regardless of your maturity level, the key is to get going.
Let’s take a look at some of the ways data and business analytics can
help educational institutions improve their understanding and solve
real business problems:
• To identify at-risk students
• To increase student retention
• To predict likelihood of college readiness
• To shorten time to graduation
• To improve student engagement and satisfaction
• To understand instructor effectiveness
• To determine course effectiveness and identify areas
for curriculum improvement
• To better prepare students for further study or their chosen vocation
• To understand how current technology is being used
• To analyze data for benchmarking and research
• To report on financial aid requirements
• To measure effectiveness of learning strategies, such as
competency-based education (CBE) (i.e., outcome achievement, time
to completion, ROI, student progress dashboards, etc.)
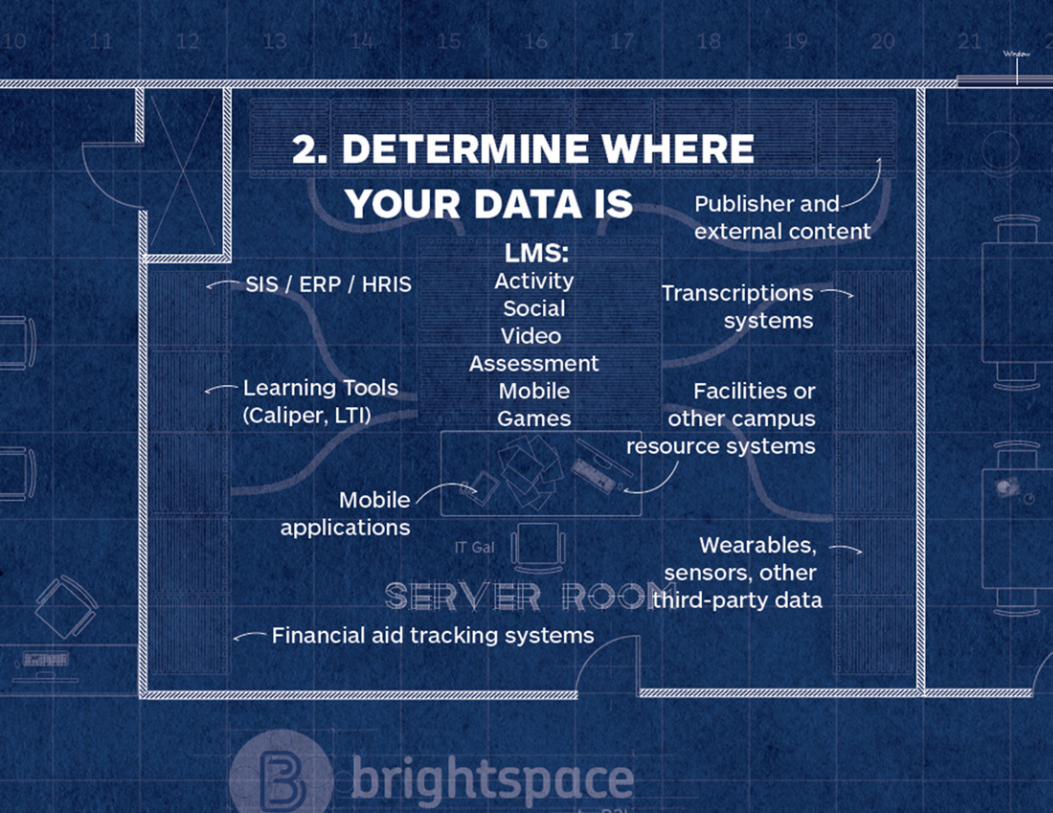
Determining Where your Data is
From the information gathered within the learning management system (LMS),
to admissions data, to student’s social interactions and engagement with
content assets, rich sources of data can be found everywhere on campus.
The real power of learning analytics comes when these pockets of data are
brought together to form a united picture of understanding.
In the past, data was collected and displayed in a variety of formats creating
impenetrable silos of information within the learning enterprise. However, new
standards are emerging to guide educational institutions in consistently
capturing and presenting measures of learning activity. Educational institutions
now have the ability to create a holistic, 360-degree view of what is happening
in the teaching and learning environment. With this understanding, they can
then make improvements in the learning experience.
Uniting many sources of data for better understanding of learning interactions
Using a holistic view of data educators can:3
• Answer those seeking more accountability with measures of learning
activity in addition to learning outcomes
• See which behaviors and content consistently
produce the desired learning outcomes
• Compare the effectiveness of different content or interaction types
• Arm early warning systems and establish predictive measures
• Personalize curriculum in real time based on student patterns
3"Caliper Analytics." Caliper Analytics. IMS Global Learning Consortium Inc, n.d. Web
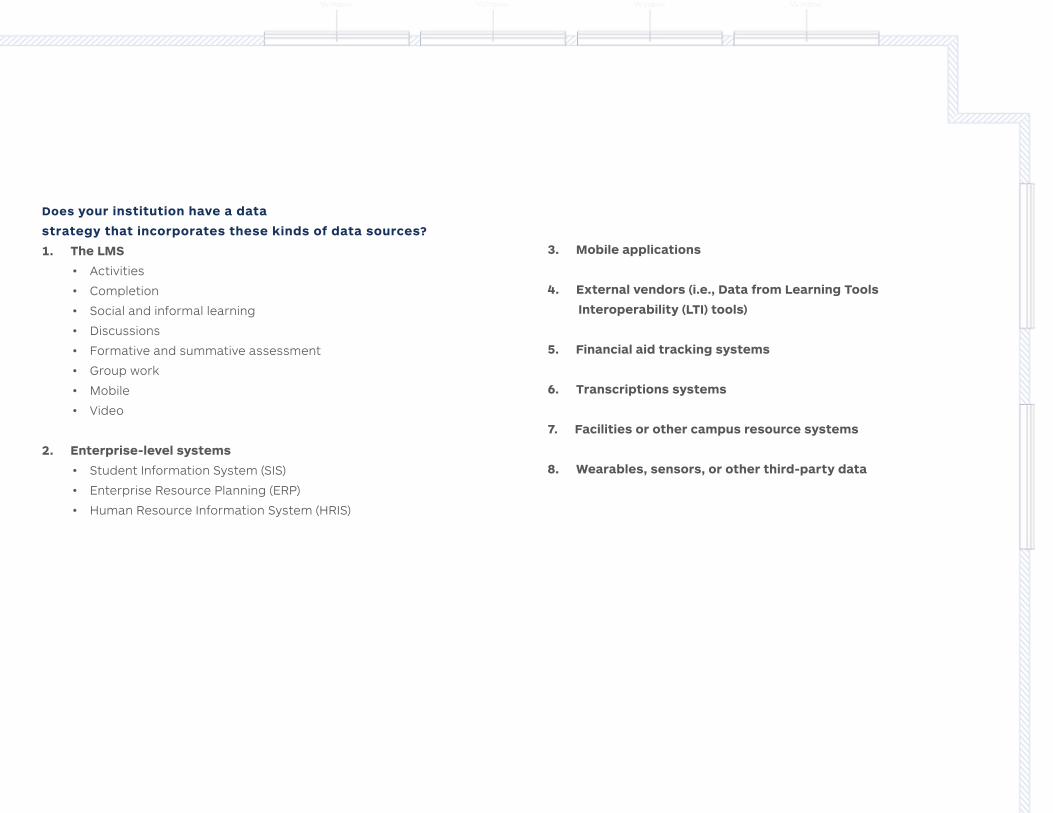
Does your institution have a data
strategy that incorporates these kinds of data sources?
1. The LMS
• Activities
• Completion
• Social and informal learning
• Discussions
• Formative and summative assessment
• Group work
• Mobile
• Video
2. Enterprise-level systems
• Student Information System (SIS)
• Enterprise Resource Planning (ERP)
• Human Resource Information System (HRIS)
3. Mobile applications
4. External vendors (i.e., Data from Learning Tools
Interoperability (LTI) tools)
5. Financial aid tracking systems
6. Transcriptions systems
7. Facilities or other campus resource systems
8. Wearables, sensors, or other third-party data
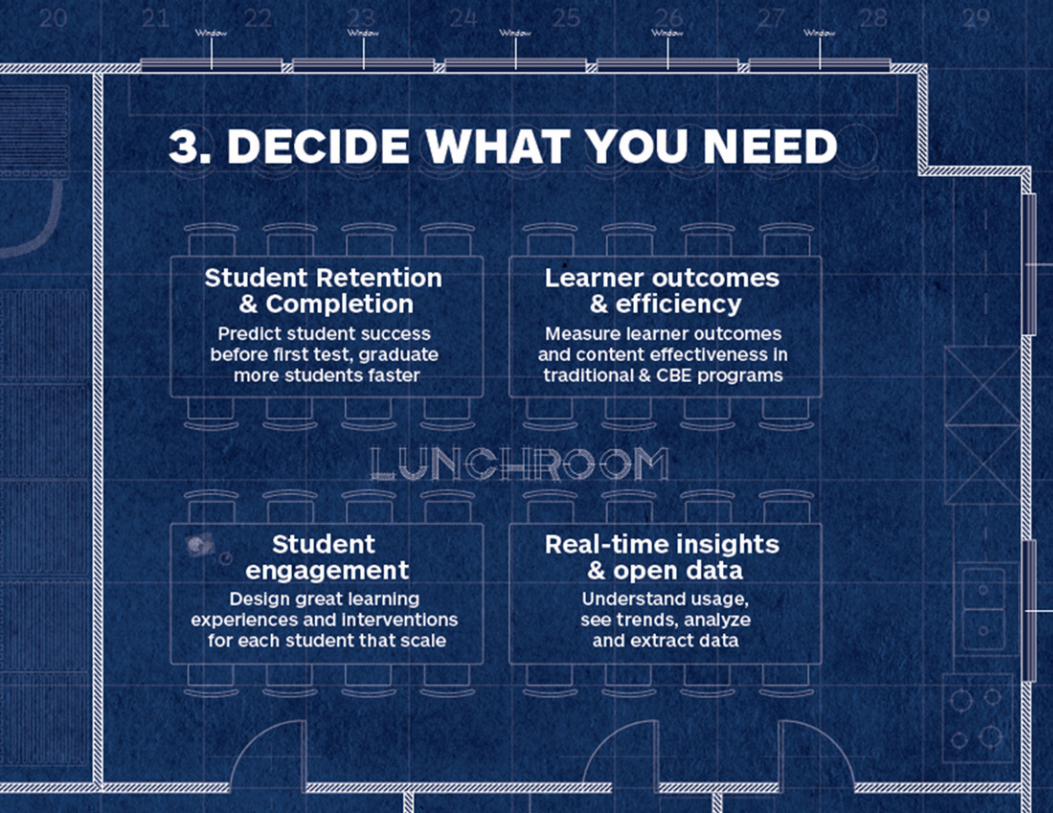
Deciding what you need
Now that you have your goals defined and you have located where the
pots of data gold exist within your learning enterprise, it is time to put
that data to work for you. But it is critical you think strategically when
approaching business analytics so your organization doesn’t find itself
lost in analysis paralysis.
First, take inventory of the critical questions you have and the answers you
seek to derive from your data. Then make sure they are aligned with the
overarching business goals of your educational institution. This approach
will allow you to strategically construct and segment your data into the
categories that matter most to stakeholders.
Aligning data insights to your biggest learning challenges
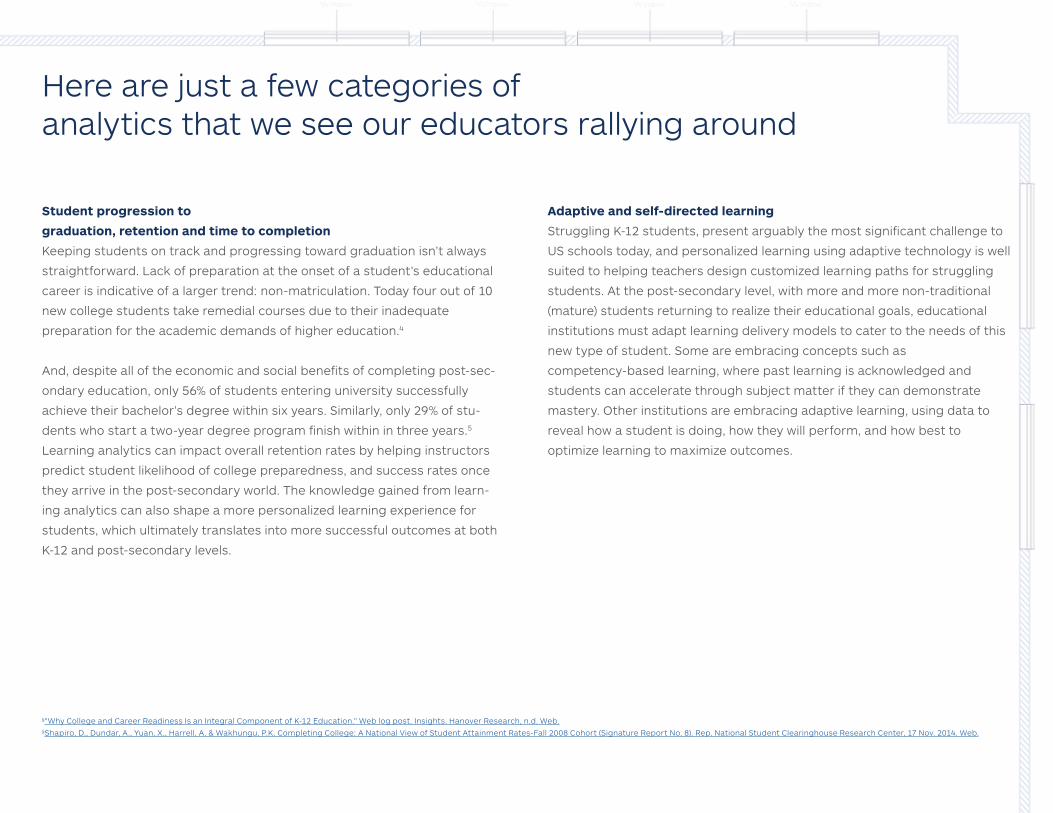
Adaptive and self-directed learning
Struggling K-12 students, present arguably the most significant challenge to
US schools today, and personalized learning using adaptive technology is well
suited to helping teachers design customized learning paths for struggling
students. At the post-secondary level, with more and more non-traditional
(mature) students returning to realize their educational goals, educational
institutions must adapt learning delivery models to cater to the needs of this
new type of student. Some are embracing concepts such as
competency-based learning, where past learning is acknowledged and
students can accelerate through subject matter if they can demonstrate
mastery. Other institutions are embracing adaptive learning, using data to
reveal how a student is doing, how they will perform, and how best to
optimize learning to maximize outcomes.
Student progression to
graduation, retention and time to completion
Keeping students on track and progressing toward graduation isn’t always
straightforward. Lack of preparation at the onset of a student’s educational
career is indicative of a larger trend: non-matriculation. Today four out of 10
new college students take remedial courses due to their inadequate
preparation for the academic demands of higher education.4
And, despite all of the economic and social benefits of completing post-sec-
ondary education, only 56% of students entering university successfully
achieve their bachelor’s degree within six years. Similarly, only 29% of stu-
dents who start a two-year degree program finish within in three years.5
Learning analytics can impact overall retention rates by helping instructors
predict student likelihood of college preparedness, and success rates once
they arrive in the post-secondary world. The knowledge gained from learn-
ing analytics can also shape a more personalized learning experience for
students, which ultimately translates into more successful outcomes at both
K-12 and post-secondary levels.
Here are just a few categories of analytics that we see our educators rallying around
4"Why College and Career Readiness Is an Integral Component of K-12 Education." Web log post. Insights. Hanover Research, n.d. Web. 5Shapiro, D., Dundar, A., Yuan, X., Harrell, A. & Wakhungu, P.K. Completing College: A National View of Student Attainment Rates-Fall 2008 Cohort (Signature Report No. 8). Rep. National Student Clearinghouse Research Center, 17 Nov. 2014. Web.
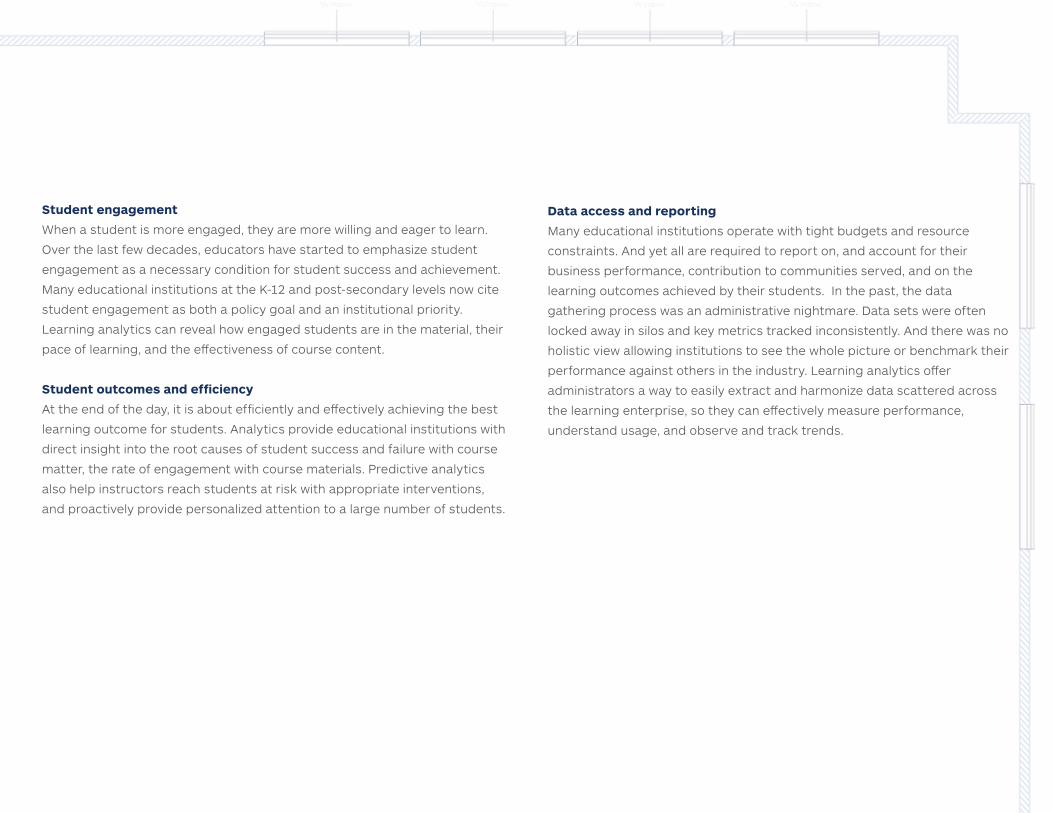
Student engagement
When a student is more engaged, they are more willing and eager to learn.
Over the last few decades, educators have started to emphasize student
engagement as a necessary condition for student success and achievement.
Many educational institutions at the K-12 and post-secondary levels now cite
student engagement as both a policy goal and an institutional priority.
Learning analytics can reveal how engaged students are in the material, their
pace of learning, and the effectiveness of course content.
Student outcomes and efficiency
At the end of the day, it is about efficiently and effectively achieving the best
learning outcome for students. Analytics provide educational institutions with
direct insight into the root causes of student success and failure with course
matter, the rate of engagement with course materials. Predictive analytics
also help instructors reach students at risk with appropriate interventions,
and proactively provide personalized attention to a large number of students.
Data access and reporting
Many educational institutions operate with tight budgets and resource
constraints. And yet all are required to report on, and account for their
business performance, contribution to communities served, and on the
learning outcomes achieved by their students. In the past, the data
gathering process was an administrative nightmare. Data sets were often
locked away in silos and key metrics tracked inconsistently. And there was no
holistic view allowing institutions to see the whole picture or benchmark their
performance against others in the industry. Learning analytics offer
administrators a way to easily extract and harmonize data scattered across
the learning enterprise, so they can effectively measure performance,
understand usage, and observe and track trends.

Preparing for SuccessAligning data insights to your biggest learning challenges
As the old saying goes, it is best to walk before you run. This is certainly
the case in establishing a solid and sound approach to your learning
analytics strategy. But as we have also noted, every institution’s approach
will be highly individualized.
Some institutions are further along the maturity curve. They have a good
handle on their sources of data. They have analytics expertise in house.
And they have a clear and established data governance policy. They
simply need the tools so they can dive right into implementing their
learning analytics strategy.
Others are still in the investigation phase. They are keen to learn from the
experience (and mistakes) of others and are actively seeking to understand
industry best practices surrounding learning analytics to inform their
strategy and implementation plan.
Others will turn to a trusted partner to accelerate their learning analytics
strategy and who can bring in an experienced implementation team
to “get it done.”
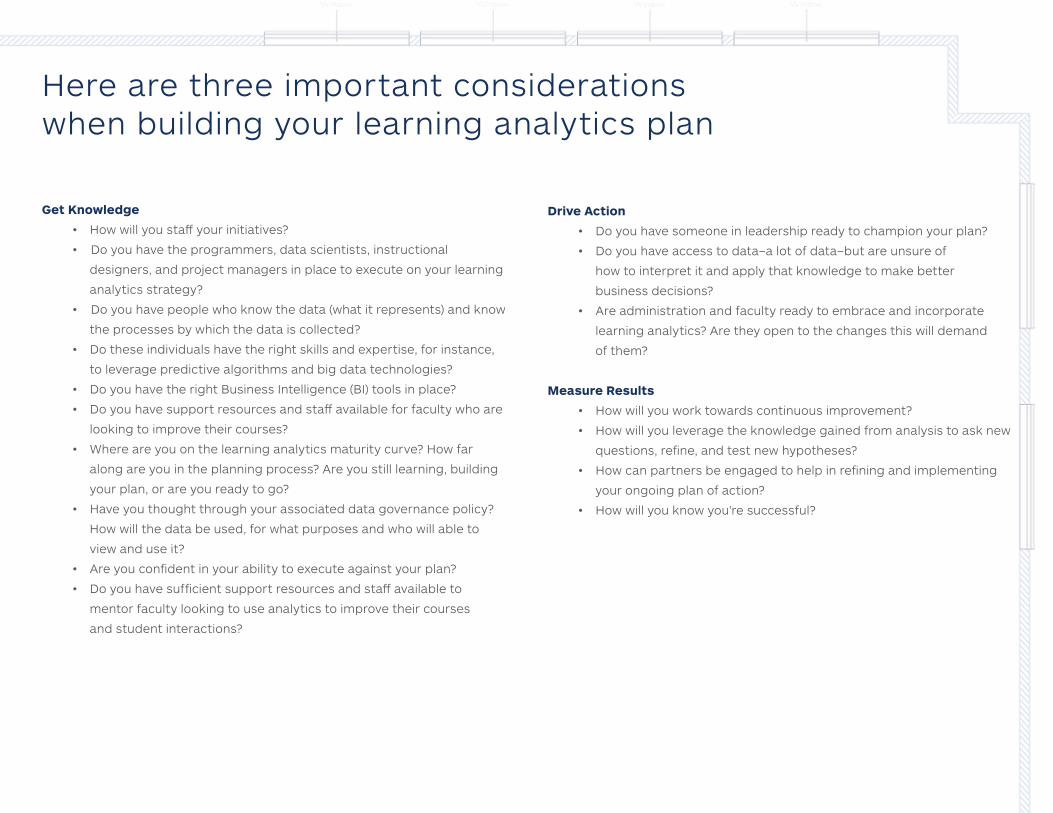
Get Knowledge
• How will you staff your initiatives?
• Do you have the programmers, data scientists, instructional
designers, and project managers in place to execute on your learning
analytics strategy?
• Do you have people who know the data (what it represents) and know
the processes by which the data is collected?
• Do these individuals have the right skills and expertise, for instance,
to leverage predictive algorithms and big data technologies?
• Do you have the right Business Intelligence (BI) tools in place?
• Do you have support resources and staff available for faculty who are
looking to improve their courses?
• Where are you on the learning analytics maturity curve? How far
along are you in the planning process? Are you still learning, building
your plan, or are you ready to go?
• Have you thought through your associated data governance policy?
How will the data be used, for what purposes and who will able to
view and use it?
• Are you confident in your ability to execute against your plan?
• Do you have sufficient support resources and staff available to
mentor faculty looking to use analytics to improve their courses
and student interactions?
Drive Action
• Do you have someone in leadership ready to champion your plan?
• Do you have access to data–a lot of data–but are unsure of
how to interpret it and apply that knowledge to make better
business decisions?
• Are administration and faculty ready to embrace and incorporate
learning analytics? Are they open to the changes this will demand
of them?
Measure Results
• How will you work towards continuous improvement?
• How will you leverage the knowledge gained from analysis to ask new
questions, refine, and test new hypotheses?
• How can partners be engaged to help in refining and implementing
your ongoing plan of action?
• How will you know you're successful?
Here are three important considerations when building your learning analytics plan
Building your SolutionHow a learning analytics expert can set you up for success
“D2L was given a perfect score for student performance and retention
because it has moved beyond basic reporting and alerts, and no other
Online Learning Platform (OLP) vendor has grasped predictive analytics
in the way D2L has.”
– Ovum, 2015
Learning analytics can boost an educational institution’s accountability,
affordability, productivity and student success. But there are best practices
to learn. There are skills to hone, and standards to follow. Not every
educational institution is in a position where it is ready to go it alone.
6"The World's Most Innovative Companies by Sector: Data Science." Fast Company. Fast Company & Inc © 2016 Mansueto Ventures, LLC, Feb. 2016. Web.
Here are some questions to ask your learning analytics partner:
1. Does your team have a deep
understanding of learning data and how to use it?
2. Is your technology platform open,
standards-based, and built for Internet scale?
3. Do you offer a complete suite of integrated products?
4. Can you demonstrate experience in making other customers successful
in their learning analytics strategy?
5. Are you committed to continually improving and innovating to remain in
lockstep with shifting market trends and dynamics?
Why Partner with D2L?
D2L brings to the table extensive experience in learning analytics and data
management best practice, enabled by a powerful technology platform.
Our expertise, platform and ability to deliver data where it counts are an
instrumental factor in making our customers around the globe successful.
D2L’s ability to provide powerful analytics to create a more meaningful
learning experience is globally recognized, with the #6 ranking on
Fast Company’s list of The Most Innovative Companies of 2016 in
the Data Science sector.6
Practice is clearly demonstrating that a trusted analytics solution is allowing
institutions to predict student success and intervene earlier and with more
confidence to improve learning outcomes. For instance, using the student
success index, Georgia Southern University is able to predict student
outcomes as early as the fourth week of classes, to within a letter grade of
accuracy, 67% of the time. University officials are seeing that accuracy reach
as high as 88% by week 18.5
And, Oral Roberts University is able to proactively identify and re-route
students that were at at-risk. They’ve improved student retention by 23.8%
in one semester and had a 67% growth in full-time registration for online
programs in one semester.8
K-12 schools are also reducing failure rates. “More kids are passing with
Cs or higher and fewer kids are in the D to F range. From 2013 to 2014,
we’ve reduced our failure rate by 36%, says Rick Tanski of Academy
Online High School (AOHS).
7Results courtesy of Georgia Southern University8Results courtesy of Oral Roberts University
Learning Analytics in Practice
ABOUT D2L
D2L is the software leader that makes the learning experience better.
The company’s cloud-based platform—Brightspace—is not a common
one-size-fits-all learning management system (LMS). It's easier to use, more flexible,
and smart. With Brightspace, you can personalize the experience for every learner
to deliver real results. The company is also a world leader in learning analytics: its
platform predicts learner performance so that you can take action in real time to
keep them on track. Brightspace is used by learners in higher education, K–12, and
the enterprise sector, including the Fortune 1000. D2L has operations in the United
States, Canada, Europe, Australia, Brazil, and Singapore. | www.brightspace.com
CONTACT US
Phone: 1-519-772-0325 (Worldwide)
Toll Free: 1-888-772-0325 (North America)
0-808-234-4235 (United Kingdom and Europe)
0-800-452-069 (New Zealand)
1-800-656-210 (Australia)
0-800-891-4507 (Brazil)
Fax: 1-519-772-0324
Email: [email protected]
Twitter: @Brightspace
Web: www.brightspace.com | www.D2L.com
© 2016 D2L Corporation. The D2L family of companies includes D2L Corporation, D2L Ltd, D2L Australia Pty Ltd, D2L Europe Ltd, D2L Asia Pte Ltd, and D2L Brasil Soluções de Tecnologia para Educação Ltda. All D2L marks are trademarks of D2L Corporation. Please visit D2L.com/trademarks for a list of D2L marks