the lego group annual report 2019 · 2020-03-04 · management‘s review annual report 2019 we are...
TRANSCRIPT

1
Annual Report 2019Management‘s Review
CVR no: 54 56 25 19
The LEGO Group Annual Report 2019

Contents
2
Annual Report 2019Contents
Management's Review 04 Letter from the CEO 05 2019 Performance Snapshot 06 Investing in Strategic Growth Initiatives07 The LEGO Group at a Glance 08 2019 Financial Review 10 Financial Highlights of the LEGO Group 11 Board of Directors and Management
Consolidated Financial Statements
13 Income Statement13 Statement of Comprehensive Income 14 Balance Sheet 15 Statement of Changes in Equity 16 Statement of Cash Flows 17 Notes
Parent Company Financial Statements
52 Income Statement 53 Balance Sheet 54 Statement of Changes in Equity 55 Notes
Additional information
63 Management's Statement 64 Independent Auditor's Report

3
Annual Report 2019Management‘s Review
Management’s Review
Letter from the CEO (p. 4)
Our ambition is to bring the power of LEGO® play to even more children around the world.
4
Annual Report 2019Management‘s Review
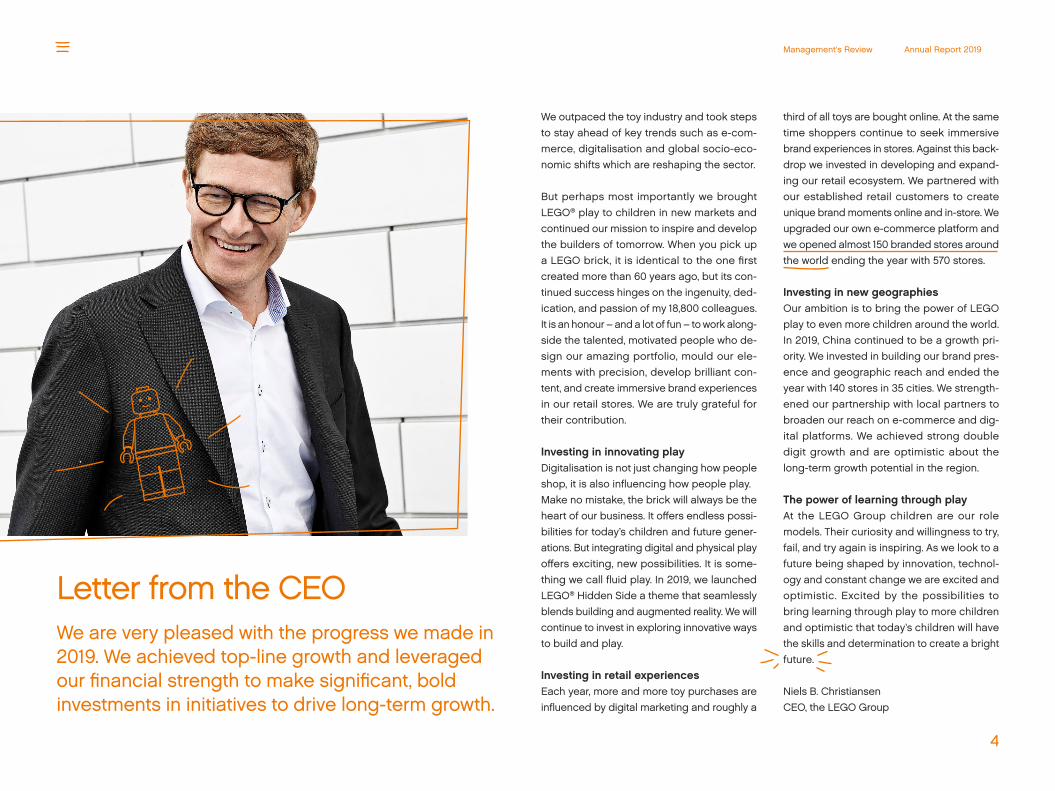
We are very pleased with the progress we made in 2019. We achieved top-line growth and leveraged our financial strength to make significant, bold investments in initiatives to drive long-term growth.
Letter from the CEO
Niels B. ChristiansenCEO, the LEGO Group
We outpaced the toy industry and took steps to stay ahead of key trends such as e-com-merce, digitalisation and global socio-eco-nomic shifts which are reshaping the sector.
But perhaps most importantly we brought LEGO® play to children in new markets and continued our mission to inspire and develop the builders of tomorrow. When you pick up a LEGO brick, it is identical to the one first created more than 60 years ago, but its con-tinued success hinges on the ingenuity, ded-ication, and passion of my 18,800 colleagues. It is an honour – and a lot of fun – to work along - side the talented, motivated people who de-sign our amazing portfolio, mould our ele-ments with precision, develop brilliant con-tent, and create immersive brand experiences in our retail stores. We are truly grateful for their contribution.
Investing in innovating playDigitalisation is not just changing how people shop, it is also influencing how people play. Make no mistake, the brick will always be the heart of our business. It offers endless possi-bilities for today’s children and future gener-ations. But integrating digital and physical play offers exciting, new possibilities. It is some-thing we call fluid play. In 2019, we launched LEGO® Hidden Side a theme that seamlessly blends building and augmented reality. We will continue to invest in exploring innovative ways to build and play.
Investing in retail experiencesEach year, more and more toy purchases are influenced by digital marketing and roughly a
third of all toys are bought online. At the same time shoppers continue to seek immersive brand experiences in stores. Against this back-drop we invested in developing and expand-ing our retail ecosystem. We partnered with our established retail customers to create unique brand moments online and in-store. We upgraded our own e-commerce platform and we opened almost 150 branded stores around the world ending the year with 570 stores.
Investing in new geographies Our ambition is to bring the power of LEGO play to even more children around the world. In 2019, China continued to be a growth pri-ority. We invested in building our brand pres-ence and geographic reach and ended the year with 140 stores in 35 cities. We strength-ened our partnership with local partners to broaden our reach on e-commerce and dig-ital platforms. We achieved strong double digit growth and are optimistic about the long-term growth potential in the region.
The power of learning through play At the LEGO Group children are our role models. Their curiosity and willingness to try, fail, and try again is inspiring. As we look to a future being shaped by innovation, technol-ogy and constant change we are excited and optimistic. Excited by the possibilities to bring learning through play to more children and optimistic that today’s children will have the skills and determination to create a bright future.

2019 Performance Snapshot
2017 2018 201910,00
10,25
10,50
10,75
11,00
2017 2018 201915
25
35
45
5
Annual Report 2019Management‘s Review
The LEGO Group made good progress against its ambition to deliver sustainable growth. Revenue, consumer sales and profit all grew. All Market Groups delivered year-on-year revenue growth, with established mar-kets growing single digits and China deliver-ing strong double digit growth. The Group used its strong financial foundations to invest in initiatives that will deliver long-term growth.
Top-selling Themes
We have a “Planet Promise” – our promise to children that we will help build a sustainable future by having a positive impact on society and the environment.
We take our responsibility seriously and track our performance against this Promise as closely as our financial results. We appreciate that consumers recognise our commitment. Their feedback placed us #1 on Reputation Institute’s RepTrak survey rank- ings for CSR in 2019.
Our Contribution to Society & the Planet
100%
LEGO® Replay launched in the United States. This is a step towards creating a circular business model for LEGO bricks. The trial programme encourages people to donate unused LEGO bricks for distribution to children in need
25%
Learning through Play Environment
The LEGO® Ideas Tree House
25% of profit goes to the LEGO Foundation. LEGO Foundation brings learn - ing through play to children in need, includ - ing refugees and those in underprivileged communities
1.8 million children reached across 26 countries through local com-munity engagement programmes, part-nerships and Build to Give, a holiday giving campaign
renewable energy milestone maintained
185 sustainable, botanical elements were used in the LEGO® Ideas Tree House, as we expand the use of elements produced from sustainable materials
LEGO® City
LEGO® Star Wars™
LEGO® Technic
LEGO® Friends
LEGO® Creator
6%Revenue growth
9.6 bn
38.5 bn
10.8 bn
Cash Flow from Operations DKK
Revenue DKK
Operating Profit DKK
69%Return on Invested Capital

Continue reading
6
Annual Report 2019Management‘s Review
Innovating play Like LEGO builders everywhere, our talented designers are driven by creativity and innova-tion. Each year, approximately 60% of our port-folio is new. During 2019, this included new sets for top-selling core themes such as LEGO® City, LEGO® Technic, LEGO® Friends and LEGO® Creator. We also created entirely new ways to play, such as LEGO® Hidden Side. This new theme blends augmented reality with building. We also integrated LEGO play into a wide range of digital experiences including digital games, apps, and voice-based intelli-gent home assistants.
Investing in fluid play – the intersection be-tween digital and physical play – will continue to be a priority.
Innovating retailThe toy retail market is being rapidly re-shaped by digitalisation and the accelerated growth of e-commerce. Shoppers are seeking different experiences from different channels – immersive brand experiences in physical stores and convenience and value online.
To achieve this we are making significant investments in our retail ecosystem. In 2019,
We achieved strong double digit growth
in China as we expanded our brand and retail presence
Sustainable Growth
Investing in Strategic Growth Initiatives
We are driven by our ambition to bring LEGO® play to more children wordwide. We believe that play has the power to shape lives. When children play, they learn. They learn life-long skills like problem solving, communication, and collaboration, which are more critical than ever. A study by the World Economic Forum esti-mates that given the pace of change 65% of kindergarten children will hold jobs that have not yet been invented. The only way we can prepare children is to give them skills that can be applied universally.
Play is an effective way to develop these skills from a young age, and LEGO play is especially powerful as it offers children endless possibil-ities. Just six two-by-four LEGO bricks can make 915 million different combinations. And they are made with such precision that they stick together like glue, but come apart easily so they can be built, unbuilt and rebuilt into whatever a child can imagine.
Our strategic priorities are designed to deliver long-term, sustainable growth and importantly bring the power of LEGO play to even more children around the world so we can continue to inspire and develop builders of tomorrow for generations to come.
Driven by our Mission
we significantly upgraded our LEGO.com e-commerce platform which drove a 27% in-crease in the number of visitors. We opened almost 150 branded stores including flagship stores in Amsterdam and Beijing, which offer shoppers one-of-a-kind experiences includ-ing personalised minifigures and self-portraits made from LEGO bricks.
We are stepping up investment in all our retail channels and working closely with our part-ners to connect with people wherever and however they want to shop.
Expanding into new markets By 2032, 90% of the world’s two billion chil-dren will live outside Europe and North America, with more than three quarters of these living in Eastern Asia.
As a result, we are stepping up investment in the growth markets of tomorrow.
We achieved strong double digit growth in China as we expanded our brand and retail presence. This will continue in 2020 as we plan to have more than 220 stores in around 40 cities by the end of the year. We will also continue to build our e-commerce presence on popular platforms such as Tmall and JD and extend our partnership with Tencent to provide unique digital content and games. We were also pleased with the success of our new sets designed to celebrate Chinese New Year, showing there is strong consumer de-mand for culturally-relevant products.
7
Annual Report 2019Management‘s Review
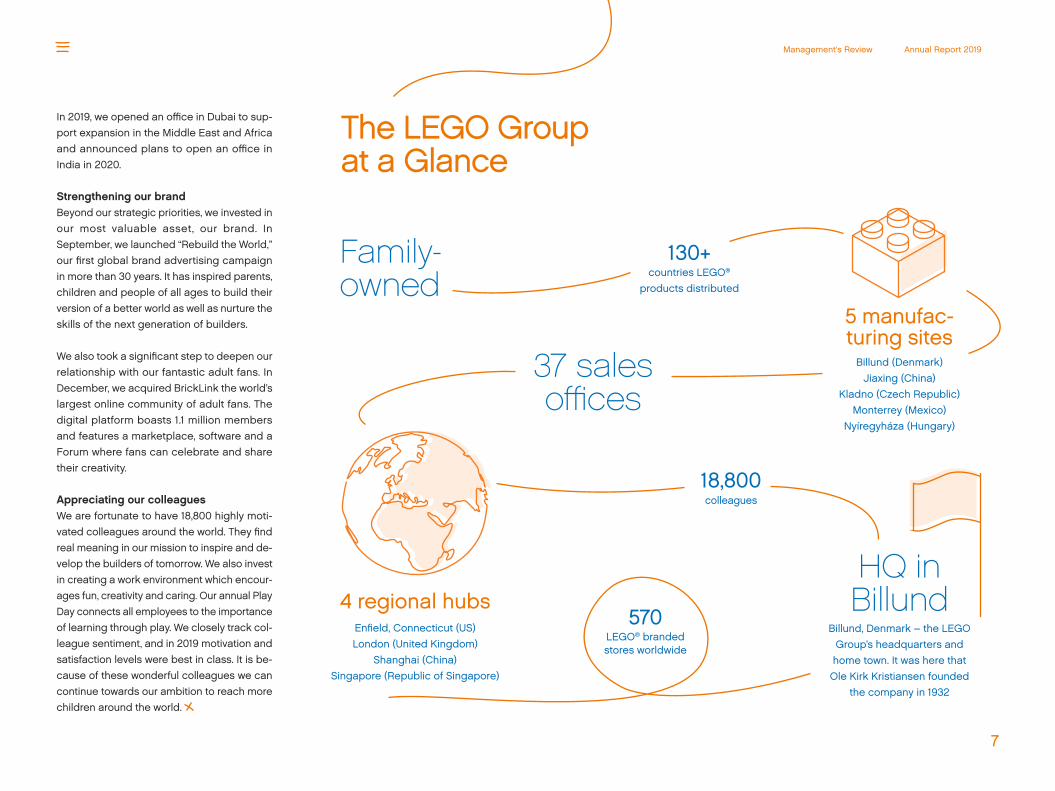
HQ in Billund
Billund, Denmark – the LEGO Group’s headquarters and home town. It was here that Ole Kirk Kristiansen founded
the company in 1932
4 regional hubsEnfield, Connecticut (US) London (United Kingdom)
Shanghai (China)Singapore (Republic of Singapore)
5 manufac-turing sites
37 sales offices
570LEGO® branded stores worldwide
18,800colleagues
130+countries LEGO®
products distributed
Family-owned
Billund (Denmark)Jiaxing (China)
Kladno (Czech Republic)Monterrey (Mexico)
Nyíregyháza (Hungary)
The LEGO Group at a Glance
In 2019, we opened an office in Dubai to sup-port expansion in the Middle East and Africa and announced plans to open an office in India in 2020.
Strengthening our brandBeyond our strategic priorities, we invested in our most valuable asset, our brand. In September, we launched “Rebuild the World,” our first global brand advertising campaign in more than 30 years. It has inspired parents, children and people of all ages to build their version of a better world as well as nurture the skills of the next generation of builders.
We also took a significant step to deepen our relationship with our fantastic adult fans. In December, we acquired BrickLink the world’s largest online community of adult fans. The digital platform boasts 1.1 million members and features a marketplace, software and a Forum where fans can celebrate and share their creativity.
Appreciating our colleaguesWe are fortunate to have 18,800 highly moti-vated colleagues around the world. They find real meaning in our mission to inspire and de-velop the builders of tomorrow. We also invest in creating a work environment which encour-ages fun, creativity and caring. Our annual Play Day connects all employees to the importance of learning through play. We closely track col-league sentiment, and in 2019 motivation and satisfaction levels were best in class. It is be-cause of these wonderful colleagues we can continue towards our ambition to reach more children around the world.
Continue reading
8
Annual Report 2019Management‘s Review
2019 Financial Review
Summary Overall, 2019 was a very satisfactory year for the LEGO Group. The company achieved rev-enue, consumer sales and profit growth which was especially satisfactory given the chal-lenging industry environment. The LEGO Group continued to make significant invest-ments in initiatives to drive future growth.
The LEGO Group’s main activity is the devel-opment, production, marketing and sale of play materials. It operates in the traditional toy market, which declined 3% in 2019 partly due to shifts in the retail environment, driven by the continued growth of e-commerce and de-cline of specialist toy retailers.
RevenueRevenue for the full year increased by 6% to DKK 38.5 billion compared with DKK 36.4 bil-lion in 2018. Excluding the impact of foreign currency exchange, revenues for the full year increased by 4% compared with 2018, in line with expectations.
The LEGO Group’s revenue was driven by sin-gle digit growth in all major markets and strong double digit growth in China where the brand continues to expand.
Expenses, Tax & ProfitOperating profit was DKK 10.8 billion in 2019 similar to DKK 10.8 billion in 2018. The operat-ing margin was 28.1% in 2019, slightly lower than 29.6% in 2018. Net financials created an expense of DKK 85 million compared with DKK 264 million in 2018. This resulted in a pre-tax profit of DKK 10.8 billion against DKK 10.5 billion the prior year.
Corporate income tax amounted to DKK 2.4 billion compared with DKK 2.4 billion in the prior year and the effective tax rate was 22.7% against 23.2% in 2018. Net profit was DKK 8.3 billion in 2019 against DKK 8.1 billion in 2018.
In 2019, the LEGO Group made significant in-vestments in initiatives designed to deliver growth in the longer term. This included port-folio innovation, expanding the number of LEGO® branded stores globally, upgrading LEGO.com e-commerce platform and building presence in newer markets such as China and the Middle East.
Cash flow and equityThe LEGO Group’s assets increased to DKK 34.9 billion in 2019 compared with DKK 31.5 billion in 2018. Cash flow from operating
activities was DKK 9.6 billion, against DKK 9.8 billion in 2018.
After recognition of the profit and distribution of dividend, the LEGO Group’s equity was DKK 22.2 billion up from DKK 21.8 billion in 2018. Return on equity for the LEGO Group was 37.8% in 2019 against 38.0% in 2018.
InvestmentsDuring 2019, the LEGO Group invested DKK 1.8 billion in property, plant and equipment, com-pared with DKK 1.4 billion in 2018. This included increasing warehousing and processing capacity in its factory in Nyíregyháza, Hungary and opening a new warehouse in Mon-terrey, Mexico.
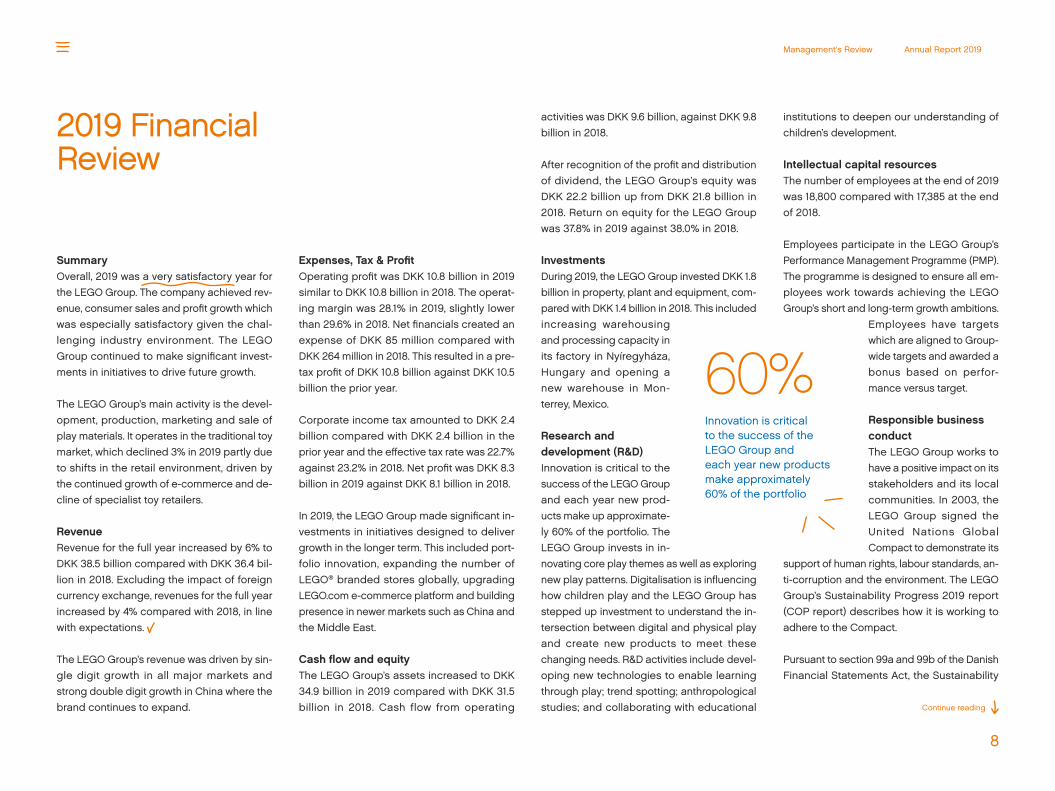
Research and development (R&D)Innovation is critical to the success of the LEGO Group and each year new prod-ucts make up approximate-ly 60% of the portfolio. The LEGO Group invests in in-novating core play themes as well as exploring new play patterns. Digitalisation is influencing how children play and the LEGO Group has stepped up investment to understand the in-tersection between digital and physical play and create new products to meet these changing needs. R&D activities include devel-oping new technologies to enable learning through play; trend spotting; anthropological studies; and collaborating with educational
institutions to deepen our understanding of children’s development.
Intellectual capital resourcesThe number of employees at the end of 2019 was 18,800 compared with 17,385 at the end of 2018.
Employees participate in the LEGO Group’s Performance Management Programme (PMP). The programme is designed to ensure all em-ployees work towards achieving the LEGO Group’s short and long-term growth ambitions.
Employees have targets which are aligned to Group-wide targets and awarded a bonus based on perfor-mance versus target.
Responsible business conductThe LEGO Group works to have a positive impact on its stakeholders and its local communities. In 2003, the LEGO Group signed the United Nations Global Compact to demonstrate its
support of human rights, labour standards, an-ti-corruption and the environment. The LEGO Group’s Sustainability Progress 2019 report (COP report) describes how it is working to adhere to the Compact.
Pursuant to section 99a and 99b of the Danish Financial Statements Act, the Sustainability
Innovation is critical to the success of the LEGO Group and each year new products make approximately 60% of the portfolio
60%

9
Annual Report 2019Management‘s Review
Progress 2019 report constitutes the statutory statement of corporate social responsibility. This also includes the required quantitative targets for the under-represented gender on the Board of Directors. The Sustainability Progress 2019 report is available at:www.LEGO.com/AboutUs/Responsibility.
Risks and governanceThe LEGO Group has no significant trade re-ceivables risk concentrated in specific coun-tries, but has some single significant trade debtors. The LEGO Group has fixed proce-dures for determining the granting of credit. The LEGO Group’s risk relating to trade re-ceivables is considered to be moderate. For more information, see note 3.4.
The majority of the LEGO Group’s sales are in foreign currency, and the risks relating to cur-rency are described in note 4.6.
In 2019, the Board of Directors established an Audit Committee mainly to oversee financial reporting, accounting policies and estimates, internal controls, risk management, and exter-nal audit and to recommend to the Board of
Directors the approval of financial statements and the appointment of external auditor.
The LEGO Group is committed to complying with all applicable laws and regulations in the countries in which it operates. The LEGO Group’s global Tax Strategy is defined by the Board of Directors and reviewed on an annual basis to ensure it remains compliant and up-to-date with global developments. It can be found on www.LEGO.com/AboutUs.
Events after the reporting dateNo events have occurred after the balance sheet date that would influence the evaluation of the Annual Report.
OutlookThe LEGO Group expects single-digit growth in 2020, ahead of the global toy market. This is expected to be achievable due to contin-ued focus on product innovation, growth in established and strategic markets, such as China. The LEGO Group also plans to contin-ue investing in initiatives to address evolving trends, including sustainability, and drive long-term sustainable growth.

(mDKK) 2019 2018 2017 2016 2015
Income Statement
Revenue 38,544 36,391 34,995 37,934 35,780
Expenses (27,707) (25,617) (24,636) (25,486) (23,536)
Operating profit 10,837 10,774 10,359 12,448 12,244
Financial income and expenses (85) (264) (158) (57) (96)
Profit before income tax 10,752 10,510 10,201 12,391 12,148
Net profit for the year 8,306 8,076 7,806 9,436 9,174
Balance Sheet
Total assets 34,946 31,485 29,911 29,937 27,877
Equity 22,183 21,753 20,714 20,039 17,751
Liabilities 12,763 9,732 9,197 9,898 10,126
Statement of Cash Flow
Cash flows from operating activities 9,645 9,847 10,691 9,084 10,559
Purchase of intangible assets (346) (54) (35) (92) (126)
Purchase of property, plant and equipment (1,827) (1,448) (1,494) (2,908) (2,822)
Cash flows from financing activities (7,671) (7,781) (9,378) (6,575) (6,816)
Total cash flows (188) 574 (210) (483) 808
Employees
Average number (full-time) 16,112 15,050 16,480 16,836 13,974
Headcount end of year 18,800 17,385 17,534 19,061 17,294
Other financials (in %)
Revenue growth in constant currency 4 7 (7) 6 19
Financial ratios (in %)
Gross margin 72.0 71.4 70.7 72.2 72.6
Operating margin 28.1 29.6 29.6 32.8 34.2
Net profit margin 21.5 22.2 22.3 24.9 25.6
Return on equity (ROE) 37.8 38.0 38.3 49.9 60.0
Return on invested capital (ROIC) 69.0 78.9 72.3 92.0 107.3
Equity ratio 63.5 69.1 69.3 66.9 63.7
The Financial Highlights for 2019 are affected by the implementation of IFRS 16 Leases as from 1 January 2019. Comparison figures for 2018, 2017, 2016 and 2015 have not been re-stated due to the use of the modified retro-spective approach. The implementation of IFRS 16 Leases in 2019 has a negative impact on ROIC (approximately 8 percentage points) and on Equity ratio (approximately 6 percent-age points) compared to 2018. Implementation of IFRS 16 Leases is described in note 1.2 and 4.4.
Financial ratios are calculated in accordance with the guidelines from the Danish Society of Financial Analysts. For definitions, please refer to note 1.1.
Parentheses denote negative figures.
Financial Highlights of the LEGO Group
10
Annual Report 2019Management‘s Review
Board of Directors and Management
Kåre Schultz— Member of the Board of LEGO A/S
since 2007.
— Chief Executive Officer of Teva Pharmaceutical Industries Ltd.
Eva Berneke
— Member of the Board of LEGO A/S since 2011 and member of the Audit Committee.
— Chief Executive Officer of KMD A/S.
— Member of the Board of DTU.
— Member of the Board of Nationalbanken.
— Member of the Conseil d'administration of École Polytechnique Université Paris-Saclay.
— Member of the Board of Vestas.
Jan Thorsgaard Nielsen — Member of the Board of LEGO A/S
since 2013 and member of the Audit Committee.
— Chief Investment Officer (CIO) of A.P. Møller Holding A/S.
— Deputy Chairman of the Board of Danske Bank A/S.
— Member of the Board of APMH Invest A/S.
— Member of the Board of A.P. Møller Capital P/S.
— Chairman of the Board of KK Wind Solutions A/S.
Niels B. Christiansen President and Chief Executive Officer
Marjorie Lao Chief Financial Officer
Julia Goldin Chief Marketing Officer
Carsten Rasmussen Chief Operations Officer
Loren I. Shuster Chief People Officer & Head of Corporate Affairs
Claus Flyger Pejstrup Executive Vice President, LEGO Retail
Victor Saeijs Executive Vice President, Market Group EMEA
Skip Kodak Executive Vice President, Market Group Americas
Eric Maugein Executive Vice President, Market Group APAC
Executive Leadership Team
Thomas Kirk Kristiansen — Chairman of LEGO A/S since February
2020, Deputy Chairman from May 2016 to February 2020 (member since 2007).
— Deputy Chairman of LEGO Brand Group.
— Representing the fourth generation of the owner family.
— Member of the Board of KIRKBI A/S and 3 fully owned subsidiaries.
— Chairman of the Board of LEGO Foundation.
— Executive Management member of Kirk & Kirk Holding ApS and management roles in 4 subsidiaries.
Søren Thorup Sørensen
— Deputy Chairman of LEGO A/S since February 2020 (member since 2010) and Chairman of the Audit Committee.
— Chief Executive Officer of KIRKBI A/S.
— Member of the Board of Falck A/S, Merlin Entertainments Limited, Landis + Gyr AG, Ole Kirk’s Fond, Koldingvej 2, Billund A/S, Boston Holding A/S and 6 fully owned subsidiaries of KIRKBI A/S.
Jørgen Vig Knudstorp — Member of the Board of LEGO A/S
since 2017, Chairman from May 2017 to February 2020.
— Executive Chairman of LEGO Brand Group.
— Member of the Board of Starbucks.
— President and Chief Executive Officer of the LEGO Group from 2004–2016.
— Member of the Board of Merlin Entertainments Limited.
11
Annual Report 2019Management‘s Review
Consolidated Financial Statements
Annual Report 2019
12
Consolidated Financial Statements

Income Statement1 January – 31 December
(mDKK) Note 2019 2018
Revenue 2.1 38,544 36,391
Production costs 2.2 (10,791) (10,417)
Gross profit 27,753 25,974
Sales and distribution expenses 2.2 (11,893) (10,971)
Administrative and IT expenses 2.2 (2,848) (2,246)
Other operating expenses 2.2 (2,175) (1,983)
Operating profit 10,837 10,774
Financial income 4.1 29 9
Financial expenses 4.1 (114) (273)
Profit before income tax 10,752 10,510
Tax on profit for the year 2.6 (2,446) (2,434)
Net profit for the year 8,306 8,076
(mDKK) 2019 2018
Profit for the year 8,306 8,076
Items that will be reclassified to the income statement, when specific conditions are met:
Change in market value of cash flow hedges (297) (99)
Reclassification of cash flow hedges from equity to be recognised as part of:
Revenue in the income statement 293 14
Tax on cash flow hedges 1 19
Currency translation differences 154 10
Items that will not be reclassified to the income statement:
Remeasurements of defined benefit plans (35) 28
Tax on remeasurements of defined benefit plans 8 (9)
Total comprehensive income for the year 8,430 8,039
Statement of Comprehensive Income1 January – 31 December
Annual Report 2019
13
Consolidated Financial Statements

Balance Sheetat 31 December
(mDKK) Note 2019 2018
Intangible assets 3.1 488 253
Property, plant and equipment 3.2 12,356 11,721
Right-of-use assets 4.4 3,123 –
Deferred tax assets 2.6 738 638
Prepayments – 142
Total non-current assets 16,705 12,754
Inventories 3.3 2,672 2,579
Trade receivables 3.4, 4.5 7,201 6,766
Other receivables 974 931
Prepayments 376 250
Current tax receivables 284 249
Loans to related parties 4.5, 5.6 5,876 6,858
Cash at banks 4.5 858 1,098
Total current assets 18,241 18,731
Total assets 34,946 31,485
(mDKK) Note 2019 2018
Share capital 4.2 20 20
Reserve for hedge accounting (35) (32)
Reserve for currency translation (417) (571)
Retained earnings 22,615 22,336
Total equity 22,183 21,753
Borrowings 4.3 147 157
Lease liabilities 4.4 2,523 –
Deferred tax liabilities 2.6 168 134
Employee benefit obligations 3.5 209 161
Provisions 3.6 78 60
Deferred revenue 3.7 14 12
Other debt 3.8 176 139
Total non-current liabilities 3,315 663
Borrowings 4.3 10 10
Lease liabilities 4.4 573 –
Trade payables 4.5 3,422 3,207
Current tax liabilities 347 257
Provisions 3.6 9 54
Deferred revenue 3.7 248 249
Other debt 3.8 4,839 5,292
Total current liabilities 9,448 9,069
Total liabilities 12,763 9,732
Total equity and liabilities 34,946 31,485
Annual Report 2019
14
Consolidated Financial Statements

Statement of Changes in Equity1 January – 31 December
Accounting policies
Reserve for hedge accounting
The reserve for hedge accounting consists of the
effective portion of gains and losses on hedging
instruments designated as cash flow hedges.
Reserve for currency translation
The reserve for currency translation consists of ex-
change rate differences that occur when translating the
foreign subsidiaries’ financial statements from their
functional currency into the LEGO Group’s presentation
currency. On disposal of the net investment, the reserve
for currency translation of that foreign subsidiary is
recognised in the income statement. Reduction of a net
investment in a foreign operation which does not result
in loss of control is not treated as a disposal.
2019 (mDKK) Share capitalReserve for hedge
accounting
Reserve forcurrency
translationRetained earnings
Total equity
Balance at 1 January 20 (32) (571) 22,336 21,753
Profit for the year – – – 8,306 8,306
Comprehensive income/(expenses) for the year – (3) 154 (27) 124
Dividend paid relating to prior year – – – (8,000) (8,000)
Balance at 31 December 20 (35) (417) 22,615 22,183
2018 (mDKK) Share capitalReserve for hedge
accounting
Reserve forcurrency
translationRetained earnings
Total equity
Balance at 1 January 20 34 (581) 21,241 20,714
Profit for the year – – – 8,076 8,076
Comprehensive income/(expenses) for the year – (66) 10 19 (37)
Dividend paid relating to prior year – – – (7,000) (7,000)
Balance at 31 December 20 (32) (571) 22,336 21,753
Annual Report 2019
15
Consolidated Financial Statements

Accounting policies
Cash flows in currencies other than the functional
currency are translated at the average exchange rate
for the month in question.
The cash flow statement is prepared by the indirect
method based on consolidated profit before income tax,
and shows cash flows from operating, investing and
financing activities as well as the LEGO Group’s cash at
banks at opening and closing.
Cash flow from operating activities is specified as the
profit before income tax for the year adjusted for non-
cash operating items, changes in the working capital,
and corporation tax paid.
Cash flow from investing activities includes the purchase
and sale of intangible and tangible fixed assets.
Cash flow from financing activities includes the raising
and repaying of long-term liabilities, short-term bank
loans and the payment of dividends.
Cash at banks comprise cash that can readily be
converted into cash.
(mDKK) Note 2019 2018
Profit before income tax 10,752 10,510
Adjustments for non-cash items 5.5 2,046 1,401
Change in working capital 5.5 (696) 440
Interest received 4.1 8 9
Interest paid 4.1 (26) (37)
Income tax paid (2,439) (2,476)
Cash flow from operating activities 9,645 9,847
Purchases of intangible assets 3.1 (346) (54)
Purchases of property, plant and equipment 3.2 (1,827) (1,448)
Proceeds from sale of property, plant and equipment 11 10
Cash flow used for investing activities (2,162) (1,492)
Repayments of borrowings (10) (11)
Payment of lease liabilities (643) –
Repayments from related parties 5.6 11,845 12,069
Payments to related parties 5.6 (10,863) (12,839)
Dividends paid to shareholders 4.2 (8,000) (7,000)
Cash flow from financing activities (7,671) (7,781)
Total cash flows (188) 574
Cash at banks at 1 January 1,098 762
Effect of exchange losses (52) (238)
Cash at banks at 31 December 858 1,098
Statement of Cash Flows 1 January – 31 December
Annual Report 2019
16
Consolidated Financial Statements

Notes Basis of preparation18 1.1 Basis for preparation of
the Consolidated Financial Statements
19 1.2 Effects of new and amended accounting standards
20 1.3 Significant accounting estimates and judgements
Results for the year21 2.1 Revenue
22 2.2 Expenses by nature
23 2.3 Employee costs
24 2.4 Depreciation, amortisation and impairment
24 2.5 Research and development expenses
25 2.6 Tax
Operating assets and liabilities27 3.1 Intangible assets
29 3.2 Property, plant and equipment
30 3.3 Inventories
31 3.4 Trade receivables
32 3.5 Employee benefit obligations
33 3.6 Provisions
34 3.7 Deferred revenue
34 3.8 Other debt
Capital structure and financing35 4.1 Financial income
and expenses
35 4.2 Share capital
36 4.3 Borrowings
37 4.4 Leases
39 4.5 Financial assets and liabilities
41 4.6 Financial risks
43 4.7 Derivative financial instruments
Other disclosures45 5.1 Fees to independent auditor
45 5.2 Remuneration of Group Management
46 5.3 Acquisition of businesses
46 5.4 Contingent assets, contingent liabilities and other obligations
47 5.5 Cash flow specifications
48 5.6 Related parties
49 5.7 Events occuring after the reporting period
50 5.8 Group structure
Annual Report 2019
17
Consolidated Financial Statements
DKK
Basis for preparation of the Consolidated Financial Statements
This section introduces the LEGO Group’s accounting
policies and significant accounting estimates and
judgements. A more detailed description of accounting
policies and significant estimates and judgements re-
lated to specific reported amounts is presented in the
respective notes.
The Consolidated Financial Statements of the LEGO
Group have been prepared in accordance with
International Financial Reporting Standards (IFRS) and
further requirements of the Danish Financial Statements
Act.
The Consolidated Financial Statements are presented
in Danish kroner (DKK), which is the functional and presen -
tation currency of the Parent Company.
The Consolidated Financial Statements have been pre-
pared in accordance with the historical cost convention,
with the exception of financial assets and financial lia-
bilities, which are measured at fair value.
Apart from the changes due to implementation of new
standards as described in note 1.2, accounting policies
are unchanged from last year.
Changes in classification in the income statement
Comparative figures in the income statement have been
restated to match this year’s presentation. The adjust-
ment of the comparative figures have no effect on op-
erating profit.
Consolidation practice
The Consolidated Financial Statements comprise LEGO
A/S (Parent Company) and the entities in which LEGO
A/S directly or indirectly holds more than 50% of the
votes or has the control over the investee (subsidiaries).
LEGO A/S and these entities are referred to as the LEGO
Group.
Subsidiaries are fully consolidated from the date where
control is transferred to the LEGO Group. They are de-
consolidated from the date where control ceases.
Intercompany transactions, balances and unrealised
gains on transactions between group entities are elim-
inated. Unrealised losses are also eliminated unless the
transaction provides evidence of impairment of the as-
set transferred. Subsidiaries’ accounting policies have
been changed, where necessary, to ensure consistency
with the policies adopted by the LEGO Group.
Foreign currency translation
Functional currency
Items included in the financial statements of each of the
LEGO Group’s entities are measured using the currency
of the primary economic environment in which the entity
operates.
Transactions and balances
Foreign currency transactions are translated into the
functional currency using the exchange rates prevailing
at the date of the transactions. Foreign exchange gains
and losses resulting from the settlement of such
transactions and from the translation at balance sheet
date exchange rates of monetary assets and liabilities
denominated in foreign currencies are recognised in
the income statement, except when deferred in equity
as reserve for exchange rate adjustments.
Group entities
The results and financial position of subsidiaries that
have a functional currency different from the presenta-
tion currency are translated into the presentation cur-
rency as follows:
• Assets and liabilities for each subsidiary are translat-
ed into DKK at the closing rate at the balance sheet
date.
Note 1.1
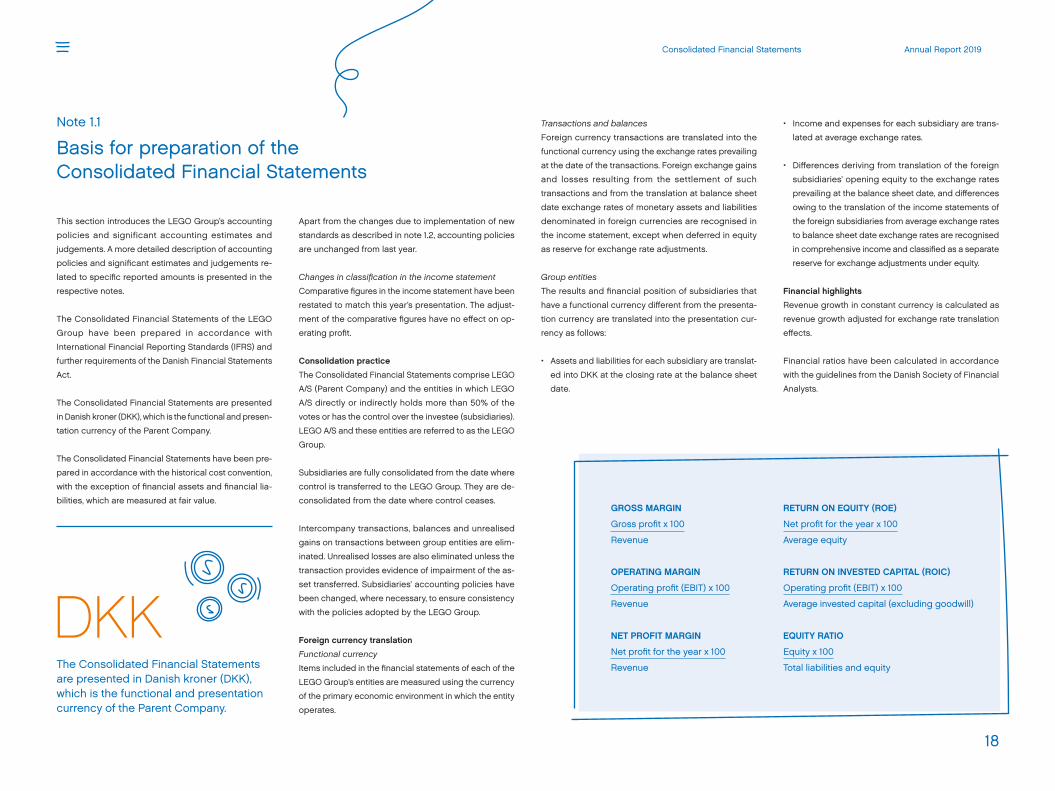
The Consolidated Financial Statements are presented in Danish kroner (DKK), which is the functional and presentation currency of the Parent Company.
• Income and expenses for each subsidiary are trans-
lated at average exchange rates.
• Differences deriving from translation of the foreign
subsidiaries’ opening equity to the exchange rates
prevailing at the balance sheet date, and differences
owing to the translation of the income statements of
the foreign subsidiaries from average exchange rates
to balance sheet date exchange rates are recognised
in comprehensive income and classified as a separate
reserve for exchange adjustments under equity.
Financial highlights
Revenue growth in constant currency is calculated as
revenue growth adjusted for exchange rate translation
effects.
Financial ratios have been calculated in accordance
with the guidelines from the Danish Society of Financial
Analysts.
GROSS MARGIN
Gross profit x 100
Revenue
OPERATING MARGIN
Operating profit (EBIT) x 100
Revenue
NET PROFIT MARGIN
Net profit for the year x 100
Revenue
RETURN ON EQUITY (ROE)
Net profit for the year x 100
Average equity
RETURN ON INVESTED CAPITAL (ROIC)
Operating profit (EBIT) x 100
Average invested capital (excluding goodwill)
EQUITY RATIO
Equity x 100
Total liabilities and equity
Annual Report 2019
18
Consolidated Financial Statements

• A single discount rate has been applied to appropriate
groups of leases with similar characteristics.
• Existing assessments of whether leases are onerous
have been applied.
• The use of hindsights, such as in determining the
lease term if the contracts contain options to extend
or terminate the lease.
No other practical expedients beyond above have been
applied.
There are no lease assets that meet the definition of
investment property.
Impact
The operating lease commitments at 31 December 2018
disclosed in the Annual Report and lease liabilities
recognised in the opening balance at 1 January 2019
in accordance with IFRS 16 can be specified as
follows:
Effects of new and amended accounting standards
Note 1.2
All amended standards and interpretations issued by IASB
and endorsed by the EU effective as of 1 January 2019
have been adopted by the LEGO Group.
From 1 January 2019, the LEGO Group has adopted the
following new standards:
• IFRS 16 Leases
• IFRIC 23 Uncertainty over Income Tax Treatments
IFRS 16 Leases
Description
IFRS 16 has been implemented as of 1 January 2019. The
standard supersedes existing leases guidance in IAS 17
Leases and related interpretations.
Implementation of IFRS 16 has had a material effect on
the LEGO Group’s balance sheet. Previously, lease
contracts for a lessee were classified as either operating
or finance leases. IFRS 16 requires the majority of
operating leases to be recognised as lease assets with
related lease liability, similar to the previous accounting
of finance leases.
The lease payments, previously accounted for as oper-
ating expenses, have been split into an interest expense
and a repayment of the lease liability. The right-of-use
assets are depreciated over the term of the lease con-
tract. Reported operating profit has increased, as previ-
ous operating lease expenses included under cost have
been replaced by depreciations and financial expenses.
The impact on profit is neutral over time, but a minor
timing effect does occur due to frontloading of interest
expenses.
Reported cash flow from operating activities has in-
creased but is offset by an increased cash outflow from
financing activities. Accordingly, total cash flow for the
year is unchanged.
Implementation
The LEGO Group adopted IFRS 16 using the modified
retrospective approach according to which comparative
figures are not restated but presented in accordance
with the previous IFRS standard on leases (IAS 17) as
disclosed in the Annual Report 2018. Right-of-use assets
have been presented as a separate line-item in the
balance sheet and specified further in note 4.4 Leases.
For existing leases classified as operating leases under
IAS 17, lease liabilities have been measured at the pre-
sent value of the remaining lease payments discounted
using an appropriate incremental borrowing rate at
1 January 2019.
For existing leases classified as finance leases under
IAS 17, the carrying amount of lease liabilities and right-
of-use assets at 1 January 2019 equals the carrying
amount of lease liabilities and lease assets at 31
December 2018.
The following practical expedients have been applied
in implementing the standard:
• Contracts not previously determined to contain a
lease in accordance with IAS 17 and IFRIC 4 have not
been reassessed at the commencement date.
• Right-of-use assets and related lease liabilities for
existing leases ending within 12 months of 1 January
2019 or leases considered to be low value are not
recognised.
(mDKK)
Operating lease commitments (not discounted) disclosed in the notes at 31 December 2018 2,600
+ Commitments not part of the notes 31 December 2018 103
Other adjustments (4)
Undiscounted lease liability 2,709
Discounting effect (311)
+ Finance lease liabilities recognised in the balance sheet at 31 December 2018 10
Lease liability recognised at 1 January 2019 2,398
The weighted average incremental borrowing rate ap-
plied to the lease liabilities at 1 January 2019 was 3.6%.
The right-of-use assets established at 1 January 2019 in
the balance sheet were DKK 2.4 billion. The right-of-use
assets are adjusted for lease incentives received
(straight-line amount in the balance per 31 December
2018).
IFRIC 23 Uncertainty over Income Tax Treatments
The implementation of the guidelines in IFRIC 23 for
accounting for uncertain income tax positions has not
resulted in any change to the net amount of tax
positions.
Annual Report 2019
19
Consolidated Financial Statements

Significant accounting estimates and judgements
Note 1.3
When preparing the Consolidated Financial Statements
it is necessary that Management makes a number of
accounting estimates and judgements that affect the
reported amounts of assets and liabilities and the re-
ported amounts of revenue and expenses.
Estimates and judgements used in the determination of
reported results are continuously evaluated.
The key accounting estimates identified are those that
have a significant risk of resulting in a material adjustment.
The estimates are expectations of the future or other
sources of estimation uncertainty based on assumptions.
These assumptions are to the extent possible supported
by historical trends or reasonable expectations.
Management believes that the estimates are the most likely
outcome of future events. Management bases the esti-
mates on historical experience and other assumptions that
Management assesses are reasonable under the given
circumstances. Actual results may differ from these esti-
mates under different assumptions or conditions.
Accounting judgements are made when applying ac-
counting policies. Key accounting judgements are the
judgements made, that can have significant impact on
the amounts recognised in the Financial Statements.
Further information can be obtained for the areas that in-
volve a high degree of estimation and judgement and are
material to the financial statements in the respective notes.
Note Key accounting estimate and judgements
3.2 Property, plant and equitment Estimate of residual value and useful life of assets
3.3 Inventories Estimate and judgements in calculation of indirect production cost
3.4 Trade receivables Estimate level of expected losses
Annual Report 2019
20
Consolidated Financial Statements

38.5 bn
RevenueNote 2.1
Accounting policies
Revenue recognition
Revenue is recognised when the LEGO Group fulfils its
contractual performance obligations towards the buyer,
and the transaction is related to the main activities.
Revenue from the sale of goods
Revenue from sale of goods is recognised when control
over the goods has been transferred to the buyer. This
condition is usually met by the time the products are
delivered to the customer and legal title transfers.
Revenue is measured at the transaction price to which
the LEGO Group expects to be entitled. Transaction
price includes variable amounts (rebates, sales incen-
tives and provisions for returned products etc.), thus the
variable amount is recognised as revenue only when it
is highly probable that a significant reversal will not
occur.
Provisions and accruals for rebates, sales incentives and
return of products are made in the period in which the
related sales are recorded. Historical data are readily
available and reliable and are used for estimating the
amount of the reduction in sales.
Sale of goods that results in award credits under the
LEGO Group’s consumer loyalty programme, is account-
ed for by allocating the transaction price between the
goods supplied and the award credits granted based
on a relative stand-alone selling price. The loyalty pro-
gramme is a separate performance obligation, as the
loyalty programme points are considered a material
right derived from the contract entered at the time of
purchase. Revenue from the award credits is recognised
when they are redeemed or when they expire.
(mDKK) 2019 2018
Sale of goods 38,093 35,882
Licence income 451 509
Total revenue 38,544 36,391
Sales of goods per region
Americas 14,328 13,769
Europe, Middle East & Africa 17,089 16,644
Asia & Pacific 6,676 5,469
38,093 35,882
Total revenue for the LEGO Group
Revenue from royalty and licence agreements
Licence fees are recognised as revenue when the per-
formance obligations in the relevant agreements have
been satisfied.
Revenue is measured at the transaction price to which
the LEGO Group expects to be entitled.
Revenue from licence agreements comprises both
agreements where performance obligations are satis-
fied over time such as sales-based agreements which
most of the LEGO Group licence revenue is related to,
and agreements where performance obligations are
satisfied at a point in time, which would normally be
upon delivery.
Licence revenue is recognised based on a classification
of either a “right to use” or “right to access” as described
below.
Right to access
Revenue derived from the LEGO® trademark is generally
considered a “right to access” and performance obliga-
tions related to licence income of this nature are satis-
fied over time. Licences with a “right to access” com-
prise income from console games, movies, mobile and
tablet platforms, and outbound licensing business gen-
erating sales based royalty fees for intellectual proper-
ties related to content like stories, style guides and
prints.
Revenue based on a right to access is recognised
based on the licensee’s actual sales or forecasts, which
in all material aspects corresponds with the value-add
to the licence partner. The process is therefore assessed
to give a faithful depiction of the transfer of licence
income.
Right to use
All other licence revenues are per definition perfor-
mance obligations satisfied at a point in time (“right to
use”). Revenue is recognised at a point in time, where
the customer directly uses and obtains substantially all
the benefits from the licence, at the point when control
is transferred to the licensee. Revenue recognised at a
point in time will primarily be related to media content
produced by the LEGO Group. Media content has sig-
nificant standalone functionality and the LEGO Group
does not affect the intellectual properties after the right
to use occurs. Revenue is recognised when the control
of the content has been transferred to the customer.
Annual Report 2019
21
Consolidated Financial Statements

Expenses by natureNote 2.2
(mDKK) Note 2019 2018
Raw materials and consumables used 5,603 5,401
Employee costs 2.3 7,047 6,482
Depreciation and amortisation 2.4 1,963 1,329
Licence and royalty expenses 2,777 2,689
Other external expenses 10,317 9,716
Total expenses 27,707 25,617
Included in the income statement under the following headings:
Production costs 10,791 10,417
Sales and distribution expenses 11,893 10,971
Administrative and IT expenses 2,848 2,246
Other operating expenses 2,175 1,983
27,707 25,617
Sales and distribution expenses
Sales and distribution expenses comprise expenses
related to sales and distribution staff, advertising and
marketing expenses, write-down of receivables as well
as depreciation, amortisation and impairment.
Administrative and IT expenses
Administrative and IT expenses comprise expenses
for IT, Facility, Human Resources, Finance, Legal and
Management, including depreciation and impairment.
Other operating expenses
Other operating expenses include research and devel-
opment expenses, trademark royalty and other operat-
ing costs.
For more information see note Research and develop-
ment expenses note 2.5.
Accounting policies
Expenses by nature discloses information about ex-
penses arising from the main inputs that are consumed
in order to accomplish the LEGO Group’s activities, such
as expenses related to materials and consumables, em-
ployees, depreciation and amortisation, licence and
royalty. Information about how costs are allocated to
functions within the LEGO Group’s business is disclosed
in the income statement.
Expenses by function allocates and combines expenses
according to the activity from which the cost arises, as
follows:
Production costs
Production costs include direct and indirect costs relat-
ed to production including movements in volumes on
inventory and related inventory re-evaluation. Direct
costs comprise raw materials, consumables and direct
labour costs. Indirect costs comprise other costs related
to production of goods including depreciation, amorti-
sation and impairment on production related material
and other supply chain related costs.
Annual Report 2019
22
Consolidated Financial Statements

(mDKK) Note 2019 2018
Wages and salaries 6,336 5,855
Pension costs 3.5 238 215
Social security and other costs 510 445
Employee costs before transfers to assets 7,084 6,515
Transfers to assets (37) (33)
Total employee costs 7,047 6,482
Included in the income statement under the following headings:
Production costs 2,116 1,898
Sales and distribution expenses 2,948 2,708
Administrative and IT expenses 1,540 1,459
Other operating expenses 443 417
7,047 6,482
Average number of full-time employees 16,112 15,050
Headcount end of year 18,800 17,385
Employee costsNote 2.3
Accounting policies
Wages and salaries, social security costs, leave and sick
leave, bonuses and non-monetary employee benefits
are recognised in the financial year in which the services
are rendered. Whenever the LEGO Group provides long-
term employee benefits, the costs are accrued to match
the rendering of the services by the employees.
Benefit costs and obligations towards employees are
specified in note 3.5.
Annual Report 2019
23
Consolidated Financial Statements

Depreciation, amortisation and impairment
Note 2.4
(mDKK) Note 2019 2018
Intangible assets, amortisation 3.1 112 87
Property, plant and equipment, depreciations 3.2 1,282 1,242
Right-of-use assets, depreciations 4.4 569 –
Total depreciations, amortisation and impairment 1,963 1,329
Included in the income statement under the following headings:
Production costs 1,206 1,096
Sales and distribution expenses 507 137
Administrative and IT expenses 250 96
1,963 1,329
Accounting policies
Depreciation and amortisation
Depreciations and amortisations are recognised in the
income statement within production costs, sales and
distribution and administrative and IT expenses.
Impairment
Any impairment losses are expensed in the income state-
ment together with depreciation and amortisation.
For more information see Intangible assets note 3.1,
Property, plant and equipment note 3.2 and Leases note
4.4.
Research and development expenses
Note 2.5
(mDKK) 2019 2018
Research and development expenses 768 689
Total research and development expenses 768 689
Accounting policies
Research and development expenses are expenses
that do not meet the criteria for asset recognition.
These are expensed as incurred and include costs
like wages, salaries and consumables.
For more information see Intangible assets note 3.1.
Annual Report 2019
24
Consolidated Financial Statements

Continue reading
TaxNote 2.6
(mDKK) 2019 2018
Current income tax charge for the year 2,393 2,381
Other tax for the year 59 53
Deferred tax change for the year (31) 30
Deferred tax impact of change in tax rates – 3
Adjustment of current tax for prior years 42 50
Adjustment of deferred tax for prior years (17) (83)
Total income tax expense 2,446 2,434
Reconciliation of tax
Profit before tax 10,752 10,510
Corporate tax rate in Denmark, 22% 2,365 2,312
Higher/lower tax rate in subsidiaries (138) 15
Non-taxable income (5) (4)
Non-deductible expenses 11 30
Deferred tax not recognised on losses arising in the year 15 27
Deferred tax impact of change in tax rates – 3
Adjustment to tax for prior years 25 (33)
Corporate withholding taxes 34 34
Other corporate taxes 25 19
Other 114 31
2,446 2,434
Effective tax rate 22.7% 23.2%
(mDKK) 2019 2018
Deferred tax
Deferred tax, net at 1 January 504 433
Change in tax rates recognised in income statement – (3)
Exchange rate adjustment 9 11
Income statement charge 48 53
Charged to comprehensive income 9 10
Deferred tax, net at 31 December 570 504
Deferred tax is recognised in the balance sheet as follows:
Deferred tax assets 738 638
Deferred tax liabilities (168) (134)
570 504
Annual Report 2019
25
Consolidated Financial Statements
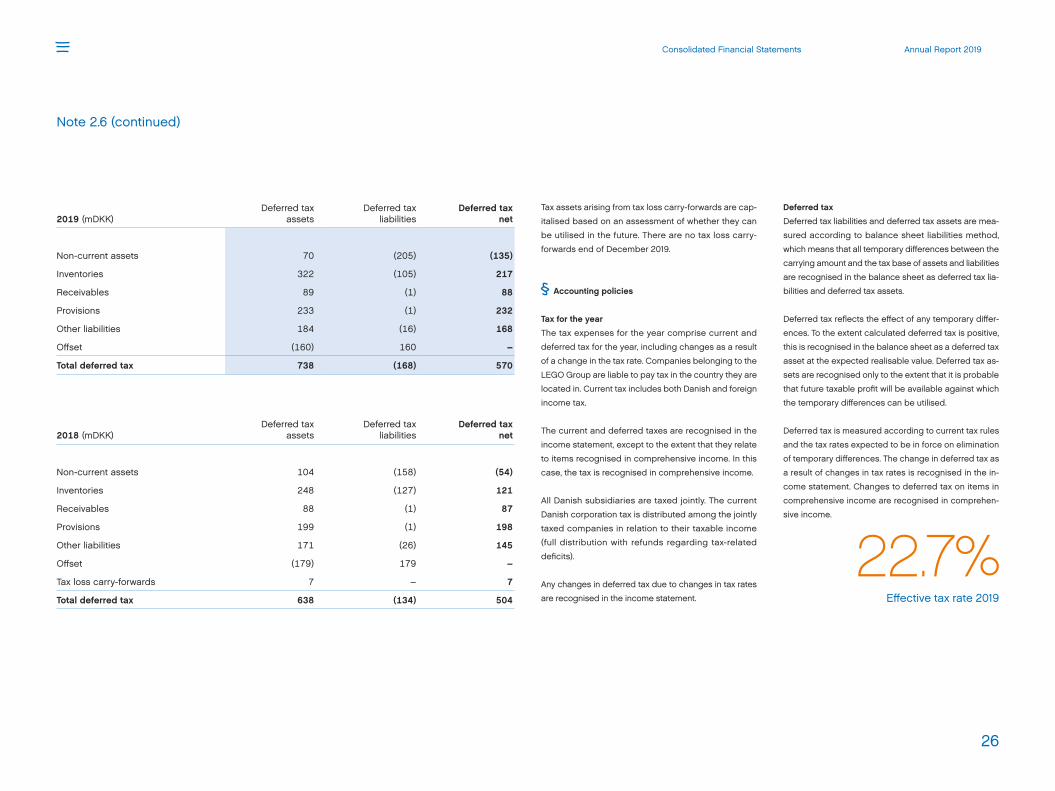
2019 (mDKK)Deferred tax
assetsDeferred tax
liabilitiesDeferred tax
net
Non-current assets 70 (205) (135)
Inventories 322 (105) 217
Receivables 89 (1) 88
Provisions 233 (1) 232
Other liabilities 184 (16) 168
Offset (160) 160 –
Total deferred tax 738 (168) 570
2018 (mDKK)Deferred tax
assetsDeferred tax
liabilitiesDeferred tax
net
Non-current assets 104 (158) (54)
Inventories 248 (127) 121
Receivables 88 (1) 87
Provisions 199 (1) 198
Other liabilities 171 (26) 145
Offset (179) 179 –
Tax loss carry-forwards 7 – 7
Total deferred tax 638 (134) 504
Note 2.6 (continued)
Accounting policies
Tax for the year
The tax expenses for the year comprise current and
deferred tax for the year, including changes as a result
of a change in the tax rate. Companies belonging to the
LEGO Group are liable to pay tax in the country they are
located in. Current tax includes both Danish and foreign
income tax.
The current and deferred taxes are recognised in the
income statement, except to the extent that they relate
to items recognised in comprehensive income. In this
case, the tax is recognised in comprehensive income.
All Danish subsidiaries are taxed jointly. The current
Danish corporation tax is distributed among the jointly
taxed companies in relation to their taxable in come
(full distribution with refunds regarding tax-related
deficits).
Any changes in deferred tax due to changes in tax rates
are recognised in the income statement.
Deferred tax
Deferred tax liabilities and deferred tax assets are mea-
sured according to balance sheet liabilities method,
which means that all temporary differences between the
carrying amount and the tax base of assets and liabilities
are recognised in the balance sheet as deferred tax lia-
bilities and deferred tax assets.
Deferred tax reflects the effect of any temporary differ-
ences. To the extent calculated deferred tax is positive,
this is recognised in the balance sheet as a deferred tax
asset at the expected realisable value. Deferred tax as-
sets are recognised only to the extent that it is probable
that future taxable profit will be available against which
the temporary differences can be utilised.
Deferred tax is measured according to current tax rules
and the tax rates expected to be in force on elimination
of temporary differences. The change in deferred tax as
a result of changes in tax rates is recognised in the in-
come statement. Changes to deferred tax on items in
comprehensive income are recognised in comprehen-
sive income.
Effective tax rate 2019
22.7%
Tax assets arising from tax loss carry-forwards are cap-
italised based on an assessment of whether they can
be utilised in the future. There are no tax loss carry-
forwards end of December 2019.
Annual Report 2019
26
Consolidated Financial Statements

Continue reading
2019 (mDKK)
Develop-ment
projectsin progress Software
Licences,patents andother rights Goodwill Total
Cost at 1 January 93 478 235 – 806
Additions 13 45 4 284 346
Disposals – (1) – – (1)
Transfers (93) 93 – – –
Exchange rate adjustments – 1 4 – 5
Cost at 31 December 13 616 243 284 1,156
Amortisation and impairment losses at 1 January – 331 222 – 553
Amortisation for the year – 100 12 – 112
Disposals – (1) – – (1)
Exchange rate adjustments – 1 3 – 4
Amortisation and impairment losses at 31 December – 431 237 – 668
Carrying amount at 31 December 13 185 6 284 488
Intangible assetsNote 3.1
2018 (mDKK)
Develop-ment
projectsin progress Software
Licences,patents andother rights Total
Cost at 1 January 71 516 225 812
Additions 54 – – 54
Disposals – (70) – (70)
Transfers (32) 32 – –
Exchange rate adjustments – – 10 10
Cost at 31 December 93 478 235 806
Amortisation and impairment losses at 1 January – 324 201 525
Amortisation for the year – 76 11 87
Disposals – (70) – (70)
Exchange rate adjustments – 1 10 11
Amortisation and impairment losses at 31 December – 331 222 553
Carrying amount at 31 December 93 147 13 253
Annual Report 2019
27
Consolidated Financial Statements

Note 3.1 (continued)
Accounting policies
Development projects in progress
Development projects in progress are currently running
projects, primarily within software development. Devel-
op ment projects in progress cover non-finalised projects
at the balance sheet date.
Development projects in progress that are clearly de-
fined and identifiable, where the technical feasibility,
sufficient resources and a potential future market or uti-
lisation opportunity within the company is demonstrated,
and where the company intends to produce, market or
use the project, are recognised as intangible assets pro-
vided that the cost can be measured reliably and that
there is sufficient assurance that future earnings or the
net selling price can cover cost of sales, selling and dis-
tribution costs and administrative expenses and devel-
opment costs. Other development costs are recognised
in the income statement as incurred.
Recognised development costs are measured at cost
less impairment. Cost includes direct and indirect
expenses directly attributable to the asset until the
asset is ready for use as intended.
Development projects in progress are annually tested
for impairment. Development projects in progress are
written down to the lower of recoverable amount and
carrying amount.
Software
Software comprises mainly internally developed software
for the purpose of supporting business operations.
Software is capitalised based on the costs incurred.
Software is amortised on a straight-line basis over the
expected useful life, which is estimated at 3-5 years.
Residual value is set at DKK 0. Useful lives are reviewed
and adjusted at each balance sheet date, if appropriate.
Software is tested for impairment in case of indications
hereof and written down to the lower of recoverable
amount and carrying amount.
Licences, patents and other rights
Licences, patents and other rights are capitalised based
on the costs incurred.
Licenses, patents and other rights are amortised over
the shorter of their estimated useful lives and the con-
tractual duration, which is usually 5-10 years. Residual
values is set at DKK 0. Useful lives are reviewed and
adjusted at each balance sheet date, if appropriate.
Goodwill
Goodwill acquired in business combinations is recog-
nised and measured as the difference between the total
of the fair value of the consideration transferred and the
fair value of the identifiable net assets of the date of ac-
quisition. Goodwill is not amortised but is reviewed for
impairment at least annually. For the purpose of impair-
ment testing, goodwill is allocated to the lowest possible
cash-generating unit expected to benefit from the syn-
ergies of the combination. Cash-generating units to which
goodwill has been allocated are tested for impairment
annually, or more frequently when there is an indication
that the unit may be impaired. If the recoverable amount
of the cash-generating unit is less than the carrying
amount of the unit, the impairment loss is allocated first
to reduce the carrying amount of any goodwill allocated
to the unit and then to the other assets of the unit pro-rata
on the basis of the carrying amount of each asset in the
unit. An impairment loss recognised for goodwill is not
reversed in a subsequent period.
Annual Report 2019
28
Consolidated Financial Statements

Continue reading
2019 (mDKK)
Land, buildings
and instal-lations
Plant and machinery
Other fixtures
and fittings, tools and
equipment
Fixed assets
under con-struction Total
Cost at 1 January 6,632 8,736 2,576 2,140 20,084
Additions 75 586 234 932 1,827
Disposals (12) (404) (192) – (608)
Transfers 1,021 237 530 (1,788) –
Exchange rate adjustments 62 1 35 68 166
Reclassification of financial leases (44) – – – (44)
Cost at 31 December 7,734 9,156 3,183 1,352 21,425
Depreciation and impairment losses at 1 January 1,379 5,600 1,384 – 8,363
Depreciation for the year 199 854 229 – 1,282
Disposals (4) (399) (175) – (578)
Exchange rate adjustments 16 3 21 – 40
Reclassification of financial leases (38) – – – (38)
Depreciation and impairment losses at 31 December 1,552 6,058 1,459 – 9,069
Carrying amount at 31 December 6,182 3,098 1,724 1,352 12,356
Property, plant and equipmentNote 3.2
2018 (mDKK)
Land, buildings
and instal-lations
Plant and machinery
Other fixtures
and fittings, tools and
equipment
Fixed assets
under con-struction Total
Cost at 1 January 6,500 8,468 2,510 1,386 18,864
Additions 73 353 72 950 1,448
Disposals (51) (177) (66) – (294)
Transfers 110 127 30 (267) –
Exchange rate adjustments – (35) 30 71 66
Cost at 31 December 6,632 8,736 2,576 2,140 20,084
Depreciation and impairment losses at 1 January 1,200 4,932 1,206 – 7,338
Depreciation for the year 180 849 213 – 1,242
Disposals (8) (166) (59) – (233)
Exchange rate adjustments 7 (15) 24 – 16
Depreciation and impairment losses at 31 December 1,379 5,600 1,384 – 8,363
Carrying amount at 31 December 5,253 3,136 1,192 2,140 11,721
Including assets under finance leases 6 – – – 6
Annual Report 2019
29
Consolidated Financial Statements

Note 3.2 (continued)
Significant accounting estimates and
judgements
Assessment of residual value and useful life of property,
plant and equipment requires estimates. When perform-
ing estimates for residual value and useful life
Management uses historical experience and other rel-
evant factors, such as expectation of future use of the
tangible assets. It is Management’s assessment that the
estimates are reasonable.
The cost of self-constructed assets comprises direct
expenses such as wage consumption, materials and
indirect expenses to the extent, that it directly supports
the asset construction.
Subsequent expenditure for improvements and mainte-
nance is allocated to the asset cost price if future eco-
nomic benefits are likely. General repair and maintenance
is expensed in the income statement as incurred.
Depreciation and impairment
Depreciation is calculated on a straight-line basis to
allocate the cost of each asset to its residual value.
Depreciations are calculated based on the following
estimated useful lives:
Buildings 40 years
High bay warehouses 40 years
Installations 5-20 years
Plant and machinery 5-15 years
Moulds 2 years
Furniture, fittings and equipment 3-10 years
Land is not depreciated.
Depreciation commences when the asset is acquired or
when the asset is ready for use as intended.
Useful lives of the assets and residual values are reviewed
and adjusted at each balance sheet date, if appropriate.
Gains and losses on disposals are determined by com-
paring the proceeds with the carrying amount and are
recognised in the income statement.
Accounting policies
Land and buildings comprise mainly factories, ware-
houses and offices. Plant and machinery are mainly
moulds, moulding machines, processing and packing
equipment. Whilst other fixtures, fittings, tools and equip-
ment mainly comprise high bay warehouse equipment,
lease hold improvements, measuring and testing equip-
ment, furniture and IT hardware.
Property, plant and equipment are measured at cost,
less subsequent depreciation and impairment, except
for land, which is measured at cost less impairment.
Cost
Cost comprises acquisition price and expenses directly
related to the acquisition until the time when the asset
is ready for use as intended.
An obligation regarding the purchase of property, plant
and equipment of DKK 524 million exists at 31 December
2019 (DKK 850 million at 31 December 2018).
The obligation has a maturity of maximum 3 years.
InventoriesNote 3.3
(mDKK) 2019 2018
Raw materials 199 163
Work in progress 1,202 1,139
Finished goods 1,271 1,277
Total inventories 2,672 2,579
Inventories recognised as an expense during the year
ending 31 December 2019 amounted to DKK 7,787 million
(DKK 7,441 million in 2018). These were included in pro-
duction cost in the income statement.
Write-downs of inventories are recognised in produc-
tion costs as a cost of DKK 25 million (DKK 5 million as
an income in 2018).
Accounting policies
Inventories are valuated at the lower of cost and net
realisable value. Cost is accounted for on a first-in, first-
out basis (FIFO). Cost comprises direct materials, direct
labour and an appropriate proportion of variable and
fixed overhead expenditure (indirect production costs),
the latter being allocated on the basis of normal produc-
tion capacity. Costs of purchased inventory are deter-
mined after deducting rebates and discounts. Net real-
isable value is the estimated selling price in the ordinary
course of business less the estimated costs of comple-
tion and the estimated costs necessary to make the sale.
Significant accounting estimates
Calculation of indirect production costs requires esti-
mates of various assumptions such as estimation of
normal production capacity and cost base. The sensi-
tivity of the measurement to these assumptions can be
significant. It is the assessment of Management that the
assumptions and estimates made are reasonable.
Annual Report 2019
30
Consolidated Financial Statements

The age distribution of trade receivables is as follows:
2019 (mDKK)Gross carrying
amountProvision for
bad debtsNet carrying
amount
Not overdue 7,145 (343) 6,802
0-60 days overdue 358 (24) 334
61-120 days overdue 11 (3) 8
121-180 days overdue 14 (4) 10
More than 180 days overdue 513 (466) 47
8,041 (840) 7,201
2018 (mDKK)Gross carrying
amountProvision for
bad debtsNet carrying
amount
Not overdue 6,624 (368) 6,256
0-60 days overdue 580 (120) 460
61-120 days overdue 34 (10) 24
121-180 days overdue 8 (2) 6
More than 180 days overdue 353 (333) 20
7,599 (833) 6,766
Significant accounting estimates
Management makes allowance for doubtful trade re-
ceivables in anticipation of estimated losses resulting
from the subsequent inability of customers to make re-
quired payments. Management analyses trade receiv-
ables and examines historical bad debt, customer con-
centrations, customer creditworthiness, payment history,
changes in customer payment terms and expectations
for the future. It is Management’s assessment that the
estimates are reasonable.
(mDKK) 2019 2018
Trade receivables (gross) 8,041 7,599
Provision for bad debts
Balance at 1 January (833) (586)
Change in provision for the year 5 (247)
Realised losses for the year 9 9
Exchange rate adjustments (21) (9)
Balance at 31 December (840) (833)
Trade receivables (net) 7,201 6,766
Trade receivablesNote 3.4
All trade receivables fall due within one year. Due to the
short-term nature of the trade receivables, their carrying
amount is considered to be approximately the same as
their fair value.
The LEGO Group has no significant trade receivables
concentrated in specific countries, but has some single
significant trade debtors. The LEGO Group has fixed
procedures for determining the LEGO Group’s granting
of credit. The LEGO Group’s risk relating to trade receiv-
ables is considered to be moderate. For more informa-
tion, see note 4.6
Accounting policies
Trade receivables are initially recognised at fair value
equal to the transaction price, and subsequently mea-
sured at amortised cost less allowance for lifetime ex-
pected credit losses.
Trade receivables are written off when all possible op-
tions have been exhausted and there are no reasonable
expectations of recovery.
The LEGO Group applies the IFRS 9 simplified approach
to measure expected credit loss and a lifetime expected
loss allowance for all trade receivables.
Exposure to credit risk on trade receivables is guided
by the LEGO Group’s policies. Credit limits are set based
on the customer’s financial position and current market
conditions.
Annual Report 2019
31
Consolidated Financial Statements

Continue reading
(mDKK) 2019 2018
The amounts recognised in the balance sheet are calculated as follows:
Present value of funded obligations (169) (140)
Fair value of plan assets 165 139
(4) (1)
Present value of unfunded obligations (205) (160)
Net liability recognised in the balance sheet (209) (161)
Of which included as part of the liabilities (209) (161)
The change in present value of defined benefit obligations for the year is as follows:
Present value at 1 January (300) (325)
Exchange rate adjustments (7) (4)
Benefit costs relating to current year (13) (13)
Benefit costs relating to prior year (1) (1)
Interest expenses (9) (9)
Remeasurement (losses)/gains (57) 35
Benefits paid 13 17
Present value at 31 December (374) (300)
The change in fair value of plan assets for the year is as follows:
Plan assets at 1 January 139 141
Exchange rate adjustments 5 –
Interest income 4 3
Remeasurement gains/(losses) 22 (7)
Employer contributions 3 14
Benefits paid (8) (12)
Plan assets at 31 December 165 139
Movements in the net liability recognised in the balance sheet are as follows:
Net liability at 1 January (161) (184)
Exchange rate adjustments (2) (4)
Total expenses charged to the income statement (19) (20)
Total (expenses)/income charged to comprehensive income (35) 28
Contributions paid 8 19
Net liability at 31 December (209) (161)
The actual return on plan assets amounts to 26 (4)
Defined contribution plans
The LEGO Group operates a number of defined contri-
bution plans throughout the world. Defined contribution
plans are fixed contributions paid to external pension
funds after which the LEGO Group has no further legal
nor constructive obligation towards current or past em-
ployees. DKK 224 million (DKK 201 million in 2018) have
been recognised in the income statement as pension
costs relating to defined contribution plans.
Defined benefit plans
In a few countries, the LEGO Group operates defined
benefit plans. The majority of the defined benefit plans
in the LEGO Group includes employees in Germany,
Mexico and in the US. Defined benefit plans are obliga-
tions to pay a specific benefit upon retirement or in
health related situations etc. The LEGO Group bears the
risk and uncertainty as regards sufficient funds being
available in the future. The LEGO Group does not enter
into new defined benefit pension plans. In the LEGO
Group a net obligation of DKK 209 million (DKK 161 mil-
lion in 2018) has been recognised relating to the LEGO
Group’s obligations towards current or past employees
concerning defined benefit plans. The obligation is cal-
culated after deduction of the plan assets. DKK 19 million
(DKK 20 million in 2018) have been recognised in the
income statement as costs and DKK 35 million (DKK 28
million as an income in 2018) have been recognised in
comprehensive income as a cost.
Employee benefit obligations
Note 3.5
Annual Report 2019
32
Consolidated Financial Statements
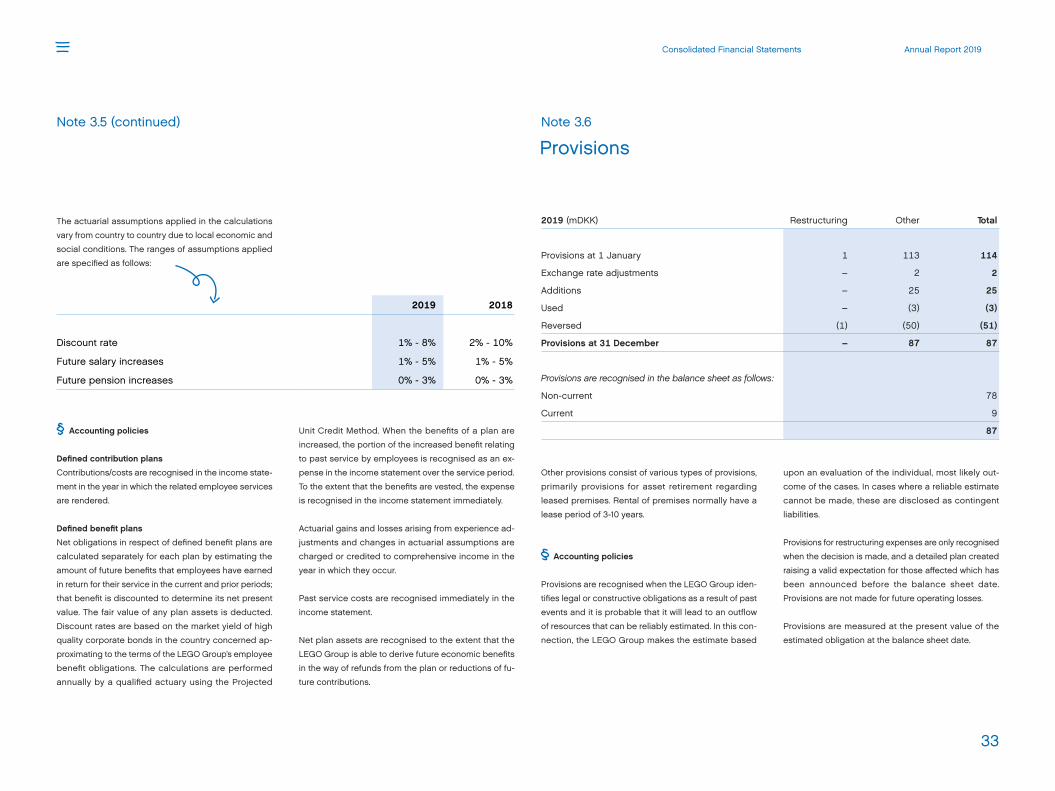
2019 2018
Discount rate 1% - 8% 2% - 10%
Future salary increases 1% - 5% 1% - 5%
Future pension increases 0% - 3% 0% - 3%
Note 3.5 (continued)
The actuarial assumptions applied in the calculations
vary from country to country due to local economic and
social conditions. The ranges of assumptions applied
are specified as follows:
Accounting policies
Defined contribution plans
Contributions/costs are recognised in the income state-
ment in the year in which the related employee services
are rendered.
Defined benefit plans
Net obligations in respect of defined benefit plans are
calculated separately for each plan by estimating the
amount of future benefits that employees have earned
in return for their service in the current and prior periods;
that benefit is discounted to determine its net present
value. The fair value of any plan assets is deducted.
Discount rates are based on the market yield of high
quality corporate bonds in the country concerned ap-
proximating to the terms of the LEGO Group’s employee
benefit obligations. The calculations are performed
annually by a qualified actuary using the Projected
Unit Credit Method. When the benefits of a plan are
increased, the portion of the increased benefit relating
to past service by employees is recognised as an ex-
pense in the income statement over the service period.
To the extent that the benefits are vested, the expense
is recog nised in the income statement immediately.
Actuarial gains and losses arising from experience ad-
justments and changes in actuarial assumptions are
charged or credited to comprehensive income in the
year in which they occur.
Past service costs are recognised immediately in the
income statement.
Net plan assets are recognised to the extent that the
LEGO Group is able to derive future economic benefits
in the way of refunds from the plan or reductions of fu-
ture contributions.
ProvisionsNote 3.6
2019 (mDKK) Restructuring Other Total
Provisions at 1 January 1 113 114
Exchange rate adjustments – 2 2
Additions – 25 25
Used – (3) (3)
Reversed (1) (50) (51)
Provisions at 31 December – 87 87
Provisions are recognised in the balance sheet as follows:
Non-current 78
Current 9
87
Other provisions consist of various types of provisions,
primarily provisions for asset retirement regarding
leased premises. Rental of premises normally have a
lease period of 3-10 years.
Accounting policies
Provisions are recognised when the LEGO Group iden-
tifies legal or constructive obligations as a result of past
events and it is probable that it will lead to an outflow
of resources that can be reliably estimated. In this con-
nection, the LEGO Group makes the estimate based
upon an evaluation of the individual, most likely out-
come of the cases. In cases where a reliable estimate
cannot be made, these are disclosed as contingent
liabilities.
Provisions for restructuring expenses are only recognised
when the decision is made, and a detailed plan created
raising a valid expectation for those affected which has
been announced before the balance sheet date.
Provisions are not made for future operating losses.
Provisions are measured at the present value of the
estimated obligation at the balance sheet date.
Annual Report 2019
33
Consolidated Financial Statements
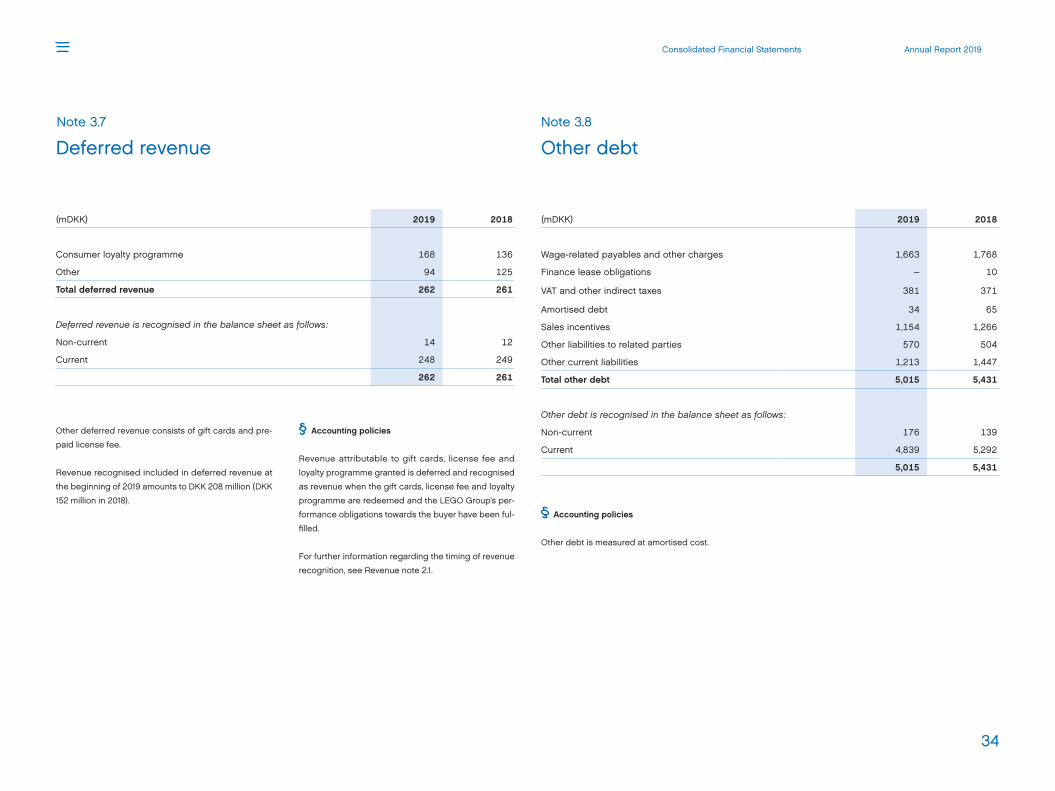
(mDKK) 2019 2018
Consumer loyalty programme 168 136
Other 94 125
Total deferred revenue 262 261
Deferred revenue is recognised in the balance sheet as follows:
Non-current 14 12
Current 248 249
262 261
Deferred revenueNote 3.7
Other deferred revenue consists of gift cards and pre-
paid license fee.
Revenue recognised included in deferred revenue at
the beginning of 2019 amounts to DKK 208 million (DKK
152 million in 2018).
Accounting policies
Revenue attributable to gift cards, license fee and
loyalty programme granted is deferred and recognised
as revenue when the gift cards, license fee and loyalty
programme are redeemed and the LEGO Group’s per-
formance obligations towards the buyer have been ful-
filled.
For further information regarding the timing of revenue
recognition, see Revenue note 2.1.
Accounting policies
Other debt is measured at amortised cost.
(mDKK) 2019 2018
Wage-related payables and other charges 1,663 1,768
Finance lease obligations – 10
VAT and other indirect taxes 381 371
Amortised debt 34 65
Sales incentives 1,154 1,266
Other liabilities to related parties 570 504
Other current liabilities 1,213 1,447
Total other debt 5,015 5,431
Other debt is recognised in the balance sheet as follows:
Non-current 176 139
Current 4,839 5,292
5,015 5,431
Other debtNote 3.8
Annual Report 2019
34
Consolidated Financial Statements

Financial income and expensesNote 4.1
(mDKK) 2019 2018
Interest income from credit institutions measured at amortised cost 5 8
Exchange gain, net 21 –
Other interest income 3 1
Financial income 29 9
(mDKK) 2019 2018
Interest expenses related to lease liabilities 88 –
Interest expenses on mortgage loans – 1
Interest expenses to related parties 14 25
Interest expenses to credit institutions 1 1
Total interest expenses measured at amortised cost 103 27
Exchange losses, net – 236
Other interest expenses 11 10
Financial expenses 114 273
Accounting policies
Financial income and expenses are recognised in the
income statement with the amounts related to the finan-
cial year.
Financial income and expenses comprise interest in-
come and expenses, realised and unrealised gains and
losses on payables/receivables and transactions in for-
eign currencies.
For all financial instruments measured at amortised cost,
interest income or expenses are recognised using the
effective interest rate. The rate is used to discount the
estimated future cash payments or receipts to the net
carrying amount of the financial asset or liability over
the expected life of the financial instrument or a shorter
period, where appropriate.
Share capitalNote 4.2
(mDKK) 2019 2018
A-shares 1 1
B-shares 9 9
C-shares 10 10
Total share capital 20 20
The share capital is divided into shares of DKK 1,000 or
multiples herof. The share capital is fully paid.
A-shares carry 10 votes per DKK 1,000 share. B-shares
carry 1 vote per DKK 1,000 share. C-shares carry 1 vote
per DKK 1,000 share.
Dividend of DKK 8,000 million was paid in April 2019,
corresponding to DKK 0.4 million per DKK 1,000 of share
capital.
Proposed dividend for 2019 is DKK 8,000 million,
corresponding to DKK 0.4 million per DKK 1,000 of share
capital.
Shareholders holding more than 5% of the share capital
or 5% of the votes:
KIRKBI A/S, Billund, Denmark
Koldingvej 2, Billund A/S, Billund, Denmark
Accounting policies
Dividends are recognised as a liability in the period in
which they are adopted at the Annual General Meeting
(declaration date).
Annual Report 2019
35
Consolidated Financial Statements

(mDKK) 2019 2018
Debt to credit institutions 157 167
Total borrowings 157 167
Borrowings are recognised in the balance sheet as follows:
Non-current liabilities 147 157
Current liabilities 10 10
157 167
BorrowingsNote 4.3
Debt to credit institutions consists of fixed rate mort-
gage loans with a remaining maturity of 14-18 years.
Accounting policies
Borrowings are initially recognised at fair value, net of
transaction expenses incurred. Borrowings are subse-
quently measured at amortised cost. Any differences
between the proceeds and the redemption value are
recognised in the income statement over the period of
the borrowings using the effective interest method.
Borrowings are classified as current liabilities unless the
LEGO Group has an unconditional right to defer settle-
ment of the liability for at least 12 months after the bal-
ance sheet date.
Annual Report 2019
36
Consolidated Financial Statements

Continue reading
LeasesNote 4.4
Right-of-use assets
2019 (mDKK)Rental ofpremises
Other assets Total
Cost at 1 January – – –
Change in accounting policy 2,186 212 2,398
Reclassifications of other debt (lease incentives) (103) – (103)
Reclassifications of financial leases 44 – 44
Reclassifications of prepayments 145 – 145
Additions and remeasurements 1,098 119 1,217
Disposals (48) (31) (79)
Exchange rate adjustments 55 – 55
Cost at 31 December 3,377 300 3,677
Depreciations at 1 January – – –
Reclassifications of financial leases 38 – 38
Depreciation for the year 467 102 569
Disposals (42) (14) (56)
Exchange rate adjustments 1 2 3
Depreciations at 31 December 464 90 554
Carrying amount at 31 December 2,913 210 3,123
Lease liabilities
Amounts recognised in the income statement
(mDKK) 2019
Lease liabilities are recognised in the balance sheet as follows:
Non-current liabilities 2,523
Current liabilities 573
Total lease liabilities 3,096
(mDKK) 2019
Expense relating to short-term leases 142
Expense relating to leases of low-value assets that are not short-term leases 13
Expense relating to variable lease payments not included in lease liability 89
244
Annual Report 2019
37
Consolidated Financial Statements

The LEGO Group leases various assets such as office
buildings, store buildings, warehouses, company cars,
forklifts etc. The leases have varying terms, clauses and
rights under normal industry practice. In determining the
lease term, all facts and circumstances that create an
economic incentive to exercise an extension option, or
not exercise termination option, are considered. Exten-
sion options (or periods after termination options) are
only included in the lease term if the lease is reasonably
certain to be extended (or terminated).
The incremental borrowing rate is determined per coun-
try and per class of underlying assets.
The total cash outflow for leases in the period was DKK
887 million.
The LEGO Group does not have significant sub-leasing
contracts.
See note 4.5 for a maturity analysis of the lease
liabilities.
The portfolio of lease commitments for short-term leases
at the end of the year, is similar to the portfolio of short-
term leases that have been expensed during the year.
The LEGO Group has entered a lease, not yet com-
menced, to which the LEGO Group is committed (DKK
1,178 million).
Please refer to note 1.2 for disclosure of the impact of
adoption of IFRS 16 on the consolidated financial
Note 4.4 (continued)
statements. The comparative information has not been
restated and continues to be reported under the ac-
counting standards in effect for those periods.
Accounting policies
The right-of-use asset and corresponding lease liability
will be recognised at the commencement date, i.e. the date
the underlying asset is available for use. The lease terms
may include options to extend or terminate the lease when
it is reasonably certain that we will exercise that option.
Right-of-use assets are measured at cost corresponding
to the lease liability recognised, adjusted for any lease
incentives received, initial direct costs and estimated
restoration costs. Depreciations are done following the
straight-line method over the lease term or the useful
life of the right-of-use assets, whichever is shortest.
The lease liabilities are measured at the present value
of lease payments to be made over the lease term. The
lease payments are discounted using the incremental
borrowing rate. The lease payments include fixed pay-
ments and variable lease payments that depend on an
index or a rate, less any lease incentives receivable. If
the contract holds an option to purchase, extend or ter-
minate a lease and it is reasonably certain to be exer-
cised by the LEGO Group, the lease payments will in-
clude those. The variable lease payments that do not
depend on an index or a rate are recognised as expense
in the period in which the event or condition that triggers
the payment occurs.
The LEGO Group applies the short-term lease recogni-
tion exemption for lease contracts that, at the com-
mencement date, have a lease term of 12 months or less
for all classes of underlying assets, and the exemption
for lease contracts for which the underlying asset is of
low value. Lease payments on short-term leases and
leases of low-value assets are recognised as expense
on a straight-line basis over the lease term.
For all classes of assets, non-lease components, i.e. ser-
vice elements, will be separated from the lease compo-
nents and thereby not form part of the right-of-use asset
and financial lease liability recognised in the balance
sheet.
Right-of-use assets classified as rental of premises and
other assets have the following lease terms:
Rental of premises 3-50 years
Other assets 2-7 years
Accounting policies before 1 January 2019
In 2018 finance leases were recognised and measured
in accordance with IAS 17.
Leases of assets where the LEGO Group has substan-
tially all risks and rewards of ownership are capitalised
as finance leases under property, plant and equipment
and depreciated over the estimated useful lives of the
assets, according to the periods listed under the section
property, plant and equipment.
The corresponding finance lease liabilities are recog-
nised in other debt and measured at fair value. The fair
value is estimated to equal the present value at expect-
ed future cash flows at a marked interest rate for similar
leases.
Operating lease expenses are recognised in the income
statement on a straight-line basis over the period of the
lease.
Annual Report 2019
38
Consolidated Financial Statements
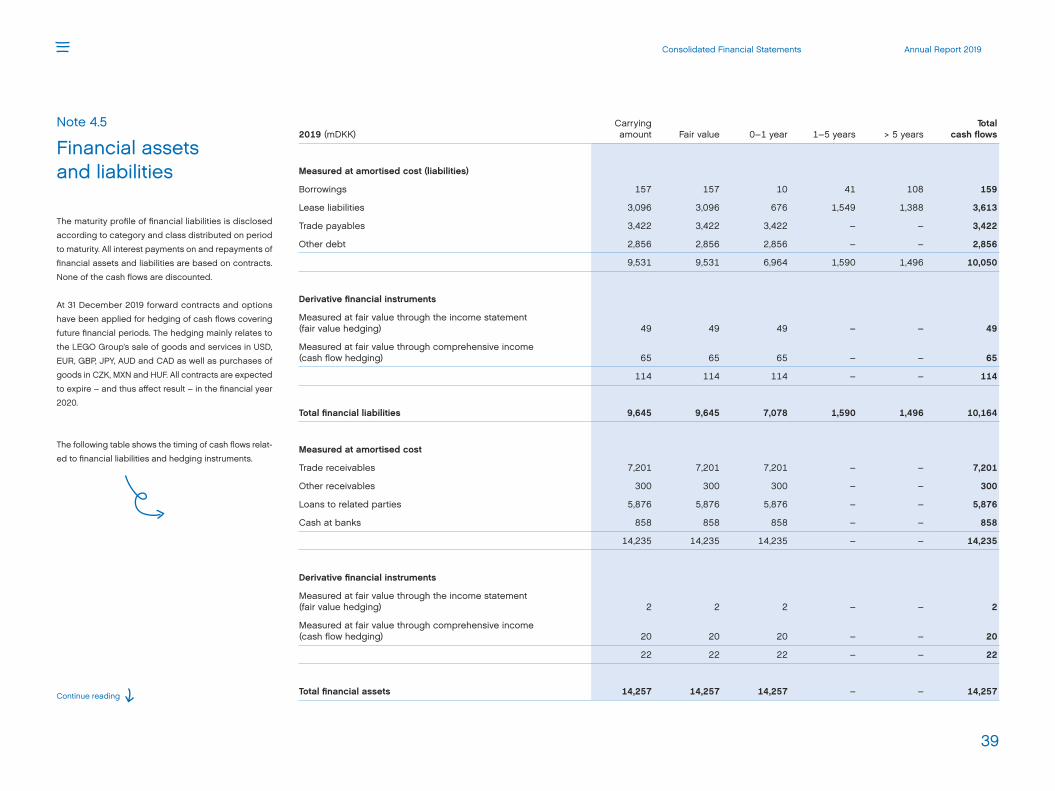
Continue reading
Financial assets and liabilities
Note 4.5
The maturity profile of financial liabilities is disclosed
according to category and class distributed on period
to maturity. All interest payments on and repayments of
financial assets and liabilities are based on contracts.
None of the cash flows are discounted.
At 31 December 2019 forward contracts and options
have been applied for hedging of cash flows covering
future financial periods. The hedging mainly relates to
the LEGO Group’s sale of goods and services in USD,
EUR, GBP, JPY, AUD and CAD as well as purchases of
goods in CZK, MXN and HUF. All contracts are expected
to expire – and thus affect result – in the financial year
2020.
The following table shows the timing of cash flows relat-
ed to financial liabilities and hedging instruments.
2019 (mDKK)Carrying amount Fair value 0–1 year 1–5 years > 5 years
Total cash flows
Measured at amortised cost (liabilities)
Borrowings 157 157 10 41 108 159
Lease liabilities 3,096 3,096 676 1,549 1,388 3,613
Trade payables 3,422 3,422 3,422 – – 3,422
Other debt 2,856 2,856 2,856 – – 2,856
9,531 9,531 6,964 1,590 1,496 10,050
Derivative financial instruments
Measured at fair value through the income statement (fair value hedging) 49 49 49 – – 49
Measured at fair value through comprehensive income (cash flow hedging) 65 65 65 – – 65
114 114 114 – – 114
Total financial liabilities 9,645 9,645 7,078 1,590 1,496 10,164
Measured at amortised cost
Trade receivables 7,201 7,201 7,201 – – 7,201
Other receivables 300 300 300 – – 300
Loans to related parties 5,876 5,876 5,876 – – 5,876
Cash at banks 858 858 858 – – 858
14,235 14,235 14,235 – – 14,235
Derivative financial instruments
Measured at fair value through the income statement (fair value hedging) 2 2 2 – – 2
Measured at fair value through comprehensive income (cash flow hedging) 20 20 20 – – 20
22 22 22 – – 22
Total financial assets 14,257 14,257 14,257 – – 14,257
Annual Report 2019
39
Consolidated Financial Statements

Note 4.5 (continued)2018 (mDKK)
Carrying amount Fair value 0–1 year 1–5 years > 5 years
Total cash flows
Measured at amortised cost (liabilities)
Borrowings 167 167 10 43 120 173
Trade payables 3,207 3,207 3,207 – – 3,207
Other debt 3,168 3,168 3,165 4 – 3,169
6,542 6,542 6,382 47 120 6,549
Derivative financial instruments
Measured at fair value through the income statement(fair value hedging) 48 48 48 – – 48
Measured at fair value through comprehensive income (cash flow hedging) 74 74 74 – – 74
122 122 122 – – 122
Total financial liabilities 6,664 6,664 6,504 47 120 6,671
Measured at amortised cost
Trade receivables 6,766 6,766 6,766 – – 6,766
Other receivables 502 502 502 – – 502
Receivables from related parties 6,858 6,858 6,858 – – 6,858
Cash at banks 1,098 1,098 1,098 – – 1,098
15,224 15,224 15,224 – – 15,224
Derivative financial instruments
Measured at fair value through the income statement (fair value hedging) 11 11 11 – – 11
Measured at fair value through comprehensive income (cash flow hedging) 32 32 32 – – 32
43 43 43 – – 43
Total financial assets 15,267 15,267 15,267 – – 15,267
Non-contractual items such as taxes, duties payable and
wage related payables are excluded from other receiv-
ables and other debt balance as this analysis is only
required for financial instruments.
Due to the short term nature of trade receivables, trade
payables, other receivables and other debt their carry-
ing amount is considered to be approximately the same
as their fair value
Financial assets and liabilities measured at fair value
comprise derivative financial instruments. The calcula-
tion of fair value of the LEGO Group’s derivative financial
instruments is based on observable inputs like interest
rates etc. (level 2) as per the IFRS Fair Value Hierarchy
listed below:
• Quoted prices (unadjusted) in active markets for
identical assets or liabilities (level 1).
• Inputs other than quoted prices included within
level 1 that are observable for the assets or
liabilities, either directly (that is, as prices) or
indirectly (that is, derived from prices) (level 2).
• Inputs for assets or liabilities that are not based on
observable market data (that is, unobservable
inputs) (level 3).
Annual Report 2019
40
Consolidated Financial Statements

Financial risksNote 4.6
(mDKK) %-change 2019 2018
EUR
Equity 10% (45) (48)
Net profit for the year 10% (45) (48)
USD
Equity 10% (109) (170)
Net profit for the year 10% 95 (2)
GBP
Equity 10% 36 19
Net profit for the year 10% (19) (19)
CZK
Equity 10% 41 37
Net profit for the year 10% 41 37
MXN
Equity 10% 160 137
Net profit for the year 10% 160 137
HUF
Equity 10% 88 114
Net profit for the year 10% 88 114
CNY
Equity 10% 102 140
Net profit for the year 10% 102 140
SGD
Equity 10% (68) (36)
Net profit for the year 10% (68) (36)
CAD
Equity 10% (43) (40)
Net profit for the year 10% (1) 2
The LEGO Group has centralised the management of
financial risks. The overall objectives and policies for the
LEGO Group’s financial risk management are outlined
in a Treasury Policy and a Credit Risk Policy.
The LEGO Group only hedges commercial exposures
and consequently does not enter into derivative trans-
actions for trading or speculative purpose. A fully inte-
grated Treasury Management System is used to manage
all financial positions.
Credit risk
Financial instruments are entered into with counterpar-
ties with investment grade level ratings.
Similarly, the LEGO Group only uses insurance compa-
nies with investment grade level ratings.
For trade receivables the exposures are managed glob-
ally through fixed procedures, and credit limits are set
as deemed appropriate for the customer, taking into
account current local market conditions. The LEGO
Group has no significant trade receivables risk concen-
trated in specific countries, but has some single signif-
icant trade debtors. Credit risk relating to trade receiv-
ables is disclosed in note 3.4.
For banks and financial institutions, only independently
rated parties with investment grade level ratings are
accepted as main banks. The LEGO Group uses the
related company KIRKBI Invest A/S for deposits. No inde -
pendent rating exists but no significant risks are recog -
nised. The maximum credit risk, that corresponds to the
carrying amount of receivables and loans granted, is
disclosed in note 4.5.
The overall credit risk of the LEGO Group is considered
to be low.
Foreign exchange risk
The LEGO Group’s presentation currency is DKK, but the
majority of the LEGO Group’s activities and investments
is denominated in other currencies. Consequently, there
is a substantial risk of exchange rate fluctuations having
an impact on the LEGO Group’s reported cash flow,
profit(loss) and/or financial position in DKK.
The LEGO Group’s foreign exchange risk is managed
centrally based on a Treasury Policy approved by the
Board of Directors. Forward contracts and options are
used to cover purchases and sales in foreign currencies.
These forward contracts and options are classified as
hedging when they meet the accounting requirements
for hedging future cash flows.
The isolated effects of the financial instruments on prof-
it and equity after tax of a currency strengthening of
10% against DKK at 31 December 2019 are specified
below for the most important currencies in the LEGO
Group. The sensitivities are based only on the impact
of the financial instruments that are outstanding at the
balance sheet date, and are thus not an expression of
the LEGO Group’s total currency risk. The financial in-
struments included in the sensitivity analysis are the
LEGO Group’s: Cash, Account receivables, Account
payables, Borrowings, foreign exchange forwards and
foreign exchange options.
Continue reading
Sensitivity analysis based only on outstanding financial instruments per 31 December:
Annual Report 2019
41
Consolidated Financial Statements
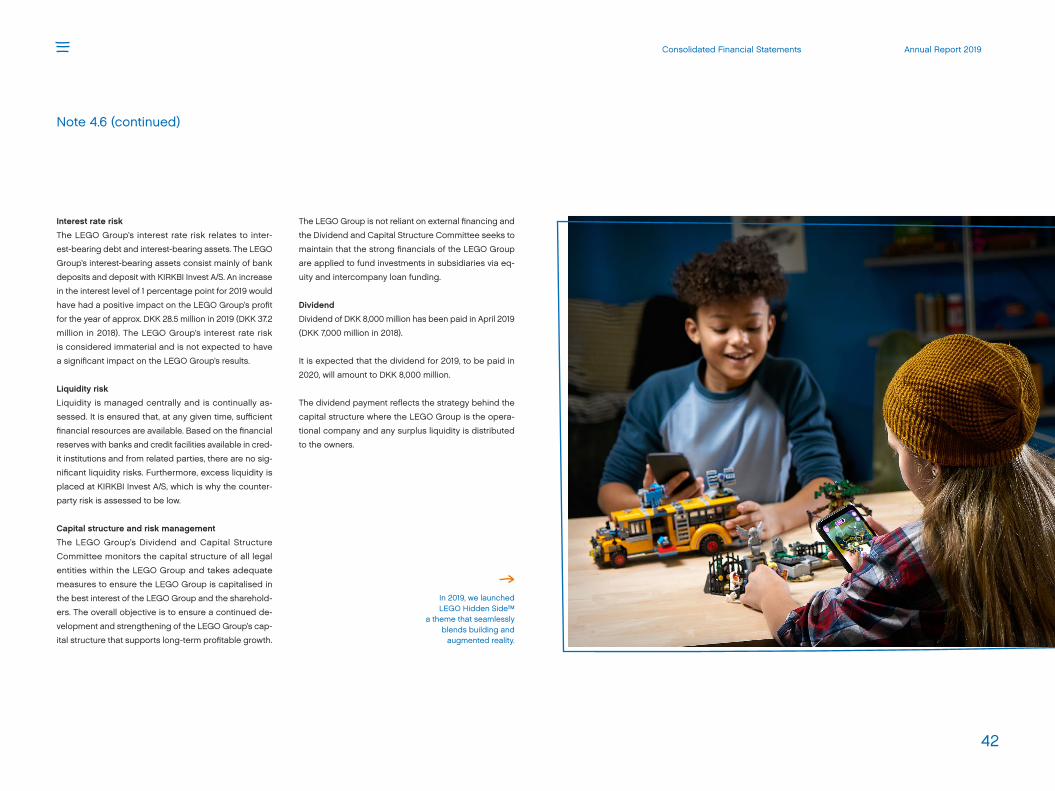
In 2019, we launched LEGO Hidden Side™
a theme that seamlessly blends building and
augmented reality.
Note 4.6 (continued)
Interest rate risk
The LEGO Group’s interest rate risk relates to inter-
est-bearing debt and interest-bearing assets. The LEGO
Group’s interest-bearing assets consist mainly of bank
deposits and deposit with KIRKBI Invest A/S. An increase
in the interest level of 1 percentage point for 2019 would
have had a positive impact on the LEGO Group’s profit
for the year of approx. DKK 28.5 million in 2019 (DKK 37.2
million in 2018). The LEGO Group’s interest rate risk
is considered immaterial and is not expected to have
a significant impact on the LEGO Group’s results.
Liquidity risk
Liquidity is managed centrally and is continually as-
sessed. It is ensured that, at any given time, sufficient
financial resources are available. Based on the financial
reserves with banks and credit facilities available in cred-
it institutions and from related parties, there are no sig-
nificant liquidity risks. Furthermore, excess liquidity is
placed at KIRKBI Invest A/S, which is why the counter-
party risk is assessed to be low.
Capital structure and risk management
The LEGO Group’s Dividend and Capital Structure
Committee monitors the capital structure of all legal
entities within the LEGO Group and takes adequate
measures to ensure the LEGO Group is capitalised in
the best interest of the LEGO Group and the sharehold-
ers. The overall objective is to ensure a continued de-
velopment and strengthening of the LEGO Group’s cap-
ital structure that supports long-term profitable growth.
The LEGO Group is not reliant on external financing and
the Dividend and Capital Structure Committee seeks to
maintain that the strong financials of the LEGO Group
are applied to fund investments in subsidiaries via eq-
uity and intercompany loan funding.
Dividend
Dividend of DKK 8,000 million has been paid in April 2019
(DKK 7,000 million in 2018).
It is expected that the dividend for 2019, to be paid in
2020, will amount to DKK 8,000 million.
The dividend payment reflects the strategy behind the
capital structure where the LEGO Group is the opera-
tional company and any surplus liquidity is distributed
to the owners.
Annual Report 2019
42
Consolidated Financial Statements

Continue reading
2019 (mDKK) Contract
amount Positive
fair value Negative fair value
Period covered
Hedging of forecast transactions qualifying for hedge accounting:
USD (sale of currency) 2,695 14 28 12 months
JPY (sale of currency) 263 2 2 12 months
GBP (sale of currency) 674 3 13 14 months
AUD (sale of currency) 498 – 9 12 months
CAD (sale of currency) 546 1 11 12 months
Other (sale of currency) 117 – 2 12 months
Total forward contracts 4,793 20 65
Hedging of balance sheet items qualifying for hedge accounting:
USD (sale of currency) 908 1 30 2 months
JPY (sale of currency) 162 – 2 2 months
GBP (sale of currency) 185 1 8 2 months
AUD (sale of currency) 134 – 2 2 months
CAD (sale of currency) 106 – 6 2 months
CZK (purchase of currency) 43 – – 2 months
Other (purchase of currency) 3 – – 2 months
Other (sale of currency) 74 – 1 2 months
Total forward contacts 1,615 2 49
USD (sale of currency) 103 – – 1 month
Total currency options 103 – –
Total for which hedge accounting applies 6,511 22 114
Total for which hedge accounting is not applied – – –
Total of forecast transactions 6,511 22 114
Derivative financial instruments
Note 4.7
Total hedging activities
The LEGO Group uses a number of forward contracts
and options to hedge currency exposure. The hedging
activities are categorised into hedging of forecast trans-
actions (cash flow hedges), and hedging of assets and
liabilities (fair value hedges).
The changes in fair value of the financial instruments qual-
ifying for hedge accounting are recognised directly under
comprehensive income until the hedged items affect the
income statement. The changes in fair value of the financial
instruments not qualifying for hedge accounting are recog-
nised directly in the income statement. This includes time
value of options.
All changes in fair value of hedging of assets and liabil-
ities (fair value hedging) are recognised directly in the
income statement.
The table below shows the fair value of hedging activities specified by
hedging instruments and the major currencies
Annual Report 2019
43
Consolidated Financial Statements
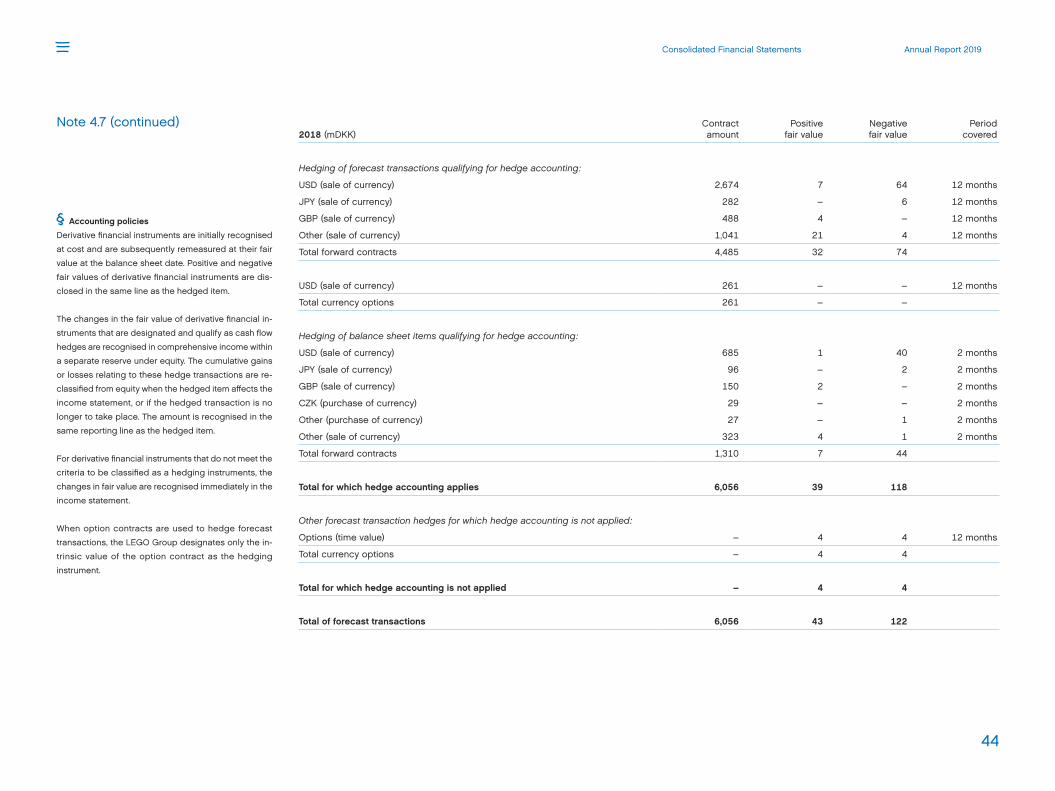
2018 (mDKK) Contract
amount Positive
fair value Negative fair value
Period covered
Hedging of forecast transactions qualifying for hedge accounting:
USD (sale of currency) 2,674 7 64 12 months
JPY (sale of currency) 282 – 6 12 months
GBP (sale of currency) 488 4 – 12 months
Other (sale of currency) 1,041 21 4 12 months
Total forward contracts 4,485 32 74
USD (sale of currency) 261 – – 12 months
Total currency options 261 – –
Hedging of balance sheet items qualifying for hedge accounting:
USD (sale of currency) 685 1 40 2 months
JPY (sale of currency) 96 – 2 2 months
GBP (sale of currency) 150 2 – 2 months
CZK (purchase of currency) 29 – – 2 months
Other (purchase of currency) 27 – 1 2 months
Other (sale of currency) 323 4 1 2 months
Total forward contracts 1,310 7 44
Total for which hedge accounting applies 6,056 39 118
Other forecast transaction hedges for which hedge accounting is not applied:
Options (time value) – 4 4 12 months
Total currency options – 4 4
Total for which hedge accounting is not applied – 4 4
Total of forecast transactions 6,056 43 122
Note 4.7 (continued)
Accounting policies
Derivative financial instruments are initially recognised
at cost and are subsequently remeasured at their fair
value at the balance sheet date. Positive and negative
fair values of derivative financial instruments are dis-
closed in the same line as the hedged item.
The changes in the fair value of derivative financial in-
struments that are designated and qualify as cash flow
hedges are recognised in comprehensive income within
a separate reserve under equity. The cumulative gains
or losses relating to these hedge transactions are re-
classified from equity when the hedged item affects the
income statement, or if the hedged transaction is no
longer to take place. The amount is recognised in the
same reporting line as the hedged item.
For derivative financial instruments that do not meet the
criteria to be classified as a hedging instruments, the
changes in fair value are recognised immediately in the
income statement.
When option contracts are used to hedge forecast
transactions, the LEGO Group designates only the in-
trinsic value of the option contract as the hedging
instrument.
Annual Report 2019
44
Consolidated Financial Statements

Fees to independent auditorNote 5.1
(mDKK) 2019 2018
Fee for statutory audit 12 10
Other assurance engagements 1 1
Total audit related services 13 11
Tax consultancy 9 14
Other services 14 14
Total non-audit services 23 28
Total fees to independent auditor 36 39
Remuneration of Group ManagementNote 5.2
(mDKK) 2019 2018
Salaries and other remuneration 31 40
Remuneration to the Executive Management and the Board of Directors
The Executive Management only consists of one mem-
ber, therefore the remuneration of the Chief Executive
Officer (Executive Management) and the Board of
Remuneration to Key Management Personnel (Executive Leadership Team)
(mDKK) 2019 2018
Salaries 58 62
Pensions 3 2
Short-term incentive plans 18 26
Long-term incentive plans 17 16
96 106
Severance payments and other one-offs 28 13
Total remuneration 124 119
Average number of Executive Leadership Team 10 12
Headcount of Executive Leadership Team end of year 9 12
Short-term incentive plans are based on yearly perfor-
mance and long-term incentive plans are based on
long-term goals regarding value creation.
Directors is disclosed collectively with reference to
§98b (3) of the Danish Financial Statement Act.
Annual Report 2019
45
Consolidated Financial Statements

Acquisition of businessesNote 5.3 Note 5.4
Acquisition of subsidiaries in 2019
On 16 December 2019 the LEGO Group acquired all as-
sets and liabilities of BrickLink Corporation and 100% of
shares of BrickLink Limited and Sohobricks LLC in a
cash purchase. No other acquisitions were made in 2019.
Description of BrickLink
BrickLink is the world’s largest online community of adult
LEGO fans. The BrickLink platform has more than one
million members and comprises an online marketplace
of more than 10,000 stores from 70 countries; a digital
building software where builders can design and show-
case their creations; and a vibrant online community
where fans share ideas and builds.
The acquisition also included Sohobricks which makes
small batches of building elements.
Strategic rationale and synergies
The acquisition of the BrickLink digital platform gives
the LEGO Group a unique opportunity to connect with
adult fans through new channels and existing experi-
ences and deepen our collaboration. The LEGO group
plans to continue to support BrickLink’s active market-
place and evolve BrickLink’s digital studio which allows
talented fans to take their creativity to the next level
while retaining and nurturing the independent spirit of
the digital platform.
Financial impact
The financial impact of the acquisition is immaterial for
the LEGO Group.
Accounting policies
Acquisitions of businesses are accounted for using the
acquisition method. The consideration transferred in a
business combination is measured at fair value, which
is calculated as the sum of the acquisition-date fair val-
ues of assets transferred by the LEGO Group, liabilities
assumed by the LEGO Group and the equity interest
issued by the LEGO Group in exchange for control of
the acquiree. Acquisition-related costs are recognised
in the income statement as incurred.
At the acquisition date, the identifiable assets acquired
and the liabilities assumed are recognised at their fair
value at the acquisition date.
The excess of the consideration transferred over the fair
value of the net identifiable assets acquired is recorded
as goodwill.
Contingent assets, contingent liabilities and other obligations
(mDKK) 2019 2018
Guarantees 483 636
Operating lease obligations – 2,600
Other obligations 1,138 1,337
Total contingencies and other obligations 1,621 4,573
2018 (mDKK) 0-1 year 1-5 years > 5 years Total
Related parties 54 148 150 352
Other 559 1,122 567 2,248
613 1,270 717 2,600
Guarantees relate to bank guarantees for commit-
ments.
Lease contracts previously classified as off-balance
leases under IAS 17 have now been capitalised, recog-
nising right-of-use assets and lease liabilities similar to
previous practices for financial lease. For further infor-
mation see Leases note 4.4.
Future minimum lease payments under non-cancellable
operating leases are specified as follows:
Continue reading
Annual Report 2019
46
Consolidated Financial Statements
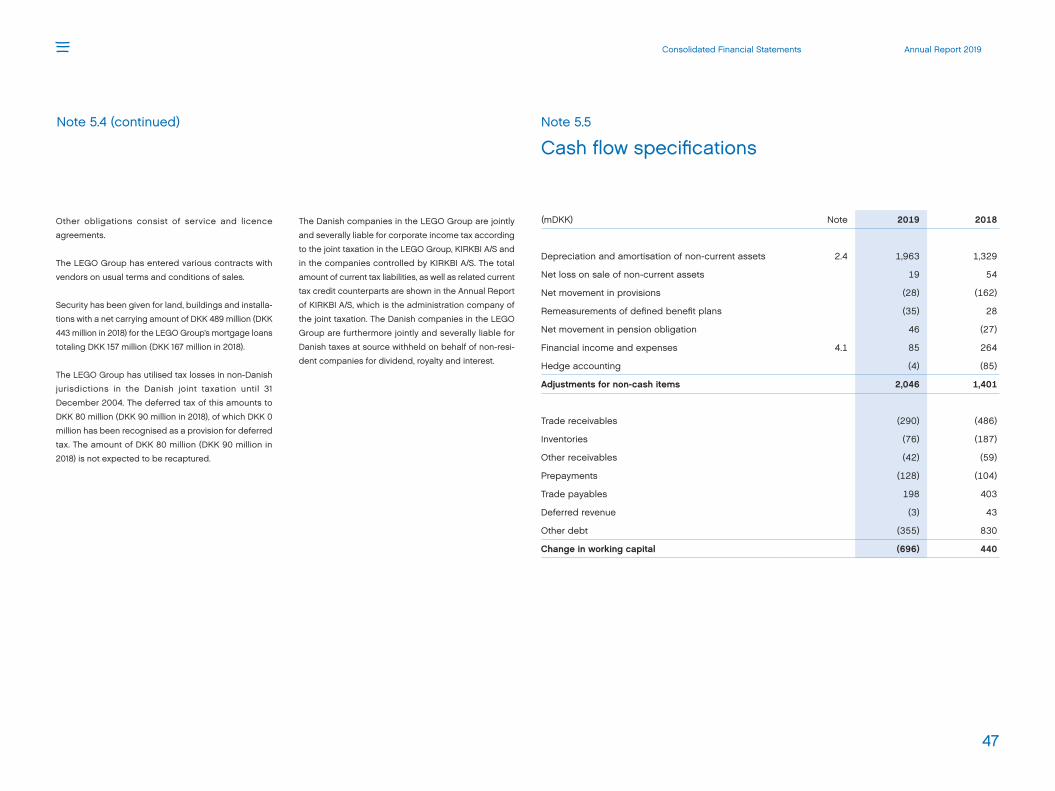
Other obligations consist of service and licence
agreements.
The LEGO Group has entered various contracts with
vendors on usual terms and conditions of sales.
Security has been given for land, buildings and installa-
tions with a net carrying amount of DKK 489 million (DKK
443 million in 2018) for the LEGO Group’s mortgage loans
totaling DKK 157 million (DKK 167 million in 2018).
The LEGO Group has utilised tax losses in non-Danish
jurisdictions in the Danish joint taxation until 31
December 2004. The deferred tax of this amounts to
DKK 80 million (DKK 90 million in 2018), of which DKK 0
million has been recognised as a provision for deferred
tax. The amount of DKK 80 million (DKK 90 million in
2018) is not expected to be recaptured.
Note 5.4 (continued) Note 5.5
Cash flow specifications
(mDKK) Note 2019 2018
Depreciation and amortisation of non-current assets 2.4 1,963 1,329
Net loss on sale of non-current assets 19 54
Net movement in provisions (28) (162)
Remeasurements of defined benefit plans (35) 28
Net movement in pension obligation 46 (27)
Financial income and expenses 4.1 85 264
Hedge accounting (4) (85)
Adjustments for non-cash items 2,046 1,401
Trade receivables (290) (486)
Inventories (76) (187)
Other receivables (42) (59)
Prepayments (128) (104)
Trade payables 198 403
Deferred revenue (3) 43
Other debt (355) 830
Change in working capital (696) 440
The Danish companies in the LEGO Group are jointly
and severally liable for corporate income tax according
to the joint taxation in the LEGO Group, KIRKBI A/S and
in the companies controlled by KIRKBI A/S. The total
amount of current tax liabilities, as well as related current
tax credit counterparts are shown in the Annual Report
of KIRKBI A/S, which is the administration company of
the joint taxation. The Danish companies in the LEGO
Group are furthermore jointly and severally liable for
Danish taxes at source withheld on behalf of non-resi-
dent companies for dividend, royalty and interest.
Annual Report 2019
47
Consolidated Financial Statements

Note 5.6
Related parties
(mDKK) 2019 2018
KIRKBI A/S
Other transactions (28) (22)
Dividend (6,000) (5,250)
Balance end of year 22 2
Lease liability end of year (909) –
Koldingvej 2, Billund A/S
Other transactions (22) (14)
Dividend (2,000) (1,750)
Balance end of year (17) (13)
Merlin Entertainments Group
Sales of goods 549 542
Royalty 30 29
Other transactions (7) (6)
Balance end of year 78 66
KIRKBI Invest A/S Group
Trademark royalty (1,405) (1,314)
Other transactions 82 22
Balance end of year (456) (421)
Lease liability end of year (25) –
Transactions with other related parties
Other transactions 15 8
Donations 82 48
Balance end of year 38 (18)
Identity of related parties
The Parent of the LEGO Group is LEGO A/S, a company
incorporated in Denmark, whose shares are owned by
KIRKBI A/S (75%) and Koldingvej 2, Billund A/S (25%).
The shares of KIRKBI A/S are fully owned by the Kirk
Kristiansen family (Billund, Denmark). Koldingvej 2, Billund
A/S is fully owned by the LEGO Foundation. Being an
associated company of KIRKBI A/S, Merlin Entertainments
Group is considered a related party. Due to shared con-
trolling shareholder, the KIRKBI Invest A/S Group is also
considered a related party. Key Management Personnel
is considered related parties.
Transactions, balances and loans with related
parties
The LEGO Group has had the following material
transactions and balances with related parties:
of Profit goes to the LEGO Foundation
25%
Continue reading
Annual Report 2019
48
Consolidated Financial Statements

The LEGO Group has the following loan to KIRKBI
Invest A/S (deposit agreement):
(mDKK) 2019 2018
Balance at 1 January 6,858 6,688
Loans advanced during the year 10,863 12,239
Repayments (11,831) (12,054)
Interest charged (14) (15)
Total Balance at 31 December 5,876 6,858
At the beginning of 2018 the LEGO Group had a loan
from KIRKBI Invest A/S of DKK 600 million. This loan was
repaid during the first half of 2018.
No loss allowance was recognised in relation to balances
or loans with related parties during the period. All bal-
ances and loans fall due within one year. Due to the
short-term nature of the balances and loans from relat-
ed parties, the carrying amount is considered to be the
same as their fair value.
Lease expenses paid to related parties are included in
other transactions. The portfolio of lease commitments
with related parties for short-term leases at the end of
the year is similar to the portfolio of short-term leases
that have been expensed during the year. The LEGO
Group has entered a lease with related parties, not yet
commenced, to which the LEGO Group is committed,
cf. information in note 4.4.
Accounting policies
Deposit between the LEGO Group and KIRKBI Invest A/S
is considered to be a financial asset and treated accord-
ing to IFRS 9 and is measured at amortised cost.
Transactions with Key Management Personnel
There have been no transactions with the Board of
Directors or Executive Leadership Team besides remu-
neration. For information about the salaries of the Board
of Directors and Executive Leadership Team, please
refer to Remuneration of Group Management note 5.2.
Terms and conditions
All transactions were made on normal commercial terms
and conditions and at market rates. Outstanding bal-
ances and loans are unsecured and are repayable in
cash.
Note 5.6 (continued) Note 5.7
Events occuring after the reporting period
Apart from the events recognised or disclosed in the
consolidated financial statements, no events have oc-
curred after the reporting period of importance to the
consolidated financial statements.
Annual Report 2019
49
Consolidated Financial Statements

Note 5.8
Group Structure
LEGO A/S
LEGO Australia Pty. Ltd.
LEGO Handelsgesellschaft mbH
LEGO Belgium n.v.
LEGO do Brasil Comércio e Distribuicão de
Brinquedos Ltda
LEGO Canada Inc.
LEGO Education Technology (Shanghai) Co., Ltd
LEGO Trading (Beijing) Co., Ltd.
LEGO Toy Manufacturing (Jiaxing) Co., Ltd.
LEGO Toy (Shanghai) Co., Ltd.
LEGO Commerce (Shenzhen) Co. Ltd.
LEGO Production s.r.o.
LEGO Trading s.r.o.
LEGO System A/S
LEGO Security Billund ApS
Oy Suomen LEGO Ab
LEGO SAS
LEGO Brand Retail S.A.S
LEGO GmbH
LLD Share Verwaltungs GmbH
LEGO Hong Kong Limited
LEGO Company Ltd.
BrickLink Limited
LEGO Hungária Kft.
LEGO Manufacturing Kft.
LEGO India Private Limited
LEG GODT India Private Limited
LEGO S.p.A.
LEGO Japan Ltd.
Australia
Austria
Belgium
Brazil
Canada
China
China
China
China
China
Czech Republic
Czech Republic
Denmark
Denmark
Finland
France
France
Germany
Germany
Hong Kong
Hong Kong
Hong Kong
Hungary
Hungary
India
India
Italy
Japan
LEGO Trading (Malaysia) Sdn. Bhd.
LEGO Mexico S.A. de C.V
Administratión de Servicios LEGO, S. de R.L. de C.V.
LEGO Operaciones de Mexico S.A. de C.V.
LEGO Real Estate, S.A. de C.V.
LEGO New Zealand Ltd.
LEGO Norge AS
LEGO Polska Sp. zo.o.
LEGO Lda.
LEGO Romania S.R.L.
LEGO Ltd.
LEGO Singapore Pte. Ltd.
LEGO South Africa (Pty.) Ltd.
LEGO Korea Co. Ltd.
Sohobricks LLC
LEGO S.A.
LEGO Sverige AB
LEGO Schweiz AG
LEGO Trading (Taiwan) Co., Ltd.
LEGO Nederland B.V.
LEGO Turkey Oyuncak Ticearet Anonim Sirketi
LEGO Ukraine LLC
LEGO Company Limited
LEGO Park Holding UK Ltd.
LEGO Lifestyle International Ltd.
LEGO Systems, Inc.
LEGO Brand Retail Inc.
LEGO Bricklink Inc.
LEGO Middle East FZ-LLC
Malaysia
Mexico
Mexico
Mexico
Mexico
New Zealand
Norway
Poland
Portugal
Romania
Russian Fed.
Singapore
South Africa
South Korea
South Korea
Spain
Sweden
Switzerland
Taiwan
The Netherlands
Turkey
Ukraine
United Kingdom
United Kingdom
United Kingdom
USA
USA
USA
Utd.Arab Emir.
LEGO A/S directly or indirectly owns the entire share
capital in all group subsidiaries.
LEGO A/S is 75% owned by KIRKBI A/S and is included
in the Consolidated Annual Report of KIRKBI A/S.
KIRKBI A/S is the ultimate Parent Company.
Annual Report 2019
50
Consolidated Financial Statements

Parent Company Financial Statements
Annual Report 2019Parent Company Financial Statements
51

Income Statement1 January – 31 December
(mDKK) Note 2019 2018
Revenue 134 126
Gross profit 134 126
Other operating expenses (37) (140)
Operating profit 97 (14)
Net profit for the year from subsidiaries 3.3 8,217 8,105
Financial income 2.2 120 86
Financial expenses 2.2 (74) (99)
Profit before income tax 8,360 8,078
Tax on profit for the year 2.3 (60) (28)
Net profit for the year 8,300 8,050
8.3 bnNet Profit DKK
Annual Report 2019Parent Company Financial Statements
52

Balance Sheetat 31 December
(mDKK) Note 2019 2018
Intangible assets 3.1 287 1
Property, plant and equipment 3.2 6 6
Deferred tax assets 3.5 38 67
Investments in subsidiaries 3.3 22,006 20,974
Investments in associates 3.3 – –
Receivables from subsidiaries 1,116 1,329
Total non-current assets 23,453 22,377
Other receivables 19 6
Total current assets 19 6
Total assets 23,472 22,383
(mDKK) Note 2019 2018
Share capital 3.4 20 20
Reserve from the use of the equity method 4,944 5,237
Retained earnings 9,213 8,496
Proposed dividend 8,000 8,000
Total equity 22,177 21,753
Provisions 13 –
Other debt 8 –
Total non-current liabilities 21 –
Trade payables 7 6
Current tax liabilities 7 2
Debt to subsidiaries 1,097 517
Other debt 163 105
Total current liabilities 1,274 630
Total liabilities 1,295 630
Total equity and liabilities 23,472 22,383
Annual Report 2019Parent Company Financial Statements
53

Statement of Changes in Equity1 January – 31 December
2019 (mDKK) Share capital
Reserve from the use of the
equity methodRetained earnings
Proposed dividend
Total equity
Balance at 1 January 20 5,237 8,496 8,000 21,753
Dividend paid relating to prior year – – – (8,000) (8,000)
Profit for the year – (417) 717 8,000 8,300
Currency translation adjustments – 154 – – 154
Entries recognised directly on equity in subsidiaries – (30) – – (30)
Balance at 31 December 20 4,944 9,213 8,000 22,177
2018 (mDKK) Share capital
Reserve from the use of the
equity methodRetained earnings
Proposed dividend
Total equity
Balance at 1 January 20 5,305 8,415 7,000 20,740
Dividend paid relating to prior year – – – (7,000) (7,000)
Profit for the year – (31) 81 8,000 8,050
Currency translation adjustments – 10 – – 10
Entries recognised directly on equity in subsidiaries – (47) – – (47)
Balance at 31 December 20 5,237 8,496 8,000 21,753
Annual Report 2019Parent Company Financial Statements
54

Notes Basis of preparation56 1.1 Basis of preparation
Income Statement56 2.1 Employee costs
56 2.2 Financial income and expenses
56 2.3 Tax on profit for the year
Balance sheet and other disclosures57 3.1 Intangible assets
58 3.2 Property, plant and equipment
59 3.3 Investments in subsidiaries and associates
60 3.4 Share capital
60 3.5 Deferred tax
61 3.6 Contingent assets, contingent liabilities and other obligations
61 3.7 Related parties
62 3.8 Proposed distribution of profit
Annual Report 2019Parent Company Financial Statements
55

Basis for preparation
The Financial Statements of the Parent Company have
been prepared in accordance with the provisions of the
Danish Financial Statements Act applying to enterprises
of reporting class C (large).
In pursuance of section 86(4) of the Danish Financial
Statement Act, the company has not prepared a state-
ment of cash flow. Referring to section 96(3) of the
Danish Financial Statement Act, the company does not
disclose the fee paid to the auditors appointed by the
Annual General Meeting.
The accounting policies are the same as for the Con-
solidated Financial Statement except additions on tax,
intangible assets and Investments in subsidiaries and
associates. See the respective notes for the ad ditions.
The accounting policies for the annual accounts remain
unchanged from last year.
Note 1.1
The average number of full-time employees in LEGO A/S
for the year is 3 (3 employees in 2018). The salaries for
the three employees are included in the Remuneration
of Group Management, please refer to note 5.2 in the
Consolidated Financial Statements.
Employee costsNote 2.1
(mDKK) 2019 2018
Salaries and other remuneration 31 40
The Executive Management only consists of one mem-
ber, therefore the remuneration of the Chief Executive
Officer (Executive Management) and the Board of
Directors is disclosed collectively with reference to §
98b (3) of the Danish Financial Statement Act.
Financial income and expensesNote 2.2
(mDKK) 2019 2018
Interest income from subsidiaries 105 86
Exchange gains, net 15 –
Financial income 120 86
Interest expenses to subsidiaries 74 84
Interest expenses to related parties – 10
Exchange loss, net – 5
Financial expenses 74 99
Remuneration to Executive Management and Board of Directors
Note 2.3
(mDKK) 2019 2018
Current income tax charge for the year 7 5
Other tax for the year 21 34
Deferred tax change for the year 23 (11)
Adjustment of current tax for prior years 3 –
Adjustment of deferred tax for prior years 6 –
Total income tax expense 60 28
Tax on profit for the year
Annual Report 2019Parent Company Financial Statements
56

Intangible assetsNote 3.1
2019 (mDKK) Goodwill
Patents, software and
other rights Total
Cost at 1 January – 10 10
Additions 253 39 292
Cost at 31 December 253 49 302
Amortisation and impairment losses at 1 January – 9 9
Amortisation for the year 4 2 6
Amortisation and impairment losses at 31 December 4 11 15
Carrying amount at 31 December 249 38 287
2018 (mDKK)
Patents, software and
other rights Total
Cost at 1 January 10 10
Cost at 31 December 10 10
Amortisation and impairment losses at 1 January 7 7
Amortisation for the year 2 2
Amortisation and impairment losses at 31 December 9 9
Carrying amount at 31 December 1 1
Accounting policies
Goodwill is amortised over the estimated useful life,
which is estimated at 5 years. The amortisation period
is determined by management based on their experi-
ence within the area of business conducted.
Annual Report 2019Parent Company Financial Statements
57

Property, plant and equipmentNote 3.2
2019 (mDKK)
Land, buildings and
installations
Other fixtures and fittings,
tools and equipment Total
Cost at 1 January 6 1 7
Cost at 31 December 6 1 7
Depreciation and impairment losses at 1 January – 1 1
Depreciation and impairment losses at 31 December – 1 1
Carrying amount at 31 December 6 – 6
2018 (mDKK)
Land, buildings and
installations
Other fixtures and fittings,
tools and equipment Total
Cost at 1 January 6 1 7
Cost at 31 December 6 1 7
Depreciation and impairment losses at 1 January – 1 1
Depreciation and impairment losses at 31 December – 1 1
Carrying amount at 31 December 6 – 6
Annual Report 2019Parent Company Financial Statements
58

Investments in subsidiaries and associates
Note 3.3
2019 (mDKK) Investments in
subsidiaries
Cost at 1 January 8,737
Correction to cost at 1 January 58
Additions 767
Cost at 31 December 9,562
Value adjustment at 1 January 12,237
Correction to value adjustment at 1 January (49)
Currency translation adjustments 154
Share of net profit for the year 8,217
Dividend (8,085)
Entries recognised directly on equity in subsidiaries (30)
Value adjustment at 31 December 2019 12,444
Carrying amount at 31 December 22,006
2018 (mDKK) Investments in
subsidiaries Investments in
associates
Cost at 1 January 7,943 4
Additions 843 –
Disposals (49) (4)
Cost at 31 December 8,737 –
Value adjustment at 1 January 11,805 (1)
Currency translation adjustments 10 –
Share of net profit for the year 8,105 –
Dividend (7,660) –
Disposals 24 1
Entries recognised directly on equity in subsidiaries (47) –
Value adjustment at 31 December 12,237 –
Carrying amount at 31 December 20,974 –
Capitalised goodwill amounts to DKK 132 million
in 2019.
Accounting policies
Subsidiaries and associates of the Parent Company are
recognised under the equity method, which is at the
respective share of the net asset values in subsidiaries
and associates.
Any costs in excess of net assets in the acquired entites
are capitalised in the Parent Company under
investments in subsidiaries as part of the investments
(“Goodwill”). Amortisation of the goodwill is provided
under the straight-line method over a period not ex-
ceeding 5 years based on estimated useful life.
To the extent it exceeds declared dividend from sub-
sidiaries, net revaluation of investments in subsidiaries
and associates is transferred to net revaluation reserve
according to the equity method under equity.
Profits in subsidiaries and associates are disclosed as
profit after tax in the income statement of the Parent
Company.
Annual Report 2019Parent Company Financial Statements
59

Share capitalNote 3.4
(mDKK) 2019 2018
A-shares of DKK 1,000 or multiples hereof 1 1
B-shares of DKK 1,000 or multiples hereof 9 9
C-shares of DKK 1,000 or multiples hereof 10 10
Total share capital 20 20
There have been no changes in the share capital during
the last 5 years.
Shareholders holding more than 5% of the share capital
or 5% of the votes:
KIRKBI A/S, Billund, Denmark
Koldingvej 2, Billund A/S, Billund, Denmark
Deferred taxNote 3.5
(mDKK) 2019 2018
Deferred tax
Deferred tax, net at 1 January 67 8
Change in deferred tax (29) 59
Deferred tax, net at 31 December 38 67
Deferred tax is recognised in the balance sheet as follows:
Deferred tax assets 38 67
Deferred tax liabilities – –
38 67
Annual Report 2019Parent Company Financial Statements
60

Contingent assets, contingent liabilities and other obligations
Note 3.6
(mDKK) 2019 2018
Guarantees 1,119 1,293
Other indemnities 570 515
1,689 1,808
Guarantees relate to commitments in subsidiaries.
LEGO A/S is jointly and severally liable for corporate
income tax according to the joint taxation in the LEGO
Group, KIRKBI A/S and in the companies controlled by
KIRKBI A/S. The total amount of current tax liabilities, as
well as related current tax credit counterparts are shown
in the Annual Report of KIRKBI A/S, which is the admin-
istration company of the joint taxation. LEGO A/S is fur-
thermore jointly and severally liable for Danish taxes at
source withheld on behalf of non-resident companies
for dividend, royalty and interest.
The LEGO Group has utilised tax losses in non-Danish
jurisdictions in the Danish joint taxation until 31
December 2004. The deferred tax of this amounts to
DKK 80 million (DKK 90 million in 2018), of which DKK 0
million has been recognised as a provision for deferred
tax. The amount of DKK 80 million (DKK 90 million in
2018) is not expected to be recaptured.
Related partiesNote 3.7
(mDKK) 2019 2018
KIRKBI A/S
Other transactions (16) (23)
Balance end of period – (5)
KIRKBI Invest A/S Group
Interest charged – (10)
Other transactions 13 –
Balance end of period 13 –
Merlin Entertainments Group
Trademark fee received 30 29
Balance end of period 6 6
Remuneration to Key Management Personnel is dis-
closed in note 2.1.
Transactions with related parties were carried out on an
arm’s length basis.
Transactions, balances and loans with related parties (excluding wholly owned subsidiaries):
LEGO A/S has had the following material transactions and balances with related parties:
Annual Report 2019Parent Company Financial Statements
61
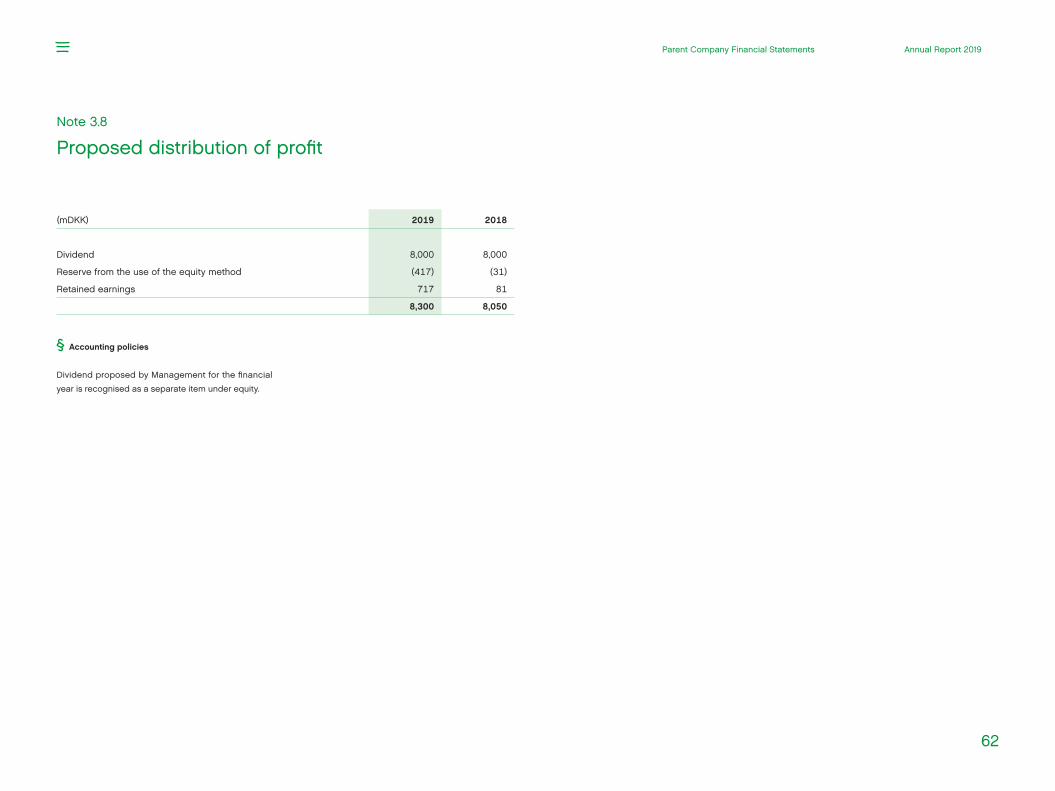
Proposed distribution of profitNote 3.8
(mDKK) 2019 2018
Dividend 8,000 8,000
Reserve from the use of the equity method (417) (31)
Retained earnings 717 81
8,300 8,050
Accounting policies
Dividend proposed by Management for the financial
year is recognised as a separate item under equity.
Annual Report 2019Parent Company Financial Statements
62

Additional information
62
Annual Report 2019Additional information

Management’s Statement
The Executive Management and the Board of Directors have today considered and adopted the Annual Report of LEGO A/S for the finan-cial year 1 January to 31 December 2019. The consolidated financial statements have been prepared in accordance with International Financial Reporting Standards as adopted by the EU and additional requirements in the Danish Financial Statements Act and the Parent Company Financial Statements are prepared in accord ance with the Danish Financial Statements Act. Manage ment’s Review is prepared in accordance with the Danish Financial Statements Act.
In our opinion, the Consolidated Financial Statements and the Parent Company Financial Statements give a true and fair view of the financial position at 31 December 2019 of the LEGO Group and the Parent Company and of the results of the LEGO Group and the Parent Company operations and consolidat-ed cash flows for the financial year 1 January to 31 December 2019.
In our opinion, Management’s Review includes a true and fair account of the development in the operations and financial circumstances of the LEGO Group and the Parent Company, of
the results for the year and of the financial position of the LEGO Group and the Parent Company as well as a description of the most significant risks and elements of uncertain ty facing the LEGO Group and the Parent Company.
We recommend that the Annual Report be adopted at the Annual General Meeting.
Niels B. ChristiansenPresident and Chief Executive Officer
Executive Management
Board of Directors
Jørgen Vig Knudstorp Kåre Schultz
Thomas Kirk KristiansenChairman
Søren Thorup SørensenDeputy Chairman
Eva Berneke
Jan Thorsgaard Nielsen
63
Annual Report 2019Additional information
Continue reading
To the shareholders of LEGO A/S
OpinionIn our opinion, the Consolidated Financial Statements give a true and fair view of the Group’s financial position at 31 December 2019 and of the results of the Group’s operations and cash flows for the financial year 1 January to 31 December 2019 in accordance with International Financial Reporting Standards as adopted by the EU and further require-ments in the Danish Financial Statements Act.
Moreover, in our opinion, the Parent Company Financial Statements give a true and fair view of the Parent Company’s financial position at 31 December 2019 and of the results of the Parent Company’s operations for the finan-cial year 1 January to 31 December 2019 in accordance with the Danish Financial Statements Act.
We have audited the Consolidated Financial Statements and the Parent Company Financial Statements of LEGO A/S for the financial year 1 January – 31 December 2019, which comprise Income Statement, Balance Sheet, Statement of Changes in Equity and Notes to the financial statements, including summary of significant
Independent Auditor’s Report
accounting policies, for both the Group and the Parent Company, as well as statement of comprehensive income and statement of cash flow for the Group (“financial statements”).
Basis for OpinionWe conducted our audit in accordance with International Standards on Auditing (ISAs) and the additional requirements applicable in Denmark. Our responsibilities under those standards and requirements are further de-scribed in the Auditor’s Responsibilities for the Audit of the Financial Statements section of our report. We are independent of the Group in accordance with the International Ethics Standards Board for Accountants’ Code of Ethics for Professional Accountants (IESBA Code) and the additional requirements appli-cable in Denmark, and we have fulfilled our other ethical responsibilities in accordance with these requirements. We believe that the audit evidence we have obtained is sufficient and appropriate to provide a basis for our opinion.
Statement on Management’s ReviewManagement is responsible for Management’s Review.
Our opinion on the financial statements does not cover Management’s Review, and we do not express any form of assurance conclusion thereon.
In connection with our audit of the financial statements, our responsibility is to read Management’s Review and, in doing so, con-sider whether Management’s Review is ma-terially inconsistent with the financial state-ments or our knowledge obtained during the audit, or otherwise appears to be materially misstated.
Moreover, it is our responsibility to consider whether Management’s Review provides the information required under the Danish Financials Statements Act.
Based on the work we have performed, in our view, Management’s Review is in accordance with the Consolidated Financial Statements and the Parent Company Financial Statements and has been prepared in accordance with the requirements of the Danish Financial Statement Act. We did not identify any mate-rial misstatement in Management’s Review.
Management’s Responsibility for the Financial Statements Management is responsible for the prepara-tion of Consolidated Financial Statements that give a true and fair view in accordance with International Financial Reporting Standards as adopted by the EU and further requirements in the Danish Financial Sta te-ments Act and for the preparation of Parent Company Financial Statements that give
a true and fair view in accordance with the Danish Financial Statements Act, and for such internal control as Management determines is necessary to enable the preparation of financial statements that are free from ma-terial misstatement, whether due to fraud or error.
In preparing the financial statements, Ma n-agement is responsible for assessing the Group’s and the Parent Company’s ability to continue as a going concern, disclosing, as applicable, matters related to going concern and using the going concern basis of ac-counting in preparing the financial statements unless Management either intends to liqui-date the Group or the Parent Company or to cease operations, or has no realistic alterna-tive but to do so.
Auditor’s Responsibilities for the Audit of the Financial StatementsOur objectives are to obtain reasonable assur-ance about whether the financial statements as a whole are free from material misstate-ment, whether due to fraud or error, and to issue an auditor’s report that includes our opinion. Reasonable assurance is a high level of assurance, but is not a guarantee that an audit conducted in accordance with ISAs and the additional requirements applicable in Denmark will always detect a material mis-statement when it exists. Misstatements can arise from fraud or error and are considered material if, individually or in the aggregate, they could reasonably be expected to influence the
64
Annual Report 2019Additional information

economic decisions of users taken on the ba-sis of these financial statements.
As part of an audit conducted in accordance with ISAs and the additional requirements ap-plicable in Denmark, we exercise professional judgement and maintain professional skepti-cism throughout the audit. We also:
• Identify and assess the risks of material misstatement of the financial statements, whether due to fraud or error, design and perform audit procedures responsive to those risks, and obtain audit evidence that is sufficient and appropriate to provide a basis for our opinion. The risk of not detect-ing a material misstatement resulting from fraud is higher than for one resulting from error as fraud may involve collusion, for-gery, intentional omissions, misrepresenta-tions, or the override of internal control.
• Obtain an understanding of internal control relevant to the audit in order to design audit procedures that are appropriate in the cir-cumstances, but not for the purpose of ex-pressing an opinion on the effectiveness of the Group’s and the Parent Company’s in-ternal control.
• Evaluate the appropriateness of account-ing policies used and the reasonableness of accounting estimates and related dis-closures made by Management
• Conclude on the appropriateness of Ma n-agement’s use of the going concern basis of accounting in preparing the financial
statements and, based on the audit evi-dence obtained, whether a material uncer-tainty exists related to events or conditions that may cast significant doubt on the Group’s and the Parent Company’s ability to continue as a going concern. If we con-clude that a material uncertainty exists, we are required to draw attention in our audi-tor’s report to the related disclosures in the financial statements or, if such disclosures are inadequate, to modify our opinion. Our conclusions are based on the audit evi-dence obtained up to the date of our audi-tor’s report. However, future events or con-ditions may cause the Group and the Parent Company to cease to continue as a going concern.
• Evaluate the overall presentation, structure and contents of the financial statements, including the disclosures, and whether the financial statements represent the under-lying transactions and events in a manner that gives a true and fair view.
• Obtain sufficient appropriate audit evi-dence regarding the financial information of the entities or business activities within the Group to express an opinion on the Consolidated Financial Statements. We are responsible for the direction, supervision and performance of the group audit. We remain solely responsible for our audit opinion.
We communicate with those charged with governance regarding, among other matters, the planned scope and timing of the audit
and significant audit findings, including any significant deficiencies in internal control that we identify during our audit.
Aarhus, 27 February 2020
PricewaterhouseCoopersStatsautoriseret RevisionspartnerselskabCVR no 3377 1231
Claus Lindholm JacobsenState Authorised Public Accountantmne23328
Mads MelgaardState Authorised Public Accountantmne34354
65
Annual Report 2019Additional information

LEGO A/S Aastvej 1DK-7190 BillundTel: +45 7950 6070
CVR no: 54 56 25 19Incorporated: 19 December, 1975 Residence: BillundFinancial Year: 1 January – 31 DecemberInternet: www.LEGO.com
Annual Report 2019 is published for the LEGO Group by Finance and Corporate Brand Communications.
Design: Kontrapunkt
LEGO, the LEGO logo, the Minifigure, DUPLO, the FRIENDS logo and the HIDDEN SIDE logo are trademarks of the LEGO Group. ©2020 The LEGO Group.
STARWARS.com © & ™ Lucasfilm Ltd.