the lehigh strategy: integrated - uli southwest...
TRANSCRIPT

The Lehigh Strategy: Integrated
• Land Use
– Residential
– Economic
– Public
– Parks
– Recreation

The Lehigh Strategy: Diversity
• Options
– Housing
– Employment
– Recreation
– Connections

The Lehigh Strategy: Connected
• Linkages
– Urban-Suburban
– Live-work-play
– Neighborhoods
– Walk-bike-transit-car
– Parks-trails-spaces
– Schools-community

Lehigh Plan: Mixed-Use
• Incentive-Based
– Densities
– Financing
• CIP Priorities
• Public-Private
– Streamline
• Planning
• Codes

Lehigh Plan: Mixed-Use Code
• Overlay
– Form-Based
– Public-Private
– Incentive-Based
• Opt-in
• Streamlined Review

Lehigh Plan: Implementation
• Prioritize Development
– Private Investment
– Funding Sources
– Capital Priorities
– Immediate Projects

The Lehigh Strategy: Services
• Public Systems
– Community-wide
– Integrated
– Connected
– Health & Safety
– Local

Lehigh Plan: Urban Land Use
• Urban Core:
– 15-25 units Standard • 40 units Incentive
• Urban Place:
– 8-18 units Standard• 25 units Incentive
• Urban Neighborhood
– 4-10 units Standard• 16 units Incentive
Fix-A-Block
Mall Chopper
Resi-Dense
Re-Center
Urban Strategies

Lehigh Plan: Suburban Practices
• Suburban Service
– Neighborhoods
– Public Service Area

Central Corridors as Complete Streets
• Lanes for vehicles and bikes
• Controlled road speed
• Wide sidewalks w/ street trees
• On-street parking
• Narrow travel lanes
• Restricted turns and turn radii

Roadway SegmentNumber
of Lanes
2012
Daily
Traffic
2035 Daily
Traffic
Growth
Rate
Maximum
Daily Capacity LOS
Lee Boulevard west of
Homestead Road
6 32,000 49,500 55% 59,900 C
Lee Boulevard north of
Leeland Heights Boulevard
2 11,800 13,900 18% 18,600 C
Beth Stacy Boulevard south
of Homestead Road
2 7,000 9,700 39% 17,700 C
Homestead Road south of
Taylor Lane
4 26,200 36,300 39% 39,800 C
Homestead Road south of
Alabama Road
4 10,900 22,200 104% 39,800 C
Alabama Road south of
Homestead Road
2 11,100 13,300 20% 17,700 C
Roadway SegmentNumber
of Lanes
2012
Daily
Traffic
2035 Daily
Traffic
Growth
Rate
Maximum
Daily Capacity LOS
Leeland Heights Boulevard
west of Bell Boulevard
4 16,500 36,500 121% 37,800 D
Bell Boulevard south of
Leeland Heights Boulevard
2 N/A 13,200 N/A 18,600 C
Joel Boulevard east of Bell
Boulevard
4 14,100 38,000 170% 37,800 F
Joel Boulevard north of East
Greens Boulevard
4 N/A 23,000 N/A 37,800 C
Projected Traffic Demand Growth in Activity Centers

Future Demand Conclusions
• Lehigh Acres will grow no matter what
• Background traffic growth will adversely affect the system
• Enhanced grid will reduce demand on primary roads
• Homestead Road and Joel Boulevard will remain four lanes
• Pedestrian and bicycle mobility can be enhanced through connected system
• A safe and pleasant environment will encourage walking and biking
• Lee Tran Routes 128 and 515 should be maintained
• Add 30-minute circulator route

Downtown Lehigh Acres Main Street Network

Admiral Lehigh Main Street Network

• 80’ Right Of Way (55’ pavement)
• Four 11’ travel lanes with 11’ center turn lane
• 5’ sidewalk with grass strip on each side
• No bike lanes
• No curb and gutter
Typical sections developed using www.streetmix.net
Downtown Lehigh Acres – Homestead Road

Homestead Road – Potential Concepts

Roundabouts as Gateway Features
Roundabouts Evaluated at:
• Homestead @ Beth Stacy• Homestead @ Taylor• Homestead @ Alabama• Joel @ Bell
Conclusions
• Possible gateway features• Minimal travel time savings

Economic Analysis
1. To provide information to assist in establishing priorities for infrastructure improvements to the Lehigh Area Community.
2. To provide information to describe the financial benefits to the property (value) of opting to develop consistent with the Regulating Plan.
3. Compare Revenue to Cost
4. Look at Intangible Benefits
Economic Analysis Objectives
Investments (Costs)
Benefits (Revenues)

Lehigh AcresPlanning and Design StudyRecommendations
March 29, 2014

Downtown and Neighborhood
Activity Centers

Land Use
1. Streamline the Regulatory Review Process
2. Create a High Quality Public Realm
Recommendations:

Land Use
Benefits:
• Incentivizes development
• Creates a public/private collaborative effort
Recommendations:
• Develop a “go-to” team of County staff who “specialize” in review of form-based development
• Expedite the review time
• Everyone at the table
Streamline the Regulatory Review Process

Land Use
Street ElementsStreet Trees
On-street Parking
Building Articulation
Outdoor Seating Wide Sidewalks
Attractive Signage
Create a High Quality Public Realm

Land Use
Create a High Quality Public RealmCivic Space

UtilitiesProposed System
• Size of system based on future needs analysis
• Water demands and sewer flow based upon density and land use
• Examined infrastructure age, deterioration, and non-conformance with existing regulations
• Assumed constructing gravity sewer which would encourage more development.
• Examine effects of these proposed demands/flows on the wastewater and water treatment plants.
• Construction driven by depth of gravity system and typically begins at the deepest point
Objective: provide water & sewer to all areas in the Activity Centers

Utilities
DowntownSewer
• Six existing private lift stations can be eliminated with gravity system
• Existing Master Pump Station cannot serve entire area
• New Master Pump Station on Homestead centrally located; start location for construction
• Secondary construction to start around Pump Station #44

Utilities
DowntownWater
• Water mains can be completed as sewer system is constructed
• Bring water system up to current fire code
• Sizes of water mains
• Location of fire hydrants
• Replace existing Asbestos Cement pipe
• Valves at all intersections

Stormwater
Overview of Existing Conditions
• Part of Orange River Sub-basin
• Pre-district permitting
• Flood control – moves water quickly
• Not adequate storage or treatment
• Maintenance issues• Parcel by parcel design

Stormwater
Future Needs Assessment
• Agency review and requirements
• SFWMD and ECWCD
• Master Water Management System
• Stormwater model of Activity Centers
• Alternative stormwater management techniques
• Canal changes
• Harns Marsh

Stormwater
RecommendationsMaster Water Management System. Designed for buildout redevelopment scenario -
which will improve and protect the environment.
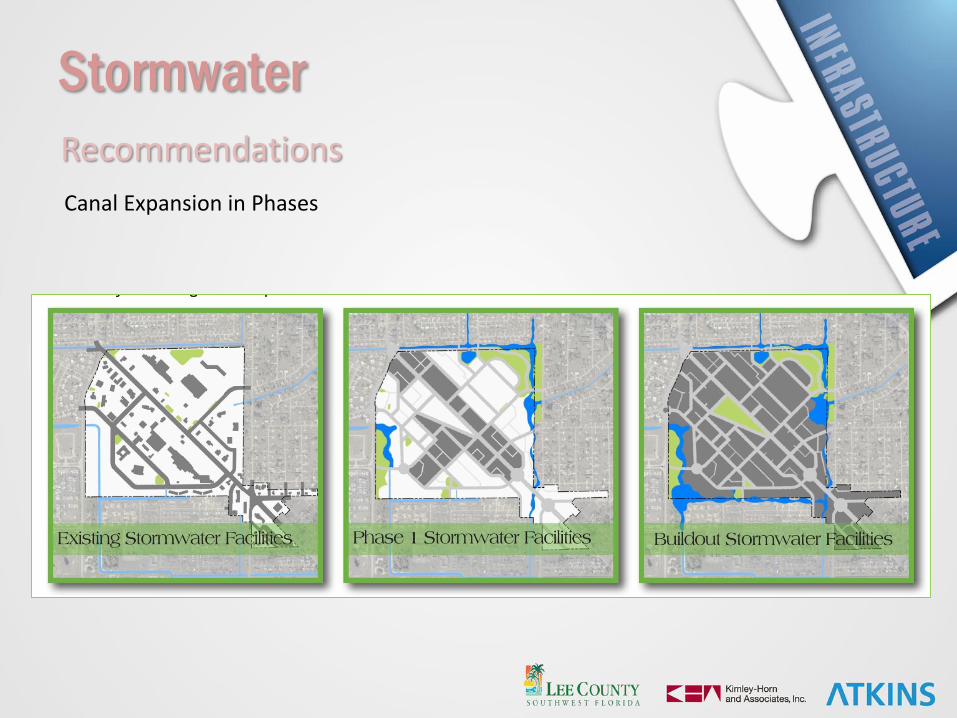
Stormwater
Recommendations
Canal Expansion in Phases

StormwaterUse of Alternative Stormwater Management techniques / Low Impact
Development principals (LID)

Economic Analysis
STEP 1: EVALUATION PLANNING
Objectives for Activity Centers
Objectives for Economic Analysis

Economic Analysis
To develop/redevelop as a vibrant, intensely developed mixed-use gathering places that will serve area residents.
• Urban development pattern
• Walkable network of streets
• Urban building setbacks
• Building frontage requirements.
Activity Center Objectives

Economic AnalysisEconomic Analysis Objectives
1. To provide information to assist in establishing priorities for infrastructure improvements to the Lehigh Area Community.
2. To provide information to describe the financial benefits to the property (value) of opting to develop consistent with the Regulating Plan.

Economic Analysis
TOTAL ESTIMATED IMPROVEMENTS
FOR DOWNTOWN ACTIVITY CENTER
$24,221,891

Economic Analysis
TOTAL ESTIMATED IMPROVEMENTS
FOR NEIGHBORHOOD ACTIVITY CENTER
$20,599,521

Economic AnalysisAnnual County Tax Yield Per Acre

Economic AnalysisReturn on Investment by Land Use
Downtown Activity Center
FormProjectedSquare Feet
Infra. Cost / Square Feet
Total Cost 20 Year County Rev.
Mixed Use 2,351,093 $10,302.40 $24,221,891 $34,456,790
Single Use 2,351,093 $10,302.40 $24,221,891 $9,783,267
Neighborhood Activity Center
FormProjectedSquare Feet
Infra. Cost / Square Feet
Total Cost 20 Year County Rev.
Mixed Use 530,770 $38,810.64 $20,599,521 $7,778,778
Single Use 530,770 $38,810.64 $20,599,521 $1,910,821

Economic AnalysisNeighborhood Activity Center Intangibles
• Community Identity / Focal Point
• Support Aging in Place (diversity in housing choices)
• Increased marketability and property values of residential areas surrounding the Activity Centers
• Reduction of vehicular travel miles on arterial roadways (affecting the timing of need for future additional expansion of these facilities)

FundingAlternative Financing
Special Tax Districts:• Tax Increment Districts
• Municipal Service Districts
• Community Redevelopment Area
• Statutory Process
• Community Redevelopment Plan
• Community Redevelopment Agency
• Enterprise Zone
• Brownfield Redevelopment Area
• Ad Valorem Tax Incentives
• Public Private Partnerships

Where to Start?
Why?• Quality open space (public and private).
• Joel Blvd. is four lanes, ready for improvements.•
• Existing mix of housing types.
• Concentrated area for creation of taxing district.
• Opportunities for high impact projects.
• Smaller size, largely undeveloped.• Ease of implementation• Test the process and programming
Neighborhood Activity Center

Next Steps…
• Create a Gateway to the Activity Centers…
• Create streetscape to beautify…
• Spur economic development…
• Create a walkable connected environment…
• Continue to Engage the community.
QUESTIONS????