the leicester practice diabetes risk score - sign...
TRANSCRIPT

The Leicester Practice Diabetes Risk ScoreInformation and User Guidewww.leicesterdiabetescentre.org.uk
© Leicester Diabetes Centre at University Hospitals of Leicester NHS Trust, 2015. Not to be reproduced in whole or in part without the permission of the copyright owner.
The Leicester Practice Diabetes Risk ScoreInformation and User Guide
Page 2
Disclaimer
The executable download and the Macros are digitally signed to assure you of the author’s identity and to confirm that the files have not been changed in transit. If the digital signature is not present then we strongly advise you not to use the tool but obtain a fresh copy as this may mean that malicious software has been inserted. Care (including use of firewalls and regularly updated anti-virus and malware software and operating system updates) has been taken to protect the source files from viral contamination but we cannot provide absolute guarantee of this and cannot accept liability for any problems that may arise. You use this software at your own risk.
The data that the tool processes contains potentially sensitive patient data. Any files that comprise the tool or which it generates must not under any circumstances be taken outside the secure practice environment, which includes use of memory sticks/CDs. We cannot be held responsible for any failure on your part to protect patient confidentiality.
We cannot accept responsibility for any errors or omissions in the software. Patient data is complex and while we have tried to design software that optimises patient selection we cannot guarantee freedom from problems arising from the use of the tool, which has been compiled in good faith. If you do come across errors we would be grateful if you can inform us, providing as much detail as possible, so we can alert others and address any problems to improve the tool.
The computer code is the copyright of Dr Shepherd and we ask you not to disassemble it or use it without permission.
We cannot undertake to support the use of the tool. We do not guarantee to respond to queries about it as this is not funded.
The Tool
The tool is based upon Windows Excel and uses Visual Basic for Applications to automate the creation of Miquest Queries and the processing of the resulting data.
The tool can be downloaded from: http://leicesterdiabetescentre.org.uk/The-Leicester-Diabetes-Risk-Score
What it does
The tool calculates the Leicester Practice Diabetes Risk S core for each patient in your practice population aged 40-75, having excluded people with known diabetes, the terminally ill and those with coded Gestational Diabetes (as they are already at identified higher risk and coded we don’t need to screen them and if we don’t exclude them at this stage you’ll end up thinking they are un-coded people with diabetes based on their glucose/OGTT data). As a lot of patients will have had screening done already we don’t want to recall them, so these are picked up by analysing existing OGTT/glucose/HbA1c data already on your system. Doing so will also identify any people with ‘missed’ diabetes – yes abnormal blood sugars do get filed without action being taken even in the best of practices through the hurley burly of day to day events. The output is presented in a single Excel sheet which can be used to check records and recall patients for screening for diabetes.
Essential Pre-requisites
You need internet access and Internet Explorer. You should have Excel 2002 (Version 10, released 2001) or later on the machine you intend to use and it should allow digitally signed macros to run. You will need to be able to run the clinical system software from your machine and have access rights to its Miquest module. The Miquest module should be configured with a LOCAL agreement and your National Practice Code entered as your practice identifier.
Using the tool
First get it clear in your head the stages you need to work through!
Don’t panic about the length of the instructions - the author can do this whole process in less than 4 minutes, including the Miquest search on SystmOne - it always looks long when you write out each stage. Most of it will be second nature to the IT literate:
A. Create a query set (in Excel)B. Run the query set and download results (in your
clinical system)C. Analyse the results (in Excel)D. Process the output (by checking output against patient
record and mail merge to Word)
© Leicester Diabetes Centre at University Hospitals of Leicester NHS
Trust, 2015. All rights reserved.

Page 3
A. Create a query set.
On downloading the tool from the website you will get a ‘File Download Security Warning’ dialog. We suggest clicking Run but the more security conscious might want to ‘Save’ to desktop and then check the digital signature by right clicking and selecting Properties (you might need to click Unblock on the General tab to get it to run). Once downloaded, the zip file it comes in automatically runs and gives a message ‘Download to Desktop or S:\LPRS or C:\LPRS using Browse’. Click Ok, then you have the option of saving the tool on a network directory or local drive. We suggest using an S: drive if one is available on your network. However one of the joys of this work is that each area seems to configure its GP systems differently and so you may need to take the advice of your local health informatics team on the best place to put the tool. It must be placed somewhere where it can save the Miquest queries, a unit of 15 files, in this case, of the file-type HQL, which it generates, to a location accessible to the clinical system’s Miquest module and where it can access Response files (CSV file-type) generated by the clinical system. (Some suggested locations are to be found in the Query Set-up dialogue below). You may need to use the Browse button to change the path in the ‘Unzip to folder’ box. Leave the ‘Overwrite files without prompting’ and ‘When done unzipping open .\LPRS.xls’ check boxes ticked. (This will only overwrite old versions of the tool and will automatically open the tool once saved.)
The downloaded zip file will extract the tool and a customisable Word document (for use with mail-merge) to the location you specify (Remember where!), creating the directory if it doesn’t exist yet eg S:/LPRS. Click Ok to the ‘2 files unzipped successfully message’. It will then automatically open the Excel tool (LPRS.xls) and take you to the opening dialogue box seen below. (If it does not you may need to change the security settings in Excel to allow digitally signed macros to run, close excel and then open the LPRS.xls file again). We suggest you close any other Excel documents you may have open.
The first step is to create a query set suitable for your clinical system and place it somewhere on the network where your clinical system can load it to the Miquest module. (NB the Miquest set must be handled as a unit of 17 queries ie all 17 must be run at the same time and downloaded for analysis as a unit of 17 response files – if you try to run or analyse or download a partial set it will not work!)
© Leicester Diabetes Centre at University Hospitals of Leicester NHS Trust, 2015. All rights reserved.

The Leicester Practice Diabetes Risk ScoreInformation and User Guide
Page 4
You may need to check for the presence of suitable network locations to place the query set and response files at this point. For example with a SystmOne practice it’s best to create the C:\LPRS\Queries directory via MyComputer before going further.
If you are not familiar with running Miquest queries on your system you can find more information in your clinical system help files or here: www.ic.nhs.uk/services/national-clinical-audit-support-programme-ncasp/national-diabetes-audit/getting-started--how-to-participate/extracting-data/pct-gp-practices/2010--2011-miquest-queries.
Click the ‘Set up and run query set’ radio button and click ‘Ok’ and the following dialogue box will open. Type in your practice National ID Code, select the clinical system you are using, chose a location to write the query set to and set the date (it defaults to today which is what you should use). Click ‘Update Set’ and a set of 17 queries will be created at the location you chose. The spreadsheet will try to save itself (– just click ok to any excel version compatibility dialogues you get).
1. From website to C:\LPRS or S:\LPRS
2. Generate queries and save to…
3. Load them to clinical system
5. Download response files to…
5. Load to analyse from…
7. Process results from C:\LPRS or S:\LPRS
LPRS Tool… network place a
… network place b
4. Run queries on Clinical system’s Miquest module
• For EMIS LV without S: drive set-up - map Z: drive to \\EMIS1234a\Shared\ and do 2 & 6 to Z: & do 3 & 5 to C:\SHARED\
• For EMIS LV with S: drive use S:\LPRS for stages 2 & 6 and for 3 & 5 use E:\SHARED\LPRS\
• For EMIS PCS use S:\LPRS\ for stages 2 & 3 and S:\LPRS\Responses for stages 5 & 6
• For Vision use local directory C:\TEMP\ for all stages• For SystmOne use S:\LPRS\Queries for stages 2 & 3 and S:\LPRS for
stage 5 & 6 • For other systems you may need to use Miquest Query instructions for
your system or consult your Informatics Service
Network places a and b may be the same or different depending on your clinical system and local network set-up
© Leicester Diabetes Centre at University Hospitals of Leicester NHS
Trust, 2015. All rights reserved.

Page 5
B. Run the query set and download results.
Now go into the Miquest Module of your clinical system and load and run the query set from the location you chose. (We suggest you delete old query sets by the same name if you have used the tool before to avoid confusion.) Once the query set has run download the set as a whole to a location on the network such as S:/LPRS that you created earlier.You shouldn’t get errors with Miquest Module rejecting queries due to the syntax. If you do just check you created a Miquest set for the correct clinical system (!) and if you did please let us know exactly what the problem was by emailing us the Miquest file that got rejected and any error messages the clinical system gave to pinpoint the problem so we can put it right.)
C. Analyse the results.
Back in Excel click ‘Click here to run start menu’ on the Main worksheet to get back to the opening dialogue. This time click the ‘Load data to analyse’ radio button and ‘Ok’ and the following dialogue box will open. Tell the tool where to find the response files you downloaded from the clinical system and where you would like the output to end up. Then click ‘Analyse’. If all goes well you will get a series of messages at the bottom left of the Excel screen telling you where you are up to and in a minute or so you should get a message saying it’s all done. If the analysis finds apparently un-coded ‘missed’ diabetics might get a message warning you – these are listed in the output file. Click OK to these messages.
An Excel file called DMSCR.xls will be created in the directory you selected. Have a look at it. It’s just a table listing all your non-diabetics with their risk score, name and address details and the outcome of the analysis of their records.
While we think we’ve have sorted most of the bugs that can arise it is possible that you might get a Run Time error message - which in our experience is often down to unexpected format of or corrupt data which then stops the program – if possible we’ll try to help sort it but because these are so unpredictable we usually have to try to reproduce the problem using your data in order to fix it – email us.
D. Process the output.
See the Sample Output file on the website to give you the general idea – this contains a much abbreviated list of the format you might see.
The idea is to list patients who apparently have diabetes but have not been coded as such at the top as they may need sorting first! (Please note that some of these may well have had normal OGTTs done subsequently but because sometimes OGTT results are un-coded or are recorded with the actual values in text form and not values, it is not possible for this system to reliably pick them up. The system still flags them as diabetic because otherwise we might miss them.)
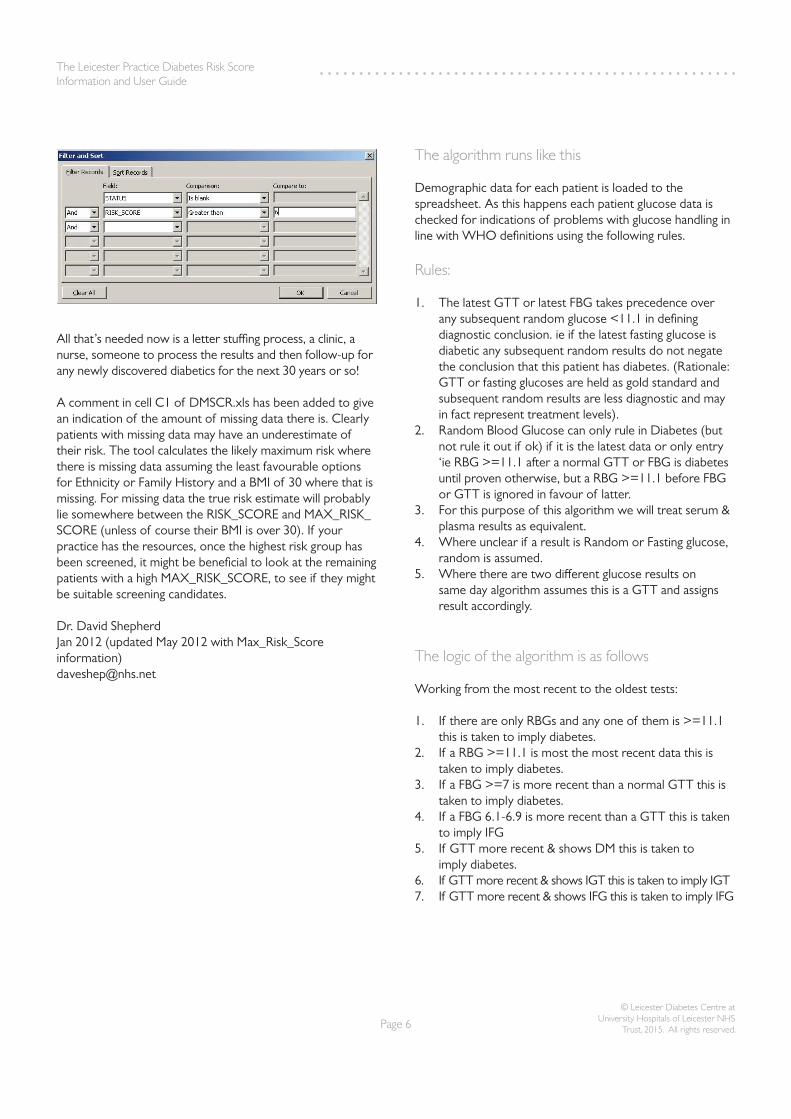
After this the results of the analysis of all your glucose / OGTT/ HbA1c data is presented. These patients probably won’t need screening for diabetes as they have effectively been screened – they are there so you don’t end up wasting time (and annoying people) by calling them again. Below them are the rest of your patients sorted in order of highest calculated diabetes risk to lowest. By opening the file ‘Diabetes Screen Recall.doc’ that came with the tool download you can (having customised it to contain your practice header and tweaked the text if you don’t like our version) set up a mail merge (using DMSCR.xls as the data source) and select a STATUS and RISK_SCORE range as below depending on how many you want to screen. NICE suggest screening the top 50% at risk. See Gray (2012) for more details. The Word document defaults to the set-up below but you could easily change the threshold Risk Score, as needed. (Unfortunately there is no space here for a tutorial on this Office function but Word has plenty of Help resources).
© Leicester Diabetes Centre at University Hospitals of Leicester NHS Trust, 2015. All rights reserved.
The Leicester Practice Diabetes Risk ScoreInformation and User Guide
Page 6
All that’s needed now is a letter stuffing process, a clinic, a nurse, someone to process the results and then follow-up for any newly discovered diabetics for the next 30 years or so!
A comment in cell C1 of DMSCR.xls has been added to give an indication of the amount of missing data there is. Clearly patients with missing data may have an underestimate of their risk. The tool calculates the likely maximum risk where there is missing data assuming the least favourable options for Ethnicity or Family History and a BMI of 30 where that is missing. For missing data the true risk estimate will probably lie somewhere between the RISK_SCORE and MAX_RISK_SCORE (unless of course their BMI is over 30). If your practice has the resources, once the highest risk group has been screened, it might be beneficial to look at the remaining patients with a high MAX_RISK_SCORE, to see if they might be suitable screening candidates.
Dr. David Shepherd Jan 2012 (updated May 2012 with Max_Risk_Score information)[email protected]
The algorithm runs like this
Demographic data for each patient is loaded to the spreadsheet. As this happens each patient glucose data is checked for indications of problems with glucose handling in line with WHO definitions using the following rules.
Rules:
1. The latest GTT or latest FBG takes precedence over any subsequent random glucose <11.1 in defining diagnostic conclusion. ie if the latest fasting glucose is diabetic any subsequent random results do not negate the conclusion that this patient has diabetes. (Rationale: GTT or fasting glucoses are held as gold standard and subsequent random results are less diagnostic and may in fact represent treatment levels).
2. Random Blood Glucose can only rule in Diabetes (but not rule it out if ok) if it is the latest data or only entry ‘ie RBG >=11.1 after a normal GTT or FBG is diabetes until proven otherwise, but a RBG >=11.1 before FBG or GTT is ignored in favour of latter.
3. For this purpose of this algorithm we will treat serum & plasma results as equivalent.
4. Where unclear if a result is Random or Fasting glucose, random is assumed.
5. Where there are two different glucose results on same day algorithm assumes this is a GTT and assigns result accordingly.
The logic of the algorithm is as follows
Working from the most recent to the oldest tests:
1. If there are only RBGs and any one of them is >=11.1 this is taken to imply diabetes.
2. If a RBG >=11.1 is most the most recent data this is taken to imply diabetes.
3. If a FBG >=7 is more recent than a normal GTT this is taken to imply diabetes.
4. If a FBG 6.1-6.9 is more recent than a GTT this is taken to imply IFG
5. If GTT more recent & shows DM this is taken to imply diabetes.
6. If GTT more recent & shows IGT this is taken to imply IGT7. If GTT more recent & shows IFG this is taken to imply IFG
© Leicester Diabetes Centre at University Hospitals of Leicester NHS
Trust, 2015. All rights reserved.

Page 7
Having assigned a diagnosis on the basis of blood glucose test results the coded data for the outcome of glucose tolerance tests is examined and the conclusion so far modified according to the following rules.
1. A code indicating ‘diabetic on GTT’ as taken as diagnostic if it is later than tests indicating a another diagnosis such IGT/IFG or normal fasting sugar.
2. Similarly for codes indicating IFG or IGT for GTT or Normal GTT.
Finally an analysis of HBA1c data present in the record is performed making a final modification to the output as follows.
1. HbA1c results over 6.5% (48mmol/l) are taken as indicating diabetes if they are later than tests indicating another diagnosis such IGT/IFG or normal fasting sugar.
2. HbA1c results 6.0 – 6.4% (42-48mmol/l) are taken as indicating IGR if it is later than tests indicating another diagnosis such IGT/IFG or normal fasting sugar. However, such a result does overturn a prior result indicating diabetes as it is possible that such an HbA1c result is monitoring of un-coded diabetes rather than a screening test for it.
3. HbA1c results under 6.0 % (42mmol/l) are taken as normal only if there are no prior tests indicating diabetes or IGF/IGT for the same reason as 2.
Thus for each patient a final conclusion is drawn.
(The value of this is that it means that for a proportion of patients further screening will not be required whatever their risk score as their current status has already been defined by recent blood tests. This information should enable rapid code assignment for ‘missed’ diabetics and avoid inappropriate calls for screening for those already assessed.)
The remaining data for the risk calculation is then loaded and the calculation performed for each patient.The data is then output to the spreadsheet.
© Leicester Diabetes Centre at University Hospitals of Leicester NHS Trust, 2015. All rights reserved.

The Leicester Practice Diabetes Risk ScoreInformation and User Guide
Reference
L. J. Gray, M. J. Davies, S. Hiles,N. A. Taub, D. R. Webb, B. T. Srinivasan & K. Khunti (2012) Detection of impaired glucose regulation and/or type 2 diabetes mellitus, using primary care electronic data, in a multiethnic UK community setting. Diabetologia: 55(4):959-66
Leicester Diabetes CentreLeicester General HospitalGwendolen RoadLeicester LE5 4PW
www.leicesterdiabetescentre.org.uk
@LDC_Tweets
www.facebook/leicesterdiabetescentre
© Leicester Diabetes Centre at University Hospitals of Leicester NHS Trust, 2015. All rights reserved.