the lessons of hurricane andrew: is florida really ready? economic incentives for building safer...
TRANSCRIPT

The Lessons of Hurricane Andrew: Is Florida Really Ready?
Economic Incentives for Building Safer CommunitiesWharton Risk Management and Decision Processes Center Roundtable
Institute for Building and Home Safety
The Wharton SchoolJune 11, 2002
Robert P. Hartwig, Ph.D., Senior Vice President & Chief EconomistInsurance Information Institute 110 William Street New York, NY 10038
Tel: (212) 346-5520 Fax: (212) 732-1916 [email protected] www.iii.org

Hurricane Andrew: A Summary of the Devastation
• Andrew struck S. FL on August 24, 1992 with sustained winds of 140 mph, gusts to 175 mph
• $15.5B insured losses ($20B in 2001 $)• $26 billion economic losses ($34B 2001 $)• 23 direct deaths• 700,000 homeowners claims• 28,066 home destroyed• 107,380 homes damaged• 82,000 businesses destroyed/damaged• 7,800 businesses closed as of Sept. 1992• 86,000 out of work as of Sept. 1992

World’s Largest Catastrophes(by insured loss)
$38.2
$20.1$16.8
$7.3 $6.3 $6.2 $6.0 $4.7 $4.3 $4.3
$0
$5
$10
$15
$20
$25
$30
$35
$40
Terro
rist A
ttack
s ('01
)*
Hurr. A
ndrew ('
92)
North
ridge
Eq.
('94
)
Typh. M
ireill
e
WS D
aria
WS L
othar
Hurr. H
ugo ('
95)
Misc
Sto
rms/F
lood
s
WS V
ivian
Typh B
art
$ Billions, in 2001 Dollars
*III Estimate; Includes life, liability, availtion and workers compensation losses.Source: Insurance Information Institute, Swiss Re;Note: WS = Winter Storm

United States: Disasters Waiting to Happen
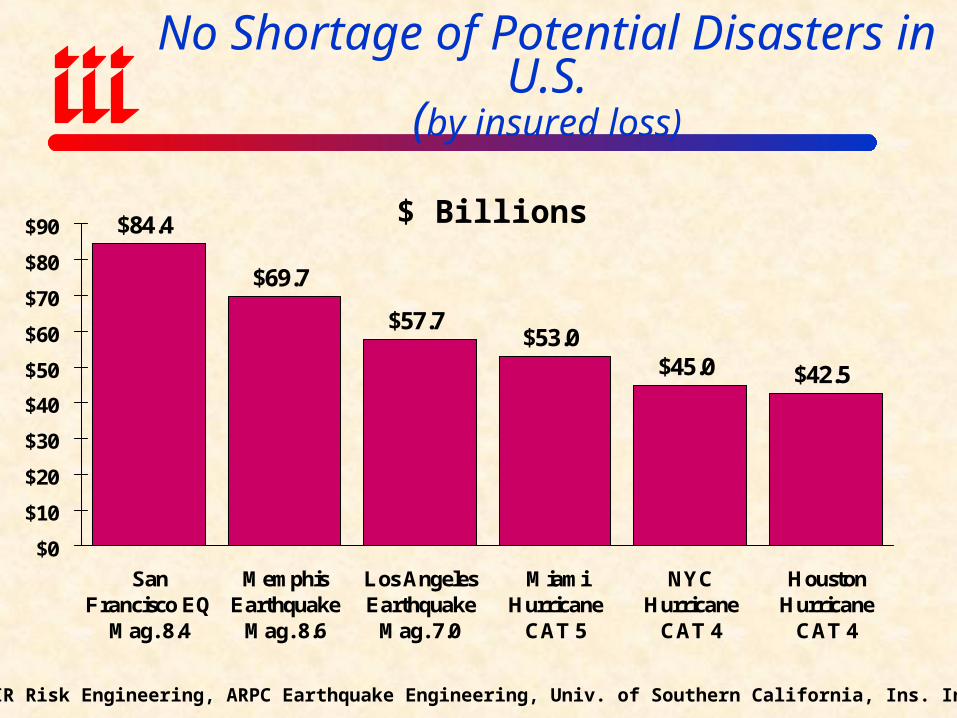
No Shortage of Potential Disasters in U.S.(by insured loss)
$84.4
$69.7
$57.7$53.0
$45.0 $42.5
$0
$10
$20
$30
$40
$50
$60
$70
$80
$90
SanFrancisco EQ
Mag. 8.4
MemphisEarthquake
Mag. 8.6
Los AngelesEarthquake
Mag. 7.0
MiamiHurricane
CAT 5
NYCHurricane
CAT 4
HoustonHurricane
CAT 4
$ Billions
Source: AIR Risk Engineering, ARPC Earthquake Engineering, Univ. of Southern California, Ins. Info Inst.

Probable Costs of FutureU.S. Natural Disasters
Source: AIR Risk Engineering, ARPC Earthquake Engineering, University of Southern California
$57.7 BILLION7.0 EARTHQUAKE
LOS ANGELES
$84.4 BILLION8.2 EARTHQUAKE
SAN FRANCISCO
HONOLULU
$30 BILLIONCLASS 4 HURRICANE
$25.6 BILLIONCLASS 5 HURRICANE
NEW ORLEANS
GALVESTON
$42.5 BILLIONCLASS 5 HURRICANE
MIAMI
$53 BILLIONCLASS 5 HURRICANE
$33.5 BILLIONCLASS 5 HURRICANE
HAMPTON
$52 BILLIONCLASS 4 HURRICANE
ASBURY PARK
$45 BILLIONCLASS 4 HURRICANE
NEW YORK
MEMPHIS
$69.7 BILLION8.6 EARTHQUAKE
$33.3 BILLION7.5 EARTHQUAKE
SEATTLE

10 Costliest Disasters in U.S. History(by insured loss)
$20.3 $19.6
$14.9
$5.9$3.2 $2.9 $2.5 $2.4 $2.1 $2.0
$0
$5
$10
$15
$20
$25
Ter
rori
stA
ttac
k: S
ept.
2001
Hur
rica
neA
ndre
w:
Aug
ust
1992
Nor
thri
dge
Ear
thqu
ake:
Jan.
199
4
Hur
rica
neH
ugo:
Sep
t.19
89
Hur
rica
neG
eorg
es:
Sept
.19
98
Hur
rica
neB
etsy
: Se
pt.
1965
TS
Alli
son:
Jul
y20
01
Hur
rica
ne O
pal:
Oct
ober
199
5
Hur
rica
neF
loyd
: Se
pt.
1999
Hur
rica
ne I
niki
:Se
pt. 1
992
$ Billions
Source:Insurance Services Office, Insurance Information Institute.

U.S. InsuredCatastrophe Losses
$7.5
$2.7$4.7
$22.9
$5.5
$16.9
$8.3 $7.3
$2.6
$10.1$8.3
$4.3
$28.1
$1.30
5
10
15
20
25
30
89 90 91 92 93 94 95 96 97 98 99 00 01* 02**
*Includes $20.3B for 9/11 losses estimated by ISO/PCS as of 6/18/02. Includes only business and personal property claims, business interruption and auto claims.**Through April 2002.Source: Property Claims Service, Insurance Information Institute
$ BillionsCAT Losses for 2001 Set a Record
•20 events (lowest since 1969)•1.5 million claims
•9/11: $20.3B = 51,000 claims

How Exposed is Florida Today?
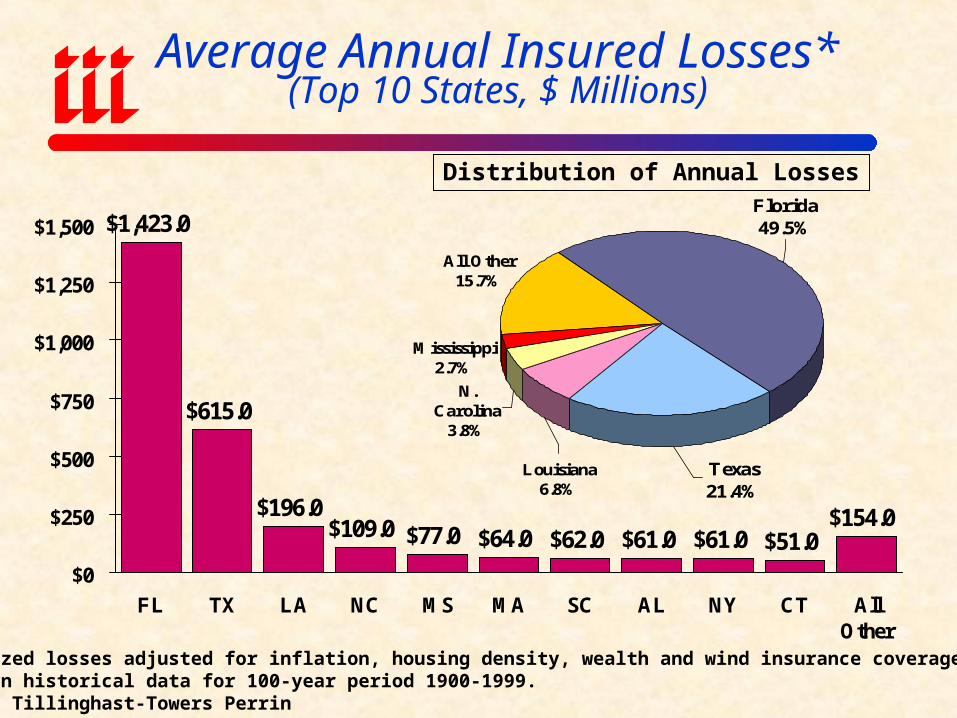
Average Annual Insured Losses*(Top 10 States, $ Millions)
$1,423.0
$615.0
$196.0$109.0 $77.0 $64.0 $62.0 $61.0 $61.0 $51.0
$154.0
$0
$250
$500
$750
$1,000
$1,250
$1,500
FL TX LA NC MS MA SC AL NY CT AllOther
*Normalized losses adjusted for inflation, housing density, wealth and wind insurance coverage, based on historical data for 100-year period 1900-1999.Source: Tillinghast-Towers Perrin
Louisiana6.8%
N. Carolina
3.8%
Mississippi2.7%
All Other15.7%
Texas 21.4%
Florida49.5%
Distribution of Annual Losses

Hurricanes Making Landfall During the 20th Century
*Normalized to adjusted for inflation, housing density, wealth and wind insurance coverage.Source: Tillinghast-Towers Perrin
Frequency
CAT 3 =47 Storms
29%
CAT 4 =15 Storms
9%
CAT 5 =2 Storms
1%
CAT 2 = 38 Storms
23%
CAT 1 = 62 Storms
38%
Cost*
CAT 3 =$943Mill
32.5%
CAT 4 =$1,579Mil
55.0%
CAT 5 =$41 Mil
1.4%
CAT 2 = $243Mil
8.3%
CAT 1 =$76 Mil2.6%

Estimated New Construction in Miami-Dade County, 1992-2001
$3,095.3
$12,981.8
$3,069.7
$305.5
$0
$2,000
$4,000
$6,000
$8,000
$10,000
$12,000
$14,000
$16,000
$18,000
South Miami-Dade All Miami-Dade
($ M
illi
ons)
New Residential Exposure New Commercial Exposure
$3.4 Billion
$16.1 Billion
Source: Best’s Review, June 2002 (International Hurricane Center, Florida International University), Ins. Info. Institute
Huge build-up in exposure in Florida
since 1992
•81% residential
•19% commercial

Estimated New ConstructionMiami-Dade County, Florida
Source: Best’s Review, June 2002 (International Hurricane Center, Florida International University)
South Miami-Dade was designated the county’s high-impact zone following Hurricane Andrew. Estimates include construction from 1992 through 2001
South Miami Dade
New Residential Exposure (Construction) $3,095,273,681
New Commercial Exposure (Construction) $305,492,393
All Miami-Dade
New Residential Exposure(Construction) $12,981,843,085
New Commercial Exposure(Construction) $3,069,654,106

Insured Losses in Florida ifHurricane Andrew Hit Today
Source: Best’s Review, June 2002 (EQECAT)
$20.3
$36.2
$46.7 $48.2 $46.3$43.5
$0$5
$10$15$20$25$30$35$40$45$50
Andrew'sOriginal
Path
Moved 0.1degreeNorth
Moved 0.2degreesNorth
Moved 0.3degreesNorth
Moved 0.4degreesNorth
Moved 0.5degreesNorth
Insu
red
loss
es, $
Bil
lion
s
•Each 0.1 degree equals about 7 miles
•A path of 0.3 degrees north of Andrew’s original location would create a direct hit on Miami
•Estimates are losses in today’s dollars after application of deductibles.

2000 Capacity of Florida Property Insurance Market
$11 Billion Capacity
$7.36B Bonding Capacity (Includes Loss Adj. Expenses)
$3.64B Cash*
$3.212B Industry Agg. Retention
$1.8
96B
Ind
.
Co-
paym
ents
$16.
1B O
vera
ll I
ndus
try
Los
s
*Projected for year-end 2000
Source: Florida Hurricane Catastrophe Fund

-$2.2-$2.8
-$4.0
-$2.9
-$5.4
-$0.3
-$2.6 -$2.4
-$3.6
-$8.9
-$6.5
-$11.5($12)
($10)
($8)
($6)
($4)
($2)
$01
99
1
19
92
19
93
19
94
19
95
19
96
19
97
19
98
19
99
20
00
20
01
E
20
02
F
Insurers Not Anxious to Assume Wind Risk in FL: U.S. UW Loss in HO Insurance, 1991-2002F
Source: A.M. Best, Insurance Information Institute
$ B
illi
ons
Underwriting losses in US homeowners insurance from 2000 to 2002 alone are
estimated at $19.0 billion, 14.5% above the $16.6 billion in 9/11 property losses.
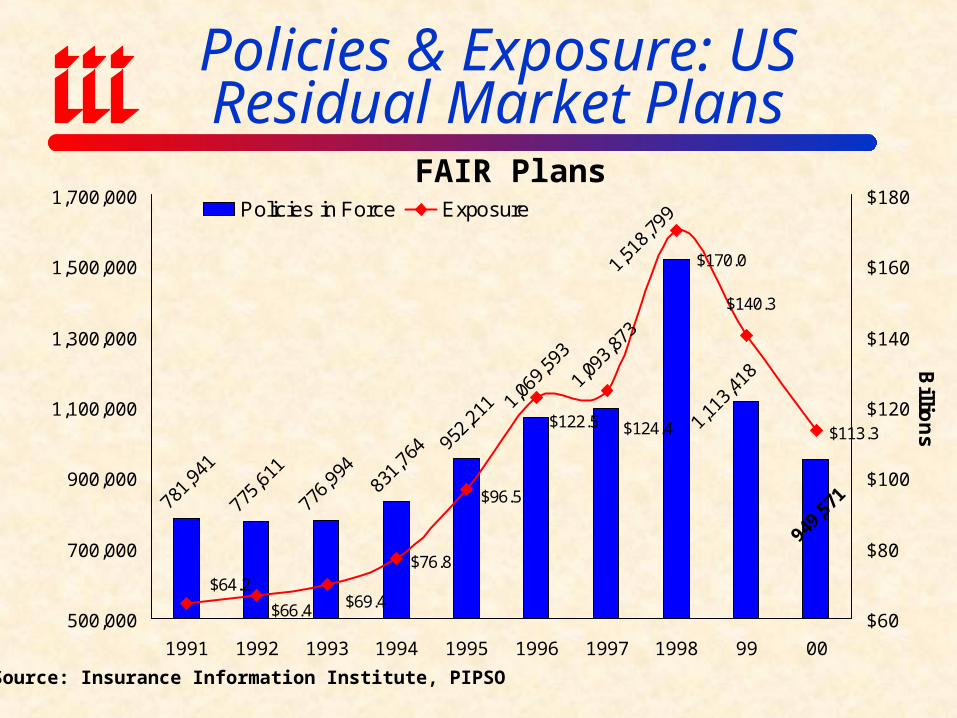
Policies & Exposure: US Residual Market Plans
781,
941
775,
611
776,
994
831,
764 95
2,21
1 1,06
9,59
3
949,
571
1,11
3,41
81,09
3,87
3
1,51
8,79
9
$113.3
$140.3
$170.0
$124.4$122.5
$96.5
$76.8
$69.4$66.4
$64.2
500,000
700,000
900,000
1,100,000
1,300,000
1,500,000
1,700,000
1991 1992 1993 1994 1995 1996 1997 1998 99 00
$60
$80
$100
$120
$140
$160
$180
Billio
ns
Policies in Force Exposure
Source: Insurance Information Institute, PIPSO
FAIR Plans

Policies in Force: Florida P/C JUA
270,910
675,497
849,271
705,988
487,590
256,753
107,62867,901
102,792116,027
0
100,000
200,000
300,000
400,000
500,000
600,000
700,000
800,000
900,000
Dec-93 Dec-94 Dec-95 Dec-96 Dec-97 Dec-98 Dec-99 Dec-00 Dec-01 Feb-02
Source: Insurance Information Institute, PIPSO
JUA is showing signs of growth

Florida’s Windstorm Underwriting Association
505,
076
457,
818
502,
369
442,
146
319,
843
240,
824
192,
842
135,
724
61,0
74
57,3
05$92.6$86.4
$7.0 $7.5
$15.3
$27.0
$36.3
$49.5
$75.4
$91.1
50,000
150,000
250,000
350,000
450,000
550,000
650,000
1991 1992 1993 1994 1995 1996 1997 1998 1999 2000
$0
$10
$20
$30
$40
$50
$60
$70
$80
$90
$100
Billio
ns
Policies in Force Exposure
Source: Insurance Information Institute, PIPSO

Southeast States HomeownersInsurance Premiums vs. US
$861
$657$594
$505 $487$457 $448
$266
$0
$200
$400
$600
$800
$1,000
TX FL MS SC US AL GA WI
Source: Insurance Information Institute from NAIC Data, 1999.
Highest in USLowest in US

5% Business Closure Scenario

Figure 3A: 5% Hurricane Closure Scenario Number of Business Closures
Source: Insurance Information Institute from US Census of Manufactures data.
2,459
1,5321,272
921
401127
0
500
1,000
1,500
2,000
2,500
Dade
Browar
d
Palm B
ch
H'b
orou
gh Lee
Mon
roe
Estimated number of business establishments that would be closed assuming a 5% closure rate.

$3,828
$2,637
$1,523
$1,962
$500$137
$0$500
$1,000$1,500$2,000$2,500$3,000$3,500$4,000
Mil
lio
ns
Figure 3B: 5% Hurricane Closure Scenario Sales Lost
Source: Insurance Information Institute from Florida Department of Revenue data.
Estimated sales losses assuming a 5% establishment closure rate.
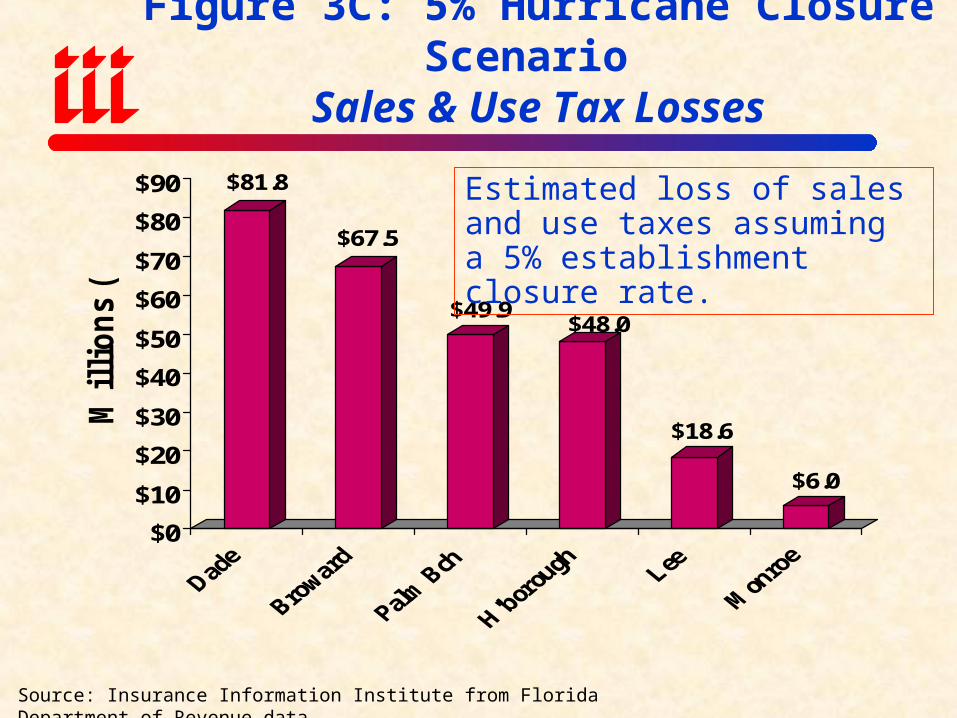
$81.8
$67.5
$49.9$48.0
$18.6
$6.0
$0
$10
$20
$30
$40
$50
$60
$70
$80
$90
Mil
lio
ns
($)
Estimated loss of sales and use taxes assuming a 5% establishment closure rate.
Figure 3C: 5% Hurricane Closure Scenario
Sales & Use Tax Losses
Source: Insurance Information Institute from Florida Department of Revenue data.

$798
$579
$432 $427
$113$23
$0$100$200$300$400$500$600$700$800
Mil
lion
s
Source: Insurance Information Institute from Florida Department of Revenue data.
Estimated payroll losses assuming a 5% establishment closure rate.
Figure 3D: 5% Hurricane Closure Scenario
Payroll Losses

30,036
22,039
15,64016,756
5,1511,184
0
5,000
10,000
15,000
20,000
25,000
30,000
35,000
Source: Insurance Information Institute from US Census of Manufactures data.
Estimated job losses assuming a 5% establishment closure rate.
Figure 3E: 5% Hurricane Closure Scenario
Job Losses

$4,708
$3,283
$2,004
$2,437
$631$165
$0
$1,000
$2,000
$3,000
$4,000
$5,000
Mil
lion
s ($
)
Dade
Browar
d
Palm B
ch
H'bor
ough Lee
Mon
roe
Source: Insurance Information Institute from US Census of Manufactures and Florida Department of Revenue data.
Figure 3F: 5% Hurricane Closure Scenario Total Losses
Estimated total lost revenue, sales & use tax and payroll assuming a 5% establishment closure rate.

10% Business Closure Scenario(approximates Hurricane
Andrew experience in 1992)

Figure 4A: 10% Hurricane Closure Scenario Number of Business Closures
Source: Insurance Information Institute from US Census of Manufactures data.
4,918
3,0632,543
1,842
802254
0500
1,0001,5002,0002,5003,0003,5004,0004,5005,000
Dade
Browar
d
Palm B
ch
H'b
orou
gh Lee
Mon
roe
Estimated number of business establishments that would be closed assuming a 10% closure rate.

$7,657
$5,273
$3,045
$3,925
$999$274
$0$1,000$2,000$3,000$4,000$5,000$6,000$7,000$8,000
Mil
lio
ns
Figure 4B: 10% Hurricane Closure Scenario Sales Lost
Source: Insurance Information Institute from Florida Department of Revenue data.
Estimated sales losses assuming a 10% establishment closure rate.

$163.7
$135.0
$99.9$95.9
$37.3
$11.9
$0
$20
$40
$60
$80
$100
$120
$140
$160
$180
Mil
lio
ns
($)
Estimated loss of sales and use taxes assuming a 10% establishment closure rate.
Figure 4C: 10% Hurricane Closure Scenario
Sales & Use Tax Losses
Source: Insurance Information Institute from Florida Department of Revenue data.

$1,596
$1,157
$863 $853
$226$45
$0$200$400$600$800
$1,000$1,200$1,400$1,600
Mil
lion
s
Source: Insurance Information Institute from Florida Department of Revenue data.
Estimated payroll losses assuming a 10% establishment closure rate.
Figure 4D: 10% Hurricane Closure Scenario Payroll Losses

60,072
44,079
31,28033,512
10,3032,369
0
10,000
20,000
30,000
40,000
50,000
60,000
70,000
Source: Insurance Information Institute from US Census of Manufactures data.
Estimated job losses assuming a 10% establishment closure rate.
Figure 4E: 10% Hurricane Closure Scenario Job Losses

$9,416
$6,566
$4,009
$4,874
$1,263$331
$0$1,000$2,000$3,000$4,000$5,000$6,000$7,000$8,000$9,000
$10,000
Mil
lion
s ($
)
Dade
Browar
d
Palm B
ch
H'bor
ough Lee
Mon
roe
Source: Insurance Information Institute from US Census of Manufactures and Florida Department of Revenue data.
Figure 4F: 10% Hurricane Closure Scenario Total Losses
Estimated total lost revenue, sales & use tax and payroll assuming a 10% establishment closure rate.

Has Florida Learned Anything over the Past Decade?

Education
Mitigating Catastrophe Risk
Financial Incentives
Mitigation
Regulation
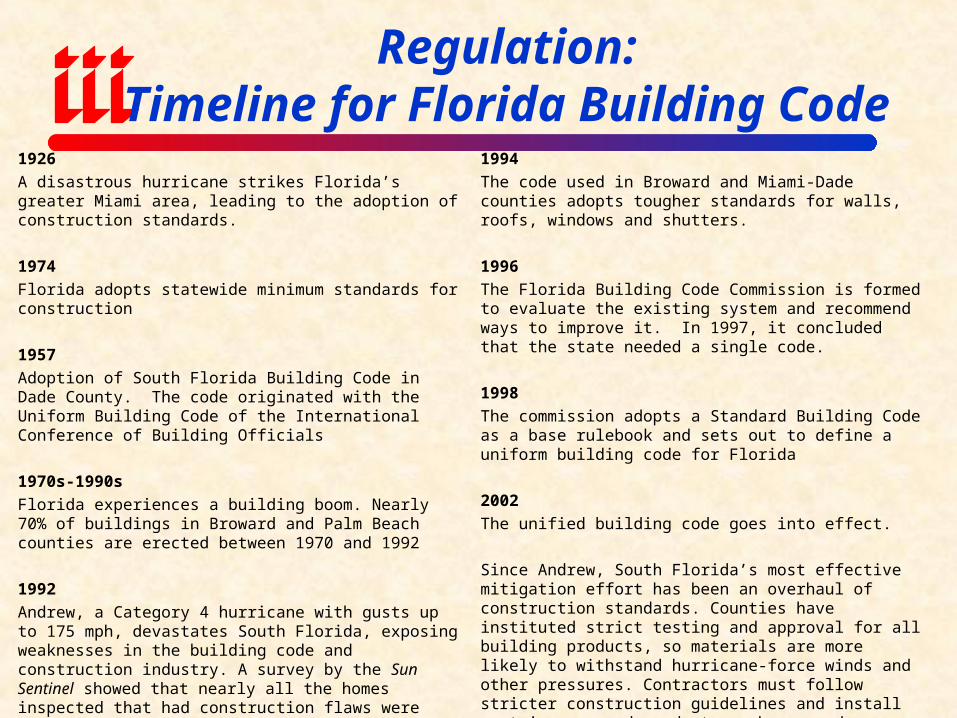
Regulation:Timeline for Florida Building Code
1926
A disastrous hurricane strikes Florida’s greater Miami area, leading to the adoption of construction standards.
1974
Florida adopts statewide minimum standards for construction
1957
Adoption of South Florida Building Code in Dade County. The code originated with the Uniform Building Code of the International Conference of Building Officials
1970s-1990s
Florida experiences a building boom. Nearly 70% of buildings in Broward and Palm Beach counties are erected between 1970 and 1992
1992
Andrew, a Category 4 hurricane with gusts up to 175 mph, devastates South Florida, exposing weaknesses in the building code and construction industry. A survey by the Sun Sentinel showed that nearly all the homes inspected that had construction flaws were built between 1975 and 1992, during the peak of South Florida’s residential growth. A survey conducted to identify code violations and construction deficiencies concluded that the majority of failures were attributed to noncompliance with the prescriptive requirements of the area building code
1994
The code used in Broward and Miami-Dade counties adopts tougher standards for walls, roofs, windows and shutters.
1996
The Florida Building Code Commission is formed to evaluate the existing system and recommend ways to improve it. In 1997, it concluded that the state needed a single code.
1998
The commission adopts a Standard Building Code as a base rulebook and sets out to define a uniform building code for Florida
2002
The unified building code goes into effect.
Since Andrew, South Florida’s most effective mitigation effort has been an overhaul of construction standards. Counties have instituted strict testing and approval for all building products, so materials are more likely to withstand hurricane-force winds and other pressures. Contractors must follow stricter construction guidelines and install certain approved products on homes and businesses. Hurricane shutters must pass stringent impact and wind tests.
Source: Best’s Review, June 2002 (Risk Management Solutions)

What Insurers are Doing: Education
• Most insurers have catastrophe safety information on their web sites:
• Similar information available through trade associations:Insurance Information Institute: www.iii.orgInstitute for Building and Home Safety:
www.ibhs.org

What Insurers are Doing: Education (continued)
Mitigation of Property DamageSecondary issue in earthquakes (though not mutually
exclusive from preservation of life)Excellent information available from IBHS
Buying appropriate catastrophe coverage III good source of informationBanks/agents sometimes weak link in chainLessons from Floyd: Flood insurance, windstorm
deductibles

What Insurers are Doing: Education•Also from IBHS “Open for Business: Disaster Recovery Guide for Small Business”
•III Brochures/web: “Am I Covered: Common Questions Asked by Homeowners about Insurance”
“Settling Insurance Claims after a Disaster”
“Insuring Your Business Against a Catastrophe”
Available free from IBHS at www.ibhs.org

What Insurers are Doing: Mitigation
• Sponsor research (and education) through IBHS and other organizations
• Support state and local efforts to strengthen building codes (ISO BCEGS Program):Building Code Effectiveness Grading Schedule

Financial Incentives
• Discounts
• Mandatory 2% wind deductibles
• Higher premiums
• Excluding wind
• Refusal to write beachfront properties

Running Against the Wind?Is Florida in Denial
• Serious Obstacles to Reducing CAT Losses in FLUnwillingness to significantly alter land use policiesNo risk-based lending practicesPolitical/lobbying efforts by developers, real estate interests defeat
restrictionsHomeowners oppose added cost to dwellingsSubsidies (e.g., flood insurance, rate suppression)Continued strong demographics
# housing units rising by 4%+ in FL, 2% nationally 17% increase in number of commercial/residential units, & 50% increase in replacement value of properties 1992-2002
• FEMA—Will emphasis shift to “Homeland Security?” FEMA was an “independent” agency with 5,100 employees Added layers of bureaucracy? Reduced effectiveness? Loss of focus?

Mitigation: Much, Much More Needed
• Mitigation is an Effective Tool, But Impact so Far Limited—Much more to be done!Only 15-20% of S. FL building stock
constructed since 1994Loss reduction of post 1994-buildings only
about 10%Even if replaced entire stock, impact would be
modest
Insurance Information Institute On-Line
If you would like a copy of this presentation, please give me your business card with e-mail address
