the life science dashboard - perceptaassociates.com file© 2005-2013 percepta associates, inc. the...
TRANSCRIPT

© 2005-2012 Percepta Associates, Inc.
877 822 2638 www.perceptaassociates.com 1 SERIESTWO JAN 13
THE LIFE SCIENCE DASHBOARD™
Key market indicators at a glance
Quantitative Immunoassay Dashboard – Survey
Questionnaire
(North America & Europe)

© 2005-2013 Percepta Associates, Inc.
THE LIFE SCIENCE DASHBOARD™
Key market indicators at a glance
877 597 9236 www.perceptaassociates.com 2
The Life Science Dashboards™ from Percepta Associates, Inc.
Copyright 2013 by Percepta Associates, Inc., 2111 Palomar Airport Rd, Suite 120, Carlsbad CA 92011. All rights reserved. This report may not be reproduced by any means in whole or in part without written permission from Percepta Associates, Inc. Reproduction and redistribution is strictly forbidden by United States and international law. Copies of this report may be ordered from Percepta Associates. To place an order, call 877-597-9236 or visit the publications section of our webpage at http://www.perceptaassociates.com/publications/. Notice: The information, data and estimates in this report have been obtained from sources believed to be reliable. Every reasonable effort has been made to verify their accuracy. Information contained in this report is very time-sensitive. Please note the publication date. While all reasonable steps have been taken to ensure the accuracy of the information presented, Percepta Associates cannot accept responsibility for inadvertent errors or omissions. Percepta Associates also takes no responsibility for any incorrect information supplied to us by survey participants. The market information contained herein is based on survey responses and information obtained from the public domain and therefore is subject to interpretation.

© 2005-2013 Percepta Associates, Inc.
THE LIFE SCIENCE DASHBOARD™
Key market indicators at a glance
877 597 9236 www.perceptaassociates.com 3
The Life Science Dashboards™ from Percepta Associates, Inc.
Key indicators shown in each segment specific dashboard include:
Market size Market share Market growth and sample/reaction throughput rates Customer satisfaction Propensity to switch Competitive intensity Perceived pricing Top suppliers Technique usage frequency Fastest growing techniques Primary downstream applications
Quantitative results are graphically represented for each question and when applicable verbatim quotations are included for qualitative support and clarification. An overview “key market indicator dashboard” is provided for quick reference.
Recognizing that professionals in research supply companies need timely, relevant and practical life science market intelligence to form a fact-based foundation for decision making, Percepta Associates developed The Life Science Dashboard™ series of market intelligence reports. The Life Science Dashboard™ is the most accessible source for current, segment specific, life science market intelligence in the industry. Designed and implemented by industry experts, The Life Science Dashboard™ provides key market indicators compiled from the survey responses of thousands of qualified researchers actively engaged in the relevant segment applications. Unlike other reports, The Life Science Dashboard™ features an at-a-glance format that provides rapid access to actionable key market indicators in an easy to understand framework.

© 2005-2013 Percepta Associates, Inc.
THE LIFE SCIENCE DASHBOARD™
Key market indicators at a glance
4
Percepta launched Series One of the Life Science Dashboards™ in early 2007, designed to establish a benchmark of the existing market landscape. The release of subsequent series of each Dashboard furthers our primary objective of regularly sampling the research landscape to give Dashboard readers a comprehensive, relevant and dynamic view of how important life science markets are adapting to new products, new competitors, and new sales and marketing strategies. Note that throughout this report, you will see the following icons: These icons and their associated values represent the changes observed in the 2013 Quantitative Immunoassay Dashboard data set in comparison to the corresponding data from the 2011 Quantitative Immunoassay Dashboard.
For example, in Figure 9 of this report, the percentage of respondents performing Western Blot at least once every six months is 83.2%, a decrease of 2.0 percentage points when compared to the 2011 Quantitative Immunoassay Dashboard value of 85.2%. There are instances where comparisons to the 2011 Quantitative Immunoassay Dashboard are not possible due to improvements in survey design and to improve the overall quality of the data:
The segment Standard Colorimetric/Chemiluminescent ELISA from the 2011 Dashboard is re-defined as two separate segments in this 2013 Quantitative Immunoassay Dashboard: Colorimetric ELISA and Chemiluminescent ELISA The frequency of performance of various immunoassay methods and share of mention questions are also revised
The Life Science Dashboards™ from Percepta Associates, Inc.
Life Science Dashboards™ Available Quantitative Immunoassay Dashboard January 2013 Series Two NA & EU Cat. #1301IMM April 2011 Series One NA & EU Cat. # 1104IMM Cell Culture Dashboard September 2012 Series One China Cat. # 1209CCC September 2012 Series Four NA & EU Cat. # 1209CCT July 2010 Series Three NA & EU Cat. # 1007CCT December 2008 Series Two NA & EU Cat. # 0812CCT January 2007 Series One NA & EU Cat. # 0702CCT Gene Expression Profiling Dashboard April 2012 Series Four NA & EU Cat. # 1204GEP February 2010 Series Three NA & EU Cat. # 1002GEP April 2008 Series Two NA & EU Cat. # 0804GEP February 2007 Series One NA & EU Cat. # 0702GEP Protein Electrophoresis and Western Analysis Dashboard January 2012 Series One NA & EU Cat. # 1201PEW Flow Cytometry Dashboard July 2011 Series One NA & EU Cat. # 1107FCM Gene Silencing Dashboard September 2010 Series Three NA & EU Cat. # 0910GSL September 2008 Series Two NA & EU Cat. # 0809GSL February 2007 Series One NA & EU Cat. # 0702GSL Nucleic Acid Separation Dashboard November 2008 Series One NA & EU Cat. # 0811SEP
% Increase from the 2011 Quantitative Immunoassay Dashboard™
% Decrease from the 2011 Quantitative Immunoassay Dashboard™
877 597 9236 www.perceptaassociates.com

© 2005-2013 Percepta Associates, Inc.
THE LIFE SCIENCE DASHBOARD™
Key market indicators at a glance
5
The Life Science Dashboards™ from Percepta Associates, Inc.
Life Science Dashboards™ Available (cont.) Nucleic Acid Amplification Dashboard September 2011 Series Three NA & EU Cat. # 1109NAA July 2009 Series Two NA & EU Cat. # 0907NAA January 2007 Series One NA & EU Cat. # 0701NAA Transfection Dashboard October 2009 Series Two NA & EU Cat. # 0910TFN January 2007 Series One NA & EU Cat. # 0701TFN Nucleic Acid Purification Dashboard September 2011 Series Three NA & EU Cat. # 1109NAP June 2009 Series Two NA & EU Cat. # 0906NAP January 2007 Series One NA & EU Cat. # 0701NAP For more information on these Life Science Dashboards™ and upcoming Dashboards please visit www.perceptaassociates.com.
877 597 9236 www.perceptaassociates.com

© 2005-2013 Percepta Associates, Inc.
THE LIFE SCIENCE DASHBOARD™
Key market indicators at a glance
877 597 9236 www.perceptaassociates.com 6
The Life Science Dashboard™ is produced by Percepta Associates, Inc. Percepta is a strategic consultancy firm focused on helping life science tool companies. Since our founding in 2005 we have provided a broad range of specialized market research, strategic and tactical planning services to life science tool providers. Our team is comprised of industry experts with first hand practical experience and a proven track record of successful leadership in life science companies. It is precisely our in-depth knowledge and practical experience in this segment that makes Percepta unique. Percepta offers custom primary market research services, in addition to periodically publishing a number of segment specific Life Science Dashboards™. Our primary research services utilize the following research methodologies – online surveys, focus groups and telephone or face-to-face in-depth interviews to capture the voice of the customer. Percepta maintains a profiled panel of over 60,000 life scientists worldwide. This panel provides a rich and qualified source of timely input for the Life Science Dashboard™ surveys and for custom market research projects. Our panel was built, and is continually supplemented, with researcher contacts from scientific societies, journals, scientific meeting participants and other qualified sources. For more information about Percepta’s market research and consulting services please visit our website at www.perceptaassociates.com or call 877 597 9236.
About Percepta Associates, Inc.

© 2005-2013 Percepta Associates, Inc.
THE LIFE SCIENCE DASHBOARD™
Key market indicators at a glance
877 597 9236 www.perceptaassociates.com 7
Survey Questionnaire
Immunoassay/ELISA Questionnaire Thank you for agreeing to participate in the Immunoassay Survey. Your answers will be used in aggregate with other survey participants to help life science product suppliers develop systems with the performance characteristics that are most important to you. The survey should take approximately 15 minutes to complete, based on the breadth of techniques each participant currently performs. Important: only one response is allowed per survey per participant. Please begin by maximizing your browser window and answering the first question below. Use the scroll bar and mouse to navigate the questions on each page and click the "Next" button at the bottom of each page to move forward when you reach it. We thank you in advance for your time.
QA. How often do you or others in your laboratory perform immunoassay experiments? Please choose one.
Weekly A few times per month A few times per year Do not perform - but I plan to in the next 12 months (go to QB) Do not perform - have no future plans to perform (disqualify)
QB. Which of the following immunoassay methods do you or others in your laboratory plan to perform in the next 12 months? Please choose all that apply.
Colorimetric ELISA Chemiluminescent ELISA Fluorescent ELISA Electrochemiluminescence immunoassays Bead-based immunoassays
(disqualify)
Q1. Which of the following immunoassay methods do you or others in your laboratory currently perform? Please choose all that apply. If you do not perform any of the following immunoassay methods, click "Next".
Colorimetric ELISA Chemiluminescent ELISA Fluorescent ELISA Electrochemiluminescence immunoassays Bead-based immunoassays
Q2. Which of the following additional protein related methods do you or others in your laboratory perform at least once every six months? Please choose all that apply.
Chromosomal immunoprecipitation (ChIP) ELISpot Flow cytometry of cells Gel shift Immunocytochemistry (ICC) Immunofluorescence Immunohistochemistry (IHC) Immunoprecipitation Mass Spectrometry Protein NMR Protein Quantification Protein/Antibody Microarray (i.e.,planar array format) Western Blot None of the above

© 2005-2013 Percepta Associates, Inc.
THE LIFE SCIENCE DASHBOARD™
Key market indicators at a glance
877 597 9236 www.perceptaassociates.com 8
Survey Questionnaire
Q3. How often do you perform each of the following types of immunoassay experiments? Please make one selection for each type of experiment. Colorimetric ELISA Chemiluminescent ELISA Fluorescent ELISA Electrochemiluminescence immunoassays Bead-based immunoassays
Weekly A few times per month A few times per year
Q3a. Do you plan to perform any of the following immunoassay methods in the next 12 months? Colorimetric ELISA Chemiluminescent ELISA Fluorescent ELISA Electrochemiluminescence immunoassays Bead-based immunoassays
Do not perform- but I plan to in the next 12 months Do not perform - I have no future plans to perform
Q4. Considering your laboratory usage, which formats of immunoassay reagents do you prefer to purchase? Colorimetric ELISA Chemiluminescent ELISA Fluorescent ELISA Electrochemiluminescence immunoassays Bead-based immunoassays Most Preferred
Individual reagents sold separately Individually optimized reagents (e.g. antibody matched pairs, detection reagents only) Fully optimized kits (e.g. includes precoated plates)
Second Most Preferred Individual reagents sold separately Individually optimized reagents (e.g. antibody matched pairs, detection reagents only) Fully optimized kits (e.g. includes precoated plates)
Q5a. For Colorimetric ELISAs that you perform, who is your primary REAGENT supplier?
Abcam BD Biosciences Life Technologies/Invitrogen R&D Systems Sigma Aldrich Thermo Fisher Scientific/Pierce KPL Affymetrix/eBioscience GE Healthcare/Amersham Other ___________________________________
Q5a1. For Chemiluminescent ELISAs that you perform, who is your primary reagent supplier?
Affymetrix/eBioscience EMD Millipore GE Healthcare/Amersham KPL Life Technologies/Invitrogen Roche Applied Science Sigma Aldrich Thermo Fisher Scientific/Pierce Other, please specify ______________________
© 2005-2013 Percepta Associates, Inc.
THE LIFE SCIENCE DASHBOARD™
Key market indicators at a glance
877 597 9236 www.perceptaassociates.com 9
Survey Questionnaire
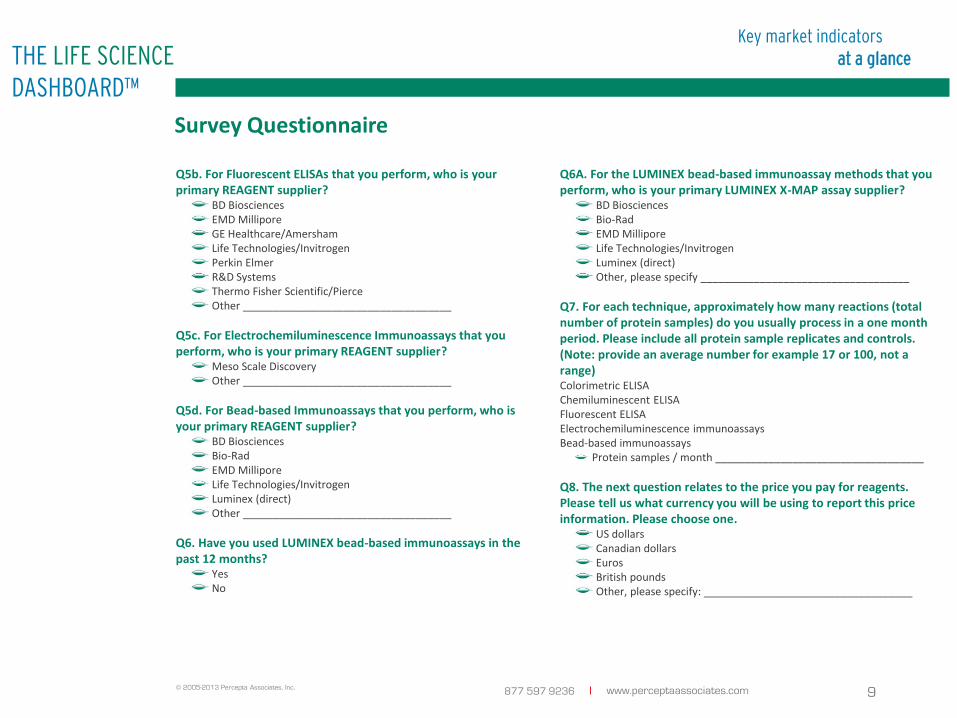
Q5b. For Fluorescent ELISAs that you perform, who is your primary REAGENT supplier?
BD Biosciences EMD Millipore GE Healthcare/Amersham Life Technologies/Invitrogen Perkin Elmer R&D Systems Thermo Fisher Scientific/Pierce Other ___________________________________
Q5c. For Electrochemiluminescence Immunoassays that you perform, who is your primary REAGENT supplier?
Meso Scale Discovery Other ___________________________________
Q5d. For Bead-based Immunoassays that you perform, who is your primary REAGENT supplier?
BD Biosciences Bio-Rad EMD Millipore Life Technologies/Invitrogen Luminex (direct) Other ___________________________________
Q6. Have you used LUMINEX bead-based immunoassays in the past 12 months?
Yes No
Q6A. For the LUMINEX bead-based immunoassay methods that you perform, who is your primary LUMINEX X-MAP assay supplier?
BD Biosciences Bio-Rad EMD Millipore Life Technologies/Invitrogen Luminex (direct) Other, please specify ___________________________________
Q7. For each technique, approximately how many reactions (total number of protein samples) do you usually process in a one month period. Please include all protein sample replicates and controls. (Note: provide an average number for example 17 or 100, not a range) Colorimetric ELISA Chemiluminescent ELISA Fluorescent ELISA Electrochemiluminescence immunoassays Bead-based immunoassays
Protein samples / month ___________________________________
Q8. The next question relates to the price you pay for reagents. Please tell us what currency you will be using to report this price information. Please choose one.
US dollars Canadian dollars Euros British pounds Other, please specify: ___________________________________

© 2005-2013 Percepta Associates, Inc.
THE LIFE SCIENCE DASHBOARD™
Key market indicators at a glance
877 597 9236 www.perceptaassociates.com 10
Survey Questionnaire
Q9. For each technique that you perform, what is the current price you are paying per reaction (price per protein data point)? Please enter a real number, for example 1.25 or 3.00, not a range and omit the currency sign. Colorimetric ELISA Chemiluminescent ELISA Fluorescent ELISA Electrochemiluminescence immunoassays Bead-based immunoassays
Price per protein data point _______________________________
Q10. How confident are you regarding your estimates of experimental throughput and cost per reaction that you provided in Q7 and Q9? I’m very confident my responses are calculated from existing records (i.e. lab notebooks, ordering records) My estimates are a close approximation based on my recall of past history I have provided a best guess
Experimental throughput Price per protein data point
Q11. For each technique listed below, how do you expect the number of reactions to change over the next 12 months? Please choose one for each technique. In one sentence please briefly explain why your usage is expected to increase or decrease (if your usage will "stay the same", please write Not Applicable in the comments). Ignore rows that are blank. Colorimetric ELISA Chemiluminescent ELISA Fluorescent ELISA Electrochemiluminescence immunoassays Bead-based immunoassays
Increase >20% Increase 10-20% Increase 5-10% Increase 3-5% Stay about the same Decrease 3-5% Decrease 5-10% Decrease 10-20% Decrease >20% Stop using altogether Please briefly explain why________________________________

© 2005-2013 Percepta Associates, Inc.
THE LIFE SCIENCE DASHBOARD™
Key market indicators at a glance
877 597 9236 www.perceptaassociates.com 11
Survey Questionnaire
Q12. For each of the immunoassay methods you perform, which of the following is the primary focus or application of your protein analysis research? (Choose one) Colorimetric ELISA Chemiluminescent ELISA Fluorescent ELISA Electrochemiluminescence immunoassays Bead-based immunoassays
Cancer Cardiovascular Disease Cell Biology Developmental Biology Genetic Analysis Hematology Immunology Infectious Disease Inflammation Metabolic Disease Microbiology Neuroscience Systems Biology Vascular Biology
Q13. If other selected in Q12 above, please specify: Colorimetric ELISA Chemiluminescent ELISA Fluorescent ELISA Electrochemiluminescence immunoassays Bead-based immunoassays
Other , please specify___________________________________
Q14. For the immunoassay methods you perform, which of the following protein classes/categories are used?(Choose all that apply)
Apoptosis Cell cycle Cell proliferation Cell structure Cell surface antigens/receptors Chemokines Cytokines Epigenetics Growth factors Inflammatory factors Kinases Nuclear receptors Signal transduction Stem cell Transcription factors Other, please specify ___________________________________
Q15. Which of the following answers most closely applies to your current usage of immunoassay products? Colorimetric ELISA Chemiluminescent ELISA Fluorescent ELISA Electrochemiluminescence immunoassays Bead-based immunoassays
I'm satisfied with the product that I am using now - no interest in switching to a different supplier at this time I'm interested in switching to a product that outperforms what I am using now I'm interested in switching to a product from a company that offers better service and support I'm interested in switching to a lower priced product I'm interested in switching to a product that is stocked at my site in a supply center or storeroom

© 2005-2013 Percepta Associates, Inc.
THE LIFE SCIENCE DASHBOARD™
Key market indicators at a glance
877 597 9236 www.perceptaassociates.com 12
Survey Questionnaire
Q16. For each of the protein analysis methods you use, have you switched suppliers in the last 6 months? Please select yes or no. Colorimetric ELISA Chemiluminescent ELISA Fluorescent ELISA Electrochemiluminescence immunoassays Bead-based immunoassays
Yes No
Q17. Please rank the top three features of products for protein analysis that most influence your decision to choose a particular immunoassay reagent or kit for your research. Most Important Second Most Important Third Most Important
Ability to perform multiplexed immunoassays (quantify multiple analytes simultaneously) Convenient system for online ordering of product Dynamic range of assay Ease of use Hands on time required On-site availability of product (in supply room or storeroom) Price per experiment Publications/citations using the product References from colleagues Reproducibility of assay Reputation of supplier/product brand Sensitivity of immunoassay Specificity of immunoassay Technical support offered by supplier Throughput of assay (ability to process multiple samples simultaneously)
Q18. Imagine you are in charge of product development for a leading supplier of immunoassay products. What immediate additions/changes etc. would you make to your current and future products? __________________________________________________________________________________________________________________________________________________________________________________________
Q19. How many people work in the lab in which you are employed? Please fill in each blank with a whole number, not a range and estimate if necessary.
Total number of lab employees:_____ Number of employees that regularly perform experiments:_____ Number of employees that perform immunoassay experiments at least a few times each year _____

© 2005-2013 Percepta Associates, Inc.
THE LIFE SCIENCE DASHBOARD™
Key market indicators at a glance
877 597 9236 www.perceptaassociates.com 13
Survey Questionnaire
Q20. How often do you perform each of the following Life Science techniques? Please make one selection for each technique. Amplification (PCR or qPCR) Apoptosis Assays Cell Proliferation Cell Viability/Cytotoxicity Assays DNA Damage in vitro Translation Kinase Assays Mammalian Cell Culture Microscopy (fluorescent) miRNA Analysis Mutagenesis Phosphatase Assays Protease Assays Protein Expression Protein Tags Reporter Gene Assays siRNA Gene Knockdown Transcription Factor Binding Assays Transfection
Weekly A few times per month A few times per year Do not perform - but I plan to in the next 12 months Do not perform - no future plans to perform
Q21. What are your areas of expertise/specialization? Please select all that apply. You must make at least one selection.
Biochemistry Bioprocessing/Bioproduction Cardiovascular Studies Cell Biology Developmental Biology Diagnostics Drug Discovery Drug Development Endocrinology/Metabolism Genetics Genomics Immunology Molecular Biology Microbiology/Infectious Disease/Virology Neuroscience Oncology Pathology Pharmacology Physiology Plant Sciences/Agriculture Proteomics Systems Biology Other, please specify: ___________________________________
© 2005-2013 Percepta Associates, Inc.
THE LIFE SCIENCE DASHBOARD™
Key market indicators at a glance
877 597 9236 www.perceptaassociates.com 14
Survey Questionnaire
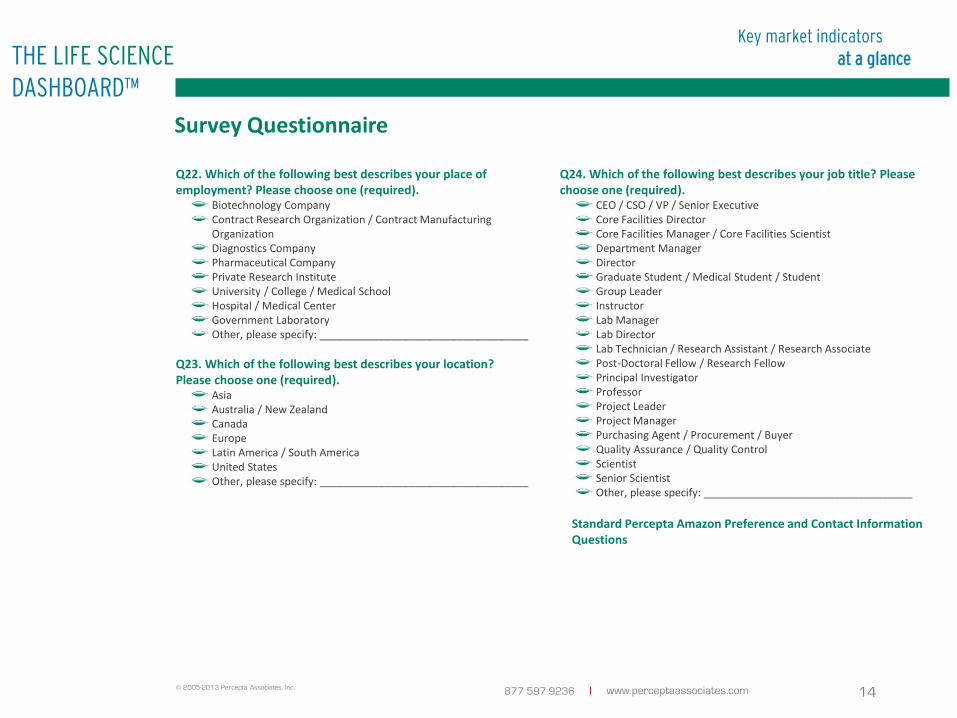
Q22. Which of the following best describes your place of employment? Please choose one (required).
Biotechnology Company Contract Research Organization / Contract Manufacturing Organization Diagnostics Company Pharmaceutical Company Private Research Institute University / College / Medical School Hospital / Medical Center Government Laboratory Other, please specify: ___________________________________
Q23. Which of the following best describes your location? Please choose one (required).
Asia Australia / New Zealand Canada Europe Latin America / South America United States Other, please specify: ___________________________________
Q24. Which of the following best describes your job title? Please choose one (required).
CEO / CSO / VP / Senior Executive Core Facilities Director Core Facilities Manager / Core Facilities Scientist Department Manager Director Graduate Student / Medical Student / Student Group Leader Instructor Lab Manager Lab Director Lab Technician / Research Assistant / Research Associate Post-Doctoral Fellow / Research Fellow Principal Investigator Professor Project Leader Project Manager Purchasing Agent / Procurement / Buyer Quality Assurance / Quality Control Scientist Senior Scientist Other, please specify: ___________________________________
Standard Percepta Amazon Preference and Contact Information Questions