the links between disasters, relief, …summit.sfu.ca/system/files/iritems1/10078/etd5982.pdf ·...
TRANSCRIPT

THE LINKS BETWEEN DISASTERS, RELIEF,
REHABILITATION AND DEVELOPMENT
by
Lynn Chido Mawunganidze BBA, University of Toronto Scarborough, 2008
PROJECT SUBMITTED IN PARTIAL FULFILLMENT OF THE REQUIREMENTS FOR THE DEGREE OF
MASTER OF PUBLIC HEALTH
In the Faculty of Health Sciences
© Lynn Chido Mawunganidze, 2010
SIMON FRASER UNIVERSITY
Spring 2010
All rights reserved. However, in accordance with the Copyright Act of Canada, this work may be reproduced, without authorization, under the conditions for Fair Dealing. Therefore, limited reproduction of this work for the purposes of private
study, research, criticism, review and news reporting is likely to be in accordance with the law, particularly if cited appropriately.

Last revision: Spring 09
Declaration of Partial Copyright Licence
The author, whose copyright is declared on the title page of this work, has granted to Simon Fraser University the right to lend this thesis, project or extended essay to users of the Simon Fraser University Library, and to make partial or single copies only for such users or in response to a request from the library of any other university, or other educational institution, on its own behalf or for one of its users.
The author has further granted permission to Simon Fraser University to keep or make a digital copy for use in its circulating collection (currently available to the public at the “Institutional Repository” link of the SFU Library website <www.lib.sfu.ca> at: <http://ir.lib.sfu.ca/handle/1892/112>) and, without changing the content, to translate the thesis/project or extended essays, if technically possible, to any medium or format for the purpose of preservation of the digital work.
The author has further agreed that permission for multiple copying of this work for scholarly purposes may be granted by either the author or the Dean of Graduate Studies.
It is understood that copying or publication of this work for financial gain shall not be allowed without the author’s written permission.
Permission for public performance, or limited permission for private scholarly use, of any multimedia materials forming part of this work, may have been granted by the author. This information may be found on the separately catalogued multimedia material and in the signed Partial Copyright Licence.
While licensing SFU to permit the above uses, the author retains copyright in the thesis, project or extended essays, including the right to change the work for subsequent purposes, including editing and publishing the work in whole or in part, and licensing other parties, as the author may desire.
The original Partial Copyright Licence attesting to these terms, and signed by this author, may be found in the original bound copy of this work, retained in the Simon Fraser University Archive.
Simon Fraser University Library Burnaby, BC, Canada
iii
ABSTRACT
This capstone discusses the relations between disasters, disaster relief
and rehabilitation, and development. Natural disasters frequency and severity
has increased over the last few decades with greater impacts on developing
countries further impeding achievement of the Millennium Development Goals
(MDGs). This capstone uses the Bangladesh floods, 2004 and the Asian tsunami
in Sri Lanka, 2004 as case studies to assess the disaster response and
development efforts undertaken in promoting development. Three main
recommendations are given; (1) Build capacity to implement and maintain
disaster reduction systems (2) Include elements of disaster reduction in
developments efforts (3) Include elements of development in disaster response
efforts. Potential challenges for achieving these recommendations are also
described.
Keywords: Natural disasters; Development; Developing countries ; Millennium Development Goals (MDGs); Risk reduction; Relief; Rehabilitation

iv
DEDICATION
To SIR(L) -
This initially simply read...
For always teaching me to live and to love
YOU are the Best of the Best!
Now I add...
For a moment we forgot everything else that was not going
right and rejoiced,
I hope this capstone will always bring you moments of joy.
v
ACKNOWLEDGEMENTS
Let me start by thanking the residents of Barmer for their inspiration in the
formulation and writing of this capstone. I hope this capstone will also bring
inspiration to your lives and your community.
I would like to thank my mum and dad for awarding me opportunities to
bring myself to this place. I know that these opportunities were the result of
numerous sacrifices on their part, I will be forever grateful. Thanks to my brother,
who always knows how to make me laugh and get me through everything. I am
grateful to my entire family for always being there for me, from spelling
homework to the writing of this capstone. Your encouragement and support has
carried me through many sleepless nights.
I am also grateful to my relatives, friends, classmates, acquaintances and
strangers who have all been instrumental in teaching me all that I know. Whether
it was a chat over lunch, on the bus, a phone conversation, in a lecture, I have
learnt from them even more than I may have realized at the time. For every
conversation that challenged my thoughts and widened my views, I thank you.
I would also like to thank Michel Joffres and Tim Takaro for being great
supervisors. Thank you for imparting your knowledge in the writing of this
capstone. I know the process was one fast roller coaster, but you stood by me

vi
with such poise and confidence, and for that, I am forever grateful. I would also
like to thank Jen Van Rassel for her support during the entire process.
Thank you to my „chief editors‟, Sam, Iris & Ricky Mawunganidze,
Aashima Garg, and „Lanre Medu, who took time out of their busy schedules and
their leisure to change the „A‟s into „B‟s and make this document simply perfect.
Thank you Leslie Ribeiro for also helping me articulate my thoughts on paper.
To all those that who endured the many hours in the computer lab with
me, the encouragement and laughter carried me further than I could have gone
alone. I hope that you will find the same encouragement when you write your
own capstones.
Finally yet importantly, I would like thank God for the many blessings that
He has bestowed on my life. He prepared the way before I even considered it,
allowed me to forge my own path and aided me with many miracles to help me
along the way. Thank you Lord.

vii
TABLE OF CONTENTS
Approval ........................................................................................................................ ii
Abstract ........................................................................................................................ iii
Dedication ..................................................................................................................... iv
Acknowledgements ....................................................................................................... v
Table of Contents ........................................................................................................ vii
List of Figures .............................................................................................................. ix
List of Tables ................................................................................................................. x
Glossary ........................................................................................................................ xi
Preface ......................................................................................................................... xv
Introduction ................................................................................................................... 1
Capstone Overview ......................................................................................................... 1
Description of Disasters .................................................................................................. 3
Disaster Statistics & Impacts ........................................................................................... 5
Disaster Management ................................................................................................... 10
Key Players in Disaster Management ............................................................................ 12
Guidelines for Disaster Management ............................................................................ 13
Disasters and Development .......................................................................................... 17
Development ................................................................................................................. 20
Disasters and Development: Reasons to care ............................................................... 21
Methods ....................................................................................................................... 28
Limitations ..................................................................................................................... 32
Findings ....................................................................................................................... 34
Case Study: Tsunami in Sri Lanka ................................................................................ 34
Case Study: Bangladesh Floods ................................................................................... 38
Discussion ................................................................................................................... 41
Relevance to Current Context ....................................................................................... 51
Recommendations ...................................................................................................... 53
Potential Challenges of Recommendations ................................................................... 56

viii
Conclusion .................................................................................................................. 58
Appendices .................................................................................................................. 59
Appendix 1: ................................................................................................................... 59
SCHR‟s Code of Conduct for Humanitarian Organizations .................................... 59 Priorities of the Hyogo Action Framework.............................................................. 60 Case Studies Rejected (met first four criteria) ....................................................... 61
Appendix 2: Tables ....................................................................................................... 62
Appendix 3: Figures ...................................................................................................... 68
Bibliography ................................................................................................................ 71
ix
LIST OF FIGURES
Figure 1: Graph of number of natural disasters reported between 1975 and 2008. ......... 6
Figure 2: Graph of number of people affected by natural disaster from 1975 to 2008 ................................................................................................................ 7
Figure 3: Graph of Estimated damages due to natural disasters from 1975 to 2008.. .............................................................................................................. 8
Figure 4: Disaster Management Cycle........................................................................... 10
Figure 5: Noji's Disaster Cycle ....................................................................................... 10
Figure 6: Graph of selected countries receiving relief and development funding. .......... 25
Figure 7: Pressure and release model: the progression of vulnerability. ........................ 27
Figure 8: Flowchart of Capstone Methods ..................................................................... 29
Figure 9: Sample Logic Model for Tsunami Disaster Response in Sri Lanka ................. 68

x
LIST OF TABLES
Table 1: Number of people affected or killed by natural disasters by country development category ................................................................................... 19
Table 2: Activities and Results reported on 2004 Tsunami Disaster Response & Recovery in Sri Lanka ................................................................................... 35
Table 3: Activities and Results reported on the Bangladesh Floods Disaster Response & Recovery .................................................................................. 39
Table 4: Economic vs. Human Development ................................................................. 62
Table 5: Millennium Development Goals, Targets & Indicators ...................................... 63
Table 6: Current Indicators found in Disaster Response & Recovery Progress Reports ......................................................................................................... 66

xi
GLOSSARY
ADB Asian Development Bank
ADRC Asian Disaster Reduction Centre
AIDS Acquired Immune Deficiency Syndrome
BBC British Broadcasting Corporation
BOP Balance of Payments
Capacity The ability to hold, receive or absorb
CBO Community Based Organization
CCF Christian Children‟s Fund (now ChildFund)
CE-DAT Complex Emergency Database (part of CRED)
CHAP Common Humanitarian Action Plan (formulated by OCHA)
CNO Centre for National Operations (Sri Lanka)
CRED Centre for Research on the Epidemiology of Disasters
DER Disaster & Emergency Response (Sub-group for LCG Bangladesh)
DFID United Kingdom‟s Department for International Development

xii
Disaster A natural or man-made event that disrupts normal community function due to losses that exceed the ability of the affected community to manage
DRR Disaster Risk Reduction
EM-DAT Emergency Disasters Database (part of CRED)
FAO Food Aid Organization
GDP Gross Domestic Product
HAF Hyogo Action Framework
Hazard A threatening event, or probability of occurrence of a potentially damaging phenomenon within a given time period and area
HIV Human Immunodeficiency Virus
IASC Inter-Agency Standing Committee
IDRL International Disaster Response Laws, Rules and Principles
IFRC International Federation of the Red Cross and Red Crescent Societies
ICG/IOTWS Intergovernmental Coordination Group for the Indian Ocean Tsunami Early Warning and Mitigation Systems
IPCC Intergovernmental Panel on Climate Change
JMA Japan Meteorological Agency
LCG Local Consultative Group (Bangladesh group composed of the Secretary, Economic Relations Division, Ministry of Finance, Government of Bangladesh and 39 Bangladesh-based representatives of bilateral donors, International Monetary Fund, World Bank, ADB and the UN agencies.)

xiii
LTTE Liberation Tigers of Tamil Eelam (Sri Lanka)
MDG Millennium Development Goal
MSF Médecins Sans Frontières
Natural disaster
Disruptions caused by forces of nature that overwhelm local capacity
NCDM National Council for Disaster Management (Sri Lanka)
NGO Non-governmental organization
OECD Organization for Economic Co-operation and Development
OCHA United Nations Office for the Coordination of Humanitarian Affairs
PAHO Pan-American Health Organization
PPP Purchasing Power Parity
Preparedness Measures taken to prepare for and reduce the effects of disasters
PTWS Pacific Tsunami Warning Centre
SCHR Steering Committee for Humanitarian Response
SLILG Sri Lanka Institute for Local Governance
TAFREN Task Force for Rebuilding the Nation (Sri Lanka)
TEC Tsunami Evaluation Committee
UN United Nations

xiv
UN-HABITAT United Nations Human Settlements Programme
UNAIDS Joint United Nations Programme on HIV/AIDS
UNDAC United Nations Disaster Assessment and Coordination
UNDP United Nations Development Programme
UNFPA United Nations Population Fund
UNICEF United Nations Children‟s Fund
UNISDR United Nations International Strategy for Disaster Reduction
UNMC United Nations Millennium Challenge
VGF Vulnerable Feeding Group (Bangladesh)
Vulnerability Diminished capacity of an individual or group to anticipate, cope with, resist and/or recover from the impact of a natural or man-made hazard
WFP World Food Programme
WHO World Health Organization

xv
PREFACE
The Barmer district of Rajasthan, India experienced devastating floods in
2006. The district is located in the Great Indian Desert so floods were
unexpected and the district was ill prepared for such a disaster. The floods killed
over 300 people and left entire villages devastated and thousands homeless. The
floods hit the region during the night and by morning when help started coming in
hundreds had already died.
Almost four years later, Barmer is still recovering. There are still numerous
reminders of the disaster, but not all have been bad. According to discussions
with a few local non-governmental organizations (NGOs), government officials
and local villagers, there have been some opportunities created since the
disaster. Temporary housing for affected communities in relief camps provided
an opportunity for mass immunization and dissemination of health education. The
rehabilitation process provided a chance to rebuild more durable infrastructure
such as stronger stone houses with better sanitation facilities and hospitals that
are more accessible with improved capacity. The floods in themselves made the
soil more fertile for the cultivation of cash crops such as cumin and castor seed,
which has created livelihood opportunities for some local residents. The most
notable positive change, however, was the creation of the disaster preparedness
and mitigation plans for the district, which has contributed towards reducing

xvi
disaster vulnerability of affected communities by relocating people away from
flood lines and creating disaster response plans. Thus, Barmer provided the
inspiration for a better understanding of how relief and rehabilitation efforts can
be used to improve development in the midst of a disaster and create positive
long-term impacts. A discussion at state level would be more appropriate
because development is more commonly measured at state level rather than at
district level.

1
INTRODUCTION
Capstone Overview
This capstone will discuss how disaster response and recovery can be
integrated with development for a more sustainable future. Disasters aggravate
the factors that negatively affect the health of the population. Disaster response
efforts that focus solely on removing or changing only those factors brought
about by the disaster do not actually improve the health of the community.
Instead, these efforts have the propensity to reinstate prior vulnerabilities. This
capstone addresses social determinants of health that are commonly disrupted
by natural disasters and are usually considered during response and
rehabilitation. These determinants include education, livelihood and poverty, food
security, water and sanitation, shelter, primary health care services and the
physical environment. The capstone describes the links between disasters and
development and the implications of these links on disaster response and
development. Greater emphasis is placed on achieving the Millennium
Development Goals (MDGs), as the measure for development.
The Bangladeshi floods of 2004 and Asian Tsunami that affected Sri
Lanka in 2004 will be used as case studies to assess how the efforts of different
disaster response and development organizations improved the lives of those
affected. These discussions will focus more on the efforts of larger humanitarian

2
and international organizations because their size, scope and capacity provide
them the ability to significantly influence both disaster response and
development. These larger organizations include the World Bank, World Health
Organization (WHO), United Nations (UN) agencies, Asian Development Bank
(ADB) and the International Federation of Red Cross and Red Crescent Societies
(IFRC), and represent organizations that are usually involved in many places
allowing for comparability across different geographic areas. These organizations
are established which allows for an evaluation of efforts over a longer time span.
There is also a greater scope of accessible and relevant information on learned
lessons and best practices from these larger organizations as compared to local
NGOs and agencies. The intention of focusing the discussion on large
organizations is not to restrict the analysis to the frame of a top-down approach
to disaster response and development but rather address some of the structural
upstream factors that have greater influence. Similar analyses at the local level
that focus on local agencies in disaster response and development would be
equally beneficial. Despite the selected case studies in this capstone being
developing countries, the recommendations given at its conclusion can be
adaptable to developed countries. Development can be considered as a
continuum and so countries occupying different positions on this continuum
should consider their local context before applying the recommendations set out
in this capstone. Development levels also vary within the same country so the
integration between disaster response and development can still be applicable in
developed countries.

3
This capstone only discusses responses to hydrological and
meteorological natural disasters and cautions the applicability of the
recommendations to technological disasters, complex emergencies or
climatological and biological disasters. Responses to geophysical disasters may
follow similar patterns to those in acute meteorological disasters and therefore
may be applied to similar concepts as discussed in this paper. The main
recommendation is for the integration of disaster response efforts with
development activities in planning, implementation and evaluation.
Description of Disasters
A disaster is defined as a “natural or man-made event that disrupts normal
community function due to losses that exceed the ability of the affected
community to manage” (Clements, 2009; IFRC, n.d.a); and in turn requires
external assistance (Hooke & Rogers, 2005). The impact of disasters on human
beings is dependent on the combination of exposure to a dangerous
phenomenon (hazard), size of the population exposed, level of vulnerability,
resilience of the population, preparedness and the availability of resources to
cope (de Ville de Goyet, 2008; Clements, 2009; UNISDR, 2009). Earthquakes,
hurricanes or floods are hazards that only translate into disasters when they
occur in a vulnerable area with inadequate resources (de Ville de Goyet, 2008;
Noji, 1997). The equation below describes a disaster (IFRC, n.d.a):
Disaster = Vulnerability + Hazard/Capacity

4
Natural disasters are defined as disruptions caused by forces of nature
“that overwhelm local capacity” (Noji, 1997; Spiegel et al, 2007). The Centre for
Research on the Epidemiology of Disasters (CRED) recognizes five different
types of natural disasters; geophysical e.g. earthquakes, meteorological e.g.
storms, hydrological e.g. floods, climatological e.g. drought and biological e.g.
epidemic on its Emergency Events Database (EM-DAT) (EM-DAT, n.d.a). Other
categories of disasters are man-made disasters which include technological
disasters such as bioterrorism and complex emergencies such as conflict
(McEntire, 2007; EM-DAT, n.d.a). EM-DAT only records disasters that meet at
least one of the following criteria:
“• Ten (10) or more people reported killed.
• Hundred (100) or more people reported affected.
• Declaration of a state of emergency.
• Call for international assistance.”
There is some debate on the distinction between natural vs. man-made
disasters as the definition of a disaster itself relies upon human actions of
vulnerability and capacity (de Ville de Goyet, 2008; Lizarralde, Johnson &
Davidson, 2010; Noji, 1997).The distinction between the two types of disasters is
also difficult because a natural disaster may trigger secondary „man-made‟
disasters such as fires after an earthquake (Noji, 1997). Natural disasters can be
acute such as floods or chronic such as droughts (Noji, 1997; Spiegel et al, 2007)

5
For the purpose of this capstone natural disasters are defined as those
caused by exposure to a hazard in nature. For ease of comparison, the focus will
be on meteorological and hydrological disasters.
Disaster Statistics & Impacts
CRED is a WHO Collaborating Centre in Louvain, Belgium that “promotes
research, training and technical expertise on humanitarian emergencies, with a
special focus on public health and epidemiology” (CRED, n.d.). It generates and
maintains the international disaster database, EM-DAT and a complex
emergency database, CE-DAT (CRED, n.d.). CRED provides data to numerous
partners that include UN agencies, multilateral/government agencies, NGOs and
research institutions. EM-DAT estimates show that over 4,400 natural disasters
occurred around the world between January 2000 and December 2009 (EM-
DAT, n.d.b). The number of natural disasters has been on the rise since the
1970s, with more than 500 natural disasters reported in 2000 and 2002 (Fig. 1).
Many other disasters go unreported or undocumented leaving considerable
uncertainty in the number and rate of change over time (IFRC, n.d.b; 2006;
Wisner, Blaikie, Cannon & Davis, 2004).

6
Figure 1: Graph of number of natural disasters reported between 1975 and 2008. From EM-DAT database
Natural disasters related to weather have significantly driven the rise in
disaster statistics (IFRC, 2007; IPCC, 2007). Fifty-five million disaster victims
were affected by weather-related disasters in 2009, which was three-quarters of
those affected in total (UNISDR, 2009a). More than 30% of the weather-related
natural disasters occur in the Asia & Pacific regions of the world (IFRC, 2007;
2008). Though the number of people killed in natural disasters has reduced from
about 2 million in the 1970s to less than 800,000 in the 1990s, CRED statistics
showed an increase in the number of people affected by natural disasters (Fig.
2); which rose from about 700 million to nearly 2 billion over two decades (EM-
DAT, n.d.). Natural disasters cost countries billions of dollars, with global

7
damages of over US$200 billion in 2005. Most of 2005 damages were as a result
of Hurricane Katrina. The least costly damages of the decade totalled US$20
billion in 2001(Fig. 3) (EM-DAT, n.d.).
Figure 2: Graph of number of people affected by natural disaster from 1975 to 2008. From EM-DAT database.

8
Figure 3: Graph of Estimated damages due to natural disasters from 1975 to 2008. From EM-DAT database.
Disasters have health, social, economic, psychological and physical
impacts. Public health impacts of disasters include increased mortality and
morbidity that can overwhelm local health capacity (Noji, 1997). Disasters can
also destroy health infrastructure and disrupt routine health services and
preventative care activities, these in turn can contribute to higher mortality and
morbidity in the long-term (Noji, 1997). Disasters have psychosocial effects on
affected communities, increasing cases of mental health problems in the
community (Cook, A., Watson, J., Buynder, P., Robertson, A., & Weinstein, P.,

9
2008; McEntire, 2007; Noji. 1997; Berg et al., 2008). Disasters can sometimes
result in food shortages that may translate into starvation or micronutrient
deficiency diseases (Few & Matthies, 2006; Noji, 1997). Disasters displace large
populations of people, which may result in overcrowding in other areas. This
displacement and overcrowding increases the probability of disease outbreaks in
host areas, stemming from deficiencies in the resources required to cope with the
influx of displaced people (Noji, 1997; PAHO, 2000).
Not all public health impacts of a disaster are immediately evident.
Disasters can also affect social determinants of health such as livelihoods,
school enrollment, school attendance and access to resources (Berg et al., 2008;
World Bank, n.d.). Disasters can affect economic growth positively, negatively or
not at all; however, severe disasters do not have any positive effects on
economic growth (Loayza, Olaberria, Rigolini & Christiaensen, 2009). On a large
scale, the long-term effects of a disaster can occur in various ways (Few &
Matthies, 2006). A disaster may destroy economic infrastructure and diminish
local budgets for several years (Noji, 1997; PAHO, n.d.). Disasters can also alter
land fertility and affect harvests for years or even require a complete change in
type of crops cultivable (Few & Matthies, 2006). At an individual level, the death
of the breadwinner for a family may leave them in a state of poverty or destitution
for years or even generations (Few & Matthies, 2006; Dilley et al. 2005).

10
Disaster Management
Disaster management has been described as a cyclic process that
Clements and McEntire describe as comprising of four main stages (Figure 4) –
mitigation, preparedness, response and recovery (Clements, 2009; McEntire
2007). Alternatively, Noji describes five phases of a disaster cycle for sudden-
impact disasters (Figure 5): inter-disaster, pre-disaster, impact, emergency, and
reconstruction (Noji, 1997).
Figure 4: Disaster Management Cycle
Figure 5: Noji's Disaster Cycle

11
The mitigation phase includes all measures taken to anticipate and
reduce the impacts of potential hazards such as early warning systems or
differential building codes in hurricane prone areas (Clements, 2009; McEntire
2007). The preparedness phase comprises the efforts done in preparation of a
potential hazard to ensure a more effective response and recovery (Clements,
2009; McEntire 2007). This phase coincides with the inter-disaster phase of
Noji‟s disaster cycle (Noji, 1997) and includes creating emergency plans that will
be followed in the event of a disaster occurring (Clements, 2009; McEntire 2007;
Noji, 1997).The response phase includes all the actions taken in response to a
current or imminent disaster event (Clements, 2009; McEntire 2007) and is also
referred to as the relief or emergency phase; characterized by immediate efforts
to save lives. The recovery or rehabilitation phase includes all actions taken in
order to return the affected area to normal (Clements, 2009; McEntire 2007).
Mitigation and preparedness phases are mostly under the jurisdiction of the local
government and community (McEntire, 2007). According to the definition of a
disaster – to overwhelm local capacity – response and recovery stages are the
responsibility of both the local and external players (McEntire, 2007; PAHO,
2000). The different phases may last from just a few seconds [impact phase of
an earthquake], to a number of years [rehabilitation phase after a tsunami]. The
duration of each phase depends on the type and extent of the disaster, the
resources available and the vulnerability of the community; with one phase
merging into the next (Clements, 2009). This capstone will focus on how efforts
during the response and recovery stages influence future health outcomes. The

12
argument for better mitigation and preparedness has been lamented in numerous
literature resulting in the creation of organizations such as United Nations
International Strategy for Disaster Reduction (UNISDR), the ProVention
Consortium, Asian Disaster Reduction Center (ADRC) and numerous
conferences on disaster risk reduction (DRR) and disaster reduction (UNDP,
2004; UNISDR, 2007; World Bank, n.d.).
Key Players in Disaster Management
There are numerous players in disaster relief and rehabilitation. Important
players include local governments and agencies, local businesses, international
governments and their respective agencies, UN agencies and international
humanitarian organizations (McEntire, 2007). Local governments are mainly
responsible for implementing and coordinating disaster response efforts, while all
other players provide assistance as requested (PAHO, 2000). Some of the
largest humanitarian organizations involved in disaster relief include, The
International Federation of Red Cross and Red Crescent Societies (IFRC),
Caritas Internationalis, Catholic Relief Services, International Save the Children
Alliance, Lutheran World Federation, Oxfam and Médecins Sans Frontières
(MSF). Local residents (outside any particular agency) of affected areas also play
a great role in disaster relief. Soon after impact, local residents are naturally the
first people on the scene and offer initial help such as search and rescue. They
are also the last ones remaining, as they continue to rebuild their community
(PAHO, n.d.; 2000). The involvement of each player depends on the type and

13
extent of the disaster. An earthquake may call for more orthopaedic surgeons
than after a flood; and a low magnitude earthquake in a remote area may require
assistance only from the local government and other local agencies with very
little or no international involvement (PAHO, 2000).
The UN Office for the Coordination of Humanitarian Affairs (OCHA) is one
of the international bodies responsible for mobilizing and coordinating
international humanitarian assistance during disasters (OCHA, n.d.). The UN
Disaster Assessment and Coordination team is deployed at the request of
international assistance by the disaster-stricken country to identify overall
humanitarian needs (OCHA, n.d.a). OCHA then develops a plan of action
(Common Humanitarian Action Plan, CHAP) that is disaster specific,
comprehensive and avoids duplication (OCHA, n.d.b). OCHA is also responsible
for evaluating those efforts after the disaster has passed (OCHA, n.d.). OCHA
works alongside the Inter-Agency Standing Committee (IASC); an “inter-agency
forum for coordination, policy development and decision-making that involves key
UN and non-UN humanitarian partners” (IASC, n.d.).
Guidelines for Disaster Management
Different ideals and criteria govern humanitarian organizations‟ efforts.
However, there are a few guidelines that are widely accepted: Steering
Committee for Humanitarian Response (SCHR) Code of Conduct, Sphere
guidelines and the Hyogo Action Framework (HAF).

14
Care International, Caritas Internationalis, the International Committee of
the Red Cross, the International Federation of Red Cross and Red Crescent
Societies, International Save the Children Alliance, Lutheran World Federation,
Oxfam, World Council of Churches, and World Vision International make up the
SCHR that is responsible for the self-policing and voluntary Code of Conduct
used to guide NGOs when undertaking humanitarian efforts (IFRC, n.d.c.). As of
September 2009, there were 481 signatories from various countries, indicating
their commitment to adhere to the principles outlined in the SCHR Code of
Conduct. In acknowledgment of other players in disaster response and recovery,
the Committee also created recommended Codes of Conduct for the
governments of disaster-affected countries, donor governments and
intergovernmental organizations (IFRC, n.d.c). Appendix 1 lists the main
components of the Code of Conduct.
The Sphere Project contains a set of guidelines aimed at steering
humanitarian efforts during disasters. This project was born out of the need for a
more universal and coordinated humanitarian effort during disaster response
(Buchanan-Smith, 2003). It was created in an effort to integrate the numerous
working agency-specific handbooks that were already in use (Walker & Purdin,
2004). InterAction, the SCHR and MSF initially promoted the project (Walker &
Purdin, 2004). The project comprises a Humanitarian charter and a set of
minimum standards for humanitarian assistance.
15
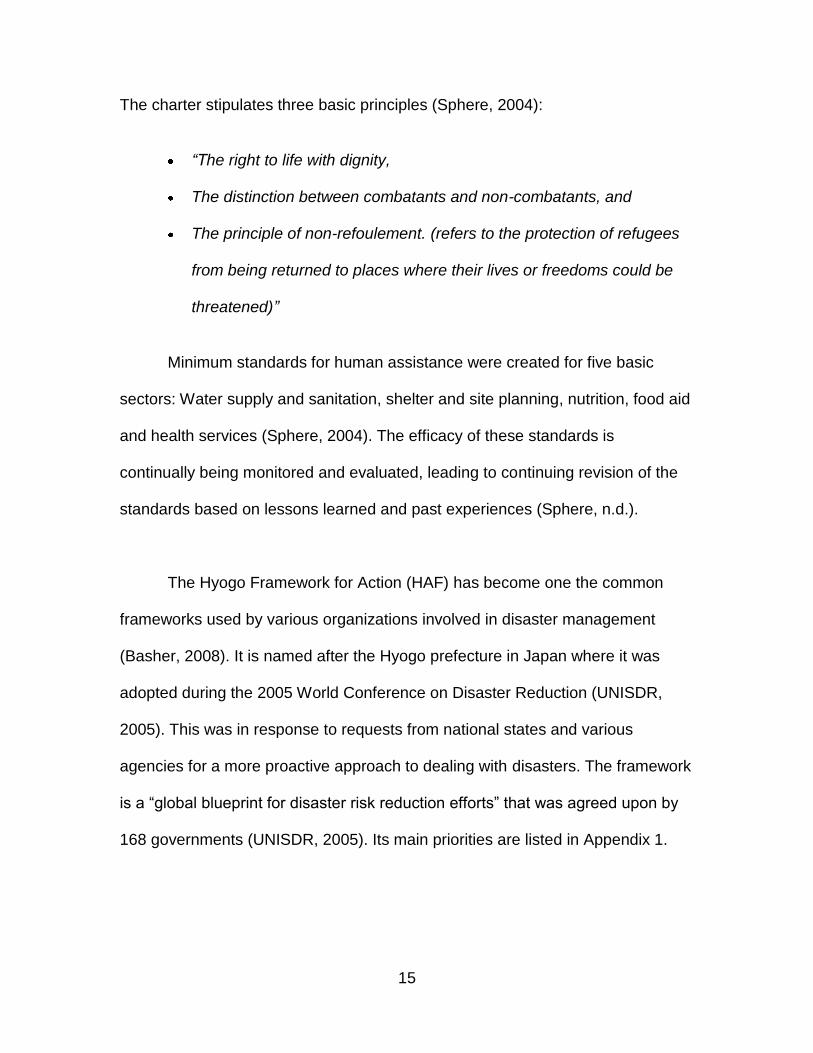
The charter stipulates three basic principles (Sphere, 2004):
“The right to life with dignity,
The distinction between combatants and non-combatants, and
The principle of non-refoulement. (refers to the protection of refugees
from being returned to places where their lives or freedoms could be
threatened)”
Minimum standards for human assistance were created for five basic
sectors: Water supply and sanitation, shelter and site planning, nutrition, food aid
and health services (Sphere, 2004). The efficacy of these standards is
continually being monitored and evaluated, leading to continuing revision of the
standards based on lessons learned and past experiences (Sphere, n.d.).
The Hyogo Framework for Action (HAF) has become one the common
frameworks used by various organizations involved in disaster management
(Basher, 2008). It is named after the Hyogo prefecture in Japan where it was
adopted during the 2005 World Conference on Disaster Reduction (UNISDR,
2005). This was in response to requests from national states and various
agencies for a more proactive approach to dealing with disasters. The framework
is a “global blueprint for disaster risk reduction efforts” that was agreed upon by
168 governments (UNISDR, 2005). Its main priorities are listed in Appendix 1.

16
HAF outlines specific actions that states, regional organizations,
institutions and international organizations can do to reduce the vulnerability of
communities to disasters (UNISDR, 2005). For example, the framework advises
governments to demonstrate strong political determination to promote and
integrate disaster risk reduction into development programming (UNISDR, 2005).
It also pushes for the implementation of the HAF into everyday practices of the
different stakeholders (Basher, 2008; UNISDR, 2005).
There is an array of humanitarian assistance handbooks and guidelines
used by various organizations. Some of these are adaptations of the SCHR Code
of Conduct and the Sphere project; in an effort for different organizations to
respond to some of the criticisms of these international guidelines. The more
commonly used guidelines will be discussed in this paper: The SCHR Code of
Conduct, Hyogo Action Framework, and the Sphere project. In addition to the
guidelines that each organization adheres to, agencies also have to comply with
the laws of the affected countries and to various international and humanitarian
laws (IFRC, 2008a; Stover & Vinck, 2008; Young, Taylor, Way & Leaning, 2004).
The International Disaster Response Laws, Rules and Principles (IDRL) are a set
of legal guidelines that help governments and agencies “prepare for common
legal problems in international response operations” (IFRC, 2008a). These
recommendations aim to “reduce red tape and strengthen accountability” but are
not legally binding (IFRC, 2008a).

17
Disasters and Development
Disasters do not affect all individuals in the same manner (de Ville de
Goyet, 2008; IFRC, 2007; UNDP, n.d.). The impacts of disasters are exacerbated
by preexisting vulnerabilities in the community; vulnerabilities ingrained within the
social, political and economic context (Cannon, 2000; Peduzzi, Dao, Herold &
Mouton, 2009). There is discrepancy not only in the number of times that
particular areas experience a natural disaster (Dilley et al., 2005) but also the
effects that each disaster has on different groups within a population (von
Oelreich, 2002; IFRC, 2007). “Disasters have a disproportionate impact on the
poorest and most vulnerable population including women, children, youth and the
elderly” (Peduzzi et al., 2009). De Ville de Goyet describes it as “strong
relationship between vulnerability to natural disasters and poverty” (de Ville de
Goyet, 2008). Trend analysis shows that between 1995 and 2004, ten times as
many people died per natural disaster in developing countries than in developed
countries (IFRC, 2004). In 2002, only 6% of the people killed by natural disasters
lived in countries of high human development index. Economic losses (as a
percentage of gross domestic product) were about twenty times greater in
developing countries than in developed countries (Kreimer, Arnold & Carlin,
2003; World Bank, n.d.).
As described in Data Against Natural Disasters (de Ville de Goyet, 2008),
a study by the World Bank and Centre for Hazards and Risk Research showed
that 44 of the 47 countries with more than 50 percent of their population at

18
relatively high mortality risk from natural disasters, were developing countries.
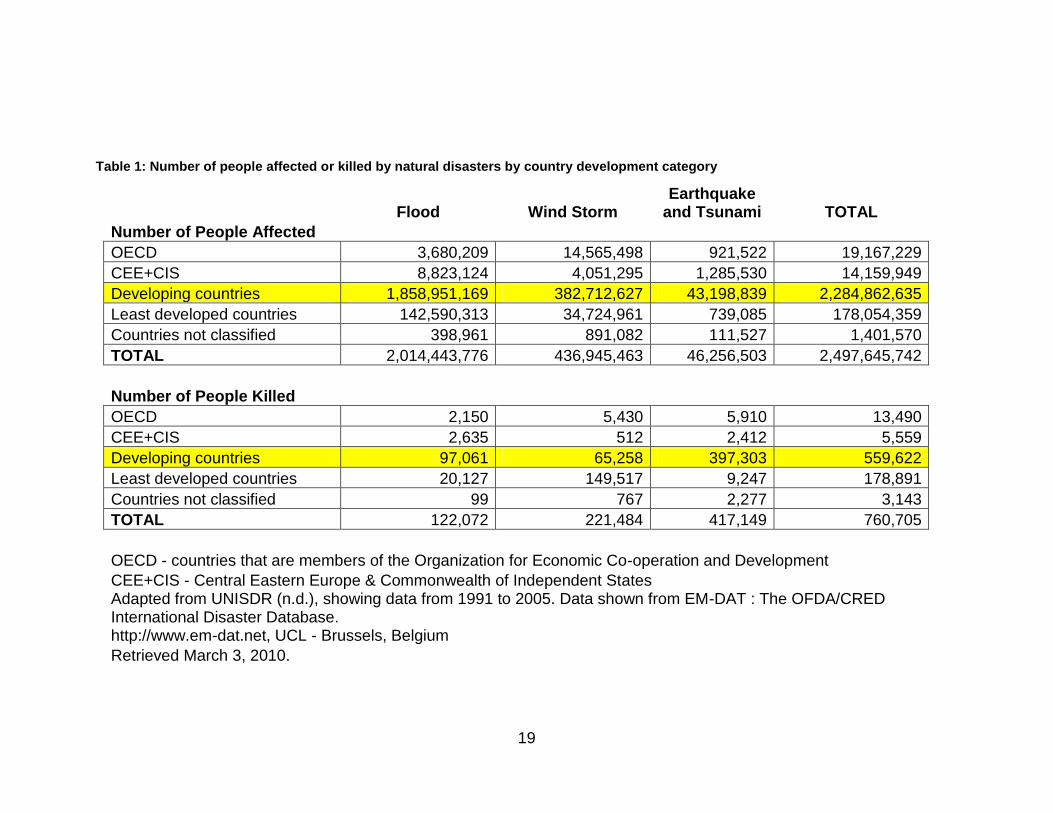
Table 1 illustrates that developing countries have significantly higher numbers of
people affected or killed by disasters than other countries.
19
Table 1: Number of people affected or killed by natural disasters by country development category
Flood Wind Storm
Earthquake and Tsunami TOTAL
Number of People Affected OECD 3,680,209 14,565,498 921,522 19,167,229
CEE+CIS 8,823,124 4,051,295 1,285,530 14,159,949
Developing countries 1,858,951,169 382,712,627 43,198,839 2,284,862,635
Least developed countries 142,590,313 34,724,961 739,085 178,054,359
Countries not classified 398,961 891,082 111,527 1,401,570
TOTAL 2,014,443,776 436,945,463 46,256,503 2,497,645,742
Number of People Killed OECD 2,150 5,430 5,910 13,490
CEE+CIS 2,635 512 2,412 5,559
Developing countries 97,061 65,258 397,303 559,622
Least developed countries 20,127 149,517 9,247 178,891
Countries not classified 99 767 2,277 3,143
TOTAL 122,072 221,484 417,149 760,705
OECD - countries that are members of the Organization for Economic Co-operation and Development
CEE+CIS - Central Eastern Europe & Commonwealth of Independent States Adapted from UNISDR (n.d.), showing data from 1991 to 2005. Data shown from EM-DAT : The OFDA/CRED
International Disaster Database. http://www.em-dat.net, UCL - Brussels, Belgium
Retrieved March 3, 2010.

20
Development
There are different schools of thoughts on the definition of development.
The idea of development in the global context was largely inspired by
humanitarian considerations to deal with the conditions of poverty, illiteracy and
mortality after the Cold War (Eatwell, Milgate & Newman, 1989). There are two
general streams of thought among international humanitarian and aid
organizations: economic vs. human development. Economic development
refers to the social and technological progress that facilitates economic growth
(Blakely, 1994). Human development refers to the process of enlarging people‟s
choices through an expansion of human capabilities and functioning (UNDP,
n.d.a). Table 4 in Appendix 2 shows a comparison of economic vs. human
development. There is some disagreement on the absolute separation of the two
types of development (Gadfrey & Jany-Catrice, 2006; Kalfagianni, 2008; Rashid,
2000; Stathakis & Vaggi, 2006). Others view economic development as being
equivalent to human development, or as a process that leads to human
development (Gadfrey & Jany-Catrice, 2006; Kalfagianni, 2008; Rashid, 2000;
Stathakis & Vaggi, 2006). Whereas proponents for the human development index
view these two to be separate, with economic development not guaranteeing
human development (Kalfagianni, 2008; UNDP, 1990). The distinction between
the two is not important for the discussion of this capstone. Instead, the MDGs,
which are a widely accepted guide for the efforts of numerous organizations and
countries (Schmidt-Traub, 2009) will be used as the measure of development.

21
The MDGs are a set of eight goals set to be achieved by 2015 and were
agreed upon by 189 nations in 2000 (UN, n.d.). These goals rose out of
discussions on how to assist impoverished countries deal with poverty and were
established at the Millennium Summit in 2000. There are 18 targets and 48
indicators used along with these goals (UN, n.d.). The goals and their respective
targets and indicators are shown in Appendix 2 Table 5. The MDGs are aimed at
developing countries, with the “developed countries pledging to assist developing
countries achieve these goals through aid, debt relief and fairer trade policies”
(UNDP, n.d.b)
Disasters and Development: Reasons to care
Disasters Make Achieving the MDGs More Challenging
Natural disasters have the potential to destroy a country‟s positive
progress towards attainment of the MDGs. The United Kingdom‟s Department for
International Development (DFID) suggests that floods can destroy crops and
hinder the goal of eradicating hunger while increasing poverty rates in agro-
based communities (as cited in UNMC & ADPC, 2007). Furthermore, an
earthquake that destroys schools will reverse the progress towards achieving
universal primary education (Goal 2) (UNDP, 2004). Women and children are
usually the hardest hit during disasters, making achieving Goals 3, 4 and 5 even
more challenging. Populations displaced by natural disasters are also at a higher
risk of exposure to the human immunodeficiency virus (HIV) and other infectious

22
diseases, with the disruption of health services also contributing to the spread of
diseases (PAHO, 2000; UNAIDS, 2003). Ensuring environmental stability is also
challenging when natural disasters can disrupt environmental processes or
destroy entire ecosystems (Noji, 1997; as cited in UNMC & ADPC, 2007). One of
the targets for Goal 7 is to halve the number of individuals that do not have
access to sustainable safe drinking water; disasters can destroy water
infrastructures resulting in an increase of this population segment. The economic
toll of disasters in developed countries can make it difficult for these countries to
extend debt relief or to help address the needs of the least developed nations
while dealing with disasters in their own country (UNDP, 2004; as cited in UNMC
& ADPC, 2007). One disaster can affect the progress of one MDG or even the
entire set of the MDGs and as weather-related disasters occurrences increase,
they become a major obstacle in achieving the MDGs (UN Secretary-General,
2005; UNISDR, 2007; Schipper & Pelling, 2006). Integration of development
within relief efforts can increase the chances for regaining the levels of
achievements that were in place prior to the disaster and ensure that countries
remain on the trajectory toward achieving the MDGs within the specified timeline.
Development Factors are Associated with Increased Negative Impact of Disaster
The frequency and severity of natural disasters is expected to rise as the
world faces challenges of climate change (IPCC, 2007). Oxfam estimates that
the number of people affected by climate-related disasters is expected to rise by
about 50%, to reach 375 million people per year by 2015 (BBC News, 2009). The

23
Stern report on climate change also suggests that the poorer countries will suffer
the most from climate change, and will experience the impacts of climate change
sooner than developed countries (McMichael, Friel, Nyong & Corvalan, 2008;
Stern, 2006). Other factors reported to be contributing to the rise in severity of
disaster impacts are rapid urbanization, population growth and environmental
degradation (IFRC, n.d.d; World Bank, n.d.). These factors are even more
prominent in developing countries that have greater rates of rural-urban
migration. The most rapidly growing populations are also within developing
countries, which puts further strain on the environment due to overpopulation and
poor land use (Jiang, Young & Hardee, 2008; Noji, 1997). Densely populated
cities are at a greater risk of high mortality or the number of people affected
during a natural disaster. Poor warning systems and response mechanisms,
which are more common in developing countries, also contribute to relatively
higher mortality rates during impact (Tolentino Jr., 2007; UNISDR, n.d.). Rapid
industrialization in developing countries can also contribute to both environmental
degradation and climate change (Jiang et al., 2008). The Intergovernmental
Panel on Climate Change (IPCC) projects an increase in cyclone intensities and
winter flooding with increased water stress in Africa and Asia by 2020 (IPCC,
2007). Development may help reduce these disaster vulnerabilities, especially in
developing countries and reduce the impacts of future disasters. Better yet,
development can help reduce some of the factors such as climate change that
actually contribute to this expected rise in the frequency and severity of disasters.

24
Shared Resources between Disaster Response and Development
There is a growing tendency for the same players involved in disaster
relief to include development on their agendas (Smillie, 1998). The UN is a major
player in disaster response, with country offices also working towards
development in various developing countries. Humanitarian organizations
involved in disaster response such as OXFAM, CARE, Red Cross and Save the
Children also have national offices working on developmental agendas. In recent
years, the World Bank and other developmental banks have also become major
players in disaster response, shifting funds earmarked for developmental efforts
towards disaster relief and reconstruction (Kreimer et al., 2003; Dilley et al.,
2005). As of March 2010, all of the ten countries on OCHA Financial Tracking
System‟s list for funding appeals for 2010 were developing countries also
receiving other forms of developmental aid (Fig. 6). (ReliefWeb, 2010; OECD,
n.d.; World Bank, n.d.a)

25
Figure 6: Graph of selected countries receiving relief and development funding.
All figures shown in current US$
*No information from OECD and World Bank 1 Amount requested for the proposed projects in 2010 2 Development Aid from OECD countries in 2008 3 Assistance Aid through World Bank in 2007
This illustrates the interrelatedness of the two processes, exemplifying
how disaster and development can no longer be disengaged from each other.
The World Bank study on disaster hotspots further points out that “disaster relief
costs drain development resources from productive investments to support
consumption over short periods” (Dilley et al. 2005). With the increasing
frequency and severity of disasters, both limited financial and human resources
are slowly becoming overwhelmed. Relief and development should therefore be

26
considered together in a manner that ensures equal attention without competing
for resources.
Disaster rehabilitation should strive to go beyond saving lives by aiming at
reducing future vulnerabilities present at individual, community, national and
global levels. Evidence has shown that disaster vulnerabilities are also
associated with level of development; with a majority of the „hotspot‟ countries
identified also being underdeveloped (Dilley et al. 2005). Elements of disaster
vulnerability such as lack of resources and environment degradation also
represent elements through which levels of development are assessed. The
inverse is also true; disasters result in hardships that are similar to those
characteristic of underdevelopment such as limited access to education, health
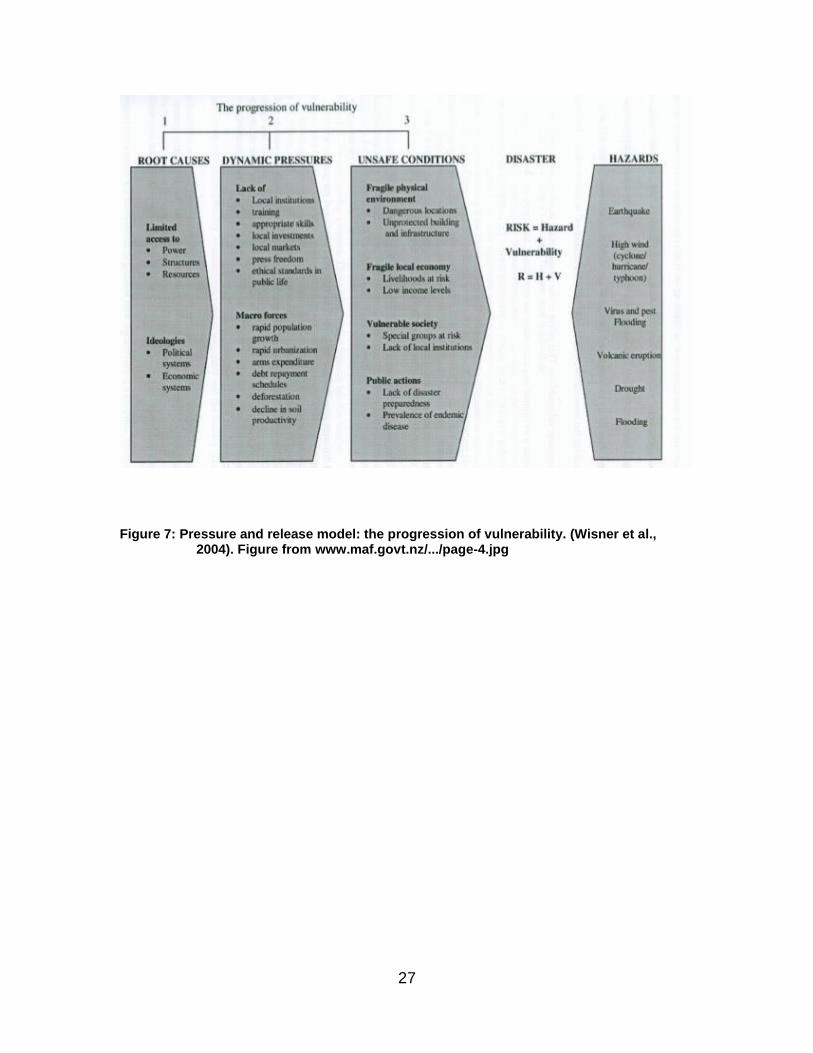
and livelihood options. Vulnerabilities do not occur at one moment, but rather
progress over time (Lizarralde et al., 2010). The disaster “pressure and release”
model (Figure 7) demonstrates this accumulation and in turn emphasizes the
need to focus on immediate vulnerabilities, the “dynamic pressures” and the “root
causes” (Wisner et al, 2004). Disaster response that takes into consideration
development goals is more likely to address both the causes and the impacts of
a disaster for long term sustainable changes in the lives of the vulnerable
population.
27
Figure 7: Pressure and release model: the progression of vulnerability. (Wisner et al., 2004). Figure from www.maf.govt.nz/.../page-4.jpg

28
METHODS
Findings on how the floods that occurred in Barmer created opportunities
for positive outcomes provided the basis for this capstone project. Initial
objectives were to assess how disaster response efforts were taking advantage
of the opportunities created by disasters to promote long-term development at a
national level. Initial literature review conducted showed very little information on
the impacts of disaster response efforts on overall development of affected
countries. These findings (or lack thereof) informed the objectives of this
capstone: to discuss how disaster response efforts are and should be used for
positive long-term developmental impacts and how development efforts before a
disaster can also be used to reduce the negative impacts of a disaster. A
flowchart of the capstone process is shown in Figure 8.

29
Figure 8: Flowchart of Capstone Methods
In an effort to achieve findings that could be used in Barmer, India, case
studies for review had to be in countries within the same regional block of South
Asia. The complete criteria and justifications that guided selection of countries
for case study were:
1. Geographical placement: Disaster occurred in the South Asian regional
block – to be comparable with India
2. Nature of Disaster: Meteorological or hydrological natural disaster –
similar impacts for ease of comparison
30
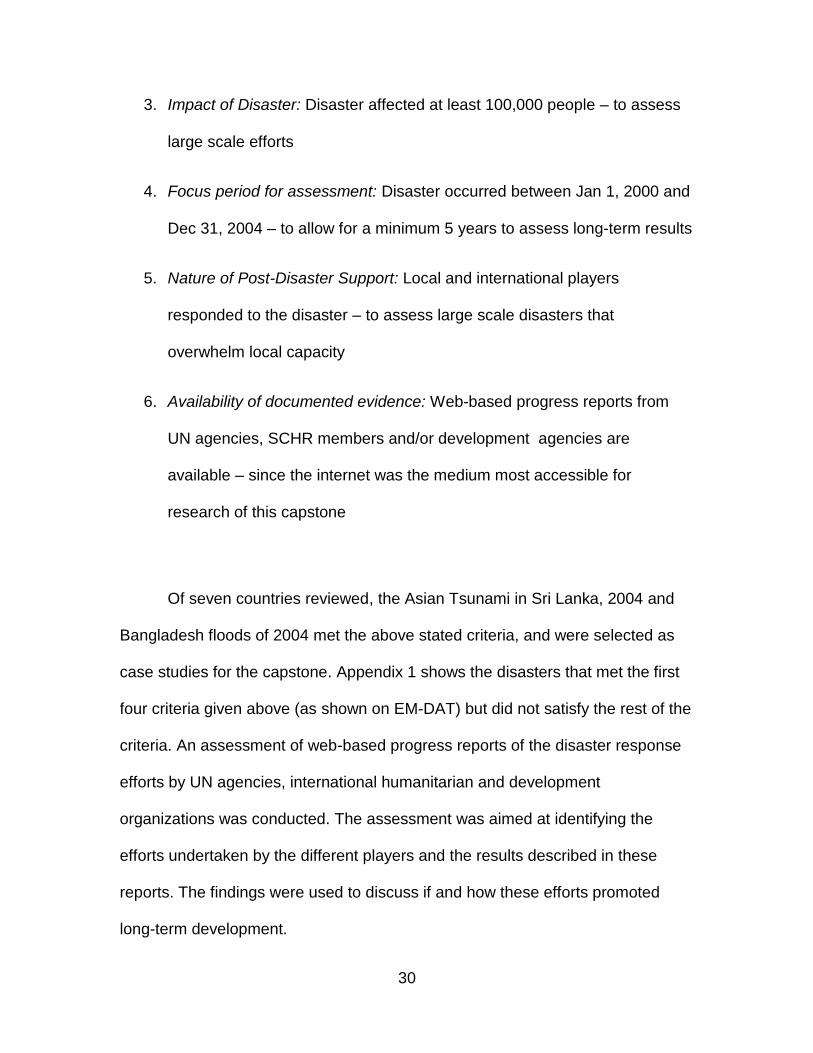
3. Impact of Disaster: Disaster affected at least 100,000 people – to assess
large scale efforts
4. Focus period for assessment: Disaster occurred between Jan 1, 2000 and
Dec 31, 2004 – to allow for a minimum 5 years to assess long-term results
5. Nature of Post-Disaster Support: Local and international players
responded to the disaster – to assess large scale disasters that
overwhelm local capacity
6. Availability of documented evidence: Web-based progress reports from
UN agencies, SCHR members and/or development agencies are
available – since the internet was the medium most accessible for
research of this capstone
Of seven countries reviewed, the Asian Tsunami in Sri Lanka, 2004 and
Bangladesh floods of 2004 met the above stated criteria, and were selected as
case studies for the capstone. Appendix 1 shows the disasters that met the first
four criteria given above (as shown on EM-DAT) but did not satisfy the rest of the
criteria. An assessment of web-based progress reports of the disaster response
efforts by UN agencies, international humanitarian and development
organizations was conducted. The assessment was aimed at identifying the
efforts undertaken by the different players and the results described in these
reports. The findings were used to discuss if and how these efforts promoted
long-term development.
31
The capstone will include information from the IFRC, UN agencies, World
Bank, ADB, Save the Children, Oxfam, MSF along with local governments and
disaster committees. The international humanitarian organizations and agencies
selected are key players in disaster relief and/or development in many countries,
providing a frame of reference for the evaluation of efforts in different countries.
These larger organizations also have a greater influence on overall countrywide
results.
Two popular frameworks used by international organizations were
selected for the purposes of the discussion; HAF and the Sphere project. HAF
pays greater attention to risk reduction and so this framework will be primarily
utilized to guide the discussion on the mitigation and preparedness stages
(UNISDR, 2005). The Sphere project guidelines for relief and rehabilitation will be
used in the assessment and discussion on these stages (Sphere, 2004). The
MDGs will be used as measures of development that are relevant to the
countries selected as case studies. The EM-DAT database used by a number of
these organizations and national states will inform this discussion.

32
Limitations
1. Limited Data Collection
There is limited or no data collection before or after a disaster occurs and
in some instances the data collected is superficial (de Ville de Goyet, 2008; Noji,
1997a; Sasin, 2008). One reason is that in most low resource areas, there are
insufficient data collection systems or surveillance systems (Wisner et al., 2004).
Once a disaster occurs data collection is often shelved as organizations deal with
the myriad of immediate needs that include, but are not limited to search and
rescue and containment of the hazard (Wisner et al., 2004). Another reason may
be due to a lack of funding for evaluation, which may limit the amount and quality
of data collected for evaluation purposes (de Ville de Goyet, 2008; IASC, 1994).
There are also gaps in routine data collection, for example, data on the MDGs is
not always available for each year. As a result, there was insufficient data to
objectively assess disaster impacts or evaluate whether or not relief efforts have
re-established, improved or regressed on pre-disaster functioning.
2. Limited Accessibility
There was also a limited amount of publicly accessible information on the
relief and rehabilitation activities undertaken and their associated results. Some
of this inaccessibility is due to the temporary nature of some public and private
disaster response groups that dissolve along with their associated information
regarding their relief and rehabilitation activities once the immediate emergency
has subsided (Sinha & Srivastava, 2002). Inaccessibility may also have been due

33
to a lack of electronic information and a lack of access to information that may
only be available in print. Despite the increased internet usage in developed
countries, the same is not true in most developing countries (UN, n.d.). Security
measures can also negatively affect accessibility and in some instances political
concerns may result in restrictions on the type of information that is publicly
available (de Ville de Goyet, 2008a; Murphy, 2000; Sasin, 2008).
3. Data Accuracy Issues
Accurate data is very important in ensuring informed decision-making (de
Ville de Goyet, 2008) and in assessing the impacts of a disaster and the
proceeding response efforts (Sinha & Srivastava, 2002). Statistics on the number
of people killed or affected by a disaster differs from one source to another, with
no universally accepted criteria for determining which is accurate. Disasters can
affect different people in different ways, and at times these effects are not
apparent soon after the disaster occurs; which can skew data collected. Different
organizations can also skew information for political or financial reasons (de Ville
de Goyet, 2008a; Sasin, 2008; Wickramasinghe, 2005). In this respect, it is
difficult to accurately assess the actual number of people affected when
presented with statistical data that fails to be impartial.
All these limitations should be taken into consideration when reading the findings
and discussion sections of this capstone.

34
FINDINGS
Case Study: Tsunami in Sri Lanka
The island of Sri Lanka is a developing country situated in the Indian
Ocean. On December 24th, 2005, the Asian tsunami ravaged many coastline
districts of Sri Lanka including its capital of Colombo; killing over 35,000 people
(ADB, 2005; EM-DAT, n.d.c; IFRC, 2005; OCHA, 2005). The tsunami resulted in
damages of almost US$1.32 billion in Sri Lanka alone (EM-DAT, n.d.c.;
TAFREN, 2005; OCHA, 2005).

35
Table 2: Activities and Results reported on 2004 Tsunami Disaster Response & Recovery in Sri Lanka
Pre-Disaster Vulnerabilities
There were no early warning or communications systems
There were no disaster management plans at national or local levels
There was a general lack of disaster preparedness at all levels
The public was unfamiliar with tsunami warnings e.g. when the water receded greatly (a sign of an incoming tsunami wave), some people went out to the beach to collect stranded fish
Environmental degradation had destroyed natural barriers such as coral reefs and mangroves
25% of the population was below the poverty line
Civil conflict in north and eastern coastline areas between the government and the Liberation Tigers of Tamil Eelam (LTTE); only ended in May 2009
Organizational Response
External Generated a lot of international humanitarian attention (received US$166 million relief assistance through
OCHA)
There was poor coordination among the multitude of players
Humanitarian organizations formed the Tsunami Evaluation Committee (TEC) to evaluate their efforts
OCHA conducted a flash appeal to raise funds for relief efforts by UN agencies and other international humanitarian organizations
The Intergovernmental Coordination Group for the Indian Ocean Tsunami Early Warning and Mitigation Systems (ICG/IOTWS) was formed
Internal
Government of Sri Lanka formed the Center for National Operations (CNO) to oversee and monitor emergency programs
Sri Lanka created legislation for the formation of the National Council for Disaster Management (NCDM) and the Task Force for Rebuilding the Nation (TAFREN)
Central government was responsible for large scale projects such as national highways and railways
Provincial government was responsible for rehabilitation of schools, hospitals, agriculture and fisheries
Local communities were responsible for enterprise development, housing and micro financing

36
Disaster Response Activities
Health Assessments of disaster impacts on health were conducted
Temporary health facilities & disease surveillance systems were set up to reduce subsequent mortality and outbreak of illnesses; no major outbreaks identified
Mobile health teams were deployed to provide medical assistance and donations of medical supplies were received
Psycho-social services and psycho-social training was provided in affected communities, especially those affected by both the tsunami and the conflict
Food was distributed to those affected by the tsunami, with nutritional supplements provided for children, pregnant women, seniors and others with weak immune systems
Displaced individuals were relocated to temporary shelters (made from donated materials such as tents) and away from damaged water and sanitation systems with donations of essential household utensils (family kit)
Livelihoods
Employment in debris removal & construction through food-for-work and cash-for-work programs was provided
Boats were donated for local fishermen and harbors and anchorages were reconstructed
Some organizations introduced rapid income-generating projects for women e.g. cultivation of ornamental plants, bee keeping, weaving and lace making
Vocational training was provided in affected communities (e.g. community health workers & disaster management)
Education
Makeshift classes were conducted for children under 12 at the relief camps
More than 25 schools were reconstructed (numbers and levels unspecified in other reports)
Educational materials were distributed to various affected communities
At-school feeding programs were introduced in some communities
Shelter
Construction materials were donated
100 destroyed health centers were reconstructed along with upgrades to 100 other centers that had not been damaged by the tsunami

37
500 permanent houses had been constructed by the end of 2005, with funding available for over 30,000 more houses by the end of 2009
Water and sanitation projects such as construction of latrines, drainage systems and provision of household water filters were taken up
Environment
Assessments of disaster impacts on the environment were conducted
There was a law created that forbad settlement close to the sea, resulting in the relocation of some communities away from coastal areas
Levees were constructed along the coastline
Mangroves were planted along the coastline
Disaster Reduction
An interim tsunami advisory information system was put in place via the Pacific Tsunami Warning Center (PTWC) and the Japan Meteorological Agency (JMA)
Community evacuation centers were constructed in some communities
Local communities were trained in disaster risk mapping and disaster management
Communities created local emergency response teams
Progress in MDGs
No data in reference to the progress towards the MDGs in reports
Gaps for 28 out of 48 MDG indicators between 2003 and 2009
Currently on track for 5 out of 8 of the goals (2008)
38
Case Study: Bangladesh Floods
Bangladesh is a least developed country and one of the most flood-prone
countries in the world, experiencing an average of 2.17 floods per year (Dilley et
al. 2005; EM-DAT, n.d; OCHA, 2004). Its main rivers include the Ganges
(Padma), Brahmaputra (Jamuna) and Meghna rivers. Heavy monsoon rains hit
the country on 27 June 2004 and subsequent storms led to flash flooding in the
northern and west-central districts of Bangladesh (ADB, 2004; OCHA, 2004; UN
HABITAT, 2009). The flood affected 36 million people, leaving almost a quarter
of the population homeless and killing about 800 people (ADB, 2004; EM-DAT,
n.d.d). The economic damage was estimated at US$2.2 billion (EM-DAT, n.d.d).
In September of the same year, heavy rains again affected areas flooded in June
and others that had been spared during the earlier flooding (ADB, 2004).

39
Table 3: Activities and Results reported on the Bangladesh Floods Disaster Response & Recovery
Pre-Disaster Vulnerabilities
It is a densely populated country
The country was (and still) undergoing rapid urbanization
40% of the population was (and still is) under the poverty line
Low lying coastal areas were (and still are) sensitive to rises in sea level
Increase in water levels of the main rivers due to snow melting in the Himalayas (as a result of climate change)
Poorly constructed dams and riverbanks
Organizational Response
External OCHA conducted a flash appeal to raise funds for relief efforts (US$210 million) by UN agencies and other
international humanitarian organizations on July 28, 2004
The Local Consultative Group (LCG) created the Disaster and Emergency Response (DER) team to conduct damage and needs assessments
International attention was shifted away from Bangladesh to the Darfur crisis during the year and to respond to the Asian tsunami in December
Internal
Ministry of Food and Disaster Management activated flood response plans
Local emergency response committees implemented and coordinated disaster response efforts
Flood Forecasting and Warning Center continued to issue updates on water levels of rivers and tributaries
Disaster Response Activities
Health 800 temporary health centers were established
Medical teams with specialties in water-borne diseases were deployed to different districts to deal with increased prevalence of diarrhea and water-borne diseases
Measles vaccination campaigns were conducted in the flood centers
Food was provided for affected families through the government’s Vulnerable Group Feeding (VGF) program
Livelihoods
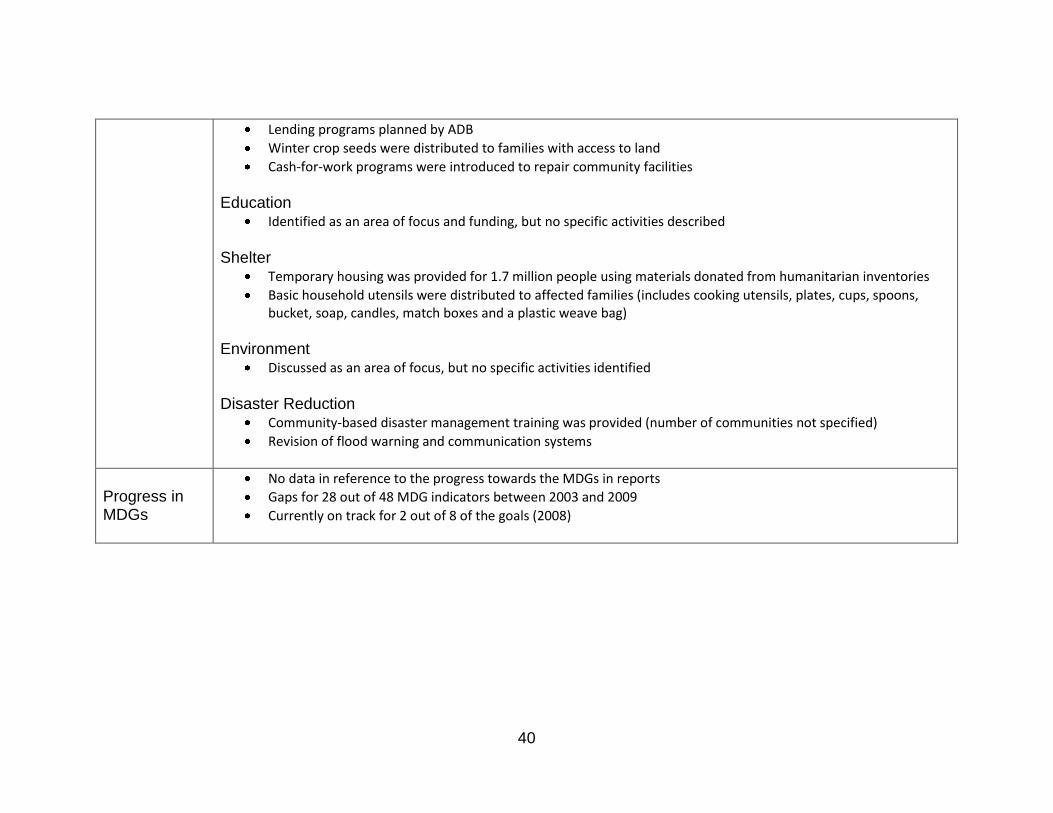
40
Lending programs planned by ADB
Winter crop seeds were distributed to families with access to land
Cash-for-work programs were introduced to repair community facilities
Education Identified as an area of focus and funding, but no specific activities described
Shelter Temporary housing was provided for 1.7 million people using materials donated from humanitarian inventories
Basic household utensils were distributed to affected families (includes cooking utensils, plates, cups, spoons, bucket, soap, candles, match boxes and a plastic weave bag)
Environment Discussed as an area of focus, but no specific activities identified
Disaster Reduction Community-based disaster management training was provided (number of communities not specified)
Revision of flood warning and communication systems
Progress in MDGs
No data in reference to the progress towards the MDGs in reports
Gaps for 28 out of 48 MDG indicators between 2003 and 2009
Currently on track for 2 out of 8 of the goals (2008)
41
DISCUSSION
There were numerous factors identified as contributing to increased
disaster vulnerability. For one, poverty has a great influence on people‟s ability to
build strong houses that can withstand the impact of hazards. Poor individuals
also have a more difficult time recovering from a disaster, for example in
Bangladesh poor individuals sold most of their belongings during the floods in
order to afford food and other basic goods, making it even more difficult to regain
their assets after the disaster (DER, 2004; OCHA, 2004a). Poverty can also drive
the rural-urban migration resulting in overpopulation in urban areas, increasing
pressure on water and sewer systems, as was the case in Bangladesh (UNICEF,
2008). Disasters can exacerbate pre-existing problems of poor water and
sanitation systems and pose health risks such as diarrhoea and typhoid;
increasing mortality and morbidity (UN HABITAT, 2009; UNICEF, 2008).
Overpopulation also exposes larger proportions of the population to a given
hazard and puts a further strain on resources available to deal with the disaster.
Such strains may discourage rehabilitation efforts, as was the case in
Bangladesh where IFRC cancelled its house reconstruction project because it did
not have enough resources to allocate fairly to those affected by the floods
(IFRC, 2005a). A relief project that provided more family kits replaced the
housing project (IFRC, 2005a). In cases of highly constrained resources and high
demand, organizations should still strive to formulate rehabilitation programs

42
whenever possible given the resources available. If no other alternatives are
possible, then a different set of criteria to select those receiving aid can be
created. The lack of distinct local leadership and planning can make such
decision making extremely challenging since such criteria must be established
according to local priorities. In any case, housing for 500 families today can
mean 500 less families affected in the future as opposed to the same (or even
greater) need during future disasters. Extra family kits are a temporary fix to
current needs, which did not reduce the impact of future floods, reduce disaster
vulnerability or positively contribute to overall country development.
The negative impact due to the lack of early warning and communication
systems was especially evident in Sri Lanka, where the UN estimates that such
systems may have saved thousands of lives (UN, 2005; 2006). There were no
tsunami early warning systems in the Indian Ocean because tsunamis were not
as common as in the Pacific Ocean where warning systems have been in place
since 1949 (UN, 2005). The Asian tsunami of 2004 illustrates the need for multi-
hazard early warning systems, even in places where a particular hazard may be
unlikely. According to the IPCC, climate change will contribute to a change in the
type of hazards that different countries will face (IPCC, 2007), therefore single-
hazard preparedness systems can no longer suffice and proactive risk
assessment is ever more important (IFRC, 2009). Formation of groups aimed at
creating tsunami early warning systems in the Indian Ocean was a disaster
response activity that translated into mitigation and has potential benefits that

43
extend beyond immediate 2004 tsunami players. The system also provides
warning to all other countries exposed to the Indian Ocean, increasing global
cooperation (MDG 8) and reducing overall risk beyond the immediate tsunami.
On the other hand, early warning and communication systems are only useful
when people have the knowledge and ability to protect themselves. For example,
there were not enough evacuation centres in all affected regions of Bangladesh,
and despite the warnings, some residents simply had nowhere to hide (Cook,
2008; OCHA, 2004a). The availability of both information and means are
important in reducing vulnerability to disasters (Randall, Navaratne, Rand, Hagos
& Jones, 2009). Efforts to provide disaster management training to local
residents in Bangladesh and Sri Lanka aimed to improve knowledge on disaster
risk, while construction of evacuation centres provided the means. These
activities reduce overall vulnerability of the communities, and depending on how
issues of local maintenance are promoted, can result in safety benefits viable for
an extended period. Unfortunately, reports identified on the Bangladesh floods of
2007 did not comment on the level of local preparedness as compared to 2004.
Presumably, risk reduction knowledge and assets would be passed on to future
generations and reduce the negative impacts of disasters on those generations.
Economic development that degrades the environment increases the
extent to which communities are vulnerable to the negative impacts of disasters.
Destruction of coral reefs and mangroves in Sri Lanka to create tourist resorts
and shrimp farms reduced the effectiveness of the natural barriers that could

44
have reduced the impact of the tsunami (Cochard et al., 2008). Environmental
degradation can also contribute to the negative effects of climate change (IPCC,
2007), which further increases vulnerability to disasters (Unnayan Onneshan,
2008). Economic activities should be balanced with good environmental
management practices that reduce the negative impacts of a disaster.
Reconstruction of mangroves and creation of environmental laws in Sri Lanka
were positive measures in ensuring long-term impacts that reduce the negative
impacts of future disasters. These measures can also work to promote
achievement of MDG7 for environmental sustainability.
Economic development can also influence where people live, whether it is
in overpopulated urban slums close to where the industries are located, or near
the sea for fishermen. Development should create economic alternatives that
remove people from areas of higher disaster vulnerability. Livelihood revival in Sri
Lanka focused mostly on the fishery industry, with not a lot of activities aimed at
diversifying economic opportunities. This was not sustainable because the laws
to relocate people away from the coastline meant some fishermen lived too far
and were no longer able to take part in the fishing sectors. Diversified economic
opportunities can help ensure economic continuity after a disaster even if one or
two economic sectors are negatively impacted (Phillipe, Bruno, Stefania &
Stefano, 2008). In Bangladesh, very little was done to promote long-term
economic development except for those who already had land. Other
employment opportunities created were limited to rebuilding donor funded

45
centres, without any provisions for further employment after those projects were
complete. Such projects therefore only focus on the immediate needs, but do not
reduce overall poverty or unemployment. Such narrow sightedness may have
been circumvented by better integrating reconstruction and livelihood revival. It is
important to understand the interrelatedness of activities in different sectors, a
notion that was not evident in the progress reports, which mainly described
„siloed‟ projects. The potential negative impact that importing rice as food aid in
Sri Lanka had on local rice farmers‟ profitability also demonstrated how a „siloed‟
food aid program did not anticipate its effects on livelihoods (OCHA, 2005a).
Projects can meet immediate needs of affected communities but inadvertently
repress progress during the rehabilitation stages.
Poor coordination among the different players and ad-hoc procedures in
Sri Lanka were found to be ineffective in ensuring the transition from the relief
stage to the rehabilitation stage (Cosgrave, 2007; Telford & Cosgrave, 2007).
Competition for funds contributed to lesser coordination in Sri Lanka (Cosgrave,
2007). Competition for funding also contributed to organizations opting for short-
term activities that would yield visible results earlier, in response to the increased
pressure from donors and the media (Christoplos, 2006).
Despite a lack of detail on the long-term impacts of immediate health
response efforts, possible long-term impacts can be speculated. The relief efforts
in both case studies managed to capitalize on populations aggregated in relief

46
camps to provide vaccinations and health education. These interventions can
translate into relatively long-term impacts, for example, the large number of
individuals vaccinated could provide herd immunity for a relatively long period of
time (Yash, 2004). Vaccination activities may have also changed local
perceptions regarding the advantages and disadvantages of immunizations if
children vaccinated in the camps fair better than those not vaccinated did. In the
same manner, health education may have also changed perceptions on health
risks and behaviours, and to provide a channel to further disseminate this
information via word of mouth. Once again, the separation between disaster
response activities and other development efforts resulted in a lack of information
to measure if activities within the relief camps translated into overall changes in
perceptions of health issues. The decision to renovate undamaged health
centres in Sri Lanka demonstrated the realization that pre-existing deficiencies
also needed to be addressed. There is however, no insight into whether or not
the newly constructed hospitals contributed to improvements in health care
service delivery and ultimately the health of the community.
The limited amount of information on the activities during the Bangladesh
floods as compared to the Asian tsunami in Sri Lanka is noteworthy. The floods
in Bangladesh did not garner as much international attention as did the tsunami,
which is also evident in the amount of information available (Cosgrave, 2007).
The Asian tsunami generated a lot of humanitarian funding (aggregate for all
affected countries) and in turn greater pressure for organizations to publicly

47
account for those funds (Christoplos, 2006). This is not to imply that there was
better accountability for one disaster response over another, but rather more
information may have been made available to the public in order to reach the
greater range of donors during the tsunami. The amount of attention also affects
the amount and type of resources gathered, which in turn influences the number
and type of projects that can be implemented. In-kind donations described in the
reports such as tarp, family kits, blankets, lentils, rice, etc., showed the greater
focus on the relief stages of disaster response. This may be as a result of
restrictive organizational mandates such as OCHA‟s flash appeal mandate which
does not accept projects with the terms “permanent” or “recovery” (de Ville de
Goyet, 2008). Earmarked funds were also largely focused on disaster relief e.g.
OCHA flash appeals of US$166 million and US$210 million for Sri Lanka and
Bangladesh respectively. Most donations to Bangladesh that were recorded on
the Financial Tracking Systems, a system that records international humanitarian
assistance, were aimed at the immediate needs and relief stage, with very few
pledges toward reconstruction. Funding in this manner promotes agencies to
undertake relief activities as opposed to long-term rehabilitation activities.
Earmarked funds can also overwhelm some sectors and neglect others,
restricting progress in some sectors such as environmental recovery in
Bangladesh. Donors therefore play a crucial role in determining what activities
are favoured.
48
The shift of resources from Bangladesh to tsunami-affected regions also
demonstrates how the amount of attention can drive disaster response and
rehabilitation efforts. Only two international organizations (OCHA & ADB)
mentioned the Bangladesh floods in 2005, after the tsunami hit. The shift in
attention may explain the lack of information on long term activities in the
Bangladeshi disaster reports, or the lack of such activities thereof. This attention
shift also provides an example of why it is important to integrate long-term
developmental efforts with relief efforts. The increase in natural disaster
occurrence means that there is greater competition for resources. Organizations
should therefore aim to begin rehabilitation (and development) sooner and
ensure that this process does occur while attention and resources are still
available. Earmarked funds again influence organizations‟ ability to integrate the
two processes.
Projects described in the various progress reports did not explicitly
address how efforts selected were linked with ongoing development efforts such
as achieving the MDGs. It is difficult for response efforts to work as a faction of
overall development efforts if the links between development and disasters are
not discernable in the plans that guide them (Christoplos, 2006). For example,
the TAFREN recovery plan for education discussed the reconstruction,
renovation and relocation of destroyed schools without any links to accessibility
or quality concerns as relevant to MDG Goal 2. Another example is how gender
equity (MDG 3) was not addressed in some projects such as livelihood revival;

49
with most of the projects aimed at men (Ratnam, 2000). This exclusion may
represent a lack of understanding of the links between disasters and the MDGs.
Monitoring and evaluation of disaster response plans as described in the
reports, neglects the outcomes and impacts of the activities conducted, simply
reporting on the amounts of money or materials used, activities undertaken and
the immediate outputs of those activities. The indicators used to measure
disaster response demonstrate the limited focus only on relief rather than
rehabilitation. Table 6 in Appendix 2 shows the different indicators discussed by
different agencies in their disaster response reports and annual reports. The
indicators used are not comprehensive to establish the success or failure of
disaster response in relation to development. It is difficult to assess how these
activities therefore improve the lives of those affected. Long term results were
even less evident for Bangladesh as attention was shifted from the floods to
respond to the Asian tsunami. The role of the media in generating and
maintaining this attention cannot be ignored. A Google news search for
„Bangladesh floods 2004‟ and „Sri Lanka tsunami 2004‟ generated 4 and 279
stories respectively (March 4, 2010).
The local context should guide disaster response efforts. Decisions on
„who receives what assistance when‟ should be guided by the context. Recurring
disasters, such as in Bangladesh may require rapid transitions from relief to
rehabilitation in order to better prepare affected communities to deal with the

50
future hazard. Acute disasters may instead result in extreme damages that result
in greater emergency relief needs. The context also dictates how resources are
shared especially when there are other disasters occurring concurrently, such as
the civil war in Sri Lanka that delayed rehabilitation efforts in some areas.
Resources donated should also be tailored to the local context unlike the
unseaworthy boats donated to fishermen in Sri Lanka after the tsunami.

51
Relevance to Current Context
In the current global picture, the earthquake that struck Haiti on January
12, 2010 provides a model example of when the links between development and
disasters are important. The country shared similar pre-disaster vulnerabilities as
those described for the two case studies above such as political strife and high
levels of poverty (UN, 2004; UNDP, 2009). Haiti is ranked 149th of 182 countries
on the Human Development Index (UNDP, 2009) and is prone to frequent
earthquakes and cyclones. When the earthquake hit, the country was still
recovering from the lingering effects of a tropical storm and three hurricanes all
experienced in the summer of 2008 (Anonymous, 2010). According to the latest
available information, Haiti was on track for only one of the eight MDGs as of
2008(MDG Monitor, 2008). The earthquake itself reduced much of the
infrastructure down to rubble and further weakened communication, surveillance,
health, education and water and sanitation systems among other things
(UNICEF, 2010). Haiti has received a lot of attention from individuals,
international humanitarian organizations, NGOs, UN agencies, private
companies and numerous governments and their associated agencies. For
disaster recovery efforts to result in substantial positive changes, they will have
to occur concurrently with development efforts.
Organizations currently working in Haiti should consider the long-term
impacts of their efforts in reducing disaster vulnerability, achieving the MDGs and
attaining any other relevant development measures. The impact of the disaster

52
was exacerbated by numerous factors of underdevelopment, which should be
addressed during relief and recovery. Rehabilitation should go beyond rebuilding
physical infrastructure, but also better understand how the „new‟ social context
can effectively use that infrastructure to rebuild the lives of the affected
population. For example, building physically accessible hospitals should be
accompanied with livelihood programs so families can afford to use these
hospitals and health education programs to know how to use the facilities
effectively. Even better, efforts should also go on to reduce the factors that
increase their risk of getting sick in the first place. Connections of efforts to
underlying factors must also extend to other sectors. A major obstacle in Haiti
integrating disaster response with development is a shortage in local experts and
authorities with the capacity to facilitate this process. Many ministerial leaders,
local NGO workers and locally stationed UN workers who are instrumental in
disaster response, rehabilitation and development died or lost their family
members during the earthquake (UN, 2010). In as much as governance of
disaster response processes in Haiti has been mainly conducted by the United
States of America (USA) and the UN (Domeltsch, 2010), capacity building of
local governance is important in ensuring local priorities are attended to and that
the sustainability of activities after the departure of USA and UN disaster
response teams is possible.

53
RECOMMENDATIONS
HAF and the Sphere project provide good suggestions for disaster
reduction, preparedness and disaster relief. The recommendations given below
are in addition to those already described in the HAF and Sphere project.
1. Build capacity of local governments to implement and maintain
disaster reduction systems
At the very least, a country must be able to afford to create and maintain
preparedness plans and to establish necessary early warning and
information systems for the hazards that they are prone to. This bare
minimum however is not adequate because it leaves countries vulnerable
to the unpredictable changes in disaster occurrence resulting from climate
change.
Regional cooperation with countries prone to similar hazards should be
promoted because it can provide a means for ensuring commitment and
accountability even when governments change. Risk pooling among
regional partners also ensures maintenance of shared early warning and
information systems even when one country is unable to contribute due to
civil unrest or economic depression.

54
In addition to suggested indicators for MDG 8 Target 5 aimed at making
new technologies available, the transfer of disaster risk-reduction
technologies is even more crucial.
2. Include elements of disaster reduction in development efforts
Development should not create or ignore future vulnerabilities but should
rather address the root causes and dynamic pressures facilitating unsafe
conditions. Disaster reduction should be integrated into efforts aimed at
achieving the MDGs e.g. including risk reduction in schools while
achieving universal education.
Development agency mandates should be more flexible to include
elements of disaster management even if their set priorities are only for
education or child health.
At each stage of development, developers should work to identify
elements that make their activities vulnerable to disasters and implement
appropriate measures to reduce those vulnerabilities.
3. Include elements of development in disaster response efforts
Disaster response plans should include how disaster relief and
rehabilitation efforts relate to local development efforts and development
requirements to better align disaster response and development.
Include development efforts in relief efforts to minimize the gap between
relief and rehabilitation and reduce vulnerability sooner.

55
Rehabilitation should consider pre-disaster vulnerabilities along with
vulnerabilities created by the disaster.
Evaluation of disaster response activities must include outcomes and
impacts on development. The MDGs indicators can be used for this
evaluation along with any other local indicators agreed upon in disaster
response plans.
Donors must allow unearmarked funding to allow for multi-sectoral
projects, which integrate development and disaster response. Deadlines
on the use of grants should also be extended to allow for developmental
efforts that usually take longer to implement.
The media should highlight disaster response projects that promote
development in order to influence key players to implement sustainable
projects.
A sample logic model for livelihood rehabilitation (Figure 9) in Sri Lanka is
shown in Appendix 3 as a tool for ensuring development in planning and
evaluating disaster response. This model can be adjusted for other sectors and
to fit changing local needs and resources. It is important to note that each sector
influences and is influenced by other sectors.
56
Potential Challenges of Recommendations
Implementation of these recommendations may be challenging in practice.
Limited financial, technological and human resources can make it difficult to
establish even the minimum required preparedness plans, early warning and
communication systems or to include disaster reduction elements in
development. There may also be a limited number of people with the expertise in
development and disaster reduction to effectively integrate them in practice.
Limited resources may also inhibit the ability for organizations to extend their
mandates to include development. Agencies may not be willing to change their
mandate in an effort to maintain their organizational identity.
The dilemma between current needs vs. future needs can be challenging
for decision makers. It can be even more challenging when the local community
and the funding agencies do not agree on which needs to address. This dilemma
may result in organizations focusing more on short-term outputs rather than the
impacts. Impacts also take time to occur and may be intangible, which can be
discouraging for some organizations or local residents. This also means that
organizations reliant on donations may be less interested in development
agendas, since successes cannot be demonstrated to entice future donations.
There is also a general lack of established and internationally accepted
indicators that tie together development and risk reduction or relief and
development. Though the MDGs are suggested as measures of development in

57
this capstone, these indicators have also received their own criticisms. Greater
research needs to be done to create indicators that better measure the relations
between disasters and development.

58
CONCLUSION
It is important for development and disaster reduction to be integrated in
practice. Disaster response efforts should foster long-term development. Simply
reinstating the pre-disaster level of development does not actually help affected
communities to better deal with future disasters; without proper rehabilitation, the
community will continue to be vulnerable. In the same manner, development
efforts should also reduce disaster risk and vulnerabilities and abate the negative
impacts of disasters. The evident effects of disasters on achieving the MDGs
require all stakeholders to take on interventions that help return countries on the
path towards achieving those goals. Inclusion of development with relief and
rehabilitation can help increase the rate at which affected countries can attempt
to attain those goals. This is especially important for countries already below the
target rate. Governments, humanitarian organizations, NGOs, community based
organizations (CBOs), private corporations, donors and the media are all
important stakeholders in the implementation of programs that promote
development.
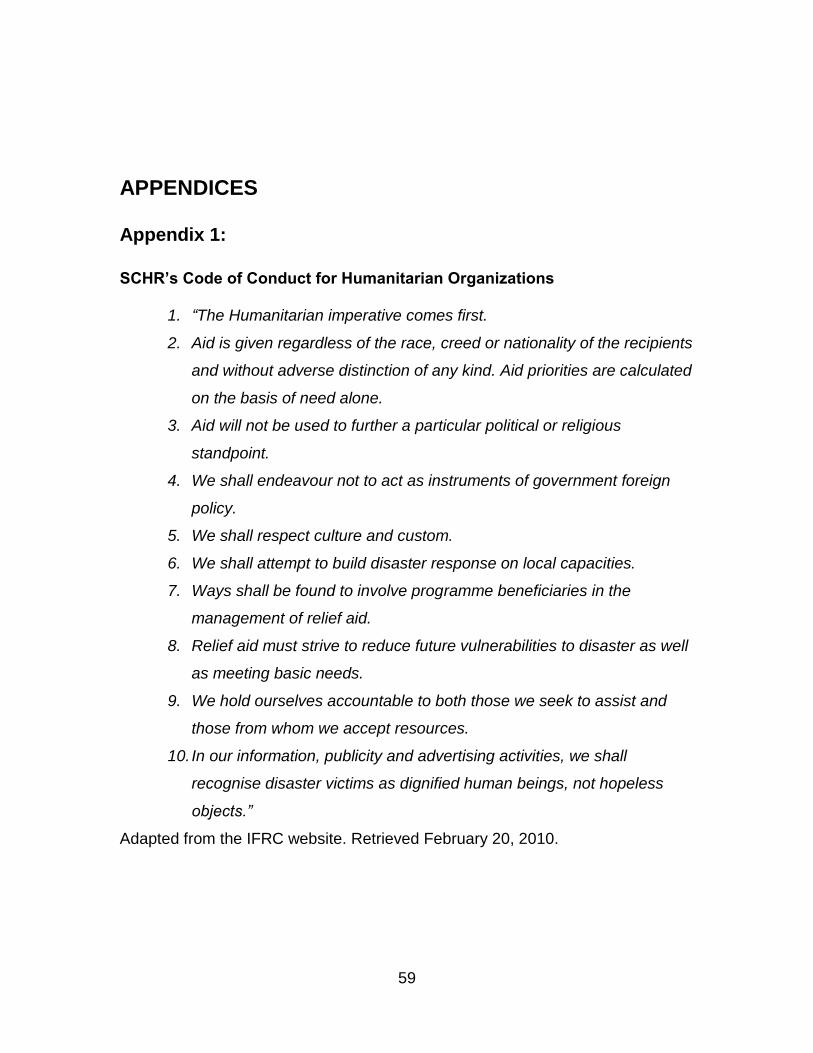
59
APPENDICES
Appendix 1:
SCHR’s Code of Conduct for Humanitarian Organizations
1. “The Humanitarian imperative comes first.
2. Aid is given regardless of the race, creed or nationality of the recipients
and without adverse distinction of any kind. Aid priorities are calculated
on the basis of need alone.
3. Aid will not be used to further a particular political or religious
standpoint.
4. We shall endeavour not to act as instruments of government foreign
policy.
5. We shall respect culture and custom.
6. We shall attempt to build disaster response on local capacities.
7. Ways shall be found to involve programme beneficiaries in the
management of relief aid.
8. Relief aid must strive to reduce future vulnerabilities to disaster as well
as meeting basic needs.
9. We hold ourselves accountable to both those we seek to assist and
those from whom we accept resources.
10. In our information, publicity and advertising activities, we shall
recognise disaster victims as dignified human beings, not hopeless
objects.”
Adapted from the IFRC website. Retrieved February 20, 2010.

60
Priorities of the Hyogo Action Framework
1. Ensure that disaster risk reduction is a national and a local priority
with a strong institutional basis for implementation.
2. Identify, assess and monitor disaster risks and enhance early
warning.
3. Use knowledge, innovation and education to build a culture of
safety and resilience at all levels.
4. Reduce the underlying risk factors.
5. Strengthen disaster preparedness for effective response at all
levels.
From UNISDR Hyogo framework for action 2005-2015:* Building the resilience of
nations and communities to disasters. Proceedings of the World Conference on
Disaster Reduction. 18-22 January, 2005, Kobe, Hyogo, Japan.

61
Case Studies Rejected (met first four criteria)
Bangladesh floods, 2000; 2001; 2002; 2003
India floods, 2000; 2001; 2002; 2003; 2004
India tsunami, 2004
Iran floods, 2001; 2002
Nepal floods, 2004
Pakistan earthquake, 2001; 2002
Pakistan floods, 2001; 2003
Sri Lanka floods, 2000; 2002; 2003; 2004

62
Appendix 2: Tables
Table 4: Economic vs. Human Development
Economic Development (World Bank) Human Development (UNDP)
Refers to social and technological
progress
Goal is to stimulate local employment
opportunities in sectors that improve
the community (Blakely, 1994)
Key Indicators
o School enrolment, primary
o Life expectancy
o Poverty rates
o Gross Domestic Product
o GNI per capita
o External debt stocks
o Annual population growth
Refers to the process of enlarging
people‟s choices achieved through
expansion of human capabilities and
functioning
Key indicators
o Human Development Index
(composite measure of life
expectancy, educational
attainment and income
o Gender-related Development
Index ( HDI adjusted for gender
inequity)
o Gender Empowerment Measure
(gender equality in economic and
political participation and decision
making)
o Human Poverty Index (focuses on
measures of deprivation of
longevity of life, knowledge and a
decent standard of living)

63
Table 5: Millennium Development Goals, Targets & Indicators
Millennium Development Goals (MDGs)
Goals and Targets (from the Millennium Declaration)
Indicators for monitoring progress
Goal 1: Eradicate extreme poverty and hunger
Target 1.A: Halve, between 1990 and 2015, the proportion of people whose income is less than one dollar a day
1.1 Proportion of population below $1 (PPP) per day 1.2 Poverty gap ratio 1.3 Share of poorest quintile in national consumption
Target 1.B: Achieve full and productive employment and decent work for all, including women and young people
1.4 Growth rate of GDP per person employed 1.5 Employment-to-population ratio 1.6 Proportion of employed people living below $1 (PPP)
per day 1.7 Proportion of own-account and contributing family
workers in total employment
Target 1.C: Halve, between 1990 and 2015, the proportion of people who suffer from hunger
1.8 Prevalence of underweight children under-five years of age
1.9 Proportion of population below minimum level of dietary energy consumption
Goal 2: Achieve universal primary education
Target 2.A: Ensure that, by 2015, children everywhere, boys and girls alike, will be able to complete a full course of primary schooling
2.1 Net enrolment ratio in primary education 2.2 Proportion of pupils starting grade 1 who reach last
grade of primary 2.3 Literacy rate of 15-24 year-olds, women and men
Goal 3: Promote gender equality and empower women
Target 3.A: Eliminate gender disparity in primary and secondary education, preferably by 2005, and in all levels of education no later than 2015
3.1 Ratios of girls to boys in primary, secondary and tertiary education
3.2 Share of women in wage employment in the non-agricultural sector
3.3 Proportion of seats held by women in national parliament
Goal 4: Reduce child mortality
Target 4.A: Reduce by two-thirds, between 1990 and 2015, the under-five mortality rate
4.1 Under-five mortality rate 4.2 Infant mortality rate 4.3 Proportion of 1 year-old children immunised against
measles Goal 5: Improve maternal health
Target 5.A: Reduce by three quarters, between 1990 and 2015, the maternal mortality ratio
5.1 Maternal mortality ratio 5.2 Proportion of births attended by skilled health
personnel
Target 5.B: Achieve, by 2015, universal access to reproductive health
5.3 Contraceptive prevalence rate 5.4 Adolescent birth rate 5.5 Antenatal care coverage (at least one visit and at
least four visits) 5.6 Unmet need for family planning
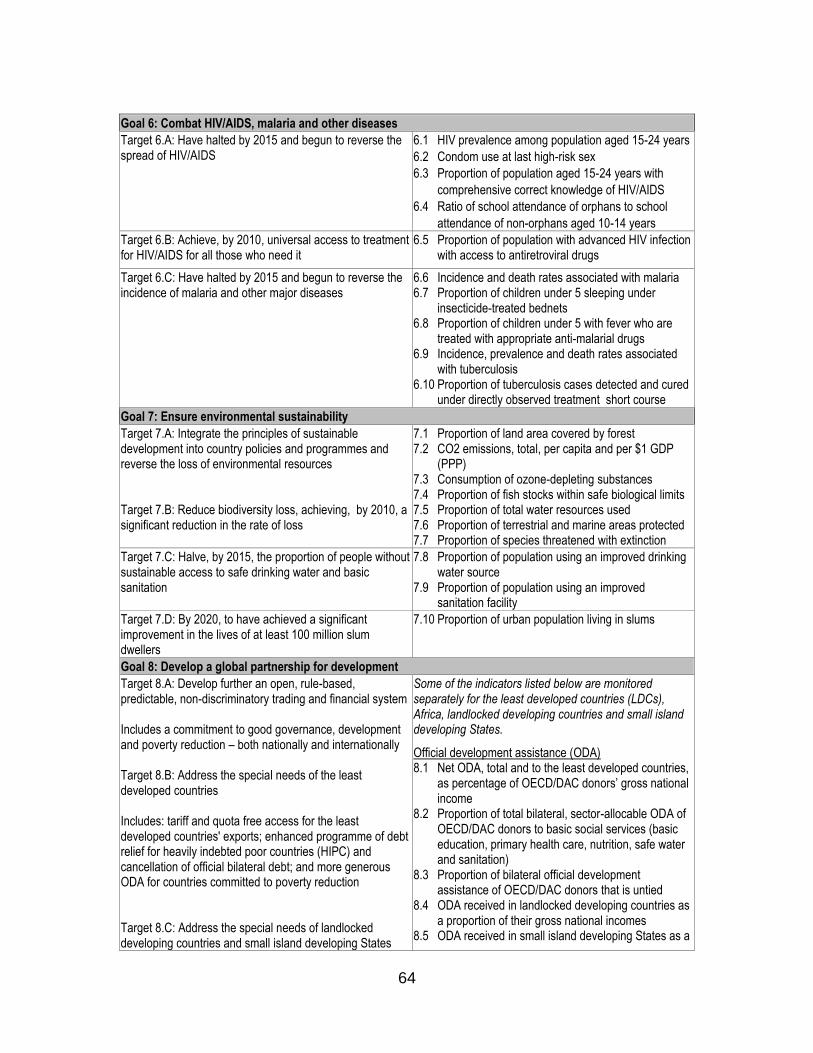
64
Goal 6: Combat HIV/AIDS, malaria and other diseases
Target 6.A: Have halted by 2015 and begun to reverse the spread of HIV/AIDS
6.1 HIV prevalence among population aged 15-24 years
6.2 Condom use at last high-risk sex
6.3 Proportion of population aged 15-24 years with
comprehensive correct knowledge of HIV/AIDS
6.4 Ratio of school attendance of orphans to school
attendance of non-orphans aged 10-14 years
Target 6.B: Achieve, by 2010, universal access to treatment for HIV/AIDS for all those who need it
6.5 Proportion of population with advanced HIV infection with access to antiretroviral drugs
Target 6.C: Have halted by 2015 and begun to reverse the incidence of malaria and other major diseases
6.6 Incidence and death rates associated with malaria 6.7 Proportion of children under 5 sleeping under
insecticide-treated bednets 6.8 Proportion of children under 5 with fever who are
treated with appropriate anti-malarial drugs 6.9 Incidence, prevalence and death rates associated
with tuberculosis 6.10 Proportion of tuberculosis cases detected and cured
under directly observed treatment short course
Goal 7: Ensure environmental sustainability
Target 7.A: Integrate the principles of sustainable development into country policies and programmes and reverse the loss of environmental resources Target 7.B: Reduce biodiversity loss, achieving, by 2010, a significant reduction in the rate of loss
7.1 Proportion of land area covered by forest 7.2 CO2 emissions, total, per capita and per $1 GDP
(PPP) 7.3 Consumption of ozone-depleting substances 7.4 Proportion of fish stocks within safe biological limits 7.5 Proportion of total water resources used 7.6 Proportion of terrestrial and marine areas protected 7.7 Proportion of species threatened with extinction
Target 7.C: Halve, by 2015, the proportion of people without sustainable access to safe drinking water and basic sanitation
7.8 Proportion of population using an improved drinking water source
7.9 Proportion of population using an improved sanitation facility
Target 7.D: By 2020, to have achieved a significant improvement in the lives of at least 100 million slum dwellers
7.10 Proportion of urban population living in slums
Goal 8: Develop a global partnership for development
Target 8.A: Develop further an open, rule-based, predictable, non-discriminatory trading and financial system Includes a commitment to good governance, development and poverty reduction – both nationally and internationally Target 8.B: Address the special needs of the least developed countries Includes: tariff and quota free access for the least developed countries' exports; enhanced programme of debt relief for heavily indebted poor countries (HIPC) and cancellation of official bilateral debt; and more generous ODA for countries committed to poverty reduction Target 8.C: Address the special needs of landlocked developing countries and small island developing States
Some of the indicators listed below are monitored separately for the least developed countries (LDCs), Africa, landlocked developing countries and small island developing States.
Official development assistance (ODA) 8.1 Net ODA, total and to the least developed countries,
as percentage of OECD/DAC donors’ gross national income
8.2 Proportion of total bilateral, sector-allocable ODA of OECD/DAC donors to basic social services (basic education, primary health care, nutrition, safe water and sanitation)
8.3 Proportion of bilateral official development assistance of OECD/DAC donors that is untied
8.4 ODA received in landlocked developing countries as a proportion of their gross national incomes
8.5 ODA received in small island developing States as a
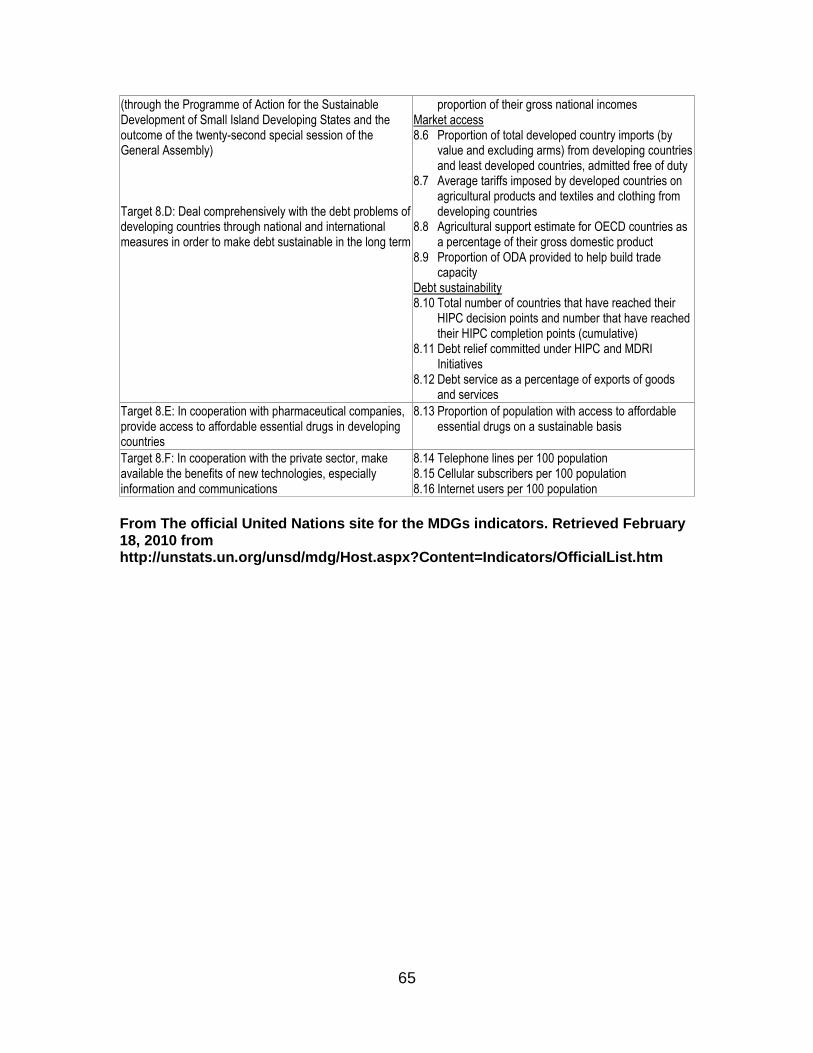
65
(through the Programme of Action for the Sustainable Development of Small Island Developing States and the outcome of the twenty-second special session of the General Assembly) Target 8.D: Deal comprehensively with the debt problems of developing countries through national and international measures in order to make debt sustainable in the long term
proportion of their gross national incomes Market access 8.6 Proportion of total developed country imports (by
value and excluding arms) from developing countries and least developed countries, admitted free of duty
8.7 Average tariffs imposed by developed countries on agricultural products and textiles and clothing from developing countries
8.8 Agricultural support estimate for OECD countries as a percentage of their gross domestic product
8.9 Proportion of ODA provided to help build trade capacity
Debt sustainability 8.10 Total number of countries that have reached their
HIPC decision points and number that have reached their HIPC completion points (cumulative)
8.11 Debt relief committed under HIPC and MDRI Initiatives
8.12 Debt service as a percentage of exports of goods and services
Target 8.E: In cooperation with pharmaceutical companies, provide access to affordable essential drugs in developing countries
8.13 Proportion of population with access to affordable essential drugs on a sustainable basis
Target 8.F: In cooperation with the private sector, make available the benefits of new technologies, especially information and communications
8.14 Telephone lines per 100 population 8.15 Cellular subscribers per 100 population 8.16 Internet users per 100 population
From The official United Nations site for the MDGs indicators. Retrieved February 18, 2010 from http://unstats.un.org/unsd/mdg/Host.aspx?Content=Indicators/OfficialList.htm

66
Table 6: Current Indicators found in Disaster Response & Recovery Progress Reports
SECTOR INDICATORS IN REPORTS
Education
Number of schools built or reconstructed
Number of children served/accommodated
Number of training centres built
Number of libraries built
Number of schools receiving educational supplies
Environment
Areas cleared of debris
Number of docks repaired
Areas cleared of sand (rice paddies)
Amount of coastline area evacuated
Food
Number of children receiving nutrition supplements
Number of children whose growth is being monitored
Number of people fed
Amount of food sent/distributed
Number of schools served (school feeding program)
Number of Food-for-Work participants
Amount of cash allowances distributed
Health
Number of public health workers trained
Number of hygiene kits distributed
Number of flip-flops distributed (prevent worms)
Number of children served by nutritional program
Number of hospitals receiving medical equipment
Number of children/families counselled
Number of children vaccinated
Number of mosquito-nets distributed
Amount of drugs/contraceptives distributed
Number of psychosocial sessions conducted
Infrastructure
Number of community centres built
Number of families relocated
Number (kilometres) of roads repaired
Number of community contracts issued
Number of water supply projects
Livelihoods
Number of fishing boats repaired or reconstructed
Number of businesses established
Number of banks established
Number of palm trees planted
Number of loans given
Number of fish ponds created & stocked
Number of sewing machines distributed

67
Shelter
Number of tents distributed
Number of temporary houses constructed/provided
Number of permanent houses constructed
Number of houses repaired
Amount of land acquired
Water and Sanitation
Number of wells repaired or built
Number of ponds & irrigation canals
Number of latrines constructed
Number of rain water harvesting tanks built
Number of people trained on harvesting tanks
Number of people with access to safe water
Number of schools with water & sanitation facilities
Number of children receiving hygiene education

68
Appendix 3: Figures
Figure 9: Sample Logic Model for Tsunami Disaster Response in Sri Lanka
INPUTS ACTIVITIES OUTPUTS OUTCOMES IMPACTS Financial resources Educational supplies Reconstruction supplies e.g.
timber, roofing Donated work-related
supplies e.g. boats, sewing machines etc.
Local Community Sri Lanka Institute for Local
Governance (SLILG) Volunteers Local CBOs & NGOs Provincial Councils & State
Agencies Ministry of Labor Relations
& Manpower Ministry of Finance &
Planning Ministry of Samurdhi &
Poverty Alleviation Ministry of Tourism Ministry of Trade,
Marketing Development, Co-operatives & Consumer
Clear debris Clear sand from rice
paddies Acquire land for
vocational training centers, industries, farms & business offices
Build/renovate vocational training centers
Conduct training sessions for local career trainers
Identify crops replacements for desalinated farms
Repair/construct fishery harbors, anchorages and other fishing related infrastructure
Rebuild damaged hotels and other
X amount of land acquired/cleared
B coastline area cleared
C amount of rice paddies cleared of sand
D number of vocational training centers built
E alternative crops identified
F amount of seeds distributed
G number of fishing infrastructures repaired
H number of opportunities identified (gender appropriate/sensitive)
J number of new occupations identified and developed
Increase in local employment opportunities especially for women
Reduction in migration for economic reasons
Increase in agricultural productivity
Increase in food variety
Improved food security
Reduction in the prevalence of underweight children under-five years of age
Reduction in the proportion of population below minimum level of
Reduction in the proportion of population below $1 purchasing power parity (PPP) per day
Reduction in the gap ratio
Reduction of the share of the poorest quintile in national consumption
Increased growth rate of GDP per person employed
Increased employment-to-population ratio
Increased gender equity
Reduction in child mortality rate

69
Services Ministry of Agriculture,
Livestock, Land & Irrigation Ministry of Agricultural
Development & Agrarian Services
Ministry of Youth Empowerment & Social Economic Development
Ministry of Supplementary Plantation Crops Development
Ministry of Fisheries & Aquatic Resources
Ministry of Education Ministry of Higher
Education Ministry of Vocational &
Technical Training Ministry of Enterprise
Development & Investment Promotion
Ministry of Industrial Development
Ceylon Fisheries/Harbour Corporation
Jobsnet Chamber of Commerce
International Labor Organization
International Organization for Migration
tourism areas Rebuild civic
infrastructure Assess income
generating opportunities in the community
Train community members on skills required to take advantage of income opportunities
Partner with private companies in creating employment in local community
Promoting diverse economic sectors (as applicable)
Promote creation of gender sensitive employment opportunities
Evaluate environmentally friendliness of livelihood alternatives
Mobilize for environmentally friendly policies
Organize lobbying for provision for adequate
K number of occupation relevant equipment distributed
L number of trainers trained
M number of training sessions conducted
N number of locals trained
O number of public-private partnerships established
P number of community members employed (gender aggregated)
Q number of trade agreements
R number of reduced tariffs negotiations approved
dietary energy consumption
Reduction in the proportion of employed people living below $1 (PPP) per day
Increase in the share of employed women
Increase in the proportion of land area covered by forest
Maintenance of proportion of fish stocks within safe biological limits
Increased proportion of protected terrestrial and marine areas
Presence of environmental policies and programs
Increased access to the international market
Increase in GDP
Increased biodiversity
Zero/surplus balance of payments (BOP)
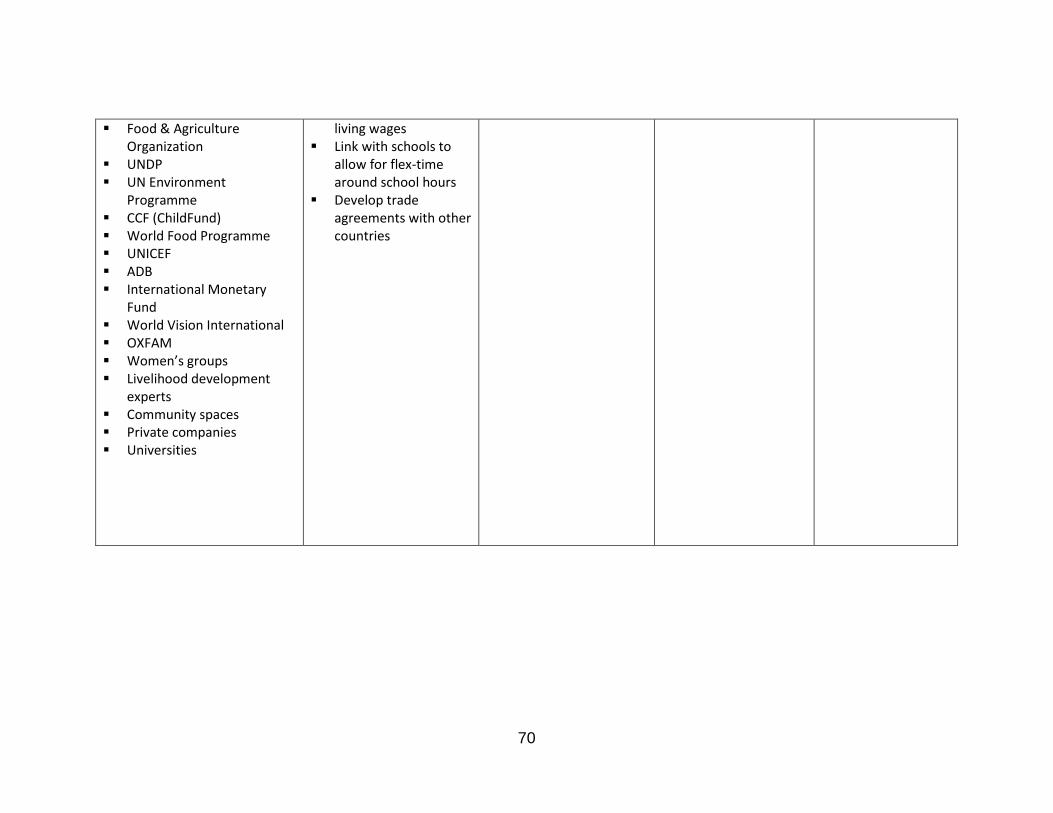
70
Food & Agriculture Organization
UNDP UN Environment
Programme CCF (ChildFund) World Food Programme UNICEF ADB International Monetary
Fund World Vision International OXFAM Women’s groups Livelihood development
experts Community spaces Private companies Universities
living wages Link with schools to
allow for flex-time around school hours
Develop trade agreements with other countries

71
BIBLIOGRAPHY
Asian Development Bank (ADB). (2004). Bangladesh: 2004 flood, response, damage and recovery needs. Manila: Asian Development Bank.
Asian Development Bank (ADB). (2005). Rebuilding Sri Lanka: Assessment of tsunami recovery implementation. Manila: Asian Development Bank.
Basher, R. (2008). Disaster impacts: Implications and policy responses. Social Research, 75(3), 937-954. Retrieved from Academic Search Premier database.
Berg, B., Grievink, L., Gutschmidt, K., Lang, T., Palmer, S., Ruijten, M., et al. (2008). The public health dimension of disasters - health outcome assessment of disasters. Prehospital and Disaster Medicine, 23(4), 55-59. Retrieved from Global Health database.
Blakely, E.J. (1994). Planning local economic development: Theory and practice (2ed). Thousand Oaks: Sage Publications
British Broadcasting Corporation (BBC News). (2004). UN asks for Bangladesh flood aid. Tuesday, 31 August, 2004.
Buchanan-Smith, M. (2003). How the Sphere project came into being: A case study of policy-making in the humanitarian aid sector and the relative influence of research. Working Paper 215. London: Overseas Development Institute.
Cannon, T. (2000). Vulnerability analysis and disasters. In Parker, D.J. (Ed), Floods (pp 45-55). London: Routledge
Centre for Research on the Epidemiology of Disasters (CRED). (n.d). About CRED. Retrieved February 16, 2010 from http://www.cred.be/about
Christoplos, I. (2006). Links between relief, rehabilitation and development in the tsunami response. London:Tsunami Evaluation Coalition
Clements, B.W. (2009). Disasters and public health: Planning and response. Boston: Butterworth-Heinemann/Elsevier.
Cochard, R., Ranamukhaarachchi, S., Shivakoti, G., Shipin, O., Edwards, P., & Seeland, K. (2008). The 2004 tsunami in Aceh and Southern Thailand: A review on coastal ecosystems, wave hazards and vulnerability. Perspectives in Plant Ecology, Evolution & Systematics, 10(1), 3-40.
72
Cook, A., Watson, J., Buynder, P., Robertson, A., & Weinstein, P. (2008). 10th Anniversary review: natural disasters and their long-term impacts on the health of communities. Journal of Environmental Monitoring, 10(2), 167-175. Retrieved from Global Health database.
Cook, B.R. (2008). Controversy in Bangladesh: What sort of knowledge for what sort of flood management? Geography, 93(2), 114-118. Retrieved from Academic Search Premier.
Cosgrave, J. (2007). Synthesis Report: Expanded Summary. Joint evaluation of the international response to the Indian Ocean tsunami. London: Tsunami Evaluation Coalition.
De Ville de Goyet, C. (2008). Information gaps in relief, recovery, and reconstruction in the aftermath of natural disasters. In S. Amin & M. Goldstein (Eds.), Data against natural disasters: Establishing effective systems for relief, recovery, and reconstruction (pp.23-58). Washington D.C: The World Bank
Dilley,M., Chen, R.S., Deichmann, U., Lerner-Lam, A.L., Arnold, M., Agwe, J., et al. (2005). Natural disaster hotspots: A global risk analysis. Synthesis Report, March 2005.
Disaster and Emergency Response Sub –Group (DER). (2004). Monsoon floods 2004 draft assessment report - 28 July 2004. Dhaka, Bangladesh.
Eatwell, J., Milgate, M. & Newman, P. (Eds). (1989). Economic Development. New York: W.W.Norton
Few, R. & Matthies, F. (Eds). (2006). Flood hazards and health: Responding to present and future risks. Trowbridge: Earthscan.
Food and Agricultural Organization of the United Nations (FAO). (2006). Plan of operations: Sri Lanka Component of Forestry Programme for early rehabilitation in Asian tsunami affected countries.
Gadrey, J. & Jany-Catrice, F. (2006). The new indicators of well-being and development. New York: Palgrave MacMillan
Hooke, W. & Rogers, P.G. (2005). Public health risks of disasters: Communication, infrastructure, and preparedness – Workshop summary. Roundtable on Environmental Health Sciences, Research, and Medicine. Washington: National Academies Press.
Inter-Agency Standing Committee (IASC). (1994). Consolidated appeal process guidelines. Retrieved March 22, 2010 from http://ochaonline.un.org/humanitarianappeal/webpage.asp?Nav=_docs_en&Site=_docs&Lang=en

73
Inter-Agency Standing Committee (IASC). (n.d.). About the IASC. Retrieved February 22, 2010 from http://humanitarianinfo.org/iasc/pageloader.apsx?page=content-about-default
Intergovernmental Panel on Climate Change (IPCC). (2007). Climate change 2007: Synthesis report. Retrieved March 23, 2010 from http://www.ipcc.ch/publications_and_data/ar4/syr/en/spms3.html
International Federation of Red Cross and Red Crescent Societies (IFRC). (n.d.a). Disaster management: About disasters: What is a disaster? Retrieved February 16, 2010 from http://www.ifrc.org/what/disasters/about/index.asp
International Federation of Red Cross and Red Crescent Societies (IFRC). (n.d.b). Disaster management: About disasters: Forgotten disasters. Retrieved February 16, 2010 from http://www.ifrc.org/what/disasters/about/forgotten-disasters.asp
International Federation of Red Cross and Red Crescent Societies (IFRC). (n.d.c). Code of Conduct for the International Red Cross and Red Crescent Movement and NGOs in disaster relief. Retrieved February 22, 2010 from http://www.ifrc.org/publicat/conduct/index.asp
International Federation of Red Cross and Red Crescent Societies (IFRC). (n.d.d). Disaster management: About disasters: Aggravating factors. Retrieved February 16, 2010 from http://www.ifrc.org/what/disasters/about/factors/climate.asp
International Federation of Red Cross and Red Crescent Societies (IFRC). (2004). World disaster report 2004: Focus on neglected crises. Focus on community resilience.
International Federation of Red Cross and Red Crescent Societies (IFRC). (2005). Tsunami facts and figures - Updated 15 December 2005. Geneva: IFRC. Retrieved February 28, 2010 from http://www.ifrc.org/docs/pubs/Updates/tsunami_facts151205.pdf#xml=http://search.ifrc.org/cgi/texis.exe/webinator/search/pdfhi.txt?query=tsunami&pr=english&prox=page&rorder=500&rprox=500&rdfreq=500&rwfreq=500&rlead=500&sufs=0&order=r&cq=&id=43d50a69b2
International Federation of Red Cross and Red Crescent Societies (IFRC). (2005a). Bangladesh: floods. Revised Appeal 17 February2005. Geneva: IFRC. Retrieved March 20, 2010 from http://www.reliefweb.int/rw/RWFiles2005.nsf/FilesByRWDocUnidFilename/VBOL-69DHW4-full_report.pdf/$File/full_report.pdf
International Federation of Red Cross and Red Crescent Societies (IFRC). (2007). World disaster report 2007: Focus on discrimination.

74
International Federation of Red Cross and Red Crescent Societies (IFRC). (2008). World disaster report 2008: Focus on HIV and AIDS.
International Federation of Red Cross and Red Crescent Societies (IFRC). (2008a). Introduction to the guidelines for the domestic facilitation and regulation of international disaster relief and initial recovery assistance. Geneva: IFRC
International Federation of Red Cross and Red Crescent Societies (IFRC). (2009). World disaster report 2009: Focus on early warning, early action.
International Federation of Red Cross and Red Crescent Societies (IFRC). (2009a). Tsunami five-year progress report 2004 – 2009. Geneva: IFRC
International Strategy for Disaster Reduction (UNISDR). (2005). Hyogo framework for action 2005-2015:* Building the resilience of nations and communities to disasters. Proceedings of the World Conference on Disaster Reduction. 18-22 January, 2005, Kobe, Hyogo, Japan.
International Strategy for Disaster Reduction (UNISDR). (2007). Integrating disaster risk reduction into the millennium development goals: Review of activities up to the present. Retrieved March 3, 2010 from http://www.reliefweb.int/rw/lib.nsf/db900SID/PANA-7K8DCN?OpenDocument
International Strategy for Disaster Reduction (UNISDR). (2009). UNISDR terminology on disaster risk reduction. Retrieved February 16, 2010 from http://www.unisdr.org/eng/terminology/terminology-2009-eng.html
International Strategy for Disaster Reduction (UNISDR). (2009a). 55 million people affected by extreme weather disasters in 2009. UNISDR News Brief 14 December 2009. Retrieved February 18, 2010 from http://www.unisdr.org/news/v.php?id=12035
International Strategy for Disaster Reduction (UNISDR). (n.d.). Platform for the promotion of early warning. Retrieved March 3, 2010 from http://www.unisdr.org/ppew/ppew-index.htm
Jiang, L., Young, M. & Hardee, K. (2008). Population, urbanization and the environment. World Watch, 21(5), 34-39. Retrieved from Academic Search Premier
Kalfagianni, A. (2008). Ethics and Politics on Human Development. Conference Papers – International Studies Association, 1-19. Retrieved from Academic Search Premier database
Kreimer, A., Arnold, M. & Carlin, A. (2003). Building safer cities: The future of disaster risk. Washington D.C.: The World Bank. Retreived February 18, 2010 from http://www.preventionweb.net/files/638_8681.pdf

75
Lizarralde, G., Johnson, C. & Davidson, C. (Eds.) (2010). Rebuilding after disasters: From emergency to sustainability. London: Spon Press
Loayza, N., Olaberria, E., Rigolini, J. & Christiaensen, L. (2009). Natural disasters and growth: Going beyond the averages. Policy Research Working Paper 4980, June 2009. Retrieved February 20, 2010 from http://www-wds.worldbank.org/external/default/WDSContentServer/IW3P/IB/2009/06/29/000158349_20090629153246/Rendered/PDF/WPS4980.pdf
McEntire, D.A. (2007). Disaster response and recovery. Mississauga: John Wiley & Sons Inc.
McMahon, P., Nyheim, T., & Schwarz, A. (2006). After the tsunami: Lessons from reconstruction. McKinsey Quarterly, (1), 94-105. Retrieved from http://search.ebscohost.com/login.aspx?direct=true&db=snh&AN=19627906&site=ehost-live
McMichael, A., Friel, S., Nyong, A. & Corvalan, C. (2008). Global environmental change and health: Impacts, inequalities and the health sector. BMJ:British Medical Journal, 336 (7637), 191-194. Retrieved from Academic Search Premier.
Murphy, D. (2000, December 5). Indonesia's president backs away from tolerance. Christian Science Monitor, p. 7. Retrieved from Academic Search Premier database.
Noji, E.K. (Ed.). (1997). The nature of disaster: General characteristics and public health effects. In The public health consequences of disasters. New York: Oxford University Press.
Noji, E.K. (Ed.). (1997a). The use of epidemiologic methods in disasters. The public health consequences of disasters. New York: Oxford University Press.
Organisation for Economic Co-operation and Development (OECD). (n.d.). OECD statistics portal.
Pan American Health Organization (PAHO). (n.d). Natural disasters: Myths and realities. Retrieved February 17, 2010 from http://paho.org/English/PED/myths.htm
Pan American Health Organization (PAHO). (n.d). Natural disasters: Myths and realities. Retrieved from Global Health database.
Peduzzi, P., Dao, H., Herold, C., & Mouton, F. (2009). Assessing global exposure and vulnerability towards natural hazards: The disaster risk index. Natural Hazards and Earth System Sciences, 9(4), 1149-1159. Retrieved from Global Health database.

76
Philippe, R., Bruno, N., Stefania, S. & Stefano, M. (2008). From emergency relief to livelihood recovery: Lessons learned from post-tsunami experiences in Indonesia and India. Disaster Prevention & Management, 17(3), 410-429. Retrieved from http://search.ebscohost.com/login.aspx?direct=true&db=aph&AN=33056158&site=ehost-live
Ranasinghe, T. & Kallesoe, M. (2006).Valuation, rehabilitation and conservation of mangroves in tsunami affected areas of Hambantota, Sri Lanka. International Union for the Conservation of Nature (IUCN).
Randall, J.J., Navaratne, A., Rand, E.C., Hagos, Y. & Jones, H. (2009). Integrating environmental sustainability into water and sanitation sector: Lessons from tsunami disaster response. Proceeding from 33rd WEDC International Conference: Accra, Ghana, 7-11 April 2008.
Rashid, S. (2000). Economic policy for growth: Economic development is human development. Boston: Kluwer Academic Publishers.
Ratnam, R. (2005). Restoring livelihoods in Sri Lanka. Press Release. Geneva: IFRC. Retrieved February, 28, 2010 from http://www.ifrc.org/docs/news/05/05122802/index.asp
ReliefWeb. (2010). Financial tracking service: Tracking global humanitarian aid flows. Retrieved March 18, 2010 from http://ocha.unog.ch/fts/pageloader.apsx
Sarvananthan, M., & Sanjeewanie, H. M. P. (2008). Recovering from the tsunami: People's experiences in Sri Lanka. Contemporary South Asia, 16(3), 339-351
Sasin, M. (2008). The flow of information during disaster response: The case of the Mozambique floods, 2007. In S. Amin & M. Goldstein (Eds.), Data against natural disasters: Establishing effective systems for relief, recovery, and reconstruction (pp.185-232). Washington D.C: The World Bank
Scheiermeier, Q. & Witze, A. (2009). Five years after the Indian Ocean disaster, the technology is in place, but local preparedness is less advanced. Nature 462, 968-969. Retrieved from Academic Search Premier.
Schipper, L., & Pelling, M. (2006). Disaster risk, climate change and international development: Scope for, and challenges to, integration. Disasters, 30(1), 19-38. doi:10.1111/j.1467-9523.2006.00304.x
Schmidt-Traub, G. (2009). The millennium development goals and human-rights based approaches: Moving towards a shared approach. International Journal of Human Rights, 13 (1), 72-85. Retrieved from Academic Search Premier database.

77
Sinha, A.K. & Srivastava, S. (2002). Comparative study on recovery and reconstruction: A case for an international platform. Retrieved from PreventionWeb database.
Smillie, I. (1998). Relief and development: The struggle for synergy. Occasional Paper #33. Providence: The Thomas J. Watson Jr. Institute for International Studies.
Sphere. (2004). The Sphere project: Humanitarian charter and minimum standards in disaster response (2004 Ed).
Spiegel, P., Phuoc, L., Ververs, M. & Salama, P. (2007). Occurrence and overlap of natural disasters, complex emergencies and epidemics during the past decade (1995-2004).. Conflict and Health, 1(2). Retrieved from Global Health database.
Srinivas, H & Nakagawa, Y. (2008). Environmental implications for disaster preparedness: Lessons learnt from the Indian ocean tsunami. Journal of Environmental Management 89(1). Retrieved from Academic Search Premier database.
Stathakis, G. & Vaggi, G. (Eds). (2006). Economic development and social change: Historical roots and modern perspectives. New York: Routledge
Stern, N. (2006). Short executive summary: Stern review report on the economics of climate change (Pre-publication Ed.). London: HM Treasury.
Stover, E., & Vinck, P. (2008, August 13). Cyclone Nargis and the Politics of Relief and Reconstruction Aid in Burma (Myanmar). JAMA: Journal of the American Medical Association, pp. 729-731. Retrieved from Academic Search Premier database.
Task Force for Rebuilding the Nation (TAFREN). (2005). Rebuilding Sri Lanka action plan. Colombo: Presidential Secretariat.
Telford, J., & Cosgrave, J. (2007). The international humanitarian system and the 2004 indian ocean earthquake and tsunamis. Disasters, 31(1), 1-28. doi:10.1111/j.1467-7717.2007.00337.x
Tolentino Jr., A. (2007). The challenges of tsunami disaster response planning and management. International Review for Environmental Strategies, 7(1), 147-154. Retrieved from Academic Search Premier.
UN Secretary-General Report. In larger freedom: towards development, security and human rights for all (A/59/2005) of 21 March 2005. New York: United Nations.

78
UNAIDS: Joint United Nations Programme on HIV/AIDS. HIV/AIDS and conflict: Conflicts and disasters contribute to spread of HIV/AIDS. Fact Sheet, August 2003. Copenhagen: UNAIDS Office on AIDS, Security and Humanitarian Response.
United Nations (UN). (2005). UN launches plans for global early warning system on natural disasters. (February 19, 2005). Retrieved February 20, 2010 from http://www.un.org/apps/news/story.asp?NewsID=13077&Cr=natural&Cr1=disaster
United Nations (UN). (2006). Global survey of early warning systems: An assessment of capacities, gaps and opportunities toward building a comprehensive global early warning system for all natural hazards. Geneva: United Nations
United Nations (UN). (n.d.). Millennium development goals. Retrieved February 23, 2010 fromhttp://www.un.org/millenniumgoals/
United Nations Children‟s Fund (UNICEF). (2008). Sanitation, hygiene and water supply in urban slums. Retrieved March 18, 2010 from http://www.unicef.org/bangladesh/URBAN_Water_Sanitation_and_Hygiene.pdf
United Nations Development Programme (UNDP). (1990). Human development report 1990. New York: Oxford University Press.
United Nations Development Programme (UNDP). (2004). A global report: Reducing disaster risk: A challenge for development. Retrieved March 3, 2010 from http://www.undp.org/cpr/whats_new/rdr_english.pdf
United Nations Development Programme (UNDP). (2005). Survivors of the tsunami: One year later, UNDP assisting communities to build back better. New York: UNDP
United Nations Development Programme (UNDP). (2005a). Restoring livelihoods still a key concern in Sri Lanka. New York: UNDP
United Nations Development Programme (UNDP). (n.d.). Natural disaster risk reduction. Retrieved February 17, 2010 from http://www.undp.org/cpr/we_do/integrating_risk.shtml
United Nations Development Programme (UNDP). (n.d.a). The human development concept. Retrieved February 28, 2010 from http://hdr.undp.org/en/humandev/
United Nations Development Programme (UNDP). (n.d.b). Millennium development goals (MDGs). Retrieved February 23, 2010 from http://www.undp.org/mdg

79
United Nations Human Settlements Programme (UN HABITAT). (2009). State of the world‟s cities: Case study Dhaka‟s extreme vulnerability to climate change. Nairobi: UN HABITAT.
United Nations Millennium Campaign (UNMC) & Asian Disaster Preparedness Center (ADPC). (2007). Disaster proofing the millennium development goals: minimise disasters, maximise development.
United Nations Office for the Coordination of Humanitarian Affairs (OCHA). (n.d.). About OCHA. Retrieved February 22, 2010 from http://ochaonline.un.org/tabid/5838/language/en-US/Default.aspx
United Nations Office for the Coordination of Humanitarian Affairs (OCHA). (n.d.a). United Nations Disaster Assessment and Coordination (UNDAC). Retrieved February 22, 2010 from http://ochaonline.un.org/OCHAHome/AboutUs/Coordination/UNDACSystem/tabid/5963/language/en-US/Default.aspx
United Nations Office for the Coordination of Humanitarian Affairs (OCHA). (n.d.b). Coordination of humanitarian response. Retrieved February 22, 2010 from http://ochaonline.un.org/OCHAHome/AboutUs/Coordination/ tabid/5872/language/en-US/Default.aspx
United Nations Office for the Coordination of Humanitarian Affairs (OCHA). (2004). OCHA situation report no. 4: Bangladesh floods 22 July 2004. Retrieved March 20, 2010 from ReliefWeb.
United Nations Office for the Coordination of Humanitarian Affairs (OCHA). (2004a). Flash appeal: Bangladesh 2004. Retrieved March 20, 2010 from http://ochadms.unog.ch/quickplace/cap/main.nsf/h_Index/Flash_2004_Bangladesh/$FILE/Flash_2004_Bangladesh_SCREEN.PDF?OpenElement
United Nations Office for the Coordination of Humanitarian Affairs (OCHA). (2005). Indian ocean earthquake: Tsunami 2005 flash appeal. Geneva: OCHA.
United Nations Office for the Coordination of Humanitarian Affairs (OCHA). 2005a). OCHA Situation Report Sri Lanka: Tsunami 22 - 24 February 2005. Retrieved February 22, 2010 from http://idh.cidi.org:8080/disaster/tsunami/ixl84.html
United Nations Population Fund (UNFPA). (2005). UNFPA response to Indian ocean tsunami: Update as one year. Retrieved March 18, 2010 from http://www.unfpa.org/emergencies/pacific/docs/unfpa-tsunami-yr-end-rpt.pdf
Unnayan Onneshan – The Innovators. (2008). Climate change, vulnerability and livelihood possibilities and prospect of the charlands of Bangladesh.

80
Von Oelreich, Eva. 2002. “Disasters need not destroy development”. IFRC News Stories, June 19, 2002. Retrieved February 17, 2010 from http://www.ifrc.org/docs/news/02/061901/
Walker, P. & Purdin, S. (2004). Birthing Sphere. Disasters, 28(2), 100-111. Retrieved Academic Search Premier
Watson, J., Gayer, M., & Connolly, M. (2007). Epidemics after natural disasters. Emerging Infectious Diseases, 13(1), 1-5. Retrieved from Global Health database.
Wickramasinghe, A. (2005). Tsunami: Building the nation through reciprocity while reconstructing the affected areas in Sri Lanka. Local Environment, 10(5), 543-549. Retrieved from http://search.ebscohost.com/login.aspx?direct=true&db=lhh&AN=20053182717&site=ehost-live;
Wisner B., Blaikie, P., Cannon, T. & Davis, I. (2004). At risk: Natural hazards, people’s vulnerability and disaster. New York: Routledge
World Bank. (2009). Bangladesh at a glance. Retrieved March 16, 2010 from http://devdata.worldbank.org/AAG/bgd_aag.pdf
World Bank. (n.d.). Disaster risk reduction and the World Bank. World Bank New Issue Brief. Retrieved on February 20, 2010 from http://go.worldbank/org/FYXIZS6860
World Bank. (n.d.a). Data & research.
World Food Programme (WFP). (2006). Real time evaluation of WFPs response to the Indian ocean tsunami. January 2006. Retrieved Feb 27, 2010 from http://www.wfp.org/operations/evaluation/
World Health Organization (WHO). (2005). A year after the tsunami of 26 December 2004. Geneva: WHO. Retrieved February 27, 2010 from http://www.who.int/hac/crises/international/asia_tsunami/one_year_story/en/index.html
World Health Organization (WHO). (2005b). Tsunami recovery process focuses on long-term health capacity development. Geneva: WHO. Retrieved February 27, 2010 from http://www.who.int/mediacentre/news/releases/2005/pr30_searo/en/index.html
World Health Organization Regional Office for South-East Asia (WHO SEARO). (2005). Tsunami response: External progress SEARO report – July 2005. Retrieved March 15, 2010 from http://www.searo.who.int/en/Section23/Section1108/Section1835/Section2022_10107.htm
81
Yash, P. (2004). Herd immunity and herd protection. Vaccine, 22(3/4), 301-302. doi:10.1016/j.vaccine.2003.07.016.
Young, H., Taylor, A., Way, S. & Leaning, J. (2004). Linking rights and standards: The process of developing „rights based‟ minimum standards on food security, nutrition and food aid. Disasters, 28(2), 142-159. Retrieved from Academic Search Premier database.