the liquidity risk premium - ph&nthe liquidity risk premium: a free lunch for institutional...
TRANSCRIPT

The Liquidity Risk Premium: A Free Lunch for Institutional Investors?
IIES 2017


The Liquidity Risk Premium: A Free Lunch for Institutional Investors?
IIES 2017
What is Liquidity? Thinking of Portfolio Liquidity as an Asset
Individual Security
Liquidity:
The ability to transact
in a security at a given
point in time,
without affecting price
Opportunity:
The additional compensation for holding an
investment comprised of less-liquid securities.
Portfolio Liquidity:
The ability to
sufficiently fund cash
requirements
Investors can benefit from the Liquidity Risk
Premium inherent in less liquid investments
1

The Liquidity Risk Premium: A Free Lunch for Institutional Investors?
IIES 2017
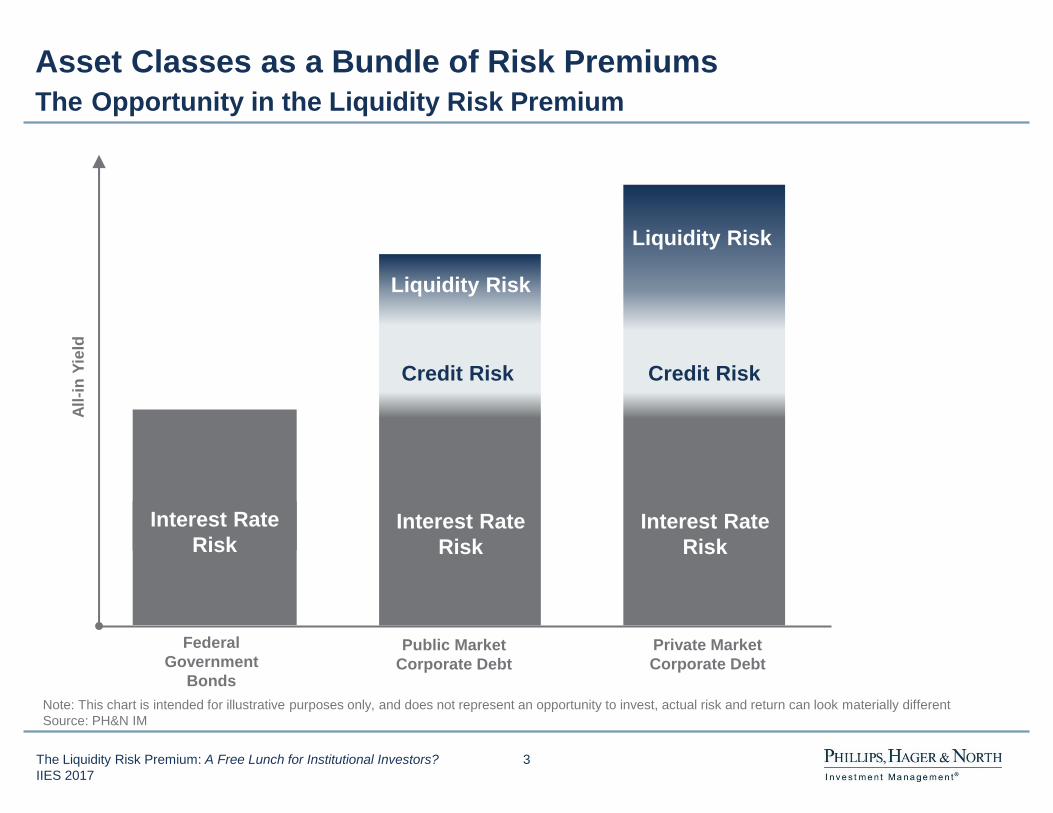
Asset classes are combinations of different risk
premiums, for example:
Economic growth risk
Interest rate risk
Inflation risk
Credit risk
Political risk
Liquidity risk
Risk Premium Investing
A risk premium is an expected excess return for bearing a risk
2
The Liquidity Risk Premium: A Free Lunch for Institutional Investors?
IIES 2017
Asset Classes as a Bundle of Risk Premiums
The Opportunity in the Liquidity Risk Premium
Interest Rate
Risk
Federal
Government
Bonds
Private Market
Corporate Debt
Interest Rate
Risk
Credit Risk
Liquidity Risk
All
-in
Yie
ld
Public Market
Corporate Debt
Interest Rate
Risk
Credit Risk
Liquidity Risk
Note: This chart is intended for illustrative purposes only, and does not represent an opportunity to invest, actual risk and return can look materially different
Source: PH&N IM
3
The Liquidity Risk Premium: A Free Lunch for Institutional Investors?
IIES 2017
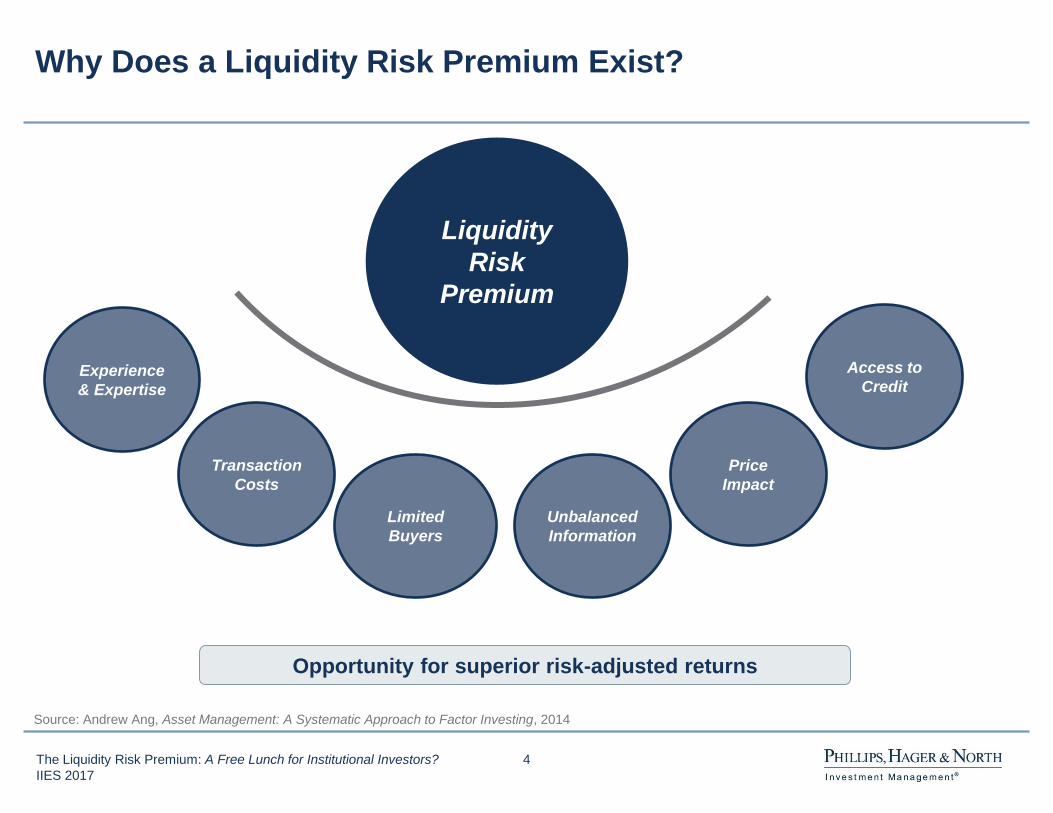
Why Does a Liquidity Risk Premium Exist?
Source: Andrew Ang, Asset Management: A Systematic Approach to Factor Investing, 2014
Liquidity
Risk
Premium
Unbalanced
Information
Opportunity for superior risk-adjusted returns
Price
Impact
Access to
Credit
Limited
Buyers
Transaction
Costs
Experience
& Expertise
4

The Liquidity Risk Premium: A Free Lunch for Institutional Investors?
IIES 2017
A skilled manager must:
How Can You Benefit from It? Skilled Manager Needed for Navigation
Identify and
price risks
appropriately
Mitigate risks Exit
profitably
Create access
to unique
opportunities
5

The Liquidity Risk Premium: A Free Lunch for Institutional Investors?
IIES 2017
The Benefits of Using a Fund Structural Liquidity of Vehicle and Underlying Securities
Patiently
deploy
capital
Fund
withdrawals
Create
internal
liquidity
Investment Vehicle Underlying securities
• Pooled fund structure
• Capital call/distribution
framework
• Allocation to cash &
equivalents
• Amortization
• Mixture of fixed and
floating rate securities
• Maturity profile
6

The Liquidity Risk Premium: A Free Lunch for Institutional Investors?
IIES 2017
Less-Liquid Fixed Income Investments Spectrum of Liquidity and Credit Risk
Note: This chart is intended for illustrative purposes only, and does not represent an opportunity to invest, actual risk and return can look materially different
Source: PH&N IM
Less
Liquid
Credit Risk
Federal
Agency
Provincial
Public IG
Fixed Income
High Yield
Private Placement
Corporate Debt
Conventional
Mortgages
Direct
Lending
Private Fixed Income
Public Fixed Income
More
Liquid
High Yield
Mortgages
7

The Liquidity Risk Premium: A Free Lunch for Institutional Investors?
IIES 2017
De
c-0
1
De
c-0
2
De
c-0
3
De
c-0
4
De
c-0
5
De
c-0
6
De
c-0
7
De
c-0
8
De
c-0
9
De
c-1
0
De
c-1
1
De
c-1
2
De
c-1
3
De
c-1
4
De
c-1
5
De
c-1
6
Yie
ld S
pre
ad
vs.
Sim
ilar
Te
rm C
an
ad
as (
%)
The Liquidity Risk Premium in Mortgages
Mortgage and Bond Yield Spreads
Versus Similar-Term Canadas
*Spread on mortgages in PH&N Mortgage Pension Trust
** FTSE TMX Canada Short Term Corporate Bond Index
Source: FTSE TMX Global Debt Capital Markets Inc.
Conventional Mortgage
Spread*
“A” Rated
Corporate Bond Spread**
Key Features:
Investment backed by physical asset
Additional yield spread vs.
comparable credit risk investments
Diverse opportunity set
Stable source of high quality income
Portfolio diversification benefits
50 – 100 bps
50 – 100 bps
8

The Liquidity Risk Premium: A Free Lunch for Institutional Investors?
IIES 2017
The Liquidity Risk Premium in Mortgages Range of Strategies
Universe Bond
Strategies
Conventional
Mortgage
Strategy
High Yield
Mortgage
Strategy
Interest Rate Risk Highest Medium Lowest
Credit Risk Medium Medium Highest
Yield Lowest Medium Highest
Liquidity Risk Lowest Medium Highest
9

The Liquidity Risk Premium: A Free Lunch for Institutional Investors?
IIES 2017
IG Public Market
50 - 60
+106
Private Placement Corporate Debt What is It?
Liquidity Risk Premium
IG Private Placements
Rated Unrated
Lower Higher
Utility
Company Bridge (P3)
Power
Generation
Private Placement Corporate Debt: A highly customized form of debt financing.
10
+180
+35-45
3
+3952
+150-200
1 Current trading levels, February 2017
2 Floating rate spread
Source: PH&N IM
Buyers
Spread (bps)1
LRP (bps)1
Index Eligibility
10

The Liquidity Risk Premium: A Free Lunch for Institutional Investors?
IIES 2017
Private Placement vs. Public Market Issue Comparable Credit Risk with Liquidity Premium
Key Features of Private Placements
Incremental yield spread
Stronger credit protection
Customized deal terms
Structural liquidity
Diverse opportunity set
Stronger protection against economic loss1
Fewer participants, access to unique opportunities
Source: BMO Capital Markets, PCBond, BondLab. For illustrative purposes only.
*Spread levels shown are indicative of where issuers could issue in the Canadian Market versus the 30-year Government of Canada benchmark bond as of September 1, 2016 1 Moody’s Infrastructure Default and Recovery Rates, 1983-2015, 2003-12 Cred Loss Experience Study: Private Placement Bonds, 2016 Society of Actuaries
Yie
ld S
pre
ad
vs
. C
an
ad
as
(%
)
Incremental
Spread
+68 bps
Yield Spread
Recent 30-Year
Utility Sector Unrated IG Private Placement*
Public Issue Private Issue
11

The Liquidity Risk Premium: A Free Lunch for Institutional Investors?
IIES 2017
What is Direct Lending? Lending Source as an Alternative to Banking System
Unique financing requirements,
limited sources of capital
Regulatory and balance sheet
constraints of traditional lenders
Supply side factors Demand side factors
Potential for attractive
risk-adjusted returns
Increasing demand for credit
Private debt recognized as a
genuine financing solution
Private companies with limited access to public markets
Event-driven situations in small- to medium-sized enterprises
Typically first or second in capital structure
The Opportunity
Direct Lending: A loan from a non-bank lender made directly to a company
12

The Liquidity Risk Premium: A Free Lunch for Institutional Investors?
IIES 2017
Structural Considerations
Capital call and distribution framework
Capital commitment and lock-up period
Investment period
Management fee + carried interest
Source: BlueBay internal estimates. For illustrative purposes only.
+200-275bps
Spread
(illiquidity)
Private Market Lending Capturing Illiquidity Premium Through Bespoke Private Loans
Just ML HY MT2 (yield
as liquid comparable) vs.
DL (make DL blurred of
~200-275bps)
Net
Ex
pec
ted
IR
R (
%)
Incremental
Spread
+100 – 300bps
High Yield Direct Lending
(Senior)
Investment Strategy
Target superior returns to equivalent public debt
securities, through liquidity and credit premiums
Senior secured loans and subordinated debt (short
term, floating rate)
Capital protection, contractual returns, current income
13


Bringing it All Together

The Liquidity Risk Premium: A Free Lunch for Institutional Investors?
IIES 2017
Improving the Risk-Reward Profile Adding Less-Liquid Fixed Income Investments
Modeled Expectations1
10-yr Annualized Return 2.6%
Annual Downside Risk2 -7.7%
Annual Volatility 4.0%
Sharpe Ratio 0.23
Modeled Expectations1
10-yr Annualized Return 3.4%
Annual Downside Risk2 -6.5%
Annual Volatility 3.6%
Sharpe Ratio 0.46
Baseline Enhanced
1 Refer to appendix for modelling assumptions and disclosures. Hypothetical performance analyses are for illustrative purposes only and there is no guarantee that hypothetical returns or
projections will be realized. 2 CVaR95 which represents the expected loss during the worst 5% of return outcomes.
Universe Bonds 70%
Mortgages 10%
Direct Lending
10%
Private Corporate
Debt 10%
Universe Bonds 70%
Corporate Bonds 30%
15

The Liquidity Risk Premium: A Free Lunch for Institutional Investors?
IIES 2017
Less-Liquid Investment Considerations
Policy Considerations
Trustee/Committee Education
Ability to Bear Illiquidity?
What is Your Objective?
Reporting and Performance Analysis
Modelling Challenges
Portfolio Management
Considerations
Governance
Manager Due Diligence Investment Strategy and Process
Risk Management and Infrastructure
Fund Structure and Fees
16

The Liquidity Risk Premium: A Free Lunch for Institutional Investors?
IIES 2017
The Liquidity Risk Premium A Free Lunch for Institutional Investors?
Conditions for success:
Long-horizon investor
Predictable liquidity needs
Stable pension fund governance
Appropriate investment expertise
Skilled investment managers
17

Appendix

The Liquidity Risk Premium: A Free Lunch for Institutional Investors?
IIES 2017
Assumptions and Disclosures Capital Market Assumptions
Assumptions represent the views of PH&N for the purposes of illustrating and understanding the potential risk-reward trade-off of different portfolio decisions. Investors should be aware of the
limitations using forward-looking assumptions in that there is absolutely no guarantee that future performance will occur according to any ex-ante expectation.
Asset Classes Representative Data Series
Expected
10-yr
Annualized
Return
Expected
Annual
Volatility
Expected
Annual
Downside
Risk
Universe Bonds FTSE TMX Canada Universe Bond Index 2.4% 4.2% -7.7%
Long Term Government Bonds FTSE TMX Canada Long Term Government Bond Index 2.7% 7.6% -14.1%
Long Term Corporate Bonds FTSE TMX Canada Long Term Corporate Bond Index 3.9% 7.4% -17.1%
20+ Strip Bonds FTSE TMX Canada 20+ Strip Bond Index 3.4% 14.8% -28.9%
Corporate Bonds FTSE TMX Canada All Corporate Bond Index 3.1% 3.8% -7.8%
Mortgages PH&N Mortgage Pension Trust 3.6% 2.4% -1.3%
Long Mortgages PH&N Long Mortgage Pension Trust 3.5% 6.9% -10.5%
Private Corporate Debt Constructed from FTSE TMX Canada corporate indices 3.7% 4.1% -8.6%
Direct Lending Credit Suisse Leveraged Loan Index (USD) 9.0% 8.6% -17.8%
Canadian Equities S&P/TSX Composite Index 6.8% 17.1% -29.9%
Global Equities MSCI World Index (CAD) 7.3% 14.9% -28.0%
Liability
Illustrative cash flows discounted using a proxy of the CIA's
prescribed methodology for commuted value (Government of
Canada spot curve + 90 bps) and annuity purchase liabilities
(provincial spot curve) resulting in an overall solvency
duration of 14.5 years
2.9% 7.9% -13.9%
19

The Liquidity Risk Premium: A Free Lunch for Institutional Investors?
IIES 2017
Assumptions and Disclosures Capital Market Assumptions
Assumptions represent the views of PH&N for the purposes of illustrating and understanding the potential risk-reward trade-off of different portfolio decisions. Investors should be aware of the
limitations using forward-looking assumptions in that there is absolutely no guarantee that future performance will occur according to any ex-ante expectation.
Correlation
Lon
g T
erm
Go
ve
rnm
ent B
ond
s
Lon
g T
erm
Co
rpo
rate
Bo
nd
s
20+
Str
ip B
ond
s
Co
rpo
rate
Bo
nd
s
Un
ive
rse
Bo
nd
s
Mo
rtg
ag
es
Lon
g M
ort
ga
ge
s
Dire
ct L
en
din
g
Canadia
n E
quitie
s
Glo
ba
l E
qu
itie
s
So
lve
ncy A
nnu
ity P
urc
ha
se
Lia
bili
ty
So
lve
ncy C
om
mu
ted
Va
lue L
iabili
ty
Priva
te C
orp
ora
te D
ebt
Long Term Government Bonds 1
Long Term Corporate Bonds 0.8 1
20+ Strip Bonds 1.0 0.8 1
Corporate Bonds 0.8 0.9 0.8 1
Universe Bonds 1.0 0.8 0.9 0.9 1
Mortgages 0.8 0.6 0.7 0.7 0.9 1
Long Mortgages 0.8 0.7 0.8 0.7 0.8 0.8 1
Direct Lending -0.1 0.3 0.0 0.3 -0.1 -0.2 -0.3 1
Canadian Equities 0.0 0.2 0.0 0.1 -0.1 -0.2 -0.1 0.4 1
Global Equities 0.1 0.2 0.1 0.1 0.0 0.0 0.0 0.3 0.6 1
Solvency Annuity Purchase Liability 1.0 0.8 1.0 0.8 1.0 0.8 0.8 0.0 0.0 0.1 1
Solvency Commuted Value Liability 1.0 0.7 0.9 0.7 0.9 0.8 0.9 -0.2 -0.2 0.0 0.9 1
Private Corporate Debt 0.8 0.8 0.8 0.9 0.9 0.8 0.7 0.1 -0.2 -0.1 0.9 0.8 1
20


The Liquidity Risk Premium: A Free Lunch for Institutional Investors?
IIES 2017
Disclaimer
This presentation is intended for institutional investors only.
This document has been provided by Phillips, Hager & North Investment Management (PH&N IM) for information purposes only and may not be reproduced, distributed or published without the
written consent of PH&N IM. It is not intended to provide professional advice and should not be relied upon in that regard.
PH&N IM takes reasonable steps to provide up-to-date, accurate and reliable information, and believes the information to be so when printed. Information obtained from third parties is believed to be
reliable, but no representation or warranty, express or implied, is made by PH&N IM, its affiliates or any other person as to its accuracy, completeness or correctness. We assume no responsibility for
any errors or omissions. The views and opinions expressed herein are those of PH&N IM as of the publication date and are subject to change without notice. This information is not intended to be
an offer or solicitation to buy or sell securities or to participate in or subscribe for any service. No securities are being offered, except pursuant and subject to the respective offering documents and
subscription materials, which shall be provided to qualified investors. This document is for general information only and is not, nor does it purport to be, a complete description of an investment in any
RBC, PH&N or BlueBay funds. If there is an inconsistency between this document and the respective offering documents, the provisions of the respective offering documents shall prevail.
These materials contain statements that are not purely historical in nature, but are “forward-looking statements.” These include, among other things, projections, hypothetical performance analyses,
hypothetical analyses of income, yield or return, future performance targets, sample or pro forma portfolio structures or portfolio composition, scenario analyses, specific investment strategies and
proposed or pro forma levels of diversification or sector investment. These forward-looking statements are based upon certain assumptions and involve significant elements of subjective judgment
and analysis. No representation is made that any returns indicated will be achieved or that all assumptions have been considered or stated. Actual events are difficult to predict and are beyond our
control. Hence, actual events may differ materially from those assumed. All forward-looking statements included are based on information available on the date hereof and we do not assume any duty
to update any forward-looking statement. Some important factors which could cause actual results to differ materially from those in any forward-looking statements include, without limitation, changes
in general economic, market, legal and financial conditions. Accordingly, there can be no assurance that hypothetical returns or projections can be realized, that forward-looking statements will
materialize or that actual returns or results will not be materially different than those presented.
Commissions, trailing commissions, management fees and expenses all may be associated with the funds mentioned in this presentation. Please read the offering materials for a particular fund
before investing. The performance data provided are historical returns, they are not intended to reflect future values of any of the funds or returns on investment in these funds mentioned in this
presentation. Further, the performance data provided assumes reinvestment of distributions only and does not take into account sales, redemption, distribution or optional charges or income taxes
payable by any unitholder that would have reduced returns. The unit values of non-money market funds change frequently. For money market funds, there can be no assurances that the fund will be
able to maintain its net asset value per unit at a constant amount or that the full amount of your investment in the fund will be returned to you. Mutual fund securities are not guaranteed by the
Canada Deposit Insurance Corporation or by any other government deposit insurer. Past performance may not be repeated.
The amount of risk associated with any particular investment depends largely on the investor’s own circumstances. Investors should consult their professional advisors/consultants regarding the
suitability of the investment solutions mentioned in this presentation.
This document may contain forward-looking statements about general economic factors which are not guarantees of future performance. Forward-looking statements involve inherent risk and
uncertainties, so it is possible that predictions, forecasts, projections and other forward-looking statements will not be achieved. We caution you not to place undue reliance on these statements as a
number of important factors could cause actual events or results to differ materially from those expressed or implied in any forward-looking statement. All opinions in forward-looking statements are
subject to change without notice and are provided in good faith but without legal responsibility.
PH&N IM is a division of RBC Global Asset Management Inc. (RBC GAM Inc.). RBC GAM Inc. is the manager and principal portfolio adviser of the Phillips, Hager & North (PH&N) investment funds.
RBC GAM Inc. is registered with the various securities commissions of Canada as a portfolio manager, which permits it to provide discretionary investment management services to its clients, and as
an exempt market dealer which permits it to act as a dealer for prospectus exempt trades in certain circumstances. RBC GAM Inc. is also registered as an Investment Fund Manager in Ontario,
British Columbia, Quebec and Newfoundland and Labrador and as a Commodity Trading Manager in Ontario.
Each of RBC GAM Inc. and BlueBay Asset Management LLP (BlueBay) is a wholly-owned subsidiary of Royal Bank of Canada, and an affiliated company and may be considered as related issuers
and/or connected issuers under applicable securities legislation.
®/™ Trademark(s) of Royal Bank of Canada. Used under licence. IC1702123
© RBC Global Asset Management Inc., 2017.
NOTE: [*Updated January 6, 2017]
This disclosure is for institutional presentations
about PH&N investment funds that include
performance data. Please adjust the disclosure
accordingly if not including performance, or if
the topics covered in the presentation include,
for example, BlueBay capabilities, Alternative
asset capabilities, QUANT Funds
“performance”. Approval for institutional
marketing materials and information about
compliance with legal, regulatory, corporate or
brand standards may be sought from
21


V A N C O U V E R Waterfront Centre, 20th Floor
200 Burrard Street
Vancouver, British Columbia
V6C 3N5 Canada
T 604-408-6000
T O R O N T O 22nd Floor
155 Wellington St. West
Toronto, Ontario
M5V 3K7 Canada
T 416-974-2710
M O N T R É A L 6th Floor, North Wing
1 Place Ville Marie
Montréal, Québec
H3B 1Z5 Canada
T 514-876-1256