the logic of hereditary rule: theory and evidencereynal/hereditary_besleyreynalquerol_2015.pdf ·...
TRANSCRIPT

The Logic of Hereditary Rule:Theory and Evidence�
Timothy BesleyLSE and CIFAR
Marta Reynal-QuerolUniversitat Pompeu Fabra-ICREA
February 12, 2015
Abstract
Hereditary leadership has been an important feature of the politi-cal landscape throughout history. This paper argues that it can playa role in improving economic performance when it improves intertem-poral incentives. We use a sample leaders between 1848 and 2004 toshow that economic growth is higher in polities with hereditary leadersbut only when executive constraints are weak. This �nding is mir-rored in policy outcomes which a¤ect growth. There is also evidencethat dynasties end when the economic performance of leaders is poorsuggesting that hereditary rule is tolerated only where there are policybene�ts. Finally, we focus on the case of monarchy where we �nd,using the gender of �rst-born children as instrument for monarchicsuccession, that monarchs increase growth.
�We are grateful to Florencia Abiuso for excellent research assistance. We thank Ger-ard Padro-i-Miquel and Maria Lopez-Uribe for comments on a earlier draft. A number ofseminar audiences have provide useful feedback on this work and Fred Finan provide someuseful discussion early in the project. Besley is grateful for funding from Martin Newson,the ESRC and CIFAR. Reynal-Querol is grateful for funding from the European ResearchCouncil under the European Community�s Seventh Framework Programme (FP7/2007-2013)/ERC grant agreement n. 203576 and acknowledges the �nancial support of thegrant SEJ2007-64340 from the Spanish Ministerio de Educación. Reynal-Querol also ac-knowledges the support of the Barcelona GSE Research Network and the Government ofCatalonia.
1
�There are many ways to wish a king well; but the king�s sub-jects, .. have more reason to be sincere when they say "long livethe king." If the king anticipates and values dynastic succession,that further lengthens the planning horizon and is good for hissubjects.�(Mancur Olson, 1993 page 571).�To the evil of monarchy we have added that of hereditary
succession; and as the �rst is a degradation and lessening of our-selves, so the second, claimed as a matter of right, is an insultand imposition on posterity.�(Thomas Paine, 1776)
1 Introduction
Over the sweep of human history, some form of autocratic rule has been thenormal state of a¤airs. Only in the past two hundred years have alternativescemented themselves in which leaders are subject to formal contests for powerand subject to executive constraints imposed by independent courts and leg-islatures. Hereditary rule in the form of monarchy or dynastic dictatorshipare an important example of autocratic rule. The utility of hereditary rulehas been much debated. Olson (1993) who, as the quote above shows, ar-gued that the possibility of hereditary rule could create an incentive for goodgovernance. But others, most notably Paine (1776), argued strongly againstit as form of government.This paper looks at hereditary rule in theory and tests the speci�c predic-
tions of a simple model which argue that its impact should be heterogeneousdepending on whether there are executive constraints in place. And we �ndthat growth is stronger in countries with hereditary leaders only if executiveconstraints are weak. With strong executive constraints, there is no advan-tage from having an hereditary leader which we argue is due to the fact thatexecutive constraints serve as an alternative means of controlling leaders.For the case of monarchy speci�cally, we are able to address the potentialconcern about the endogeneity of hereditary selection by showing that ourmain result holds when we use whether a monarch or their predecessor had a�rst-born son as an instrument for whether a monarchic succession occurs.The argument that we develop to motivate a role for hereditary rule
exploits the insights from classic political agency models such as of Barro(1973).1 The core general idea is that the development of �reputations�can
1See Besley (2006) for a review of the political agency literature.
2

be used to control moral hazard problems in politics. There is now a largeliterature on relational contracts in industrial organization which developsthese arguments for principal agent problems that arise within �rms (see, forexample, Malcomson, 2013). Myerson (2008, 2010) has developed theoreticalarguments related to those in this paper. He notes that political leadership isheld in trust and that controlling moral hazard is central to good leadershipbeing maintained. He also emphasizes the role of a selectorate in enforcingimplicit �contracts�forged between citizens and leaders by controlling accessto power.More generally, the paper is related to an emerging literature on political
dynasties. Blood ties between politicians of di¤erent generations are commonin both autocratic and democratic systems. In the data introduced below,we �nd that 6.4% of all leaders since the mid nineteenth century have beenfrom a hereditary dynasty; this percentage falls to 3.1% in democracies.2 DalBo, Dal Bo and Snyder (2009) document historic and geographic patternsin the evolution and pro�le of political dynasties in the U.S. since 1789.Using a regression discontinuity design, they argue that dynastic politicalpower is self-perpetuating with a positive exogenous shock to a person�spolitical power having persistent e¤ects on holding political power. Querubin(2010) looks at political dynasties in the Philippines using a similar approachand �nds an even stronger e¤ect of a political advantage through a familyconnection on holding power. Querubin (2011) �nds that there is no e¤ectof introducing a term limit on the persistence of family power.Interest in hereditary rule is part of a wider interest in the role of elites in
acquiring and maintaining political power in di¤erent settings. Perhaps themost famous statement on this topic is the celebrated work by Mosca (1939)and Pareto (1901). Tullock (1987) argued that hereditary transitions ofpower were part of a wider strategy for sustaining elite control in autocraciessince it provides a means of insulating the elite from potentially destabilizingpower struggles. Brownlee (2007) studies transitions of power in a sample of258 post war autocratic leaders who rule for at least three years. He arguesthat hereditary succession tends to be accepted by ruling elites when thereare no formal party structures to regulate transitions of power.This paper is also related to the large literature on dynastic control in
2This increases to 9% and 11% respectively if we use a broader de�nition of dynasticleader.
3

�rms and whether �rms su¤er from being controlled by family members �see,for example, Benedsen et al (2007), Bloom and VanReenen (2007), Burkhartet al (2003) for discussion of aspects of this. In general, these studies havefound that family-owned businesses are run more poorly than other �rms.However, we are not aware of studies that have studied whether there is het-erogeneity in the performance of family run �rms depending on governancearrangements in place, for example by outside investors.The remainder of the paper is organized as follows. In the next section,
we introduce the data and explore some background facts about hereditaryrule in the raw data. In particular, we constrast the personal characteristics ofhereditary and non-hereditary rules. Section three discusses the theoreticalframework which motivates a speci�c test and underpins the interpretationof the empirical �ndings. Section three presents some evidence on howhereditary leaders a¤ect policy and growth. It also discusses whether lowgrowth increases the chances that hereditary leadership comes to an end.This section also present results where the probability that a dynastic lineof monarchs continues depends on whether a monarch�s �rst-born child is ason. Section four concludes.
2 Background Facts
To identify the leader in each country and year, we use the Archigos dataset which covers the period between 1875 and 2004.3 We classify a leaderas hereditary if they had either a parent or grandparent who had been headof the state. We identify such leaders from information that we collectedon which of the leader�s relatives, speci�cally their parents, grandparentsuncle, brother, cousin, spouse, or brother-in-law has held a broadly de�ned
3Archigos has two datasets: one which gives information on leader, year and country,and one which gives information only on leader and country. In the latter data thereare 95 leader-country observations that do not appear in the former. In our analysis, weinclude these 95 observations which are for the following countries: Barbados, Bahamas,Belize, Brunei, Cape Verde, Iceland, Luxemburg, Maldives, Malta, Montenegro, SolomonIslands, Suriname, Tiber, Transvaal, Zanzibar. We extend the data back to 1848 for afew countries. Many countries have more than one �head of state�. The Archigos dataidenti�es the actual e¤ective ruler based on a judgement about the particularities of eachcountry. Two rules are generally followed: (i) in Parliamentary regimes, the prime ministeris coded as the ruler while in Presidential systems, it is the president; (ii) in communiststates the Chairman of the Party is coded as the e¤ective ruler.
4

political position. To capture this, we included both high o¢ ce such asa Prime Minister, President or King along with lesser positions such as aMember of Parliament or a Mayor. In a small number of cases that arerelevant, we also maser their relationship to Clan Chiefs, Religious Leadersor Samurai.This information comes mainly from the Encyclopedia of Heads of States
and Governments, Oxford Political Biography: Who is Who in the TwentiethCentury World Politics, Encyclopedia Britannica, other online sources, andbiographies contained in Lexis-Nexis. Using these sources, we have a coresample of leaders in 197 countries between 1848 and 2004 out of a potentialsample of 227 countries. Picking one leader per year this gives us a total of2097 leaders, and a total of 2484 leader-spells in o¢ ce.4
We �nd that 6.4% of the leaders in our sample are classi�ed as hereditaryaccording to our core de�nition. We begin by looking at the prevalence ofhereditary leaders and how it has changed over time. Hereditary leadershiphas been in decline in countries that were already independent before 1900;around 8.3% of leaders between 1848 and 1900 are classi�ed as being hered-itary compared to 4.2% for the period between 1950 and 2004.5 Amongnewer countries, i.e. those which appear in the data later than 1900, around7.7% have hereditary leaders. There is no signi�cant correlation betweenthe year in which a leader comes to power and whether he is classi�ed asbeing hereditary.6
The strength of executive constraints plays a key role in the theoreticalframework and our core measure of this comes from the Polity IV data base.
4In cases where more than one leader is in o¢ ce in a given year, we focus on the leaderwho has been in o¢ ce for the longest time period during the year.
5This broadly similar to the �ndings for the U.S Congress where Dal Bo et al (2009)�nd that the 8.7% of new entrants have a previous political connection using data between1789 and 1996. They also �nd that this proportion has not fallen much over time.
6It is interesting to relate whether a politician is dynastic to opportunities to replaceleaders as captured by three PolityIV variables: (i) the extent of institutionalization �orregulation �of executive transfers (XRREG), (ii) the competitiveness of executive selection(XRCOMP), and (iii) the openness of executive recruitment (XROPEN). This summaryvariable takes values between 1 and 8, with 8 being the most open and competitive methodof selection. This variable is strongly correlated with our measure of whether a politicianbelongs to a political dynasty. Around 3% of leaders are from dynasties in the politicalsystems where the value of this dummy variable is 8 compared to 10% for the samplewhere the value of this variable is less than 8.
5
We use the variable xconst which captures how leaders are bound by institu-tional constraints on a scale between 1 and 7. Limits on the chief executivemay, for example, be imposed by any �accountability group� in the polity.In many democracies these constraints are imposed by the legislative and ju-dicial branches of government. Other kinds of accountability groups are theruling party in a one-party system, a council of nobles or powerful advisors inmonarchies, and the military in coup-prone polities. We work with a dummyvariable which equals one if a country in a particular year has xconst equalto 7, i.e. the highest possible score. We refer hereafter to a country wherethis dummy variable is equal to one as having strong executive constraints.Table 1 uses data from Besley and Reynal-Querol (2011) to look at some
observable characteristics of hereditary and non-hereditary leaders; we alsodisaggregate this according to whether executive constraints are strong orweak. Hereditary leaders are less educated, being less likely to have a col-lege degree and graduate quali�cation. This is mainly driven by those whotake o¢ ce in countries when executive constraints are weak. In strongexecutive constraints countries, hereditary leaders are more likely to havestudied abroad. Hereditary leaders come to o¢ ce on average when theyare younger (42 years old versus 53) and they also tend to serve for longerin o¢ ce, 11.5 years in o¢ ce compared to 5 for nonhereditary leaders. Thisdi¤erence is greatest for those who take o¢ ce when executive constraints areweak. Hereditary leaders are more likely to have served in the military, areless likely to have been elected and, unsurprisingly, are much more likely tobelong to royal families, i.e. be from monarchies. In terms of careers, heredi-tary leaders are less likely to have had careers as lawyers, professors/scientistsand are also less likely to have business background.In our sample of leaders, 46% of leader spells fall under strong executive
constraints. This actually increases rather modestly over our sample pe-riod; from around 40% in the nineteenth century to a little over 50% forthe last twenty-�ve years of the sample. However, this re�ects the fact thatmany countries that enter our data in later years tend not to have strongconstraints. Indeed, the proportion of countries in our sample with strongexecutive constraints actually falls after World War II in comparison to theinter-war period.Figure 1 further illustrates the time-series pattern of hereditary. The red
line is drawn for all leaders and shows a general downward trend. However,it should be borne in mind that there is a change in the sample of countriesin this �gure as more independent countries enter the data set over time.
6
The green and blue lines show the trend over time for countries that haveweak and strong executive constraints respectively. At the very beginningof the sample, there are actually more hereditary leaders in countries withstrong executive constraints. However, this pattern is reversed by the end ofthe nineteenth century and throughout the twentieth century there are fewerhereditary leaders in countries with strong executive constraints.Finally, we look at some raw facts about growth. Table 2 compares the
average growth performance in countries depending on whether the coun-try has an hereditary leader and whether it has strong or weak executiveconstraints. This suggests a clear pattern with growth being lowest whenthere is neither an hereditary leader nor strong executive constraints. Inthis case, the average growth rate is 0.89%. This contrasts with a growthrate of around 2% in all of the other cases. An F-test (F=4.42, p-value 0.03)reveals that we can reject the null hypothesis that the mean growth ratesare equal for the sample of hereditary and nonhereditary leaders in countrieswith weak executive constraints. However, we cannot reject that the averagegrowth rates are the same when we compare countries with strong execu-tive constraints by whether the leader is hereditary or not (F-test (F=0.86,p-value 0.35)).
3 Theory
In this section, we develop a model where hereditary rule emerges as a polit-ical equilibrium in the spirit of Olson (1993) and induces better performancefrom leaders who care that their o¤spring will follow them in o¢ ce. However,this is valuable to voters only when executive constraints are weak if suchconstraints have a direct impact on the quality of policy. This is becausewe assume that strong executive constraints independently solve the moralhazard problem in government.7
Policy Making and Institutions Time is in�nite and in each perioda policy maker is required to make a binary policy choice et 2 f0; 1g whichdetermines a payo¤to the citizens of �t 2 f0;�g. For concrete purposes thinkof this as making decisions which increase everyone�s incomes via enforcementof property rights or improving infrastructure. Each period there is a state
7See Besley and Mueller (2015) for a model along these lines.
7

of the world st 2 f0; 1g and �t = � if and only et = st. We assume that bothstates are equally likely and that generating a bene�t of � to the citizenscosts a leader c. Since generating � is costly, there is a potential moralhazard problem.There is a countably in�nite pool of families denoted by f = 1; :::: from
whom leaders can be drawn. Each leader lives for one period and has asingle o¤-spring. We suppose that there is bene�t B to an incumbent ofhaving his o¤spring hold power. This is like a classic �warm-glow�bequestmotive. We assume that B > c, i.e. a leader would be willing to generate� for the citizens if his o¤spring is allowed to succeed him.Each leader, `, has a level of innate �popularity� a` 2 f�A;Ag . Any
leader is popular with probability �. Let �A (�) = [2�� 1]A be a randomlyselected leader�s expected popularity.We consider two institutional possibilities. With strong executive con-
straints, we will suppose that et = st always so that citizens always get�t = �.8 Such constraints therefore entirely eliminate moral hazard. Thisis, of course, an extreme case but having this happen probabilistically wouldyield broadly similar results. With weak executive constraints, the incum-bent has full discretion over the action et. Hence, et = st only when it is theleader�s private interest to do so.
Retention and Selection The retention of leaders lies in the hands of asub-group of citizens (the selectorate). The term selectorate, coined by deMesquita et al (2003) could represent a variety of institutional settings. Indemocracies retention decisions rest voters although party elites and insiderscan also play an important role in who stands. In non-democracies theselectorate could comprise senior army o¢ cers in military dictatorships orin�uential aristocrats in monarchies. They could also be members of aparty hierarchy as in a communist system like in China. Members of theselectorate decide whether to select the policy maker from the ruling familyor to install a new ruling family. An hereditary dynasty is created whenthe selectorate selects the o¤spring of the incumbent to take power. Wesuppose that the selectorate have discount factor � and that they observethe popularity of the leader�s o¤spring before deciding whether to appoint
8While this is an extreme case, it serves to make the logic clear �all that matter isthat � can arise with a positive probability under strong executive constraints regardlessof the behavior of the leadership.
8

her as leader.
Timing The timing of the model with each period t is as follows:
1. There is an incumbent leader in o¢ ce for t� 1.
2. Nature determines the popularity of the leader�s o¤spring a 2 f�A;Ag.
3. The selectorate chooses between the leader�s o¤spring and picking anew ruling family from the pool.
4. Nature chooses st:
5. The incumbent leader chooses et 2 f0; 1g
6. Payo¤s are realized.
We will look for a stationary sub-game perfect equilibrium of the modelwhere the selectorate and incumbents optimize in their policy and retentiondecisions.
3.1 Equilibrium
We begin by showing what happens with strong executive constraints. Thenwe look at weak executive constraints and focus on two possibilities. In the�rst of these, only popular incumbents are retained and incumbents neverproduce good policy. In the second, a hereditary dynasty emerges where theleader�s o¤spring is retained whether or not she is popular provided that herpredecessor has generated � while in o¢ ce.
Strong Executive Constraints If there are strong executive constraintsthen et = st always by assumption. If the selectorate observes that theo¤spring of the incumbent is popular then she will be appointed as leadersince A > �A (�). Thus, consistent with the data, hereditary rule is possibleeven with strong executive constraints. However, this will happen purely onthe basis of popularity rather than performance in o¢ ce.
9

Weak Executive Constraints We begin with the following benchmarkresult where hereditary succession plays no role.
Proposition 1 There is an equilibrium where only popular incumbents areretained and et 6= st for all t.
There is no performance related retention in this and it is not worthwhilefor the incumbent leader to put in good performance which is costly. Aswith strong executive constraints, the frequency of incumbent turnover isdriven purely by � the probability that an incumbent�s o¤spring is popular.Thus, as under strong constraints, it is still possible to have some hereditaryleaders in this case, but only based on popularity not in exchange for goodperformance.We now consider an hereditary equilibrium in which the o¤spring of all
incumbents are retained regardless of their popularity as long as their pre-decessor has produced a good policy outcome. We now give conditions forthis possibility to emerge.
Proposition 2 Suppose that � � 2� [1� ��]A and (1� �)B > c; thenthere is an equilibrium in which the o¤spring of all incumbents are retainedand e = s.
This equilibrium requires that the bequest motive be strong enough andthat � is large enough to make it worthwhile for the selectorate to ignoreany gains from looking for a popular leader. Note that the condition forhereditary rule to be an equilibrium depends on �. It is hardest to satisfywhen � is close to one since it is highly likely that the unpopular o¤spring ofa leader will be replaced by a popular leader is she is no allowed to succeedher parent. Moreover, the leader knows that his o¤spring will be allowed tosucceed him regardless of his policy action.This equilibrium can be thought of as a relational contract between the
dynasty in power and the selectorate along the lines envisaged in the open-ing quote from Olson (1993). The hereditary dynasty delivers good policyoutcomes in exchange for insurance against unpopular members not beingallowed to take o¢ ce. This is supported by the belief that if the hereditarysystem were to break down (speci�cally if an unpopular incumbent were re-moved) then there would be non-hereditary equilibrium where all incumbentsperform poorly and only popular o¤spring of incumbents are retained.
10
Although we have applied this idea to an hereditary system, this couldalso be a model of a long-lived party system like the communist party inChina where economic growth is �exchanged� for continuity in power re-gardless of whether leaders are intrinsically popular. This is a focal point ofthe system which creates political stability and good economic performance.Such systems only make sense in a weak executive constraints setting likeChina where there are no direct means of enforcing good policy.
Predictions Proposition 2 gives conditions for there to be an equilibriumwith good policy without strong executive constraints. Thus citizens getgood policy (et = st) in two cases: (i) if there are strong executive constraintsand (ii) if there is an hereditary equilibrium under weak executive constraints.There will bad policy outcomes (with et 6= st) for citizens when then is nohereditary equilibrium with weak executive constraints.Since there can be multiple equilibria, the model does not fully explain
how some polities can coordinate on hereditary equilibria. For the core em-pirical results, we suppose that this coordination is uncorrelated with factorswhich shape economic performance. The model also does not explain whyall polities do not choose to have strong executive constraints, particularlythose which cannot organized hereditary equilibria. This could be explainedby adding additional features to the model where bad policies generate rentsfor some agents who therefore have a vested interest in that.
Comments on the Model The model that we have presented is deliber-ately simple in order to focus on the nature of the exchange between the se-lectorate and the leaders. It could be complicated in a variety of ways whichwould make it more realistic while retaining the essence of the argument thatwe have developed for why hereditary rule can improve performance. Forexample, the assumption that strong executive constraints always improvesperformance is not needed, only that it does so on average. We could alsointroduce an element of selection into the model whereby some leaders aremore or less competent with growth providing a signal of competence. Ifcompetence is transmitted intergenerationally, this would provide an addi-tional argument for hereditary selection.The model has focused on hereditary rather than dynastic selection in
general. However, similar theoretical forces could also explain how fami-lies/clans could developed reputations which would be relevant in periodic
11

contests for power. This would depend on the selectorate using the historyof all past members of a dynasty and factoring this into their decisions andcould explain period re-emergence of members of dynasties.9
Growth Implications We will apply the ideas above to aggregate mea-sures of economic performance when speci�c leaders are in power. We willsuppose that the realization�t a¤ects productivity so that aggregate output,Yt, is given by the production function:
Yt = e�t�K1��t L�
�where productivity depends on policy: �t = [1 + �t] �t�1 and there is a �xedsupply of labor, L. We will suppose that aggregate capital Kt = sYt�1 wheres is the savings propensity. This implies that growth is given by:
gt = log
�YtL
�� log
�Yt�1L
�= [1 + �t] �t�1 � � log
�Yt�1L
�:
This forges a link between policy making as it is a¤ected by institutions andbehavior, and economic growth.This very simple model, combined with the discussion of political equi-
libria give us the following prediction about growth:
Core Growth Prediction Growth will be higher in an hereditary equilib-rium only if executive constraints are weak.
We will test this idea by looking at economic growth during the spell ofleader ` in country c who takes o¢ ce in year t. Speci�cally, let gc`t be theaverage growth rate during the leader spell. We then run regressions of theform:
g`ct = �c + �t + �y`ct + �1�`ct + �2�`ct + �3 (�`ct � �`ct) + "`ct (1)
where �c are country dummies, �t are dummies for the years in which leaderstake o¢ ce, y`ct is the level of income per capita in the year that leader `�sspell in o¢ ce begins, �`ct is a dummy variable which is equal to one if leader
9We �nd empirically that dynastic leaders seem to emerge following natural disasterssuggesting that there are times when there citizens crave familiarity among their leader-ship.
12
` is an hereditary leader �`ct is a dummy variable which is equal to one ifa country has strong executive constraints when the leader comes to power.We cluster the standard errors at the country level.10
According to the core prediction of the theory, we should expect �1 >0; �2 > 0 and �3 < 0 with a core implication of the theory being that�1 + �3 = 0, i.e. having a dynastic leader generates better performance onlywhen executive constraints are weak.This empirical exercise will take variation in institutions as exogenous
conditional on year and country �xed e¤ects. Below, we will �nd that �2 inequation (1) is not signi�cant in each of our speci�cations once we includecountry �xed e¤ects suggesting that �xed country characteristics may bedoing a decent job in conditioning out the relevant unobserved heterogene-ity associated with institutional di¤erences. Moreover, by including country�xed e¤ects, we are far more cautious than the majority of the previous liter-ature studies on institutions where the main source of identi�cation is purelycross-sectional. That said, what we have here are only correlations that wecan compare to the predictions of the theory. Below, we will explore thepossibility of getting a source of exogenous variation from the gender compo-sition of the o¤spring of �rst-born children to explain successful hereditarytransitions in monarchies. We will show that whether the �rst born is maleis correlated with a successful hereditary transition.
4 Evidence
We begin by presenting the core results on growth. We then assess theirrobustness as well as looking at supporting evidence from policy outcomes.The next step is to look at whether growth a¤ects the probability that coun-tries stick with hereditary leaders. Finally, we look at whether the resultshold up when we use the gender composition of the �rst-born child as aninstrument for hereditary succession in monarchies.
Core Results The core results are report in Table 3.In column (1) we analyze the relationship between growth and having an
hereditary leader in o¢ ce using a basic speci�cation which excludes lagged
10This speci�cation is fairly standard for a growth regression in panel data. The longtime series (an average of 11 observations, i.e., leaders per country) means that the stan-dard dynamic bias from including lagged income should not be an issue.
13

income as well as year and country dummies. This shows a positive correla-tion between the growth rate and having an hereditary leader in o¢ ce, butonly if there are weak institutional constraints. The F-test reported in theseventh row of the table tests the hypothesis that there is no e¤ect on growthfrom having an hereditary leader when executive constraints are strong, i.e.�1 + �3 = 0 in (1). It shows that we cannot reject the hypothesis that thereis no positive correlation with growth when an hereditary leader takes o¢ cewith strong executive constraints. The size of the coe¢ cient suggests that,in a country with weak executive constraints, going from a non-hereditaryleader to an hereditary leader, increases the annual average economic growthof the country by 1.03 percentage points per year. This is consistent withwhat we saw in the raw data presented in Table 2.In column (2) we allow for convergence by including the log of per capita
income in the year before the leader spell starts. The positive correlationbetween growth and having an hereditary leader in o¢ ce remains. Theimplied long-run e¤ect is similar in magnitude to the coe¢ cient in column (1).Our core �nding is also found in column (3) where we include year dummyvariables to capture global macro-economic shocks and trends. Column (4)adds country dummies which allow us to control for time-invariant countrycharacteristics. The size of the coe¢ cient on being an hereditary leader isnow larger and strongly signi�cant. It is interesting to observe that thecoe¢ cient on having strong executive constraints is not signi�cant once weinclude country dummies. This suggests that �xed country characteristicsaccount for much of the variation that determines institutional di¤erences.In column (5) and (6), we look at separate sub-samples according to the
strength of executive constraints. This allows separate year and countrydummies to be estimated for each subgroup. The �nding is in line with the�ndings of the previous columns with the only signi�cant correlation beingfor hereditary leaders.In column (7), we respond modestly to the concern that the process de-
termining institutional change in our data could be playing a direct role inthe results. We have 87 institutional transitions between strong and weakexecutive constraints in our data. In column (7), we drop all leaders whopresided over an institutional change during their tenure along with all thosefor whom there was an institutional change in their �rst two years or lasttwo years in power. We want to be sure that this group of 148 leaders arenot driving the results since such �reformist�leaders may be di¤erent fromothers in terms of their growth performance. The results in column (7),
14

which use the same speci�cation as column (4) con�rm that this is not thecase.Overall the results indicate that, when there are weak constraints in the
executive, hereditary leaders tend to out perform non-hereditary leaders inline with the theory which sees this as part of an implicit relational contract.
Robustness In Table 4, we assess the robustness of these results to a va-riety of alternative speci�cations and ways of looking at the data. We �rstassess whether results in Table 3 are sensitive to the exact measure of hered-itary leadership that we use, considering broader and narrower alternatives.Column (1) focuses only on leaders whose father was head of the state,
the most narrow de�nition of hereditary leadership. The core results holdup in this case. Column (2) uses a less restrictive de�nition of hereditaryleadership, also classifying as hereditary those leaders whose uncle, brother,cousin, spouse, or brother-in-law had been head of the state. The coe¢ cientis somewhat smaller but still positive and signi�cant for the case of weakexecutive constraints. Column (3) widens the core de�nition of hereditaryleadership in a di¤erent way by classifying leaders as hereditary if their par-ents or grandparents had held any political position not just being head ofstate. Again the core results hold up.In column (4) of Table 4, we include the age and tenure (in years) of lead-
ers as additional controls. This deals with a possible concern that hereditaryleaders are di¤erent in other ways which is driving their performance. More-over, we have already seen from Table 2 that hereditary leaders tend to staylonger in o¢ ce and tend to be younger when they take up their position.There is a positive and signi�cant correlation between the tenure of a leaderand average economic growth during the leader�s spell in o¢ ce. There is nosigni�cant correlation with the age at which the leader is selected. The coreresults reported in Table 3 remain the same with hereditary leaders beingassociated with higher growth but only with weak executive constraints.Institutions such as executive constraints could be correlated with other
variables which a¤ect economic performance. One powerful and importanthypothesis concerns the role of human capital in making democracy sustain-able. Indeed, it is sometimes argued that correlations between institutionsand performance are suspect when human capital levels are controlled for(Glaeser et al, 2007). Thus it is interesting to explore this in our case.Due to the di¢ culty of obtaining reliable education data at the country
15
level for longer periods of time and a wide range of countries, we now focuson period after 1960. Column (5) in Table 4 establishes that the core resultsare robust when we focus on the period 1960 onwards although the correla-tion between growth and having an hereditary leader is somewhat smaller.Column (6) includes the average years of education in the population overage 25 from the Barro and Lee (2001) data set as regressor. The coe¢ cienton education is not signi�cant (principally due to the inclusion of country�xed e¤ects). But the core �nding of the paper is the same with growth be-ing higher when an hereditary leader holds o¢ ce when executive constraintsare weak.
Policy Since we are positing that leaders a¤ect growth, we would expectleadership to matter via a¤ecting the policies that are implemented during aleader�s spell in power. In Table 5, we explore directly by focusing on somepolicies that could plausibly be thought to a¤ect growth.One possibility is that productivity enhancing investment decisions de-
pend on the enforcement of contracts and support for markets. If these areimportant for growth as argued, for example, by Hall and Jones (1999), weshould expect a similar pattern of results when we use this as a dependentvariable. To investigate this, we look at the composite index of governmentanti-diversion policies (GADP) as created from the International CountryRisk Guide Date (ICRG) by Hall and Jones (1999) and Knack and Keefer(1995) who use �ve averages of these variables. We use an equally-weightedaverage of �ve variables: law and order, bureaucratic quality, corruption, riskof expropriation, and government repudiation of contracts which is availablebetween 1982 and 1997. We normalize the variable to lie between zeroand one with higher values representing more e¤ective policies to supportmarkets.The speci�cation that we estimate is:
GADP`ct = �c + �t + �1�`ct + �2�`ct + �3 (�`ct � �`ct) + "`ct (2)
for leader ` in country c beginning at date t, where: �c are country dummiesand �t are year dummies. To capture the leader�s performance, we measureGADP`ct in the last year of the leader�s time in o¢ ce.11 As above, we clusterthe standard errors by country.
11We chose this criterion so that we do not lose leaders whose spell in o¢ ce ends after1995.
16
The results are reported in Columns (1) and (2) in Table 5. In column (1)we include year and country dummies and in column (2), country dummiesare replaced by region dummies. As with the core results, there is a posi-tive correlation between GADP`ct and an hereditary leader being in powerwith weak executive constraints but there is no signi�cant correlation whenexecutive constraints are strong. Hence the pattern found for governmentanti-diversion policies parallels that found in data on growth.12
Our second policy measure also re�ects something which arguably hasa signi�cant impact on growth, namely infrastructure quality. The mostreadily available data on this are from the Business Environment Risk Intel-ligence (BERI) data which are available between 1972 and 1990. Knack andKeefer (1995) shows that a high correlation between an index of these BERImeasures and higher investment and growth rates. This infrastructure qual-ity variable that we use speci�cally tries to capture the quality of availablefacilities a¤ecting communication and transportation within a country. Wealso normalize this measure to lie between zero and one.The speci�cation that we estimate is:
IQ`ct = �c + �t + �1�`ct + �2�`ct + �3 (�`ct � �`ct) + "`ct (3)
for the spell in o¢ ce of leader ` in country c beginning at date t, where:�c are country dummies and �t are year dummies. We measure IQ`ct, theBERI infrastructure quality variable, during the last year of the leader�s spellin o¢ ce.13 We continue to cluster the standard errors by country.The results are reported in columns (3) and (4) of Table 5. In column (3)
we show that with country and time dummy variables, there is a positive andsigni�cant correlation between having an hereditary leader in o¢ ce and in-frastructure quality, but only when executive constraints are weak. As withgrowth, we cannot reject the hypothesis that there is no correlation between
12We also attempted to update this variable to 2008. However, some of the variables inthe original ICRG are no longer reported. However, we can construct something whichis fairly close; speci�cally we take the average of corruption, law and order, quality ofbureaucracy and investment pro�le, normalized to lie between zero and one. Expropriationrisk and repudiation of contracts have been replaced in the later data by a new investmentpro�le variable. If we repeat the speci�cations of columns (1) through (2) of Table 7, theresults with country dummies are weak, but with regional dummy variables, the resultsare similar to those in columns (1) and (2).13We chose this criterion so as not to lose from the sample those leaders whose spell in
o¢ ce ends after 1990.
17
IQ`ct when executive constraints are strong. The �ndings are broadly similarin column (4) of Table 5 where we only exploit within-region variation.
Does the survival of hereditary leaders depend on growth? We nowtest one aspect of the mechanism emphasized by the theory, that hereditarysuccession is dependent on good economic performance.14 For this purpose,we de�ne a regime in year t, rt, to be hereditary (rt = 1) if an hereditaryleader is in power in t and non-hereditary, (rt = 0) if a non-hereditary leaderis in power. We then estimate the probability of an exit from an hereditaryregime into a non-heriditary regime.Speci�cally, we model this as follows:
Prob (rt = 0 : rt�1 = 1) = �(�c + �t + �1�gct + �2zct) if rt�1 = 1 (4)
where � (:) is a standard normal distribution function, (�c; �t) are countryand year dummies �gct is the average growth rate over the previous �ve yearsand zct are other determinants of hereditary leadership which we outlinebelow. If growth a¤ects the probability of a succession, the coe¢ cient ongrowth, �1, will be negative. It makes sense to study this using annual datasince, unlike the theoretical model, there is no �xed date at which a leader�sterm comes to an end. In e¤ect, this approach is modeling the hazardfunction associated with being in an hereditary regime and the probabilityof exiting that regime.Table 6 presents the results. Column (1) �nds a negative association
between the survival of the hereditary regime and growth performance. Themagnitude of the e¤ect suggests that a 1 percentage point change in growthover the past �ve years leads to a 2.6 percentage point fall in the proba-bility that any hereditary leader comes to an end in any year. Since theunconditional probability of this happening is around 4.7%, this says thatthe probability of the hereditary regime coming to an end in any given year
14Our model does not predict when this might come to an end even if a country is inthe hereditary equilibrium of Proposition 2. However, it would be di¢ cult to modify thetheory to have this possibility. One device would be to invoke some kind of �tremblinghand�in equilibrium play with some leaders failing to deliver to choose good policies evenwhen it is in their interest to do so. Another possibility would to invoke competenceshocks which impair the ability of some hereditary leader�s to deliver. In such cases,there will be low growth according to our model and hereditary leaders will not succeedin passing on the o¢ ce to their o¤spring.
18
increases by 50% when growth falls by 1 percentage point. Column (2)con�rms that this �nding is driven by countries that have weak executiveconstraints �we cannot reject that there is no relationship between the endof a hereditary regime and poor performance for countries with strong con-straints. The size of the e¤ect is marginally larger with a 2% increase ingrowth associated with a 4.4% reduction in the probability of a hereditaryregimen ending.These results give credence to the idea that there could be a performance
related component to the survival of hereditary regimes where executive con-straints are weak in line with what the theory postulates.
Hereditary Succession in Monarchies Our model of hereditary lead-ership has multiple equilibria. Hence whether an hereditary leader emergeswith weak executive constraints is an equilibrium selection issue. In thisworld social conventions can play a coordinating role and in some monarchiesa common convention is primogeniture where the oldest son is the presump-tive heir. If this system is in operation, then monarchs who have a �rst bornson may be more likely to be selected as the next leader. Moreover, if theheir already has a son himself at the time that they become king, then itfurther increases the likelihood of continuity through time.To look at this empirically, we collected data on the gender composition
of as many of our leaders as possible from a range of sources: Encyclopedia ofHeads of States and Governments, Oxford Political Biography: Who is Whoin the Twentieth Century World Politics, Encyclopedia Britannica, as wellas other online sources, and biographies contained in Lexis-Nexis. This givesus information on only a sub-set of our leaders. The data is particularlycomplete for monarchies since having children tends to be important forsuccession. We de�ne an hereditary leader to be a monarch in our dataif, according to their biography, he/she is a member of a recognized royalfamily in the country. For example, members of the Alaouite dynasty whichstarted in 1631 in Morocco are monarchs as are members of the Rana dynastyin Nepal. Since almost all monarchies have weak executive constraints, wefocus exclusively on this case in this section.15 This yields a sample of 492leader spells from 114 countries where 22 have monarchies.Having a son per se is not, however, a source of exogenous variation
since a system that favored boys might lead a monarch choosing to have
15Monarchs with strong executive constraints are extremely rare in out data.
19

more children in the hope of having a boy, in order to enhance the chanceof an hereditary succession. However, whether a monarch has a boy or agirl as their �rst born should be random. We use this data to isolate acausal e¤ect of monarchy on country economic performance which parallelsthe approach taken in the literature on the succession of CEOs in family�rms. For example, Bennedsen et al (2007) exploits the gender compositionof the �rst born child as an instrument for family succession in a �rm.16 Inmany ways, monarchies and family �rms are quite similar in having to dealwith succession planning.The proportion of leaders in our sample who have a �rst-born son is
52.4%. However, consistent with the idea that this in�uences selection, 64.0%of monarchs have a �rst-born son. On average 50.8% of leaders have a prede-cessor with a �rst-born son while this proportion among monarchs is 59.6%.Thus monarchs with �rst-born sons and/or predecessors who have �rst-bornsons are over-represented in monarchies compared to non-monarchies. Thissuggests that male lineage succession is more important in monarchies thanother systems of leadership.17
We now explore whether our results on growth hold up once we instrumentfor succession using a variable based on whether monarchs have �rst bornsons. Our core variable is a dummy which is equal to one if a monarchand his predecessor had a �rst-born son. The reason that we include thepredecessor is that a monarch often comes to power after he has had a childwhich could also in�uence selection since the future male line of succession isthen enhanced. The question is then whether having monarch is correlatedwith better growth and whether this holds up to instrumenting this with ourcore �rst-born son variable.The results are reported in Table 7. As in the core speci�cation, we
include country and time dummies as well as a control for the level of GDPper capita. Column (1) Table 7 con�rms that in this sub-sample we do havea positive e¤ect of being a monarch on growth although the size of the e¤ectis somewhat smaller than in the core results.Column (2) gives the ��rst-stage� regression where we show that there
16We are grateful to Fred Finan for drawing our attention to this.17We will focus on leaders who take o¢ ce after the age of 25 when it is more likely
that they will have started a family, making whether they have a �rst born-son mostrelevant for succession. We have also looked at whether morachies with a �rst-born girlend up having more children. However, we do not �nd that the number of children thata monarch has depends sigini�acntly on the gender of the �rst-born child.
20

is a positive relationship between having a �rst-born son and hereditarysuccession of a monarch. Column (3) now gives a "reduced form" where theoutcome is growth. The result shows that growth is positively correlated withthe �rst-born son dummy as we would expect if this in�uencing the likelihoodof succession. Finally, column (4) presents an IV speci�cation where the�rst-born son variable is used as instrument for succession in monarchies.Here, we �nd a positive e¤ect of monarchy on growth which is signi�cant ata 10% level.18
Finally, column (5) broadens the sample to include all leaders for whichwe have data on �rst-born sons. We now include countries with both weakand strong executive constraints and interact our �rst-born son dummy withstrong executive constraints. If this is in�uencing the chances of successionthen our theory says that there should be a positive correlation with growthbut only where executive constraints are weak. This is exactly what we �ndin column (5) of Table 7.
5 Concluding Comments
This paper has looked at the role of hereditary rule in improving economicperformance when other controls �executive constrains �on incumbents areabsent. The logic that we have exploited is essential that conjectured inOlson (1993) that hereditary rule is a way of creating better inter-temporalincentives. To test this idea, we collected information which allows us toclassify rulers as hereditary. In line with the theory, hereditary rule increasesgrowth but only when executive constraints are weak.The analysis contributes to our understanding of the heterogeneity of
arrangements which can sustain economic policy. Establishing hereditarysuccession is generally part of the informal institutional arrangements relyingon norms and conventions as much as formal constitutional rules. It isimportant to drill down into such details when looking at the workings ofpolitical systems and how they relate to economic performance.Although we have tried to understand the logic of hereditary rule, we
do not regard the �ndings of the paper as supporting the institutions of
18One way of assessing the exclusion restriction implicit in this IV formulation is tosee whether the gender of the �rst-born is correlated with economic growth and gdp percapita for those with �rst born sons and �rst born daughters. When we do this, we �ndno signi�cant di¤erences across the two samples.
21

hereditary rule. There are many arguments against, going back at least toPaine (1776), about the inherent injustice in such systems. Moreover, thefact that many polities around the world have put an end to hereditary ruleand establish strong executive constraints is no accident since this is arguablya much more robust way to control leaders than relying on the chance thatsuccession incentives will safe-guard the public interest.
22

References
[1] Acemoglu, Daron and James Robinson [2006], Economic Origins of Dic-tatorship and Democracy, Cambridge, MA: Cambridge University Press.
[2] Acemoglu, Daron, and James Robinson, [2012], Why Nations Fail: TheOrigins of Power, Prosperity and Poverty, Pro�le Books.
[3] Barro, Robert J., [1973], �The Control of Politicians: An EconomicModel,�Public Choice, vol 14, 19-42.
[4] Barro, Robert J., [1996], �Democracy and growth,�Journal of EconomicGrowth, 1(1), 1�27.
[5] Barro, Robert and Jong-Wha Lee, [2001], �International Data on Edu-cational Attainment: Updates and Implications,�Oxford Economic Pa-pers, 53(3), 541-563, and www.barrolee.com
[6] Bennedsen, M., Nielsen, K., Perez-Gonzales, F., and Wolfenzon, D.[2007] �Inside the Family Firm: The Role of Families in SuccessionDecisions and Performance�, Quarterly Journal of Economics, 122(2),647-691.
[7] Besley, Timothy, [2005], �Political Selection�, Journal of Economic Per-spectives, 19(3), 43-60.
[8] Besley, Timothy, [2006], Principled Agents? The Political Economy ofGood Government, The Lindahl Lectures, Oxford: Oxford UniversityPress.
[9] Besley, Timothy and Hannes Mueller, [2015], Institutions, Volatility andInvestment, CEPR Discussion Paper No. 10373.
[10] Besley, Timothy and Marta Reynal-Querol, [2011], �Do DemocraciesSelect More Educated Leaders?� American Political Science Review,105(3), 552-566
23
[11] Besley, Timothy, Torsten Persson and Marta Reynal-Querol, [2013],�Political Instability and Institutional Reform: Theory and Evidence,�unpublished typescript.
[12] Besley, Timothy and Torsten Persson [2011], �The Logic of PoliticalViolence,�Quarterly Journal of Economics, 126(3), 1411-1446.
[13] Burkart, Mike, Fausto Panunzi, and Andrei Shleifer, [2003], �FamilyFirms�, Journal of Finance, 58(5), 2167-2201.
[14] Bloom, Nicholas, and John Van Reenen, [2007], �Measuring and Ex-plaining Management Practices Across Firms and Countries,�QuarterlyJournal of Economics, 122(4),1341�1408.
[15] Brownlee, Jason, [2007], �Heriditary Succession in Modern Autocra-cies,�World Politics, 59, 595-628.
[16] Dal Bo, Ernesto, Pedro Dal Bo and Jason Snyder, [2009], �PoliticalDynasties,�Review of Economic Studies, 76(1), 115-142.
[17] Ferraz, Claudio and Fred Finan, [2008], �Exposing Corrupt Politicians:The E¤ect of Brazil�s Publicly Released Audits on Electoral Outcomes,�Quarterly Journal of Economics, 123(2), 703-745.
[18] Ferraz, Claudio and Fred Finan, [2011], �Electoral Accountability andCorruption in Local Governments: Evidence from Audit Reports,�American Economic Review, 101(4), 1274-1311.
[19] Glaeser, Edward, Giacomo Ponzetto and Andrei Shleifer, [2007],�Why does democracy need education?,�Journal of Economic Growth,Springer, 12(2), 77-99.
[20] Hall, Robert and Chad Jones [1999], "Why Do Some Countries Produceso Much More Output per Worker than Others?�, Quarterly Journal ofEconomics, vol 114, 83-116.
[21] Klein, Benjamin and Keith B. Le er, [1981], �The Role of Market Forcesin Assuring Contractual Performance,� Journal of Political Economy,89(4), 615-41.
24
[22] Knack, Stephen and Philip Keefer [1995], "Institutions and economicperformance: cross-country tests using alternative institutional mea-sures" Economics and Politics 7, 207�227.
[23] Ma, Debin, [2012], �Political Institutions and Long-run Economic Tra-jectory: Some Lessons from Two Millennia of Chinese Civilization,�Chapter 4 in Institutions and Comparative Development, edited byMasahiko Aoki. Timur Kuran and Gerard Roland, IEA Conference Vol-ume No. 150-1, London: Palgrave Macmillan.
[24] Malcomson, James, [2013], �Relational Incentive Contracts,� chapter25 in The Handbook of Organizational Economics, edited by RobertGibbons and John Roberts, Oxford and Princeton: Princeton UniversityPress.
[25] Mosca, Gaetano, [1939], The Ruling Class, NY, McGraw Hill.
[26] Myerson, Roger, [2008], �The Autocrat�s Credibility Problem and Foun-dations of the Constitutional State,�American Political Science Review,102 (2008), 125-139.
[27] Myerson, Roger, [2010], �Moral Hazard in Hugh Of-�ce and the Dynamics of Aristocracy,� available athttp://home.uchicago.edu/~rmyerson/research/power.pdf
[28] Olson, Mancur [1993], �Dictatorship, Democracy, and Development�,American Political Science Review, 87(3), 567-576.
[29] Paine, Thomas, [1776], Common Sense, London: Penguin Books, 1986.
[30] Papaioannou, Elias, and Gregorios Siourounis. [2008], �Democratizationand Growth,�Economic Journal, 118, 1520-1551.
[31] Pareto, Vilfredo [1901], The Rise and Fall of Elites: Application of The-oretical Sociology, Piscataway NJ, Transaction Publishers.
[32] Persson, Torsten and Guido Tabellini [2009a], �The growth e¤ects ofdemocracy: Is it heterogenous and how can it be estimated?�, in El-hanan Helpman (ed) Institutions and Economic Performance, Cam-bridge: Harvard University Press.
25

[33] Persson, Torsten and Guido Tabellini [2009b], "Democratic Capital:The Nexus of Economic and Political Change", American EconomicJournal Macroeconomics, vol 1, 88-126.
[34] Przeworski, Adam, and Fernando Limongi, [1993], �Political Regimesand Economic Growth,�Journal of Economic Perspectives, 7 (3), 51-69.
[35] Querubin, Pablo, [2010], �Family and Politics: Dynastic Persistence inthe Philippines,�unpublished typescript, NYU
[36] Querubin, Pablo, [2011], �Political Reform and Elite Persistence: TermLimits and Political Dynasties in the Philippines,� unpublished type-script, NYU
[37] Tullock, Gordon, [1987], Autocracy, Boston MA: Kluwer.
26
Appendix
Proof of Proposition 1:. Consider the �rst case and suppose that e (s) 6=s, and all unpopular leaders are removed from o¢ ce after one period: Thevalue to the selectorate along the equilibrium path is �A+(1��)
�A(�)+�1�� . Let
W (x) = x+ �
��A+ (1� �) �A (�) + �
1� �
�:
Retaining popular incumbent yields W (A) : Deviating by removing such anincumbent makes the selectorate worse o¤ since W (A) > W
��A (�)
�. Now
consider whether there could be a worthwhile deviation by retaining an un-popular incumbent rather than picking a new incumbent at random. Thiswill not be the case either since W (�A) < W
��A (�)
�. Hence there is no
worthwhile one-shot deviation for the selectorate. Since the probability thatan incumbent is retained is independent of �, it is optimal for all incumbentsto set e 6= s for all c > 0.Proof of Proposition 2:. We �rst show that it is optimal for the se-lectorate in such cases to retain the o¤spring of leaders in this case if theyproduce � when the out of equilibrium beliefs are that if the leader choosee 6= s, then there is an in�nite reversion to playing the benchmark equilib-rium where e 6= s for all leaders and only popular leaders are retained. Inthe benchmark equilibrium, the payo¤ along the equilibrium is
�A+ (1� �) �A (�)1� � .
In the proposed hereditary equilibrium, the payo¤ is:�A (�) + �
1� � :
Suppose now that the incumbent leader has an unpopular o¤spring thenretaining that individual is optimal if
�A+�+ �� �A (�) + �
1� �
�� �A (�) + �
��A+ (1� �) �A (�)
1� �
�which reduces to the condition above. Clearly, if this condition holds, itwill hold a fortiori if the incumbent�s o¤spring is popular. This equilibriumexists as long as (1� �)B � c . This is because if the incumbent deviatesto e 6= s, then his incumbent will be retained in o¢ ce with probability �.However, if he chooses e = s, then his o¤spring will hold o¢ ce for sure.
27

0
0.05
0.1
0.15
0.2
0.25
0.3Prop
ortio
n of Hered
itary Llead
ers
Figure 1. Proportion of Hereditary Leaders
All Leaders
Weak Executive Constraints
Strong Executive Constraints

Table 1: Leader Characteristics
Hereditary leader
Non- hereditary leader
Hereditary leader with
weak executive constraints
Non- hereditary leader with
weak executive constraints
Hereditary leader with
strong executive constraints
Non- Hereditary leader with
strong executive constraints
Education (graduate) 0.20 0.28 0.17 0.23 0.30 0.38
Education (college) 0.47 0.73 0.45 0.67 0.65 0.83
Studied abroad 0.32 0.25 0.27 0.26 0.43 0.20
Age in first year holding office 42 53 42.3 51.52 44.88 55.??
Length of Tenure 11.5 4.8 11.7 5.7 7.21 3.35
Served in Military 0.016 0.22 0.024 0.34 0 0.06
Elected/selected under democracy 0.35 0.58 0.19 0.31 1 0.99
Monarch 0.61 0.02 0.66 0.03 0.36 0
Career as Lawyer 0.04 0.26 0.012 0.21 0.12 0.32
Career as Professor and/or scientist
0.008 0.12 0 0.11 0 0.12
Career in Business 0.016 0.05 0.024 0.04 0 0.08
Notes: A leader is dynastic leader if a leader’s father, gradfather or mother held an elected position. Education (graduate) is a dummy that is equal to one if the leader has a graduate degree; Education (college) is a dummy that is equal to one if the leader has a college degree; Studied abroad is a dummy equal to 1 if the leader studied abroad; Served in Military is a dummy equal to 1 if the leader was a military professional before holding office; Monarch is a dummy equal to 1 if the leader is a monarch. Career as Lawyer is a dummy equal to 1 if the leader was a lawyer before holding office. Career as a Professor and/or Scientist is a dummy that is equal to 1 if the leader was a Professor or Scientist before holding office. Career in business is a dummy that is equal to 1 if the leader was in business before holding office.
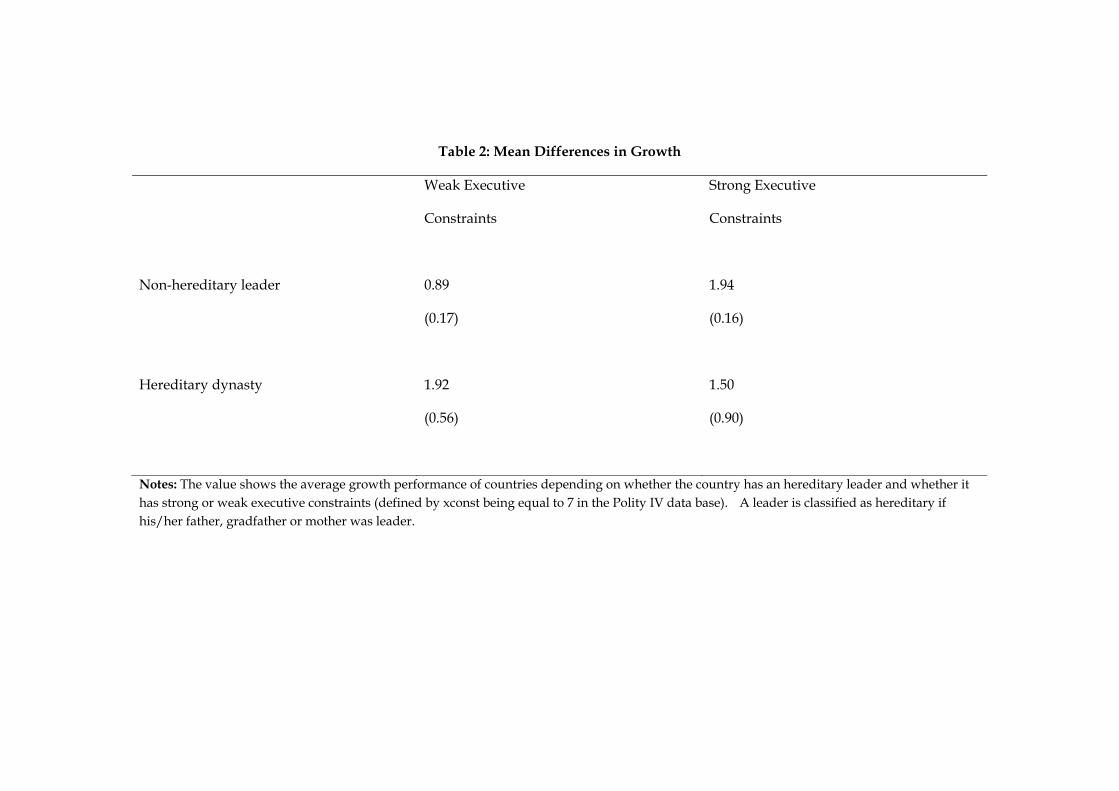
Table 2: Mean Differences in Growth
Weak Executive
Constraints
Strong Executive
Constraints
Non-hereditary leader 0.89
(0.17)
1.94
(0.16)
Hereditary dynasty 1.92
(0.56)
1.50
(0.90)
Notes: The value shows the average growth performance of countries depending on whether the country has an hereditary leader and whether it has strong or weak executive constraints (defined by xconst being equal to 7 in the Polity IV data base). A leader is classified as hereditary if his/her father, gradfather or mother was leader.

Table 3: Core Results
Weak Executive
Constraints
Strong Executive
Constraints
VARIABLES (1) (2) (3) (4) (5) (6) (7) Hereditary Leader 1.025** 0.853** 0.966** 1.758*** 1.985** -0.304 1.985*** (0.432) (0.413) (0.488) (0.569) (0.760) (0.566) (0.637) Log(GDP) lagged -0.142 -0.133 -2.881*** -2.950*** -4.459*** -3.528*** (0.135) (0.158) (0.604) (1.081) (1.071) (0.615) Strong Executive Constraints
1.053*** 1.247*** 1.529*** 0.651 0.606
(0.264) (0.315) (0.322) (0.470) (0.535) Interaction -1.471** -1.285** -1.582** -2.057** -2.237** (0.592) (0.600) (0.655) (0.926) (1.120) Year FE
Yes Yes Yes Yes Yes
Country FE Yes Yes Yes Yes Observations 1,681 1,637 1,637 1,637 774 863 1,471 R-squared 0.012 0.014 0.220 0.351 0.448 0.435 0.377 F-test 0.965 0.801 1.464 0.147 0.0752 Prob>F 0.328 0.372 0.228 0.702 0.784 Notes: The outcome measure is the average growth rate during a leader’s spell in office. All specifications include country and year fixed-effects. Robust standard errors (clustered at the country level) in parentheses (*** p<0.01, ** p<0.05, * p<0.1)
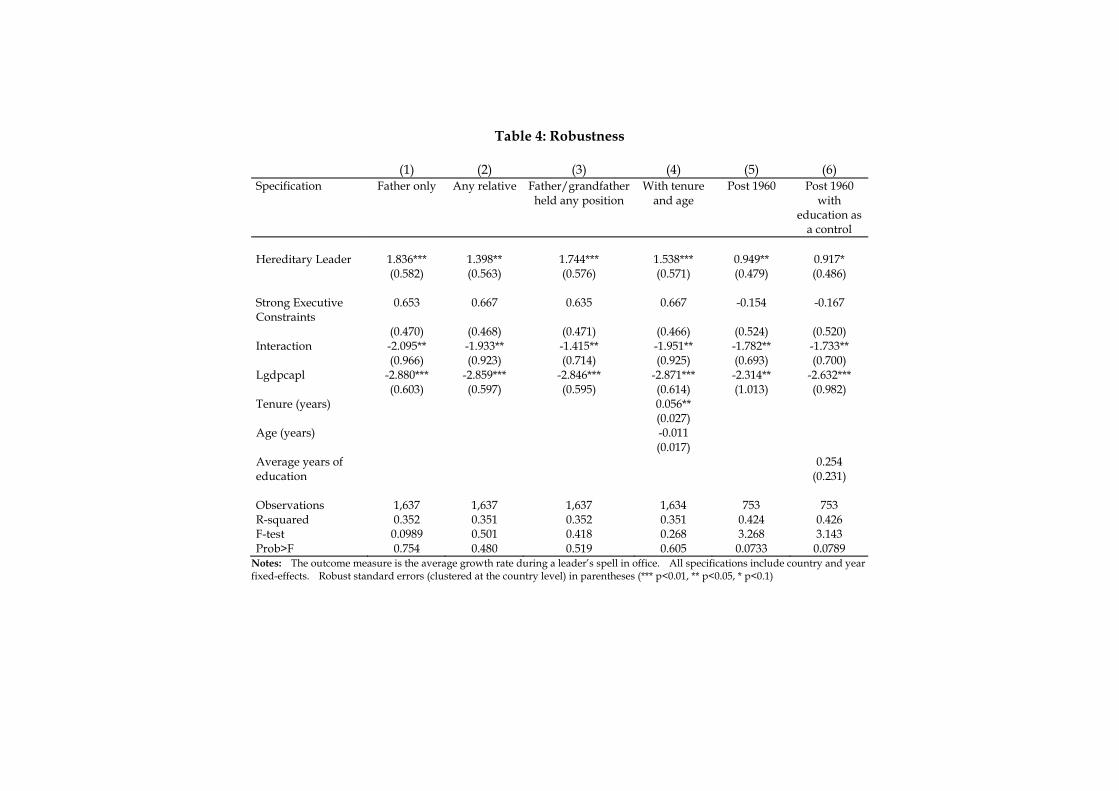
Table 4: Robustness
(1) (2) (3) (4) (5) (6) Specification Father only Any relative Father/grandfather
held any position With tenure
and age Post 1960 Post 1960
with education as
a control
Hereditary Leader 1.836*** (0.582)
1.398** (0.563)
1.744*** (0.576)
1.538*** (0.571)
0.949** (0.479)
0.917* (0.486)
Strong Executive Constraints
0.653 0.667 0.635 0.667 -0.154 -0.167
(0.470) (0.468) (0.471) (0.466) (0.524) (0.520) Interaction -2.095** -1.933** -1.415** -1.951** -1.782** -1.733** (0.966) (0.923) (0.714) (0.925) (0.693) (0.700) Lgdpcapl -2.880*** -2.859*** -2.846*** -2.871*** -2.314** -2.632*** (0.603) (0.597) (0.595) (0.614) (1.013) (0.982) Tenure (years) 0.056** (0.027) Age (years) -0.011 (0.017) Average years of education
0.254 (0.231)
Observations 1,637 1,637 1,637 1,634 753 753 R-squared 0.352 0.351 0.352 0.351 0.424 0.426 F-test 0.0989 0.501 0.418 0.268 3.268 3.143 Prob>F 0.754 0.480 0.519 0.605 0.0733 0.0789
Notes: The outcome measure is the average growth rate during a leader’s spell in office. All specifications include country and year fixed-effects. Robust standard errors (clustered at the country level) in parentheses (*** p<0.01, ** p<0.05, * p<0.1)

Table 5 Government Anti-Diversion Policy and Infrastructure Quality
VARIABLES (1) (2) (3) (4) Hereditary Leader 0.131** 0.107*** 0.047** 0.086* (0.062) (0.039) (0.021) (0.044) Strong Executive Constraints 0.048* 0.162*** -0.007 0.206*** (0.027) (0.031) (0.019) (0.039) Interaction -0.186** -0.212*** -0.033 -0.164** (0.086) (0.074) (0.035) (0.072) Country dummies Yes Yes Región dummies
Yes
Yes
Observations 355 355 274 274 R-squared 0.934 0.596 0.954 0.552 F-test 1.058 2.889 0.286 2.173 Prob>F 0.306 0.0919 0.595 0.146 Notes: All specifications include year fixed-effects. Robust standard errors (clustered at the country level) in parentheses (*** p<0.01, ** p<0.05, * p<0.1).

Table 6: The end of dynasties
End of Dynasty End of Dynasty VARIABLES (1) (2) Average growth rate in last 5 years -20.599***
(5.925) -20.575***
(7.906) Strong executive constraints -0.035 (0.589) Interaction 12.808 (9.076) Chi square 1.69 P value (0.1936) Observations 470 409 Notes: Robust standard errors in parentheses (*** p<0.01, ** p<0.05, * p<0.1)
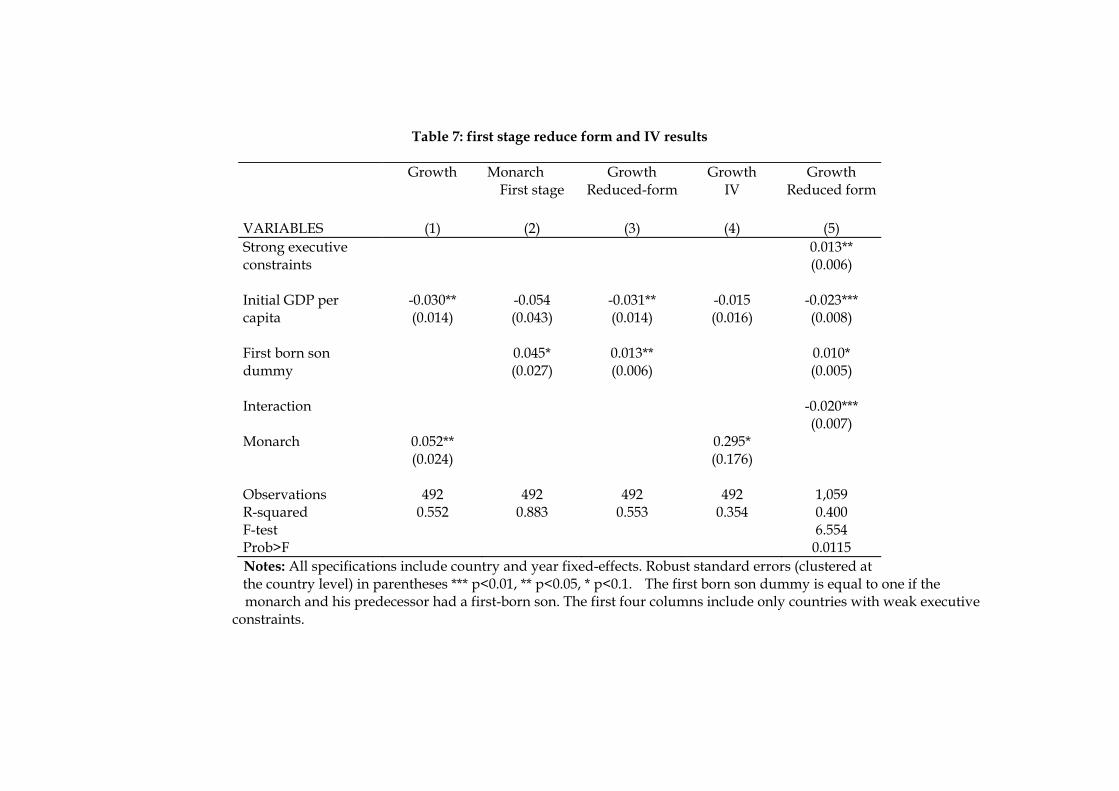
Table 7: first stage reduce form and IV results
Growth Monarch Growth Growth Growth
First stage Reduced-form
IV
Reduced form
VARIABLES (1) (2) (3) (4) (5) Strong executive constraints
0.013** (0.006)
Initial GDP per capita
-0.030** (0.014)
-0.054 (0.043)
-0.031** (0.014)
-0.015 (0.016)
-0.023*** (0.008)
First born son dummy
0.045* (0.027)
0.013** (0.006)
0.010* (0.005)
Interaction -0.020*** (0.007) Monarch 0.052** 0.295* (0.024) (0.176) Observations 492 492 492 492 1,059 R-squared 0.552 0.883 0.553 0.354 0.400 F-test 6.554 Prob>F 0.0115
Notes: All specifications include country and year fixed-effects. Robust standard errors (clustered at the country level) in parentheses *** p<0.01, ** p<0.05, * p<0.1. The first born son dummy is equal to one if the
monarch and his predecessor had a first-born son. The first four columns include only countries with weak executive constraints.