the london housing strategy - lifetime homes · november 2008 the london housing strategy draft for...
TRANSCRIPT


Hou
se p
rice
inde
x (y
ear 2
002
= 10
0) 140
120
100
80
60
40
20
0
1969
1972
1975
1978
1981
1984
1987
1990
1993
1996
1999
2002
2005
2007

Num
ber o
f ho
mes
40 000
35 000
30 000
25 000
20 000
15 000
10 000
5 000
0
Local authorities
Housing associations
Private sector
1970
1973
1976
1979
1982
1985
1988
1990
/91
1993
/94
1996
/97
1999
/00
2002
/03
2005
/06
2006
/07


020 000
40 000
60 000
80 000
100 000
120 000
140 000
160 000
180 000
2008
2006
2004
2002
2000
1998
1996
1994
1992
1990
1988
1986
1984
1982
1980


1997
/98
1998
/99
1999
/200
0
2000
/01
2001
/02
2002
/03
2003
/04
2004
/05
2005
/06
2006
/07
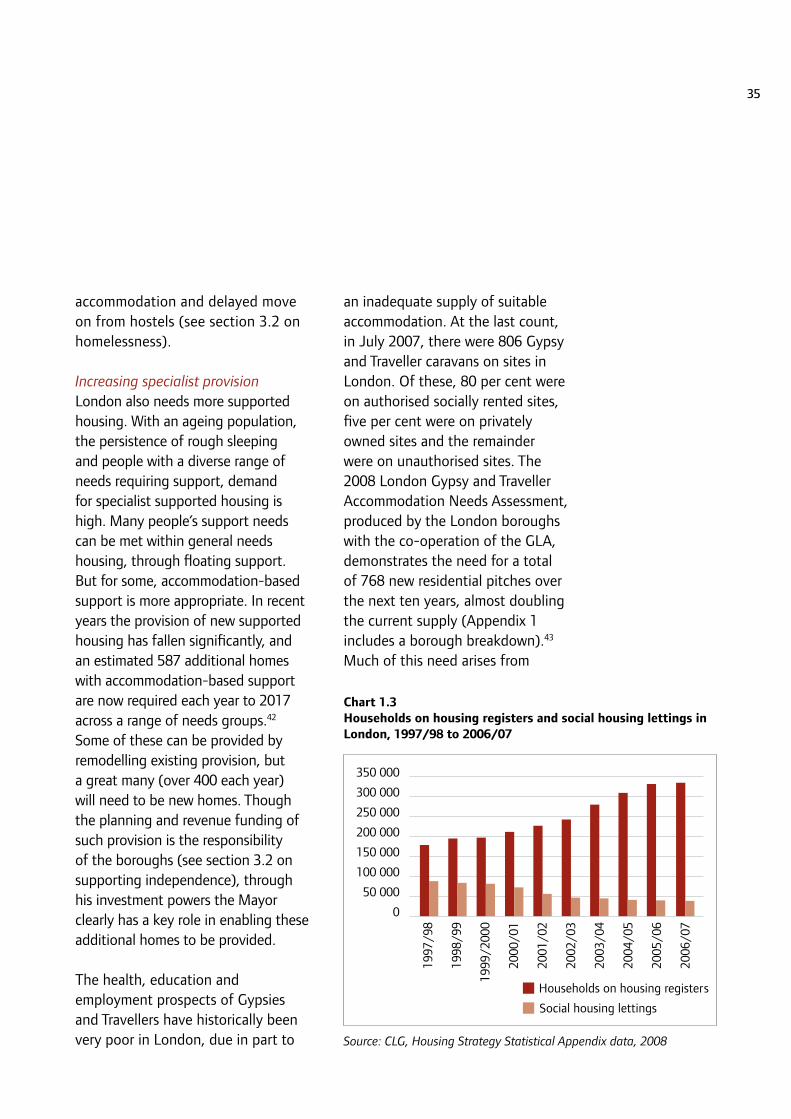
350 000
300 000
250 000
200 000
150 000
100 000
50 000
0


0
100 000
200 000
300 000
400 000
500 000
600 000 Housing benefit
Non-housing benefit
Nor
th E
ast
Wes
t M
idla
nds
Eas
t M
idla
nds
Nor
th W
est
York
s &
H
umbe
r
Eas
t
Sou
th W
est
Sou
th E
ast
Lon
don


England
London
0% 100%80%60%40%
% of schemes
20%


0% 5% 10% 15% 20% 25% 30% 35% 40%
Residual income
Full income
Rented from ahousing association
Rented from alocal authority
Privately rented
Owned outright
Owned mortgage
Percentage of households in fuel poverty


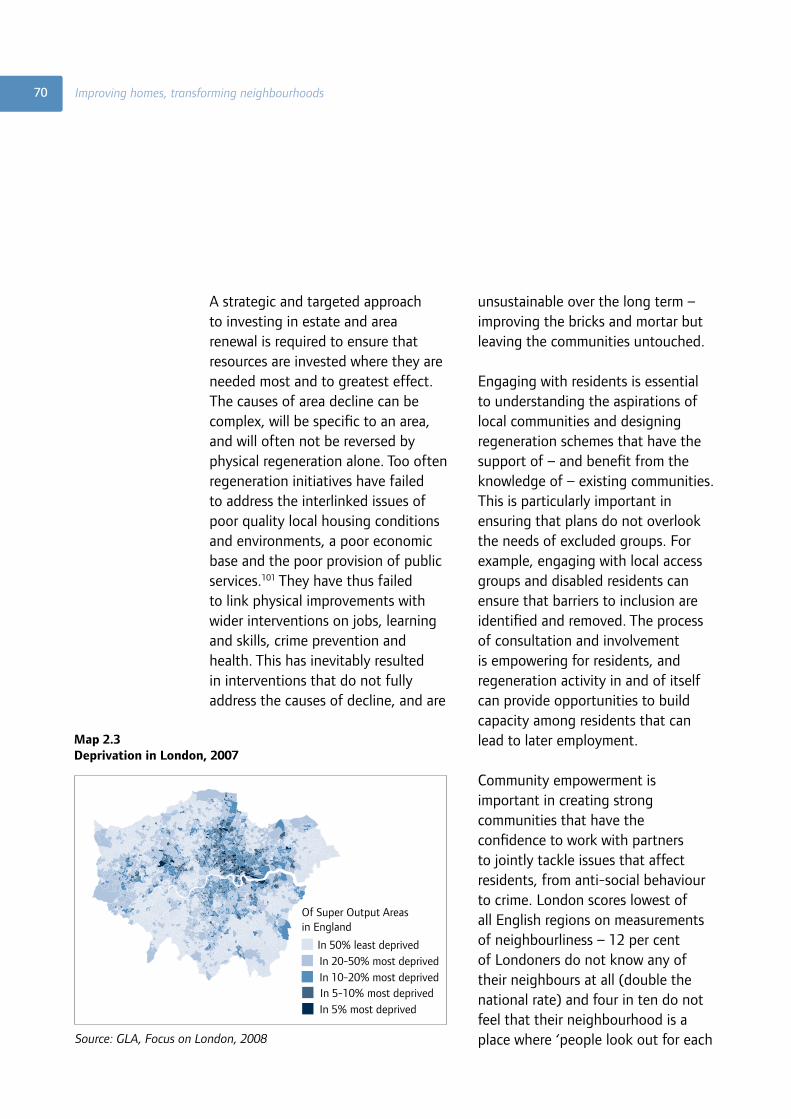
Of Super Output Areas in England
In 50% least deprivedIn 20-50% most deprivedIn 10-20% most deprivedIn 5-10% most deprivedIn 5% most deprived


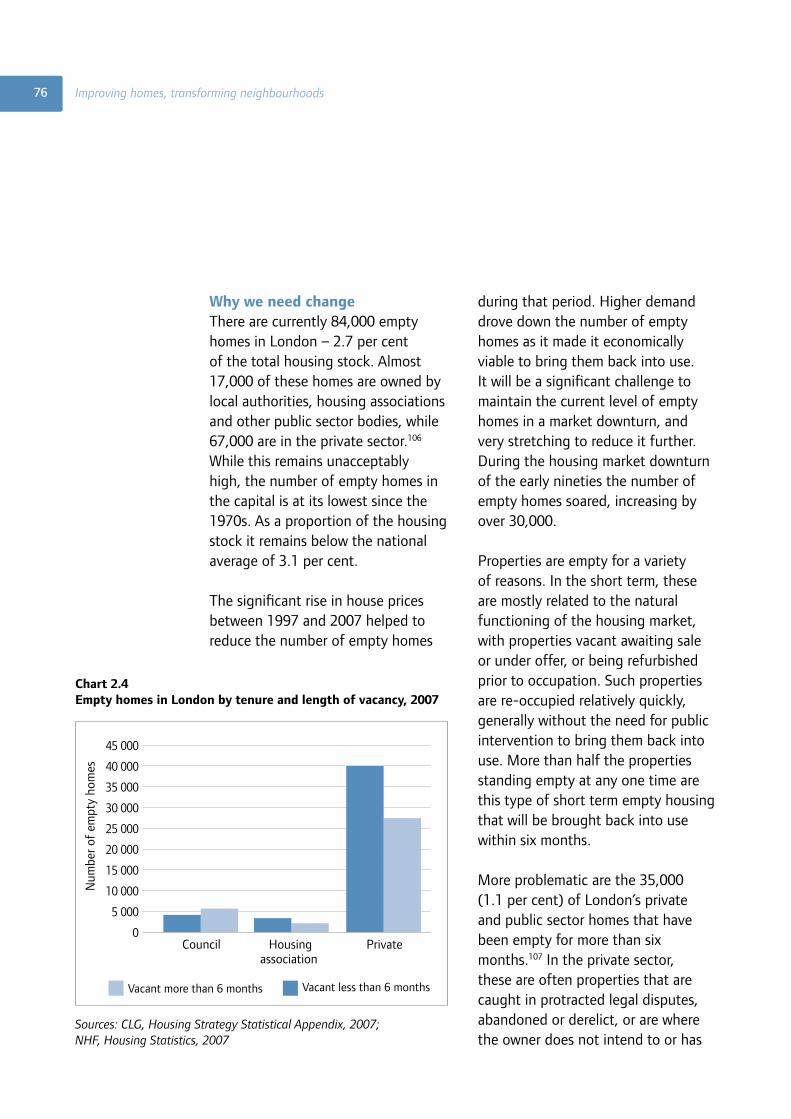
0
5 000
10 000
15 000
20 000
25 000
30 000
35 000
40 000
45 000
Vacant more than 6 months Vacant less than 6 months
Private Housing association
Council
Num
ber o
f em
pty
hom
es


0
10 000
20 000
30 000
40 000
50 000
60 000
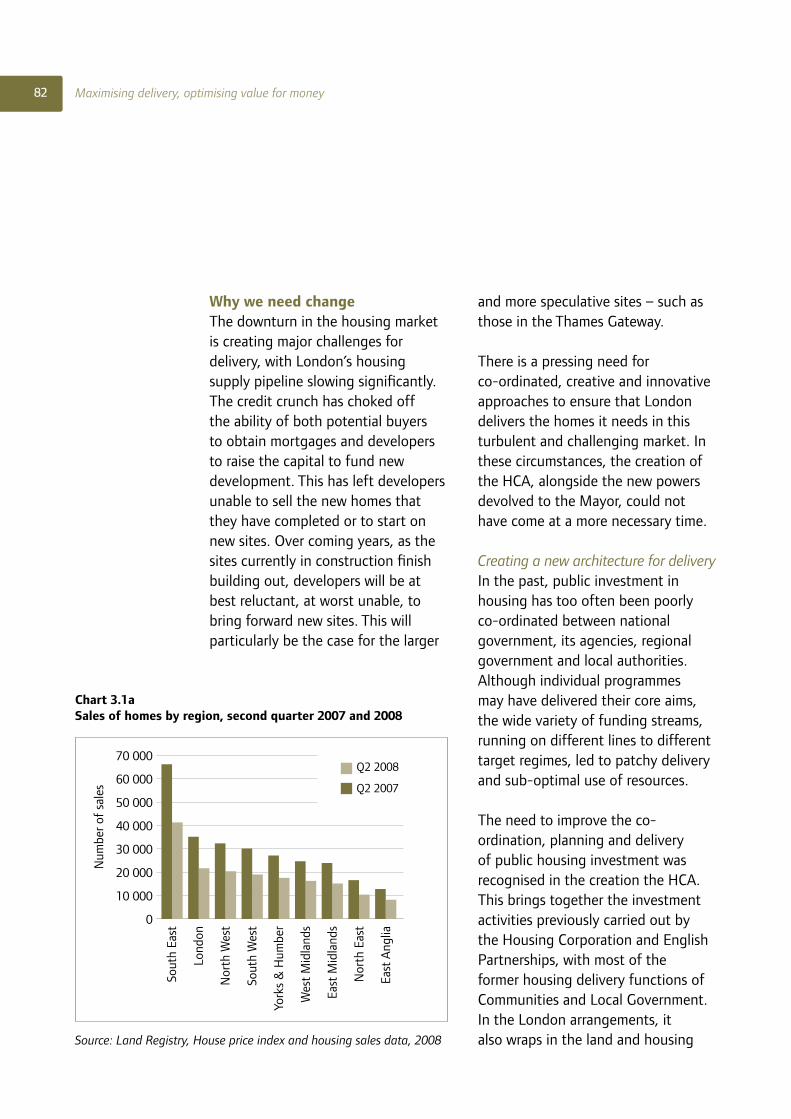
70 000Q2 2008
Q2 2007
East
Ang
lia
Nor
th E
ast
East
Mid
land
s
Wes
t M
idla
nds
York
s &
Hum
ber
Sout
h W
est
Nor
th W
est
Lond
on
Sout
h Ea
st
Num
ber o
f sa
les

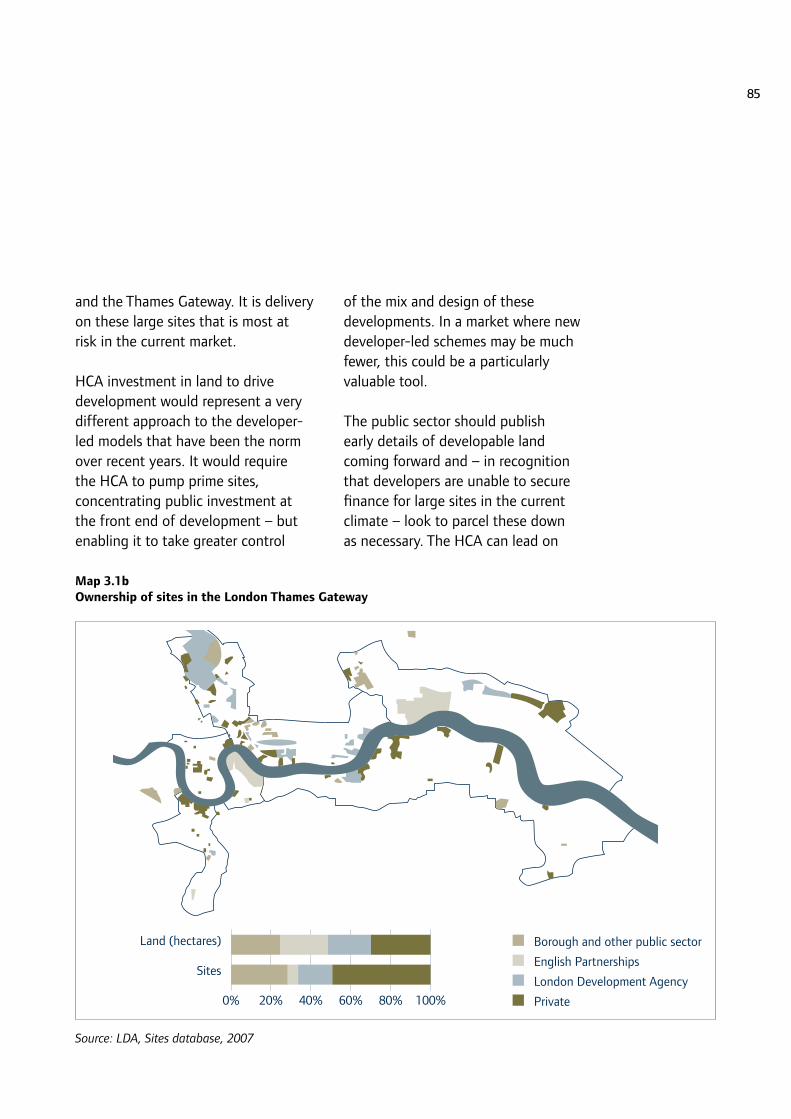
Land (hectares)
Sites
0% 100%80%60%40%20%
Borough and other public sector
English Partnerships
London Development Agency
Private


0
10 000
20 000
30 000
40 000
50 000
60 000 Social housing lets made to homeless households, 2006/07
Homeless households in temporary accommodation, March 2008
Nor
th E
ast
East
Mid
land
s
Wes
t M
idla
nds
York
s &
Hum
ber
Nor
th W
est
Sout
h W
est
East
of
Engl
and
Sout
h Ea
st
Lond
on