the long and winding road… u.s. travel trends and outlook
TRANSCRIPT

The Long and Winding Road…U.S. Travel Trends and Outlook

About the travelhorizonsTM Survey
• Looking forward instead of back• Travel intentions in the six months• Quarterly online national survey of U.S. adults since March
2007• Current survey conducted between July 19 – 30th• Total of 2,200 responses from U.S. adults age 18+ and
capturing 1,600 past year travelers per survey wave• Respondents representative of the total U.S. population of
adults age 18+• Joint program between the U.S. Travel Association and
Ypartnership

2001 – 2011… One for the books

But also a Decade of Rs…
Resilience Renewal Re-Birth
Recovery
Resourcefulness

Turning the corner…But when?
• Another “soft patch”• Weak housing market• Americans’ spending plans still on hold • Weak labor market has weakened again • Inflationary pressures still high in travel• Ongoing debt crisis• Threat of higher taxes

It’s the Consumer Corporations, Stupid!

Consumer Confidence Plummets…Just can’t sustain consumer confidence
Lowest since April 2009
44.5 as of August
90.0 is considered healthy
1985 = 100
Source: The Conference Board, August 30, 2011

Consumer Confidence…Heading in the wrong direction
Jan '08 Jul '08 Jan '09 Jul '09 Jan '10 Jul '10 Jan '110
25
50
75
100
125
150Percent Change
* January-MaySource: National Park Service
1985 = 100
Source: The Conference Board
25.3
44.5
90 considered “healthy”
66.0

August Consumer Confidence Index for Past Five Years…
1985 = 100
Source: The Conference Board

Even upper-income Americans are concerned

Overall Traveler Sentiment IndexTM An uptick in July
Source: U.S. Travel Association/Ypartnership, travelhorizonsTM, July 2011
March 2007 = 100 Interest in travelTime for travelMoney available for travelAffordability of travelQuality of serviceSafety of travel in U.S.

Younger Americans the Most Positive about Travel
Jul 09 Oct 09 Feb 10 Apr 10 Jul 10 Oct 10 Feb 11 Apr 11 Jul 11
Gen Y 95 91.2 97.6 97.1 91.5 91.2 99.3 94.2 100.1
Gen X 92.4 88.2 90.8 88.1 86.8 89.3 99.3 84.2 89.7
Young Boomer 86.1 81.6 82.2 83.7 85.3 81.6 84.1 78.5 83.3
Older Boomer 87.4 89.9 85.4 83.7 74.5 80.1 90 76.1 73.9
Mature 81.2 84.8 82.6 84 79.3 75.4 80.5 72.3 79.4
70.0
80.0
90.0
100.0
Gen Y Gen X Young BoomerOlder Boomer Mature
Traveler Sentiment Scores
Source: U.S. Travel Association/Ypartnership, travelhorizonsTM, July 2011
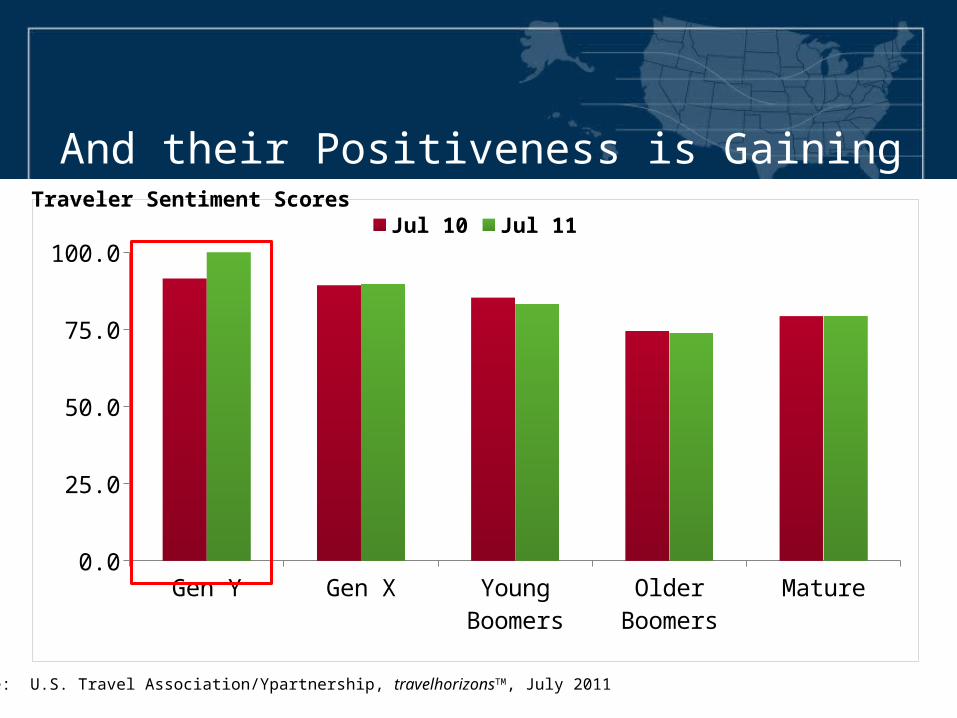
And their Positiveness is Gaining
Gen Y Gen X Young Boomers
Older Boomers
Mature
Jul 10 91.5 89.3 85.3 74.5 79.3
Jul 11 100.1 89.7 83.3 73.9 79.4
12.5
37.5
62.5
87.5
Jul 10 Jul 11Traveler Sentiment Scores
Source: U.S. Travel Association/Ypartnership, travelhorizonsTM, July 2011

Affordability of Travel Index… Regains some ground
Source: U.S. Travel Association/Ypartnership, travelhorizonsTM, July 2011
March 2007 = 100
Gas price rise

But travel prices still outpacing inflation
Motor Fuel Airfares Lodging Food Away from Home
Recreation0.0
5.0
10.0
15.0
20.0
25.0
30.0
35.0
28.7%
10.1%
2.4% 2.1%0.2%
Source: U.S. Travel Association Travel Price Index
Percentage change through July 2011YTD TPI = +6.7%YTD CPI = +2.9%
Does not include various fees

The cost of flying…Higher prices, fees, fees and more fees
• Carry-on bags• Checked bags• Changed flights• Booking by phone• Preferred seating• Cut-the-line• Curb-side check-in• Change to earlier flight• Lavatory use (Ryan Air)
$9.2 billion in fees to U.S. airlines in 2010 for checked baggage/other services.
TSA estimates there were 59 million more carry-ons in 2010 than in 2009.

Gas prices up $0.85 from last year…Price of gas still a financial issue facing travelers
Record High 7/11/08
9/20/2010 8/20/2011 9/20/20110
0.5
1
1.5
2
2.5
3
3.5
4
4.5 $4.11
$2.73
$3.57 $3.58
Source: AAA Daily Fuel Gauge Report as of September 20, 2011www.aaa.org

Good News…Looks like gas prices will be declining
Source: AAA Daily Fuel Gauge Report as of September 20, 2011www.aaa.org

Relevance of Travel & Tourism…Right up there with other necessities
After pumping $60 of gas into his Chevy pickup, Chuck says
he’s giving up cigarettes, beer and a vacation.
“I’ll sit at home and cook out and won’t go anywhere.”
Source: USA Today, Friday, March 11, 2001

Interest in Travel Remains Strong
Mar 07
Apr 07
Jun 07
Aug 07
Oct 07
Dec 07
Feb 08
Apr 08
Jul 08
Oct 08
Feb 09
Apr 09
Jul 09
Oct 09
Feb 10
Apr 10
Jul 10
Oct 10
Feb 11
Apr 11
Jul 11
In-ter-est
130.5
126.9
112.1
120.2
122.3
122.8
123.8
106.4
104.2
100.1
110.4
113.5
117.9
117.1
116.2
115.8
103.7
104.9
118.8
111.4
116.2
85
95
105
115
125
135 Interest in Travel Scores
Source: U.S. Travel Association/Ypartnership, travelhorizonsTM, July 2011
Traveler Sentiment Scores
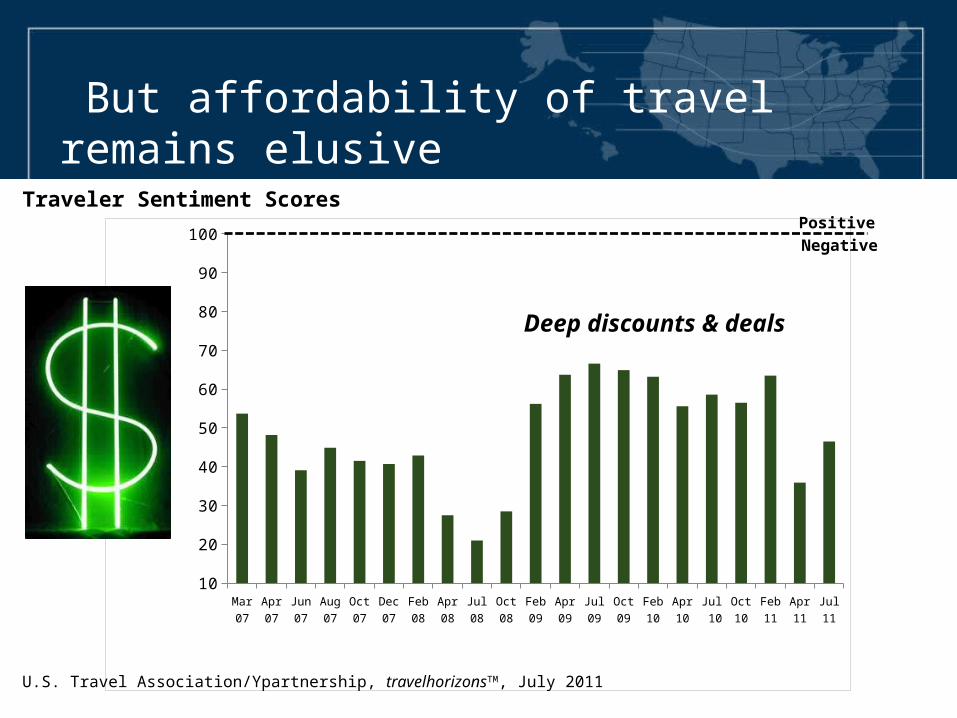
But affordability of travel remains elusive
Mar 07
Apr 07
Jun 07
Aug 07
Oct 07
Dec 07
Feb 08
Apr 08
Jul 08
Oct 08
Feb 09
Apr 09
Jul 09
Oct 09
Feb 10
Apr 10
Jul 10
Oct 10
Feb 11
Apr 11
Jul 11
Af-fordabil-ity
53.7 48.2 39.1 44.9 41.5 40.7 42.9 27.5 21 28.5 56.2 63.7 66.6 64.9 63.2 55.6 58.6 56.5 63.5 35.9 46.5
15
25
35
45
55
65
75
85
95
Positive
Negative
Source: U.S. Travel Association/Ypartnership, travelhorizonsTM, July 2011
Traveler Sentiment Scores
Deep discounts & deals

And “money available for travel” not back to pre-recession levels
Mar 07
Apr 07
Jun 07
Aug 07
Oct 07
Dec 07
Feb 08
Apr 08
Jul 08
Oct 08
Feb 09
Apr 09
Jul 09
Oct 09
Feb 10
Apr 10
Jul 10
Oct 10
Feb 11
Apr 11
Jul 11
Money Avail-able
85.1
81.9
74 76.8
75 71.1
73.9
65.7
54.6
51.8
55.6
59.8
59.8
61.1
67.7
70.1
64.2
64.2
75.7
64 68
45
55
65
75
85
95
Traveler Sentiment Scores
Positive
Negative
Source: U.S. Travel Association/Ypartnership, travelhorizonsTM, July 2011

Travel Performance…We are digging out of the hole

First Half 2011 Travel Performance…Looking goodDomesticVolume
DomesticLeisure Volume
Domestic BusinessVolume
2.6%2.8%
1.9%
DomesticSpending
7.8%
Source: U.S. Travel Association and Tourism Economics

Leisure Travel Trends

States Planning to Visit on Future Leisure Trip…
1. Florida 33%
2. California 33%
3. Hawaii 31%
4. Alaska 24%
5. Colorado 22%
6. New York 20%
7. Arizona 18%
8. Nevada 17%
9. Texas 17%
10. Washington 16%
Among all U.S. adultsSource: U.S. Travel Association/Ypartnership, travelhorizonsTM, July 2011

Interest in Visiting CO Varies by Generation… Gen X knocking at your door
Gen Y Gen X Young Boomer
Older Boomers
Mature0
5
10
15
20
25
30
35
19%
30%
22%
18%15%
Among all U.S. adultsSource: U.S. Travel Association/Ypartnership, travelhorizonsTM, July 2011
Which states are you interested in visiting on a future leisure trip?

And by household income
Under $30,000 $30 - 49,999 $50 - 99,999 $100,000+0
5
10
15
20
25
30
35
17% 17%
26%
29%
Among all U.S. adultsSource: U.S. Travel Association/Ypartnership, travelhorizonsTM, July 2011
Which states are you interested in visiting on a future leisure trip?

Domestic Leisure Visitors…Exceeded the 2007 high last year
Source: U.S. Travel Association
Bah!
Millions of Person-Trips

56% of U.S. adults planning at
least one leisure trip between August and
January7 million more travelersSource: U.S. Travel Association/Ypartnership, travelhorizonsTM, July 2011

Leisure travel intentions highest in the West…Good news for Colorado
October 2008 = 62%October 2009 = 50%
49%
54%
57%
62%
Source: U.S. Travel Association/YPartnership travelhorizons™ , July 2011
Lowest on record
Plan to take a leisure trip between August 2011 and January 2012
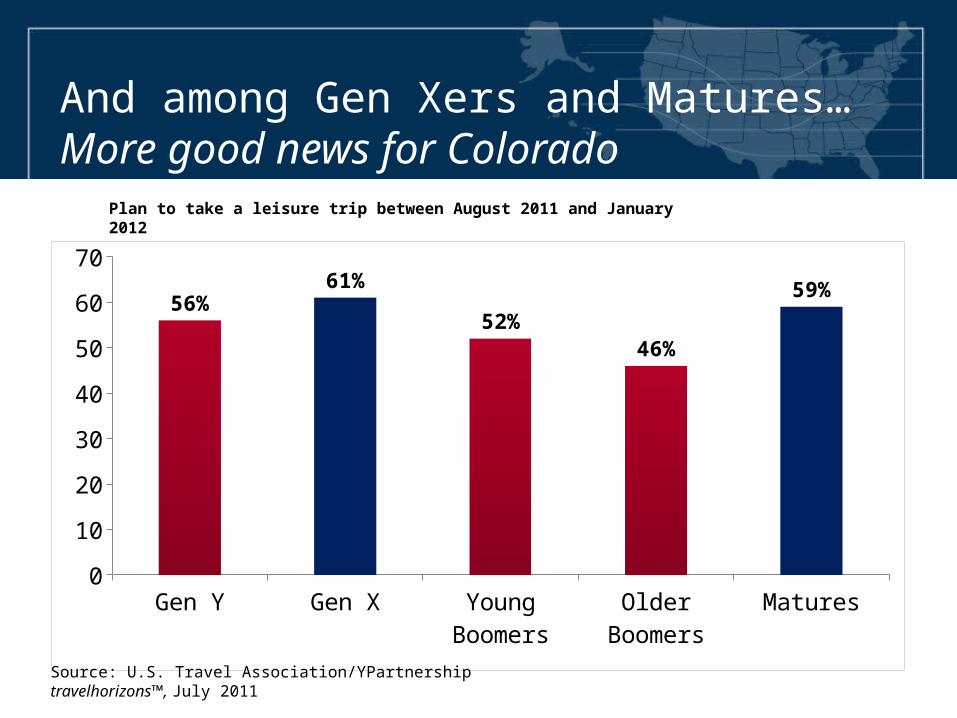
And among Gen Xers and Matures…More good news for Colorado
Gen Y Gen X Young Boomers
Older Boomers
Matures0
10
20
30
40
50
60
70
56%61%
52%46%
59%
Source: U.S. Travel Association/YPartnership travelhorizons™, July 2011
Plan to take a leisure trip between August 2011 and January 2012

Financial factors influencing leisure travel…Most not really travel related
Financial Factor Influencing Future Leisure Travel
% AgreeJuly 2011
Price of gallon of gasoline 62%
Price of air travel 59
Meltdown of the U.S. economy 58
High level of credit card debt 57
Expectation of making less money 56
Expectation spouse/partner will lose job 55
High level of personal debt 55
Rising cost of healthcare 51
Size of the national debt 46
Q: To what degree is each of the following financial issues currently affecting your leisure vacation plans over the next 12 months? (Somewhat to much less likely to travel)Source: U.S. Travel Association/Ypartnership, travelhorizonsTM, July 2011

Reasons for taking more leisure trips…3 Rs -- Rest, Relax, Reconnect
• Reconnect with family/fiends (43%) • Relieve stress/need to relax (34%)
• Break from home/work routine (26%)
• Have put off traveling due to economy – feeling housebound (25%)
Q: Why are you planning on taking more leisure trips during the next 6 months?Source: U.S. Travel Association/Ypartnership, travelhorizonsTM, July 2011

Outlook through January 2012
• Still willing to travel, but making
adjustments in spending
• Still traveling close to home
• Overnight leisure trips shorter in duration
• More day trips
• More long weekend getaways
• Plans can change, but…..Source: U.S. Travel Association/Ypartnership, travelhorizonsTM, July 2011

Vacations are Needed Now More than Ever!

Business Travelers…Not what it used to be

Incidence of Business Travel Down 14 Points Over Past 5 Years, but Stabilizing
Percent taking business trip in past year
July-07 July-08 July 2009 July 2010 July 20110
5
10
15
20
25
30
35
40 37%35%
28%
23% 23%
Per
cen
tag
e
Source: U.S. Travel Association/Ypartnership, travelhorizonsTM, July 2011

508.7494.3
461.1
431.1
447.8
380
400
420
440
460
480
500
520
2006 2007 2008 2009 2010
Source: U.S. Travel Association
Millions of Person-Trips
Domestic business travel inches up…Well below 1998 record high
Ouch!

Business travel… The province of the young
Gen Y Gen X Young Boomers
Older Boomers
Matures0
5
10
15
20
25
30
24%21%
18%
8% 7%
Plan to take a business trip between August 2011 and January 2012
Source: U.S. Travel Association/Ypartnership, travelhorizonsTM, July 2011

Lodging Trends

J F M A M J J A S O N D J F M A M J J A0.0
2.0
4.0
6.0
8.0
10.0
12.0
2.6
3.9
8.8
7.36.5
9.2 9.08.3 8.4 8.4
10.5
6.67.0
6.2
7.16.4 6.1
4.9
3.6
6.4
Hotel demand… Stronger than expected
Source: Smith Travel Research, September 2011
2010 2011
Percent change in room-nights sold over prior year

J F M A M J J A S O N D J F M A M J J A
-10.0
-5.0
0.0
5.0
10.0
15.0
-7.5
-3.6-2.1
3.5
7.18.0 8.5
9.98.8 8.2
11.8
7.48.7
7.9
10.1
7.98.8
7.86.9
8.2
Revenue Per Available Room positive…Driven primarily by rising demand
Source: Smith Travel Research, September 2011
2010 2011
Percent change over prior year

Top down recovery for lodging% change in RevPAR through August 2011 by tier
Luxu
ry
Upp
er U
psca
le
Ups
cale
Upp
er M
idsc
ale
Mid
scal
e
Eco
nom
y
Inde
pend
ents
0.0
2.0
4.0
6.0
8.0
10.0
12.0
14.011.9%
6.6%8.0%
8.8%
2.4%
5.7%
7.9%
Source: Smith Travel Research, September 2011

% change in RevPAR through August 2011 -Getting better
Source: Smith Travel Research, August 2011
10.0% or more
Decrease
7.5% to 9.9%
5.0% to 7.4%
0.0% to 4.9%
7.3
7.3
8.2
12.6
3.05.8
1.9
6.5

Hotel Performance Through August 2011Mountain region and Colorado doing quite nicely
Occupancy ADR RevPAR Demand
U.S. 4.5 3.5 8.2 6.4
Mountain 5.2 3.4 8.7 6.1
Colorado 4.3 5.1 9.7 5.9
1
3
5
7
9
11
U.S. Mountain Colorado2011 versus 2010
Source: Smith Travel Research, September, 2011

STR Forecasts for 2011 and 2012ADR drives up RevPAR
Source: Smith Travel Research, July 2011

Air Travel Faces a Bevy of Challenges…Pat downs, no snacks, too many checked bags

Transportation demand “unsettled”
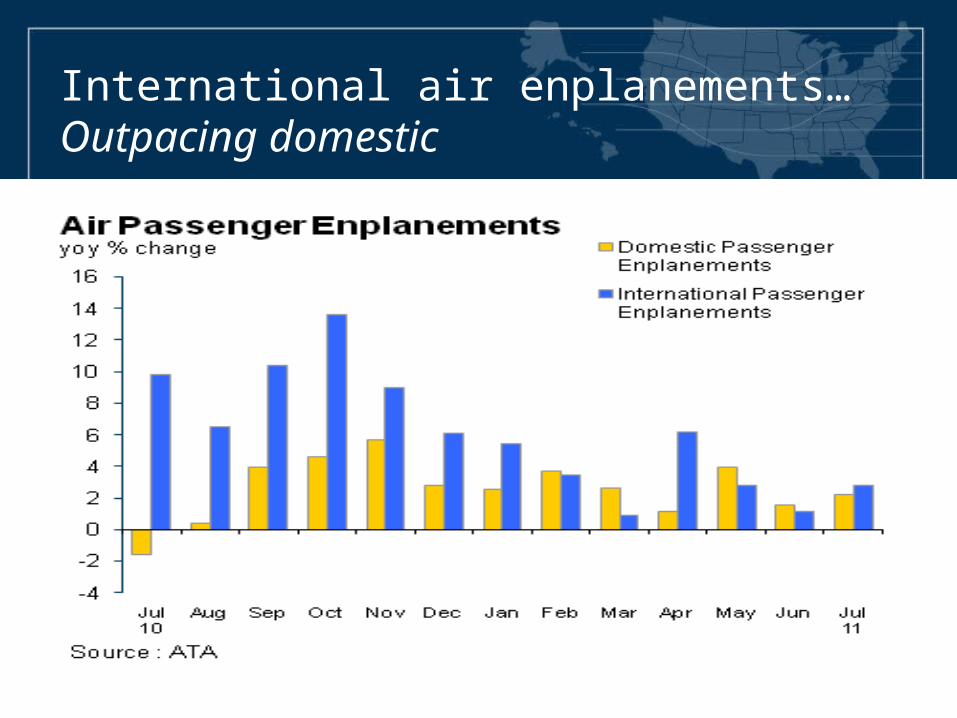
International air enplanements…Outpacing domestic

International Visitors…Welcome back!
• Spend more per trip ($4,000 per overseas visitor)• Stay longer (18 nights in U.S.)• $31.7 billion trade surplus• Stay in hotels (78%)• They enjoy seeing the America we take for granted

International arrivals to U.S. sets new record!9 million more visitors than 2000
Source: Office of Travel and Tourism Industries
(in millions)

New record high for overseas arrivals… But, back to where we were in 2000
Source: Office of Travel and Tourism Industries

2011 Booming! International visitation up 5% and spending up 12% through June
Source: Office of Travel and Tourism Industries
(% change through June 2011)
Arrivals Spending0
2
4
6
8
10
12
14
5%
12%

China Brazil Australia France Korea Germany Canada UK Mexico Japan
Arrivals 32 28 23 21 8 7 6 3 -1 -7
-7.5
-2.5
2.5
7.5
12.5
17.5
22.5
27.5
32.5
Percentage Change in International Arrivals Through June 20118 of 10 top countries showing increases
Source: Office of Travel and Tourism Industries

Forecasts Through 2013…Break out the Ouija boards!

Total domestic visitors…Modest growth
*ForecastSource: U.S. Travel Association; Tourism Economics

Total Domestic Visitors…Should set new record this year
2000 2007 2008 2009 2010 2011* 2012* 2013*1750
1800
1850
1900
1950
2000
2050
2100
1,892
2,005
1,965
1,898
1,965
2,006
2,043
2,089
* Forecast as of May 20, 2011Source: U.S. Travel Association and Tourism Economics
In billions

Domestic leisure visitors…More solid growth
*ForecastSource: U.S. Travel Association; Tourism Economics

Domestic Leisure VisitorsWill continue to set new records
* Forecast as of May 20, 2011Source: U.S. Travel Association and Tourism Economics
In billions

Domestic business travelers…Some improvement
*ForecastSource: U.S. Travel Association; Tourism Economics

In millions
Domestic business travel improves…But still well below 1998 record high
* Forecast as of May 11, 2011Source: U.S. Travel Association and Tourism Economics

International and Overseas arrivals continue strong as well
2010 2011* 2012* 2013*0.0
2.0
4.0
6.0
8.0
10.0
12.0
8.7%
5.8%4.9% 4.7%
11.0%
5.0% 5.4% 5.4%
International Overseas
*ForecastSource: U.S. Travel Association; Tourism Economics

Summary…sustained, but slow growth expected in 2011…and 2012 and 2013
DomesticLeisureVolume
DomesticBusinessVolume
InternationalVisitors
InternationalSpending*
Note: Numbers is parentheses are 2010 data
2.4%1.2%
5.8%
10.0%
DomesticSpending
7.3%
(3.5%)(3.7%)
(8.7%) (7.4%)
(9.8%) *Excluding international airfaresSources: U.S. Travel Association; Oxford Economics/Tourism Economics; U.S. Department of Commerce-Office of Travel and Tourism Industries

In this travel environment…“If you’re not at the table, you’ll be on the menu.”

42 million “not sures”…Must be in the marketplace
Not Sure18%
42 Million
No Plans to Travel26%
60 Million
Q: Over the next 6 months, do you plan to take any leisure trips of at least 50 miles one way from home or that will include an overnight stay?Source: U.S. Travel Association/Ypartnership, travelhorizonsTM, July 2011

The Rise and Fall of State Tourism Office Budgets…Too much uncertainty from year to year
Total State Tourism Office Budgets in Millions
Source: U.S. Travel Association, Survey of State Tourism Office Budgets

Elected officials giveth and elected officials taketh away…% change 2010/2009
Se-ries
1
-80
-60
-40
-20
0
20
40
60
80Louisiana
+68%
New York-63%
Source: U.S. Travel Association, Survey of State Tourism Office Budgets

Most State Tourism Office funding still tied to the public sector
Source: U.S. Travel Association, Survey of State Tourism Office Budgets


“The Power of Travel Promotion” Travel and Tourism…An economic engine
Question: How can we fund something like tourism promotion when we have to cover essential services like teachers, safety and highways?
Answer: Tax revenue generated by travelers is immediate and are critical to financing essential services. – 2010 state/local travel tax revenues more than covered
all wages paid to police and firefighters nationally– Almost half of all wages paid to elementary and middle
school teachers
Source: U.S. Travel Association

“The Power of Destination Marketing”What happens when you stop marketing…The Colorado Case
• 30% loss in market share of overnight leisure trips
• $1.4 billion in lost traveler spending in first year
• $2.4 billion lost traveler spending per year within four years of closing
• $134 million in lost state and local tax receipts
• Tourism office back in game in 2000• Funding increased to $19 million
based on ROI of 12:1
“The Rocky Mountains were there long before the Colorado Tourism Board and they’d be there long after. Surely, the tourists will keep on coming.”
Source: Longwoods International

Washington State…The Next Colorado

Power of Travel Promotion Report

Today’s Consumer

2010 Census and Beyond Profound Population Shifts in Past 20 Years
• Bigger (Not obese but more of us)• Older (Not older, but less young)• More Hispanic and Asian• More cognizant of multiracial identities• More accepting of non-traditional living situations – multi-
generational households, unmarried couples, same-sex couples, living solo
• Less enamored of kids• Redefined gender roles (Chastity Bono)• More suburban, and less rural• Leaning more to the South and West
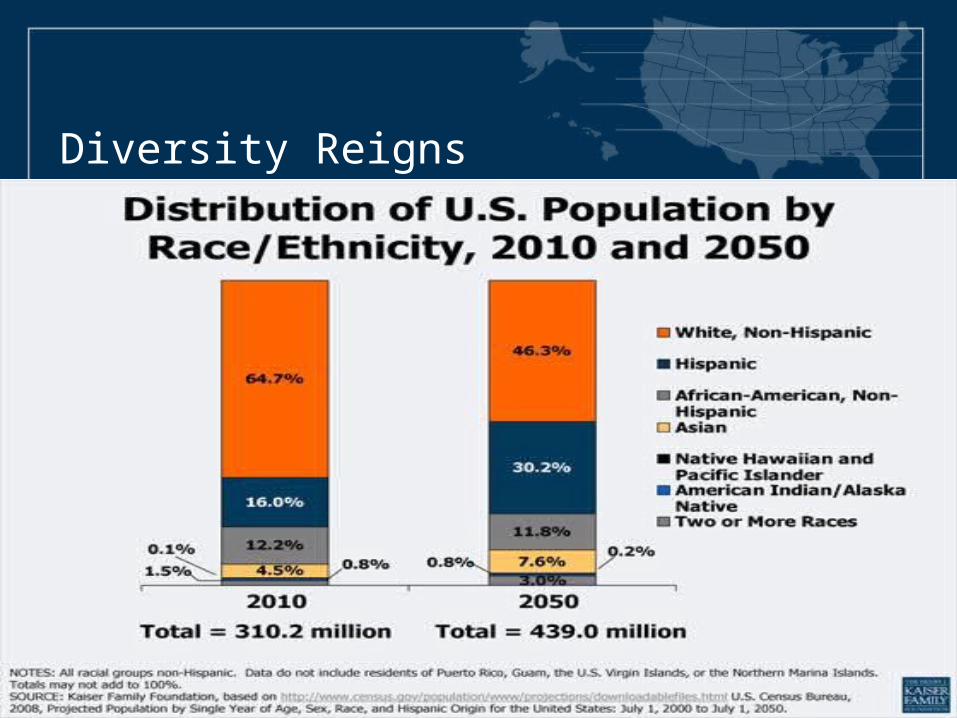
Diversity Reigns

New Culture Of Impatience
• Faster Food• Faster Boot Ups
• Faster Downloads• Speed Vacations
Consumer Trends to Watch

Last-Minute travel is still in…Must be constantly in the market place
Took at least onelast-minute trip in
past year and keeps rising
30%
Source: Ypartnership/Harrison Group, 2011

The New Resourcefulness

Smarter Shoppers
48% of leisure travelers feel they are smarter shoppers
thanks to the economic situation
Source: U.S. Travel Association/Ypartnership, travelhorizonsTM, February 2011

Differences in Buying Behavior…Doing more of than before
Gen Y Gen X Young Boomer
Older Boomer
Mature
Waiting for items I buy to go on sale 57% 54% 61% 56% 51%
Using coupons/direct offers 60 55 54 59 50
Doing more research before making a travel purchase 46 46 41 40 37
Buying in quantity to get more for my money 45 43 43 32 28
Buying more with cash 38 38 43 32 32
Buying the lower cost item in a category 45 39 43 28 27
Extent to which shopping behavior has changed from a year ago (% more)
Numbers shown in red are significantly different from one or more other generationsSource: U.S. Travel Association/Ypartnership, travelhorizonsTM, February 2011

Travelers Demanding More for Their Money
More leg room Upgraded guest room
More bountiful breakfastsFree Internet & Wi-Fi

The New Thrift…Generations and marketing implications

The “Great Recession”…Telling it like it is
Percentage of U.S. adultswho agree with the statement:
“Although the recession is technically over, I don’t feel like it is.”
57%Source: U.S. Travel Association/Ypartnership, travelhorizonsTM, July 2011

Generations…Recovery is not equal
Danny—
Have a great day sweetie!
xoxo
Mom

Millennials (Gen Ys)…I don’t understand a thing they say
Millenials (Gen Ys)
• 76 million “20 something's”• Line between home and work doesn’t exist• More than half move back home with the folks after college • The “boomerang generation”• Like spending time with parents

Gen Xers…Charlie & Robert – Sensing a trend?
Gen Xers
• 50 million • Born in 60s to early 80s• Post Vietnam • Moving in and out of the work force • In high demand in work force

Baby Boomers…Time flies
Baby Boomers
• 85 million!• Expected to have time and $$$• Juggling act between work and home• Retiring or thinking about it • 10,000 turn 65 every day• Purchase 77% of prescription drugs

Matures…Seeing the people on the list just kills me
Matures
• Born in 1945 or before• Age 65+• Many retired or will be soon• Depression-induced attitudes values persist• Connected

Positive attitudes about travel decline with age
Q: Perceptions of travel compared to year agoSource: U.S. Travel Association/Ypartnership, travelhorizonsTM, July 2011
Positive
Negative
Traveler Sentiment Scores

Younger more positive about having money available for travel… Mom & Dad?
Q: Perceptions of travel compared to year ago?Source: U.S. Travel Association/Ypartnership, travelhorizonsTM, July 2011
Positive
Negative
Traveler Sentiment Scores

Differences in Frame of Mind…Boomers less positive
Gen Y Gen X Young Boomer
Older Boomer
Mature
I feel much more optimistic about the future 37% 34% 23% 27% 19%
Although recession is technically over, I don’t feel like it is 49% 53% 61% 66% 60%
Have become much more budget minded than in the past 53% 56% 63% 52% 57%
More confidence in my ability to deal with economic uncertainty 39% 38% 30% 32% 36%
I am in much better financial shape than I was before the recession 29% 24% 13% 15% 10%
Recent financial crises have affected sense of financial security negatively
28% 36% 43% 40% 44%
% agreeing strongly/very strongly with statement
Numbers shown in red are significantly different from one or more other generationsSource: U.S. Travel Association/Ypartnership, travelhorizonsTM, February 2011

Differences in Buying Behavior…Doing less of than before
Gen Y Gen X Young Boomer
Older Boomer
Mature
Buying exclusive brands 32% 43% 57% 62% 68%
Shopping at malls 35% 45% 59% 50% 52%
Purchasing with credit cards 33% 43% 54% 39% 43%
Buying the higher cost item because its on sale 28% 37% 31% 39% 39%
Extent to which shopping behavior has changed from a year ago (% less)
Numbers shown in red are significantly different from one or more other generationsSource: U.S. Travel Association/Ypartnership, travelhorizonsTM, February 2011

Differences in Spending…Doing less of than before
Gen Y Gen X Young Boomer
Older Boomer
Mature
Going out to clubs/bars 46% 49% 61% 57% 68%
Buying jewelry 42 45 57 62 67
Dining out in restaurants 43 44 55 45 45
Major household appliances & furniture 42 39 50 48 51
Entertainment (movies, sports, etc.) 41 38 48 45 51
Leisure travel 40 39 47 36 41
Clothing/apparel 33 37 47 40 43
Computers/electronics 35 30 39 37 39
Personal care (gyms, hair care, etc) 36 33 42 38 38
Extent to which your spending has changed compared to a year ago (% less)
Numbers shown in red are significantly different from one or more other generationsSource: U.S. Travel Association/Ypartnership, travelhorizonsTM, February 2011

Differences in Leisure Travel Behavior…Older Americans lagging behind
Gen Y Gen X Young Boomers
Older Boomers
Mature
Stay in more expensive hotels 30% 27% 11% 19% 17%
Take more overnight trips 58% 61% 45% 58% 51%
Take more long weekend trips 62% 68% 54% 68% 49%
Stay more with friends & family 76% 69% 65% 56% 64%
Plan my own vacation to save money 77% 74% 85% 86% 85%
Take more trips lasting 1 week or longer 39% 40% 24% 37% 36%
Take fewer long weekend getaways 38% 32% 46% 32% 51%
Numbers shown in red are significantly different from one or more other generationsSource: U.S. Travel Association/Ypartnership, travelhorizonsTM, February 2011
More likely to do during next 6 months compared to last year
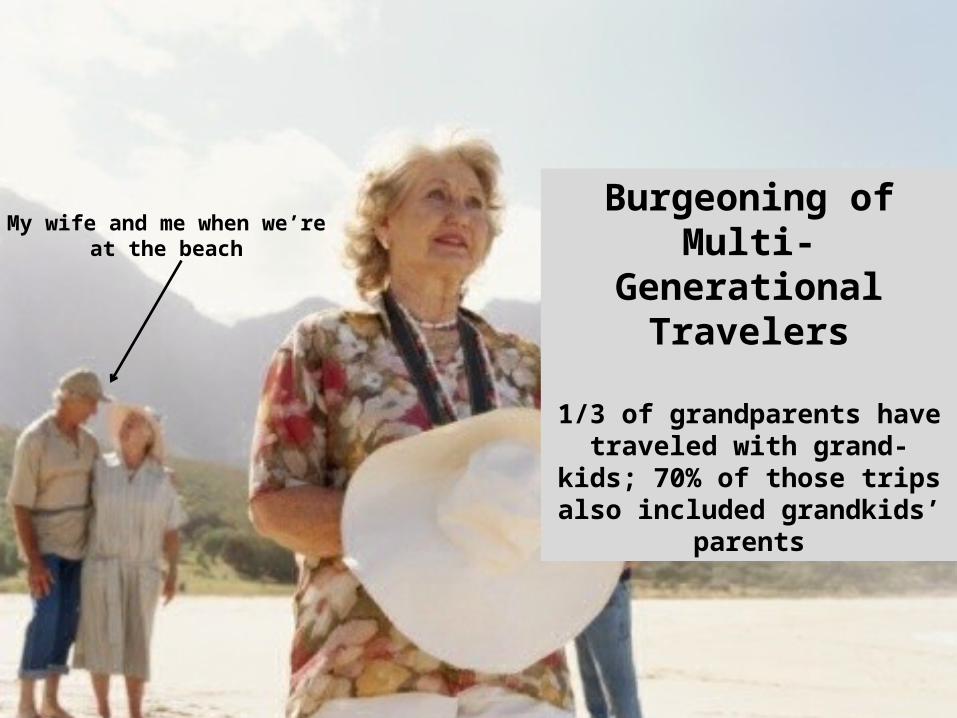
Burgeoning of Multi-Generational
Travelers
1/3 of grandparents have traveled with grand-kids; 70% of those trips also
included grandkids’ parents
My wife and me when we’reat the beach

Elusive value of social media…Not yet a trusted source for travel information
But can bring about revolutions.

Visited a Collective Buying Site for Travel Deals
Yes26%
No67%
Not Sure7%
Source: U.S. Travel Association/Ypartnership, travelhorizonsTM, July 2010
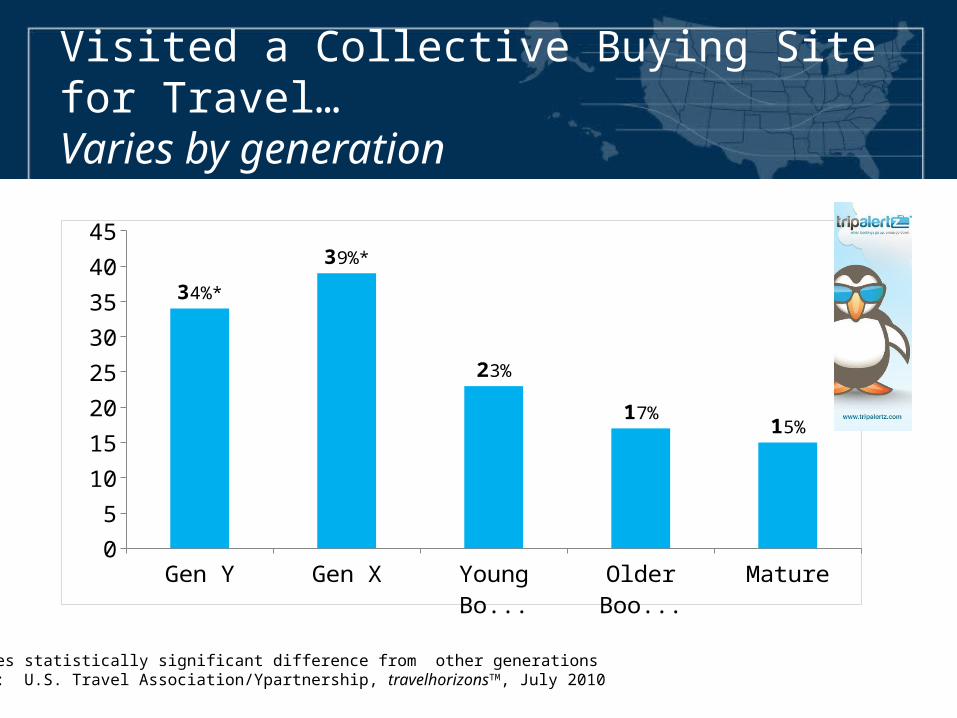
Visited a Collective Buying Site for Travel… Varies by generation
*Denotes statistically significant difference from other generationsSource: U.S. Travel Association/Ypartnership, travelhorizonsTM, July 2010
Gen Y Gen X Young Boomer
Older Boomers
Mature0
5
10
15
20
25
30
35
40
45
34%*
39%*
23%
17%15%

Travel Services Purchased on a Collective Buying Site… Lodging and food
Lodging Dining out Air travel Rental car Cruise Other0
10
20
30
40
50
42%
37%
24%
20%
8%
19%
Source: U.S. Travel Association/Ypartnership, travelhorizonsTM, July 2011

Hand-Held Mobile Devices…The next big step is already in the hands of consumers
• How consumers will purchase travel
• Make decisions while on the trip
• Adjust their routes to go off the beaten path
• Provides more flexibility

Travelers are Technology Users…But really distracted drivers
Access Internet From… 2010 2011
Cell phone that is a Smartphone such as an iPhone, BlackBerry, Palm, etc.
23% 32%*
A tablet computer such as an iPad, Samsung Galaxy Tab or HP Slate, etc.
NA 7%

Summary…sustained, but slow growth expected in 2011…and 2012 and 2013
DomesticLeisureVolume
DomesticBusinessVolume
InternationalVisitors
InternationalSpending*
2.4%1.2%
5.8%
10.0%
DomesticSpending
7.3%
*Excluding international airfaresSources: U.S. Travel Association; Oxford Economics/Tourism Economics; U.S. Department of Commerce-Office of Travel and Tourism Industries

There is light at the end of the tunnel…Stay around for the ride!

Ending on a High Note!
Sleep tight…and don’t let the bed bugs bite.

Concerns About Bed Bugs…Issue doesn’t seem to be going away
Very/ex-tremely
20%
Somewhat14%Not
very/not at all66%
Source: U.S. Travel Association/Ypartnership, travelhorizonsTM, July 2010
How concerned are you about being bitten by bed bugs in a forthcoming stay in a U.S. hotel or resort?

Bed Bug Concerns are Across the Board
Luxury/upscale Moderate Budget Homes of friends/relatives
0
5
10
15
20
25
30
35 33%
29%
25% 26%
Source: U.S. Travel Association/Ypartnership, travelhorizonsTM, July 2010
Level of concern about bed bugs by hotel segment stayed in past year

Concern is High…But incidence is low
Yes2%
No76%
Not Sure22%
Source: U.S. Travel Association/Ypartnership, travelhorizonsTM, July 2010
Ever stayed in a U.S. hotel or resort that had bed bugs?
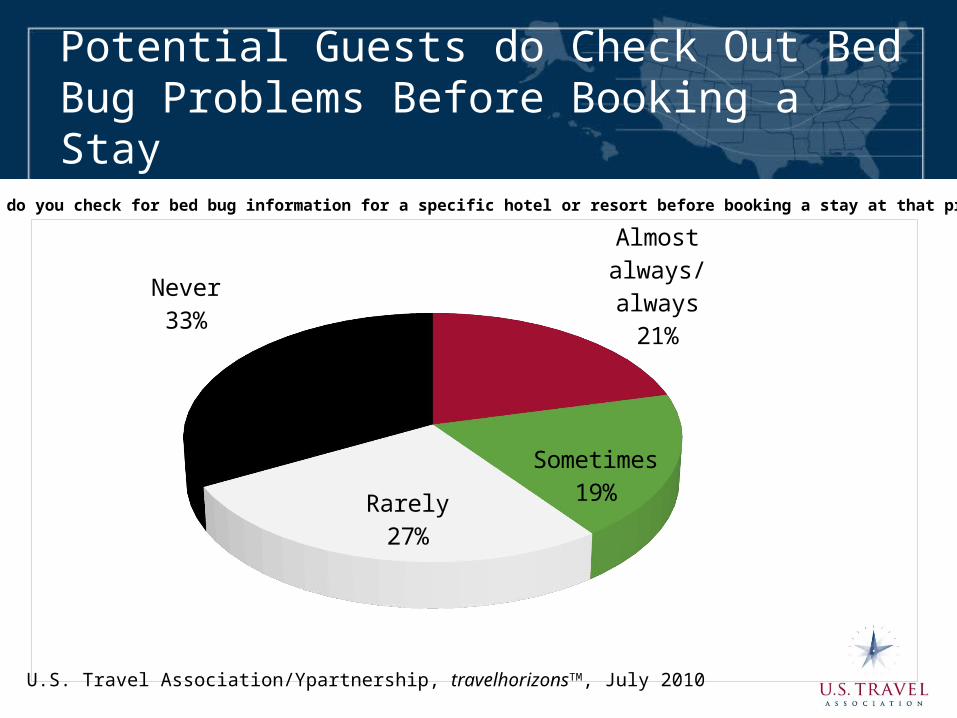
Potential Guests do Check Out Bed Bug Problems Before Booking a Stay
Almost always/always21%
Sometimes19%
Rarely27%
Never33%
Source: U.S. Travel Association/Ypartnership, travelhorizonsTM, July 2010
How often do you check for bed bug information for a specific hotel or resort before booking a stay at that property?

Being Proactive and Upfront May be Worth the Expense and Effort
More Likely52%
Just as Likely30%
Less Likely18%
Source: U.S. Travel Association/Ypartnership, travelhorizonsTM, July 2010
Are you more likely, less likely or just as likely to stay in a U.S. hotel or resort that was known to make pre-emptiveInspections of its guest rooms and public places for bed bugs and treated any problems that may have existed?

U.S. Travel Outlook…To keep you in the know

David SheatsleyDirector, Marketing Research