the long-term effects of genocide on social preferences...
TRANSCRIPT

1
The Long-term Effects of Genocide on Social Preferences and Risk*
Lata Gangadharan Asadul Islam
Chandarany Ouch Liang Choon Wang
March 17, 2017
Abstract
We conduct a lab-in-the-field experiment to examine the long-term effects of exposure to the Cambodian genocide (1975–1979) during childhood and adolescence on individuals’ prosocial and antisocial behaviours and risk preferences. Our identification strategy uses exogenous variations in the intensity of genocide across regions and individuals’ direct or indirect exposure to violence. Our results indicate that as the intensity of exposure to the genocide increases, individuals directly exposed to violence during childhood and adolescence become more antisocial and risk-seeking in the long term. Keywords: Civil Conflict, Khmer Rouge, Intensity of Exposure, Social Preferences, Risk, Field Experiment JEL Codes: C91, C93, D74 Affiliations: Department of Economics, Monash Business School, Monash University, Australia (Gangadharan, Islam and Wang); Cambodia Development Resource Institute, Cambodia (Ouch). Email addresses: [email protected]; [email protected]; [email protected]; [email protected]. Acknowledgements: We thank three anonymous referees and the editor at the Economic Journal, participants at the 2015 Australasian Development Economics workshop and the 2015 ESA World meetings and seminar audiences at Monash University for their helpful comments. Ethics (IRB) clearance for the project was obtained from Monash University. We are grateful for generous funding support from the Australian Research Council, AusAID (DFAT) and Monash University.

2
1 Introduction
There is a growing body of literature documenting the social costs of civil conflicts,
particularly their impacts on prosocial behaviours and preferences for risk. Preferences
relating to social behaviours and risk are fundamental building blocks for society. They
are perhaps especially important in societies with legacies of conflict, since social
organisations can take more complex forms in war-torn areas, potentially by changing
individuals’ motivations and behaviours. Most studies have focused on the impact of
the exposure to conflict on prosocial behaviours and risk preferences of adults shortly
after the end of conflict, and to date, the evidence has been inconclusive.1 What has yet
to be established in the literature is whether the impact of exposure to conflict on these
behaviours persists in the long term and, importantly, whether it also influences
antisocial behaviour. Being antisocial is a significant step away from being less
prosocial. Antisocial behaviours, such as violating social rules, being deceitful, thieving
and being reckless, reflect explicit decisions to harm others, sometimes even when such
actions create no obvious private or societal gain. We fill this gap in the literature by
focusing on the long-term impacts of conflict on a range of antisocial and prosocial
behaviours and risk preferences.
Violent and near-death experiences can alter survivors’ preferences and affect
long-term economic development. Social psychologists have documented the impacts
of exposure to violence during childhood and adolescence on a range of social and
behavioural outcomes, such as delinquency and aggression (Dubow et al., 2009;
Loeber, 1990; Miller et al., 1999; Slone et al., 1999). However, there is little evidence
of the impacts of conflict and exposure to violence on dishonesty and financially
vindictive behaviours. Dishonesty encourages corruption (Collier et al., 2003) and
creates fraud and inefficiencies that are harmful to development. Similarly, vindictive
behaviours in the form of financial sabotage are costly to the economy (Murphy, 1993).
Civil conflict and political violence can also change the risk preferences of those
affected. Specifically, traumatic experiences of violence can provoke feelings of anger
1 Some studies show that individuals more affected by violent conflicts tend to exhibit prosocial behaviours, such as trust, altruism (Gilligan et al., 2014; Gneezy & Fessler, 2012; Voors et al., 2012; Whitt & Wilson, 2007) and egalitarianism (Bauer et al., 2014), and to be more socially and politically engaged (Bellows & Miguel, 2009; Blattman, 2009; Gilligan et al., 2014). Cassar et al. (2013) and Rohner et al. (2013), on the other hand, highlight the negative consequences of exposure to conflict on trust, fairness and willingness to engage in impersonal exchanges. Risk preferences among individuals affected by war or political violence have also been examined (Callen et al., 2014; Jakiela & Ozier, 2015; Voors et al., 2012). We discuss this literature in more detail in Section 3.
3
or fear. Anger may encourage optimistic risk evaluations and risky choices. In contrast,
fear is more likely to cause risk avoidance (Callen et al., 2014; Lerner & Keltner, 2001).
In this paper, we conduct a lab-in-the-field experiment to examine the long-term
effects of exposure to genocide during childhood and early adolescence on prosocial
and antisocial behaviours and risk preferences in adulthood. To identify the effects of
exposure to genocide, we exploit geographical variations in intensity of exposure to the
Cambodian genocide and individuals’ direct and indirect experiences of violence
during this period. Under the Khmer Rouge (KR) regime (1975–1979), Cambodia
experienced one of the worst genocide events in human history, resulting in the deaths
of nearly two million people and leaving millions more traumatised. In this study, the
group of individuals directly exposed to the genocide comprises individuals who were
born before or during the KR regime (1960–1979 birth cohorts) and who reported
experiencing or witnessing violence during this period. The indirectly exposed group
consists of individuals who did not explicitly witness or experience this violence and
includes both individuals who were born before or during the KR regime and
individuals who were born after (1979–1982 birth cohorts). While these individuals did
not directly witness or experience violence, they were either present during the
genocide period or experienced its aftermath.2
Individuals from the directly and indirectly exposed groups participate in a
number of behavioural games. Specifically, the participants play trust, altruism, risk,
money-burning (financially vindictive) and self-reporting (dishonesty) games. We also
use extensive surveys to collect data on personal experiences during the KR period and
attitudes related to social capital. Finally, we use the Big Five Inventory to measure the
participants’ personality traits. To examine the sensitivity of our results, we also
consider different birth cohorts in the directly and indirectly exposed groups.
Unlike most of the prior studies in this field, our study focuses on the long-term
effects of different degrees of exposure to genocide during childhood and early
adolescence. The Cambodian genocide occurred approximately 32 to 39 years before
the individuals’ participation in the study, and our research strategy allows us to trace
its effects on these individuals depending on their personal exposure to the genocide
2 Our definition of levels of exposure builds on that proposed by Bauer et al. (2014) for the context of Sierra Leone. We use the Cambodian Genocide Database (CGD) on deaths of individuals in different regions to go a step further and exploit the geographical intensity of war. In sections 4.1 and 4.4, we explain in detail our definitions of direct and indirect exposure and intensity of exposure to genocide.

4
and the concentration of violence in their geographic locations. A number of
experimental studies show that individuals’ social preferences develop over the course
of childhood and adolescence (Eckel et al., 2011; Fehr et al., 2013; Harbaugh et al.,
2002; Sutter & Kocher, 2007; Sutter et al., 2013). Exposure to violent conflicts during
this crucial stage, during which much behavioural development takes place and after
which behaviour becomes less malleable, can have long-term repercussions.
We find that exposure to genocide during childhood and adolescence has
different long-term effects on social preferences and risk attitudes depending on the
intensity of the genocide and whether an individual is directly or indirectly exposed to
violence. In particular, the results of our field experiment show that direct exposure to
violence in areas with more intensive killings led to more financially vindictive, selfish
and risk-seeking behaviours, whereas indirect exposure to violence in areas with more
intensive killings made individuals less dishonest.
The main findings of the experiment are robust across a variety of sensitivity
checks and specifications. In particular, we demonstrate that our results are not affected
by any differences in the observed characteristics, such as age or education. Our results
are also robust to alternative assumptions about the reliability of early childhood
memory, the inclusion (or not) of post-genocide birth cohorts and the inclusion (or not)
of controls for post-genocide relocation.
This study provides unique insights into the lasting effects of war on social
behaviours and risk. It builds on recent evidence that civil conflicts can have adverse
effects on the social behaviours of affected individuals and contributes to the literature
in a number of ways. First, whereas the existing literature focuses on the impact of
recent civil conflicts, this study of the Cambodian genocide enables us to examine the
long-term (30 years after the genocide ended) impact on social behaviours and risk.
Second, despite some evidence on the link between civil conflicts and prosocial
behaviours and risk preferences, little is known about antisocial preferences resulting
from direct exposure to civil conflict. Our findings, therefore, contribute to current
knowledge by showing that direct and greater exposure to genocide during childhood
and early adolescence makes individuals significantly more vindictive and
opportunistic later in life. Indirect exposure, on the other hand, leads to less dishonesty.
Specifically, as the intensity of exposure increases, the difference between the directly
and the indirectly exposed tends to increase, such that individuals who are not directly
exposed tend to become less dishonest. Third, by isolating the direct and the indirect

5
effects of exposure to genocide and interacting them with the geographical intensity of
the genocide, we differentiate between different types of war experiences of children
and how these experiences impact long-term behaviour.
The paper proceeds in the following way. In Section 2, we provide a brief
background of the genocide in Cambodia. In Section 3, we present a conceptual
framework that relates conflict with social preferences and risk and informs our
research design and hypotheses. Section 4 discusses the research strategy. Sections 5
and 6 report the results, and Section 7 concludes.
2 Background of the Cambodian Genocide
Between April 1975 and January 1979, Cambodia suffered a period of genocide under
the KR regime which was characterised by massive destruction, violence, torture and
death. The KR attempted to impose an extreme form of Maoist communism and build
a new Cambodia based on an agrarian model. To achieve this goal, the KR aimed to
destroy traditional Cambodian social norms, cultures, religions, organisations,
networks and even family structures (Collier et al., 2003). The regime closed schools,
hospitals, and factories, abolished banking, finance and currency, isolated the country
from all foreign influences and barred Western medicine (UNESCO, 2011). It banned
all religions, and people seen taking part in religious rituals or services were executed.
The KR also confiscated all private property and relocated people from urban areas to
collective farms through agricultural labour.
The regime forced people to live in communal work camps under the control of
the Angka (organisation) with extremely strict rules and policies and no freedom of
movement. Under the KR regime, most Cambodians had to work long hours each day
with insufficient food, no material rewards, limited access to their spouses and children
and very little free time (Chandler, 2008). At the age of eight, most children were sent
to live with other children, supervised by two or three senior KR officials. Community
and family members were encouraged to spy and report on each other, which destroyed
trust and established deeply rooted fear (Collier et al., 2003). During its four years in
power, the KR executed select groups it believed to be enemies of the state. KR cadres
carried out arbitrary executions and torture against perceived subversive elements. The
KR also targeted and killed suspected political opponents, educated individuals,
individuals from high social and professional classes and individuals who did not share

6
the KR vision for a new Cambodia. To avoid being targeted, people hid their identities
and tried to be as inconspicuous as possible.
According to the Cambodian Genocide Database established by Yale
University, approximately 1.4 million Cambodians (approximately 21% of the
country’s population) were killed or died from starvation or exhaustion during the KR
regime. The intensity of the killing and death differed across regions of Cambodia
(Islam et al., 2017). Adult males were the demographic group most likely to die (de
Walque, 2006). Many Cambodians who survived this period were either direct victims
of the regime or witnessed violence during the KR’s rule. They experienced threats to
and the loss of loved ones and faced prolonged parental absence.
3 Conflict, Social Preferences and Risk
In this section, we draw on theories and evidence from studies across different
disciplines to understand how exposure to extreme events, such as conflicts, war and
genocide, can affect individuals’ behaviours. The discussion informs the research
design and identifies outcome measures of interest.
Studies of the psychological and epidemiological literature indicate that direct
exposure to violence or stress and trauma due to fear of loss, torture or violence during
childhood and adolescence can influence individuals’ behaviours and development
either by provoking aggression and negative social behaviours or by subduing positive
social behaviours. For example, Bandura’s (1973) social learning theory suggests that,
during wartime, children may learn aggressive behaviours by observing the violence
committed by others, who are often aggressive “role models” perceived as national
heroes (Kerestes, 2006). Similarly, Huesmann’s (1988) social information-processing
theory suggests that children may become more aggressive during wartime given the
abundance of stimuli perceived to be threatening, leading to aggressive behavioural
responses (Kerestes, 2006). Dubow et al. (2009) argue that the constant threat of losing
loved ones or being killed during wartime can have contemporaneous and long-term
impacts on affected children’s mental wellbeing and aggressive behaviours.
The empirical evidence supporting these theories is, however, inconclusive.
Using survey evidence from classroom assessments, Kerestes (2006) finds that
children’s direct exposure to violence in Croatia increased their aggressive behaviour
and decreased their prosocial (altruistic) behaviour. Using clinical case studies,
McAuley and Troy (1983) report that children affected by riots in urban areas of

7
Northern Ireland experienced higher rates of antisocial behaviour. Farver and Frosch
(1996) find that children exposed to the Los Angeles riots of 1992 included more
aggressive words and thematic content in stories than similar children from other parts
of the country who had no direct exposure to the riots. Evidence to the contrary also
exists. For example, Raboteg-Saric et al. (1994) report that after the war in Croatia,
children showed increased prosocial tendencies in classroom surveys that elicited
instances of sharing, comforting and helping each other and exhibited no change in
instances of aggressive verbal or physical behaviours. The differences in these studies
findings’ could be due to differences in the intensity of the children’s exposure to
violence and whether the exposure was direct or indirect, aspects that we focus on in
our research. It is also unclear whether behavioural changes persist into adulthood or
manifest in other forms of antisocial behaviours.
In the realm of antisocial behaviours, we consider acquisitive aggression,
destructive envy and dishonesty, since the Cambodian genocide (like other similar civil
conflicts) created many opportunities to aggravate these behaviours. Envious attitudes
are pervasive in all societies and can impact decision-making (Beckman et al., 2002).
In particular, destructive envious behaviour, which involves decreasing others’
outcomes even at a cost for oneself, can be harmful to the operation of competitive
markets and can impede innovation and economic development. Similarly, dishonesty
encourages corruption, which is well documented to be harmful to development. To
survive in an environment of civil conflict, such as during the KR, people must often
hide and lie about their families’ backgrounds and identities. Once an honest reputation
is lost, the incentive for honest behaviour in the future is greatly weakened (Collier et
al., 2003). Thus, we conduct a dictator game with taking options, a money-burning
game and a self-reporting game to elicit behaviours of opportunistic taking, destructive
envy and dishonesty. We then test whether different levels of exposure to genocide
under the KR regime are associated with these forms of antisocial behaviours, which
have not been examined in past studies.
A few studies, primarily in the economics and political science literature,
examine the impact of violence and conflict exposure on prosocial preferences and
show mixed findings. Some indicate that experiences of war and threats may lead to
more cooperative, prosocial behaviour as a result of increased empathy for victims.
Sympathy may also evolve from a sense of connectedness with others. Groups with a
shared fate may experience mutual identification, which can become a source of

8
support. Gneezy and Fessler (2012) argue that violent intergroup conflict elicits
behaviours that enhance intra-group cooperation and strengthen the group’s chances of
victory. Bauer et al. (2016) conducted a meta-analysis of nearly 20 studies from more
than 40 countries to re-analyse and weigh different theoretical explanations (economic,
social and psychological mechanisms), finding a strong, persistent pattern of a positive
legacy of war in terms of local cooperation and civic engagement. This pattern is
observed primarily among adults—and, in some circumstances, children—who were
exposed to violence. 3 Individuals affected by conflict are observed to be more
politically and socially engaged (Gilligan, Pasquale, & Samii, 2014; Bateson, 2012;
Blattman, 2009; Bellows & Miguel, 2009).4 Voors et al. (2012) find that adults who
were directly exposed to violence or who lived in communities that were violently
attacked during the civil war in Burundi display more altruistic giving to members of
their communities. Cassar et al. (2013), on the other hand, show that a greater intensity
of direct exposure to violence during the civil war in Tajikistan lowers trust within
communities and decreases willingness to engage in impersonal exchange. They argue
that exposure to conflicts and violence may reduce prosocial behaviours towards out-
group in inter-ethnic or inter-group conflicts or even towards members of own
communities when group allegiances are not easily observable, a feature of the civil
war in Tajikistan. The Cambodian genocide was primarily an intra-ethnic genocide.
The KR regime encouraged people to spy upon and sabotage each other, potentially
eroding such prosocial preferences as trust and altruism. The consequences of being
reported to the regime were often torture and death. Survivors, hence, frequently
developed tendencies towards mistrust and selfishness. We conduct a dictator game
with giving and a trust game to examine trust and altruism within our sample.
Numerous studies also demonstrate that exposure to conflict and violence
influence risk-taking behaviours, since risk attitudes are determined by both individual
3 Bauer et al. (2014) played games with children in Georgia six months after the end of the war between Russia and Georgia over South Ossetia. They ran the same games among adults in Sierra Leone following an 11-year civil war that ended in 2002. They find that greater exposure to war shifted people's motivations toward greater equality for members of their own groups. Those participants who had been affected by war were more willing to sacrifice both their own payoffs and those of their groups to reduce inequality if their partners were from the same village or school. Based on these results, Bauer et al. (2014) argue that exposure to war affects human psychology in specific ways. If the war experience takes place during a sensitive window in development between early adulthood and adolescence, then it leaves an enduring mark. 4 A number of studies in other related contexts, such as post-election violence (Becchetti, Conzo, & Romeo, 2014) and earthquake and tsunami damage (Caló-Blanco, et al., 2015; Cassar, Healy, & Von Kessler, 2011; Rao et al., 2011), also find that survival threats tend to enhance local cooperation.

9
(e.g., personality, cognitive ability, genetics and emotions) and environmental (e.g.,
friends, parents and learning circumstances) factors (Kim & Lee, 2014). A number of
recent studies show that adults’ risk preferences are altered by traumatic experiences,
which can trigger fear and/or anger; however, evidence showing the direction of this
impact is mixed. Callen et al. (2014) argue that fearful recollections induce more
pessimistic likelihood judgements and find evidence consistent with this in
Afghanistan. Another study finds an association between self-reported fear and less
risky decisions (Lerner & Keltner, 2001). Jakiela and Ozier (2015) show that
experiencing Kenya’s post-election violence sharply increased risk aversion. Sacco et
al. (2003) find that after the 9/11 terrorist attack, individuals (in a different country)
who were not directly exposed to the attacks made more conservative and less risky
decisions. Voors et al. (2012), on the other hand, find that exposure to violence during
the civil war in Burundi increased risk-seeking behaviours. Both fear and anger are
drivers for risk evaluations in violent settings, and both figure prominently in the
Cambodian genocide. We examine whether different levels of exposure to genocide
under the KR regime are associated with differences in risk preferences using a risk
elicitation task.
Though adverse effects on antisocial behaviours as a result of exposure to the
Cambodian genocide during childhood and early adolescence are expected based on
other findings in the psychology literature, it is a priori unclear whether we will observe
effects on opportunistic taking and destructive envious behaviours, whether these
effects persist into adulthood decades after initial exposure and whether the effects
differ by the intensity and type of exposure. Similarly, it is empirically unknown
whether individuals’ prosocial and risk preferences are influenced by the intensity and
type of exposure to violence they experienced as children and adolescents decades ago
during the Cambodian genocide. 5 We hypothesise that both the severity and the
proximity type (i.e., direct or indirect) of exposure to the Cambodian genocide
influence a person’s social and risk preferences, resulting in significantly different
revealed behaviours. We use the intensity of genocide at the district level interacted
with the direct exposure measure to estimate how the extent of exposure differentially
affected the directly and indirectly exposed groups. This allows us to examine the
5 Previous studies generally focus on the impact of exposure to violence on prosocial and risk preferences, and the findings are mostly inconclusive. We focus on the intensity of the exposure and on whether an individual is directly or indirectly exposed to violence.

10
differential impact of exposure to the Cambodian genocide and constitutes a significant
contribution to the literature.
4 Research Design
4.1 Selection of Sample
We conducted the field experiment during February 2014 in several locations: Phnom
Penh, Cambodia’s capital city, and six rural districts in Cambodia’s Kampong Cham
province.6 The districts were selected from a list of districts in the Cambodian Genocide
Database (CGD), which includes a district identifier for each KR mass gravesite and
the estimated number of bodies in each mass grave.7 Conducting the experiment in both
Phnom Penh and a number of rural districts with a range of KR mortality rates allows
us to obtain a sample of individuals who were directly and indirectly exposed to
different degrees of violence during the Cambodian genocide.
In all locations, participants were required to meet the age criterion (born
between 1960 and 1982). In addition, we aimed for gender balance and socioeconomic
diversity. During the recruitment process, participants were informed that they would
be involved in decision making in different contexts and that they would be paid based
on their decisions. A total of 492 adults born between 1960 and 1982 participated in
the study.
4.2 Experiment Design
Our main outcome variables are drawn from incentivised experimental games. To
measure prosocial and antisocial behaviours and risk preferences, we conduct trust,
dictator, risk, money burning, and self-reporting games. The trust game, for example,
elicits the degree to which participants can trust one another and the extent of their
trustworthiness. We conduct the dictator game in two stages. The dictator game with
giving is designed to measure the extent of altruism among participants, which might
indicate their concern for the well-being of others (rather than self-interest). The
6 Kampong Cham is one of the five largest provinces in Cambodia based on population and is 123 km from Phnom Penh. 7 The database was developed by Yale University and has been updated by the Documentation Center of Cambodia (DC-Cam). We use both information from the original Yale database and data on additional mass gravesites and estimates of death numbers from the DC-Cam updates. For details on the original Yale database and the Cambodian Genocide Program, see http://www.yale.edu/cgp/ and http://www.d.dccam.org/Database/Index1.htm for data kept by DC-Cam.

11
dictator game with the option to give or take indicates opportunism and selfishness. The
risk task measures risk-taking behaviours. The money-burning game is designed to
understand participants’ inclinations to destroy, at a cost, other players’ payoffs. The
self-reporting game, which uses a simple task and requires participants to pay
themselves when there is no probability of being detected for over-payment, can be
interpreted as an indicator of dishonesty. These games have been used extensively in
the extant literature in this field. We briefly describe the games below. We also detail
the design and procedure used in each game in Appendix A and present the instructions
seen by the participants in Appendix B.
We use the trust game (introduced by Berg et al., 1995) protocol in which each
participant plays as both player 1 (sender) and player 2 (receiver) and is matched with
different participants in each role. In the first stage, all participants are senders and can
send any positive amount x of the total endowment to an anonymous receiver, knowing
that the experimenter triples the amount sent, such that the receiver receives an amount
of 3x. In the second stage, all participants play as receivers. To reduce logistical issues
in the field, each receiver decides on an amount y of 3x to return to the sender for all
the corresponding amounts the receiver might receive. The sender is only informed of
the amount sent back by the receiver if the game is selected for final payment.
In the dictator game, there are two stages: 1) giving and 2) giving or taking (List,
2007). Each participant plays as both player 1 (dictator) and player 2 (recipient). All
participants receive an initial endowment. The dictator receives an additional
endowment, while the recipient does not. In the dictator game with giving, the dictator
can transfer any positive amount x of the additional endowment to the anonymous
recipient. The recipient must simply accept it and is only informed of how much the
dictator sends if the game is selected for the final payment. In the dictator game with
giving or taking, the dictator can send the additional endowment to other players or take
other players’ initial endowments. This means that the dictator can send either a
negative amount or a positive amount. As in stage 1, the recipient is only told the
amount the dictator sends or takes if the game is selected for final payment.
To elicit risk preferences, we use a simple risk task with a 50% chance of
winning or losing (Gneezy & Potters, 1997). Each participant receives an endowment
and can invest any positive amount in a risky business. The investment yields triple the
amount invested with 50% probability and nothing with 50% probability. The outcome
is decided by tossing a coin.

12
To capture envious and financially vindictive behaviours, we use a simpler two-
player version of the money-burning game developed by Zizzo and Oswald (2001).
Participants simultaneously decide how much, if any, of the other player’s total
endowment to eliminate. Participants must pay from their own endowment to eliminate
the other player’s endowment. The fee incurred for eliminating the other’s endowment
is charged at three levels: 5, 10 and 20% of the amount of the other player’s endowment
a player wants to eliminate.
Attitudes towards dishonesty are measured using a variant of the self-reporting
matrix task (Mazar et al., 2008). We design a simple task with pictures instead of
numerical or word tasks to accommodate Cambodia’s low literacy level. The task
involves finding the picture of a star on a sheet with 10 tables, each of which has 9
images (see Appendix B). Each participant is given an envelope containing a sheet of
10 tables and is instructed to find the stars within one minute and pay themselves
accordingly. To ensure that there are considerable and different opportunities for
cheating, not all of the 10 tables have a star. We design two different sheets: a sheet
with 7 stars in the 10 tables and a sheet with only 4 stars in the 10 tables. These
maximum numbers are not known to the participants. The maximum number of either
4 or 7 stars per sheet allows considerable scope for cheating, even for top performers.
After completing all of the experimental games, participants are requested to
complete a survey questionnaire. The survey covers information about participants’
personal characteristics and experiences during the KR period and includes attitudinal
questions and 10 questions relating to personality traits. Participants with limited
reading and writing abilities are interviewed.8
We set different endowments and participation fees for Phnom Penh and for the
rural areas in Kampong Cham province. In Phnom Penh, the endowment and
participation fees are set to twice those of the rural areas, since the average earnings of
workers in Phnom Penh (based on CSES, 2011) are approximately twice those of
workers in rural areas.
8 The attitudinal questions and personality measures used are discussed in Appendix C. These do not vary significantly with the intensity of genocide exposure for either the directly exposed group or the indirectly exposed group. Our main results from the experimental games are robust to using these measures as control variables.

13
4.3 Measures of Genocide Exposure
We use a number of measures of genocide exposure. First, we ask participants born
between 1960 and 1979 two questions in the survey: “Did you ever see or experience
physical torture during the KR regime?” and “Did you ever see someone killed during
the KR regime?” If the response to either of these two questions is ‘yes’, we classify an
individual as having been directly exposed to the Cambodian genocide. Roughly 55%
of those who were born before or during the KR regime (born between 1960 and 1979),
or 40% of the overall sample, responded positively to this question. Note that
individuals who were not directly exposed to the genocide were, by construction,
indirectly exposed to it, since they were either present during the genocide period or
experienced the genocide’s aftermath. These individuals include those born after the
KR regime ended and those who responded ‘no’ to the question above.
Second, the Cambodian Genocide Database (CGD) provides information about
the intensity of the Cambodian genocide in various areas of Cambodia, which allows
us to construct a district-level measure of the intensity of genocide exposure. The
construction of this measure is detailed in Islam et al. (2017).9 Briefly, to construct
district-level KR mortality rates, we divide the estimated deaths under the KR in a given
district (based on information from the CGD) by the sum of the total estimated deaths
under the KR, the number of living individuals (based on Census 1998 data) residing
in each district at the beginning of the KR regime (1975) and the number of living
individuals (based on Census 1998 data) born in each district during the KR period.10
The geographical distribution of KR mortality rates (shaded blue) is illustrated in Figure
1. According to the information available in the CGD, KR mortality rates in the 145
districts fall between 0 and 0.857. For districts in five provinces (Kaoh Kong, Preah
Vihear, Otdar Mean Chey, Krong Kaeb and Krong Pailin; shaded white in Figure 1),
no information is available in the CGD.11
9 Islam et al. (2017) examine the intergenerational impact of KR mortality on children’s outcomes through its effects on gender imbalances and the marriage market. 10 Since we do not have information on the number of individuals who survived the KR regime but died between 1980 and 1998 at the district level, the estimated KR mortality rates are noisy. Note that we are able to identify districts of residence both in 1975 and at birth because Census 1998 contains information regarding birth district, years of residence in current district and previous district of residence. Islam et al. (2017) show that alternative ways of constructing mortality rates do not differently affect the estimated impact of KR mortality rates on education, earnings, fertility and health measures. 11 Only three participants in our sample were in these provinces during the KR regime. We assume that the intensity of genocide they faced during the KR regime was zero. The results are not sensitive to dropping these participants from the sample or using the genocide intensities of the districts in which they currently live.
14
[Figure 1]
Since we ask participants whether they have lived in the same district since birth
and, if not, in which district they resided during the KR regime, we are able to link the
direct exposure measure with the intensity of exposure measure, as well as to construct
an intensity of indirect exposure measure. Thus, among those individuals who were
exposed directly to violence, we can estimate the impact using the intensity of the direct
exposure. Among those individuals who were not exposed directly to violence, the
intensity of exposure measure enables us to estimate the impact of the extent to which
they were indirectly exposed to the genocide (e.g., through family members, neighbours
and so on).
4.4 Exogenous Variations in Violence Exposure
Table 1 reports summary statistics of participants’ demographic characteristics and t-
tests of the means between those who were directly exposed and those who were not.
A broad balance is achieved across a variety of demographics, including gender, marital
status and ethnicity. The directly exposed group (n = 196) and the indirectly exposed
group (n = 296) do not differ in their intensities of genocide exposure or their
background demographics, except for age, gender and education, as shown in column
6. Table 1 also shows the representativeness of the sample by comparing the
demographic characteristics of the experiment sample to data from the 2011 Cambodia
Socio-economic Survey (CSES 2011). The characteristics of respondents of the two
samples are similar, as indicated by column 8 of Table 1.
[Table 1]
The mortality rate in an individual’s district of residence during the KR regime
is, on average, 22.1% for a directly exposed individual and 21.5% for an indirectly
exposed individual (p = 0.65). This result means that a person’s type of exposure (i.e.,
direct or indirect) to a high level of violence is fairly random. The average ages of the
directly exposed group and the indirectly exposed group are approximately 48 and 39,
respectively (p = 0.000). Individuals in the directly exposed group are more likely to
be male (55.6%) than female (39.5%) (p = 0.0004). The average years of schooling of
the directly exposed group and the indirectly exposed group are six and eight years,
respectively (p = 0.000). These differences are not surprising, since older individuals
are more likely to directly experience and remember violence due to being exposed to
the KR regime for a longer period of time and having more mature memories at the

15
time of exposure. 12 Similarly, as Islam et al. (2016) show, education and age are
positively correlated because the civil conflict and genocide in Cambodia disrupted
schooling. It is also reasonable that males are more likely to be directly exposed to
violence given past findings by de Walque (2006), Islam et al. (2017) and Neupert and
Prum (2005), who show that males were the demographic group most likely to die
under the KR regime. In our regression analysis, we control for these differences and
examine the robustness of our results to excluding age and education as control
variables. The percentage of married participants is approximately 87% in the directly
exposed group and 82% in the indirectly exposed group (p = 0.144). The majority of
participants in the experiment are from the Khmer ethnic group (99% in the directly
exposed group and 99.7% in the indirectly exposed group, p = 0.342). Only a small
number of Cambodian Muslims participate in the experiment.
[Table 2]
Table 2 demonstrates that the variation in the intensity of the genocide across
districts is exogenous by showing that district-level KR mortality rates are uncorrelated
with a range of proxies for pre-KR social and economic conditions. In particular,
Census 1962 and geographical information system data allow us to construct the
following proxies for pre-KR social and economic conditions: the (1) pre-KR sex ratio,
(2) pre-KR population density and (3) geographical distance of a district to an urban
centre.13 The estimates in panel A are based on the full sample of districts for which
the GCD provides mortality figures. The estimates in panel B are based on the sample
of districts in which the participants in this study resided during the KR period. Both
panels show that the 1962 sex ratios are unrelated to the KR mortality rates at the district
level (column 1). The KR mortality rates are also not correlated with various measures
of 1962 population density (columns 2 through 4). Similarly, district mortality rates
under the KR are not correlated with distance from the provincial capital (column 5).
Panel C shows that the variables used to test for exogeneity in panels A and B are indeed
correlates of the current economic, educational and health outcomes of older adults who
were excluded from our sample selection criteria. Thus, taken together, the evidence
12 The number of retained memories of an event increases with an individual’s age at the time of the event, and mature memories begin forming around the age of seven (Howe, 2013). 13 The General Population Census 1962 provides data on commune-level population by gender. First, we match the commune codes in Census 1962 with the district codes in Census 1998. Next, we match the commune-level population with the district-level population based on the district codes in Census 1998. To merge Census 1962 with the CGD, we replace the sex ratios and population densities for district codes not available in Census 1962 with neighbouring districts’ sex ratios and population densities.

16
from panels A, B and C suggests that geographical variations in KR mortality are likely
exogenous.
5 Results
5.1 Descriptive Analysis
In this section, we present the average behaviours observed in the experimental games
of the directly exposed groups and the indirectly exposed groups, separated according
to degree of exposure to violence during the KR regime, in order to examine whether
this exposure affected the outcome measures.14
For simplicity, we classify intensity of violence exposure into three categories
based on the distribution of KR death rates within our sample. The first is the low
intensity category, in which KR mortality rates fall between the 0th and 33rd percentile.
The second is the medium intensity category, in which KR mortality rates fall between
the 33rd and the 67th percentile. The third is the high intensity category areas, in which
KR mortality rates are in the 67th percentile or above. This categorisation allows us to
clearly demonstrate the impact of the intensity of exposure to violence before delving
into the richer and more continuous variation in the intensity measure in a regression
framework.
We construct nine outcome variables from the experimental games described
above. The first is a variable for trust, measured by the percentage sent to other players
in the trust game. The second is a variable for trustworthiness, measured by the
percentage returned from other players in the trust game. The third is a variable for
altruism, measured by the percentage given to other players in the dictator game. The
fourth is a variable for opportunistic taking, which takes the value of 1 if an individual
takes some or all of the other player’s endowment in the dictator game. The fifth is a
variable for risk preferences, captured by the percentage of endowment a person invests
in the risk game. The sixth is a variable for vindictive behaviour, measured by a dummy
variable that takes the value of 1 if a person burns other players’ money for at least one
of the three prices of burning (5, 10 or 20%) in the money-burning game. The seventh
is a binary variable measuring dishonesty, which takes the value of 1 if a participant
takes more money than that to which he or she is entitled.
14 Since the estimated effects using survey measures of attitudes and personality traits as outcome measures do not differ significantly across the two groups with respect to intensity, we report them in Appendix C.

17
We also construct a simple index for prosocial and antisocial behaviour using
the approach outlined by Gneezy, Leibbrandt and List (2016). The index for prosocial
behaviour is composed of participants’ behaviours in three experiments (amount sent
in the trust game, total amount returned in the trust game for all possible levels of trust
and amount sent in the dictator game with giving), as follows:
𝐼𝐼𝐼𝐼𝐼𝐼𝐼𝐼𝐼𝐼𝐼𝐼𝐼𝐼𝐼𝐼𝐼𝐼𝐼𝐼 𝑝𝑝𝑝𝑝𝑝𝑝𝑝𝑝𝑝𝑝𝑝𝑝𝐼𝐼𝐼𝐼𝐼𝐼 𝑏𝑏𝑏𝑏ℎ𝐼𝐼𝐼𝐼𝐼𝐼𝑝𝑝𝑝𝑝 𝐼𝐼𝐼𝐼𝐼𝐼𝑏𝑏𝑖𝑖
= �13�
𝐼𝐼𝑎𝑎𝑝𝑝𝐼𝐼𝐼𝐼𝑎𝑎 𝑝𝑝𝑏𝑏𝐼𝐼𝑎𝑎 𝐼𝐼𝐼𝐼 𝑎𝑎𝑝𝑝𝐼𝐼𝑝𝑝𝑎𝑎 𝑔𝑔𝐼𝐼𝑎𝑎𝑏𝑏𝑎𝑎𝐼𝐼𝑖𝑖𝐼𝐼𝑎𝑎𝐼𝐼𝑎𝑎 𝐼𝐼𝑎𝑎𝑝𝑝𝐼𝐼𝐼𝐼𝑎𝑎 𝑝𝑝𝐼𝐼𝑏𝑏 𝑝𝑝𝑝𝑝𝐼𝐼𝐼𝐼𝐼𝐼 𝑝𝑝𝑏𝑏𝐼𝐼𝐼𝐼
�
+ 13�𝐼𝐼𝐼𝐼𝐼𝐼 𝑝𝑝𝑝𝑝𝑝𝑝𝑝𝑝𝐼𝐼𝑏𝑏𝐼𝐼𝑏𝑏 𝐼𝐼𝑎𝑎𝑝𝑝𝐼𝐼𝐼𝐼𝑎𝑎 𝑝𝑝𝑏𝑏𝑎𝑎𝐼𝐼𝑝𝑝𝐼𝐼𝑏𝑏𝐼𝐼 𝐼𝐼𝐼𝐼 𝑎𝑎𝑝𝑝𝐼𝐼𝑝𝑝𝑎𝑎 𝑔𝑔𝐼𝐼𝑎𝑎𝑏𝑏𝑎𝑎𝑝𝑝𝑎𝑎𝐼𝐼𝐼𝐼 𝑝𝑝𝑝𝑝𝑝𝑝𝑝𝑝𝐼𝐼𝑏𝑏𝐼𝐼𝑏𝑏 𝐼𝐼𝑎𝑎𝑝𝑝𝐼𝐼𝐼𝐼𝑎𝑎 𝑝𝑝𝐼𝐼𝑏𝑏 𝑝𝑝𝑝𝑝𝐼𝐼𝐼𝐼𝐼𝐼 𝑝𝑝𝑏𝑏𝑝𝑝𝑏𝑏𝐼𝐼𝐼𝐼𝑏𝑏
�
+13�𝐼𝐼𝑎𝑎𝑝𝑝𝐼𝐼𝐼𝐼𝑎𝑎 𝑝𝑝𝑏𝑏𝐼𝐼𝑎𝑎 𝐼𝐼𝐼𝐼 𝐼𝐼𝐼𝐼𝑝𝑝𝑎𝑎𝐼𝐼𝑎𝑎𝑝𝑝𝑝𝑝 𝑔𝑔𝐼𝐼𝑎𝑎𝑏𝑏 𝑔𝑔𝐼𝐼𝐼𝐼𝐼𝐼𝐼𝐼𝑔𝑔𝑎𝑎𝐼𝐼𝑖𝑖𝐼𝐼𝑎𝑎𝐼𝐼𝑎𝑎 𝐼𝐼𝑎𝑎𝑝𝑝𝐼𝐼𝐼𝐼𝑎𝑎 𝑝𝑝𝐼𝐼𝑏𝑏 𝑝𝑝𝑝𝑝𝐼𝐼𝐼𝐼𝐼𝐼 𝑝𝑝𝑏𝑏𝐼𝐼𝐼𝐼
�� × 100
The index for antisocial behaviour correspondingly comprises the behaviours
in the dictator game with opportunities for giving or taking, the money-burning game
and the dishonesty games, as follows:
𝐼𝐼𝐼𝐼𝐼𝐼𝐼𝐼𝐼𝐼𝐼𝐼𝐼𝐼𝐼𝐼𝐼𝐼𝐼𝐼 𝐼𝐼𝐼𝐼𝑎𝑎𝐼𝐼𝑝𝑝𝑝𝑝𝑝𝑝𝐼𝐼𝐼𝐼𝐼𝐼 𝑏𝑏𝑏𝑏ℎ𝐼𝐼𝐼𝐼𝐼𝐼𝑝𝑝𝑝𝑝 𝐼𝐼𝐼𝐼𝐼𝐼𝑏𝑏𝑖𝑖
= �13�𝐼𝐼𝑎𝑎𝑝𝑝𝐼𝐼𝐼𝐼𝑎𝑎 𝑎𝑎𝑝𝑝𝑝𝑝𝑡𝑡 𝐼𝐼𝐼𝐼 𝐼𝐼𝐼𝐼𝑝𝑝𝑎𝑎𝐼𝐼𝑎𝑎𝑝𝑝𝑝𝑝 𝑔𝑔𝐼𝐼𝑎𝑎𝑏𝑏 𝑔𝑔𝐼𝐼𝐼𝐼𝐼𝐼𝐼𝐼𝑔𝑔/𝑎𝑎𝐼𝐼𝑡𝑡𝐼𝐼𝐼𝐼𝑔𝑔
𝑎𝑎𝐼𝐼𝑖𝑖𝐼𝐼𝑎𝑎𝐼𝐼𝑎𝑎 𝐼𝐼𝑎𝑎𝑝𝑝𝐼𝐼𝐼𝐼𝑎𝑎 𝑝𝑝𝐼𝐼𝑏𝑏 𝑝𝑝𝑝𝑝𝐼𝐼𝐼𝐼𝐼𝐼 𝑎𝑎𝐼𝐼𝑡𝑡𝑏𝑏�
+ 16�𝑎𝑎𝑝𝑝𝑎𝑎𝐼𝐼𝐼𝐼 𝐼𝐼𝑎𝑎𝑝𝑝𝐼𝐼𝐼𝐼𝑎𝑎𝑝𝑝 𝑏𝑏𝐼𝐼𝑝𝑝𝐼𝐼𝑎𝑎 𝑝𝑝𝑜𝑜 𝑎𝑎ℎ𝑏𝑏 𝑎𝑎ℎ𝑝𝑝𝑏𝑏𝑏𝑏 𝑝𝑝𝑝𝑝𝐼𝐼𝑝𝑝𝑏𝑏𝑝𝑝 𝐼𝐼𝐼𝐼 𝑎𝑎𝑝𝑝𝐼𝐼𝑏𝑏𝑚𝑚 𝑏𝑏𝐼𝐼𝑝𝑝𝐼𝐼𝐼𝐼𝐼𝐼𝑔𝑔 𝑔𝑔𝐼𝐼𝑎𝑎𝑏𝑏
𝑎𝑎𝐼𝐼𝑖𝑖𝐼𝐼𝑎𝑎𝐼𝐼𝑎𝑎 𝐼𝐼𝑎𝑎𝑝𝑝𝐼𝐼𝐼𝐼𝑎𝑎 𝑝𝑝𝐼𝐼𝑏𝑏 𝑝𝑝𝑝𝑝𝐼𝐼𝐼𝐼𝐼𝐼 𝑏𝑏𝐼𝐼𝑝𝑝𝐼𝐼�
+13�𝐼𝐼𝑎𝑎𝑝𝑝𝐼𝐼𝐼𝐼𝑎𝑎 𝑎𝑎𝑝𝑝𝑝𝑝𝑡𝑡 𝐼𝐼𝐼𝐼 𝑝𝑝𝑏𝑏𝐼𝐼𝑜𝑜 − 𝑝𝑝𝑏𝑏𝑝𝑝𝑝𝑝𝑝𝑝𝑎𝑎𝐼𝐼𝐼𝐼𝑔𝑔 𝑔𝑔𝐼𝐼𝑎𝑎𝑏𝑏𝑎𝑎𝐼𝐼𝑖𝑖𝐼𝐼𝑎𝑎𝐼𝐼𝑎𝑎 𝐼𝐼𝑎𝑎𝑝𝑝𝐼𝐼𝐼𝐼𝑎𝑎 𝑝𝑝𝐼𝐼𝑏𝑏 𝑝𝑝𝑝𝑝𝐼𝐼𝐼𝐼𝐼𝐼 𝑎𝑎𝐼𝐼𝑡𝑡𝑏𝑏
�� × 100
Figure 2 shows that the directly exposed group tends to exhibit lower prosocial
and antisocial preferences and risk attitudes than the indirectly exposed group at low
levels of violence exposure. As the intensity of violence exposure increases, the directly
exposed group engages in more taking, more risk-seeking and more money-burning.
By contrast, the behaviours of the indirectly exposed groups generally does not vary
much with the extent of violence exposure, with the exception of the behaviour of
dishonesty, which decreases with the intensity of violence experienced by the
participants’ communities and then levels off.

18
Figure 2: Means of behavioural outcomes of directly exposed and indirectly exposed
groups according to degree of exposure to violence during the KR regime
5.2 Regression Specification
We examine the effects of genocide exposure, using regression to control for covariates
that could potentially correlate with outcomes:
𝑌𝑌𝑖𝑖𝑖𝑖𝑖𝑖 = 𝛽𝛽0 + 𝛽𝛽1𝐾𝐾𝐾𝐾𝑖𝑖 + 𝛽𝛽2𝐸𝐸𝑖𝑖𝑝𝑝𝑖𝑖𝑖𝑖𝑖𝑖 + 𝛽𝛽3𝐸𝐸𝑖𝑖𝑝𝑝𝑖𝑖𝑖𝑖𝑖𝑖 ∗ 𝐾𝐾𝐾𝐾𝑖𝑖 + 𝛿𝛿′𝑿𝑿𝑖𝑖𝑖𝑖𝑖𝑖 + 𝜀𝜀𝑖𝑖𝑖𝑖𝑖𝑖 (1)
where 𝑌𝑌𝑖𝑖𝑖𝑖𝑖𝑖 includes the experimental behavioural outcomes for individual i who resided
in district k during the KR regime and participates in the experiment in district j. The
dummy variable 𝐸𝐸𝑖𝑖𝑝𝑝𝑖𝑖𝑖𝑖𝑖𝑖 takes the value of 1 if individual i was directly exposed to
genocide and the value of 0 if individual i was indirectly exposed. A set of control
variables 𝑿𝑿𝑖𝑖𝑖𝑖𝑖𝑖 includes age, gender and education for individual i, as well as an
indicator for whether the experiment took place in Phnom Penh (dummy for urban).
𝜀𝜀𝑖𝑖𝑖𝑖𝑖𝑖 is the error term. Standard errors are clustered at the level of the district of residence
at the time of the KR regime. As we mentioned before, individuals who were directly
exposed to the genocide are somewhat older, less educated and more likely to be male
than those who were not directly exposed to the genocide. Thus, controlling for these
variables takes these differences into account.
1020
3040
Ave
. %S
ent
Low Medium HighIntensity of KR mortality
Trust Game: % Sent
1020
3040
Ave
. %R
etur
ned
Low Medium HighIntensity of KR mortality
Trust Game: % Returned
1020
3040
Ave
. %G
iven
Low Medium HighIntensity of KR mortality
Dictator Game: % Given
2030
4050
% T
aker
s
Low Medium HighIntensity of KR mortality
Dictator Game: Give or Take
4050
6070
Ave
. % In
vest
ed
Low Medium HighIntensity of KR mortality
Risk Game: % Invested
4050
6070
% B
urne
rs
Low Medium HighIntensity of KR mortality
Money Burning Game
1020
3040
50%
Che
ater
s
Low Medium HighIntensity of KR mortality
Self-Reporting Game18
2430
36A
ve. I
ndex
Low Medium HighIntensity of KR mortality
Pro-social Pref. Index
1012
1416
Ave
. Ind
ex
Low Medium HighIntensity of KR mortality
Anti-social Pref. Index
Indirectly Exposed Directly Exposed

19
We are particularly interested in examining the differential effects of direct and
indirect exposure to violence of different intensity levels. For individuals who
experienced direct exposure to the genocide, (𝛽𝛽1 + 𝛽𝛽3) measures how their prosocial
behaviours, antisocial behaviours and risk attitudes vary with the intensity of genocide
exposure. Thus, we may view (𝛽𝛽1 + 𝛽𝛽3) as a measure of how directly exposed
individuals behave if they experience a low intensity of exposure versus a high intensity
of exposure. For individuals who were indirectly exposed to the genocide, 𝛽𝛽1 measures
how their prosocial behaviours, antisocial behaviours and risk attitudes vary with the
exposure intensity. Similarly, 𝛽𝛽1 can be interpreted as a measure of how indirectly
exposed individuals behave if they experience a low intensity of exposure versus a high
intensity of exposure. The coefficient 𝛽𝛽3 is also of some interest, as this measures how
the behaviours of directly exposed individuals vary relative to those of indirectly
exposed individuals as the intensity of experienced violence increases. This informs us
about the counterfactual behaviours of indirectly exposed individuals, had they been
directly exposed to the genocide within their localities.
We further assess the credibility of our identification strategy in the sensitivity
analysis section. First, we allow the effects of indirect exposure to differ for those born
before the end of the KR regime and those born after the end of the regime. If the
behaviours of these two groups of individuals are similar, then we have evidence that
both are robust control groups to the directly exposed and that our results are unlikely
to be biased by any self-reporting error in the measurement of direct exposure (by those
born before the end of the KR regime). Second, the direct exposure measure can be
sensitive to adult memories of early childhood. To explore the robustness of the main
results, we assume memories of direct violence exposure below certain ages to be
unreliable and code these cases as indirect exposure. Third, since individuals who
relocated after the KR regime provide us with additional variation in the intensity of
the violence exposure, we include in our regressions a control variable indicating
whether an individual has been living in the same district or location since birth.
Robustness in the estimates provides evidence that the estimated behavioural
differences by direct exposure and exposure intensity are not sensitive to displacement
during or after the KR regime. Fourth, we exclude education as a control variable to
examine whether genocide exposure may influence outcomes through education.
Finally, we add risk attitudes as an additional control variable when examining the

20
impact on social preferences because risk preferences may be correlated with social
preferences, including, particularly, measures of trust and dishonesty.
5.3 Regression Results
We estimate equation (1) using an Ordinary Least Squares (OLS) regression for
prosocial behaviour and risk and employ a Probit estimation approach for antisocial
behaviour and present the results in Table 3. Column 1 reports the effects on an
individual’s trust. Column 2 reports the effects on an individual’s trustworthiness.
Column 3 reports the effects on altruism. Column 4 reports the marginal effects on
taking behaviour (evaluated at the means). Column 5 reports the effects on a person’s
risk-taking attitude. Columns 6 and 7 report the marginal effects on the likelihood of
burning other players’ money (evaluated at the means). Columns 8 and 9 present the
marginal effects on dishonesty (evaluated at the means). Column 10 reports the effects
on the prosocial behaviour index. Column 11 reports the effects on the index of
antisocial behaviour.
[Table 3]
Of particular interest are the coefficient for KR mortality rates, which measures
how the behaviours of indirectly exposed individuals vary with the intensity of
genocide, and the sum of the coefficients for the KR mortality rates and the interaction
between these mortality rates and direct exposure (reported in the bottom row in bold),
which measures how the behaviours of directly exposed individuals vary with the
intensity of the genocide. Columns 1 and 2 in Table 3 (the bottom row) show that
individuals directly exposed to the genocide exhibit less trust and less trustworthy
behaviours according to the intensity of the genocide they experienced, but not
significantly so. Similarly, for individuals indirectly exposed to the genocide, trust and
trustworthy behaviours do not vary significantly with the intensity of the genocide
experienced by their communities. (first row)
Columns 3 and 4 of Table 3 indicate that directly exposed individuals give less
and are more likely to take some or all of other players’ endowments when exposed to
a high level of violence.15 On the other hand, those who are not directly exposed to
15 An ordered probit or a multinomial logit/probit regression model in which the dependent variable takes the value of 0 (takes some or all of the other player’s endowment), 1 (does not give to or take from the other player) or 2 (gives some or all of the endowment to the other player), provides results similar to those in column 4. These unreported results are available upon request.
21
violence experience little variation in altruistic and opportunistic behaviours with the
intensity of the violence experienced by the community. Thus, greater direct exposure
to violence makes a person significantly less altruistic and significantly more
opportunistic.
Next, we examine the effects of genocide exposure on risk preferences. Column
5 of Table 3 (the bottom row) shows that as the intensity of exposure to violence
increases, individuals who were directly exposed to the genocide invest significantly
more in the risky option. In contrast, individuals who were not directly exposed to
violence do not vary their risk-taking attitudes with the intensity of violence in their
communities. Thus, our results indicate that high levels of direct exposure to violence
make individuals more risk-seeking.
We find that high levels of direct exposure to violence have a statistically
significant impact on individuals’ vindictive behaviours. Column 6 shows that as the
intensity of violence exposure increases, those directly exposed to the genocide become
more likely to destroy others’ wealth. The vindictive behaviours of those indirectly
exposed to the genocide, however, do not vary significantly with the intensity of
violence in their communities.16
Columns 9 and 10 report the impact of exposure to violence on attitudes towards
dishonesty. These attitudes are invariant to the intensity of genocide exposure for
individuals directly exposed to the genocide (bottom rows). However, as the intensity
of genocide in the community increases, individuals who were indirectly exposed
become significantly less dishonest than those who witnessed lower intensities of
genocide. When we control for differences in opportunities to cheat (i.e., the maximum
number of possible correct answers, either 4 or 7) in the regression, the results remain
similar. These findings suggest that individuals who were not directly affected by
violence but witnessed intense chaos and the aftermath of the conflict might appreciate
their relative good fortune and perhaps develop a stronger sense of moral integrity.
Columns 10 and 11 of Table 3 present the effects of genocide exposure on the
indexes for prosocial and antisocial behaviours. Column 10 shows that prosocial
behaviours do not vary significantly with intensity of genocide exposure for either
16 Column 7 shows that these results are not sensitive to the inclusion of a binary indicator for whether a participant is an advantaged player (i.e., received a gift in the money-burning game). Further, the magnitude of the estimated coefficients is smaller when using different measures of the burning decision (e.g., burn in at least two prices of burning and burn in all three prices of burning). The main effect remains negative and significant.

22
directly exposed or indirectly exposed individuals, although the intensity of genocide
exposure somewhat reduces prosocial behaviours for both groups. Column 11 shows
that antisocial behaviours vary significantly with intensity of genocide exposure for
directly exposed individuals, but not for indirectly exposed individuals. The results
indicate that a high level of direct exposure to violence during adolescence increases
antisocial attitudes and behaviours in the long term.
Overall, the results show that members of the directly exposed group are more
financially vindictive, less altruistic, likely to take more from others and risk seeking if
they were residing in areas of intensive killing during the genocide. There is also some
evidence that indirectly exposed individuals may be less dishonest if the level of
violence in their communities was higher.
6 Sensitivity Analysis
In this sensitivity analysis section, we demonstrate that our results are robust and that
our data do not support alternative explanations.
6.1 Split Sample by Post-Genocide Birth Cohorts
There are two types of indirectly exposed individuals in our sample: individuals born
before and during the KR period and individuals born after the KR period. It is
conceivable that the individuals who were physically present during the genocide but
did not directly experience any violence might develop prosocial and antisocial
preferences and risk attitudes that differ from those of individuals who only heard about
the violence and saw the aftermath of the genocide years later. For example, individuals
who were physically present during the genocide are likely to have faced a constant
threat of losing loved ones or being killed or tortured, whereas individuals who were
born after the KR period are not. To ascertain whether these two types of indirectly
exposed individuals respond differently to the intensity of genocide experienced by
their communities, we estimate equation (1) for the sample of individuals born before
the fall of the KR regime and estimate a variant of equation (1) that omits the direct
exposure variable and the interaction between direct exposure and the KR mortality
rate for the sample of individuals born after the end of the genocide.
[Table 4]

23
Panel A in Table 4 shows that the estimated marginal effects of KR mortality
on both the indirectly exposed group and the directly exposed group are similar to those
reported in Table 3. Similarly, the estimated marginal effects of KR mortality on the
dishonesty measure of the group of indirectly exposed individuals who were born after
the KR period are very similar to those reported in Table 3 (Panel B, Table 4). Thus,
the marginal effects of the intensity of genocide on the tendency for indirectly exposed
individuals to be dishonest are similarly negative regardless of whether or not these
individuals were actually present during the genocide. These results also indicate that
the both types of indirectly exposed individuals provide similar counterfactuals and
serve as good control groups for the directly exposed individuals. Moreover, because
the behaviours of these two groups of indirectly exposed individuals are similar, it is
unlikely that any self-reporting error in the direct exposure measure for those who were
physically present during the KR period might bias our results.
6.2 Reliability of Memories of Early Childhood Experience
We collect information on direct violence exposure through surveys. While this
approach offers a unique and individual-specific measure of exposure to violence, the
information collected may be sensitive to the reliability of adult memories and recalls
of early childhood experiences. For example, the literature on childhood amnesia and
autobiographical memory development indicates that children have very little memory
of events that occurred before the age of two and few memories of events that occurred
between the ages of two and three (Howe, 2013). The number of retained memories of
events increases with an individual’s age at the time of the event, and mature memories
begin forming around age seven (Howe, 2013). Bauer et al. (2014) also find that greater
exposure to war has no measurable impact on children below the age of seven, but that
the effects are pronounced beginning at around seven years of age.
To examine the sensitivity of our results, we recode direct experience of
violence as 0 for the various birth cohorts whose early childhood memories of exposure
to violence are less reliable and report the re-estimated results in Table 4. We do this
systematically by progressively recoding the direct exposure variable to 0 for: (A)
individuals born between 1978 and 1979 (less than 1.5 years old during the KR period);
(B) individuals born between 1977 and 1979 (less than 2.5 years old during the KR
period); (C) individuals born between 1976 and 1979 (less than 3.5 years old during the
KR period); and (D) individuals born between 1975 and 1979 (less than 4.5 years old
24
during the KR period). Table 5 demonstrates that our main findings are robust
irrespective of how we treat the adult memories of early childhood experience.17 The
results suggest that our main conclusion concerning direct exposure to genocide is
driven by the sample of children and adolescents who were born before the KR regime
began (i.e. born before 1975).
[Table 5]
6.3 Robustness to Post-Genocide Relocation
The variation in the intensity of genocide comes primarily from the number of districts
in which we conducted the experiments (7 in total) and the number of individuals who
resided in districts during the KR period or at birth that differ from the districts in which
they participate in the experiments (61 additional districts). Roughly 68% of the full
sample and 66% of those born before the end of the KR regime indicate that they have
lived in the same districts since the KR period. It is possible that post-genocide
relocation might have influenced individuals’ prosocial and antisocial behaviours and
risk attitudes. For example, relocation may disrupt social networks. It is also possible
that individuals who are more mobile differ from those who are not in terms of their
social preferences and risk attitudes.
We assess the sensitivity of our results to the effects of relocation by including
a relocation dummy that takes the value of one if a respondent’s district of residence
during the KR period or at birth (if they were born after the KR period) differs from the
district in which they currently live. The results reported in Table 6 are very similar to
those reported in Tables 3. Thus, our results are not sensitive to post-genocide
relocation or the inclusion of individuals who moved away from their birth districts.
[Table 6]
6.4 Exclusion of Education and Age as Controls
So far, we have included participants’ completed years of schooling and ages as
controls in our regression analyses. However, education is a potential channel through
which the effects of civil conflict exposure can affect individual preferences. Many
existing studies examining civil conflicts in different countries (e.g., Akresh & de
17 Results are similar even when we expand the birth cohorts to those younger than 6.5 years old during the KR period.

25
Walque, 2008; Chamarbagwala & Morán, 2011; Dabalen & Paul, 2012; Islam et al.,
2016; Leon, 2012; Shemyakina, 2011) find a negative relationship between exposure
to conflict and educational attainment. Similarly, age and educational attainment are
highly correlated in the Cambodian context (Islam et al., 2016). Thus, we estimate
equation (1) for all measures based on the experimental games, first excluding only
completed number of years of schooling from the regression and then excluding both
years of schooling and age. As reported in panels A and B of Table 7, the signs,
magnitudes and significance levels of the coefficients of interest are similar to the main
results in Table 3. Thus, there is no evidence that the documented effects of exposure
to violence operate through education or are confounded by cohort differences.
[Table 7]
6.5 Effects of Risk Attitudes on Behaviours in Experiment
Risk attitudes are likely correlated with prosocial and antisocial behaviours. Since we
find strong effect on risk attitudes, we include risk attitudes as a control variable when
estimating the impact on social preferences. Compared to Table 3, which shows the
main results, Table 8 shows little change in the magnitudes of the estimated coefficients
and the significance levels, suggesting that exposure to genocide directly affects the
individual behaviours observed in the experiments.
[Table 8]
7 Conclusion
KR’s violent enforcement of social engineering policies with the goal of
transforming Cambodia into a classless agrarian utopia produced one of the worst
genocides in human history. We examine the long-term effects of this genocide on the
social behaviours of individuals. We exploit the intensity of genocide across different
geographic locations where individuals either directly or indirectly experienced or
witnessed war-related violence during their childhood and early adolescence in order
to identify the causal impact of genocide on social preferences and risk. First, we use
exogenous variations in the degree of concentration of deaths during the KR regime
across districts in Cambodia. Second, we use individuals’ direct and indirect personal
experiences of war during the important developmental window of childhood and

26
adolescence. We show that personal experiences with violence are orthogonal to
correlates of economic conditions and geographical characteristics.
We find that individuals who directly experienced or witnessed the genocide in
areas of intensive killings are now less altruistic, more vindictive and more risk-taking.
Overall, these people exhibit more antisocial preferences. Individuals who lived in the
same area as the genocide but who did not have direct experience with it are found to
be less dishonest when given the option to cheat. The results suggest that genocide has
differential long-term effects on prosocial and antisocial preferences and risk-taking
behaviours depending on whether an individual directly witnessed or experienced
extreme violence during the genocide period. Our findings also suggest that direct and
intense exposure to genocide during childhood and early adolescence can alter
individuals’ social preferences and that the effects persist decades after the genocide
ends. Our results are robust to a variety of checks, such as, among other sensitivity
measures, restricting the sample size to different cut-off ages for exposure to genocide,
differences in education levels, living in the same locality since birth and individual
personalities.
We argue that the KR forced people to adopt norms and institutions that created
feelings of fear and horror, provoked antisocial behaviours and discouraged prosocial
motivations. While the KR regime could be dismissed as a uniquely horrific historic
event of little general relevance to the world today, the extreme ideology and the general
disregard for human life which were the defining characteristics of the Cambodian
genocide and which led to human catastrophe can still be seen in several places around
the world today. 18 Similar extreme events, for example, have been experienced in
China during the Cultural Revolution, in Rwanda, in Yugoslavia and, in recent years,
in Syria.
While more research is needed to explore the generalisability of our findings to
other contexts, we expect our results to improve the understanding of the long-term
effects of extreme violence and how these effects can be influenced by the proximity
and intensity of violence. The specific motivations of perpetrators may be unique to
each conflict; however, the encouragement of interpersonal animosity, repression and
murder on a massive scale are all common elements. In sum, the lessons of the
18Extreme state ideologies have also been found to impact individuals’ behaviours in other (non-violent) settings. For example, Cameron et al. (2013) find that individuals who were single children due to the One Child Policy in China exhibit different behavioural characteristics than individuals who had siblings.

27
Cambodian genocide may apply well beyond the country’s borders and could have
implications for current events and their effects on long-term behaviours in a post-
conflict society.

28
References
Akresh, R., & de Walque, D. (2008). Armed conflict and schooling: Evidence from the 1994 Rwandan genocide (Policy Research Working Paper No. 4606). Washington, DC: The World Bank.
Bandura, A. (1973). Aggression: A social learning analysis. Englewood Cliffs, N.J.: Prentice-Hall.
Bateson, R. (2012). Crime victimization and political participation. American Political Science Review, 106(3), 570–587.
https://doi.org/10.1017/S0003055412000299
Bauer, M., Blattman, C., Chytilová, J., Henrich, J., Miguel, E., & Mitts, T. (2016). Can war foster cooperation? The Journal of Economic Perspectives, 30(3), 249–274.
Bauer, M., Cassar, A., Chytilová, J., & Henrich, J. (2014). War’s enduring effects on the development of egalitarian motivations and in-group biases. Psychological Science, 25(1), 47–57. https://doi.org/10.1177/0956797613493444
Bauer, P. J., & Larkina, M. (2014). Childhood amnesia in the making: Different distributions of autobiographical memories in children and adults. Journal of Experimental Psychology: General, 143(2), 597–611. https://doi.org/10.1037/a0033307
Becchetti, L., Conzo, P., & Romeo, A. (2014). Violence, trust, and trustworthiness: evidence from a Nairobi slum. Oxford Economic Papers, 66(1), 283–305. https://doi.org/10.1093/oep/gpt008
Beckman, S. R., Formby, J. P., Smith, W. J., & Zheng, B. (2002). Envy, malice and Pareto efficiency: An experimental examination. Social Choice and Welfare, 19(2), 349–367. https://doi.org/10.1007/s003550100116
Bellows, J., & Miguel, E. (2009). War and local collective action in Sierra Leone. Journal of Public Economics, 93(11), 1144–1157.
Berg, J., Dickhaut, J., & McCabe, K. (1995). Trust, reciprocity, and social history. Games and Economic Behavior, 10(1), 122–142.
https://doi.org/10.1006/game.1995.1027
Blattman, C. (2009). From violence to voting: War and political participation in Uganda. American Political Science Review, 103(2), 231–247.
Callen, M., Isaqzadeh, M., Long, J. D., & Sprenger, C. (2014). Violence and risk preference: Experimental evidence from Afghanistan. American Economic Review, 104(1), 123–148.
Caló-Blanco, A., Kovarik, J., Mengel, F., & Romero, J. G. (2015). Natural disasters and indicators of social cohesion. Unpublished manuscript.
Cameron, L., Erkal, N., Gangadharan, L., & Meng, X. (2013). Little emperors: Behavioral impacts of China’s one-child policy. Science, 339(6122), 953–957.
Cassar, A., Grosjean, P., & Whitt, S. (2013). Legacies of violence: Trust and market development. Journal of Economic Growth, 18(3), 285–318.

29
Cassar, A., Healy, A., & Kessler, C. (2011). Trust, risk, and time preferences after a natural disaster: Experimental evidence from Thailand. Unpublished manuscript.
Chamarbagwala, R., & Morán, H. E. (2011). The human capital consequences of civil war: Evidence from Guatemala. Journal of Development Economics, 94(1), 41–61.
Chandler, D. P. (2008). A history of Cambodia (4th ed.). Boulder, Colo: Westview Press.
Collier, P., Elliott, V. L., Hegre, H., Hoeffler, A., Reynal-Querol, M., & Sambanis, N. (2003). Breaking the conflict trap: Civil war and development policy. Washington, DC: The World Bank.
Dabalen, A. L., & Paul, S. (2012). Estimating the causal effects of conflict on education in Côte d’Ivoire (Policy Research Working Paper No. 6077). Washington, DC: The World Bank.
De Walque, D. (2006). The socio-demographic legacy of the Khmer Rouge period in Cambodia. Population Studies, 60(2), 223–231.
Dubow, E. F., Huesmann, L. R., & Boxer, P. (2009). A social-cognitive-ecological framework for understanding the impact of exposure to persistent ethnic-political violence on children’s psychosocial adjustment. Clinical Child and Family Psychology Review, 12(2), 113–126. https://doi.org/10.1007/s10567-009-0050-7
Eckel, C., Grossman, P. J., Johnson, C. A., de Oliveira, A. C. M., Rojas, C., & Wilson, R. (2011). Social norms of sharing in high school: Teen giving in the dictator game. Journal of Economic Behavior and Organization, 80(3), 603–612.
Farver, J. A. M., & Frosch, D. L. (1996). L.A. stories: Aggression in preschoolers’ spontaneous narratives after the riots of 1992. Child Development, 67(1), 19–32. https://doi.org/10.1111/j.1467-8624.1996.tb01716.x
Fehr, E., Glatzle-Rutzler, D., & Sutter, M. (2013). The development of egalitarianism, altruism, spite and parochialism in childhood and adolescence. European Economic Review, 64, 369–383.
Gilligan, M. J., Pasquale, B. J., & Samii, C. (2014). Civil war and social cohesion: Lab-in-the-field evidence from Nepal. American Journal of Political Science, 58(3), 604–619.
Glaeser, E. L., Laibson, D. I., Scheinkman, J. A., & Soutter, C. L. (2000). Measuring trust. The Quarterly Journal of Economics, 115(3), 811–846.
Gneezy, A., & Fessler, D. M. T. (2012). Conflict, sticks and carrots: War increases prosocial punishments and rewards. Proceedings of the Royal Society B, 279(1727), 219–223. https://doi.org/10.1098/rspb.2011.0805
Gneezy, U., Leibbrandt, A., & List, J. A. (2016). Ode to the sea: Workplace organizations and norms of cooperation. The Economic Journal, 126(595), 1856–1883. https://doi.org/10.1111/ecoj.12209
Gneezy, U., & Potters, J. (1997). An experiment on risk taking and evaluation periods. The Quarterly Journal of Economics, 112(2), 631–645.
Guiso, L., Sapienza, P., & Zingales, L. (2004). The role of social capital in financial development. The American Economic Review, 94(3), 526–556.

30
Harbaugh, W., Krause, K., & Vesterlund, L. (2002). Risk attitudes of children and adults: Choices over small and large probability gains and losses. Experimental Economics, 5(1), 53–84. https://doi.org/10.1023/A:1016316725855
Howe, M. L. (2013). Memory development: Implications for adults recalling childhood experiences in the courtroom. Nature Reviews Neuroscience, 14(12), 869–876.
Huesmann, L. R. (1988). An information processing model for the development of aggression. Aggressive Behavior, 14(1), 13–24. https://doi.org/10.1002/1098-2337(1988)14:1<13::AID-AB2480140104>3.0.CO;2-J
Islam, A., Ouch, C., Smyth, R., & Wang, L. C. (2016). The long-term effects of civil conflicts on education, earnings, and fertility: Evidence from Cambodia. Journal of Comparative Economics, 44(3), 800–820.
https://doi.org/10.1016/j.jce.2015.05.001
Islam, A., Ouch, C., Smyth, R., & Wang, L. C. (2017). The intergenerational effect of Cambodia's Genocide on Children's Education and Health. Population and Development Review, forthcoming.
Jakiela, P., & Ozier, O. (2015). The impact of violence on individual risk preferences: Evidence from a natural experiment (Policy Research Working Paper No. 7440) (pp. 1–37). The World Bank. Retrieved from http://documents.worldbank.org/curated/en/100191468188937680/The-impact-of-violence-on-individual-risk-preferences-evidence-from-a-natural-experiment
Keresteš, G. (2006). Children’s aggressive and prosocial behavior in relation to war exposure: Testing the role of perceived parenting and child’s gender. International Journal of Behavioral Development, 30(3), 227–239. https://doi.org/10.1177/0165025406066756
Kim, Y.-I., & Lee, J. (2014). The long-run impact of a traumatic experience on risk aversion. Journal of Economic Behavior & Organization, 108, 174–186.
Knack, S., & Keefer, P. (1997). Does social capital have an economic payoff? A cross-country investigation. The Quarterly Journal of Economics, 112(4), 1251–1288.
Leon, G. (2012). Civil conflict and human capital accumulation: The long-term effects of political violence in Peru. Journal of Human Resources, 47(4), 991–1022.
Lerner, J. S., & Keltner, D. (2001). Fear, anger, and risk. Journal of Personality and Social Psychology, 81(1), 146–159.
Lewis, M. (2001). Issues in the study of personality development. Psychological Inquiry, 12(2), 67–83.
List, J. a. (2007). On the interpretation of giving in dictator games. Journal of Political Economy, 115(3), 482–493. https://doi.org/10.1086/519249
Loeber, R. (1990). Development and risk factors of juvenile antisocial behavior and delinquency. Clinical Psychology Review, 10(1), 1–41.
https://doi.org/10.1016/0272-7358(90)90105-J
Mazar, N., Amir, O., & Ariely, D. (2008). The dishonesty of honest people: A theory of self-concept maintenance. Journal of Marketing Research, 45(6), 633–644.

31
McAuley, R., & Troy, M. (1983). The impact of urban conflict and violence on children referred to a child psychiatry clinic. In J. Harbison (Ed.), Children of the troubles: Children in Northern Ireland (pp. 33–43). Belfast: Stranmillis College, Learning Resources Unit.
McCrae, R. R., Costa, P. T., Ostendorf, F., Angleitner, A., Caprara, G. V., Barbaranelli, C., … Piedmont, R. L. (1999). Age differences in personality across the adult life span: Parallels in five cultures. Developmental Psychology, 35(2), 466–477.
Miller, L. S., Wasserman, G. A., Neugebauer, R., Gorman-Smith, D., & Kamboukos, D. (1999). Witnessed community violence and antisocial behavior in high-risk, urban boys. Journal of Clinical Child Psychology, 28(1), 2–11. https://doi.org/10.1207/s15374424jccp2801_1
Murphy, Kevin R. (1993). Honesty in the workplace. Pacific Grove, Calif.: Brooks/Cole Publishing Co.
Neupert, R., & Prum, V. (2005). Cambodia: Reconstructing the demographic stab of
the past and forecasting the demographic scar of the future. European Journal of Population, 21(2), 217–246. https://doi.org/10.1007/s10680-005-6854-3
Neyer, F. J., & Asendorpf, J. B. (2001). Personality-relationship transaction in young adulthood. Journal of Personality and Social Psychology, 81(6), 1190–1204.
Raboteg‐Šaric, Z., Žužul, M., & Keresteš, G. (1994). War and children’s aggressive and prosocial behavior. European Journal of Personality, 8(3), 201–212. https://doi.org/10.1002/per.2410080305
Rammstedt, B., & John, O. P. (2007). Measuring personality in one minute or less: A 10-item short version of the Big Five Inventory in English and German. Journal of Research in Personality, 41(1), 203–212.
Rao, L.-L., Han, R., Ren, X.-P., Bai, X.-W., Zheng, R., Liu, H., … Li, S. (2011). Disadvantage and prosocial behavior: The effects of the Wenchuan earthquake. Evolution and Human Behavior, 32(1), 63–69.
Rohner, D., Thoenig, M., & Zilibotti, F. (2013). Seeds of distrust: Conflict in Uganda. Journal of Economic Growth, 18(3), 217–252.
Sacco, K., Galletto, V., & Blanzieri, E. (2003). How has the 9/11 terrorist attack influenced decision making? Applied Cognitive Psychology, 17(9), 1113–1127. https://doi.org/10.1002/acp.989
Shemyakina, O. (2011). The effect of armed conflict on accumulation of schooling: Results from Tajikistan. Journal of Development Economics, 95(2), 186–200.
Slone, M., Lobel, T., & Gilat, I. (1999). Dimensions of the political environment affecting children’s mental health: An Israeli study. Journal of Conflict Resolution, 43(1), 78–91.
Sutter, M., & Kocher, M. G. (2007). Trust and trustworthiness across different age groups. Games and Economic Behavior, 59(2), 364–382.
Sutter, M., Kocher, M. G., Glatzle-Ruetzler, D., & Trautmann, S. T. (2013). Impatience and uncertainty: Experimental decisions predict adolescents’ field behavior. American Economic Review, 103(1), 510–531.

32
UNESCO. (2011). Edcuation and fragility in Cambodia. Paris: UNESCO-International Institute for Educational Planning.
Voors, M. J., Nillesen, E. E. M., Verwimp, P., Bulte, E. H., Lensink, R., & Soest, D. P. V. (2012). Violent conflict and behavior: A field experiment in Burundi. American Economic Review, 102(2), 941–964.
Whitt, S., & Wilson, R. K. (2007). The dictator game, fairness and ethnicity in postwar Bosnia. American Journal of Political Science, 51(3), 655–668.
Zizzo, D. J., & Oswald, A. J. (2001). Are people willing to pay to reduce others’ incomes? Annales d’Économie et de Statistique, (63/64), 39–65.

33
Figure 1: Distribution of KR mortality rates across districts in Cambodia
Note: Blue shaded areas are districts with information of mortality under the Khmer Rouge regime available. White circles with a red marker denote districts in which the participants in our experiment resided during the Cambodian genocide period.

34
Table 1: Demographic characteristics of experiment participants
Experimental sample CSES 2011 Mean differences
between Experiment and CSES 2011 samples
Main Variables All Std.
Dev. Range Direct Exposure
Indirect Exposure
p-value of diff. (t-test)
All p-value of diff. (t-test)
(1) (2) (3) (4) (5) (6) (7) (8) KR mortality rate 0.217 0.153 0-0.542 0.221 0.215 0.633 Age 42.31 7.290 32-54 47.80 38.67 0.000 41.88 0.194 Male (=1) 0.46 0.499 0-1 0.556 0.395 0.000 0.47 0.689 Education (years) 7.32 4.459 0-22 6.199 8.054 0.000 7.13 0.311 Married (=1) 0.84 0.369 0-1 0.867 0.818 0.144 0.82 0.477 Khmer (=1) 0.99 0.078 0-1 0.990 0.997 0.342 Observations 492 196 296 4601
Note: Age originally reported in CSES 2011 is recoded to reflect the age in February 2014. Column (6) tests the differences of means reported in columns (4) and (5). Column (8) tests the differences of means reported in columns (1) and (7).

35
Table 2: Exogeneity of mortality rates under the Khmer Rouge regime
Sex ratio in 1962
Density in 1962
Density —Men in 1962
Density — Women in 1962
Distance to capital district
(1) (2) (3) (4) (5)
Panel A: CGD sample Test of exogeneity of mortality rates under the Khmer Rouge regime
KR mortality rates -0.022 -814.459 -417.384 -397.075 4.054 (0.017) (663.015) (335.879) (327.192) (9.648) R-squared 0.008 0.008 0.008 0.007 0.001 Observations 145 145 145 145 145
Panel B: Experiment sample Test of exogeneity of mortality rates under the Khmer Rouge regime
KR mortality rates -0.005 -577.343 -290.417 -286.926 16.750 (0.022) (1172.329) (592.270) (580.062) (16.325) R-squared 0.001 0.003 0.003 0.003 0.014 Observations 68 68 68 68 68
Panel C: CSES 2004 sample of individuals born before 1950
Correlation of test of exogeneity variables and actual outcomes
Mean years of
schooling Mean monthly
earnings Mean monthly
household income Illness/injury during
the past 30 days Disabled (1) (2) (3) (4) (5) Dependent Variable: Sex ratio in 1962 4.469** 5.728*** 5.834*** -0.314 -0.231 (1.760) (1.791) (0.794) (0.273) (0.287) Density in 1962 (in 10,000) 3.521*** 1.140*** 1.794*** 0.105** -0.054* (0.245) (0.334) (0.153) (0.049) (0.028) Density—Men in 1962 (in 10,000) 6.925*** 2.233*** 3.527*** 0.206** -0.106* (0.507) (0.675) (0.315) (0.097) (0.056) Density—Women in 1962 (in 10,000) 7.160*** 2.327*** 3.649*** 0.216** -0.110* (0.476) (0.662) (0.298) (0.098) (0.058) Distance to capital district (in 10,000) -288.508*** -113.597** -148.448*** 3.122 2.543 (42.899) (43.645) (27.979) (6.579) (6.315) Observations 141 125 141 141 141
Note: All observations are measured at the district level. The values for the dependent variables in columns 1–4 of panels A and B are from Census 1962. In panel B, KR mortality rates are assumed to be zero for the three districts in which KR mortality data are not available (the results are similar if the three districts are excluded). In panel C, each estimate came from a separate regression with one explanatory variable. Panel C shows whether the variables used for the test of exogeneity are predictive of actual outcomes. Robust standard errors are in parentheses. *** p<0.01, ** p<0.05, * p<0.10

36
Table 3: Estimates of effects of exposure to genocide on prosocial and antisocial behaviour and risk Trust Dictator Risk Money Burning Self-reporting Index
Dependent variable: % Sent % Returned % Given Take % Invested Burn Burn Dishonest Dishonest Prosocial Preferences
Antisocial Preferences
(1) (2) (3) (4) (5) (6) (7) (8) (9) (10) (11) KR mortality rate (β1) -9.932 -5.274 -5.373 -0.244 8.264 -0.055 -0.057 -0.678*** -0.701*** -6.531 -8.650
(12.105) (12.265) (7.933) (0.245) (8.825) (0.153) (0.152) (0.216) (0.215) (9.972) (6.992) Direct exposure (β2) -5.014 -3.050 -0.752 -0.124* -5.721 -0.077 -0.079 0.060 0.055 -3.151 -2.070 (4.094) (3.226) (4.782) (0.074) (3.448) (0.073) (0.072) (0.056) (0.056) (3.213) (2.292) KR mortality rate × Direct exp. (β3) 0.706 4.959 -20.634 0.585*** 23.501** 0.563*** 0.571*** 0.596** 0.587** -4.264 18.627*** (11.202) (13.703) (16.011) (0.210) (9.256) (0.162) (0.159) (0.259) (0.261) (11.937) (6.947) Age -0.013 -0.204 0.070 -0.001 -0.104 0.006 0.006 -0.003 -0.003 -0.045 -0.071 (0.201) (0.181) (0.298) (0.004) (0.212) (0.004) (0.004) (0.003) (0.003) (0.176) (0.079) Education (years) 0.601* 0.280 0.536 0.003 0.980** 0.018*** 0.017*** -0.017*** -0.018*** 0.496* 0.041 (0.324) (0.230) (0.381) (0.005) (0.399) (0.005) (0.005) (0.006) (0.006) (0.272) (0.131) Male 8.376*** 3.043** 9.398*** -0.121*** 8.900*** -0.037 -0.036 -0.092** -0.097** 6.867*** -2.129 (2.300) (1.501) (2.272) (0.039) (2.451) (0.050) (0.051) (0.044) (0.041) (1.389) (1.898) Phnom Penh 21.808*** 13.328*** 18.726*** -0.168* 5.883 -0.148* -0.147* -0.190*** -0.192*** 18.347*** -6.896*** (4.132) (3.329) (4.409) (0.099) (4.371) (0.085) (0.085) (0.073) (0.072) (3.380) (2.121) Advantaged player -0.016 (0.043) Maximum number of correct answers -0.122*** (0.041) R-squared 0.132 0.059 0.140 0.088 0.180 0.039 Observations 492 4920 492 492 492 492 492 492 492 492 492 KR mortality rate + KR mortality rate × Direct exp. (β1+ β3) -9.226 -0.315 -26.007** 0.341** 31.765*** 0.508*** 0.514*** -0.082 -0.114 -10.795 9.977** (p-values) (0.460) (0.977) (0.050) (0.011) (0.000) (0.000) (0.000) (0.572) (0.453) (0.290) (0.017) Note: Column 2 includes 10 observations per person as there are 10 possible values that each sender might send. Column 4 reports the marginal effects evaluated at the mean from the Probit estimation when the dependent variable equals 1 if the player decides to take some or all of the other player’s endowment and 0 otherwise. Columns 6 and 7 report the marginal effects evaluated at the mean from the Probit estimation where dependent variable equals 1 if the player decides to reduce (burn) the other player’s money for at least 1 of the 3 prices of burning and 0 if player decides not to burn any amount. Columns 8 and 9 report the marginal effects evaluated at the mean from the Probit estimation where dependent variable equals 1 if the player takes extra money to which he or she is not entitled and 0 otherwise. The advantaged player equals 1 if the player receives a gift and 0 otherwise. The maximum number of correct answers equals 1 if the total number of correct answers in the self-reporting game is 7 and 0 if total number of correct answers is 4. Column 10 reports the index for prosocial behaviour, which is composed of the behaviour in three experiments (amount sent in the trust game, total amount returned in the trust game for all possible levels of trust, amount sent in the dictator game - giving). Column 11 reports the index for antisocial behaviour which comprises of the behaviour in the dictator game -giving or taking, money burning and dishonesty games. Robust standard errors clustered by districts (68 districts) are reported in parentheses. *** significant at 1%, ** significant at 5%, * significant at 10%.

37
Table 4: Splitting the Sample by Post-Genocide Birth Cohorts Trust Dictator Risk Money Burning Self-reporting Index
Dependent variable: % Sent % Returned % Given Take % Invested Burn Burn Dishonest Dishonest Prosocial Preferences
Antisocial Preferences
(1) (2) (3) (4) (5) (6) (7) (8) (9) (10) (11) Panel A: Birth cohorts: 1960-KR Period KR mortality rate (β1) -7.562 8.573 -1.024 -0.371 13.953 -0.100 -0.098 -0.489** -0.564*** 0.618 -9.208
(15.769) (10.004) (9.266) (0.419) (13.423) (0.265) (0.264) (0.229) (0.217) (8.552) (10.656) Direct exposure (β2) -4.527 -0.357 0.026 -0.146* -5.029 -0.101 -0.105 0.110* 0.094 -1.744 -2.189 (4.897) (3.308) (4.950) (0.088) (4.171) (0.077) (0.078) (0.063) (0.062) (3.342) (2.946) KR mortality rate × Direct exp. (β3) -2.083 -8.970 -25.160* 0.686* 18.120 0.623** 0.632** 0.417 0.456* -11.685 18.734* (15.271) (12.958) (13.044) (0.380) (12.927) (0.250) (0.254) (0.260) (0.247) (11.183) (9.954) Age 0.069 -0.177 0.120 -0.002 -0.102 0.003 0.003 -0.007 -0.006 0.024 -0.111 (0.293) (0.153) (0.296) (0.003) (0.276) (0.006) (0.006) (0.006) (0.006) (0.173) (0.093) Education (years) 0.554 0.195 0.574* 0.009* 0.954** 0.010 0.010 -0.023*** -0.024*** 0.477* 0.095 (0.399) (0.240) (0.300) (0.005) (0.423) (0.007) (0.007) (0.008) (0.007) (0.241) (0.165) Male 9.505*** 4.340** 9.733*** -0.114** 10.256*** 0.012 0.013 -0.112** -0.119*** 7.722*** -1.953 (2.605) (1.830) (2.589) (0.051) (3.573) (0.070) (0.071) (0.048) (0.045) (1.275) (2.404) Phnom Penh 20.074*** 12.592*** 18.832*** -0.135 7.857 -0.163 -0.161 -0.280*** -0.289*** 17.484*** -7.164*** (5.669) (4.682) (5.946) (0.099) (5.360) (0.114) (0.113) (0.103) (0.103) (4.790) (2.069) Advantaged player -0.033 (0.050) Max. no. of correct answers -0.125*** (0.045) R-squared 0.104 0.045 0.134 0.104 0.152 0.040 Observations 358 3580 358 358 358 358 358 358 358 358 358 KR mortality rate + KR mortality rate × Direct exp. (β1+ β3) -9.645 -0.397 -26.184* 0.315** 32.073*** 0.523*** 0.534*** -0.072 -0.108 -11.067 9.526** (p-values) (0.450) (0.972) (0.057) (0.015) (0.000) (0.001) (0.000) (0.572) (0.424) (0.304) (0.018) Panel B: Post-Genocide Birth Cohorts KR mortality rate -12.656 -20.844 -10.938 -0.146 -0.024 -0.016 -0.006 -0.706*** -0.676*** -14.801 -8.321 (14.521) (17.567) (15.167) (0.146) (9.999) (0.205) (0.208) (0.192) (0.216) (14.397) (6.676) R-squared 0.197 0.093 0.148 0.052 0.235 0.041 Observations 134 1340 134 134 134 134 134 134 134 134 134 Notes: See notes in Table 3 for details about the dependent variables and specifications used. Post-genocide birth cohorts are those born in 1980 and after. Robust standard errors clustered by districts (68 districts) are reported in parentheses. *** significant at 1%, ** significant at 5%, * significant at 10%.

38
Table 5: Robustness to Potential Unreliability of Adult Memories of Childhood Experience
Trust Dictator Risk Money Burning Self-Reporting Index % Sent % Returned % Given Take % Invested Burn Dishonesty Prosocial Antisocial (1) (2) (3) (4) (5) (6) (7) (8) (9) A. Birth cohorts 1978-1979 recoded KR mortality rate -9.932 -5.274 -5.373 -0.244 8.264 -0.055 -0.678*** -6.531 -8.650 (0.415) (0.669) (0.501) (0.319) (0.352) (0.718) (0.002) (0.515) (0.220) KR mortality rate + KR mortality rate × Direct exp. -9.226 -0.315 -26.007** 0.341** 31.765*** 0.508*** -0.082 -10.795 9.977** (0.460) (0.977) (0.050) (0.011) (0.000) (0.000) (0.572) (0.290) (0.017) B. Birth cohorts 1977-1979 recoded KR mortality rate -10.099 -5.570 -5.793 -0.237 7.922 -0.049 -0.666*** -6.823 -8.410 (0.405) (0.650) (0.466) (0.336) (0.378) (0.749) (0.002) (0.494) (0.238) KR mortality rate + KR mortality rate × Direct exp. -8.878 0.205 -25.316* 0.330** 32.397*** 0.499*** -0.099 -10.277 9.620** (0.481) (0.985) (0.053) (0.010) (0.000) (0.001) (0.482) (0.312) (0.017) C. Birth cohorts 1976-1979 recoded KR mortality rate -8.489 -5.603 -5.490 -0.255 7.016 -0.042 -0.617*** -6.210 -8.645 (0.521) (0.649) (0.496) (0.291) (0.435) (0.772) (0.003) (0.553) (0.223) KR mortality rate + KR mortality rate × Direct exp. -11.308 0.228 -26.115* 0.361*** 33.91*** 0.495*** -0.136 -11.319 10.178** (0.321) (0.983) (0.052) (0.008) (0.000) (0.001) (0.269) (0.261) (0.016) D. Birth cohorts 1975-1979 recoded KR mortality rate -9.611 -6.697 -5.970 -0.214 6.449 -0.020 -0.631*** -7.082 -7.981 (0.468) (0.593) (0.468) (0.354) (0.468) (0.892) (0.001) (0.507) (0.253) KR mortality rate + KR mortality rate × Direct exp. -9.845 1.937 -26.339* 0.334** 35.369*** 0.475*** -0.107 -10.360 9.900** (0.396) (0.860) (0.067) (0.040) (0.000) (0.001) (0.364) (0.319) (0.038)
Note: All regressions include controls for age, gender, education and Phnom Penh as in columns 1, 2, 3, 4, 5, 6, 8, 10, and 11 in Table 3. We assume that various birth cohorts born during the KR period have unreliable memory of direct exposure to violence and recoded the value of their direct exposure measure as zero. P-values based on robust standard errors clustered at the district level (68 districts) are reported in parentheses. *** significant at 1%, ** significant at 5%, * significant at 10%.

39
Table 6: Robustness to Post-Genocide Relocation
Trust Dictator Risk Money Burning Self-Reporting Index % Sent % Returned % Given Take % Invested Burn Dishonesty Prosocial Antisocial (1) (2) (3) (4) (5) (6) (7) (8) (9) KR mortality rate (β1) -10.130 -6.102 -4.398 -0.249 10.369 -0.018 -0.688*** -6.443 -8.461
(11.538) (11.800) (8.392) (0.247) (8.338) (0.162) (0.210) (9.792) (7.170) Direct exposure (β2) -5.086 -3.353 -0.395 -0.126 -4.950 -0.063 0.056 -3.119 -2.000
(4.193) (3.117) (4.969) (0.080) (3.474) (0.080) (0.059) (3.253) (2.425) KR mortality rate × Direct exp. (β3) 0.657 4.751 -20.389 0.584*** 24.028** 0.577*** 0.591** -4.242 18.675** (11.334) (13.999) (15.694) (0.208) (9.379) (0.166) (0.259) (11.929) (7.069) Age -0.005 -0.172 0.032 -0.001 -0.186 0.004 -0.003 -0.049 -0.078 (0.200) (0.163) (0.303) (0.005) (0.220) (0.005) (0.003) (0.166) (0.090) Education (years) 0.606* 0.300 0.512 0.003 0.929** 0.017*** -0.017*** 0.494* 0.036 (0.315) (0.220) (0.387) (0.006) (0.410) (0.005) (0.006) (0.268) (0.137) Male 8.397*** 3.129** 9.297*** -0.121*** 8.682*** -0.041 -0.091** 6.858*** -2.149 (2.373) (1.451) (2.289) (0.039) (2.566) (0.051) (0.045) (1.418) (1.953) Phnom Penh 22.102*** 14.560*** 17.275*** -0.160 2.750 -0.206** -0.172** 18.215*** -7.178*** (3.900) (3.336) (4.130) (0.103) (4.679) (0.093) (0.078) (3.070) (2.024) Relocation -0.488 -2.042 2.406 -0.013 5.193* 0.098 -0.029 0.218 0.467 (3.704) (2.455) (2.930) (0.068) (2.898) (0.061) (0.047) (2.640) (2.177) R-squared 0.132 0.060 0.141 0.094 0.180 0.040 Observations 492 4920 492 492 492 492 492 492 492 KR mortality rate + KR mortality rate × Direct exp. (β1+ β3) -9.473 -1.351 -24.787* 0.335** 34.397*** 0.559*** -0.097 -10.685 10.214** (p-values) (0.435) (0.897) (0.055) (0.013) (0.000) (0.000) (0.515) (0.285) (0.035)
Note: All regressions include controls for age, gender, education and Phnom Penh as in columns 1, 2, 3, 4, 5, 6, 8, 10, and 11 in Table 3. Relocation is coded as one if the participant’s current district of residence differs to the district of residence during the KR period or at birth (post-KR cohorts). Robust standard errors clustered at the district level (68 districts) are reported in parentheses. *** significant at 1%, ** significant at 5%, * significant at 10% .

40
Table 7: Robustness to the Exclusion of Education and Age Controls Trust Dictator Risk Money Burning Self-Reporting Index % Sent % Returned % Given Take % Invested Burn Dishonesty Prosocial Antisocial (1) (2) (3) (4) (5) (6) (7) (8) (9) A. Excluding education control KR mortality rate (β1) -8.286 -4.507 -3.905 -0.236 10.948 -0.007 -0.712*** -5.174 -8.539
(12.029) (11.920) (7.570) (0.239) (9.158) (0.158) (0.212) (9.701) (6.837) Direct exposure (β2) -5.130 -3.104 -0.856 -0.124* -5.911 -0.078 0.065 -3.247 -2.078
(4.162) (3.244) (4.708) (0.074) (3.594) (0.068) (0.061) (3.206) (2.288) KR mortality rate × Direct exp. (β3) 2.339 5.720 -19.177 0.592*** 26.163** 0.601*** 0.536** -2.918 18.738*** (11.721) (14.040) (16.164) (0.211) (9.955) (0.158) (0.268) (12.292) (6.984) Age -0.160 -0.273* -0.061 -0.002 -0.345** 0.002 0.001 -0.167 -0.081 (0.201) (0.147) (0.233) (0.004) (0.162) (0.004) (0.003) (0.136) (0.079) Male 9.110*** 3.385** 10.052*** -0.118*** 10.096*** -0.015 -0.112** 7.472*** -2.080 (1.997) (1.458) (2.346) (0.043) (2.520) (0.050) (0.045) (1.183) (1.967) Phnom Penh 24.285*** 14.482*** 20.936*** -0.156* 9.921** -0.073 -0.242*** 20.389*** -6.728*** (4.502) (3.404) (4.625) (0.093) (4.204) (0.071) (0.063) (3.704) (1.922) R-squared 0.125 0.057 0.133 0.070 0.171 0.039 Observations 492 4920 492 492 492 492 492 492 492 KR mortality rate + KR mortality rate × Direct exp. (β1+ β3) -5.947 1.213 -23.082* 0.356*** 37.111*** 0.594*** -0.176 -8.092 10.199** (0.641) (0.910) (0.083) (0.004) (0.000) (0.000) (0.253) (0.431) (0.012) B. Excluding age and education controls KR mortality rate (β1) -8.070 -4.138 -3.822 -0.233 11.415 -0.010 -0.713*** -4.948 -8.430 (12.075) (11.945) (7.638) (0.241) (9.154) (0.156) (0.209) (9.752) (6.984) Direct exposure (β2) -6.595** -5.603** -1.417 -0.141** -9.069*** -0.064 0.073 -4.774* -2.816 (3.304) (2.640) (4.045) (0.061) (3.170) (0.052) (0.055) (2.746) (2.153) KR mortality rate × Direct exp. (β3) 2.431 5.877 -19.142 0.593*** 26.362** 0.601*** 0.535** -2.822 18.784** (11.554) (13.672) (16.044) (0.214) (9.988) (0.159) (0.267) (12.038) (7.127) Male 9.120*** 3.402** 10.056*** -0.117*** 10.118*** -0.015 -0.112** 7.482*** -2.075 (1.976) (1.413) (2.345) (0.043) (2.444) (0.050) (0.045) (1.162) (1.964) Phnom Penh 24.577*** 14.981*** 21.048*** -0.153 10.552** -0.076 -0.244*** 20.694*** -6.581*** (4.560) (3.314) (4.505) (0.095) (4.243) (0.069) (0.063) (3.616) (1.928) R-squared 0.124 0.053 0.133 0.065 0.169 0.038 Observations 492 4920 492 492 492 492 492 492 492 KR mortality rate + KR mortality rate × Direct exp. (β1+ β3) -5.639 1.739 -22.964* 0.360*** 37.777*** 0.591*** -0.178 -7.770 10.354** (p-values) (0.660) (0.871) (0.082) (0.004) (0.000) (0.000) (0.245) (0.448) (0.010)
Note: Robust standard errors clustered at the district level (68 districts) are reported in parentheses. *** significant at 1%, ** significant at 5%, * significant at 10%

41
Table 8: Robustness to the Inclusion of Risk Attitude Trust Dictator Risk Money Burning Self-Reporting Index % Sent % Returned % Given Take % Invested Burn Dishonesty Prosocial Antisocial (1) (2) (3) (4) (5) (6) (7) (8) (9) KR mortality rate (β1) -11.245 -6.801 -6.602 -0.229 8.264 -0.055 -0.687*** -7.909 -8.624
(12.467) (12.525) (8.327) (0.244) (8.825) (0.154) (0.221) (10.340) (7.100) Direct exposure (β2) -4.105 -1.993 0.098 -0.135* -5.721 -0.077 0.064 -2.197 -2.088
(3.983) (3.029) (4.697) (0.072) (3.448) (0.074) (0.057) (3.048) (2.207) KR mortality rate × Direct exp. (β3) -3.025 0.616 -24.128 0.629*** 23.501** 0.565*** 0.586** -8.182 18.702*** (11.144) (13.660) (16.022) (0.214) (9.256) (0.164) (0.261) (11.885) (6.758) Age 0.004 -0.185 0.086 -0.001 -0.104 0.006 -0.003 -0.028 -0.071 (0.192) (0.186) (0.294) (0.004) (0.212) (0.004) (0.003) (0.172) (0.080) Education (years) 0.445 0.099 0.391 0.005 0.980** 0.018*** -0.018*** 0.332 0.044 (0.339) (0.267) (0.404) (0.005) (0.399) (0.005) (0.006) (0.298) (0.124) Male 6.963*** 1.398 8.074*** -0.106*** 8.900*** -0.036 -0.099** 5.383*** -2.101 (2.517) (1.471) (2.420) (0.038) (2.451) (0.050) (0.046) (1.482) (1.817) Phnom Penh 20.873*** 12.241*** 17.852*** -0.161 5.883 -0.148* -0.196*** 17.366*** -6.877*** (4.000) (3.158) (4.256) (0.100) (4.371) (0.086) (0.073) (3.213) (2.210) Risk - % Invested 0.159*** 0.185*** 0.149*** -0.002*** -0.000 0.001 0.167*** -0.003 (0.030) (0.032) (0.042) (0.001) (0.001) (0.000) (0.026) (0.021) R-squared 0.155 0.098 0.164 0.088 0.228 0.039 Observations 492 4920 492 492 492 492 492 492 492 KR mortality rate + KR mortality rate × Direct exp. (β1+ β3) -14.270 -6.185 -30.730** 0.400*** 31.765*** 0.510*** -0.101 -16.091 10.078** (p-values) (0.277) (0.585) (0.021) (0.000) (0.000) (0.001) (0.494) (0.132) (0.024)
Note: All regressions include controls for age, gender, education and Phnom Penh as in columns 1, 2, 3, 4, 5, 6, 8, 10, and 11 in Table 3. Robust standard errors clustered at the district level (68 districts) are reported in parentheses. *** significant at 1%, ** significant at 5%, * significant at 10%

42
Appendix A: Experimental Game Design and Procedure
The following section describes the experimental games with the endowment and participation fees used in the rural areas. One of the first four tasks was randomly chosen for payment purposes, in addition to the earnings in the self-reporting task.
Game 1: Trust
We use the standard trust game protocol to measure trust and trustworthiness. Each participant plays both as player 1 (sender) and player 2 (receiver). The sender receives an endowment of 10,000 riel (AUD 2.8)19, while the receiver is endowed with 0 riel. In the first stage, all participants are senders and can send any positive amount x ∈ {0, 1,000, 2,000, …, 9,000, 10,000} to the anonymous receiver, knowing that the experimenter triples the amount sent and that the receiver receives an amount of 3x. In the second stage, all participants play as receivers. We aimed to minimize the logistical issues in the field, so the receiver was not informed of the amount sent by the sender. Thus, the receiver decides on an amount y ∈ {3x} to return to the sender for all the corresponding amounts the receiver might receive. The sender is also not informed of the amount sent back by the receiver unless the game is selected for the final payment. If the trust game and the sender’s role are selected for the final payment, all participants receive (10,000 – x + y). Otherwise, all participants receive (3x – y) if the receiver’s role is chosen.
Game 2: Dictator
In the dictator game, there were two stages: 1) giving; and 2) giving or taking. Each participant plays as both player 1 (dictator) and player 2 (recipient). All participants receive an endowment of 10,000 riel. The dictator receives an additional endowment of 10,000 riel, while the recipient does not receive the additional endowment.
1) In dictator game giving, the dictator is asked to decide how much of the additional endowment to give to the recipient. The dictator can transfer any positive amount x ∈ {0, 1,000, 2,000, …, 9,000, 10,000} to the anonymous recipient. The recipient must simply accept it and is only informed of how much the dictator sends if the game is selected for the final payment. All participants receive (10,000 + 10,000 – x) if the dictator game, part 1, and the dictator’s role are selected for the final payment. However, if the dictator game, part 1, and the recipient’s role are chosen, the payoffs for all participants are (10,000 + x).
2) In dictator game giving or taking, the dictator can send the additional endowment to other players or take other player’s initial endowment. This means that the dictator can send a negative or positive amount x ∈ {–1,000, –2,000, …, –10,000, 0, 1,000, 2,000, …, 10,000}. As in part 1, the recipient is only told the amount the dictator sends or takes if the game is selected for the final payment. The payoffs of all participants are (10,000 + 10,000 –/+ x) depending on the dictator’s decision to take or give if the dictator game, part 2, and the dictator’s role are selected and (10,000 –/+ x) if the dictator game, part 2, and the recipient’s role are selected.
19 The exchange rate was AUD 1 = 3,570Riel (February 23, 2014).
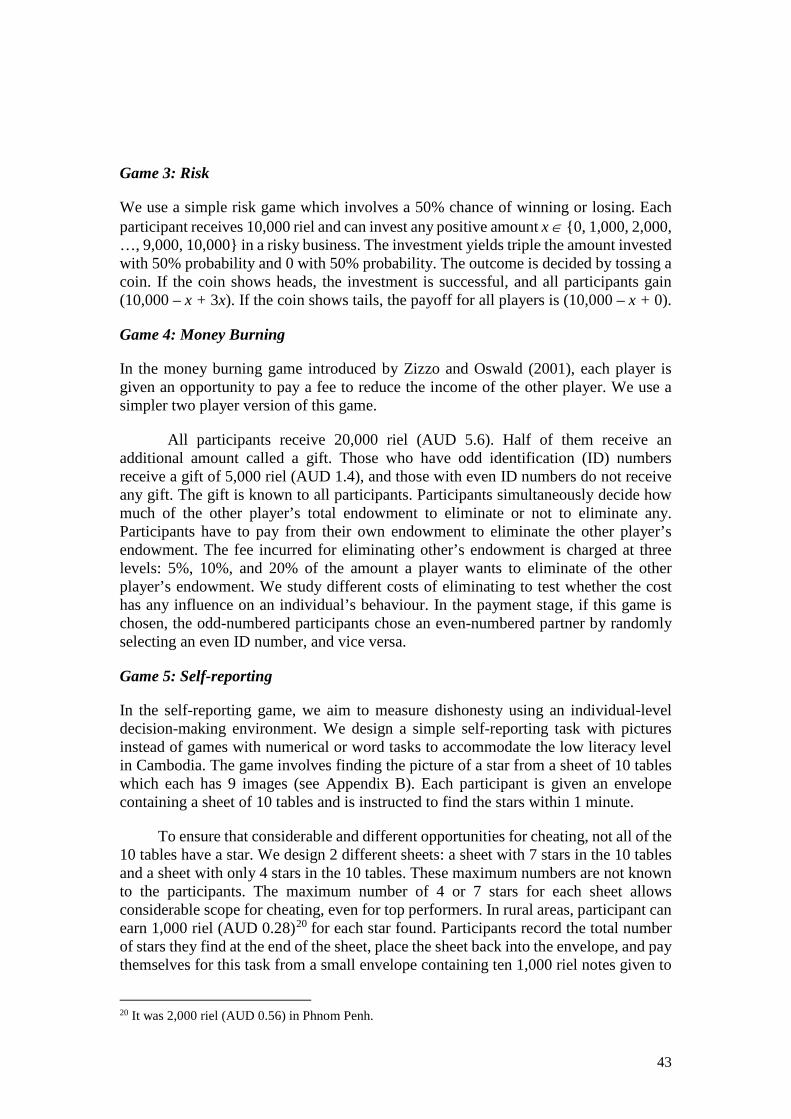
43
Game 3: Risk
We use a simple risk game which involves a 50% chance of winning or losing. Each participant receives 10,000 riel and can invest any positive amount x ∈ {0, 1,000, 2,000, …, 9,000, 10,000} in a risky business. The investment yields triple the amount invested with 50% probability and 0 with 50% probability. The outcome is decided by tossing a coin. If the coin shows heads, the investment is successful, and all participants gain (10,000 – x + 3x). If the coin shows tails, the payoff for all players is (10,000 – x + 0).
Game 4: Money Burning
In the money burning game introduced by Zizzo and Oswald (2001), each player is given an opportunity to pay a fee to reduce the income of the other player. We use a simpler two player version of this game.
All participants receive 20,000 riel (AUD 5.6). Half of them receive an additional amount called a gift. Those who have odd identification (ID) numbers receive a gift of 5,000 riel (AUD 1.4), and those with even ID numbers do not receive any gift. The gift is known to all participants. Participants simultaneously decide how much of the other player’s total endowment to eliminate or not to eliminate any. Participants have to pay from their own endowment to eliminate the other player’s endowment. The fee incurred for eliminating other’s endowment is charged at three levels: 5%, 10%, and 20% of the amount a player wants to eliminate of the other player’s endowment. We study different costs of eliminating to test whether the cost has any influence on an individual’s behaviour. In the payment stage, if this game is chosen, the odd-numbered participants chose an even-numbered partner by randomly selecting an even ID number, and vice versa.
Game 5: Self-reporting
In the self-reporting game, we aim to measure dishonesty using an individual-level decision-making environment. We design a simple self-reporting task with pictures instead of games with numerical or word tasks to accommodate the low literacy level in Cambodia. The game involves finding the picture of a star from a sheet of 10 tables which each has 9 images (see Appendix B). Each participant is given an envelope containing a sheet of 10 tables and is instructed to find the stars within 1 minute.
To ensure that considerable and different opportunities for cheating, not all of the 10 tables have a star. We design 2 different sheets: a sheet with 7 stars in the 10 tables and a sheet with only 4 stars in the 10 tables. These maximum numbers are not known to the participants. The maximum number of 4 or 7 stars for each sheet allows considerable scope for cheating, even for top performers. In rural areas, participant can earn 1,000 riel (AUD 0.28)20 for each star found. Participants record the total number of stars they find at the end of the sheet, place the sheet back into the envelope, and pay themselves for this task from a small envelope containing ten 1,000 riel notes given to
20 It was 2,000 riel (AUD 0.56) in Phnom Penh.

44
them at the beginning of the task. Participants place any remaining money in the small envelope, seal it, and leave it on their desk for the experimenters to collect. The envelopes are not opened until the experimental session is completed. To reduce scrutiny bias, the experimenters leave the room while participants perform this task.
Experimental Procedure
All the tasks were conducted with paper and pen. Clear instructions with tables and diagrams in Khmer were provided to all participants. Before starting the experiment, participants were randomly assigned to 1 of 3 separate rooms in a local school.21 On average, there were 24 participants per session. One session was smaller (14 participants) because of the small size of the room available and 3 sessions were larger (30–32 participants). We ran 3 sessions (rooms) simultaneously in Phnom Penh and in each district in Kampong Cham to reduce the spillover effects between sessions.
Participants played with other participants in the same session. They were informed that their partner was another participant in the session and selected their partner during the payment stage by choosing the ID number of another participant in the same session. Participants were also informed that they would be paid for 1 of the first 4 tasks picked at random, plus their earnings in task 5 and participation fees of 20,000 riel (AUD 5.6) in Phnom Penh and 10,000 riel (AUD 2.8) in the rural areas. At the end of the entire experiment, the experimenter rolled a dice in front of the participants to determine for which game participants were paid. Participants did not receive any feedback between the tasks or on the tasks not chosen for the final payment.
The games were conducted in two different orders. Game order 1 followed the sequence of trust, dictator, risk, money burning, and self-reporting games. This order was followed in odd-numbered districts (4 of 7 districts). In game order 2, we used the sequence of risk, money burning, trust, dictator, and self-reporting games in even-numbered district (3 districts). We altered the order of the games mainly to test whether participating in the antisocial games first might influence participants’ behaviour differently.22 Participants had to make decisions in a booth during each game, except for the self-reporting game. An experimenter was in the booth to assist participants if they could not read or write.
21 In Phnom Penh, we conducted the experiment at a research institute: the Cambodia Development Resource Institute. 22 Our results are robust when we control for game order instead of experimental district fixed effects. The self-reporting task was always conducted last as participants paid themselves in this task and the amount they earned in this task could potentially influence their decisions in other tasks if this task were conducted before the others.

45
Appendix B: Instructions and Decision Sheets Instructions for Participants
Dear Participant, Thank you for participating in this experiment. There will be two main parts of today’s experiment: performing some tasks and answering the questionnaires. There are five tasks; and we are going to ask you to make some decisions in each task. You will have an opportunity to earn a considerable amount of money depending on the decisions you and everyone else make during each task. You will be paid for ONE of the first four tasks plus your earnings in the Task 5. We will invite one of the participants in the room to draw 1 ball out of the box of 4 balls (representing the four tasks). The number of the ball defines which game will be paid to EVERYONE in the room at the end of the entire experiment. In addition, you will also be given an additional 10,000 riels (AU$2.8) for your participation in this research. Before we start, we will read the consent form. If you agree to participate in this experiment, you are required to sign the form. Then we will collect the signed form from you. If you do not agree, you can leave and will not receive the 10,000 riels participation fee. The experiment will last approximately 2-2.5 hours depending on your cooperation. You can decide not to participate at any time if you think that you are not happy with the experiment. All decisions that you make in the tasks and responses that you provide during the interview will be completely anonymous and will be recorded only by anonymous ID number. You will be invited to randomly select a small envelope before we start. In the envelope, there is a paper with your ID number. Please do not remove the ID number from the envelope and keep this envelope (ID number) with you all the times and do not show this ID number to anyone during and after this experiment. You will need to present your ID number to the research assistant who will collect the decision sheet and will interview you after you complete all the five tasks and to the cashier to receive your payment at the end of the entire experiment. We are about to begin the first task. We will explain the task and give you some examples. When we finish reading the instruction, you will have a chance to ask questions. During performing each task, you also can raise your hand if you are unclear and one of our team will come by to help you. It is very important that you understand how to do in each task. If you do not understand, you will not be able to participate effectively. While you are waiting for other participant to make his/her decision during this experiment, please wait at your seat and do not communicate with other participants. Also, please do not share your decision with other participants during this experiment to ensure the confidentiality. If you are ready, then we will proceed. Please follow the experimenter.

46
Instructions for Task 1 (Trust Game) In Task 1, there will be two stages as shown in this diagram. You will be asked to make a decision involving money. This task will be played by pairs of individuals. Each pair is made up of a “Sender” and a “Receiver”. Each of you will be paired randomly with another participant in this room. You will not be told who you are matched with during or after the experiment. You will play as both Sender and Receiver in the Task 1. In Stage 1, you will play as “Sender” and will be paired with one of the participants in this room. In Stage 2, you will play as “Receiver” and will be paired with different partner in Stage 1. If this task is chosen for payment at the end of the experiment, we will decide which role (Sender or Receiver) for the payment for EVERYONE in the room by tossing a coin. We will invite one person from your group to come out here and toss the coin. If the head shows up, the role as Sender will be chosen for the payment. If the tail shows up, the role as Receiver will be chosen for the payment. Stage 1: Sender In the first stage, each of you plays as a “Sender” and has been allocated 10,000 riels (AUD 2.8). No money will be given at this point. All actual payments will be made at the end of the experiment if this task is chosen for the final payment when the experiment finishes.
• Your decision: Decide how much of your endowment (10,000 riels) you would allocate to your partner (Receiver) who is also the participant in this session. You can decide to keep all money for yourself or allocate some or all of it to your partner. The experiment will multiply what you gave by three and pass the money to your partner. Then, in the second stage, your partner will have an opportunity to keep all of the money you sent to him/her or to return some or all of it to you.
• As shown in the decision sheet #1 that we just distribute to you, you can choose ONLY one option.
• For example, if you choose to allocate 5000 riels to your partner, your partner will get 15,000 riels (= 5000 riels x 3 times). Your partner will make decision to send the money back to you in the second stage. If he/she sends back 4000 riels. Then you will have 9000 riels (=10,000 riels – 5000 riels + 4000 riels) to bring home if this game is chosen for the final payment. Your partner will bring home 11,000 riels (=(5000 riels x 3 times) – 4000 riels).
• If you decide to give nothing (zero) to your partner, the first stage for you ends. Your pay-off from this stage is 10,000 riels and your partner’s pay-off is 0 riel.
• Please note that these are only examples. The actual decisions are up to you.

47
Procedure:
• You will be asked to go to the private booth at the corner and bring with you the “ID number” and the “decision sheet”. In the booth, you decide how much money you want to allocate to your partner by choosing one of the options in the decision sheet.
• Then, the research assistant will ask you the amount of money you want to allocate to your partner to confirm your decision, write down your ID number on the decision sheet and put the decision sheet inside a box. Then you can go back to your seat. Please keep in mind that you are not allowed to discuss or let other participants know about your decision.
Do you have any question? If you are ready, we will proceed. Please remain seated until we invite you to the booth. Stage 2: Receiver In the second stage, each of you has been assigned as “Receiver”. Each of you is now paired randomly with other participant in this room. Remember your partner in this stage is different from the first stage. You will not be told who you are matched with during or after this task.
• Your partner in the first stage has made a decision of how much of his/her endowment (10,000 riels) he/she is willing to allocate to you. He/she was told that the amount he would give will be tripled and given to you. So you would have an opportunity to return money that you receive.
• Your decision: Indicate how much of the money you are willing to return conditional on how much you received. To be specific, how much you are going to return to your partner, if you received 3000 riels, 6000 riels, 9000 riels, 12,000 riels, 15,000 riels,…, 30,000 riels. This means you have to complete all these blanks as shown in this decision sheet #2. You can keep all the money, return all or some of it.
• For example: o If your partner in Stage 1 sent you 3000 riels (already triple), you decide
to return to your partner 0 riel. o If your partner in Stage 1 sent you 12,000 riels (already triple), you
decide to send back 8000 riels. o If your partner in Stage 1 sent you 30,000 riels (already triple), you
decide to return to your partner 10,000 riels. • Please note that these are only examples. The actual decisions are up to you.
Procedure:

48
• You will be asked to go to the private booth at the corner and bring with you the “ID number” and the “decision sheet”. In the booth, you indicate how much you will return to your partner (please fill in all blanks).
• The research assistant will ask you the amount you want to return in each blank to confirm your decision and write down your ID number in the decision sheet, and put the decision sheet inside a box. The research assistant will assist you to write the amount based on your decision in each blank if needed. Then you can go back to your seat. Please keep in mind that you are not allowed to discuss or let other participants know about your decision.
Do you have any question? If you are ready, we will proceed. Please remain seated until we invite you to the booth.

49
Decision Sheet of Trust Game: Sender’s Role
DECISION SHEET #1
PARTICIPANT ID: _______________ TASK 1 STAGE 1
Please decide: “how much would you like to allocate to your partner?” Please select only one option from the following:
0
1,000
2,000
3,000
4,000
5,000
6,000
7,000
8,000
9,000
10,000
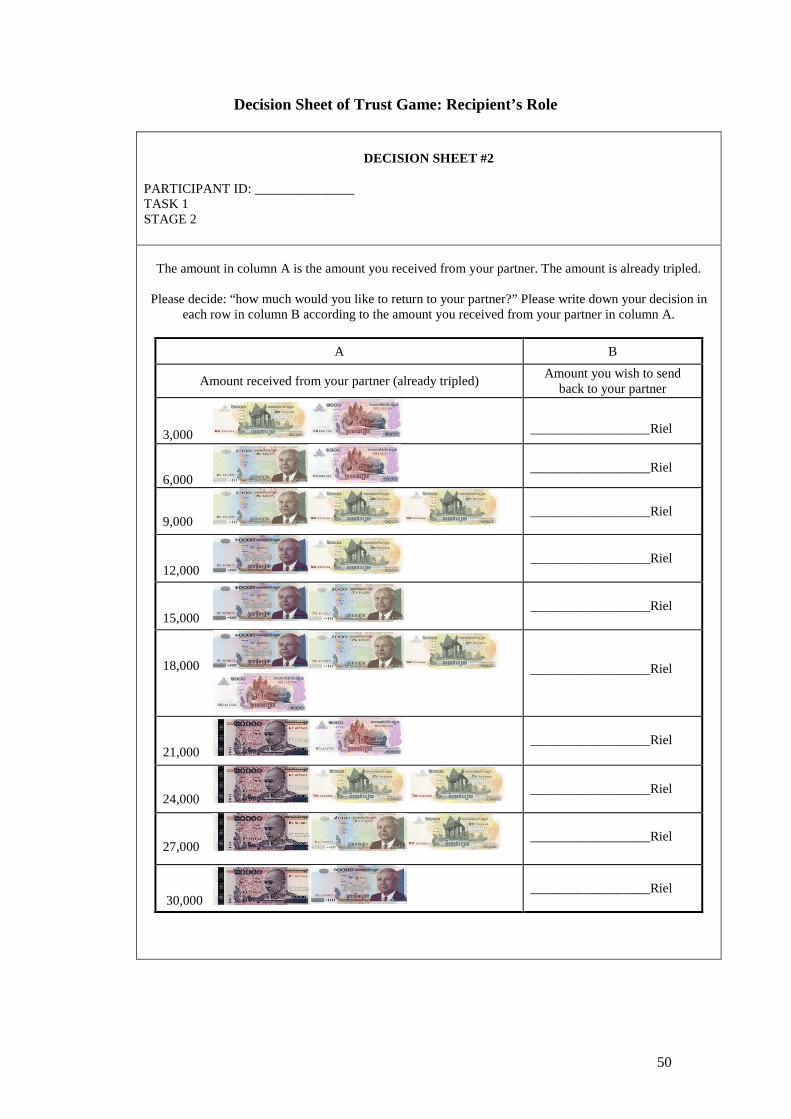
50
Decision Sheet of Trust Game: Recipient’s Role
DECISION SHEET #2 PARTICIPANT ID: _______________ TASK 1 STAGE 2
The amount in column A is the amount you received from your partner. The amount is already tripled.
Please decide: “how much would you like to return to your partner?” Please write down your decision in
each row in column B according to the amount you received from your partner in column A.
A B
Amount received from your partner (already tripled) Amount you wish to send back to your partner
3,000 __________________Riel
6,000
__________________Riel
9,000
__________________Riel
12,000
__________________Riel
15,000
__________________Riel
18,000
__________________Riel
21,000
__________________Riel
24,000
__________________Riel
27,000
__________________Riel
30,000
__________________Riel

51
Instructions for Task 2 (Dictator Game) There will be two parts in Task 2. You will be asked to make a decision involving money. This task will also be played by pairs of individuals. Each pair is made up of a “Sender” and a “Receiver”. If Task 2 is chosen for payment at the end of the experiment, we will decide which part (PART I or PART II) for the payment for EVERYONE in the room by tossing a coin. We will invite one person from your group to come out here and toss the coin. If the head shows up, PART I will be chosen for the payment. If the tail shows up, PART II will be chosen for the payment. Then, we will decide which role (Sender or Receiver) in the chosen PART above for the payment for EVERYONE in the room by tossing the coin again. We will invite another person from your group to come out here and toss the coin. If the head shows up, the role as Sender will be chosen for the payment. If the tail shows up, the role as Receiver will be chosen for the payment. Part I: Giving Each of you is assigned the role as a “Sender”. You are now paired randomly to anyone in this room. You will not be told who you are matched with during or after the experiment.
• Both you and your partner have been allocated 10,000 riels (AUD 2.8) in this part of the experiment. In addition, only you as “Sender” have been allocated an additional 10,000 riels (AUD 2.8). No money will be given at this point. All actual payments will made at the end of the experiment if this task is chosen for the final payment when the experiment finishes.
• Your decision: Decide how much of your additional endowment (10,000 riels) to allocate to your partner. You can choose any amount from as shown in the decision sheet #3.
• Your partner will not make any decision. He/she will take home whatever amount you allocate to him/her plus his/her initial 10,000 riels allocation, and you are as “Sender” will take home whatever amount you keep for yourself plus your initial 10,000 riels allocation.
• For example, you choose to allocate 4000 riels to your partner. Then your partner will go home with 14,000 riels (=10,000 riels + 4000 riels) and you will go home with 16,000 riels (10,000 riels +10,000 riels – 4000 riels).
• Please note that this is an example only. The actual decision is up to you. Procedure:
• You will be asked to go to the private booth at the corner and bring with you the “ID number” and the “decision sheet”. In the booth, you decide how much money you want to allocate to your partner by choosing ONLY one option in the decision sheet #3.

52
• Then, the research assistant will ask you the amount of money you want to allocate to your partner to confirm your decision, write down your ID number on the decision sheet and put the decision sheet inside a box. Then you can go back to your seat. Please keep in mind that you are not allowed to discuss or let other participants know about your decision
Do you have any question? If you are ready, we will proceed. Please remain seated until we invite you to the booth. Part II: Giving or Taking In the second part, there is the same procedure as in Part I. You are assigned the role as a “Sender”. You are now paired randomly to a new partner from anyone in this room. You will not be told who you are matched with during or after the experiment. Please keep in mind that your partner in this part is different from your partner in Part I.
• You and your new partner have been allocated 10,000 riels (AUD 2.8). In addition, only you as “Sender” have been allocated an additional 10,000 riels (AUD 2.8). No money will be given at this point. All actual payments will be made at the end of the experiment if this task is chosen for the final payment.
• Your decision: Decide how much of your additional endowment (10,000 riels) to transfer to your partner. Moreover, you can also transfer a negative amount. This means that you can take up to 10,000 riels from your partner. You can choose any amount from the options in the decision sheet #4.
• The minus amount means you take your partner’s endowment instead of dividing your endowment to your partner.
• For example, if you decide to choose – 6000 riels, it means you take 6000 riels from your partner’s endowment. So your partner will take home 4000 riels (=10,000 riels – 6000 riels) and you will have 26,000 riels (=10,000 riels + 10,000 riels + 6000 riels).
• If you decide to choose 5000 riels to transfer to your partner, he/she will take home 15,000 riels (=10,000 riels + 5000 riels) and you will take home 15,000 riels (=10,000 riels + 10,000 riels – 5000 riels)
• Please note that these are only examples. The actual decisions are up to you. Procedure:
• You will be asked to go to the private booth at the corner and bring with you the “ID number” and the “decision sheet”. In the booth, you decide how much money you want to allocate to OR take from your partner by choosing one of options in the decision sheet #4.

53
• Then, the research assistant will ask you the amount of money you want to allocate to OR take from your partner to confirm your decision, write down your ID number on the decision sheet and put the decision sheet inside a box. Then you can go back to your seat. Please keep in mind that you are not allowed to discuss or let other participants know about your decision.
Do you have any question? If you are ready, we will proceed. Please remain seated until we invite you to the booth.
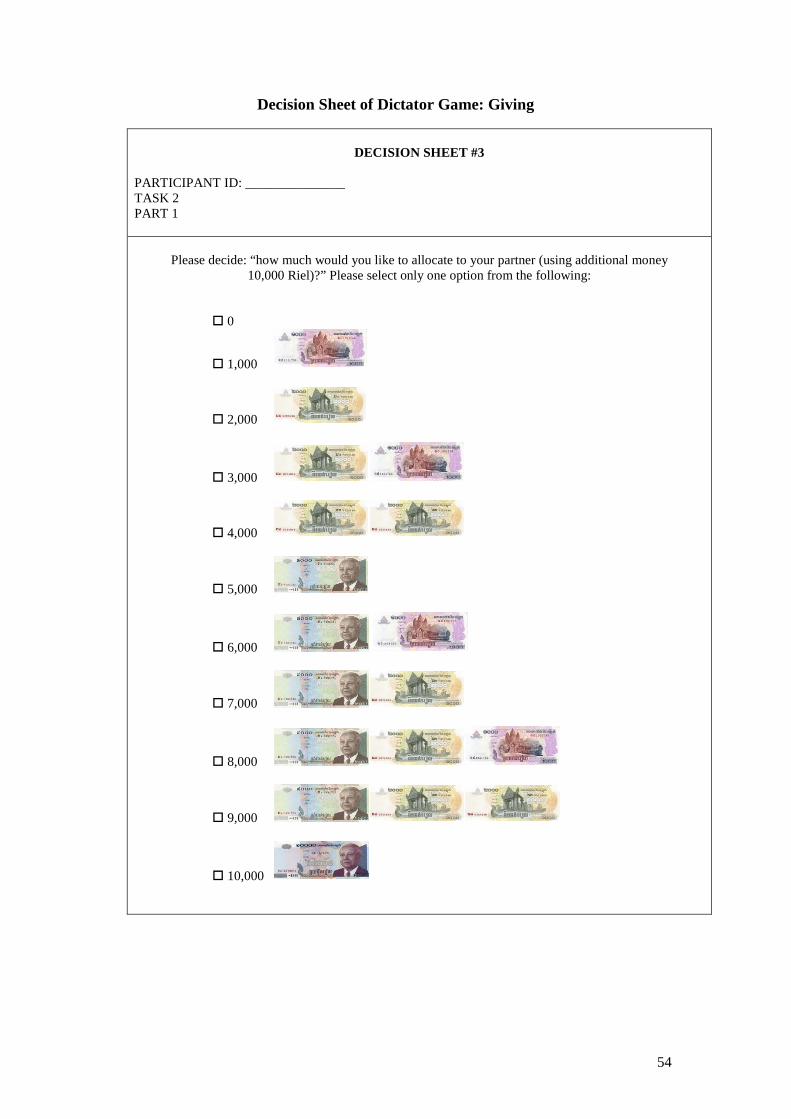
54
Decision Sheet of Dictator Game: Giving
DECISION SHEET #3
PARTICIPANT ID: _______________ TASK 2 PART 1
Please decide: “how much would you like to allocate to your partner (using additional money 10,000 Riel)?” Please select only one option from the following:
0
1,000
2,000
3,000
4,000
5,000
6,000
7,000
8,000
9,000
10,000

55
Decision Sheet of Dictator Game: Giving or Taking DECISION SHEET #4
PARTICIPANT ID: _______________ TASK 2 PART II
Please decide: “how much would you like to transfer to your partner or how much would you like to take from your partner?” Please select only one option from the following:
- 10,000 minus
- 9,000 minus
- 8,000 minus
- 7,000 minus
- 6,000 minus
- 5,000 minus
- 4,000 minus
- 3,000 minus
- 2,000 minus
- 1,000 minus 0
0
1,000
2,000
3,000
4,000
5,000
6,000
7,000
8,000
9,000
10,000

56
Instructions for Task 3 (Risk Game) In Task 3, once again, you will be asked to make a decision involving money in this Task.
• You have been allocated 10,000 riels. No money will be given at this point. All actual payments will be made at the end of the experiment if this task is chosen for the final payment..
• You have an opportunity to invest all, some or none of these 10,000 riels. • There is 50% chance of successful investment and 50% chance of unsuccessful
investment. If the investment succeeds, you will receive 3 times the amount of money you invested. If the investment fails, you will lose the amount you invested.
• We will decide the outcome of the investment by tossing a coin at the end of the entire session if this task is chosen for payment. We will invite one person from your group to come out here and toss the coin in front of all of you. If the coin shows head, EVERYONE in this room get 3 times of the amount that each participant invested. But if the coin shows tail, EVERYONE in this room will get nothing.
• For examples: - If you choose to invest nothing, you will get 10,000 riels if this task is chosen
for payment at the end of the experiment. - If you choose to invest all of the 10,000 riels,. you get 30,000 riels (=10,000
riels x 3 times) if head shows up or nothing (zero riels) if it’s tail. - If you choose to invest 4000 riels, you receive 18,000 riels (= [4000 riels x 3
times] + 6000 riels) if the head shows up and 6,000 riels (=10,000 riels – 4000 riels) if the tail shows up.
• Please note that these are only examples. The actual decisions are up to you. Procedure:
• You will be asked to go to the private booth at the corner and bring with you the “ID number” and the “decision sheet”. In the booth, you choose how much you want to invest from the decision sheet #5.
• Then, the research assistant will ask you the amount of money you want to invest to confirm your decision, write down your ID number on the decision sheet and put the decision sheet inside a box. Then you can go back to your seat. Please keep in mind that you are not allowed to discuss or let other participants know about your decision
Do you have any question? If you are ready, we will proceed. Please remain seated until we invite you to the booth.

57
Decision Sheet of Risk Game
DECISION SHEET #5
PARTICIPANT ID: _______________ TASK 3
Please decide: “how much would you like to invest in a risky business?” Please select only one option
from the following:
0
1,000
2,000
3,000
4,000
5,000
6,000
7,000
8,000
9,000
10,000

58
Instructions for Task 4 (Money Burning Game) In Task 4, you are now paired randomly to a new partner from anyone in this room. You will not be told who you are matched with during or after the experiment.
• You and your partner have been allocated 20,000 riels (AUD 5.6). • We divide you into two groups: Group 1 has Odd ID number and Group 2 has
Even ID number. • The person who has Odd ID number receives a gift of 5000 riels. • We will pair the person who has Odd ID number with the person who has Even
ID number. Please remember that you will not be told who you are matched with during or after the experiment.
• Your and your partner’s incomes are public knowledge, meaning that you can know how much your partner’s income is, and vice versa your partner will learn about your income too.
• Your decision: Decide how much you would like to reduce your partner’s total income. But you have to pay from your income for reducing other person’s income. There are three prices of reducing other person’s income: 5%, 10% and 20% of the amount you want to reduce.
• The gray box in the “decision sheet #6/7” is your and your partner’s total income. The price of reducing is at 5% in Case 1, 10% in Case 2, and 20% in Case 3. You have to choose ONLY ONE option in Case 1, Case 2 and Case 3.
• For example: you have Odd ID number, you receive gift (5000 riels) and your partner does not. So your total income is 25,000 riels and your partner’s total income is 20,000 riels. In Case 1 (5% price of reducing), you decide to reduce 10,000 riels of your partner’s income. Thus, you will have to pay from your income by 500 riels (= 5% * 10,000 riels). Your partner decides to reduce 20,000 riels of your income; hence, he/she will have to pay from his/her income by 1000 riels (= 5% * 20,000 riels).
Your income will remain 4500 riels (= 25,000 riels – 500 riels – 20,000 riels) and your partner’s income will be 9000 riels (= 20,000 riels – 1000 riels – 10,000 riels).
• Please note that these are only examples. The actual decisions are up to you. • Other participant has been told to make the same decision. This means that your
partner can do the same thing as you are being told. • Both you and your partner make decision simultaneously, but only the choice
of one player (your partner or your choice) will be randomly selected for the payment if the task is chosen for the final payment. Then, we will also randomly select which case/price of reducing (5%, 10% or 20%) for the final payment.
Procedure:

59
• You will be asked to go into the private booth at the corner and bring with you
the “ID number” and the “decision sheet”. In the booth, you decide how much money you want to reduce other person’s income in Case 1, Case 2 and Case 3. Then, you estimate how much do you think your partner decides to reduce your income.
• Next, the research assistant will ask you the amount of money you want to reduce other person’s income in each case to confirm your decision, write down your ID number on the decision sheet and put the decision sheet inside a box. Then you can go back to your seat. Please keep in mind that you are not allowed to discuss or let other participants know about your decision.
Do you have any question? If you are ready, we will proceed. Please remain seated until we invite you to the booth.

60
Decision Sheet of Money Burning Game
DECISION SHEET #6 (For ODD ID number)
PARTICIPANT ID: _______________ TASK 4
YOU Your Partner
Initial endowment: 20,000 Riel 20,000 Riel
Gift: 5,000 Riel 0 Rie
Total income:
25,000 Riel
20,000 Riel
Case 1: At 5% price of reducing other person’s income
How much do you want to reduce other person’s income?
Please select only one option from the following:
if the price for eliminating is:
0 0
5,000 250
10,000 500
15,000 750
20,000 1,000

61
Case 2: At 10% price of reducing other person’s income
How much do you want to reduce other person’s income?
Please select only one option from the following:
if the price for eliminating is:
0 0
5,000 500
10,000 1,000
15,000 1,500
20,000 2,000
Case 3: At 20% price of reducing other person’s income
How much do you want to reduce other person’s income?
Please select only one option from the following:
if the price for eliminating is:
0 0
5,000 1,000
10,000 2,000
15,000 3,000
20,000 4,000

62
Decision Sheet of Money Burning Game
DECISION SHEET #7
(For EVEN ID number)
PARTICIPANT ID: _______________ TASK 4
YOU Your Partner
Initial endowment: 20,000 Riel 20,000 Riel
Gift: 0 Riel 5,000 Riel
Total income:
20,000 Riel
25,000 Riel
Case 1: At 5% price of reducing other person’s income
How much do you want to reduce other person’s income?
Please select only one option from the following:
if the price for eliminating is:
0 0
5,000 250
10,000 500
15,000 750
20,000 1,000
25,000 1,250

63
Case 2: At 10% price of reducing other person’s income
How much do you want to reduce other person’s income?
Please select only one option from the following:
if the price for eliminating is:
0 0
5,000 500
10,000 1,000
15,000 1,500
20,000 2,000
25,000 2,500
Case 3: At 20% price of reducing other person’s income
How much do you want to reduce other person’s income?
Please select only one option from the following:
if the price for eliminating is:
0 0
5,000 1,000
10,000 2,000
15,000 3,000
20,000 4,000
25,000 5,000

64
Instructions for Task 5 (Self-reporting Game) In Task 5, each participant will be given a large envelope and you will find a sheet of 10 matrices like the one below:
• You will get different sheet of matrices. • Your role is to tick in the box if you see a “star” in the matrix.
There are 10 matrices and you have 1 minute for this Task. You will get 1000 riels (AUD 0.28) for each “star” you found.
However, some of the matrices have no “star”.
When you find the matrix that does not have “star”, please mark in the box.
You will not receive the money for the matrix that does not have “star”. But you will receive money based on number of star you found. Please write down the total number of star you found in this box. For example, if you find six stars, please write 6.

65
Total : ………… 6 ………
• On your table, there is a small envelope containing ten 1000 riel notes. • Please pay yourself for this task based on the total number of stars you found. • When you finish, please put the matrix sheet and any remaining money in the
small envelope in this box. • Our team will leave the room for 1 minute. • Please note that we will not open the matrix sheet and count the remaining
money until you leave the room (the session finishes). Do you have any question? If you are ready, we will proceed.

66
Decision Sheet of Self-reporting Game
TASK 5
- Please tick in the box if you find a star in the matrix. - Please cross in the box if you do not find star in the matrix.
Example:
Total number of stars found: …………………………

67
Appendix C: Attitudinal Questions and Personality Measures
Our survey questionnaires also include attitudinal questions and 10 questions relating
to personality traits. The survey asks attitudinal questions related to self-reported trust,
risk taking, and dishonest behaviour. The trust question focuses on trust in family
members, neighbours, and friends, as opposed to anonymous individuals, so it is
complementary to the experimental setting. 23 The survey-based question “trust in
family members, neighbours and friends” is scored from 1 to 5, with higher scores
indicating more trust. We create a trust index by summing the scores of trust in family
members, neighbours and friends. The maximum possible value for the trust index is
15. We also use a survey question designed by Glaeser, Laibson, Scheinkman, and
Soutter (2000) to measure self-reported past trusting behaviour. We form an index of
past trusting behaviour by summing the scores of two survey questions: “How
frequently do participants: 1) lend personal possessions to friends; and 2) lend money
to friends?” The maximum possible value for this lending to friends index is 10, with
higher scores indicating a higher frequency of lending.
The survey also asks participants to score “How willing are you to take risks
regarding your household finances?” (risk taking regarding household finances), with
a maximum value of 5; higher scores indicate more risk taking. Similarly, participants
evaluate themselves on the question “How honest do you consider yourself?” (being
honest). The maximum possible score for this variable is 5, with higher scores
indicating that participants consider themselves to be more honest.
To measure personality traits, we use a short version of the Big Five Inventory-
10 developed by Rammstedt and John (2007), which contains 10 questions designed to
categorize people in terms of 5 main factors: extraversion, agreeableness,
conscientiousness, neuroticism, and openness. Broadly, extraversion reflects
sociability, assertiveness, and positive emotionality. Agreeableness reflects altruism
and the tendency toward cooperation, maintenance of social harmony, and
consideration of the concerns of others. Conscientiousness describes traits related to
self-discipline, organization, and self-control. Neuroticism refers to the tendency to
23 We do not use a trust question from the General Social Survey: “Generally speaking, would you say that most people can be trusted, or that you can’t be too careful in dealing with people?” As mentioned by Knack and Keefer (1997), this question leaves it somewhat ambiguous as to what “people” respondents have in mind.
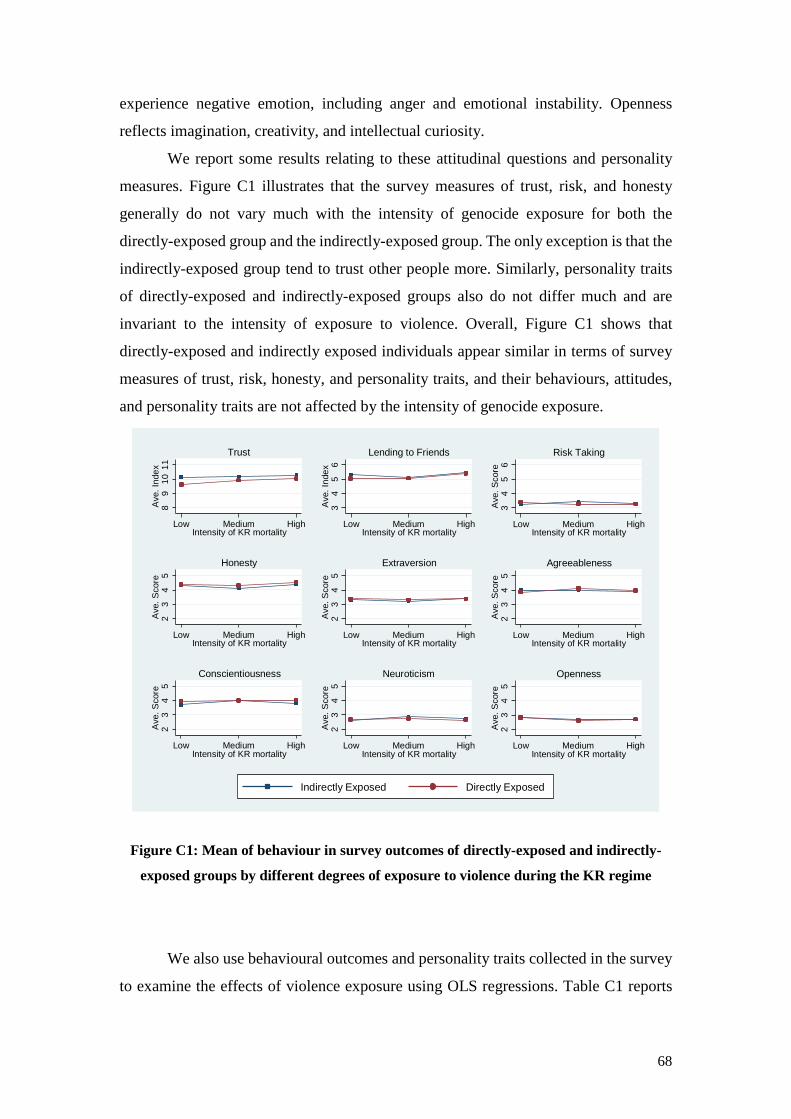
68
experience negative emotion, including anger and emotional instability. Openness
reflects imagination, creativity, and intellectual curiosity.
We report some results relating to these attitudinal questions and personality
measures. Figure C1 illustrates that the survey measures of trust, risk, and honesty
generally do not vary much with the intensity of genocide exposure for both the
directly-exposed group and the indirectly-exposed group. The only exception is that the
indirectly-exposed group tend to trust other people more. Similarly, personality traits
of directly-exposed and indirectly-exposed groups also do not differ much and are
invariant to the intensity of exposure to violence. Overall, Figure C1 shows that
directly-exposed and indirectly exposed individuals appear similar in terms of survey
measures of trust, risk, honesty, and personality traits, and their behaviours, attitudes,
and personality traits are not affected by the intensity of genocide exposure.
Figure C1: Mean of behaviour in survey outcomes of directly-exposed and indirectly-
exposed groups by different degrees of exposure to violence during the KR regime
We also use behavioural outcomes and personality traits collected in the survey
to examine the effects of violence exposure using OLS regressions. Table C1 reports
89
1011
Ave
. Ind
ex
Low Medium HighIntensity of KR mortality
Trust
34
56
Ave
. Ind
ex
Low Medium HighIntensity of KR mortality
Lending to Friends
34
56
Ave
. Sco
re
Low Medium HighIntensity of KR mortality
Risk Taking
23
45
Ave
. Sco
re
Low Medium HighIntensity of KR mortality
Honesty
23
45
Ave
. Sco
re
Low Medium HighIntensity of KR mortality
Extraversion
23
45
Ave
. Sco
re
Low Medium HighIntensity of KR mortality
Agreeableness
23
45
Ave
. Sco
re
Low Medium HighIntensity of KR mortality
Conscientiousness
23
45
Ave
. Sco
re
Low Medium HighIntensity of KR mortality
Neuroticism
23
45
Ave
. Sco
re
Low Medium HighIntensity of KR mortality
Openness
Indirectly Exposed Directly Exposed

69
results for trust (column 1), lending to friends (column 2), risk (column 3), honesty
(column 4), extraversion (column 5), agreeableness (column 6), conscientiousness
(column 7), neuroticism (column 8), and openness (column 9).
Columns 1 to 4 of Table C1 show that the interaction term between genocide
intensity and exposure on behavioural outcomes collected through survey
questionnaires is not statistically different from zero. These results are consistent with
the patterns revealed in Figure C1. Thus, there are no differential effects on survey-
based measures of trust, risk and honesty between directly-exposed and indirectly-
exposed groups at the different level of conflict intensity. The findings here suggest that
survey questions are likely less effective in detecting subtle behavioural differences.
Similarly, the estimates in Table C1 also do not reveal any statistical significant
relationship between the intensity of violence exposure and personality traits for both
the directly exposed and indirectly exposed groups. If personality change occurs
primarily during young adulthood and plateaus by late middle age as McCrae et al.
(1999) proposes, then our estimates imply that violence exposure does not affect
personality traits. However, it is possible that genocide exposure affects personality
traits, but the effects dissipate over time. For example, Lewis (2001) and Neyer and
Asendorpf (2001) argue that personality traits are sensitive to environmental influences
and, therefore, are likely to change over time and across contexts, especially during
development periods characterized by pervasive internal and external change. It is also
possible that exposure to genocide actually affects personality traits, but the effect
captured by our survey instrument is similar for the directly-exposed and indirectly-
exposed individuals.

70
Table C1: Estimates of effects of exposure to genocide on social behaviour, risk, and personality traits using attitudinal survey questions
Dependent variable: Trust index Past lending behaviour
index
Risk taking regarding household finances
Honesty Extraversion Agreeableness Conscientious-ness Neuroticism Openness
(1) (2) (3) (4) (5) (6) (7) (8) (9) KR mortality rate (β1) 0.353 0.356 0.269 0.117 0.288 -0.226 0.298 0.036 -0.285 (0.599) (0.674) (0.681) (0.374) (0.250) (0.249) (0.276) (0.206) (0.183) Direct exposure (β2) -0.389 -0.018 0.423 0.089 0.191** -0.101 0.097 -0.030 0.068 (0.279) (0.247) (0.445) (0.131) (0.076) (0.093) (0.164) (0.103) (0.136) KR mortality rate × Direct exp. (β3) 0.125 0.281 -0.881 0.317 -0.300 0.456** 0.092 -0.070 -0.004 (0.723) (0.799) (1.173) (0.349) (0.265) (0.207) (0.454) (0.262) (0.485) Age 0.012 0.001 -0.032** 0.000 -0.002 -0.001 0.007 0.000 -0.007 (0.014) (0.013) (0.013) (0.009) (0.006) (0.005) (0.005) (0.007) (0.006) Education (years) 0.113*** 0.110*** 0.006 0.010 0.027*** -0.004 -0.006 -0.029*** 0.002 (0.022) (0.021) (0.014) (0.011) (0.008) (0.006) (0.007) (0.010) (0.009) Male 0.572*** 0.094 0.252*** 0.025 0.018 -0.000 -0.153** -0.400*** 0.037 (0.145) (0.171) (0.088) (0.078) (0.074) (0.056) (0.066) (0.040) (0.080) Phnom Penh -0.365 0.155 -0.143 -0.206 0.026 -0.100 0.193* -0.041 0.106 (0.247) (0.265) (0.244) (0.155) (0.099) (0.121) (0.111) (0.113) (0.101) R-squared 0.078 0.076 0.018 0.015 0.039 0.005 0.033 0.102 0.011 Observations 492 492 492 492 492 492 492 492 492 KR mortality rate + KR mortality rate × Direct exp. (β1+ β3) 0.478 0.637 -0.612 0.434 -0.012 0.230 0.390 -0.034 -0.289 (0.457) (0.250) (0.523) (0.262) (0.964) (0.425) (0.149) (0.911) (0.477)
Note: Robust standard errors clustered by districts (68 districts) are reported in parentheses. *** significant at 1%, ** significant at 5%, * significant at 10%.