the macog freight transportation · pdf fileintroduction 3 freight steering ... these goods...
TRANSCRIPT

The MACOG Freight Transportation Study:
An Analysis of Freight Capacity and Movement in Northern Indiana
FY 2004
April 13, 2004
The Michiana Area Council of Governments 227 West Jefferson Boulevard #1120
South Bend, Indiana 46601 574-674-8894
[email protected] www.macog.com
The MACOG Freight Transportation Study FY 2004
Table of Contents
Executive Summary 2
Introduction 3
Freight Steering Committee 4 The MACOG Region 5 Highway Networks 5
Railroad Networks 6 Airport Facilities 7
Land Use Trends
Elkhart County 8 Kosciusko County 9
Marshall County 10 St. Joseph County 10
Socio-Economic Trends 12
Summary of Freight Movement State of Indiana 15
North Central Indiana Region 16
Freight Inventory Survey Findings Introduction 18 Methodology 19 Motor Carriers 20 Rail Carriers 20 Air Carriers 22 Manufacturers and Warehousers 23
Suggested Improvements 26
Appendices A. NAICS Definitions 29
B. Sample Surveys 31 C. Responses to Survey Question 36 D. Bibliography 38
1

The MACOG Freight Transportation Study FY 2004
Executive Summary The purpose of this study is to identify transportation network related problems in North Central Indiana as they relate to freight haulers. This study analyzed the current transportation network, identified key freight stakeholders, conducted a survey of over 500 freight haulers, and identified growth areas in each of the communities in North Central Indiana. For this study North Central Indiana was defined as the counties served by the Michiana Area Council of Governments, Elkhart, Marshall and St. Joseph Counties, as well as Kosciusko County. These four counties have a population of over 550,000 and a workforce of over 250,000. Twenty-four federal or state highways, three national rail carriers and two short-line carriers, and South Bend Regional Airport serve the transportation needs of North Central Indiana and provide access to markets far beyond the Midwestern United States. Economic growth is occurring in all four of the counties in North Central Indiana. Each of the communities in the region is experiencing growth in industries that frequently utilize freight. The RV industry in Elkhart County is experiencing growth at a rapid pace. These manufacturers of large RVs are some of the larger freight haulers in the region that were surveyed for this study. Fifty-three percent of all jobs in North Central Indiana are in industries that primarily utilize freight carriers. This indicates how important freight movement is to the businesses in North Central Indiana. In 1998, 698,000,000 tons of goods were hauled to, from, and within Indiana. 72% of these goods were carried by motor carriers on the state highway system. In 1993, 6.4% of the goods carried by truck in the State of Indiana originated in North Central Indiana. The freight originating in North Central Indiana is expected to increase from 14 million tons to 17 million tons by 2015. A survey of freight haulers in North Central Indiana including motor carriers, rail carriers, air carriers, manufacturers, and warehousers were included as part of this study. This survey was done to identify the problems with the regions’ transportation network as they apply to freight movement, and gained input from the freight haulers that use the transportation network everyday This study identified; key growth areas by businesses who utilize freight and perceive a need for better access to major transportation routes, the importance of freight movement to North Central Indiana as well as Indiana as a whole, transportation network issues, and transportation policy issues in our region and nationwide.
2

The MACOG Freight Transportation Study FY 2004
Introduction1
In 1998, the United States Department of Transportation and the Federal Highway Administration continued its commitment to comprehensive, cooperative and coordinated transportation planning with the passage of the Transportation Equity Act for the 21st Century (TEA-21). TEA-21 increased funding levels for both the nation as a whole to $37 billion per year, and to Indiana with an average of $611 million per year over the life of the bill (1998-2003)2. The legislation provided a greater opportunity to increase the efficiency of the North Central Indiana transportation network and for enhanced mobility of goods and persons. One of the components of TEA-21 supports planning activities that address goods movement and the freight industry’s participation in the Metropolitan Planning Organization’s regional transportation planning process. The consideration of freight movement as part of the planning process brings to mind opportunities benefiting the entire multi-modal and intermodal system including:
• Development and maintenance of an efficient road network for the movement of goods and people
• Reduction of traffic congestion • Opportunities to influence routing and enhance modal choice • Reduction of mobile source air pollution
Two of the seven planning emphasis areas required under TEA-21 identify the need to “increase the accessibility and mobility options available to people and for freight” and to “enhance the integration and connectivity of transportation systems, across and between modes, for people and freight.” Further, it is the Michiana Area Council of Governments’ intent to identify public and private freight carriers and providers…and give their representatives an opportunity to comment on the transportation planning process. Direct links can be made to the importance of freight planning as it relates to infrastructure planning, economic development, environmental protection, and increased safety. The purpose of The MACOG Freight Transportation Study: An Analysis of Freight Capacity and Movement in Northern Indiana is to explore growth and congestion affecting freight movement in North Central Indiana. The study addresses truck, rail, and airfreight movement.
1This section includes information taken from the 1999 Michiana Freight Transportation Study, produced by MACOG. 2 TEA-21 expired on September 30, 2003.
3

The MACOG Freight Transportation Study FY 2004
Freight Steering Committee A steering committee was brought together to help guide the MACOG staff through the Freight Transportation Study process. The committee members are industry representatives as well as local and state government agency representatives. The committee’s primary responsibility was to review the Freight Inventory Survey and to provide industry expertise as needed. Because of the nature of freight transportation, these industry representatives were able to guide the staff in asking the correct questions of the companies surveyed who handle freight in Northern Indiana. The committee provided resources to the staff that ensured the most comprehensive survey possible. The committee reviewed the results of the survey, and gave their own opinions to staff about what areas of the regions’ transportation network need improvements for more efficient freight transportation. The Freight Steering Committee first met on October 29, 2003. The committee was presented with the findings from the last survey completed in FY 2000. The committee was also asked to review the survey forms and respond back to MACOG staff members with their recommendations. Table 1.1 Members of the Committee include: Name Agency Representation Jason Kaiser INDOT - Ft. Wayne District Region/Highways Jamile Smith INDOT - LaPorte District Region/Highways John Schalliol South Bend Regional Airport Region/Air Freight Andrew Maksymovitch Elkhart Municipal Airport Region/Air Freight Chuck Compton South Shore Freight Region/Rail Carriers Barry Chase KBT Leasing Region/Motor Carriers Bob Schrameyer Hill Truck Sales Region/Motor Carriers Kyle Hannon Elkhart Chamber of Commerce Region/Manufacturers & COC Abe Marcus South Bend Warehousing Region/Warehousers Rick Pharis Elkhart County Highway Dept. Elkhart County Rob Ladson Kosciusko County Highway Dept. Kosciusko County Troy Kiefer Marshall County Plan Commission Marshall County Owen Rock South Bend Comm. & Econ. Dev. St. Joseph County The steering committee provided valuable input throughout the process of the survey. They returned input on who should be surveyed and also provided new resources for identifying freight haulers in North Central Indiana. Throughout the process various members of the committee were called upon to answer questions and provide input to the staff. Finally the committee reviewed the final document of the project. The Freight Steering Committee will remain an active standing committee within MACOG. The committee will meet twice annually to review transportation project submissions into the MACOG Transportation Improvement Program and provide the staff input as needed.
4

The MACOG Freight Transportation Study FY 2004
The MACOG Region The Michiana Area Council of Governments (MACOG) is a regional intergovernmental agency established to foster cooperative, coordinated and comprehensive planning activities. The MACOG region (see Figure 2.1) represents Elkhart, Marshall and St. Joseph Counties in Indiana, and is the designated "Metropolitan Planning Organization" (MPO) in North Central Indiana. As an MPO, MACOG, in coordination with state departments of transportation and public transit operators, is responsible for carrying out the transportation planning process for the urbanized areas of South Bend-Mishawaka and Elkhart-Goshen. For this study Kosciusko County is being included in the MACOG region as well, because of its relationship it has with the other counties in the region.
Figure 2.1 The MACOG Regionshowing Elkhart, Kosciusko,Marshall and St. Joseph Counties.
Highway Networks The National Highway System (NHS) and other major state routes were used in this study as a basis for identifying travel corridors highly important to freight movement (see
Figure 2.2 The Roadways in the MACOG Region. On the left is the NationalHighway System; on the right are Other Major Highways in the Region.
5

The MACOG Freight Transportation Study FY 2004
Figure 2.2). The NHS routes are the focus of federal-aid resources on roads and are the backbone of the interstate and national defense systems. Many times these roads serve as major economic corridors. Below in Table 2.1 are the NHS routes in North Central Indiana. Supplemental to the NHS are the state highways that connect cities and towns throughout the state. These state routes serve as major freight movement and economic corridors to the smaller cities and towns not designated as part of the NHS. Table 2.1 National Highway System (NHS) Routes in North Central Indiana. Road Name Counties Connections I-80/90 or Indiana Toll Road St. Joseph, Elkhart Chicago, Ohio US 33 St. Joseph, Elkhart Fort Wayne, Ohio US 20 St. Joseph, Elkhart South Bend, Mishawaka, Elkhart, Goshen US 31 Bypass St. Joseph South Bend, SW Michigan US 31 St. Joseph, Marshall Indianapolis, Southern Indiana US 30 Kosciusko, Marshall Fort Wayne, Chicago CR 17 Elkhart I-80, Goshen, Elkhart County SR 331 St. Joseph, Marshall I-80, Mishawaka, Marshall County Table 2.2 State Highway Routes in North Central Indiana. Road Name Counties Connections SR 13 Elkhart, Kosciusko Elkhart County, Central Indiana SR 15 Elkhart, Kosciusko Michigan, Central Indiana SR 17 Marshall Logansport, Western Indiana SR 19 Elkhart, Kosciusko Elkhart, Central Indiana SR 10 Marshall Southern Marshall County SR 14 Kosciusko Fort Wayne, Rochester US 6 Elkhart, Marshall, St. Joseph Chicago, Ohio SR 933 St. Joseph St. Joseph County US 20 Elkhart, St. Joseph Chicago, Toledo US 120 Elkhart Elkhart, NE Indiana SR 119 Elkhart SW Elkhart County SR 106 Marshall Bremen SR 331 Marshall, St. Joseph Mishawaka, Marshall County SR 25 Kosciusko Logansport, Lafayette SR 2 St. Joseph NW Indiana SR 4 St. Joseph Elkhart County, St. Joseph County
Railroad Networks Another important transportation system in North Central Indiana, integral to freight movement, is the railroad network. There are five companies operating railroads in North Central Indiana. These are Canadian National (Grand Trunk and Western), CSX, Norfolk Southern, Chicago South Shore and South Bend Railroad, and the Elkhart and Western Railroad (See Figure 2.3).
6
The MACOG Freight Transportation Study FY 2004
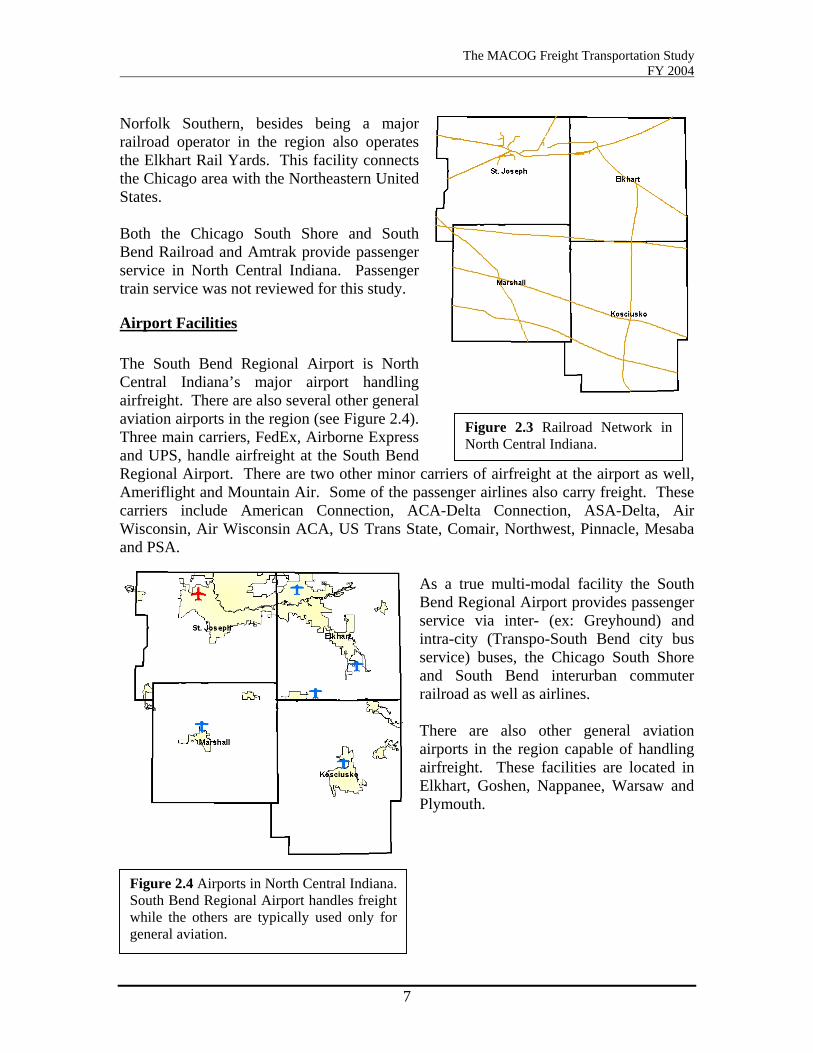
Norfolk Southern, besides being a major railroad operator in the region also operates the Elkhart Rail Yards. This facility connects the Chicago area with the Northeastern United States. Both the Chicago South Shore and South Bend Railroad and Amtrak provide passenger service in North Central Indiana. Passenger train service was not reviewed for this study.
Airport Facilities The South Bend Regional Airport is North Central Indiana’s major airport handling airfreight. There are also several other general aviation airports in the region (see Figure 2.4). Three main carriers, FedEx, Airborne Express and UPS, handle airfreight at the South Bend Regional Airport. There are two other minor carriers of airfreight at the airport as well, Ameriflight and Mountain Air. Some of the passenger airlines also carry freight. These carriers include American Connection, ACA-Delta Connection, ASA-Delta, Air Wisconsin, Air Wisconsin ACA, US Trans State, Comair, Northwest, Pinnacle, Mesaba and PSA.
Figure 2.3 Railroad Network inNorth Central Indiana.
As a true multi-modal facility the South Bend Regional Airport provides passenger service via inter- (ex: Greyhound) and intra-city (Transpo-South Bend city bus service) buses, the Chicago South Shore and South Bend interurban commuter railroad as well as airlines. There are also other general aviation airports in the region capable of handling airfreight. These facilities are located in Elkhart, Goshen, Nappanee, Warsaw and Plymouth.
Figure 2.4 Airports in North Central Indiana.South Bend Regional Airport handles freightwhile the others are typically used only forgeneral aviation.
7

The MACOG Freight Transportation Study FY 2004
Land Use Trends Current and future industrial and commercial developments will greatly influence freight movement throughout each of the counties and the region. Looking at land use trends in the area will provide planners with the necessary information to improve existing facilities or build new facilities for future growth. Each county was examined individually on the basis of current and future land use.
Elkhart County US 33 running from the southeast corner of Elkhart County to the southern edge of the City of Elkhart is the major corridor for development through Elkhart County. The City of Goshen, the City of Elkhart, and unincorporated areas of these communities are growing along this major transportation route as well as several secondary routes. The City of Goshen is experiencing industrial growth to its south and east along the US 33 corridor. This is an unincorporated area that is served by Goshen utilities, but is not a part of the city. Other areas around Goshen experiencing growth are areas to the north of Goshen along US 33. This development is primarily commercial and draws consumers to this area from both Elkhart and Goshen. (Hauflaire, 2004) The US 33 corridor will continue to be an important growth area for the City of Goshen. Other areas of future development include areas south of Goshen along CR 27, CR 38 and CR 40. A new CR 17 (possibly limited-access) will be constructed to the west of Goshen; it is suspected this new road will produce “development on adjacent lands contiguous to the roadway” (Hauflaire, 2004). The City of Nappanee sits at the intersection of US 6 and SR 19. US 6 has traditionally been the major corridor for commercial and industrial growth in this community. This corridor continues to be the primary area for growth as new businesses are building to the east and west of the City. Mostly new manufacturing businesses have moved into the community in the last 10 years. (Andrews, 2004) Unincorporated areas of Elkhart County are experiencing development just the same as the cities are. CR 17 east of Elkhart between the Dean Mock Expressway (US 20) and SR 120 serves as a connector to the Indiana Toll Road (I-80/90) and is experiencing both commercial and industrial growth. SR 19 at CR 24 south of the City of Elkhart is experiencing growth as the urban area begins to spread outward past the boundary of the Dean Mock Expressway (US 20). The Town of Wakarusa, along SR 19 at the intersection of CR 40, is experiencing growth of large manufacturers and the supporting commercial retail businesses as well. (Byers, 2004) New growth areas in unincorporated Elkhart County are suspected to be west of the Town of Bristol along SR 15 and the Norfolk Southern Railroad tracks and at the intersection of CR 17 and CR 6 east of the City of Elkhart. The area west of Bristol is about 500-600 acres and will be mostly industrial with the possibility of heavy freight
8

The MACOG Freight Transportation Study FY 2004
movement by rail and truck. The CR 17 and CR 6 intersection is suspected to be primarily commercial office and retail development with some warehousing as well. (Byers, 2004) Each of the communities in Elkhart County use various, proactive forms of incentives to promote and attract businesses. These incentives include: TIF districts, tax abatements, and infrastructure grants. The cities administer these programs themselves, or in the case of the County by the County Economic Development Corporation. (Andrews, Byers, Hauflaire, 2004)
Kosciusko County Traditionally commercial and industrial growth in Kosciusko County has occurred along major highway corridors and continues to do so today. These highway corridors are US 30, SR 15 and SR 13. Over the last ten years commercial and industrial development has occurred around the City of Warsaw, in Plain and Wayne Townships, as well as in Turkey Creek Township (Town of Syracuse) in the northeastern portion of Kosciusko County. (Sandy, 2004) US 30 and SR 15 intersect on the north side of Warsaw; commercial development has grown to the north of this intersection, towards the Town of Leesburg for some time. These commercial developments have primarily been ‘big-box’ retailers as well as smaller stand alone businesses. Other commercial development has occurred along the SR 13 corridor in northeast Kosciusko County in the Town of North Webster. These areas of commercial growth are expected to continue into the future as the County and Cities continue to grow along these transportation corridors. (Sandy, 2004) Industrial growth is currently focused along US 30. The primary areas for industrial growth have been the western side of Warsaw and westward from the Town of Pierceton to Warsaw along US 30. Industrial development will continue to be focused along the US 30 corridor to the west and east of Warsaw as well as in the current industrial parks throughout the county. (Sandy, 2004) These areas of growth mentioned above will continue to be viable areas for commercial and industrial growth for the foreseeable future. Recently Kosciusko County has been hit with two large manufacturing plant closings as well as news that one large employer will be expanding in the community. (Sandy, 2004) Kosciusko County supports the attraction and retention of businesses in their communities through the use of various financial programs such as TIF districts and tax abatements. The County and the various Cities and Towns administer these programs sometimes in cooperation with the Chamber of Commerce (Mitchell, 2004).
9

The MACOG Freight Transportation Study FY 2004
Marshall County In Marshall County commercial and industrial growth has traditionally occurred along the highways of US 6, US 30, US 31, SR 17, and SR 110. Development has occurred in the Towns of Bremen, Argos, Culver and the City of Plymouth. Plymouth, the largest community in Marshall County, has seen much of the commercial and industrial development. US 30, US 31 and SR 17 come into the City providing it with ready access to two of the States’ major transportation routes (US 30 and US 31). (Kiefer, 2004) Over the last ten years a mix of small and medium sized industries have located in Marshall County. These businesses include: food processing, packaging, electronics and genetics companies among others. Commercial development in the County has focused on large national chain restaurants and ‘big-box’ retailers as well as unique eating establishments in downtown areas. (Kiefer, 2004) Much of these areas seeing current development are still viable for future commercial and industrial growth. Only the Town of Culver seems to struggle to develop commercial and industrial areas; further commercial and industrial growth in this community is hindered by poor access to major transportation corridors. “Both the County and Town of Culver are pursuing ways to improve highway access to this area” (Kiefer, 2004). Once a new reconfigured US 31 is constructed, areas of additional growth may occur around the Town of Lapaz as well. (Kiefer, 2004) The Towns and Cities of Marshall County have been proactive in using tax abatements to attract businesses to their communities. Towns in Marshall County have offered utility partnerships as well. The City of Plymouth has a very aggressive TIF district program. Marshall County, on the other hand, “has been reluctant to offer such incentives…the County’s policy on development is that it should occur in and around the existing towns where services can most economically be provided” (Kiefer, 2004).
St. Joseph County Industrial development in St. Joseph County has occurred in a few large areas in both of the major communities, South Bend and Mishawaka. These areas continue today as the primary industrial growth areas for the entire county. These areas include the Studebaker Corridor and Oliver Plow Works Site in west central South Bend and the Blackthorn area on the northwest side of South Bend. The AM General area continues to be a strong industrial corridor in Mishawaka. (Rock and Sante, 2004) Industrial development has spread in recent years to several new facilities in St. Joseph County. This includes the IN/TEK-IN/KOTE facilities near the Town of New Carlisle, as well as a new ethanol production plant and other warehousing and manufacturing businesses along US 31 on the western edge of South Bend. (Rock and Sante, 2004) Commercial development in St. Joseph County has been focused in several main areas for several decades. The Grape Road/Main Street Corridors on the north side of
10
The MACOG Freight Transportation Study FY 2004
Mishawaka continue to develop as one of the regions’ premier retail areas. Other commercial development is occurring on the south side of South Bend near the former Scottsdale Mall site along the Ireland Road corridor. Other areas of commercial development are along the traditional corridors leading into and out of the City of South Bend; these include, Western Avenue, Lincolnway East and West, Portage Avenue, Miami Street, and South Main and Michigan Streets. Downtown areas of both Mishawaka and South Bend continue to develop, mostly with large and small offices, as well as small retail businesses. (Rock and Sante, 2004) Future areas of commercial development in St. Joseph County will depend on the extension of municipal utilities into unincorporated areas. Included is the area around Capital Avenue where it intersects the Indiana Toll Road (I-80/90) and SR 23. The Ireland Road corridor on the south side of South Bend is also a developing commercial area. (Rock and Sante, 2004) A majority of the growth recently in South Bend has been with existing businesses. The City of South Bend has used the following economic development financial tools to attract, retain and help businesses grow: tax abatements, TIF districts, Urban Enterprise Zones, and redevelopment districts. (Rock and Sante, 2004)
11

The MACOG Freight Transportation Study FY 2004
Socio-Economic Trends3
Demographic and economic trends in North Central Indiana, just like many other parts of the country, are continuing to rise. The regional population continues to grow, increasing every year, since 1970. It has grown by 5.32%, from 454,687 to 567,535 (See Table 4.1). Table 4.1 Population by County.
1970 1980 1990 2000 2010 2020 2030Elkhart County 126,529 137,330 156,198 182,791 189,772 204,363 222,040Kosciusko County 48,127 59,555 65,294 74,057 76,139 79,839 83,981Marshall County 34,986 39,155 42,182 45,128 47,216 49,880 52,848St. Joseph County 245,045 241,617 247,052 265,559 270,266 283,885 297,557Region Total 454,687 477,657 510,726 567,535 583,393 617,967 656,4262010-2030 projections were provided by Stats Indiana Kosciusko County has produced the highest percentage growth rate of all the counties, adding 9.95% of its population since 1970. Elkhart County also continues to add population at a faster rate than the other counties, growing by over 50,000 since 1970. From 1970 to 1980 St. Joseph County lost about 3,500 persons. This losing trend, which was the result of an economic downturn years before, has since reversed itself and St. Joseph County is now growing by about 0.70% per year (See Table 4.2). Marshall County is also growing, but at a slower rate than Elkhart and Kosciusko Counties, but faster than St. Joseph County adding 1.94% of its population, since 1970.
Table 4.2 Average Population change per year 1990 to 2000.
# %Elkhart County 156,198 182,791 2659.3 1.45%Kosciusko County 65,294 74,057 876.3 1.18%Marshall County 42,182 45,128 294.6 0.65%St. Joseph County 247,052 265,559 1850.7 0.70%Region Total 510,726 567,535 5680.9 1.00%
Change per YearPopulation in 1990
Population in 2000
Economically the region is growing also. Incomes in the North Central Indiana region have been in line with, or slightly above the national and state levels for the last forty years. Table 4.3 shows this comparison. Incomes in the region have risen on average 0.3% or by $13,058 from 1990 to 2000.
Table 4.3 Median Household Income: County,State and Nation.
1970 1980 1990 2000Elkhart County $9,500 $17,593 $30,973 $44,478Kosciusko County $8,281 $16,754 $31,666 $43,939Marshall County $8,163 $16,519 $28,311 $42,581St. Joseph County $8,343 $17,570 $28,235 $40,420Region Total $8,572 $17,109 $29,796 $42,855State of Indiana 8,921$ 17,587$ 28,797$ 41,657$ United States 8,734$ 19,547$ 30,056$ 41,994$ 3 All data for this section comes from the United States Census Bureau 1970, 1980, 1990, and 2000 Decennial Census. Some projections were also obtained from STATS Indiana at Indiana University. See Appendix D for further information.
12
The MACOG Freight Transportation Study FY 2004
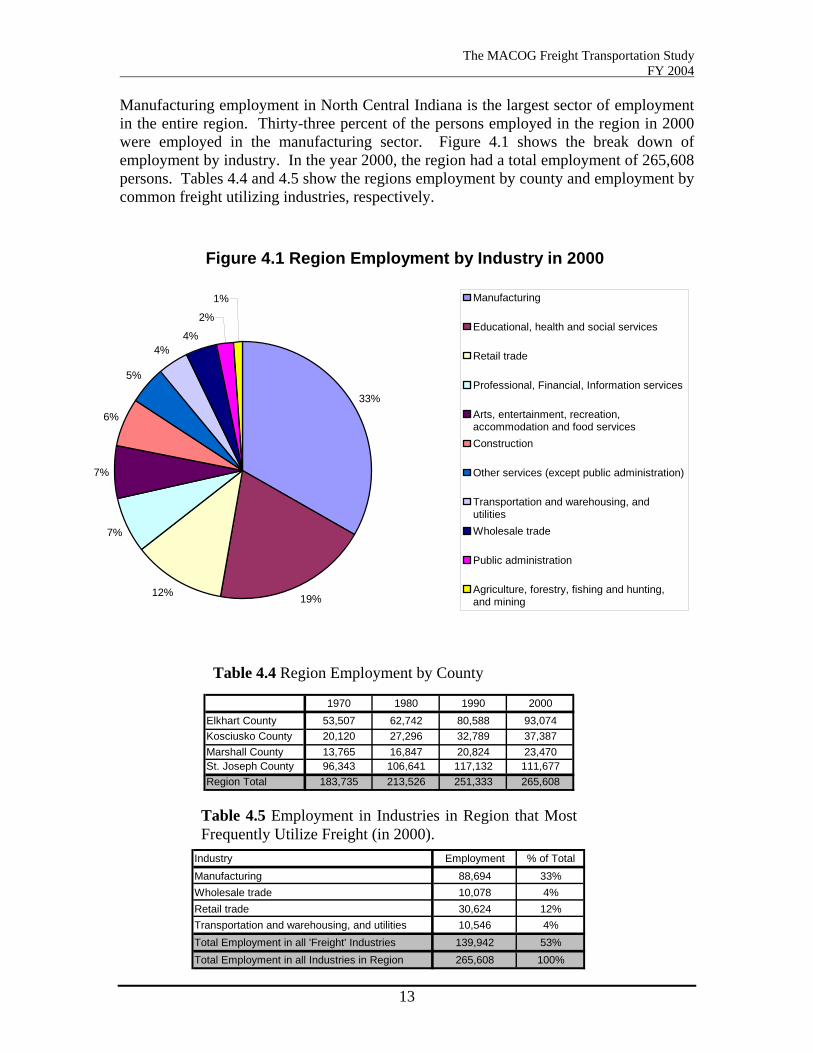
Manufacturing employment in North Central Indiana is the largest sector of employment in the entire region. Thirty-three percent of the persons employed in the region in 2000 were employed in the manufacturing sector. Figure 4.1 shows the break down of employment by industry. In the year 2000, the region had a total employment of 265,608 persons. Tables 4.4 and 4.5 show the regions employment by county and employment by common freight utilizing industries, respectively.
Figure 4.1 Region Employment by Industry in 2000
33%
19%12%
7%
7%
6%
5%
4%4%
2%
1% Manufacturing
Educational, health and social services
Retail trade
Professional, Financial, Information services
Arts, entertainment, recreation,accommodation and food servicesConstruction
Other services (except public administration)
Transportation and warehousing, andutilitiesWholesale trade
Public administration
Agriculture, forestry, fishing and hunting,and mining
Table 4.4 Region Employment by County
1970 1980 1990 2000Elkhart County 53,507 62,742 80,588 93,074Kosciusko County 20,120 27,296 32,789 37,387Marshall County 13,765 16,847 20,824 23,470St. Joseph County 96,343 106,641 117,132 111,677Region Total 183,735 213,526 251,333 265,608
Table 4.5 Employment in Industries in Region that MostFrequently Utilize Freight (in 2000).
13
Industry Employment % of TotalManufacturing 88,694 33%Wholesale trade 10,078 4%Retail trade 30,624 12%Transportation and warehousing, and utilities 10,546 4%Total Employment in all 'Freight' Industries 139,942 53%Total Employment in all Industries in Region 265,608 100%

The MACOG Freight Transportation Study FY 2004
As Table 4.4 shows, Elkhart and St. Joseph Counties are clearly where the major employers are located in the region. These two counties have over 75% of the persons employed in the entire region. Persons employed in freight related industries account for 53% of the individuals employed in North Central Indiana. When MACOG began this study, companies fitting into the industries specified in Table 4.5 were used. These are the industries that most typically ship and receive goods, thereby utilizing the regions’ highway and rail networks and airfreight facilities.
14

The MACOG Freight Transportation Study FY 2004
Summary of Freight Movement
State of Indiana The most recent data available comes from the U.S. Department of Transportation, Federal Highway Administration, Freight Transportation Profile – Indiana published in November 2002. In 1998, there were 698,000,000 tons of goods moved to, from and within Indiana. The majority (72%) of this movement occurred via highway. Freight movement by air was only 0.14% of total tons shipped; rail was 16%.
Figure 5.1 Goods Movement in Indiana
-
200
400
600
800
1,000
1,200
1998 2010 2020
Year
Tons
in m
illio
ns
Highway Air Rail Water/Other
Projections were also made for freight movement in 2010 and 2020 in Indiana. While the amount of freight shipped is expected to increase over this time period, the market share of highway, air and rail will remain at about the same percentages as in 1998. Table 5.1 and Figure 5.1 illustrate this point. Table 5.1 Goods Movement in Indiana. Type of Goods Movement 1998 2010 2020 Highway 506 million tons
72% of total 710 million tons 74% of total
836 million tons 75% of total
Air <1 million tons 0.14% of total
<1 million tons 0.10% of total
1 million tons 0.09% of total
Rail 113 million tons 16% of total
148 million tons 15% of total
169 million tons 15% of total
State Total 698 million tons 955 million tons 1,109 million tons Furthermore, in 1998, 97% of the total freight to, from, and within Indiana was for the domestic market. The remaining 3%, then, was for international markets. The Federal Highway Administration projects that these percentages will remain the same in 2010 and 2020.
15

The MACOG Freight Transportation Study FY 2004
Table 5.2 The top five commodities shipped in 1998 were: Commodities Tonnage % of Total Nonmetallic Mineral 191 million 27% Coal 80 million 11% Farm Products 64 million 9% Primary Metal Products 60 million 9% Secondary Traffic4 47 million 7% The year 2020 projections for commodities by Federal Highway Administration, show shipments of these products are expected to increase. For the most part, the market share of each commodity is expected to remain about the same. However, nonmetallic minerals has the only significant change in projected market share in the year 2020 – reduced from 27% in 1998 to 21% in 2020. Table 5.3 The top five commodities, year 2020 projections: Commodities Tonnage % of Total Nonmetallic Mineral 228 million 21% Secondary Traffic1 126 million 11% Coal 113 million 10% Farm Products 85 million 8% Primary Metal Products 99 million 9% North Central Indiana Region The most recent data (1993) for regional highway and rail freight come from a 1997 study entitled Transport Flows in the State of Indiana: Commodity Database Development and Traffic Assignment, completed by the Transportation Research Center and the Department of Geography at Indiana University. In 1993, 14.3 million tons or 6.4% of the state’s total goods moving by truck (e.g. highway) originated in this North Central Indiana.
Table 5.4 Top five commodities exported out of the region via truck were: Commodities Tonnage % of Total Nonmetallic Mineral 6.721 million 47% Stone, Clay and Glass Products 1.43 million 10% Transportation Equipment 1.144 million 8% Food and Kindred Products 1.144million 8% Lumber and Wood Products 1.001 million 7% By 2015, it is projected that the number of tons originating in the region to be shipped via highway will increase to almost 17 million. Nonmetallic minerals are still expected to be a top exported commodity at over 9.6 million tons. 4 Secondary traffic refers to the movement of goods between distribution centers or intermodal facilities. There are no categories of goods assigned to this movement.
16

The MACOG Freight Transportation Study FY 2004
In 1993 2.1 million tons or 3.4% of the state total freight shipped by rail originated in North Central Indiana. Table 5.5 The top five commodities exported by rail out of the region were: Commodities Tonnage % of Total Nonmetallic Mineral 315,000 15% Chemicals and Allied Products 315,000 15% Food and Kindred Products 273,000 13% Stone, Clay, and Glass Products 273,000 13% Primary Metal Products 273,000 13% Projections indicate that by 2015 the number of tons originating in the region to be shipped by rail will increase to 2.5 million. Again, non-metallic minerals are expected to be a top exported commodity at over 453,000 tons. Airfreight data for the region comes from the South Bend Regional Airport Annual Report. Although the airport does not provide projections for cargo, data from 1993, 1997 and 2002 can be used to generate un-official linear projections every four years. Table 5.6 Freight, loaded and unloaded, at South Bend Regional Airport. Year Freight tonnage (loaded and unloaded) 1993 6,895 1997 8,823 2001 12,137 2005 projections 16,118 2009 projections 21,405 2013 projections 28,426 These un-official projections show that the amount of freight loaded and unloaded at the South Bend Regional Airport could more than double in the next 12 years, if the rate of increase remained about the same from 2001 to 2013. Also, it is a positive sign for the region that the Airport’s official data from 1993 to 2001 show a definite steady increase in freight movement into and out of the Airport. More information on airfreight is provided under the ‘Air Carriers’ section of the Freight Inventory Survey findings chapter of this report.
17

The MACOG Freight Transportation Study FY 2004
Freight Inventory Survey Findings
Introduction In order to identify problems on North Central Indiana’s transportation network, a survey was conducted by MACOG to gain public input from the freight haulers who use the roadways, railways and airports everyday. The survey was conducted from late December 2003 through March 2004. One focus of the survey was to identify first hand, problems experienced on the region’s transportation network. The survey was also sought input to identify freight characteristics in the region. For example, what types of trucks were being used and what commodities are being carried. Surveys were sent out to 531 manufacturers, motor carriers, rail carriers, air carriers, and warehousers throughout the North Central Indiana Region. These companies returned a total of 139 surveys. This is a return rate of 26.2%. See Table 6.1 for a breakdown of returns by county and survey type.
Methodology MACOG staff conducted the Freight Inventory Survey with the input and resources of the freight steering committee members. The businesses identified for the survey were taken from several sources. Companies surveyed from the previous study were included in this survey as well. Additional companies were identified through the phone book, chamber of commerce directories, and steering committee input. The main way businesses were identified was through the North American Industrial Classification System or NAICS. The U.S. Department of Labor’s Bureau of Labor Statistics developed NAICS to systematically classify all divisions of labor in North America. The Freight Study conducted in 2000 used 25 SIC codes (Standard Industrial Classification codes, the predecessor to NAICS) to identify companies to survey. These codes were translated into NAICS codes. Then companies in each county were then identified for the 2004 survey. A listing of the NAICS codes used and their descriptions appears in Appendix A. The rail carriers and air carries were identified through this process and were contacted individually by MACOG staff for the completion of the survey. To make the survey easier for the companies to respond, a website was developed so companies could quickly and easily complete the survey using the Internet. This also made the compilation of the survey easier for MACOG staff members, because the data collected from the Internet based surveys was automatically stored in a database. Only twelve companies completed the survey on the Internet out of the 139 surveys that were returned. Although this is a small percentage of returns, MACOG is continuing to use the Internet as a valuable tool to reach the public.
18

The MACOG Freight Transportation Study FY 2004
Motor Carriers MACOG distributed eighty-one Freight Surveys to motor carriers in the four county region. Of these, nineteen or about 23% were returned. Each of the respondents was very informative and provided valuable information. Fourteen of the respondents stated there were transportation problems affecting their firms’ profitability. These responses ranged from general road maintenance issues to project specific concerns. Congestion and operators hours of service were also major concerns. The United States Department of Transportation Federal Motor Carrier Safety Administration implemented new Hours of Service (HOS) rules for truck drivers in January 2004. These new HOS rules changed the way in which a truck driver can count the hours they are on the job. The new rules state that a driver can have a 14-hour workday and can drive for 11 of those 14 hours.
“Under the old rules, work hours were cumulative. Truckers could stop the clock when they stopped for food or fuel or waited while their trucks were loaded or unloaded. Under the new rules, the clock doesn’t stop once the workday begins. Hours spent waiting at the loading docks are counted as part of a 14-hour workday.” (Bayles, 2004)
For both the motor carrier and manufacturing portions of this survey there was a total of 20 (14% of all surveys returned) responses about the HOS rule changes. All twenty of these responses were negative, as many saw these changes as cost increases for their companies. Table 6.1 Motor Carriers in North Central Indiana. This chart shows the number of vehicles owned and the annual vehicle mileage by vehicle class for survey respondents.
# % # % # % # %
141 9% 639 39.40% 67 4.13% 775 47.78% 85.37 1622
485,000 0.22% 45,948,000 21.25% 3,679,353 1.70% 166,104,306 76.82% 12,012,037 216,216,659Annual Mileage
Number of Trucks
Average Total< 6,000 lbs 6,001 - 19,500 lbs 19,501- 33,000 lbs >33,001 lbs
As shown in Table 6.1 there are a total of 1,622 vehicles in the survey respondents’ fleets. 87% of the vehicles are divided between two classes of trucks; the 6,001-19,500 pound class is typical of trucks like UPS, UHAUL and flatbeds, and the >33,001 class is typical of the average 18-wheel semis. The annual mileage for trucks based in North Central Indiana is over 216 million miles. The motor carriers in North Central Indiana drive an average of over 12 million miles
19
The MACOG Freight Transportation Study FY 2004
annually. Over 75% of the miles driven were in the largest of the four classes of vehicles (the > 33,001 class) with over 166 million miles driven. Seven respondents stated they have experienced local roadway problems while driving in North Central Indiana. These problems range from poor turning movements in many of the regions’ cities to height restrictions on under/overpasses as well as lack of rest areas along the highways for truckers. Over 90% of the regions’ trucking fleet uses diesel fuel. The remaining 10% use gasoline. This is an indication that there is little use of alternative fuels in the regions’ trucking fleet. 56% of the respondents to the survey said they carried ‘general commodities.’ One carrier stated they typically haul ‘hazardous materials’ while two carriers stated they carry refrigerated products. The other products motor carriers listed are RVs, auto parts, agricultural products, and septic waste among others. There was little response as to whether local trucking companies would be expanding in the next five years. Fourteen respondents said they would not be expanding; only one said they had warehouse expansion plans in the near future.
Rail Carriers As noted before, there are five freight hauling rail companies in North Central Indiana. These railroads include, Norfolk Southern, CSX, Elkhart and Western, Canadian National (Grand Trunk and Western), and Chicago South Shore and South Bend railroads. Three railroads responded to the survey. None of the survey respondents were aware of any problems on the highways or rail lines affecting their companies’ profitability. Two of the rail companies responding said they use transloading points in and around the North Central Indiana Region. The Chicago South Shore and South Bend railroad has transloading sites at Pine Road and at Smilax Road in St. Joseph County. CSX does not have any transloading sites in North Central Indiana but do have rail interchanges in Fort Wayne and Chicago. The Chicago South Shore and South Bend railroad is not capable of double stacking rail cars on its lines. This is due to the catenary lines overhead. These are electrical lines used by the passenger commuter rail service between the South Bend Regional Airport and Downtown Chicago. Each of the rail carriers surveyed carry various kinds of freight ranging from general commodities to hazardous materials as well as coal specifically.
20

The MACOG Freight Transportation Study FY 2004
The survey asked how many trains travel through the region on a daily basis. Norfolk Southern operates between 80 and 90 trains through the region. Most of these trains are on the northern most tracks running through Elkhart, Mishawka and South Bend. Some of the trains terminate/originate in Elkhart at the rail yards on the southwest side of the city. The Chicago South Shore and South Bend Railroad operates on an as-needed basis and only runs trains at the request of the customers they serve. This is on average about three trains per week. The two CSX railroads running east-to-west through the southern two counties of Kosciusko and Marshall handle 40-50 trains per day. The northern line, linking Auburn and Gary, Indiana carries 40-50 trains per day. The southern line, linking Fort Wayne and Gary, Indiana carries 6-8 trains per day. Of all of these companies combined about 120-140 trains travel through North Central Indiana each day. In the previous Freight Study, conducted in 2000, there were 232 trains per day through North Central Indiana. It should be noted that two rail companies did not respond to the current survey and the number of trains traveling on these tracks were not counted. Based on numbers from the previous study and the numbers collected from the current survey about 150-180 trains travel through North Central Indiana on all railroads. There are really no specific peak travel times on the railroads in North Central Indiana, Norfolk Southern noted that trains on their tracks usually run constant over the entire day. Only the Chicago South Shore and South Bend railroad expressed interest in possible expansion of their services. It was noted that they own various parcels of land in St. Joseph County that can be developed for new customers needing access to rail facilities. Some of the recommendations from the railroad companies to better improve the regions transportation system were to separate rail and highway crossing where feasible, to change policies to charge motor carriers their fair share of road maintenance costs and to change state/municipal policies to allow incentives for companies to have access to rail facilities to reduce congestion pollution and costs.
Air Carriers Airfreight is a growing business throughout the country. North Central Indiana is no exception to this. South Bend Regional Airport, or SBN, has seen an increase of freight handling of nearly 3,000 tons from January 2001 to December 2003. Three primary companies handle airfreight at SBN; FedEx, UPS and Airborne Express. Two smaller companies as well as the passenger carriers also haul freight. Figure 6.1 contains the amount of freight passing through SBN every month for the years 2001-2003. Most freight at SBN is brought into the region; only a slightly less amount actually leaves the region. In the three years studied 23,000 tons of freight came into North Central Indiana via air carriers at SBN. During this same time period nearly 18,000 tons of freight left North Central Indiana via SBN. In 2003 SBN handled a total of 30,191,756 pounds or 15,000 tons of freight. This survey did not collect information on where freight goes to or comes from in North Central Indiana.
21

The MACOG Freight Transportation Study FY 2004
An interesting note is that the terrorist attacks of September 11, 2001 did not have a lasting affect on freight movement at SBN. There was a slight decrease in the few months following the incident but the freight movement soon rebounded to pre-9/11 levels and above.
Figure 6.1 Total Freight Movement at SBN 2001-2003
0
500
1,000
1,500
2,000
2,500
3,000
3,500
January February March April May June July August September October November December
Tota
l Pou
nds
(in th
ousa
nds)
2001 2002 2003
A survey was sent to each of the airfreight carriers at SBN similar to the surveys sent to motor carriers and rail carriers. A total of six surveys were sent to the air carriers and to the Airport Authority itself. This resulted in a return of two surveys. The surveys that were returned provided detailed information about airfreight movement at SBN.
Figure 6.2 Total Air Freight by Company at SBN in 2001-2003 (Other Passenger*: This is all passenger aircraft carrying freight cargo, does not include mail).
0
2,000
4,000
6,000
8,000
10,000
12,000
14,000
16,000
18,000
20,000
Airborne FedEx UPS Other Freight Other Passenger*
Air Freight Companies
Am
ount
of F
reig
ht (b
y po
und)
(in th
ousa
nds)
2001 2002 2003
22

The MACOG Freight Transportation Study FY 2004
None of the survey respondents felt there were any transportation related problems facing them that would have a negative impact on their companies. The survey did show the various airfreight carriers base five planes at SBN. None of the survey respondents maintain a truck fleet at the airport. It was noted however by the Airport Authority that companies like UPS and FedEx base 25-30 trucks at the airport. The Airport Authority noted that mostly freight classified at ‘general commodities’ are handled by the air carriers at SBN. One air carrier is considering combining their air operations and truck fleet operations (currently located in another part of South Bend) into one new facility at SBN. SBN is also considering major expansion plans over the next several years. These plans include moving Lincolnway West to make room for a longer runway. These roadway plans are in the current MACOG Long Range Plan with a completion year of 2010.
Manufacturers and Warehousers The MACOG Freight Inventory Study identified over 430 manufacturers in the region to be surveyed. Manufacturers returned 115 surveys from the region. This resulted in a 25% rate of return on the surveys for manufacturers. Thirty-six respondents identified transportation related issues that affected the profitability of the manufacturer. These responses ranged from general road improvement concerns to congestion issues, from US DOT Hours of Service issues to motor carrier service and reliability issues. The US DOT HOS issues raised are similar to those raised by the motor carriers. Other areas affecting the profitability of local manufactures were poor access roads from rural areas to major highway routes. Congestion was an issue raised by five respondents. They noted that general traffic congestion in the region reduced the profitability of their businesses. 25% of the respondents to this question said there are issues with the service availability and reliability of motor carriers. North Central Indiana has a variety of products being manufactured in the region. 109 of the 115 respondents to the survey gave the general type of manufacturing in which they were involved. These 109 responses fit easily into twelve categories: medical supplies, boat/cargo trailers/buses, outdoor living, animal/human foods, eyeglasses/small assembly, metal fabrication, paper products/printing, manufactured housing/RVs/materials, auto parts, plastics/molding, electrical materials, and miscellaneous. The largest of these categories were the boat/cargo trailer/buses, metal fabrication, and manufactured housing/RV/materials industries; these three categories amount for 13.76%, 19.27%, and 22.02%, respectively, of the manufacturers responding to the survey. The survey respondents have a total of 439 loading/unloading docks at their facilities in North Central Indiana. This is an average of about 4.82 docks per manufacturer. 1,079
23

The MACOG Freight Transportation Study FY 2004
trucks deliver goods to North Central Indiana manufacturers each day. Manufacturers also ship out 1,234 truckloads of goods each day from North Central Indiana. This means that each manufacturer in North Central Indiana handles on average 10.48 incoming trucks per day and 12.22 outgoing trucks per day. Manufacturers in North Central Indiana receive or ship goods on average 4.93 days per week. Nearly 90% of the manufacturers surveyed said they ship or receive goods at least five days per week. Six respondents to the survey said they had rail access at their manufacturing facility. Of the six that responded four stated they used these facilities. A total of twenty-four railcars can be kept at manufacturers in North Central Indiana. An average of six railcars can be kept at each facility. Eleven respondents to the survey said they do not have rail service but added it would be in their interest to have rail access. Thirteen percent of respondents to the survey said transfer or transloading points were used to transfer their goods from one mode of transportation to another. These respondents transferred goods mostly from truck to rail and vice-versa. Some respondents also transferred goods to ships from trucks for international shipment. Most transfer points were in Indiana or Chicago, Illinois. The locations in Indiana were in Elkhart, Goshen and Indianapolis. Seven respondents stated their transfer points were in Chicago. Other sites included New Jersey, California, Canada, and Mexico.
Table 6.3 Reasons North Central Indiana manufacturers would like rail access. Grain shipmentMovement of goods to new warehouse if rail were presentRaw materials could be received via railIt would reduce our costs and save time
Sixty-four or 58% of respondents said they do not use ‘Just-in-Time’ (JIT) delivery. ‘Just-in-Time’ delivery is defined as goods that arrive at a location where there is little or no warehousing space; these goods are used rather quickly in the manufacturing process and are not warehoused, waiting to be used. 18% of the respondents said they do use JIT delivery because of lack of warehousing space. Another sixteen respondents said they use JIT delivery to control inventory and costs. Other respondents said JIT delivery is a customer or industry demand, because they only do specialized orders and manufacturing. 57% of the respondents said pre- or post-warehousing space is present at their facilities. Forty-nine percent of the respondents said they had some future plans for construction or relocation of their business in the next five years. Plans included: adding warehouse space, consolidating facilities, adding new production facilities, adding office space, and adding new equipment; as well as other continuous improvements to their manufacturing facilities in North Central Indiana. Only one warehouser responded to our survey. This warehouser stores general commodities at their facility in St. Joseph County. The twenty-four loading docks at this facility handle about forty incoming and outgoing (combined) truckloads per day. This
24

The MACOG Freight Transportation Study FY 2004
company does not have rail access and does not perceive any need for it in the future. The company also has no plans for capital improvements in the next five years.
25
The MACOG Freight Transportation Study FY 2004
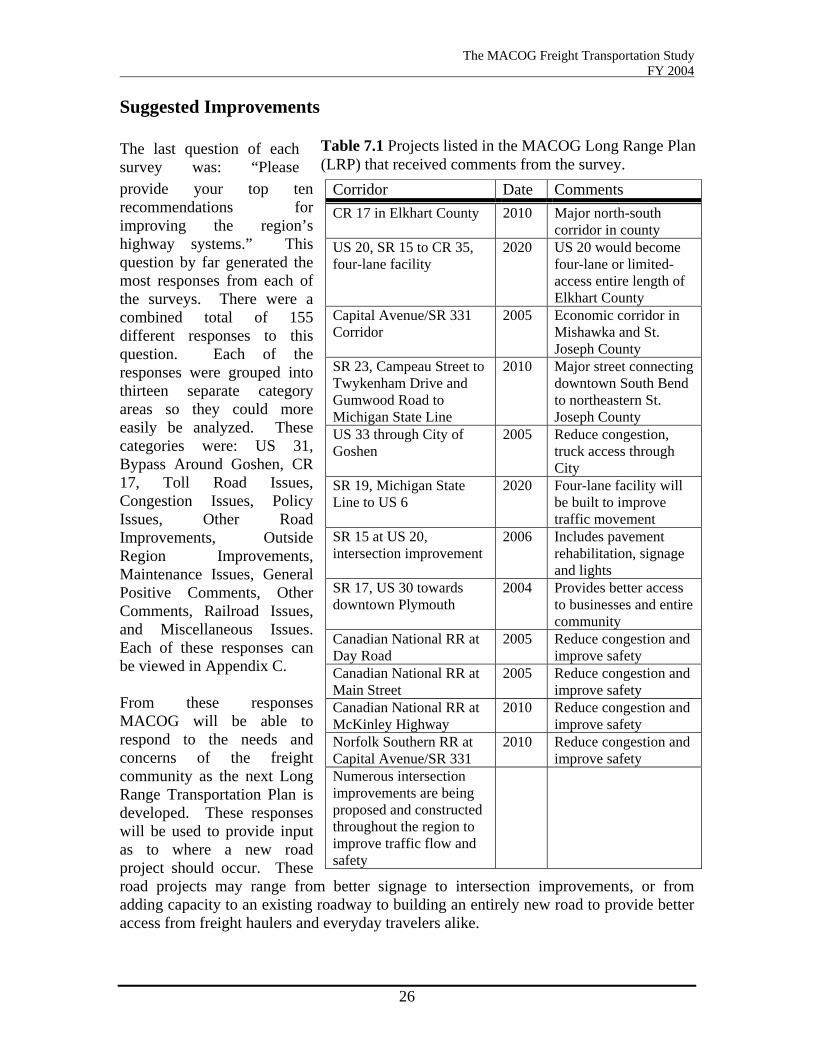
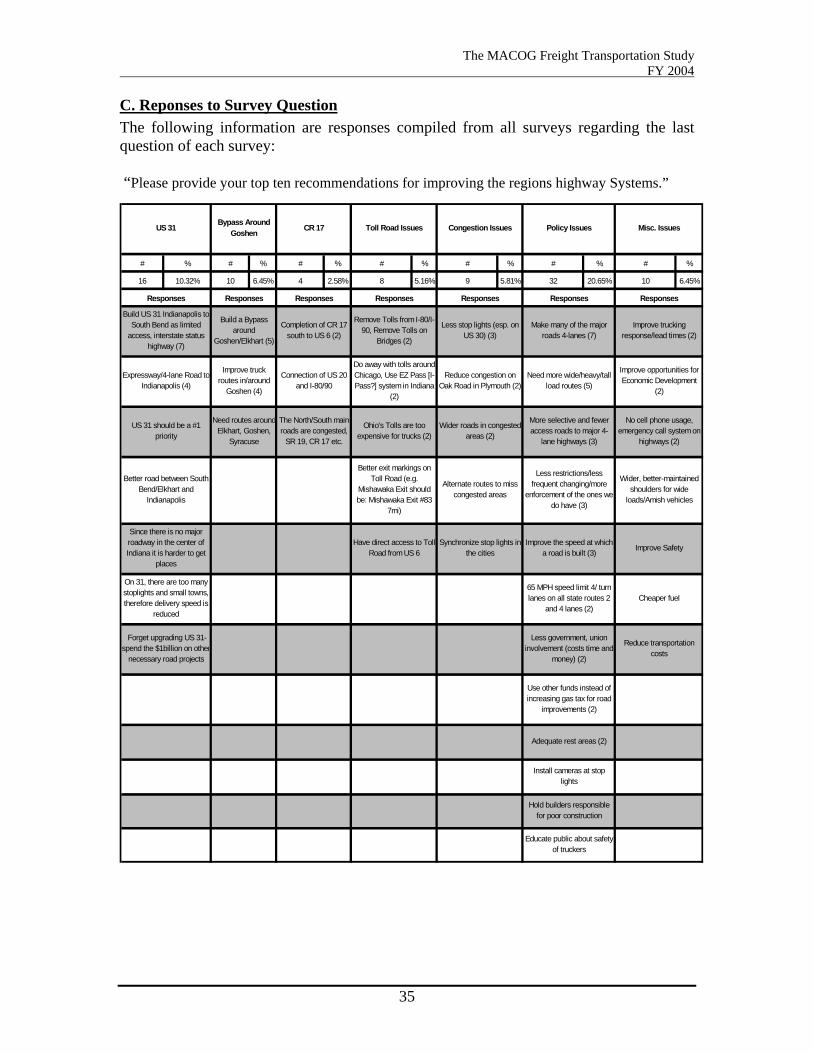
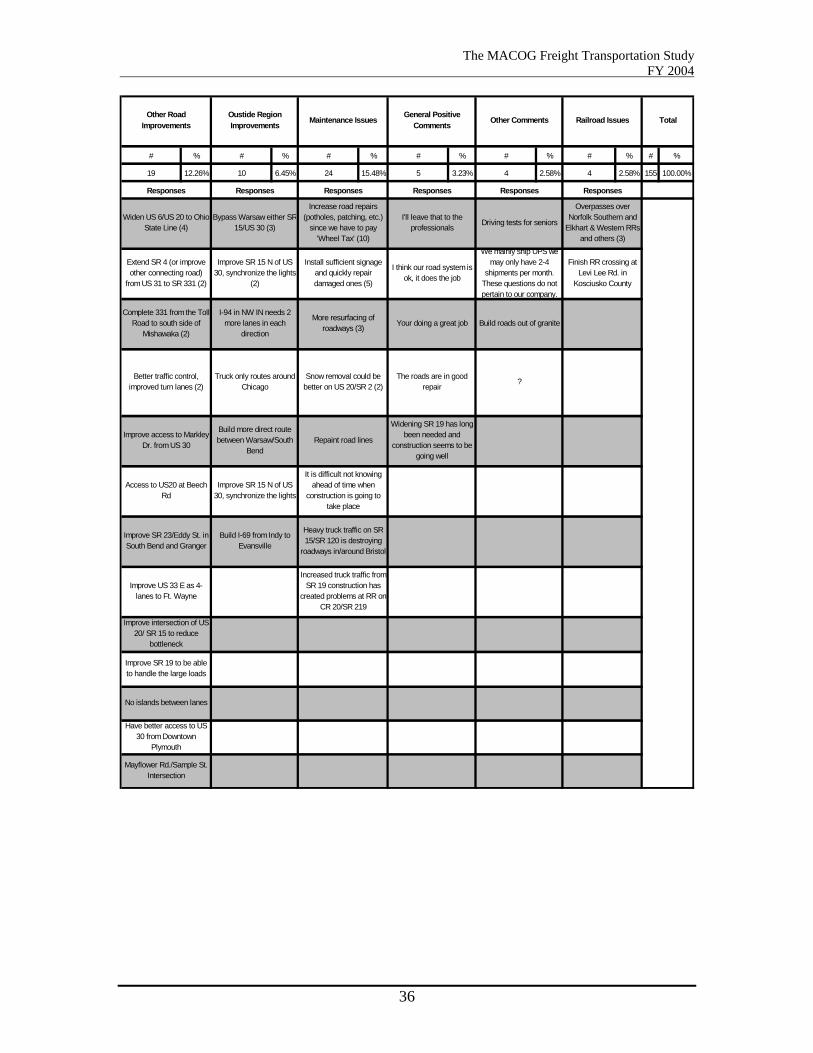
Suggested Improvements The last question of each survey was: “Please provide your top ten recommendations for improving the region’s highway systems.” This question by far generated the most responses from each of the surveys. There were a combined total of 155 different responses to this question. Each of the responses were grouped into thirteen separate category areas so they could more easily be analyzed. These categories were: US 31, Bypass Around Goshen, CR 17, Toll Road Issues, Congestion Issues, Policy Issues, Other Road Improvements, Outside Region Improvements, Maintenance Issues, General Positive Comments, Other Comments, Railroad Issues, and Miscellaneous Issues. Each of these responses can be viewed in Appendix C. From these responses MACOG will be able to respond to the needs and concerns of the freight community as the next Long Range Transportation Plan is developed. These responses will be used to provide input as to where a new road project should occur. These road projects may range from better signage to intersection improvements, or from adding capacity to an existing roadway to building an entirely new road to provide better access from freight haulers and everyday travelers alike.
Corridor Date Comments CR 17 in Elkhart County 2010 Major north-south
corridor in county US 20, SR 15 to CR 35, four-lane facility
2020 US 20 would become four-lane or limited-access entire length of Elkhart County
Capital Avenue/SR 331 Corridor
2005 Economic corridor in Mishawka and St. Joseph County
SR 23, Campeau Street to Twykenham Drive and Gumwood Road to Michigan State Line
2010 Major street connecting downtown South Bend to northeastern St. Joseph County
US 33 through City of Goshen
2005 Reduce congestion, truck access through City
SR 19, Michigan State Line to US 6
2020 Four-lane facility will be built to improve traffic movement
SR 15 at US 20, intersection improvement
2006 Includes pavement rehabilitation, signage and lights
SR 17, US 30 towards downtown Plymouth
2004 Provides better access to businesses and entire community
Canadian National RR at Day Road
2005 Reduce congestion and improve safety
Canadian National RR at Main Street
2005 Reduce congestion and improve safety
Canadian National RR at McKinley Highway
2010 Reduce congestion and improve safety
Norfolk Southern RR at Capital Avenue/SR 331
2010 Reduce congestion and improve safety
Numerous intersection improvements are being proposed and constructed throughout the region to improve traffic flow and safety
Table 7.1 Projects listed in the MACOG Long Range Plan (LRP) that received comments from the survey.
26
The MACOG Freight Transportation Study FY 2004
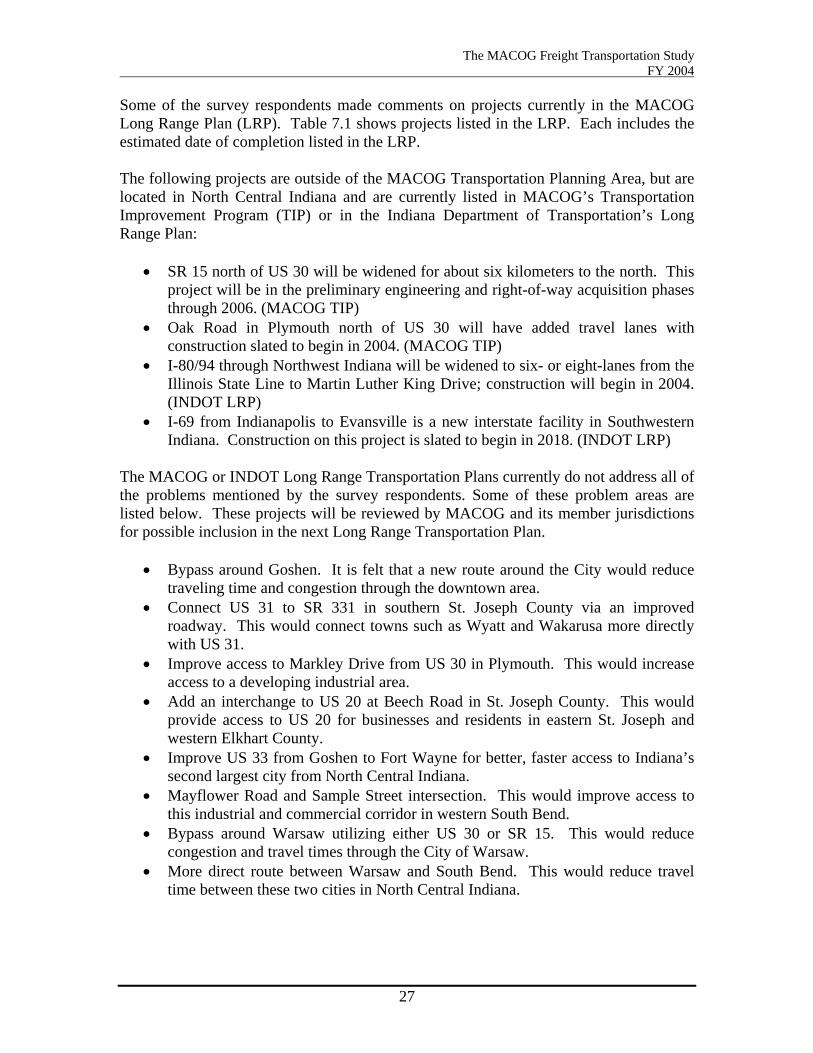
Some of the survey respondents made comments on projects currently in the MACOG Long Range Plan (LRP). Table 7.1 shows projects listed in the LRP. Each includes the estimated date of completion listed in the LRP. The following projects are outside of the MACOG Transportation Planning Area, but are located in North Central Indiana and are currently listed in MACOG’s Transportation Improvement Program (TIP) or in the Indiana Department of Transportation’s Long Range Plan:
• SR 15 north of US 30 will be widened for about six kilometers to the north. This project will be in the preliminary engineering and right-of-way acquisition phases through 2006. (MACOG TIP)
• Oak Road in Plymouth north of US 30 will have added travel lanes with construction slated to begin in 2004. (MACOG TIP)
• I-80/94 through Northwest Indiana will be widened to six- or eight-lanes from the Illinois State Line to Martin Luther King Drive; construction will begin in 2004. (INDOT LRP)
• I-69 from Indianapolis to Evansville is a new interstate facility in Southwestern Indiana. Construction on this project is slated to begin in 2018. (INDOT LRP)
The MACOG or INDOT Long Range Transportation Plans currently do not address all of the problems mentioned by the survey respondents. Some of these problem areas are listed below. These projects will be reviewed by MACOG and its member jurisdictions for possible inclusion in the next Long Range Transportation Plan.
• Bypass around Goshen. It is felt that a new route around the City would reduce traveling time and congestion through the downtown area.
• Connect US 31 to SR 331 in southern St. Joseph County via an improved roadway. This would connect towns such as Wyatt and Wakarusa more directly with US 31.
• Improve access to Markley Drive from US 30 in Plymouth. This would increase access to a developing industrial area.
• Add an interchange to US 20 at Beech Road in St. Joseph County. This would provide access to US 20 for businesses and residents in eastern St. Joseph and western Elkhart County.
• Improve US 33 from Goshen to Fort Wayne for better, faster access to Indiana’s second largest city from North Central Indiana.
• Mayflower Road and Sample Street intersection. This would improve access to this industrial and commercial corridor in western South Bend.
• Bypass around Warsaw utilizing either US 30 or SR 15. This would reduce congestion and travel times through the City of Warsaw.
• More direct route between Warsaw and South Bend. This would reduce travel time between these two cities in North Central Indiana.
27
The MACOG Freight Transportation Study FY 2004
Appendices
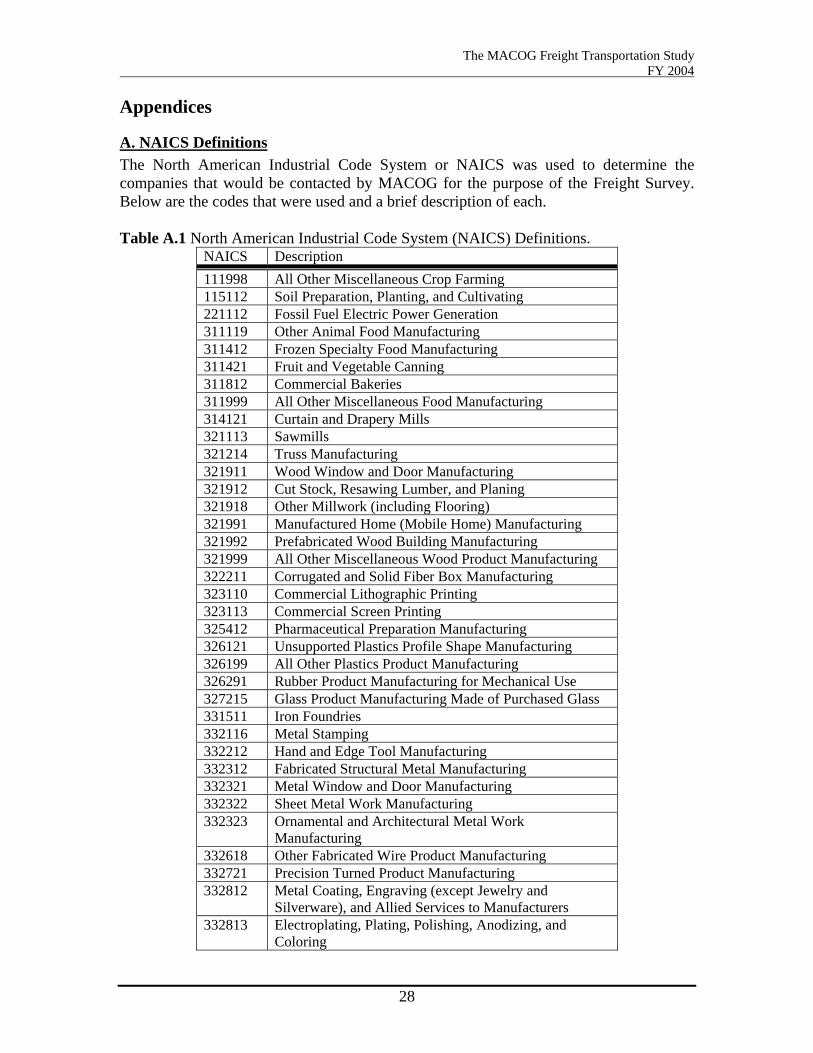
A. NAICS Definitions The North American Industrial Code System or NAICS was used to determine the companies that would be contacted by MACOG for the purpose of the Freight Survey. Below are the codes that were used and a brief description of each. Table A.1 North American Industrial Code System (NAICS) Definitions.
NAICS Description 111998 All Other Miscellaneous Crop Farming 115112 Soil Preparation, Planting, and Cultivating 221112 Fossil Fuel Electric Power Generation 311119 Other Animal Food Manufacturing 311412 Frozen Specialty Food Manufacturing 311421 Fruit and Vegetable Canning 311812 Commercial Bakeries 311999 All Other Miscellaneous Food Manufacturing 314121 Curtain and Drapery Mills 321113 Sawmills 321214 Truss Manufacturing 321911 Wood Window and Door Manufacturing 321912 Cut Stock, Resawing Lumber, and Planing 321918 Other Millwork (including Flooring) 321991 Manufactured Home (Mobile Home) Manufacturing 321992 Prefabricated Wood Building Manufacturing 321999 All Other Miscellaneous Wood Product Manufacturing 322211 Corrugated and Solid Fiber Box Manufacturing 323110 Commercial Lithographic Printing 323113 Commercial Screen Printing 325412 Pharmaceutical Preparation Manufacturing 326121 Unsupported Plastics Profile Shape Manufacturing 326199 All Other Plastics Product Manufacturing 326291 Rubber Product Manufacturing for Mechanical Use 327215 Glass Product Manufacturing Made of Purchased Glass 331511 Iron Foundries 332116 Metal Stamping 332212 Hand and Edge Tool Manufacturing 332312 Fabricated Structural Metal Manufacturing 332321 Metal Window and Door Manufacturing 332322 Sheet Metal Work Manufacturing 332323 Ornamental and Architectural Metal Work
Manufacturing 332618 Other Fabricated Wire Product Manufacturing 332721 Precision Turned Product Manufacturing 332812 Metal Coating, Engraving (except Jewelry and
Silverware), and Allied Services to Manufacturers 332813 Electroplating, Plating, Polishing, Anodizing, and
Coloring
28

The MACOG Freight Transportation Study FY 2004
332996 Fabricated Pipe and Pipe Fitting Manufacturing 332999 All Other Miscellaneous Fabricated Metal Product
Manufacturing 333111 Farm Machinery and Equipment Manufacturing 333319 Other Commercial and Service Industry Machinery
Manufacturing 333511 Industrial Mold Manufacturing 333514 Special Die and Tool, Die Set, Jig, and Fixture
Manufacturing 335121 Residential Electric Lighting Fixture Manufacturing 335999 All Other Miscellaneous Electrical Equipment and
Component Manufacturing 336112 Light Truck and Utility Vehicle Manufacturing 336211 Motor Vehicle Body Manufacturing 336212 Truck Trailer Manufacturing 336213 Motor Home Manufacturing 336214 Travel Trailer and Camper Manufacturing 336312 Gasoline Engine and Engine Parts Manufacturing 336322 Other Motor Vehicle Electrical and Electronic
Equipment Manufacturing 336399 All Other Motor Vehicle Parts Manufacturing 336612 Boat Building 336999 All Other Transportation Equipment Manufacturing 337121 Upholstered Household Furniture Manufacturing 337122 Nonupholstered Wood Household Furniture
Manufacturing 337127 Institutional Furniture Manufacturing 337211 Wood Office Furniture Manufacturing 337214 Office Furniture (except Wood) Manufacturing 337215 Showcase, Partition, Shelving, and Locker
Manufacturing 339111 Laboratory Apparatus and Furniture Manufacturing 339112 Surgical and Medical Instrument Manufacturing 339113 Surgical Appliance and Supplies Manufacturing 339992 Musical Instrument Manufacturing 454312 Liquefied Petroleum Gas (Bottled Gas) Dealers 481211 Nonscheduled Chartered Passenger Air Transportation 484121 General Freight Trucking, Long-Distance, Truckload 484122 General Freight Trucking, Long-Distance, Less Than
Truckload 488119 Other Airport Operations 562111 Solid Waste Collection 562991 Septic Tank and Related Services 562998 All Other Miscellaneous Waste Management Services
29
The MACOG Freight Transportation Study FY 2004
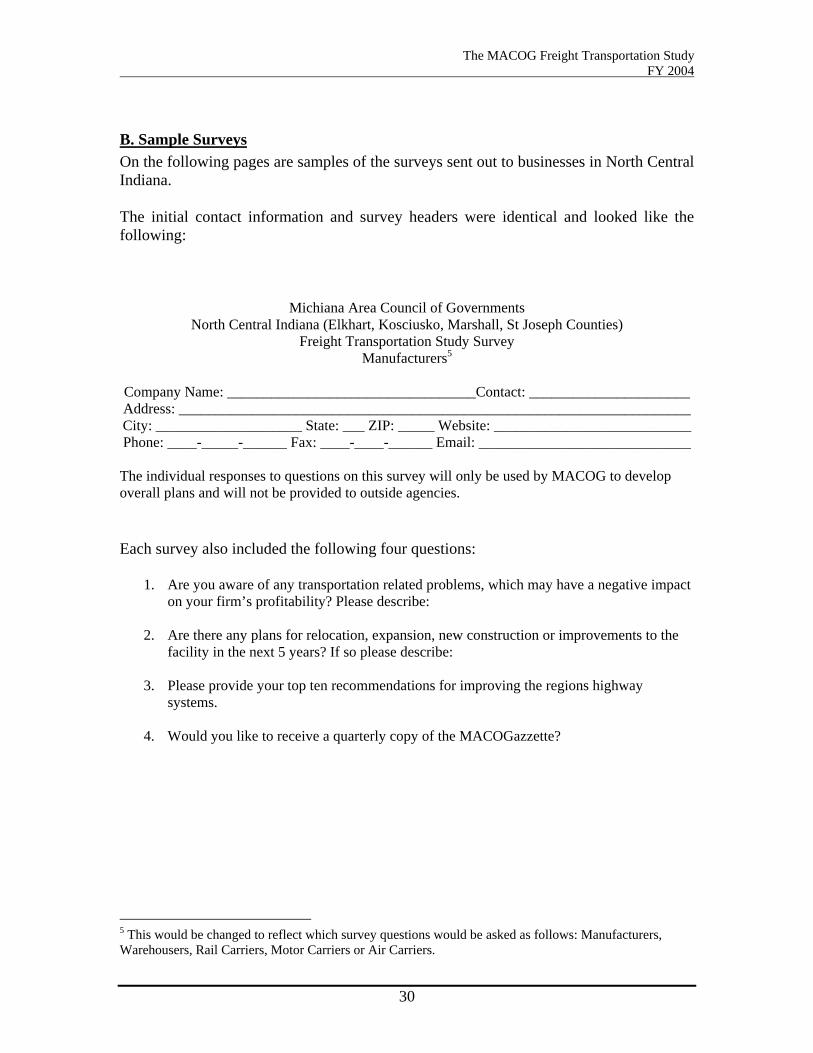
B. Sample Surveys On the following pages are samples of the surveys sent out to businesses in North Central Indiana. The initial contact information and survey headers were identical and looked like the following:
Michiana Area Council of Governments North Central Indiana (Elkhart, Kosciusko, Marshall, St Joseph Counties)
Freight Transportation Study Survey Manufacturers5
Company Name: __________________________________Contact: ______________________ Address: ______________________________________________________________________ City: ____________________ State: ___ ZIP: _____ Website: ___________________________ Phone: ____-_____-______ Fax: ____-____-______ Email: _____________________________
The individual responses to questions on this survey will only be used by MACOG to develop overall plans and will not be provided to outside agencies.
Each survey also included the following four questions:
1. Are you aware of any transportation related problems, which may have a negative impact on your firm’s profitability? Please describe:
2. Are there any plans for relocation, expansion, new construction or improvements to the
facility in the next 5 years? If so please describe:
3. Please provide your top ten recommendations for improving the regions highway systems.
4. Would you like to receive a quarterly copy of the MACOGazzette?
5 This would be changed to reflect which survey questions would be asked as follows: Manufacturers, Warehousers, Rail Carriers, Motor Carriers or Air Carriers.
30
The MACOG Freight Transportation Study FY 2004
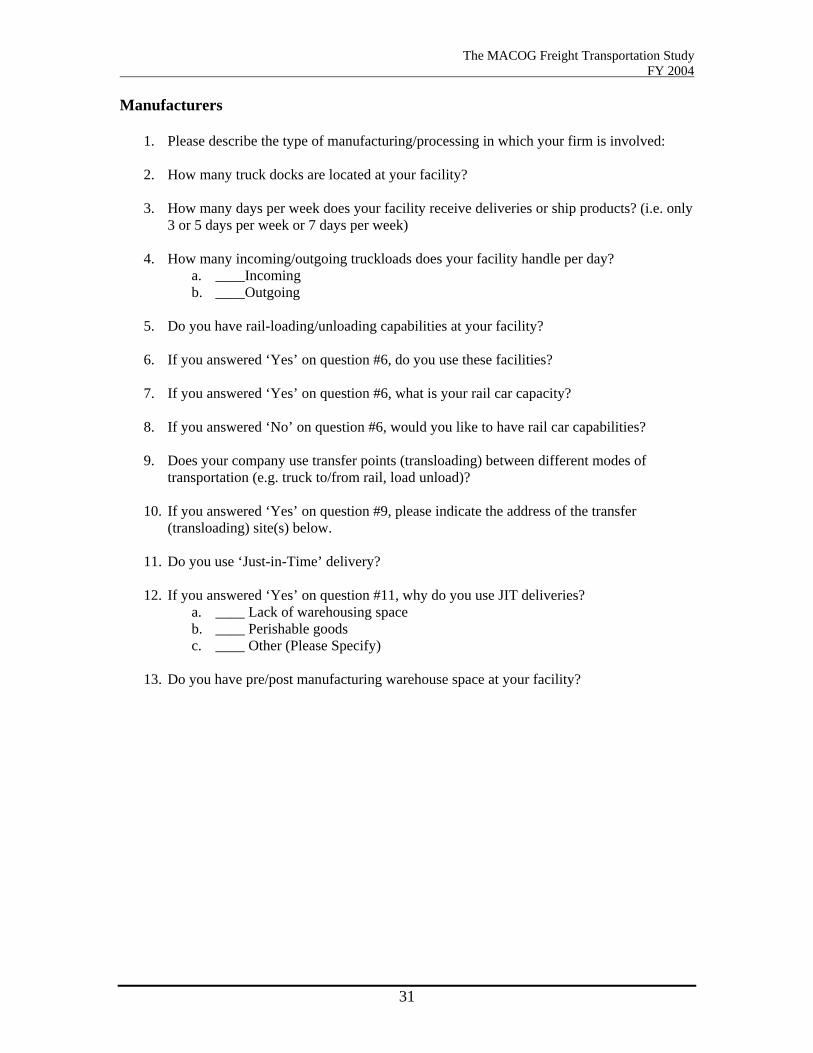
Manufacturers
1. Please describe the type of manufacturing/processing in which your firm is involved:
2. How many truck docks are located at your facility?
3. How many days per week does your facility receive deliveries or ship products? (i.e. only 3 or 5 days per week or 7 days per week)
4. How many incoming/outgoing truckloads does your facility handle per day?
a. ____Incoming b. ____Outgoing
5. Do you have rail-loading/unloading capabilities at your facility? 6. If you answered ‘Yes’ on question #6, do you use these facilities?
7. If you answered ‘Yes’ on question #6, what is your rail car capacity? 8. If you answered ‘No’ on question #6, would you like to have rail car capabilities?
9. Does your company use transfer points (transloading) between different modes of
transportation (e.g. truck to/from rail, load unload)?
10. If you answered ‘Yes’ on question #9, please indicate the address of the transfer (transloading) site(s) below.
11. Do you use ‘Just-in-Time’ delivery? 12. If you answered ‘Yes’ on question #11, why do you use JIT deliveries?
a. ____ Lack of warehousing space b. ____ Perishable goods c. ____ Other (Please Specify)
13. Do you have pre/post manufacturing warehouse space at your facility?
31
The MACOG Freight Transportation Study FY 2004
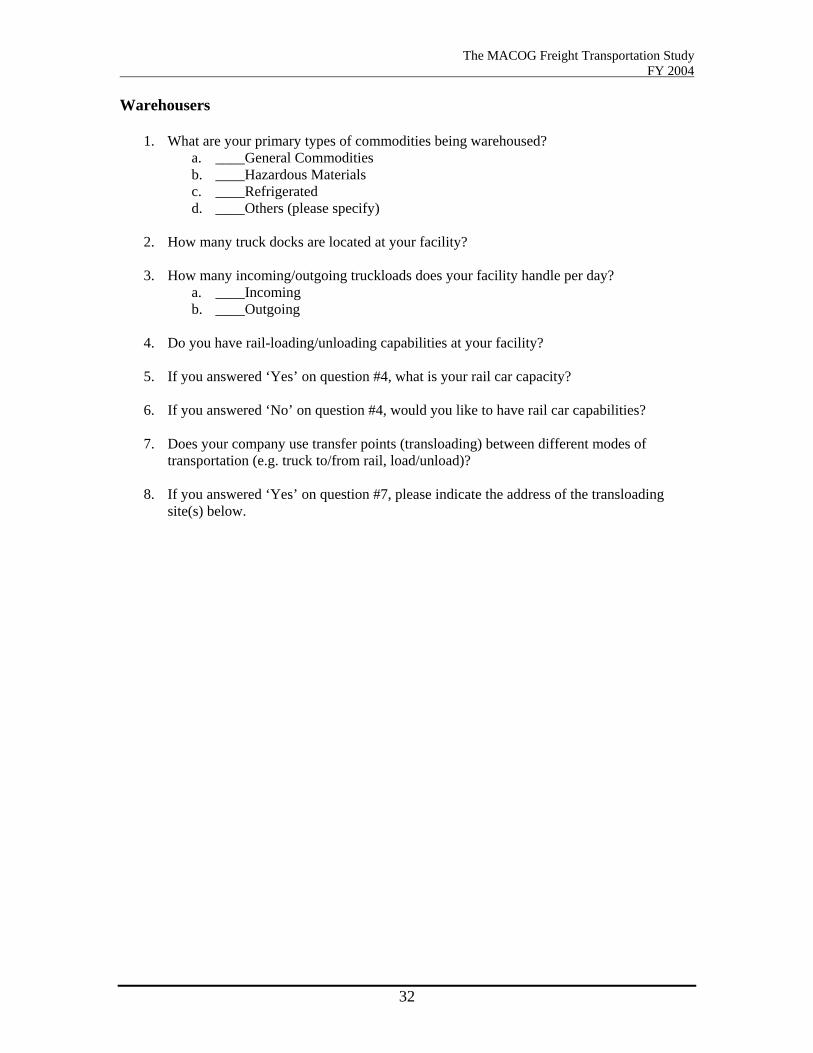
Warehousers
1. What are your primary types of commodities being warehoused? a. ____General Commodities b. ____Hazardous Materials c. ____Refrigerated d. ____Others (please specify)
2. How many truck docks are located at your facility?
3. How many incoming/outgoing truckloads does your facility handle per day?
a. ____Incoming b. ____Outgoing
4. Do you have rail-loading/unloading capabilities at your facility?
5. If you answered ‘Yes’ on question #4, what is your rail car capacity?
6. If you answered ‘No’ on question #4, would you like to have rail car capabilities?
7. Does your company use transfer points (transloading) between different modes of
transportation (e.g. truck to/from rail, load/unload)?
8. If you answered ‘Yes’ on question #7, please indicate the address of the transloading site(s) below.
32
The MACOG Freight Transportation Study FY 2004
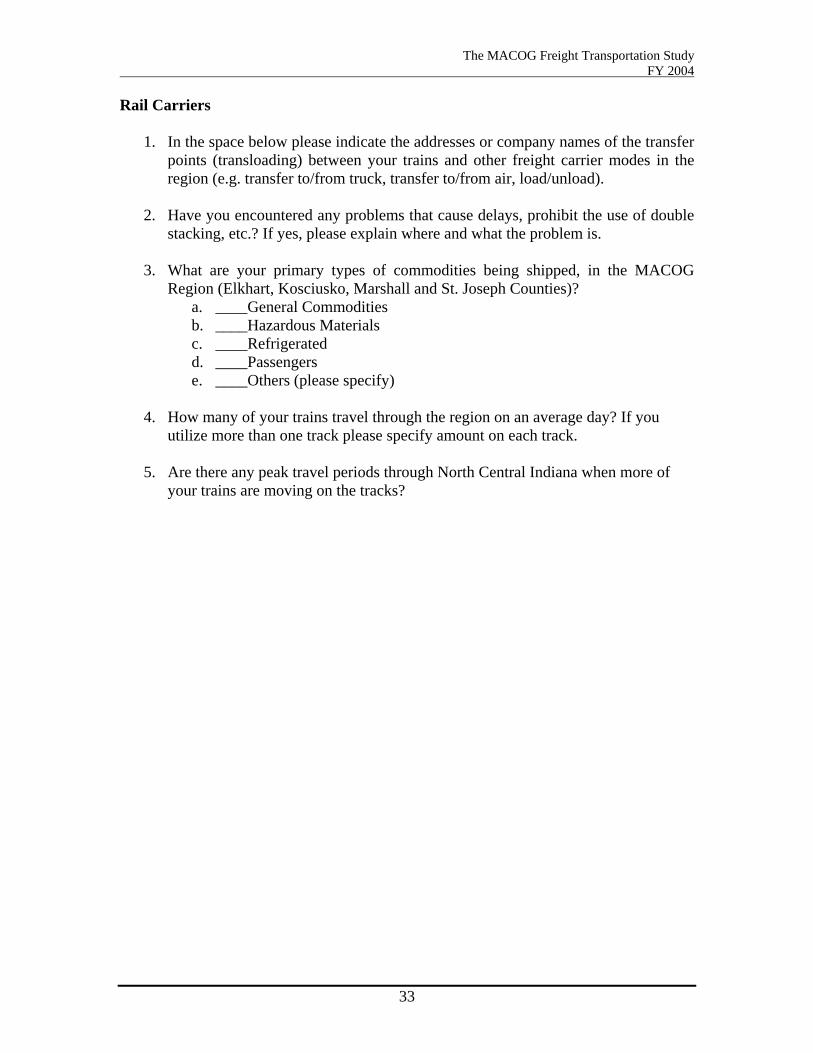
Rail Carriers
1. In the space below please indicate the addresses or company names of the transfer points (transloading) between your trains and other freight carrier modes in the region (e.g. transfer to/from truck, transfer to/from air, load/unload).
2. Have you encountered any problems that cause delays, prohibit the use of double
stacking, etc.? If yes, please explain where and what the problem is. 3. What are your primary types of commodities being shipped, in the MACOG
Region (Elkhart, Kosciusko, Marshall and St. Joseph Counties)? a. ____General Commodities b. ____Hazardous Materials c. ____Refrigerated d. ____Passengers e. ____Others (please specify)
4. How many of your trains travel through the region on an average day? If you utilize more than one track please specify amount on each track.
5. Are there any peak travel periods through North Central Indiana when more of
your trains are moving on the tracks?
33

The MACOG Freight Transportation Study FY 2004
Motor Carriers
1. How many of each of the following types of trucks (owned or leased) do you operate out of this address?
a. _____ 6,000 lbs or less (pick-up, van etc.) b. _____ 6,001 – 19,500 lbs (flatbed, UPS, UHAUL, mail carrier etc.) c. _____ 19,501 – 33,000 lbs (beverage truck, city tractor, home-heating fuel
truck) d. _____ 33,001 lbs or more (Multi-trailer trucks, semi-trailers and doubles)
2. In the space below, please indicate the addresses or company names of the transfer points between your trucks and other freight carrier modes in the region (e.g. transfer to/from rail, transfer to/from air, load/unload).
3. Have you encountered any problems on your routes (i.e. narrow roads, low
underpasses, difficult turn movements etc.)? If yes, please explain where and what the problem is.
4. In each class please indicate your firm’s annual total vehicle mileage in 2003.
a. _____ 6,000 lbs or less (pick-up, van etc.) b. _____ 6,001 – 19,500 lbs (flatbed, UPS, UHAUL, mail carrier etc.) c. _____ 19,501 – 33,000 lbs (beverage truck, city tractor, home-heating fuel
truck) d. _____ 33,001 lbs or more (Multi-trailer trucks, semi-trailers and doubles)
5. How many of your vehicles use the following types of fuel:
a. Diesel_________ b. Gasoline________ c. Ethanol________ d. Propane________ e. Natural Gas_______ f. Methanol_________ g. Other (Please Specify)
6. What are your primary types of commodities being shipped?
a. ____General Commodities b. ____Hazardous Materials c. ____Refrigerated d. ____Others (Please Specify)
34
The MACOG Freight Transportation Study FY 2004
C. Reponses to Survey Question The following information are responses compiled from all surveys regarding the last question of each survey: “Please provide your top ten recommendations for improving the regions highway Systems.”
# % # % # % # % # % # % #
16 10.32% 10 6.45% 4 2.58% 8 5.16% 9 5.81% 32 20.65% 10 6.45%
US 31 Bypass Around
Goshen CR 17 Toll Road Issues Congestion Issues Policy Issues Misc. Issues
Responses Responses Responses Responses Responses Responses Responses
Build US 31 Indianapolis to South Bend as limited
access, interstate status highway (7)
Build a Bypass around
Goshen/Elkhart (5)
Completion of CR 17 south to US 6 (2)
Remove Tolls from I-80/I-90, Remove Tolls on
Bridges (2)
Less stop lights (esp. on US 30) (3)
Make many of the major roads 4-lanes (7)
Improve trucking response/lead times (2)
Expressway/4-lane Road to Indianapolis (4)
Improve truck routes in/around
Goshen (4)
Connection of US 20 and I-80/90
Do away with tolls around Chicago, Use EZ Pass [I-Pass?] system in Indiana
(2)
Reduce congestion on Oak Road in Plymouth (2)
Need more wide/heavy/tall load routes (5)
Improve opportunities for Economic Development
(2)
US 31 should be a #1 priority
Need routes aroun
%
dElkhart, Goshen,
Syracuse
The North/South main roads are congested,
SR 19, CR 17 etc.
Ohio's Tolls are too expensive for trucks (2)
Wider roads in congested areas (2)
More selective and fewer access roads to major 4-
lane highways (3)
No cell phone usage, emergency call system on
highways (2)
Better road between South Bend/Elkhart and
Indianapolis
Better exit markings on Toll Road (e.g.
Mishawaka Exit should be: Mishawaka Exit #83
7mi)
Alternate routes to miss congested areas
Less restrictions/less frequent changing/more
enforcement of the ones we do have (3)
Wider, better-maintained shoulders for wide
loads/Amish vehicles
Since there is no major roadway in the center of Indiana it is harder to get
places
Have direct access to Toll Road from US 6
Synchronize stop lights in the cities
Improve the speed at which a road is built (3) Improve Safety
On 31, there are too many stoplights and small towns, therefore delivery speed is
reduced
65 MPH speed limit 4/ turn lanes on all state routes 2
and 4 lanes (2)Cheaper fuel
Forget upgrading US 31-spend the $1billion on other
necessary road projects
Less government, union involvement (costs time and
money) (2)
Reduce transportation costs
Use other funds instead of increasing gas tax for road
improvements (2)
Adequate rest areas (2)
Install cameras at stop lights
Hold builders responsible for poor construction
Educate public about safety of truckers
35
The MACOG Freight Transportation Study FY 2004
# % # % # % # % # % # % # %
19 12.26% 10 6.45% 24 15.48% 5 3.23% 4 2.58% 4 2.58% 155 100.00%
Have better access to US 30 from Downtown
Plymouth
No islands between lanes
Improve SR 19 to be able to handle the large loads
Improve intersection of US 20/ SR 15 to reduce
bottleneck
Increased truck traffic from SR 19 construction has
created problems at RR on CR 20/SR 219
Improve US 33 E as 4-lanes to Ft. Wayne
Build I-69 from Indy to Evansville
Heavy truck traffic on SR 15/SR 120 is destroying
roadways in/around Bristol
Improve SR 23/Eddy St. in South Bend and Granger
Improve SR 15 N of US 30, synchronize the lights
It is difficult not knowing ahead of time when
construction is going to take place
Access to US20 at Beech Rd
Build more direct route between Warsaw/South
BendRepaint road lines
Widening SR 19 has long been needed and
construction seems to be going well
Improve access to Markley Dr. from US 30
Truck only routes around Chicago
Snow removal could be better on US 20/SR 2 (2)
The roads are in good repair
?Better traffic control, improved turn lanes (2)
I-94 in NW IN needs 2 more lanes in each
direction
More resurfacing of roadways (3) Your doing a great job Build roads out of granite
Finish RR crossing at Levi Lee Rd. in
Kosciusko County
Complete 331 from the Toll Road to south side of
Mishawaka (2)
Improve SR 15 N of US 30, synchronize the lights
(2)
Install sufficient signage and quickly repair damaged ones (5)
I think our road system is ok, it does the job
We mainly ship UPS we may only have 2-4
shipments per month. These questions do not pertain to our company.
Overpasses over Norfolk Southern and
Elkhart & Western RRs and others (3)
Extend SR 4 (or improve other connecting road)
from US 31 to SR 331 (2)
Bypass Warsaw either SR15/US 30 (3)
Increase road repairs (potholes, patching, etc.)
since we have to pay 'Wheel Tax' (10)
I'll leave that to the professionals Driving tests for seniors
Responses
Widen US 6/US 20 to Ohio State Line (4)
Responses Responses Responses Responses
Railroad Issues Total
Responses
Oustide Region Improvements Maintenance Issues
General Positive Comments Other Comments
Other Road Improvements
Mayflower Rd./Sample St. Intersection
36
The MACOG Freight Transportation Study FY 2004
D. Bibliography Andrews, Larry. Questionnaire Communication. City of Nappanee Planning
Department. 2004, April 13. Bayles, Fred. (2004, January 5). U.S. limits truckers’ time on road. USA Today, p. 4A. Black, William R., Ph.D. and Garth Banninga (in cooperation with INDOT and FHWA).
Transport Flows in the State of Indiana: Commodity Database Development and Traffic Assignment. Transportation Research Center and Department of Geography at Indiana University: July 1997.
Byers, Thomas. Questionnaire Communication. Elkhart County Plan Commission.
2004, April 13. Federal Highway Administration. Freight Transportation Profile - Indiana. November
2002. Hauflaire, Joseph. Questionnaire Communication. City of Goshen Planning Department.
2004, April 13. INDOT. INDOT 2025 Long Range Plan. 2003. Kiefer, Troy. Questionnaire Communication. Marshall County Plan Commission. 2004,
January 9. MACOG. MACOG 2025 Long Range Transportation Plan. 2002. MACOG. MACOG FY 2004-2006 Transportation Improvement Program. 2003. MACOG. The Michiana Freight Transportation Study: Analysis of Freight Capacity and
Movement in Northern Indiana. FY 2000. Mitchell, Sue Ann. Phone Communication. Kosciusko County Auditor. 2004, April 13. Rock, Owen. Questionnaire Communication. City of South Bend Community and
Economic Development Department. 2004, April 12. Sandy, Matt. Questionnaire Communication. Kosciusko County Area Plan Commission.
2004, January 8. Sante, Robert. Questionnaire Communication. St. Joseph County Area Plan Commission.
2004, January 24. STATS Indiana. Indiana Business Research Center. Indiana University.
www.stats.indiana.edu.
37

The MACOG Freight Transportation Study FY 2004
US Census Bureau. Decennial Census 1970. Census of Population: Characteristics of
the Population. 1973. US Census Bureau. Decennial Census 1980. General Social and Economic
Characteristics. 1983. US Census Bureau. Decennial Census 1990 and 2000. www.census.gov.
38