the macro inputs of valuation hubris and happenstance aswath damodaran updated: january 2013 aswath...
TRANSCRIPT

The macro inputs of valuationhubris and happenstance
Aswath DamodaranUpdated: January 2013
Aswath Damodaran 1
2
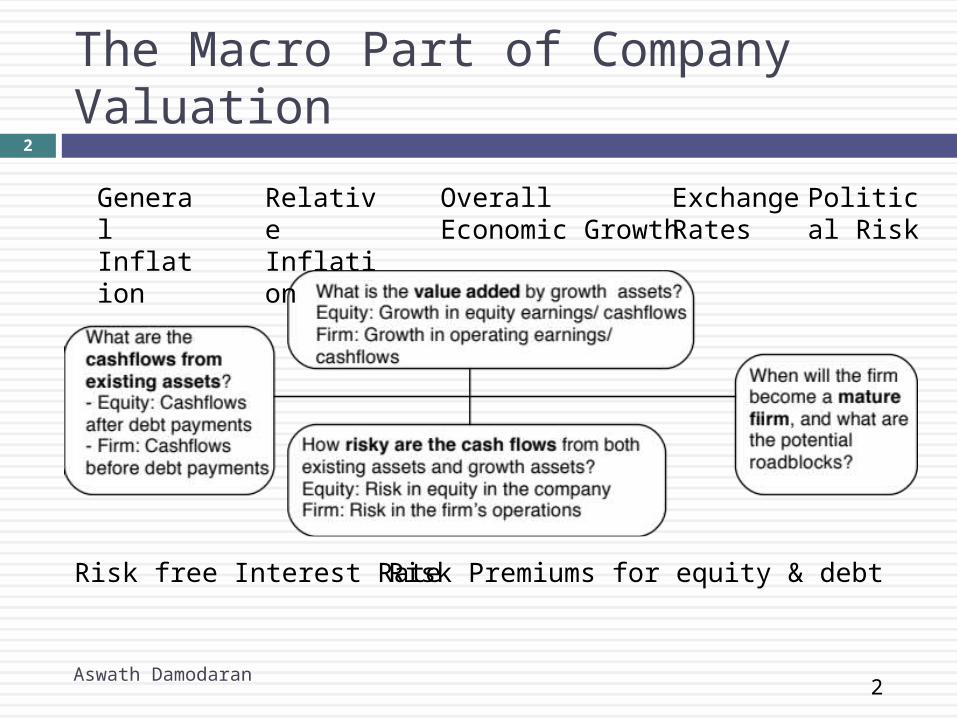
The Macro Part of Company Valuation
Aswath Damodaran
2
General Inflation
Overall Economic Growth
Exchange Rates
Relative Inflation
Risk free Interest Rate Risk Premiums for equity & debt
Political Risk
3
The Macro determinants of Discount Rates
The discount rate that you use on a cash flow will reflect the risk of that cash flow, but the overall level is affected by macro economic variables. There are two key macro components to discount rates that have little to do with the asset that you are valuing and are set by the market.
The first is the risk free rate, that is the base for your discount rate. Risk free rate = Expected Inflation + Expected Real Interest Rate The expected inflation will be a function of the currency you choose to do
your analysis in The expected real interest rate is set by the demand for & supply of capital
in the real economy. It should increase if growth is expected to be robust and decrease if growth is anticipated to be anemic.
The second is the risk premium that investors charge for investing in equity markets (the equity risk premium) or for lending money (default spreads).
Aswath Damodaran
3
4
I. A Riskfree Rate
On a riskfree asset, the actual return is equal to the expected return. Therefore, there is no variance around the expected return.
For an investment to be riskfree, then, it has to have No default risk No reinvestment risk
1. Currency matters: The risk free rate will vary across currencies.2. Time horizon matters: Thus, the riskfree rates in valuation will
depend upon when the cash flow is expected to occur and will vary across time.
3. Not all government securities are riskfree: Some governments face default risk and the rates on bonds issued by them will not be riskfree.
Aswath Damodaran
4
5
Test 1: A riskfree rate in US dollars!
In valuation, we estimate cash flows forever (or at least for very long time periods). The right risk free rate to use in valuing a company in US dollars would bea. A three-month Treasury bill rate (0.1%)b. A ten-year Treasury bond rate (2%)c. A thirty-year Treasury bond rate (3%)d. A TIPs (inflation-indexed treasury) rate (1%)e. None of the above
When we use US treasury rates as risk free rates, what are we assuming about default risk in the US treasury?
Aswath Damodaran
5
6
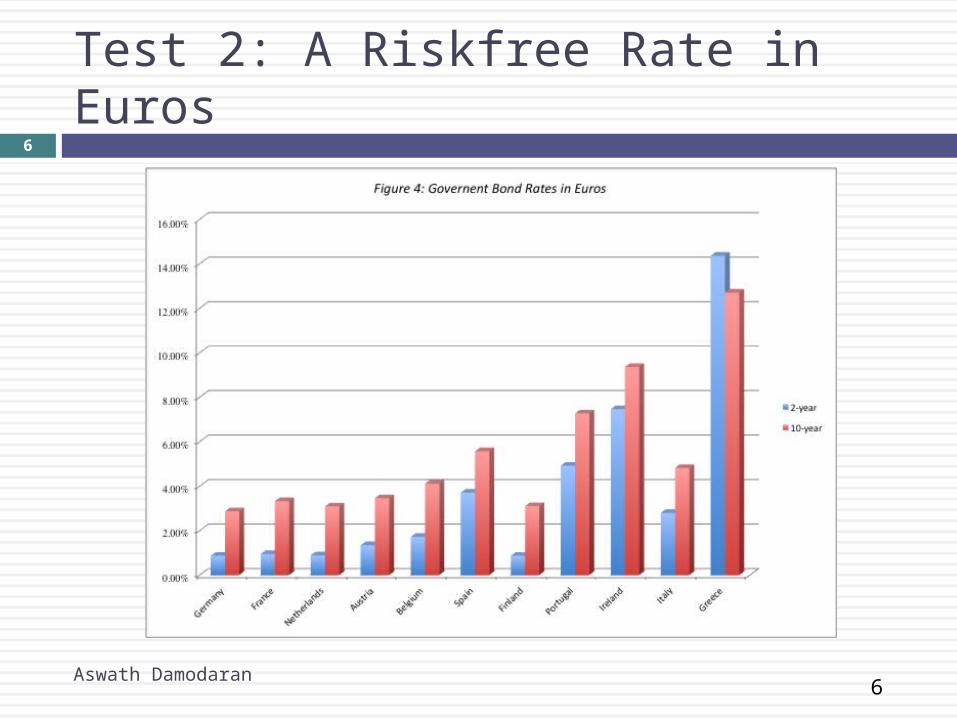
Test 2: A Riskfree Rate in Euros
Aswath Damodaran
6
7
Test 3: A Riskfree Rate in $R (Nominal Reails)
Aswath Damodaran
7
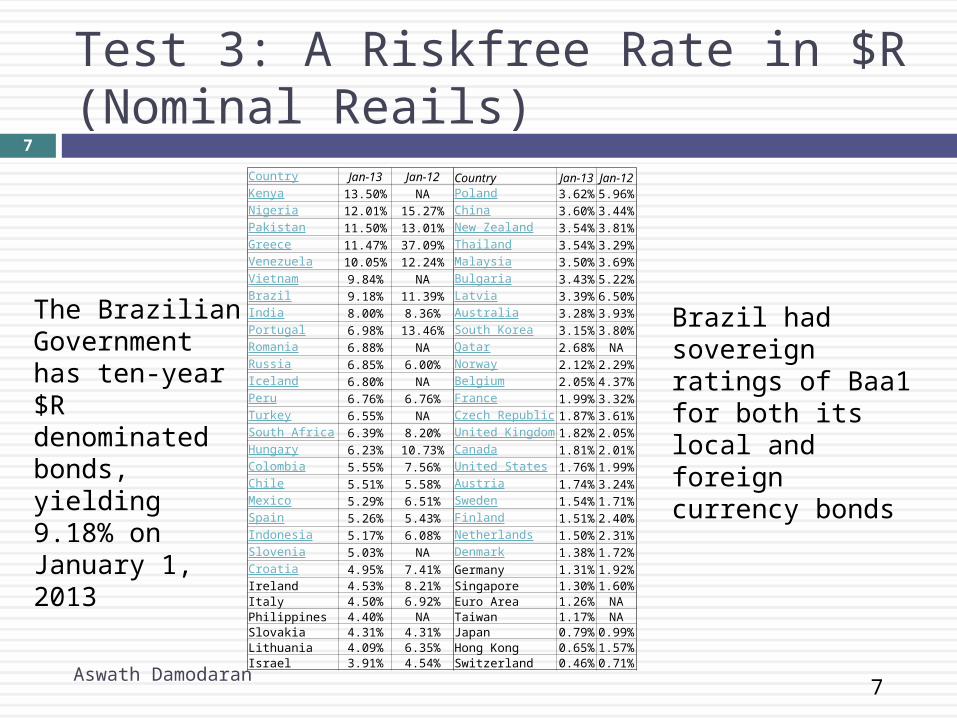
Country Jan-13 Jan-12 Country Jan-13 Jan-12Kenya 13.50% NA Poland 3.62% 5.96%Nigeria 12.01% 15.27% China 3.60% 3.44%Pakistan 11.50% 13.01% New Zealand 3.54% 3.81%Greece 11.47% 37.09% Thailand 3.54% 3.29%Venezuela 10.05% 12.24% Malaysia 3.50% 3.69%Vietnam 9.84% NA Bulgaria 3.43% 5.22%Brazil 9.18% 11.39% Latvia 3.39% 6.50%India 8.00% 8.36% Australia 3.28% 3.93%Portugal 6.98% 13.46% South Korea 3.15% 3.80%Romania 6.88% NA Qatar 2.68% NARussia 6.85% 6.00% Norway 2.12% 2.29%Iceland 6.80% NA Belgium 2.05% 4.37%Peru 6.76% 6.76% France 1.99% 3.32%Turkey 6.55% NA Czech Republic 1.87% 3.61%South Africa 6.39% 8.20% United Kingdom 1.82% 2.05%Hungary 6.23% 10.73% Canada 1.81% 2.01%Colombia 5.55% 7.56% United States 1.76% 1.99%Chile 5.51% 5.58% Austria 1.74% 3.24%Mexico 5.29% 6.51% Sweden 1.54% 1.71%Spain 5.26% 5.43% Finland 1.51% 2.40%Indonesia 5.17% 6.08% Netherlands 1.50% 2.31%Slovenia 5.03% NA Denmark 1.38% 1.72%Croatia 4.95% 7.41% Germany 1.31% 1.92%Ireland 4.53% 8.21% Singapore 1.30% 1.60%Italy 4.50% 6.92% Euro Area 1.26% NAPhilippines 4.40% NA Taiwan 1.17% NASlovakia 4.31% 4.31% Japan 0.79% 0.99%Lithuania 4.09% 6.35% Hong Kong 0.65% 1.57%Israel 3.91% 4.54% Switzerland 0.46% 0.71%
The Brazilian Government has ten-year $R denominated bonds, yielding 9.18% on January 1, 2013
Brazil had sovereign ratings of Baa1 for both its local and foreign currency bonds
8
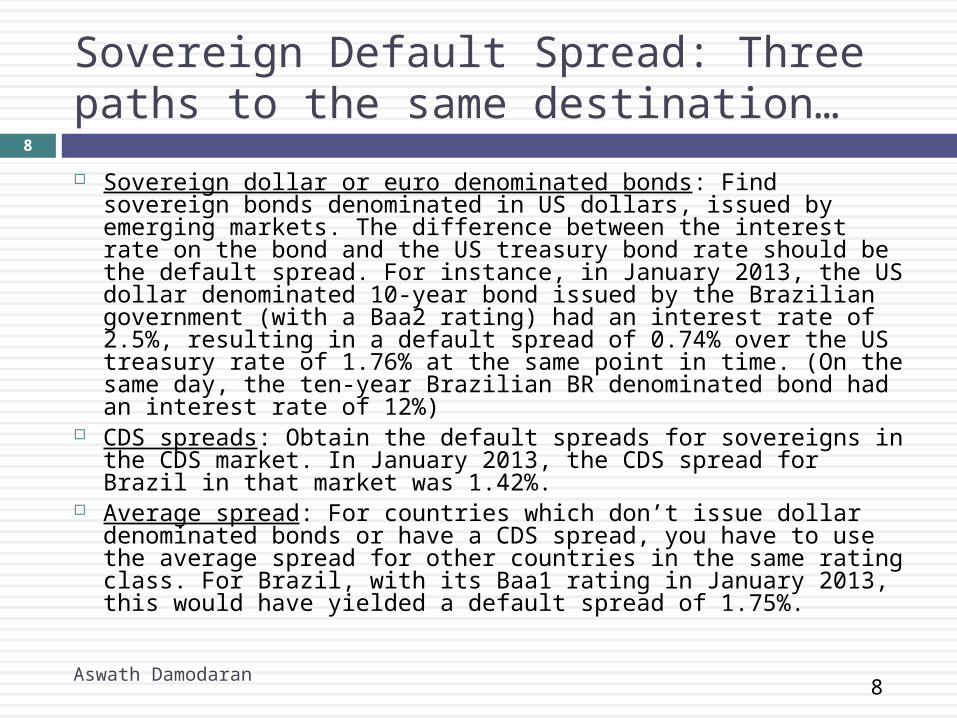
Sovereign Default Spread: Three paths to the same destination…
Sovereign dollar or euro denominated bonds: Find sovereign bonds denominated in US dollars, issued by emerging markets. The difference between the interest rate on the bond and the US treasury bond rate should be the default spread. For instance, in January 2013, the US dollar denominated 10-year bond issued by the Brazilian government (with a Baa2 rating) had an interest rate of 2.5%, resulting in a default spread of 0.74% over the US treasury rate of 1.76% at the same point in time. (On the same day, the ten-year Brazilian BR denominated bond had an interest rate of 12%)
CDS spreads: Obtain the default spreads for sovereigns in the CDS market. In January 2013, the CDS spread for Brazil in that market was 1.42%.
Average spread: For countries which don’t issue dollar denominated bonds or have a CDS spread, you have to use the average spread for other countries in the same rating class. For Brazil, with its Baa1 rating in January 2013, this would have yielded a default spread of 1.75%.
Aswath Damodaran
8
9
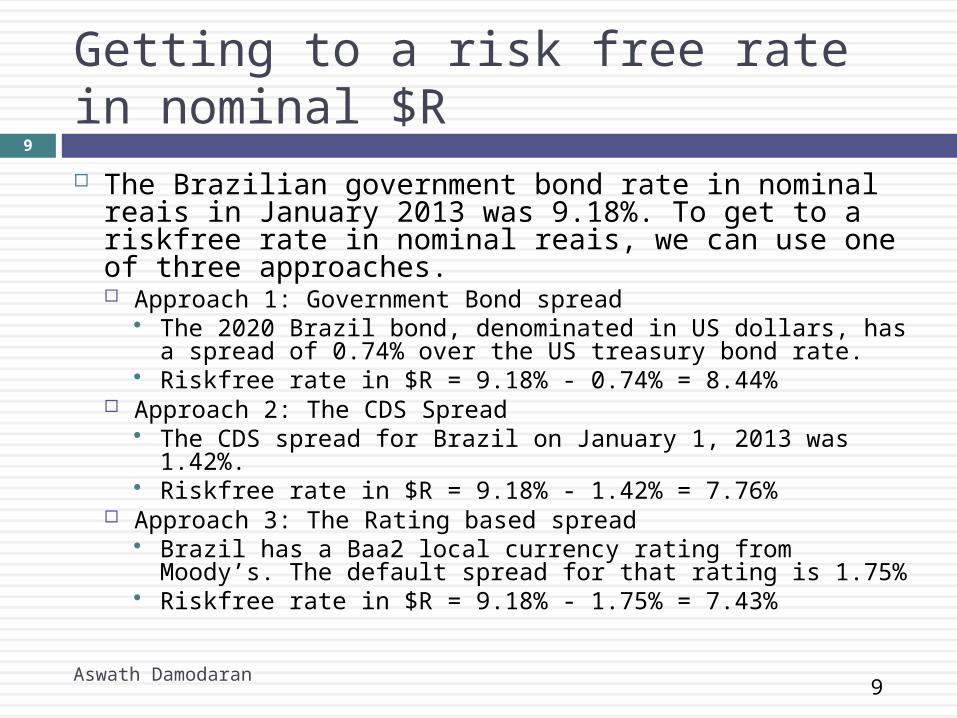
Getting to a risk free rate in nominal $R
The Brazilian government bond rate in nominal reais in January 2013 was 9.18%. To get to a riskfree rate in nominal reais, we can use one of three approaches. Approach 1: Government Bond spread
The 2020 Brazil bond, denominated in US dollars, has a spread of 0.74% over the US treasury bond rate.
Riskfree rate in $R = 9.18% - 0.74% = 8.44% Approach 2: The CDS Spread
The CDS spread for Brazil on January 1, 2013 was 1.42%. Riskfree rate in $R = 9.18% - 1.42% = 7.76%
Approach 3: The Rating based spread Brazil has a Baa2 local currency rating from Moody’s. The default
spread for that rating is 1.75% Riskfree rate in $R = 9.18% - 1.75% = 7.43%
Aswath Damodaran
9
10
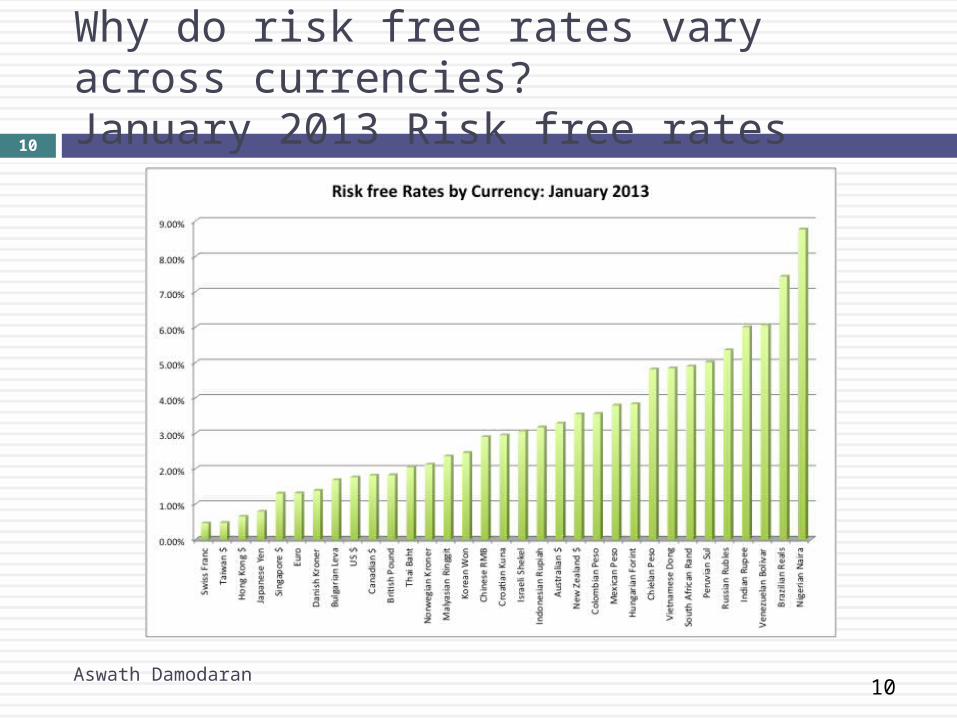
Why do risk free rates vary across currencies?January 2013 Risk free rates
Aswath Damodaran
10
11
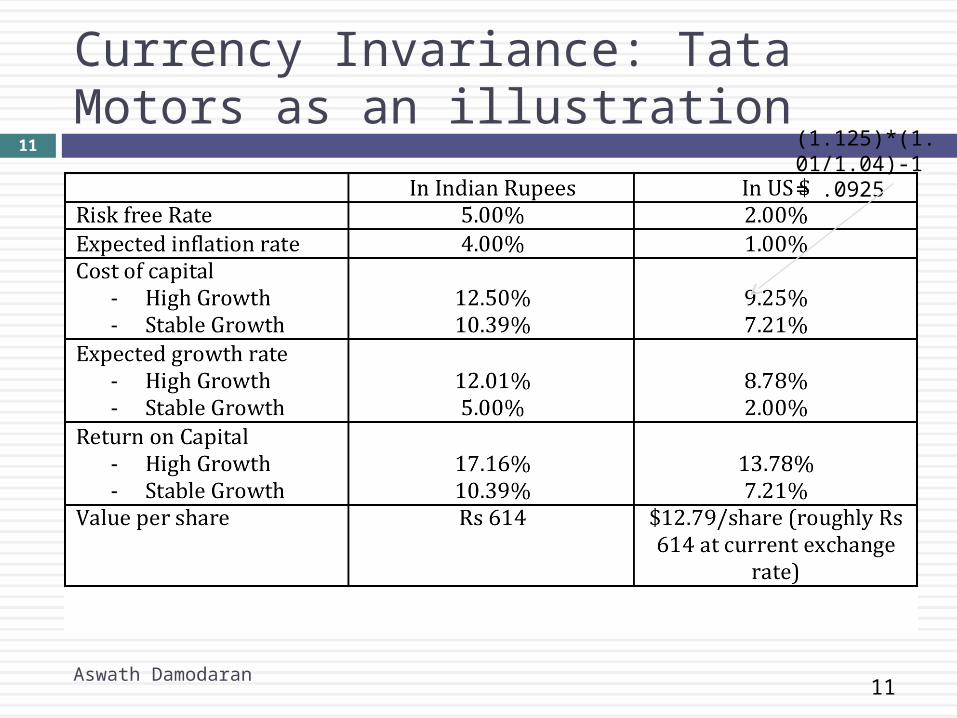
Currency Invariance: Tata Motors as an illustration
(1.125)*(1.01/1.04)-1 = .0925
Aswath Damodaran
11
12
II. Risk Premiums
Aswath Damodaran
12
The equity risk premium is the premium that investors demand for investing in an average risk investment, relative to the riskfree rate.
As a general proposition, this premium should be increase with the risk aversion of the investors in that market increase with the riskiness of the “average” risk investment
The default spread is the premium that lenders charge for lending you money. While it should reflect your credit risk as a borrower, the level of this spread will Increase with the risk aversion of lenders in the market Increase with the risk in the overall economy
13
Equity Risk PremiumsThe ubiquitous historical risk premium
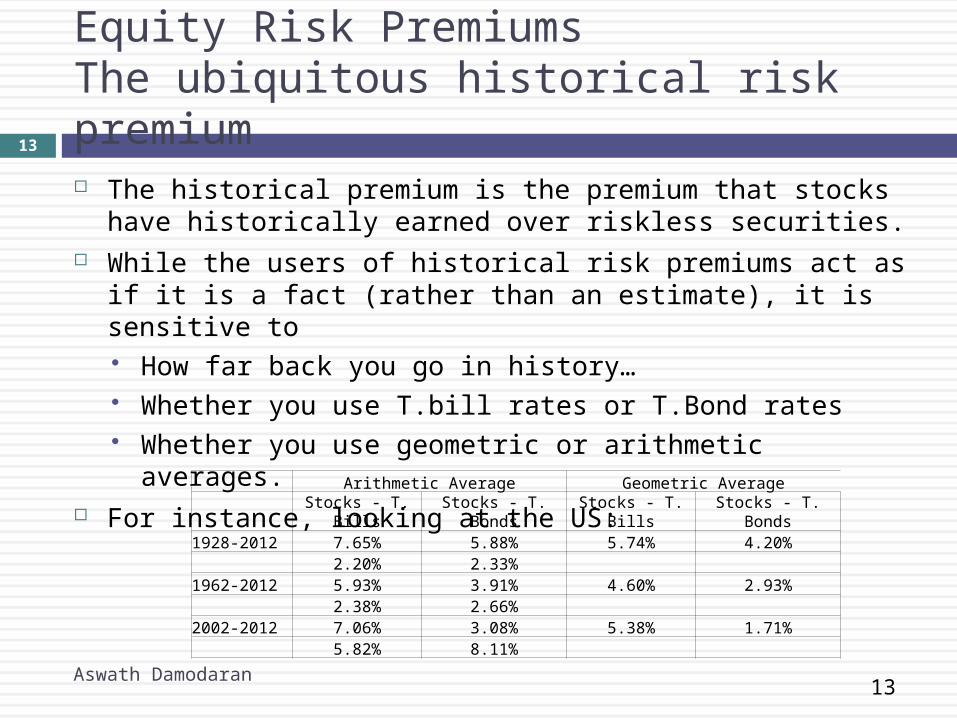
The historical premium is the premium that stocks have historically earned over riskless securities.
While the users of historical risk premiums act as if it is a fact (rather than an estimate), it is sensitive to How far back you go in history… Whether you use T.bill rates or T.Bond rates Whether you use geometric or arithmetic averages.
For instance, looking at the US: Arithmetic Average Geometric Average Stocks - T. Bills Stocks - T. Bonds Stocks - T. Bills Stocks - T. Bonds1928-2012 7.65% 5.88% 5.74% 4.20% 2.20% 2.33% 1962-2012 5.93% 3.91% 4.60% 2.93% 2.38% 2.66% 2002-2012 7.06% 3.08% 5.38% 1.71% 5.82% 8.11%
Aswath Damodaran
13
14
The perils of trusting the past…….
Noisy estimates: Even with long time periods of history, the risk premium that you derive will have substantial standard error. For instance, if you go back to 1928 (about 80 years of history) and you assume a standard deviation of 20% in annual stock returns, you arrive at a standard error of greater than 2%:
Standard Error in Premium = 20%/√80 = 2.26% Survivorship Bias: Using historical data from the U.S.
equity markets over the twentieth century does create a sampling bias. After all, the US economy and equity markets were among the most successful of the global economies that you could have invested in early in the century.
Aswath Damodaran
14
15
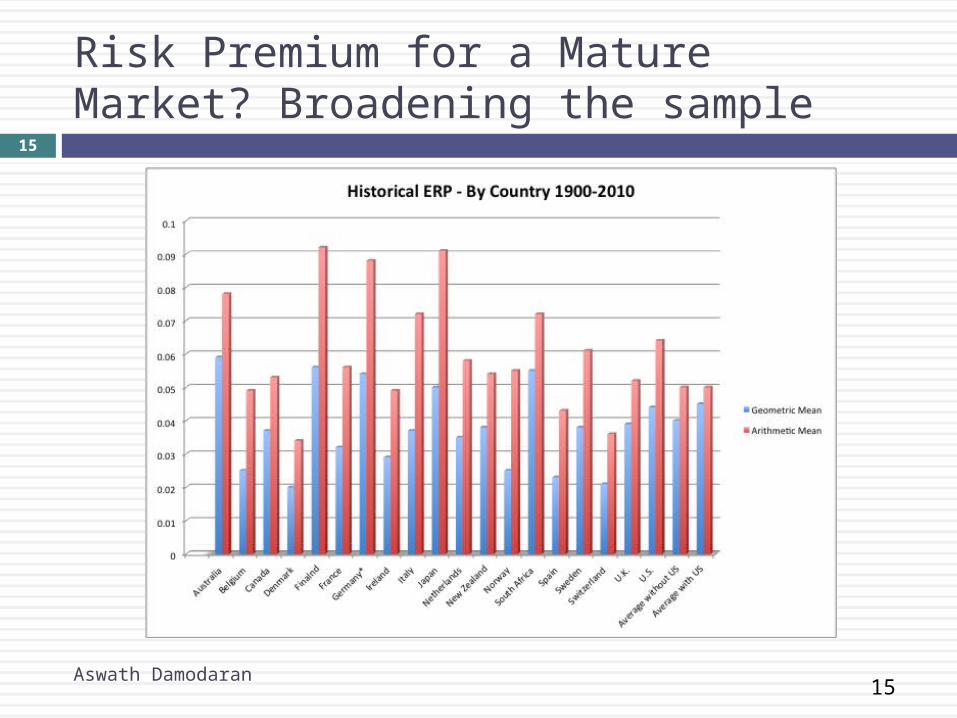
Risk Premium for a Mature Market? Broadening the sample
Aswath Damodaran
15
16
The simplest way of estimating an additional country risk premium: The country default spread
Default spread for country: In this approach, the country equity risk premium is set equal to the default spread for the country, estimated in one of three ways: The default spread on a dollar denominated bond issued by the
country. Brazil’s 10 year $ denominated bond at the start of 2013 was trading at an interest rate of 2.60%, a default spread of 0.84% over the US treasury bond rate of 1.76%.
The ten year CDS spread for Brazil of 1.42% Brazil’s sovereign local currency rating is Baa2. The default spread for a
Baa2 rated sovereign is about 1.75%. This default spread is added on to the mature market
premium to arrive at the total equity risk premium for Brazil, assuming a mature market premium of 5.80%. Country Risk Premium for Brazil = 1.75% Total ERP for Brazil = 5.80% + 1.75% = 7.55%
Aswath Damodaran
16
17
An equity volatility based approach to estimating the country total ERP
This approach draws on the standard deviation of two equity markets, the emerging market in question and a base market (usually the US). The total equity risk premium for the emerging market is then written as: Total equity risk premium = Risk PremiumUS* Country Equity / US Equity
The country equity risk premium is based upon the volatility of the market in question relative to U.S market. Assume that the equity risk premium for the US is 5.80%. Assume that the standard deviation in the Bovespa (Brazilian equity) is
21% and that the standard deviation for the S&P 500 (US equity) is 18%.
Total Equity Risk Premium for Brazil = 5.80% (21%/18%) = 6.77% Country equity risk premium for Brazil = 6.77% - 5.80% = 0.97%
Aswath Damodaran
17
18
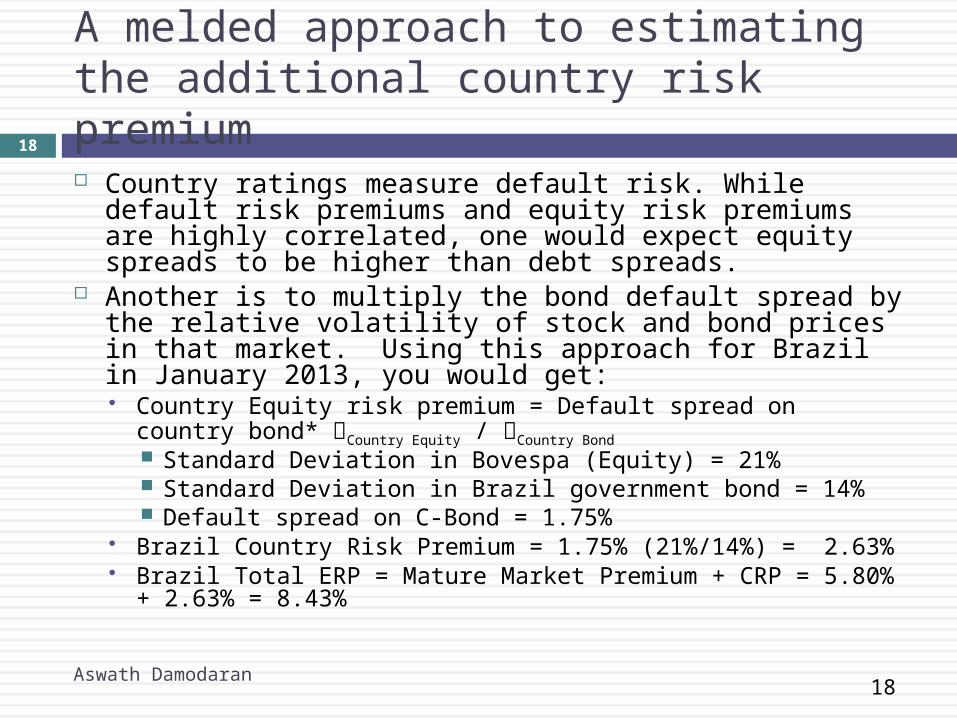
A melded approach to estimating the additional country risk premium
Country ratings measure default risk. While default risk premiums and equity risk premiums are highly correlated, one would expect equity spreads to be higher than debt spreads.
Another is to multiply the bond default spread by the relative volatility of stock and bond prices in that market. Using this approach for Brazil in January 2013, you would get: Country Equity risk premium = Default spread on country bond* Country
Equity / Country Bond Standard Deviation in Bovespa (Equity) = 21% Standard Deviation in Brazil government bond = 14% Default spread on C-Bond = 1.75%
Brazil Country Risk Premium = 1.75% (21%/14%) = 2.63% Brazil Total ERP = Mature Market Premium + CRP = 5.80% + 2.63% = 8.43%
Aswath Damodaran
18
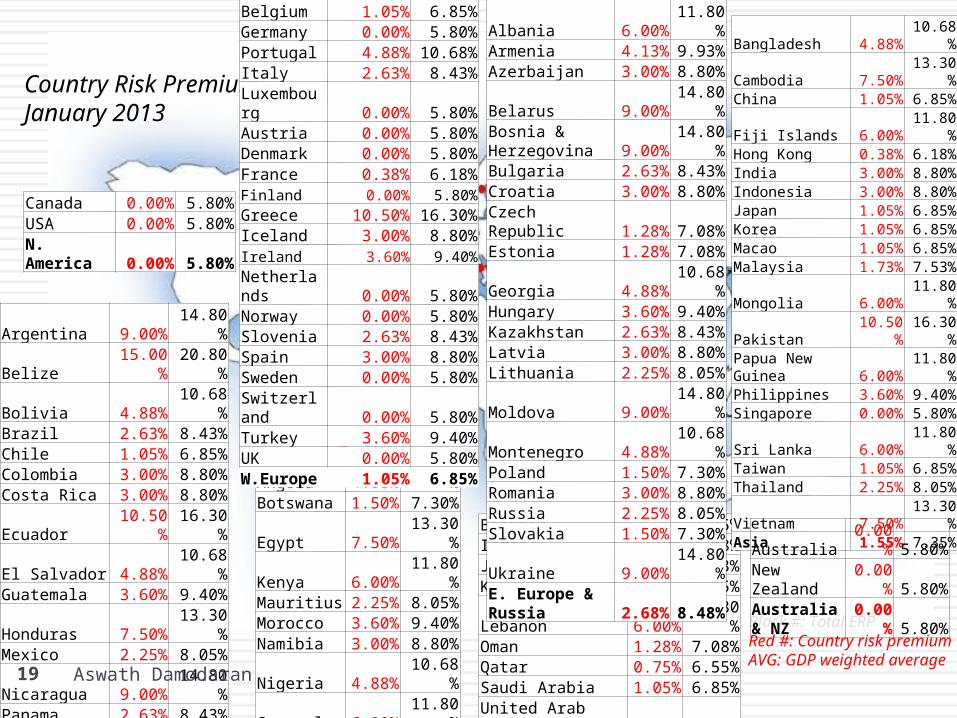
Country Risk PremiumsJanuary 2013
Black #: Total ERPRed #: Country risk premiumAVG: GDP weighted average
Angola 4.88% 10.68%Botswana 1.50% 7.30%Egypt 7.50% 13.30%Kenya 6.00% 11.80%Mauritius 2.25% 8.05%Morocco 3.60% 9.40%Namibia 3.00% 8.80%Nigeria 4.88% 10.68%Senegal 6.00% 11.80%South Africa 2.25% 8.05%Tunisia 3.00% 8.80%Zambia 6.00% 11.80%Africa 4.29% 10.09%
Belgium 1.05% 6.85%Germany 0.00% 5.80%Portugal 4.88% 10.68%Italy 2.63% 8.43%Luxembourg 0.00% 5.80%Austria 0.00% 5.80%Denmark 0.00% 5.80%France 0.38% 6.18%Finland 0.00% 5.80%
Greece 10.50% 16.30%Iceland 3.00% 8.80%Ireland 3.60% 9.40%
Netherlands 0.00% 5.80%Norway 0.00% 5.80%Slovenia 2.63% 8.43%Spain 3.00% 8.80%Sweden 0.00% 5.80%Switzerland 0.00% 5.80%Turkey 3.60% 9.40%UK 0.00% 5.80%W.Europe 1.05% 6.85%
Canada 0.00% 5.80%USA 0.00% 5.80%N. America 0.00% 5.80%
Bahrain 2.25% 8.05%Israel 1.28% 7.08%Jordan 4.13% 9.93%Kuwait 0.75% 6.55%Lebanon 6.00% 11.80%Oman 1.28% 7.08%Qatar 0.75% 6.55%Saudi Arabia 1.05% 6.85%United Arab Emirates 0.75% 6.55%Middle East 1.16% 6.96%
Albania 6.00% 11.80%Armenia 4.13% 9.93%Azerbaijan 3.00% 8.80%Belarus 9.00% 14.80%Bosnia & Herzegovina 9.00% 14.80%Bulgaria 2.63% 8.43%Croatia 3.00% 8.80%Czech Republic 1.28% 7.08%Estonia 1.28% 7.08%Georgia 4.88% 10.68%Hungary 3.60% 9.40%Kazakhstan 2.63% 8.43%Latvia 3.00% 8.80%Lithuania 2.25% 8.05%Moldova 9.00% 14.80%Montenegro 4.88% 10.68%Poland 1.50% 7.30%Romania 3.00% 8.80%Russia 2.25% 8.05%Slovakia 1.50% 7.30%Ukraine 9.00% 14.80%E. Europe & Russia 2.68% 8.48%
Bangladesh 4.88% 10.68%Cambodia 7.50% 13.30%China 1.05% 6.85%Fiji Islands 6.00% 11.80%Hong Kong 0.38% 6.18%India 3.00% 8.80%Indonesia 3.00% 8.80%Japan 1.05% 6.85%Korea 1.05% 6.85%Macao 1.05% 6.85%Malaysia 1.73% 7.53%Mongolia 6.00% 11.80%Pakistan 10.50% 16.30%Papua New Guinea 6.00% 11.80%Philippines 3.60% 9.40%Singapore 0.00% 5.80%Sri Lanka 6.00% 11.80%Taiwan 1.05% 6.85%Thailand 2.25% 8.05%Vietnam 7.50% 13.30%Asia 1.55% 7.35%
Australia 0.00% 5.80%New Zealand 0.00% 5.80%Australia & NZ 0.00% 5.80%
Argentina 9.00% 14.80%Belize 15.00% 20.80%Bolivia 4.88% 10.68%Brazil 2.63% 8.43%Chile 1.05% 6.85%Colombia 3.00% 8.80%Costa Rica 3.00% 8.80%Ecuador 10.50% 16.30%El Salvador 4.88% 10.68%Guatemala 3.60% 9.40%Honduras 7.50% 13.30%Mexico 2.25% 8.05%Nicaragua 9.00% 14.80%Panama 2.63% 8.43%Paraguay 6.00% 11.80%Peru 2.63% 8.43%Uruguay 3.00% 8.80%Venezuela 6.00% 11.80%Latin America 3.38% 9.18%Aswath Damodaran19
20
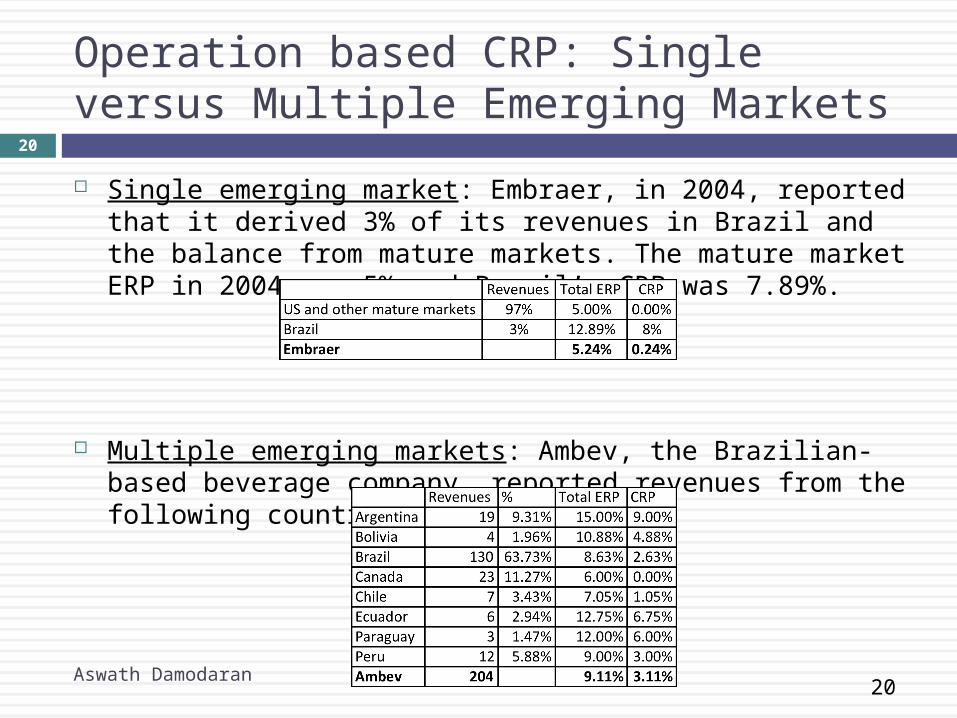
Operation based CRP: Single versus Multiple Emerging Markets
Single emerging market: Embraer, in 2004, reported that it derived 3% of its revenues in Brazil and the balance from mature markets. The mature market ERP in 2004 was 5% and Brazil’s CRP was 7.89%.
Multiple emerging markets: Ambev, the Brazilian-based beverage company, reported revenues from the following countries during 2011.
Aswath Damodaran
20
21
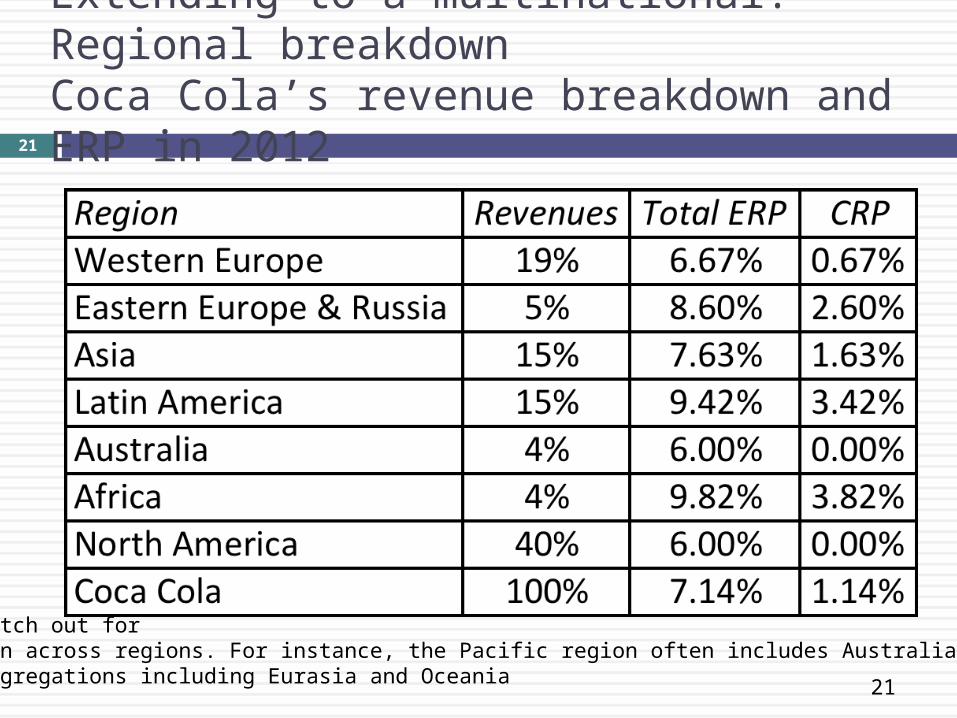
Extending to a multinational: Regional breakdownCoca Cola’s revenue breakdown and ERP in 2012
Things to watch out for1.Aggregation across regions. For instance, the Pacific region often includes Australia & NZ with Asia2.Obscure aggregations including Eurasia and Oceania
21
22
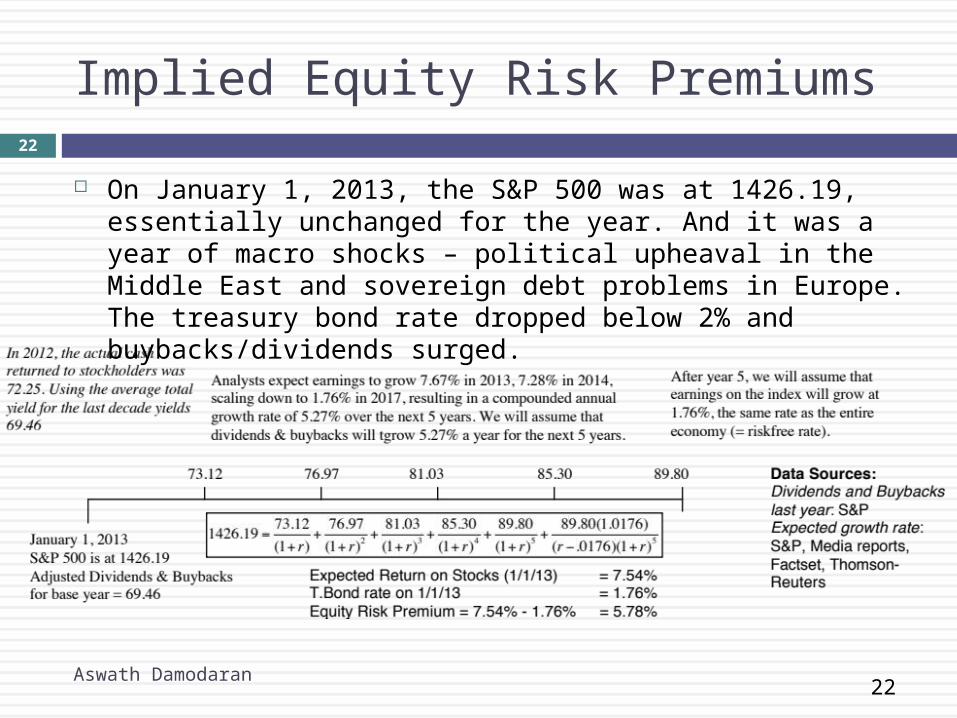
Implied Equity Risk Premiums
On January 1, 2013, the S&P 500 was at 1426.19, essentially unchanged for the year. And it was a year of macro shocks – political upheaval in the Middle East and sovereign debt problems in Europe. The treasury bond rate dropped below 2% and buybacks/dividends surged.
Aswath Damodaran
22
23
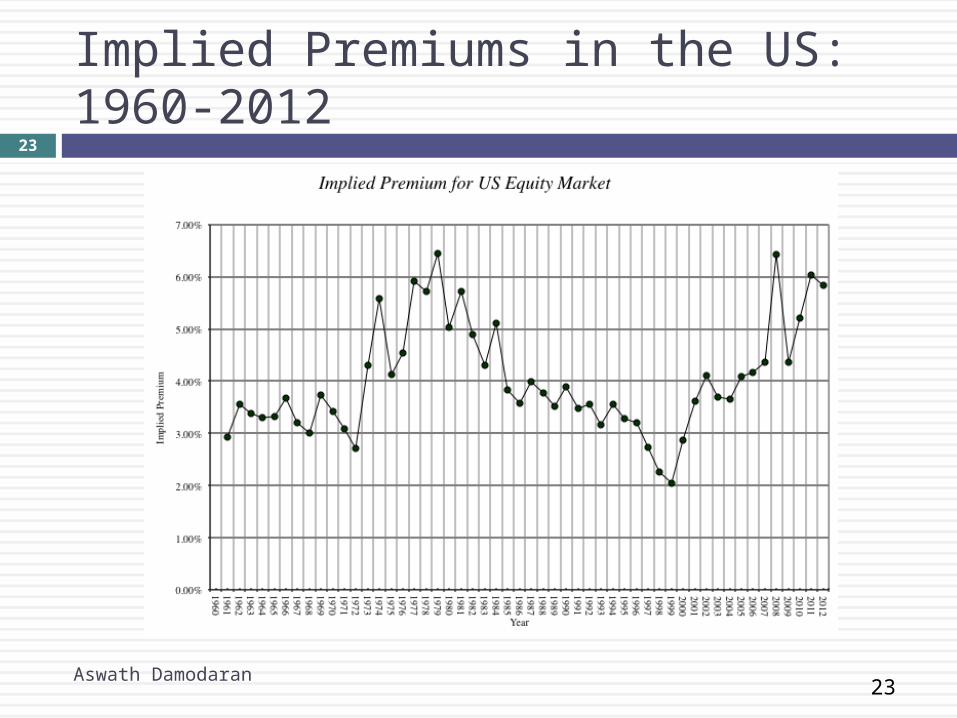
Implied Premiums in the US: 1960-2012
Aswath Damodaran
23
24
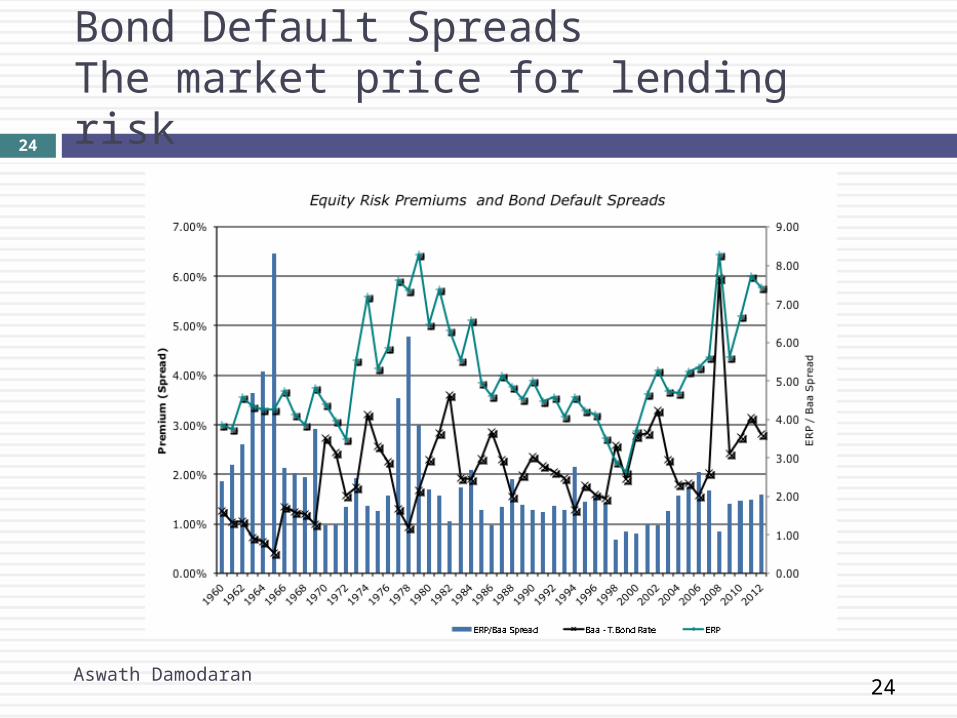
Bond Default SpreadsThe market price for lending risk
Aswath Damodaran
24
25
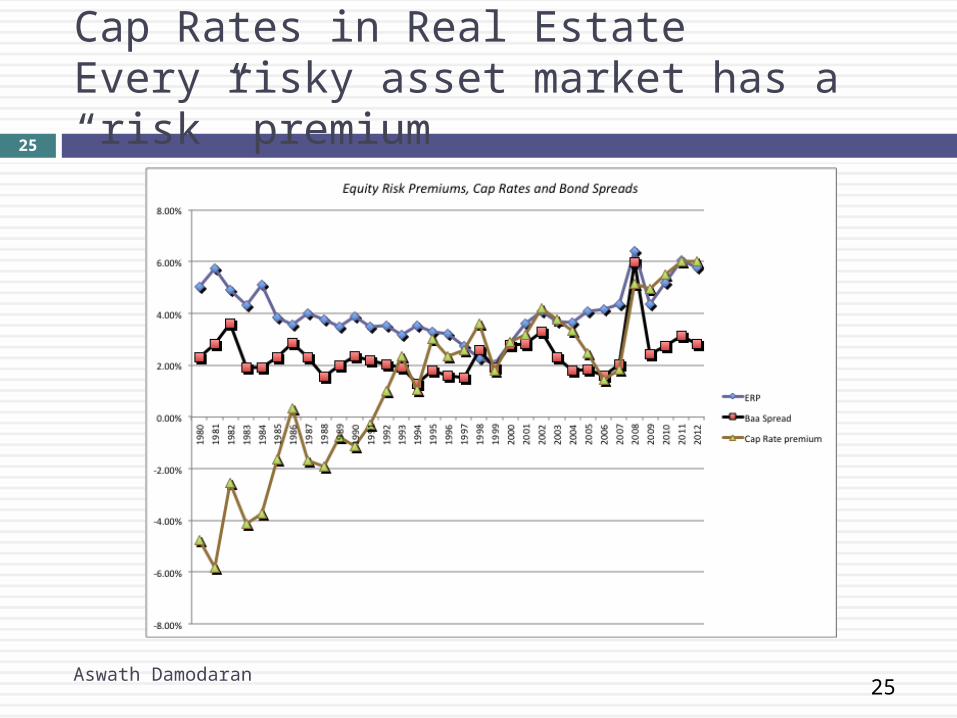
Cap Rates in Real EstateEvery risky asset market has a “risk” premium
Aswath Damodaran
25
26
The Macro Effects on Cash flows
The expected cash flows on an asset or company are determined partly by the company’s choices and partly by macro variables.
Thus, the earnings growth for a company will be higher, other things remaining equal, if the economy grows faster.
In the same vein, earnings and cash flows will be affected (and not always by the same amount) by the overall level of inflation as well as relative inflation (i.e., inflation in the goods/services that the company either consumes of produces, relative to overall inflation).
Finally, exchange rate movement can have positive or negative effects on earnings and cash flows.
Aswath Damodaran
26
27
Rule 1: Be macro consistentDiscount rate and Cash flow assumptions The risk free rate that you used to estimate your discount rate
already incorporates assumptions about inflation and real growth. The cash flows that you use should reflect the same expectations.
If you mismatch inflation or real growth assumptions, you will mis value companies. If you build in higher expectations of inflation and real growth into
your cash flows than you have incorporated into your discount rate, you will over value companies.
If you build in lower expectations of inflation and real growth into your cash flows than you have incorporated into your discount rate, you will under value companies.
Bottom line: It is more important that you be consistent in your inflation/ growth assumptions than that you are right.
Aswath Damodaran
27
28
Rule 2: Keep your focusDon’t let the macro drown the micro When you are asked to value a company, you should
keep your focus on what drives that value. If you bring in your specific macro views into the valuation, the value that you obtain for a company will be a joint result of what you think about the company and your macro views.
Bottom line: If you have macro views, provide them separately. You should be as macro-neutral as you can be, in your company valuations.
Follow up: If you find macro risk dominating your thoughts, deal with it frontally.
Aswath Damodaran
28
Aswath Damodaran29
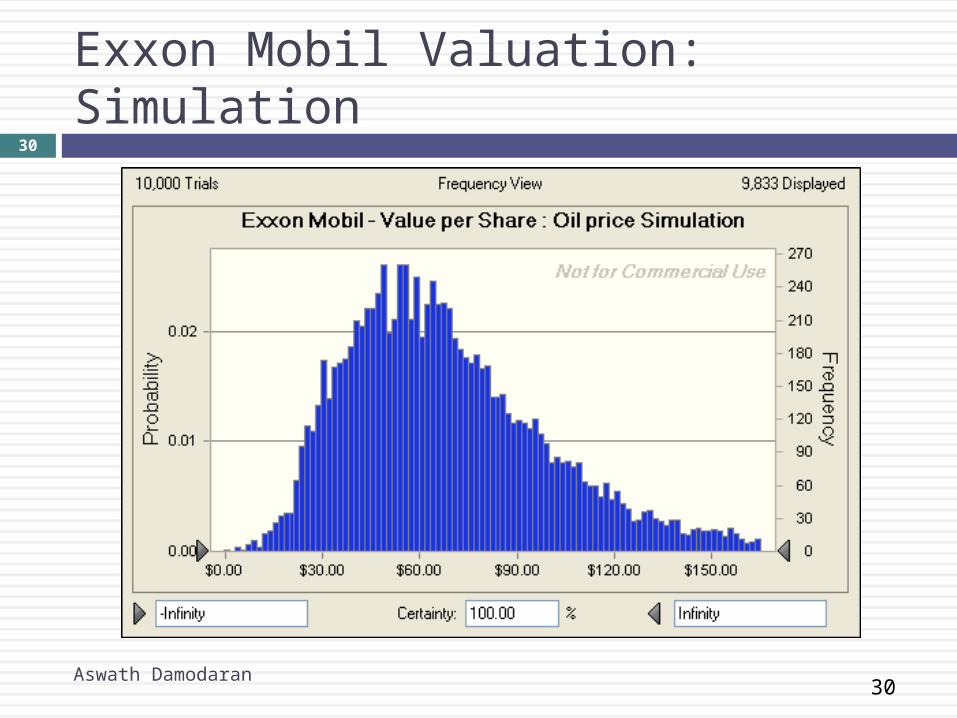
30
Exxon Mobil Valuation: Simulation
Aswath Damodaran
30