the making of a senator: barack obama and the 2004
TRANSCRIPT
Southern Illinois University CarbondaleOpenSIUCThe Simon Review (Occasional Papers of the PaulSimon Public Policy Institute) Paul Simon Public Policy Institute
8-2006
The Making of a Senator: Barack Obama and the2004 Illinois Senate RaceJohn S. JacksonSouthern Illinois University Carbondale
Follow this and additional works at: http://opensiuc.lib.siu.edu/ppi_papersSimon Review Paper #4
This Article is brought to you for free and open access by the Paul Simon Public Policy Institute at OpenSIUC. It has been accepted for inclusion in TheSimon Review (Occasional Papers of the Paul Simon Public Policy Institute) by an authorized administrator of OpenSIUC. For more information,please contact [email protected].
Recommended CitationJackson, John S. "The Making of a Senator: Barack Obama and the 2004 Illinois Senate Race." (Aug 2006).
THE MAKING OF A SENATOR:
BARACK OBAMA AND THE 2004 ILLINOIS SENATE RACE
By John S. Jackson
Visiting Professor
An Occasional Paper Of the Paul Simon Public Policy Institute
Southern Illinois University
Carbondale, Illinois
August, 2006
The Making of a Senator: Barack Obama
And the 2004 Illinois Senate Race
by John S. Jackson
Introduction
The 2004 U.S. Senate race in Illinois may prove to be one of the most significant in
American history. Perhaps not since the Senate election of 1858, when Stephen Douglas
defeated Abraham Lincoln, has one Senate election had such an impact on the national
leadership cadre. Although Lincoln lost the election, his speeches and debates with
Douglas over slavery and the future of the Union ensured his place as a national leader of
the young Republican Party and then as a leading contender for the Republican
nomination in 1860 (Goodman, 2005).
Although Barack Obama is one of one hundred Senators, and a freshman at that, he
has quickly become a much sought after speaker, and his influence has spread far beyond
the usual parameters for a first-term Senator. Obama is the first African-American male
Senator to be elected since Edward Brooke of Massachusetts. He is the second African-
American elected to the Senate from Illinois following former Senator Carol Moseley
Braun, who was elected in 1992 and then defeated in 1998 (Kenney and Hartley, 2003,
203-209). With the exception of the post Civil War Reconstruction Era, Brooke, Braun,
and now Obama are the only three popularly elected African-American Senators in
American history.
The status of being the only African-American in the U.S. Senate alone is enough to
guarantee Obama a significant platform in American politics if he chose to use it. It is
clear that he has been willing to accept the challenge and tries to realize his special
2
opportunity for leadership. Obama became a very high-profile, national political figure at
the time of his keynote address to the Democratic National Convention in Boston in late
July of 2004. The speech was extraordinarily well delivered and well reviewed and it
helped to catapult Obama to national prominence even before he was elected to the
Senate in November.
The Senator reportedly now receives an average of 300 invitations per week for
speaking opportunities. In the Senate, he is sought out for co-sponsorship of bills by
colleagues on both sides of the aisle and he has made common cause with several
Republican Senators on legislation that cuts across partisan boundaries. In addition,
Obama is now widely mentioned as a potential presidential or vice presidential candidate
for either 2008 or 2012, even though he is still a first term freshman (Zelney, 2006). The
Obama phenomenon is worthy of further study and analysis by serious scholars.
This paper provides a descriptive account of the 2004 Senate campaign and an
analysis of the foundation upon which Obama’s victory was built. In so doing, the paper
can provide some clues as to what kind of support and opposition a future Obama
candidacy may face. It also has some implications for the futures of the Democratic and
Republican parties in Illinois and nationally.
The 2004 Democratic Primary
We focus in this paper particularly on the demographics and geography of Obama’s
two races in 2004. The story properly begins with the Illinois Democratic primary held
on March 16, 2004. In many respects it was the more competitive and politically the
more “normal” contest and by far the biggest hurdle Obama faced that year. After he was
3

nominated, things turned really abnormal on the Republican side of the ticket and the
result was that Obama enjoyed a relatively easy road to victory in the general election. It
is now largely forgotten that the primary started out as a very competitive race and the
ultimate winner was far from certain. Obama had been a community activist in Chicago
since 1991 and a State Senator since 1997. He was a young man with an interesting
personal background since he was the son of the marriage between an African graduate
student from Kenya and a white mother from Kansas. He was born in 1961 in Hawaii
and partially raised by his grandparents there and by his mother and step father in
Indonesia (Obama, 1996). This childhood seemed to produce an unusually cosmopolitan
background and perhaps a high level of tolerance and an ability to see both sides of an
issue and empathy for the views of others. Obama was also obviously very capable,
graduated from Columbia University in New York, and he became the first African-
American President of the Harvard Law Review. After considering a number of possible
job offers and career paths, Obama settled in Chicago where he became a community
activist and where he taught constitutional law at the University of Chicago. He was first
elected to the Illinois State Senate in 1996 from the 13th District, which encompasses part
of the south side of Chicago and part of the Hyde Park community including the
University of Chicago as well as the poorest areas of the south side. He was known in
the Illinois Senate as someone who got along well and who tried to work with all factions.
It is also worth noting that Obama’s road to success was not completely smooth. He ran
against an incumbent congressman, Representative Bobby Rush, in the First
Congressional District in the Democratic Primary in March of 2000 and lost rather
decisively by a 61:30 percent margin (State Board of Elections, 2000, 8). At that point
4
some critics regarded Obama as a young man with more ambition than good judgment. It
is a long step from a failed Congressional primary to the kind of national prominence
Obama attained in 2004.
Obama returned to the Illinois Senate and to the projects he cared about to wait for
another and better opportunity for political advancement. The opportunity to run for an
open seat presented itself in 2003. First term Senator Peter Fitzgerald, a Republican who
had defeated Carol Moseley Braun in 1998 and facing a tough reelection fight,
announced that he was giving up his Senate seat and returning to private business. Many
observers thought Fitzgerald was vulnerable and that he might draw a Republican
challenger in the primaries as well as several Democratic opponents. Fitzgerald’s
withdrawal produced one of the few open seats for the Senate in 2004 and it elicited a
large field of candidates in both the Democratic and Republican Primaries. There were
five major candidates and three minor candidates in the Democratic Primary and four
major candidates and four minor candidates on the Republican side. When he announced
for the U.S. Senate race in 2003, Barack Obama was hardly a figure powerful enough to
frighten away potential opponents, and he had serious opposition.
The most prominent and proven political figure in the Democratic Primary was State
Comptroller Daniel Hynes. Hynes already held a statewide office and had the advantage
of fairly high name identification and having run and won a statewide race already.
Although he was a young man, Hynes was a member of a prominent Chicago political
family and his father, Tom Hynes, had been a State Senator, President of the Illinois
Senate and later Cook County Assessor, which is a powerful position. Daniel Hynes was
5
also known as a serious and capable office-holder and his record as Comptroller was well
regarded even though the office itself is the lowest profile constitutional office.
The most flamboyant of the Democrats was M. Blair Hull of Chicago who had made
a fortune as an investments expert and stock trader. This was Hull’s first try at elective
office and he started out unknown statewide. Following the model of other wealthy
business people who entered politics in mid-life, Blair Hull started his campaign very
early and spent a considerable amount of his substantial personal fortune, which was
reported to be in the range between $131 million and $444 million (Fornek, 2004, 6). In
2002 he helped to support and finance a number of state and local candidates in
preparation for 2004. Hall also started his own 2004 campaign with a very early and very
large media buy bringing up his advertisements in the summer of 2003. If personal
wealth can buy one’s way into the U.S. Senate, and there is evidence that it can certainly
help as in the case of the Maria Cantwell of Washington, Jon Corzine of New Jersey, and
Peter Fitzgerald in Illinois, Blair Hull had as good as a chance as any other candidate. He
certainly garnered the most early publicity.
The other two major Democratic candidates were Maria Pappas who was Cook
County Treasurer and Gery Chico, who had been Chief of Staff to Mayor Richard M.
Daley and then Daley’s appointment to be Chair of the Chicago School Board. Nancy
Skinner, Joyce Washington, and Estella Johnson Hunt rounded out the field and proved
not to be significant factors in the outcome. Overall, then, in handicapping the candidates
at the outset of the Democratic Primary in 2004 an analyst might have ranked Hynes as
the potential favorite because of his statewide experience and name identification,
coupled with the support of the regular party organization throughout the state. Hull was
6
probably the most likely outsider to catch on simply because he was so well financed and
had started so early in building up a campaign support infrastructure. Obama was the
most interesting new face for a statewide office and had a compelling Horatio Alger-type
personal story; however, he was also largely unknown and untested outside his Senate
district on the south side of Chicago. Either of the other two major Democrats, Gery
Chico and Maria Pappas might have been Chicago machine candidates in an earlier era;
however, they were largely unknown outside the city and would have to struggle to gain
any statewide traction, which they ultimately failed to do (Chicago Sun-Times, March 1,
2004, 6-7).
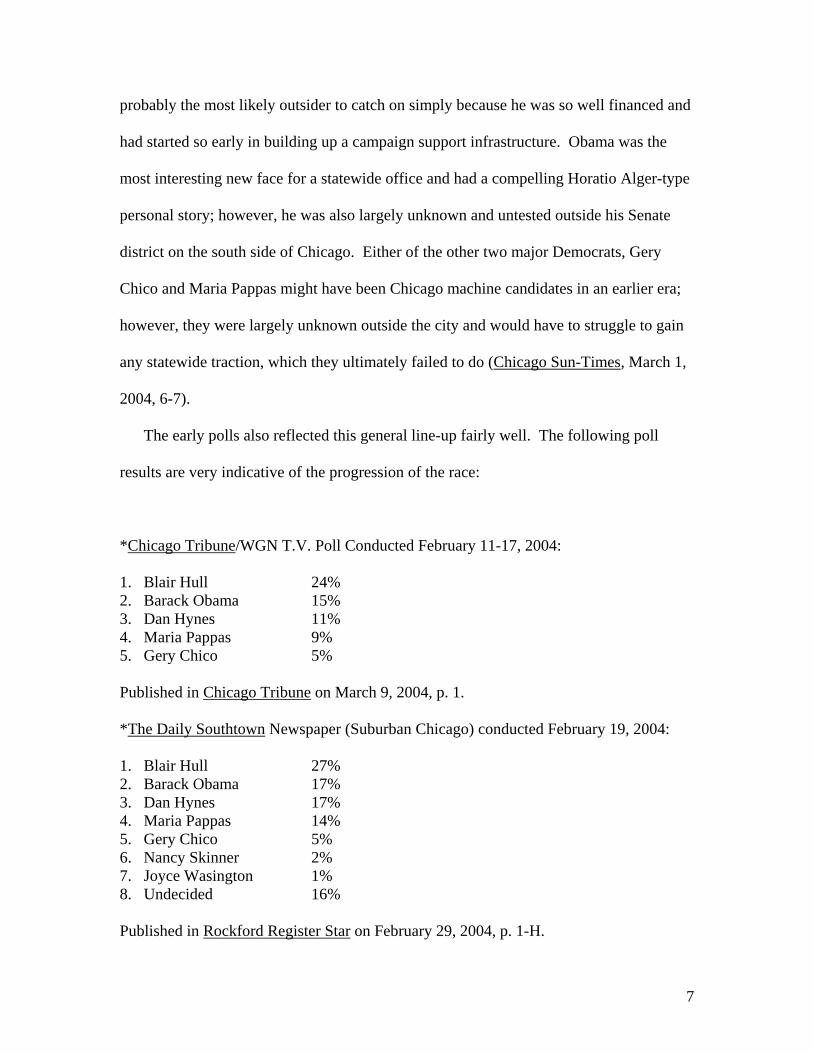
The early polls also reflected this general line-up fairly well. The following poll
results are very indicative of the progression of the race:
*Chicago Tribune/WGN T.V. Poll Conducted February 11-17, 2004:
1. Blair Hull 24% 2. Barack Obama 15% 3. Dan Hynes 11% 4. Maria Pappas 9% 5. Gery Chico 5% Published in Chicago Tribune on March 9, 2004, p. 1.
*The Daily Southtown Newspaper (Suburban Chicago) conducted February 19, 2004:
1. Blair Hull 27% 2. Barack Obama 17% 3. Dan Hynes 17% 4. Maria Pappas 14% 5. Gery Chico 5% 6. Nancy Skinner 2% 7. Joyce Wasington 1% 8. Undecided 16% Published in Rockford Register Star on February 29, 2004, p. 1-H.
7

*Chicago Tribune/WGN T.V. poll conducted February 23, 2004:
1. Blair Hull 24$ 2. Barack Obama 15% 3. Dan Hynes 11% 4. Maria Pappas 9% 5. Gery Chico 5% 6. Undecided 34%
Published in Rockford Register Star, February 29, 2004, p. 1-H.
*Daily Southtown/Chicago Sun-Times poll conducted March 3, 2004:
1. Barack Obama 28% 2. Blair Hull 23% 3. Dan Hynes 22% 4. Maria Pappas 10% 5. Gery Chico 3% 6. Joyce Washington 3% 7. Nancy Skinner 1% 8. Undecided 11% Published in Chicago Sun-Times, March 5, 2004, p. 9. *Chicago Tribune/WGN T.V. poll conducted March 3-6, 2004: 1. Barack Obama 33% 2. Dan Hynes 19% 3. Blair Hull 16% 4. Maria Pappas 8% 5. Gery Chico 6% 6. Others 2% 7. Undecided 16% Published in the Chicago Tribune, March 9, 2004, p. 1-A.
8
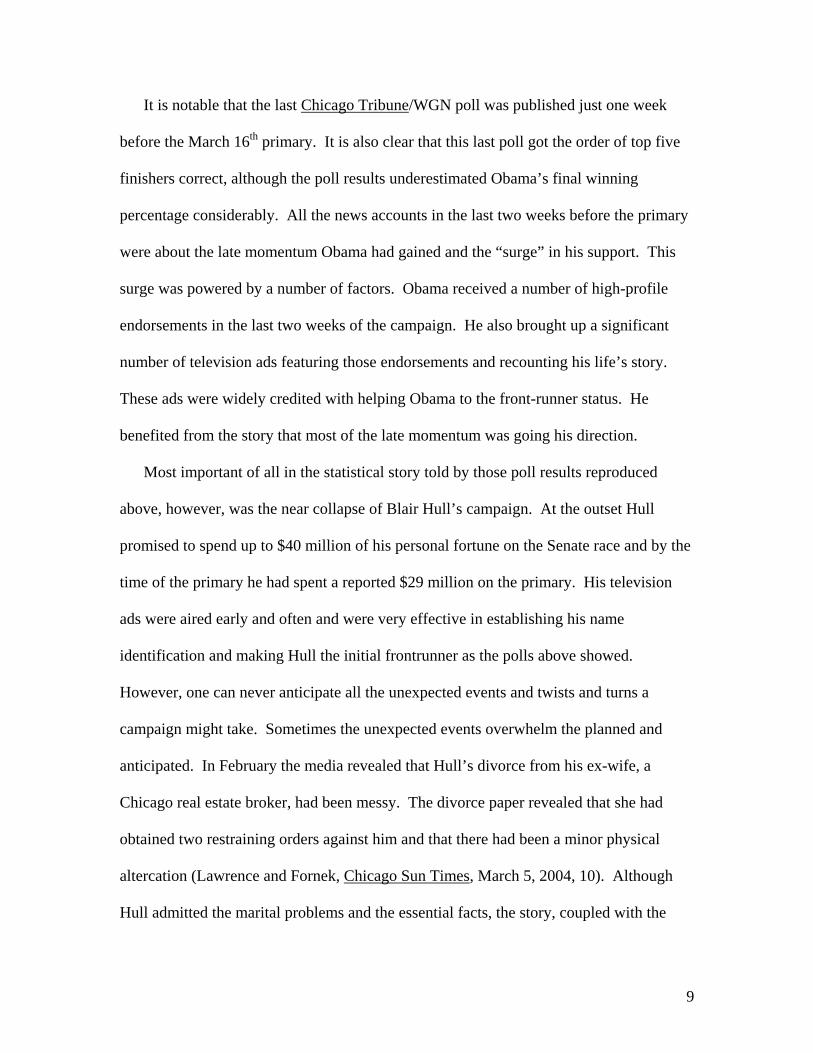
It is notable that the last Chicago Tribune/WGN poll was published just one week
before the March 16th primary. It is also clear that this last poll got the order of top five
finishers correct, although the poll results underestimated Obama’s final winning
percentage considerably. All the news accounts in the last two weeks before the primary
were about the late momentum Obama had gained and the “surge” in his support. This
surge was powered by a number of factors. Obama received a number of high-profile
endorsements in the last two weeks of the campaign. He also brought up a significant
number of television ads featuring those endorsements and recounting his life’s story.
These ads were widely credited with helping Obama to the front-runner status. He
benefited from the story that most of the late momentum was going his direction.
Most important of all in the statistical story told by those poll results reproduced
above, however, was the near collapse of Blair Hull’s campaign. At the outset Hull
promised to spend up to $40 million of his personal fortune on the Senate race and by the
time of the primary he had spent a reported $29 million on the primary. His television
ads were aired early and often and were very effective in establishing his name
identification and making Hull the initial frontrunner as the polls above showed.
However, one can never anticipate all the unexpected events and twists and turns a
campaign might take. Sometimes the unexpected events overwhelm the planned and
anticipated. In February the media revealed that Hull’s divorce from his ex-wife, a
Chicago real estate broker, had been messy. The divorce paper revealed that she had
obtained two restraining orders against him and that there had been a minor physical
altercation (Lawrence and Fornek, Chicago Sun Times, March 5, 2004, 10). Although
Hull admitted the marital problems and the essential facts, the story, coupled with the
9

negative media coverage of it, seemed to stop Hull’s campaign cold. He went from
leading the horse race polls to a weak third place in a period of about two weeks. No
amount of pleading extenuating circumstances, pained explanations, and mea culpas
appeared to gain him much sympathy. In the end, Hull finished a very distant third with
just under 11% of the vote.
The clear beneficiary of the Hull collapse seemed to be Barack Obama. His poll
numbers rose in tandem with Hull’s decline. For whatever reason, Dan Hynes, the State
Comptroller, seemed unable to take advantage of the same volatility in the electorate. It
seems evident in retrospect that Obama received the benefit of the initial Hull voters who
switched during the primary campaign plus more than his share of the undecided voters.
Obama received several high profile endorsements, including Sheila Simon, daughter of
the late Senator Paul Simon, and Michael Jordan. Simon made a very effective television
ad for Obama and Jordan donated a well publicized $10,000 check. The more
endorsements he received the more the media covered him and the more people noticed
Obama. The more people learned about Obama, the more they appeared to like him. His
53 percent victory, over better known and better financed and more experienced
opponents, was an impressive victory given the broad field he faced. Some candidates
appear to wilt in the glare of the spotlight. Obama seemed to grow and thrive in it.
When the primary was over, Obama was in a good position to mount a very competitive
campaign for the general election. He still had to face a very serious Republican
opponent and the Senate seat was currently held by the Republicans. The Republicans
were determined to use their national party power and resources, including President
Bush, and the resources of the Republican National Committee and the National
10
Republican Senatorial Committee (NRSC) in an attempt to hold onto that Senate seat.
The Republican who emerged from the primary, Jack Ryan, at that point was a strong
candidate. He had won a hard fought race and had defeated three other very creditable
challengers.
The Republican Primary
The Republican Primary drew four major candidates and four more minor candidates.
The four major candidates were generally well regarded and each could claim to be a
very competitive choice to replace Senator Peter Fitzgerald. Jim Oberweis was a Kane
County businessman, the owner of a dairy which bore his family name, and the champion
of the most conservative wing of the Republican Party. Oberweis had run for Senator in
2002 and had finished second to the Republican nominee, Jim Durkin, that year; with 32
percent of the statewide vote in that race. Through that race he managed to get his name
recognition widely established. His very aggressive use of television ads, especially ads
attacking illegal immigrants, became a source of controversy; however, he was also very
appealing to the most conservative wing of the party. Oberweis also pledged to sink a
considerable proportion of his personal fortune into this race.
State Senator Steve Rauschenberger was from suburban Elgin located in Kane and
western Cook counties, a Republican stronghold. He had been a leader in the Illinois
General Assembly for years and was very highly regarded by his legislative colleagues.
Several downstate legislators endorsed him in the primary and lent assistance to his
campaign. Rauschenberger was also later the Chair of the National Conference of State
Legislatures (NCSL) which was another mark of his colleagues’ respect for him.
11
Andrew McKenna Jr. was a Chicago-area businessman and community activist. He
was also the son of a widely respected business leader and philanthropist in Chicago. He
held a Master’s Degree from Northwestern University, worked at Kraft foods, and then in
1981 became President of Schwartz Paper Company. McKenna was later elected to be
Chair of the Republican Party statewide after losing the Senate primary.
Probably the most interesting and charismatic of the Republican candidates was Jack
Ryan. He also was a graduate of Harvard Law School and held a Master’s Degree in
Business from Harvard. After college, he went to work at Goldman Sachs as an
investment banker and became a multi-millionaire from his investments. His net worth
was estimated to be between $38 million and $96 million. Ryan then quit the investment
banking business to teach in an inner-city school, Hales Franciscan, between 2000 and
2003. Several of his former students actively campaigned for Ryan. He had also been
married to a movie and television star, Jeri Ryan, with whom he had a son. Ryan himself
had movie star good looks and presence. He started out as the leader in the early polls
and was still the leader when the campaign closed. (Biographical material obtained from
campaign biographies and the media, especially Fornek, Chicago Sun-Times, March 2,
2004, pp. 12-13.) Ryan just seemed perfect for the part and he led the race from the start
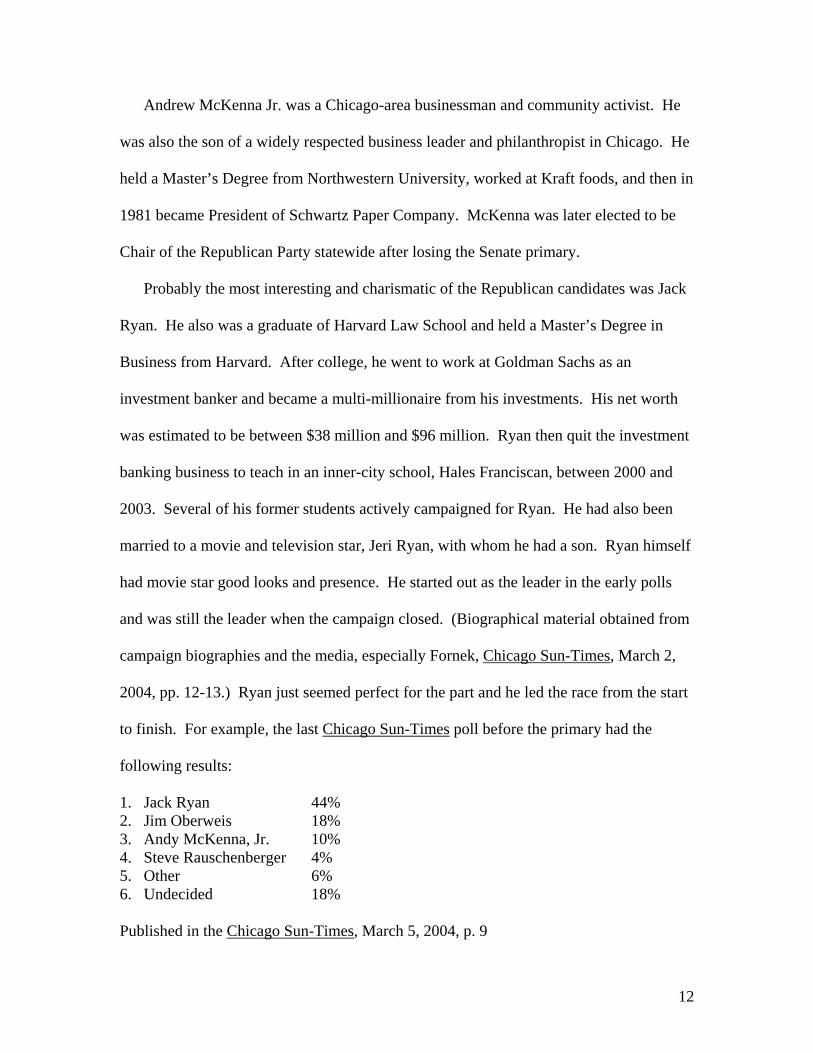
to finish. For example, the last Chicago Sun-Times poll before the primary had the
following results:
1. Jack Ryan 44% 2. Jim Oberweis 18% 3. Andy McKenna, Jr. 10% 4. Steve Rauschenberger 4% 5. Other 6% 6. Undecided 18% Published in the Chicago Sun-Times, March 5, 2004, p. 9
12
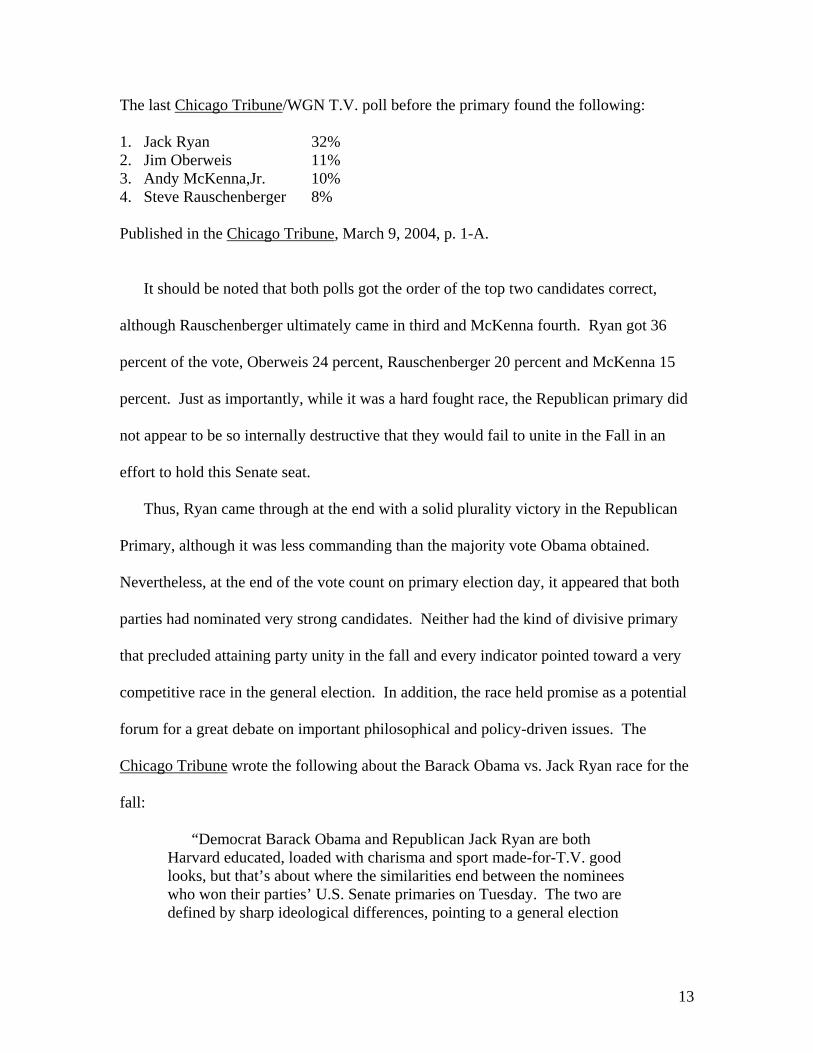
The last Chicago Tribune/WGN T.V. poll before the primary found the following: 1. Jack Ryan 32% 2. Jim Oberweis 11% 3. Andy McKenna,Jr. 10% 4. Steve Rauschenberger 8% Published in the Chicago Tribune, March 9, 2004, p. 1-A.
It should be noted that both polls got the order of the top two candidates correct,
although Rauschenberger ultimately came in third and McKenna fourth. Ryan got 36
percent of the vote, Oberweis 24 percent, Rauschenberger 20 percent and McKenna 15
percent. Just as importantly, while it was a hard fought race, the Republican primary did
not appear to be so internally destructive that they would fail to unite in the Fall in an
effort to hold this Senate seat.
Thus, Ryan came through at the end with a solid plurality victory in the Republican
Primary, although it was less commanding than the majority vote Obama obtained.
Nevertheless, at the end of the vote count on primary election day, it appeared that both
parties had nominated very strong candidates. Neither had the kind of divisive primary
that precluded attaining party unity in the fall and every indicator pointed toward a very
competitive race in the general election. In addition, the race held promise as a potential
forum for a great debate on important philosophical and policy-driven issues. The
Chicago Tribune wrote the following about the Barack Obama vs. Jack Ryan race for the
fall:
“Democrat Barack Obama and Republican Jack Ryan are both Harvard educated, loaded with charisma and sport made-for-T.V. good looks, but that’s about where the similarities end between the nominees who won their parties’ U.S. Senate primaries on Tuesday. The two are defined by sharp ideological differences, pointing to a general election
13
campaign that harbors the potential to evolve into a sophisticated debate on the future direction of national policy.”
(Chase and Mendell, March 17, 2004, 1-A.)
The Unfolding Campaign
At the outset of this campaign all of the indicators pointed toward a very competitive
race. The race featured two articulate, capable, even charismatic candidates. The two
parties have been competitive over a long period of time in Illinois. The Democrats have
enjoyed a slight advantage statewide since 2000 and elected all the constitutional officers
statewide in 2002 except for the Republican Treasurer. The current division in the
Congressional delegation is ten Democrats and nine Republicans, although in 2004 it was
ten Republicans and nine Democrats. At the time of the 2004 election the state’s senior
Senator was Richard Durbin, a Democrat, and the junior Senator was Peter Fitzgerald, a
Republican; so the Republicans were trying to hold onto the Senate seat Fitzgerald had
won in 1998. Based on past performance the national Republican Party could be
expected to match or exceed any funds the Democratic Party could raise to assist Obama.
In addition, Jack Ryan was personally wealthy and could help finance his own campaign.
At that point the candidates had not attained any national stature and the race would have
to be rated as competitive.
An examination of the voting returns from the March 2004 primary indicates where
the candidates were strong and where each candidate showed potential weaknesses. By
extension these results also indicate a great deal about the traditional strengths and
weaknesses of the two parties in Illinois. At the risk of slight oversimplification it is
generally true that Ryan and the Republicans enjoyed some advantages in their wider
14
geographical distribution of the vote and Obama and the Democrats enjoyed significant
advantages on population and numbers of voters. Put simply, Obama won a total of
655,923 votes which was 52.77 percent of the total of 1,310,129 ballots cast in the
Democratic Primary while his closest competitor, Dan Hynes won 294,717 or 23.71
percent of the total. On the Republican side Ryan won 234,791 votes which were 35.48
percent of the total of 702,658 votes cast in the Republican Primary. Ryan’s closest
competitor, Jim Oberwise, received 23.54 percent of the total Republican vote, which
was almost identical to the Hynes percentages as the Democratic runner-up (Illinois State
Board of Elections, March 16, 2004, 8). (See Appendix A.) Based on primary votes
alone, the results leaned toward Obama and the Democrats; however, the Republicans in
Illinois can be quite competitive with the right candidates in statewide races. They
controlled the Governor’s office for 26 consecutive years until Rod Blagojevich defeated
Jim Ryan in 2002. In addition, Peter Fitzgerald won this Senate seat in 1998 by defeating
the then incumbent, Carol Moseley Braun. Although party loyalty is an important initial
foundation, the race in Illinois usually goes to the party which presents the strongest
candidate with the most effective campaign.
Part of the story on just how competitive a statewide race can be in Illinois is told by
the geographical distribution of the vote. In recent elections the overall pattern has been
as follows:
1. The Democrats dominate the City of Chicago by winning very large percentages
of the total vote. While suburban Cook County outside the city formerly
produced substantial numbers of Republican votes, those numbers have been
15
declining in recent years. The 2000 census showed Chicago only contained 23
percent of the total population in Illinois while suburban Cook County contained
20 percent for a total of 43 percent of the Illinois population (Jackson, 2004, 5).
2. The Republicans formerly dominated the ring of five large suburban counties
around Chicago. DuPage County is the largest of these and has been the
backbone of the Republican Party in Illinois. The five collar counties contain 21
percent of the state total and coupled with suburban Cook’s 20 percent, the
suburban total is 41 percent of the state (Jackson, 2004). More recently the
Democrats have made significant inroads into these suburban counties and have
been winning statewide races partially on the strength of these suburban increases
(Green, 2003).
3. The remaining 96 counties are loosely termed “Downstate.” In the 2000 census,
Downstate held 38 percent of the total population. Political scientists Peter Colby
and Paul Green originally pointed out that these 96 counties could hold the
“balance of power” because they determined the winner when the vote was
closely split between Democratic Chicago and the Republicans in the suburbs
(Colby and Green, 1982). More recently, however, the suburbs have held the
balance of power compared to Downstate and the suburbs, especially suburban
Cook County, have become more diverse (Green, 2003).
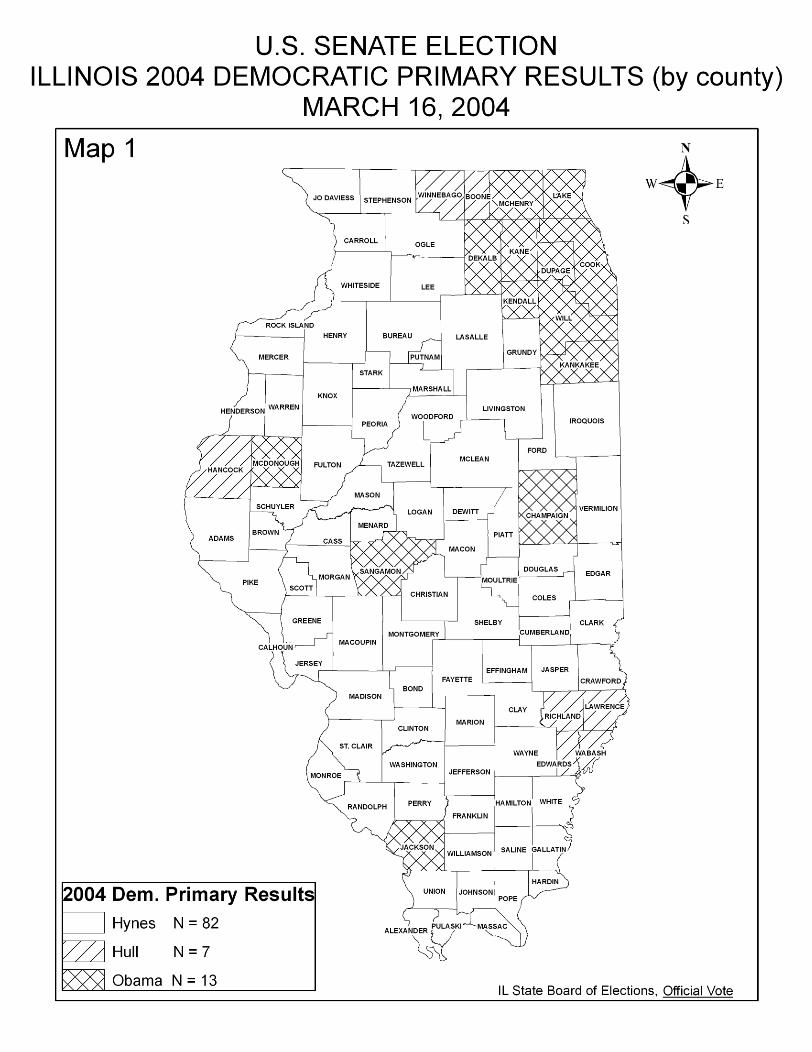
The distribution of Barack Obama’s vote in the Illinois Primary compared to all his
Democratic competitors gives a good indicator of where his original strength lay in
Illinois. These results are displayed on Map 1 and Appendix A. This map displays
16
Obama’s bedrock strength and his potential for challenges in future campaigns. It is clear
from this map that Obama’s core constituency originally was in urban Chicago and in the
suburban collar counties. He won the city of Chicago handily and won all five of the
collar counties, plus Kankakee County which is just south of the suburban ring. This is
where he piled up insurmountable vote advantages. It is also notable that outside the
urban and suburban ring, Obama only won four other counties downstate. These were
Champaign County, the home of the University of Illinois’ main campus; Jackson County,
the home of Southern Illinois University’s main campus; Sangamon County, the seat of
state government and the home of one of the University of Illinois campuses; and
McDonough County in western Illinois, the home of Western Illinois University.
It is notable that the regular party organization’s favored candidate, Comptroller Dan
Hynes, won a total of 83 counties out of 102 total. His strength was spread across all of
Downstate Illinois; however, he simply did not do well enough in his hometown of
Chicago to be competitive with Obama. As an interesting footnote to a failed campaign,
Blair Hull actually carried seven counties, two in far northern Illinois, a nest of four deep
in southern Illinois, and Hancock County standing alone in far western Illinois. A
campaign which once held great promise, and which cost millions of dollars, ultimately
foundered on the rocks of personal and marital difficulties.
On the Republican side Jack Ryan won both the population and the geographic races.
Ryan took a total of 86 counties and these were spread evenly across Illinois. He won big
in Chicago, Cook County and the suburbs. He also ran well downstate. Oberweis came
in second in the popular vote and won five counties including DeKalb and suburban
Kendall, St. Clair in the metro-east area, and Franklin and Union in southern Illinois
17
where his rock-ribbed conservatism had more appeal. Rauschenberger won eleven
counties including his home turf of Kane County and a scattering of downstate counties,
especially in southern Illinois, such as Jackson, Washington and Jefferson, where his
legislative colleagues were helpful. McKenna won a single county, Warren, deep in
northwest Illinois. (See Appendix B.)
In summary, the primaries produced strong and competitive candidates for each party.
Each party had reason to believe they could win the general election. Ryan had run well
Downstate and Obama had done extremely well in the city of Chicago. Both candidates
had run well in the suburban collar counties. The decision would presumably hinge on
who could conduct the best campaign and especially which candidate could appeal to the
Independents and the growing suburban vote. Certainly based on the returns from the
primaries there was ample reason to believe that either Jack Ryan or Barack Obama could
exhibit such appeal.
The readers of this paper are likely to know that the story took a dramatic shift shortly
after the primaries were over on March 16. Before the primary there had been persistent
rumors about the Jack Ryan divorce case. The court files on Ryan’s divorce from actress
Jeri Ryan had been sealed at Jack Ryan’s request. His explanation was that he was
concerned about protecting the privacy of the couple’s son. Some of Ryan’s Republican
primary opponents alluded to the sealed file and made vague reference to it in debates
before the primary, but nothing specific came out. Then shortly after the primary a court
in California ordered that the file should be unsealed. The file contained rather damaging
allegations by Jeri Ryan against Jack Ryan regarding incidents related to their sex life.
The story became an explosive one and an overnight sensation among the media. Here
18
was another divorce file, and another set of charges by a former wife coming into play in
this Senate race. It was very reminiscent of the situation which had effectively derailed
Blair Hull’s candidacy before the primary; however, this all came out after the primary.
The timing could have hardly been worse for the Republicans.
After much public pressure from various Republican Party leaders, Jack Ryan
announced that he was giving up his place as the Republican Party nominee for the U.S.
Senate. The Republican State Central Committee, which had pressured him to resign
from the ticket, accepted his resignation and met to choose a successor. After much
debate and internal wrangling committee members decided to nominate conservative
commentator, Alan Keyes, who had run for President in 2000 and who lived in Maryland.
Indeed, Keyes had earlier also run for the U.S. Senate from Maryland. At best it was an
unusual decision which proved to be highly controversial. Many critics asked why no
worthy Republicans could be found to run for the Senate out of a state of more than 12
million people.
Editorial opinion, for example, throughout the state’s newspapers was almost
unanimously negative. The only explanations for this extraordinary decision were that
the Republican State Central Committee wanted someone who was already well-known
and who could take the fight to Obama aggressively in the fall. As a prominent African-
American activist who was very outspoken on a variety of conservative social agenda
causes, Alan Keyes seemed to fit that job description. Others speculated that the
conservative legislators from Downstate felt that Keyes could have a coattail effect in
some marginal races in their districts. This reason had some plausibility to it as well.
19
Whatever the original strategic plan in bringing Keyes to Illinois from Maryland to
campaign against Obama, it did not work out well in execution (Long and Parsons,
Chicago Tribune, August 20, 2004, 1). Keyes did mount an aggressive and outspoken
campaign on behalf of several of his social issue causes. He was strongly against
abortion, against gay rights, and in favor of increasing religion’s role in the public square.
When it came to his rationale for being Senator from Illinois, to the bread and butter
concerns of many voters, and plans for bettering the economic status of the people he
would represent, the Keyes campaign faltered. He appeared stuck in radio talk show
mode. He seemed never to gain much traction in presenting himself as a viable and
creditable candidate for the Senate from Illinois. When Keyes made strongly worded
charges against his opponent, Obama largely ignored him.
Obama did not conduct a Rose Garden strategy however. He mounted a very
energetic and high-profile campaign for the Senate even if little of it was aimed directly
at Alan Keyes. He campaigned aggressively from the date of his nomination in March,
all through the spring and into early summer, and then came his moment in the national
spotlight as Keynote Speaker at the Democratic National Convention in Boston in late
July. By virtually all assessments Obama rose to the occasion and took maximum
advantage of the opportunity that had been offered to him. The speech was graceful
stylistically and thoughtful substantively. It was extremely well reviewed by almost all
commentators. The national media certainly took note and gave him massive free
exposure. Here was an articulate young African-American, presenting mostly
mainstream and moderate views, with an engaging personality and an attractive wife and
family. Americans in general are attracted to candidate images more that the candidate’s
20
specific issues. They want someone they feel they can relate to and that they can trust
and who seems to have the ability to understand people like them and the lives they live.
Obama seemed to project those qualities.
Obama quickly took command of a national stage after the Democratic Convention
Keynote. Invitations to speak virtually all over the country, to be interviewed on all the
talk shows, and to campaign for fellow Democrats poured in rapidly. Simply sifting
through all those opportunities and deciding where to use Obama’s limited time and
energy became a major problem for him and his staff. Obama appeared to keep a good
attitude and to stay well grounded and focused on his Senate race. He frequently pointed
out that his first obligation was to campaigning in Illinois and that his first objective was
to winning the U.S. Senate race. In self-deprecating humor, Obama joked that he had not
accomplished anything yet of national significance and that if elected he would be #100
in seniority. While some people were already talking about his inevitably running for
President someday, Obama for the most part confirmed himself to the mundane details of
his Senate campaign in Illinois. Obama adopted the strategic decision largely to ignore
Alan Keyes unless there was absolute need for a specific rejoinder or face-to-face
encounter. For instance, on one occasion Keyes claimed that Jesus Christ would not vote
for Obama (on moral grounds). Obama declined to answer even when reporters pressed
him for a response, a decision he much later said he regretted when he gave a much noted
speech on religion and politics in June of 2006 (Obama, Chicago Tribune, July 18, 2006,
11). Nevertheless, Obama mostly stayed focused on his own Senate campaign and
winning the race in the fall despite his growing national recognition.
21
The published polls certainly seemed to validate the wisdom of Obama’s strategy.
All of the published polls consistently projected a wide lead for Obama (McDermott, St.
Louis Post-Dispatch, October 28, 2004, 1-A). As far as the polls were concerned, the
only question remaining was how large Obama’s winning margin would be. The Keyes
campaign replied when asked about the polls that, “the only poll which matters is the one
taken on election day.” This is, of course, the standard response for the candidate who is
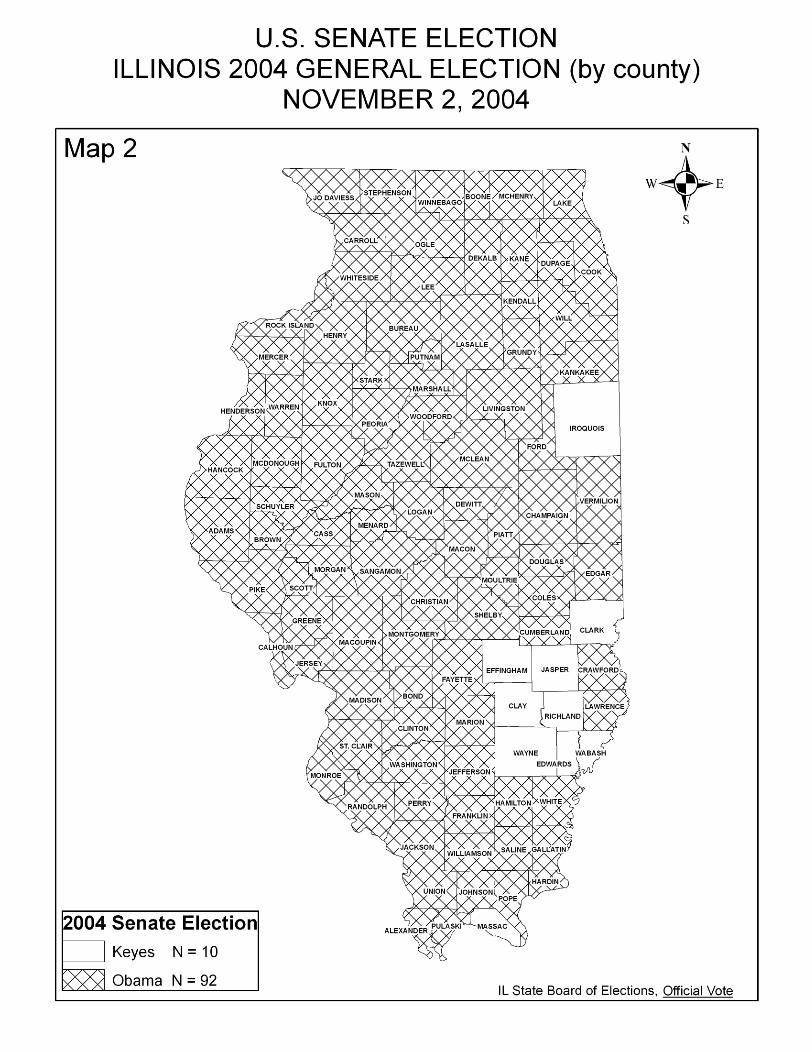
trailing badly. The actual vote came soon enough on November 2, 2004. Barack Obama
won the U.S. Senate seat by a margin of 69.9 percent to 27.05 percent, one of the largest
margins in Illinois history. His statewide victory included an extraordinary level of
support in central city Chicago, a very large lead in the suburbs, and a substantial victory
Downstate. Map 2 shows the results in geographical terms. As is evident from Map 2,
Obama won 92 of the 102 counties in Illinois. While Obama’s victory margin was deep
and wide it is worth examining where Alan Keyes succeeded. This will provide some
clues as to where the Republican bedrock is in Illinois as well as clues as to where
Obama could have problems in the future. As one can see in Map 2, there was a block of
counties in deep southern Illinois which Keyes carried. These include Effingham, Jasper,
Clark, Clay, Richland, Wayne, Edwards, and Wabash counties. These are rural and small
town counties where cultural conservatism has always been strong and where religious
fundamentalism is growing in its impact on politics. They are also counties where the
loss of high paying union jobs is felt keenly and stress from the pressures of a global
economy is great; however, for a variety of reasons the Democrats have failed to
capitalize on this domestic issue area which traditionally favors them especially in
southern Illinois. This nest of eight counties was joined was joined by Massac County in
22
deepest southern Illinois across the Ohio River from Kentucky and by Iroquois County in
central Illinois. Both of these are places of traditional Republican Party strength. It
should also be noted that all ten of the Keyes victory counties are represented by
Republicans John Shimkus and Tim Johnson in Congress, and they are counties which
President George W. Bush won handily in 2000 and 2004.
So, Keyes won where Republicans have traditionally won in Illinois. He also
captured and perhaps even enhanced the viability of running a campaign based almost
exclusively on morals and values issues and religious fervor. While that strategy was not
nearly enough in the 2004 Illinois Senate race, it nevertheless has a powerful appeal to
one of the Republican Party’s most crucial core constituencies. That constituency of very
conservative voters has not been dominant in the Republican Party in Illinois; however, it
is vital and growing in many other states.
In most of the South and in many congressional districts in the Midwest, the
Mountain West, and the Southwest the question of morality and family values are the
major driving forces for people’s vote. Their translation of morals and values is usually
in terms of where the candidate stands on the litmus tests of abortion, gay marriage,
prayer in the public schools, and appointments to the Federal courts. Keyes was right and
Obama was wrong on those issues from the perspective of this category of “values
voter.” In some parts of southern and central Illinois where Keyes ran well, in most of
the white south today, and in much of rural and small town America today, the
Democrats have lost elections based on the cultural and religious values appeals of the
Republicans. The Democrats have proven incapable of countering that appeal and using
their own traditional strength on economic and bread and butter issues, or the legitimate
23
role of governmental services, to appeal to many of the people who need these services
and economic development. The Democratic Party has experienced very little success in
expanding the definition of “morality” to larger issues that gay rights, abortion, and the
Pledge of Allegiance and flag burning. They have not found a voice of reason on the
relation between religion and politics. Barack Obama was able to overcome those
historic limits of the Democratic Party and appeal to a broad and diverse range of Illinois
voters. He became an extraordinary coalition builder in the 2004 campaign and that
ability may be transferable into other settings, however, the 2004 race featured some
special circumstances.
Concluding Observations on Obama’s Future
Obama’s reputation seems to have continually improved since the 2004 election. He
is widely sought out as a speaker and a guest on television talk shows. He re-released his
biography and it became a best seller (Obama, 1995). He signed a very lucrative book
deal which made him an instant millionaire. He is an active member of the Senate who is
enlisted as a co-sponsor for legislation by Democrats and Republicans alike. He has
traveled all over the United States and to several nations overseas and his travels are
widely covered when he is in any state or country.
In July of 2006, when he accepted the invitation of Iowa Senator Tom Harkin to
attend his fish fry and speak in the rural area outside DesMoines, speculation about an
Obama run for the Presidency as early at 2008 increased, although others thought a run in
2012 to be more realistic. Talk of a joint ticket with Senator Hillary Clinton or another
prominent Democrat also ran rampant well over two years before the 2008 presidential
24
election. Obama had clearly become a national figure with a significant national
reputation quite apart from whatever his legislative record in the Senate might ultimately
prove to be.
There are two lessons to draw from the Obama results in the Illinois Primary of
March 2004, well before Obama became nationally famous. First, Obama is remarkably
appealing to the core constituents of the Democratic Party and he unites the party in ways
that few candidates can claim. He ran extremely well among African Americans and
other minorities, white urban dwellers, liberals and the young. He also did well among
Independents and suburbanites, which accounts for the margin of his victory and proved
that he can broaden the Democratic base. Second, Obama also encountered clear and
persistent opposition from the Republican Party’s core constituencies. That is, there is
evidence of a lack of support in the small towns, the rural areas, and among those who
are voters compelled by their religious morality. Dan Hynes, the party organization
candidate took 83 Downstate counties in the Primary. Party organization and labor
support was crucial to those victories. George W. Bush took 88 counties Downstate plus
all five of the suburban counties in the 2004 general election. (See Map 3 and Appendix
D.) Many of these were the same counties Dan Hynes (or Blair Hull) won in the
Democratic Primary in March of 2004. Even Alan Keyes, who ran about as hapless a
campaign as Illinois has witnessed in its recent history, took 10 counties in small town
and rural Illinois. Numerically there are far more of these rural and small town counties
in the United States than there are urban counties. Of course, the balance of power is
now in the suburban and, increasingly, the “exurban” counties and it is there that national
elections will be won in the future (Judis and Teixeria, 2002; Phillips, 1969).
25
Geography and population both count in American politics. Both qualities are
important in the aggregate in Senate and House races in terms of who will control the
majority of the Congress. In running for the American presidency, geography and the
popular vote also count in unique ways through the Electoral College. The disputed
results in 2000 taught us again that while the popular vote and the Electoral College vote
are both important, it is the Electoral College vote which ultimately counts the most. The
Electoral College is heavily driven by geography since it is a winner take all vote at the
state level for all but two states, Maine and Nebraska and they are winner-take-all at the
Congressional District level. Thus, one has to win the Electoral College vote to win and
it is based on winning states. Since each state gets two votes automatically based on the
Senate formula, and since the small states get a bonus from this formula thus ensuring
that their voters are worth more proportionately than the voters of the large states, the
Electoral College emphasizes geography over population.
The same is even more obviously true in the U.S. Senate where each state has equal
representation. This means that Wyoming with 498,703 residents has the same Senate
representation as California with 35,116,033 residents and this is a defining feature of the
U.S. Constitution. The implications of this geographical base are not entirely well
recognized. The political scientist, Gary Jacobson, has argued that the Republicans have
a “structural advantage” in assembling a majority in the House or Senate. Their votes are
spread more evenly and more widely across more states and more Congressional Districts
compared to the Democratic core voters who tend to be more clustered in the cities
(Jacobson, 2005). This means that the Democrats “waste” more of their votes because
they are piled up in Congressional Districts where Democrats win by very wide margins.
26
Many of these are the “Majority Minority” Districts constructed in the urban areas and
compelled by the Justice Department and by the Supreme Court’s interpretation of the
Voting Rights Act. The Republican vote is spread more evenly and more efficiently
across the nation. Thus, the Republicans were able to take a very narrow popular vote
plurality (48.7 percent) in 2000 in the House and convert it into a larger percentage of
House seats (50.8 percent) and the same margin became a tie in the Senate. They were
then able to increase their margin of House and Senate seats in both 2002 and 2004 based
on only very narrow victories in the popular vote totals (Stanley and Niemi, 2006, 44-45).
This emphasizes the crucial role of geography and importance of the spread of one’s
partisans as counterweights to the widely recognized standard of “one person, one vote”
and an emphasis on the popular vote.
All of these considerations simply indicate that a candidate with aspirations for
national office must have broad-based appeal. That candidate first must hold onto and
mobilize his or her partisan base constituency and mobilize them by an effective “get out
the vote” effort. They also must reach out and expand that base by appealing to
moderates and Independents and by mobilizing new voters, particularly among the young
and among these groups who were formerly non-voting and disenfranchised. Barack
Obama has taken some initial steps toward doing exactly that in building coalitions
during his first Senate race in Illinois, which is a large and diverse state. He successfully
appealed to virtually all parts of the state in the general election against a controversial
opponent. However even against Alan Keyes, Obama lost ten counties in areas indicative
of the places where Republicans have recently won nationwide recently. The results in
his first primary against Dan Hynes and Blair Hull indicate that rural and small town
27
voters in Middle America are not his most natural constituency. Whether he can use that
experience, build on it and take it to success on the national level is an intriguing question
at this point. The fact that people are even asking the question about a first-term,
African-American Senator is truly a political phenomenon with potentially historic
implications.
28
Bibliography
Chase, John. 2004. “Voters Have Distinct Choice in the Fall.” Chicago Tribune. March
17, 1-A.
Colby, Peter W. and Paul M. Green. 1982. “Downstate Holds the Key to Victory.” In
Illinois Elections, 2nd edition, edited by Caroline A. Gherardini, J. Michael Lennon,
Richard J. Shereikis, and Larry R. Smith. Springfield, Illinois: Sangamon State
University, 2-6.
Fornek, Scott. 2004. “Campaign 2004 U.S. Senate Republicans: Profiles in Brief” and
“Up Close, Real Life Guide to the Dems.” Chicago Sun-Times. March 1, 2004, 6-1,
March 2, 12-13.
Goodman, Doris Kearns. 2005. Team of Rivals: The Political Genius of Abraham
Lincoln. New York: Simon and Schuster.
Green, Paul M. 2003. “Illinois Governor: It was more than the Ryan Name.” in
Midterm Madness: The Elections of 2002. edited by Larry J. Sabato. Lanham,
Maryland: Rowman and Littlefield Publishers, Inc., 209-217.
Herrmann, Andrew and Scott Fornek. 2004. “Obama Leads Pack for Dem Senate Nod.”
Chicago Sun-Times. March 5, 9.
29

Illinois State Board of Elections. 2004. Official Vote Primary Election, Springfield:
March 16, 2004; General Election, November 2.
Jackson, John S. 2004. Illinois Politics in the 21st Century: Bellwether, Leading Edge,
or Lagging Indicator. Carbondale: An Occasional Paper of the Paul Simon Public
Policy Institute. January.
Jacobson, Gary C. 2005. “The Congress: The Structural Basis of Republican Success.”
in The Elections of 2004, edited by Michael Nelson. Washington, D.C., CQ Press,
163-186.
Judis, John B. and Ray Teixeria. 2002. The Emerging Democratic Majority. New York:
Scribner.
Kenney, David and Robert E. Hartley. 2003. An Uncertain Tradition: U.S. Senators
from Illinois 1818-2003. Carbondale: Southern Illinois University Press.
Lawrence, Curtis and Scott Fornek. 2004. “Hull Says He Struck Wife to Defend
Himself.” Chicago Sun-Times. March 5, 10.
Long, Ray and Christi Parsons. 2004. “GOP Gives Keyes a Tepid Reception.” Chicago
Tribune. August 20, 1.
30
McDermott, Kevin. 2004. “Obama Keeps Huge Lead Over Keyes in Senate Race.” St.
Louis Post-Dispatch, October 28, 1-A.
Obama, Barack. 1995. Dreams From My Father: A Story of Race and Inheritance.
N.Y.: Kodansha America, Inc. Times Books.
Obama, Barack. 2006. “The Religious Divide.” Chicago Tribune. July 18, 11.
Pearson, Rick. 2004. “Obama, Ryan Out Front.” Chicago Tribune. March 9, 1-A.
Pearson, Rick and Jon Yates. 2004. “Keyes Reportedly Set to Accept GOP Nod.”
Chicago Tribune. August 6, 1-A.
Phillips, Kevin. 1969. The Emerging Republican Majority. New York: Arlington
House.
Stanley, Harold W. and Richard G. Niemi. 2006. Vital Statistics on American Politics.
Washington, D.C.: CQ Press.
Sweeny, Chuck. 2004. “Who Are These Chicago Democrats?” Rockford Register Star.
February 29, 1-H.
Zelney, Jeff. 2006. “Obama in ’08?” Chicago Tribune. May 28. 1-A
31

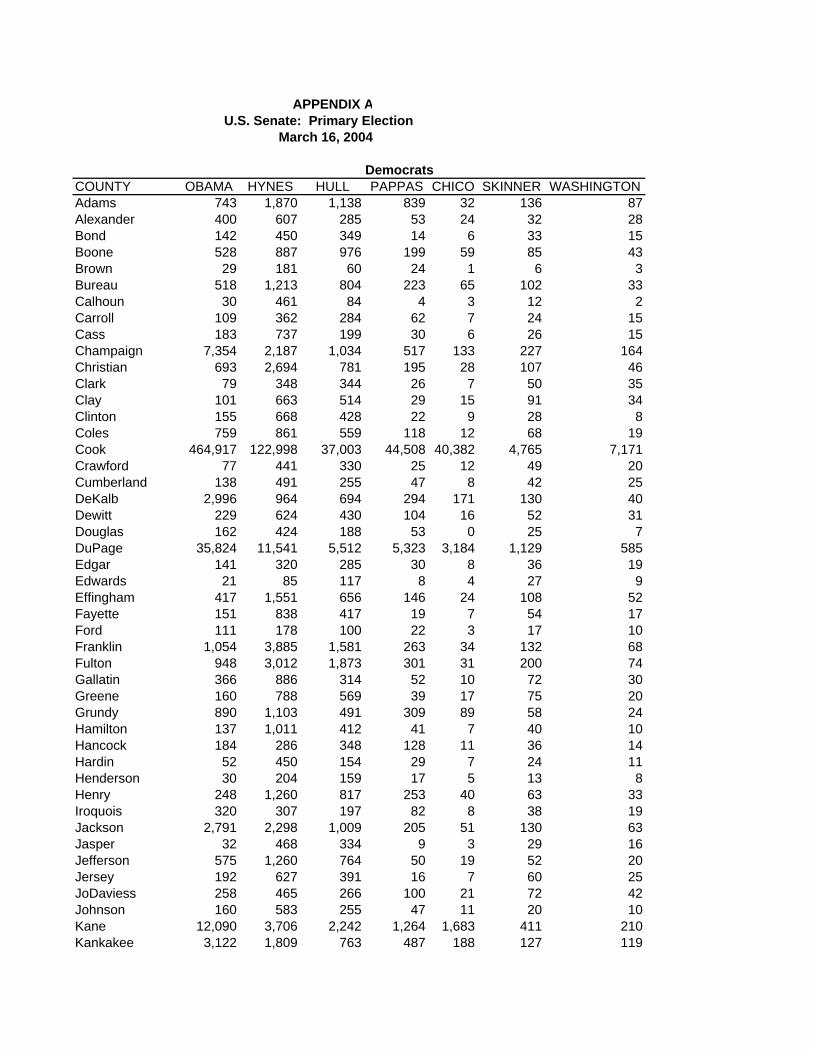
APPENDIX A U.S. Senate: Primary Election
March 16, 2004
DemocratsCOUNTY OBAMA HYNES HULL PAPPAS CHICO SKINNER WASHINGTONAdams 743 1,870 1,138 839 32 136 87Alexander 400 607 285 53 24 32 28Bond 142 450 349 14 6 33 15Boone 528 887 976 199 59 85 43Brown 29 181 60 24 1 6 3Bureau 518 1,213 804 223 65 102 33Calhoun 30 461 84 4 3 12 2Carroll 109 362 284 62 7 24 15Cass 183 737 199 30 6 26 15Champaign 7,354 2,187 1,034 517 133 227 164Christian 693 2,694 781 195 28 107 46Clark 79 348 344 26 7 50 35Clay 101 663 514 29 15 91 34Clinton 155 668 428 22 9 28 8Coles 759 861 559 118 12 68 19Cook 464,917 122,998 37,003 44,508 40,382 4,765 7,171Crawford 77 441 330 25 12 49 20Cumberland 138 491 255 47 8 42 25DeKalb 2,996 964 694 294 171 130 40Dewitt 229 624 430 104 16 52 31Douglas 162 424 188 53 0 25 7DuPage 35,824 11,541 5,512 5,323 3,184 1,129 585Edgar 141 320 285 30 8 36 19Edwards 21 85 117 8 4 27 9Effingham 417 1,551 656 146 24 108 52Fayette 151 838 417 19 7 54 17Ford 111 178 100 22 3 17 10Franklin 1,054 3,885 1,581 263 34 132 68Fulton 948 3,012 1,873 301 31 200 74Gallatin 366 886 314 52 10 72 30Greene 160 788 569 39 17 75 20Grundy 890 1,103 491 309 89 58 24Hamilton 137 1,011 412 41 7 40 10Hancock 184 286 348 128 11 36 14Hardin 52 450 154 29 7 24 11Henderson 30 204 159 17 5 13 8Henry 248 1,260 817 253 40 63 33Iroquois 320 307 197 82 8 38 19Jackson 2,791 2,298 1,009 205 51 130 63Jasper 32 468 334 9 3 29 16Jefferson 575 1,260 764 50 19 52 20Jersey 192 627 391 16 7 60 25JoDaviess 258 465 266 100 21 72 42Johnson 160 583 255 47 11 20 10Kane 12,090 3,706 2,242 1,264 1,683 411 210Kankakee 3,122 1,809 763 487 188 127 119
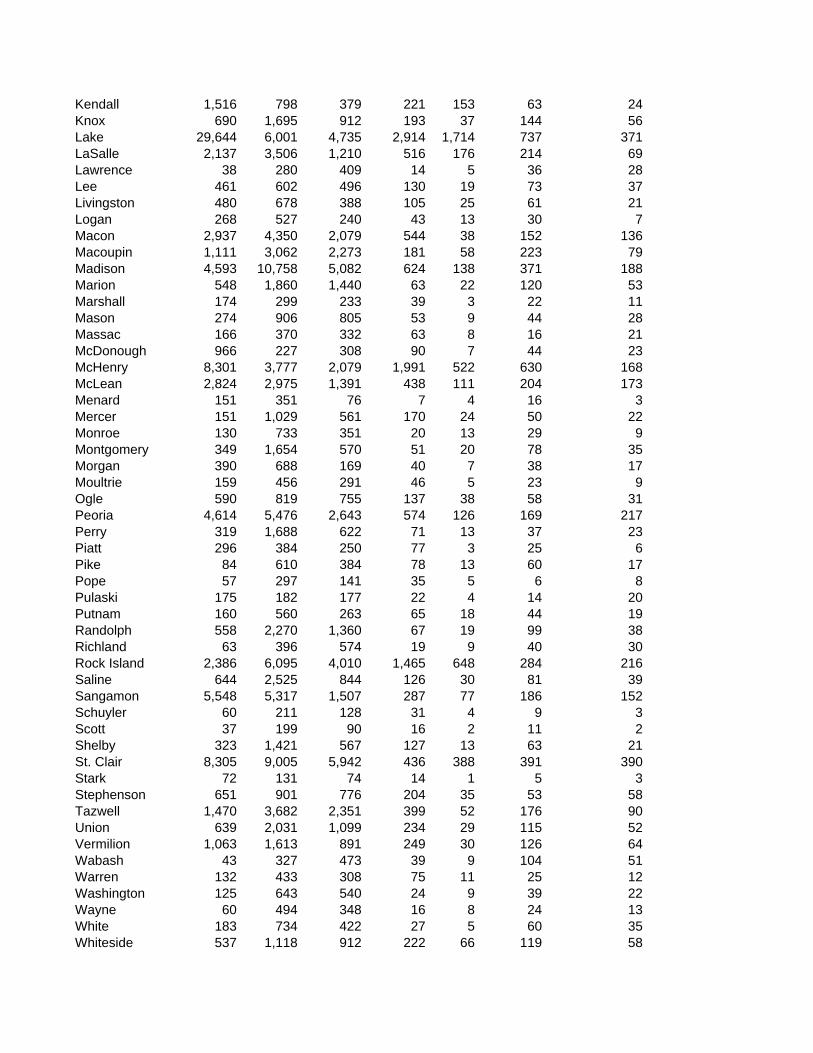
Kendall 1,516 798 379 221 153 63 24Knox 690 1,695 912 193 37 144 56Lake 29,644 6,001 4,735 2,914 1,714 737 371LaSalle 2,137 3,506 1,210 516 176 214 69Lawrence 38 280 409 14 5 36 28Lee 461 602 496 130 19 73 37Livingston 480 678 388 105 25 61 21Logan 268 527 240 43 13 30 7Macon 2,937 4,350 2,079 544 38 152 136Macoupin 1,111 3,062 2,273 181 58 223 79Madison 4,593 10,758 5,082 624 138 371 188Marion 548 1,860 1,440 63 22 120 53Marshall 174 299 233 39 3 22 11Mason 274 906 805 53 9 44 28Massac 166 370 332 63 8 16 21McDonough 966 227 308 90 7 44 23McHenry 8,301 3,777 2,079 1,991 522 630 168McLean 2,824 2,975 1,391 438 111 204 173Menard 151 351 76 7 4 16 3Mercer 151 1,029 561 170 24 50 22Monroe 130 733 351 20 13 29 9Montgomery 349 1,654 570 51 20 78 35Morgan 390 688 169 40 7 38 17Moultrie 159 456 291 46 5 23 9Ogle 590 819 755 137 38 58 31Peoria 4,614 5,476 2,643 574 126 169 217Perry 319 1,688 622 71 13 37 23Piatt 296 384 250 77 3 25 6Pike 84 610 384 78 13 60 17Pope 57 297 141 35 5 6 8Pulaski 175 182 177 22 4 14 20Putnam 160 560 263 65 18 44 19Randolph 558 2,270 1,360 67 19 99 38Richland 63 396 574 19 9 40 30Rock Island 2,386 6,095 4,010 1,465 648 284 216Saline 644 2,525 844 126 30 81 39Sangamon 5,548 5,317 1,507 287 77 186 152Schuyler 60 211 128 31 4 9 3Scott 37 199 90 16 2 11 2Shelby 323 1,421 567 127 13 63 21St. Clair 8,305 9,005 5,942 436 388 391 390Stark 72 131 74 14 1 5 3Stephenson 651 901 776 204 35 53 58Tazwell 1,470 3,682 2,351 399 52 176 90Union 639 2,031 1,099 234 29 115 52Vermilion 1,063 1,613 891 249 30 126 64Wabash 43 327 473 39 9 104 51Warren 132 433 308 75 11 25 12Washington 125 643 540 24 9 39 22Wayne 60 494 348 16 8 24 13White 183 734 422 27 5 60 35Whiteside 537 1,118 912 222 66 119 58
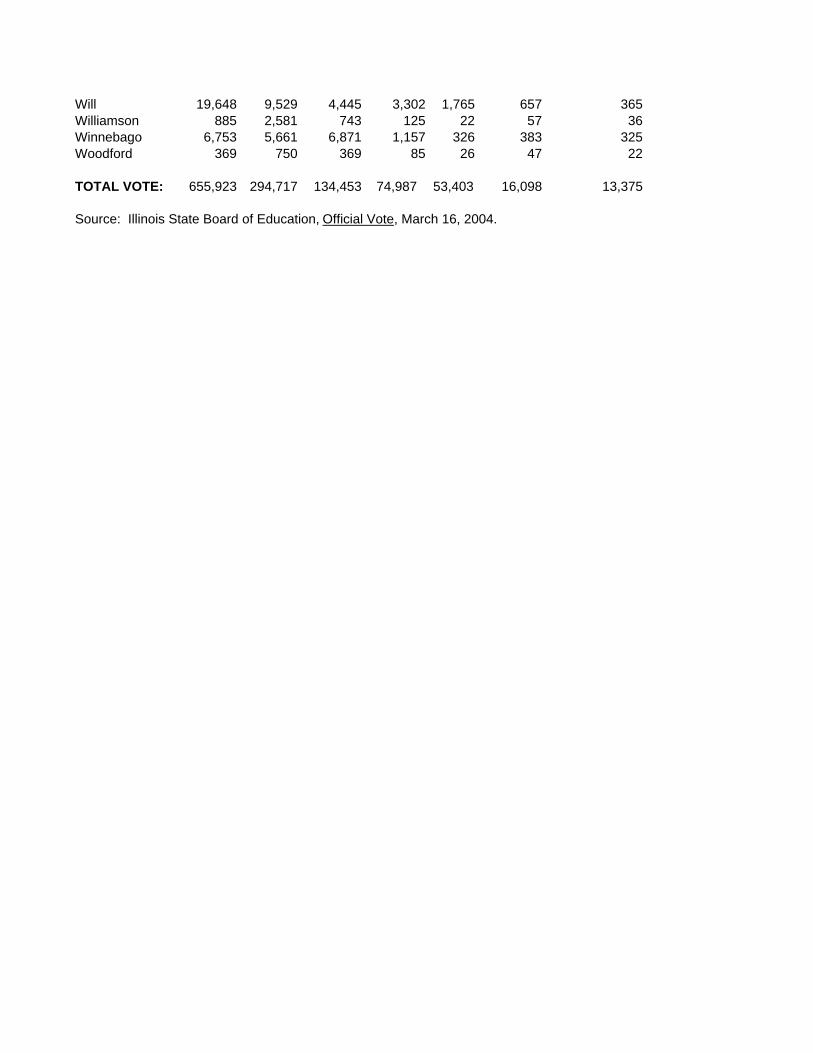
Will 19,648 9,529 4,445 3,302 1,765 657 365Williamson 885 2,581 743 125 22 57 36Winnebago 6,753 5,661 6,871 1,157 326 383 325Woodford 369 750 369 85 26 47 22
TOTAL VOTE: 655,923 294,717 134,453 74,987 53,403 16,098 13,375
Source: Illinois State Board of Education, Official Vote, March 16, 2004.

APPENDIX B U.S. Senate: Primary Election March 16, 2004
Republicans COUNTY RYAN OBERWEIS RAUSCHENBERGER McKENNAAdams 2,608 1,374 531 2,161Alexander 115 43 11 43Bond 262 94 469 61Boone 2,532 1,562 919 929Brown 125 63 27 68Bureau 1,134 403 297 586Calhoun 92 31 19 16Carroll 692 272 312 298Cass 388 123 85 147Champaign 5,406 2,579 2,560 1,823Christian 729 189 125 295Clark 243 125 474 99Clay 312 149 184 112Clinton 364 345 381 121Coles 1,139 489 610 357Cook 50,326 32,310 32,955 17,923Crawford 398 182 324 92Cumberland 316 109 155 122DeKalb 2,385 2,930 2,240 899Dewitt 1,531 468 160 489Douglas 894 542 316 269DuPage 25,332 22,866 22,043 11,376Edgar 621 271 393 166Edwards 227 199 248 44Effingham 912 516 450 349Fayette 468 194 594 163Ford 609 230 183 235Franklin 415 461 148 190Fulton 927 296 144 467Gallatin 110 36 5 23Greene 323 113 51 94Grundy 1,438 1,359 414 390Hamilton 219 162 71 95Hancock 715 276 209 351Hardin 200 85 27 117Henderson 166 57 28 131Henry 902 523 410 579Iroquois 1,201 634 483 399Jackson 592 507 740 234Jasper 146 95 149 69Jefferson 330 367 485 194Jersey 418 174 107 95JoDaviess 1,404 532 1,047 474Johnson 544 503 125 243Kane 6,959 10,032 13,803 2,614Kankakee 2,060 880 380 671
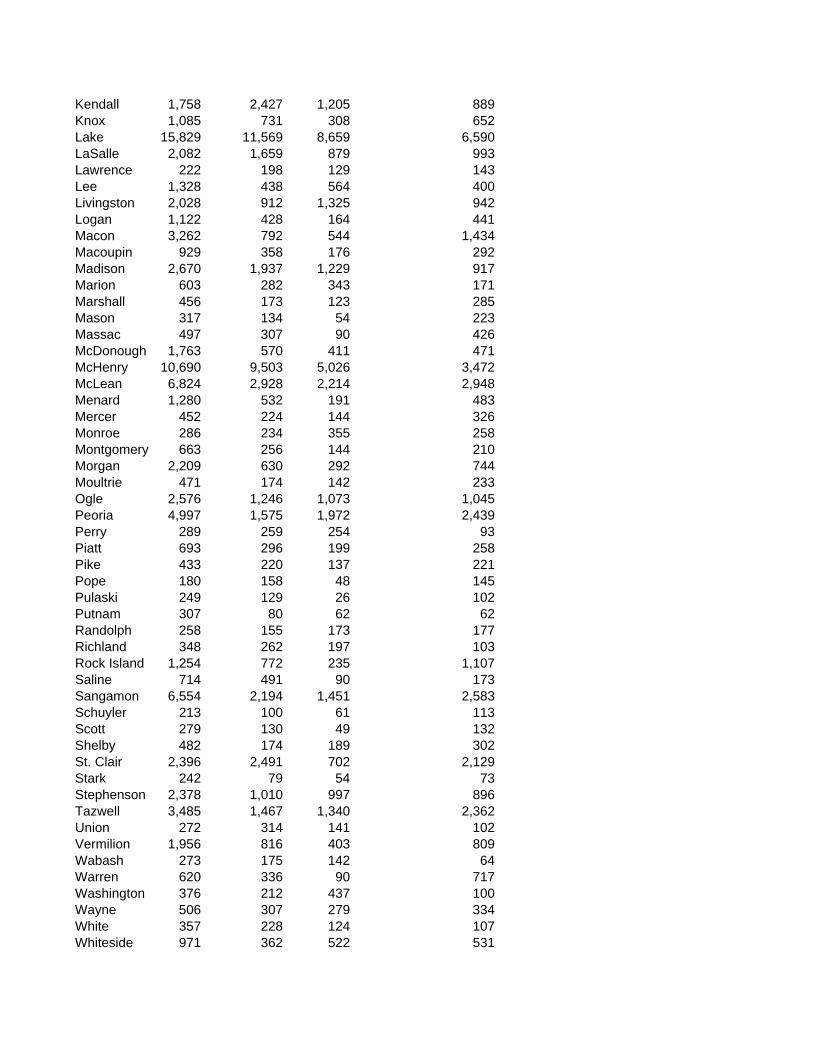
Kendall 1,758 2,427 1,205 889Knox 1,085 731 308 652Lake 15,829 11,569 8,659 6,590LaSalle 2,082 1,659 879 993Lawrence 222 198 129 143Lee 1,328 438 564 400Livingston 2,028 912 1,325 942Logan 1,122 428 164 441Macon 3,262 792 544 1,434Macoupin 929 358 176 292Madison 2,670 1,937 1,229 917Marion 603 282 343 171Marshall 456 173 123 285Mason 317 134 54 223Massac 497 307 90 426McDonough 1,763 570 411 471McHenry 10,690 9,503 5,026 3,472McLean 6,824 2,928 2,214 2,948Menard 1,280 532 191 483Mercer 452 224 144 326Monroe 286 234 355 258Montgomery 663 256 144 210Morgan 2,209 630 292 744Moultrie 471 174 142 233Ogle 2,576 1,246 1,073 1,045Peoria 4,997 1,575 1,972 2,439Perry 289 259 254 93Piatt 693 296 199 258Pike 433 220 137 221Pope 180 158 48 145Pulaski 249 129 26 102Putnam 307 80 62 62Randolph 258 155 173 177Richland 348 262 197 103Rock Island 1,254 772 235 1,107Saline 714 491 90 173Sangamon 6,554 2,194 1,451 2,583Schuyler 213 100 61 113Scott 279 130 49 132Shelby 482 174 189 302St. Clair 2,396 2,491 702 2,129Stark 242 79 54 73Stephenson 2,378 1,010 997 896Tazwell 3,485 1,467 1,340 2,362Union 272 314 141 102Vermilion 1,956 816 403 809Wabash 273 175 142 64Warren 620 336 90 717Washington 376 212 437 100Wayne 506 307 279 334White 357 228 124 107Whiteside 971 362 522 531
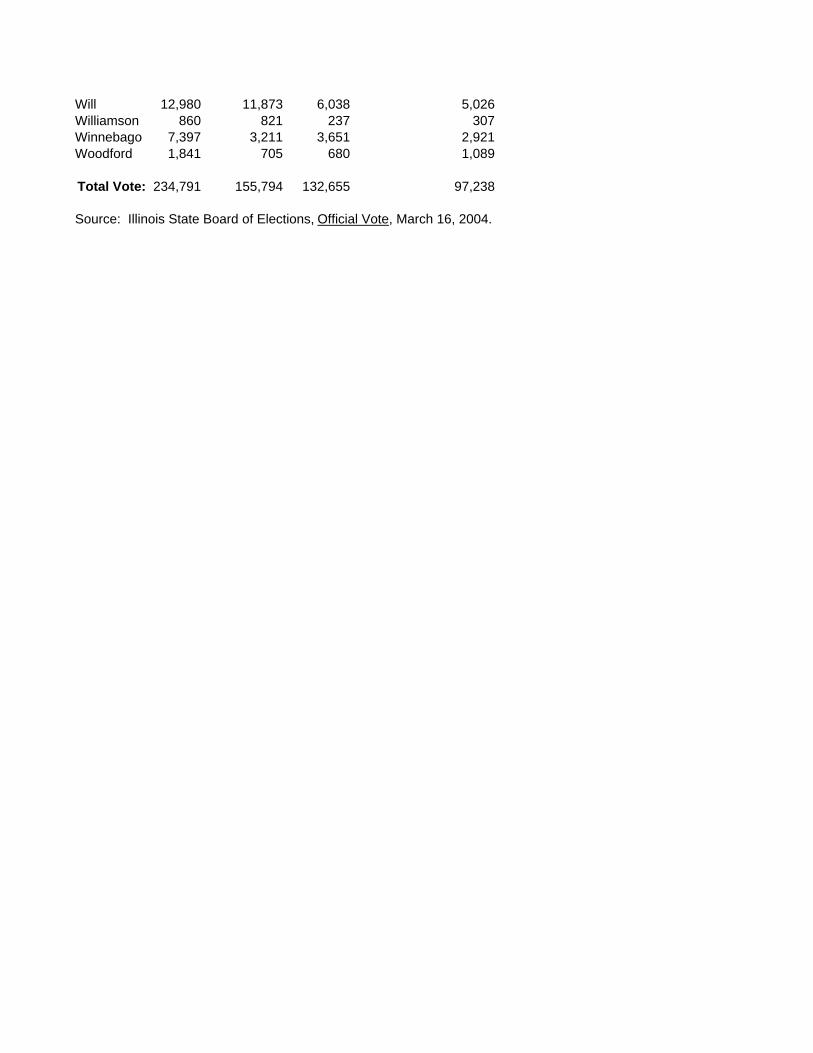
Will 12,980 11,873 6,038 5,026Williamson 860 821 237 307Winnebago 7,397 3,211 3,651 2,921Woodford 1,841 705 680 1,089
Total Vote: 234,791 155,794 132,655 97,238
Source: Illinois State Board of Elections, Official Vote, March 16, 2004.

APPENDIX CU.S. Senate: General Election
November 2, 2004
DEM REPCOUNTY PLURALITY OBAMA KEYES
Adams 2,179 (DEM) 16,036 13,857Alexander 1,247 (DEM) 2,395 1,148Bond 1,510 (DEM) 4,227 2,717Boone 3,889 (DEM) 11,206 7,317Brown 235 (DEM) 1,308 1,073Bureau 4,364 (DEM) 10,648 6,284Calhoun 692 (DEM) 1,604 912Carroll 2,231 (DEM) 4,961 2,730Cass 1,445 (DEM) 3,341 1,896Champaign 26,265 (DEM) 51,813 25,548Christian 4,222 (DEM) 9,323 5,101Clark 267 (REP) 3,566 3,833Clay 1,109 (REP) 2,505 3,614Clinton 2,872 (DEM) 9,437 6,565Coles 4,133 (DEM) 12,758 8,625Cook 1,299,625 (DEM) 1,629,296 329,671Crawford 41 (DEM) 4,302 4,261Cumberland 106 (DEM) 2,598 2,492DeKalb 14,123 (DEM) 26,077 11,954Dewitt 1,367 (DEM) 4,340 2,973Douglas 522 (DEM) 4,239 3,717DuPage 126,803 (DEM) 251,445 124,642Edgar 156 (DEM) 4,014 3,858Edwards 721 (REP) 1,155 1,876Effingham 2,666 (REP) 6,264 8,930Fayette 699 (DEM) 4,826 4,127Ford 37 (DEM) 3,021 2,984Franklin 5,728 (DEM) 11,949 6,221Fulton 7,173 (DEM) 11,729 4,556Gallatin 1,323 (DEM) 2,109 786Greene 1,062 (DEM) 3,343 2,281Grundy 5,977 (DEM) 12,285 6,308Hamilton 778 (DEM) 2,458 1,680Hancock 1,018 (DEM) 5,143 4,125Hardin 262 (DEM) 1,253 991Henderson 1,509 (DEM) 2,704 1,195Henry 7,746 (DEM) 15,965 8,219Iroquois 559 (REP) 6,177 6,736Jackson 10371 (DEM) 17,295 6,924Jasper 627 (REP) 2,141 2,768Jefferson 2,333 (DEM) 9,111 6,778Jersey 1,845 (DEM) 5,670 3,825
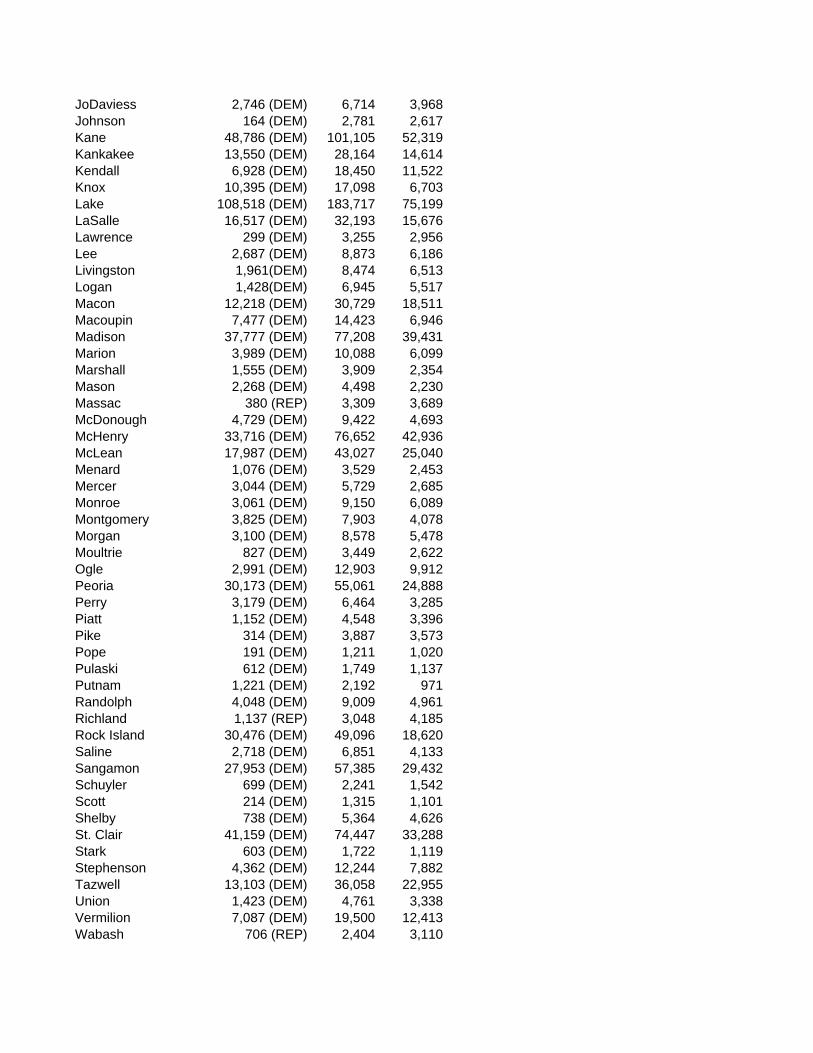
JoDaviess 2,746 (DEM) 6,714 3,968Johnson 164 (DEM) 2,781 2,617Kane 48,786 (DEM) 101,105 52,319Kankakee 13,550 (DEM) 28,164 14,614Kendall 6,928 (DEM) 18,450 11,522Knox 10,395 (DEM) 17,098 6,703Lake 108,518 (DEM) 183,717 75,199LaSalle 16,517 (DEM) 32,193 15,676Lawrence 299 (DEM) 3,255 2,956Lee 2,687 (DEM) 8,873 6,186Livingston 1,961(DEM) 8,474 6,513Logan 1,428(DEM) 6,945 5,517Macon 12,218 (DEM) 30,729 18,511Macoupin 7,477 (DEM) 14,423 6,946Madison 37,777 (DEM) 77,208 39,431Marion 3,989 (DEM) 10,088 6,099Marshall 1,555 (DEM) 3,909 2,354Mason 2,268 (DEM) 4,498 2,230Massac 380 (REP) 3,309 3,689McDonough 4,729 (DEM) 9,422 4,693McHenry 33,716 (DEM) 76,652 42,936McLean 17,987 (DEM) 43,027 25,040Menard 1,076 (DEM) 3,529 2,453Mercer 3,044 (DEM) 5,729 2,685Monroe 3,061 (DEM) 9,150 6,089Montgomery 3,825 (DEM) 7,903 4,078Morgan 3,100 (DEM) 8,578 5,478Moultrie 827 (DEM) 3,449 2,622Ogle 2,991 (DEM) 12,903 9,912Peoria 30,173 (DEM) 55,061 24,888Perry 3,179 (DEM) 6,464 3,285Piatt 1,152 (DEM) 4,548 3,396Pike 314 (DEM) 3,887 3,573Pope 191 (DEM) 1,211 1,020Pulaski 612 (DEM) 1,749 1,137Putnam 1,221 (DEM) 2,192 971Randolph 4,048 (DEM) 9,009 4,961Richland 1,137 (REP) 3,048 4,185Rock Island 30,476 (DEM) 49,096 18,620Saline 2,718 (DEM) 6,851 4,133Sangamon 27,953 (DEM) 57,385 29,432Schuyler 699 (DEM) 2,241 1,542Scott 214 (DEM) 1,315 1,101Shelby 738 (DEM) 5,364 4,626St. Clair 41,159 (DEM) 74,447 33,288Stark 603 (DEM) 1,722 1,119Stephenson 4,362 (DEM) 12,244 7,882Tazwell 13,103 (DEM) 36,058 22,955Union 1,423 (DEM) 4,761 3,338Vermilion 7,087 (DEM) 19,500 12,413Wabash 706 (REP) 2,404 3,110
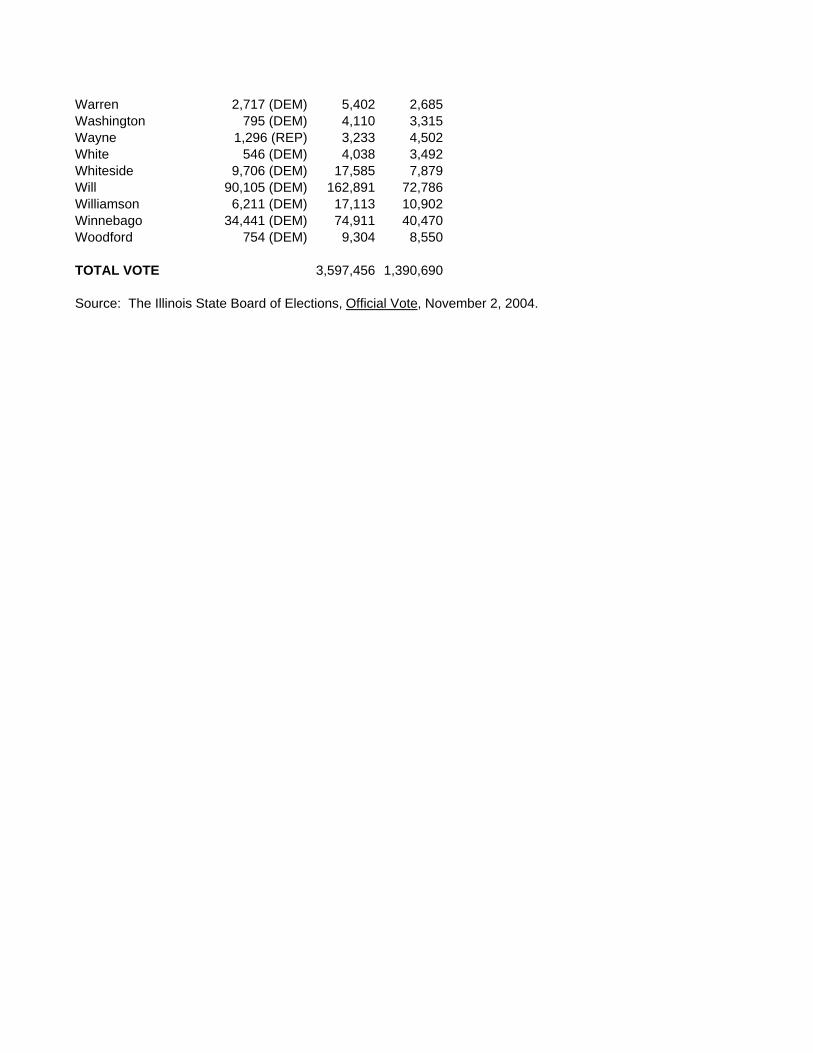
Warren 2,717 (DEM) 5,402 2,685Washington 795 (DEM) 4,110 3,315Wayne 1,296 (REP) 3,233 4,502White 546 (DEM) 4,038 3,492Whiteside 9,706 (DEM) 17,585 7,879Will 90,105 (DEM) 162,891 72,786Williamson 6,211 (DEM) 17,113 10,902Winnebago 34,441 (DEM) 74,911 40,470Woodford 754 (DEM) 9,304 8,550
TOTAL VOTE 3,597,456 1,390,690
Source: The Illinois State Board of Elections, Official Vote, November 2, 2004.
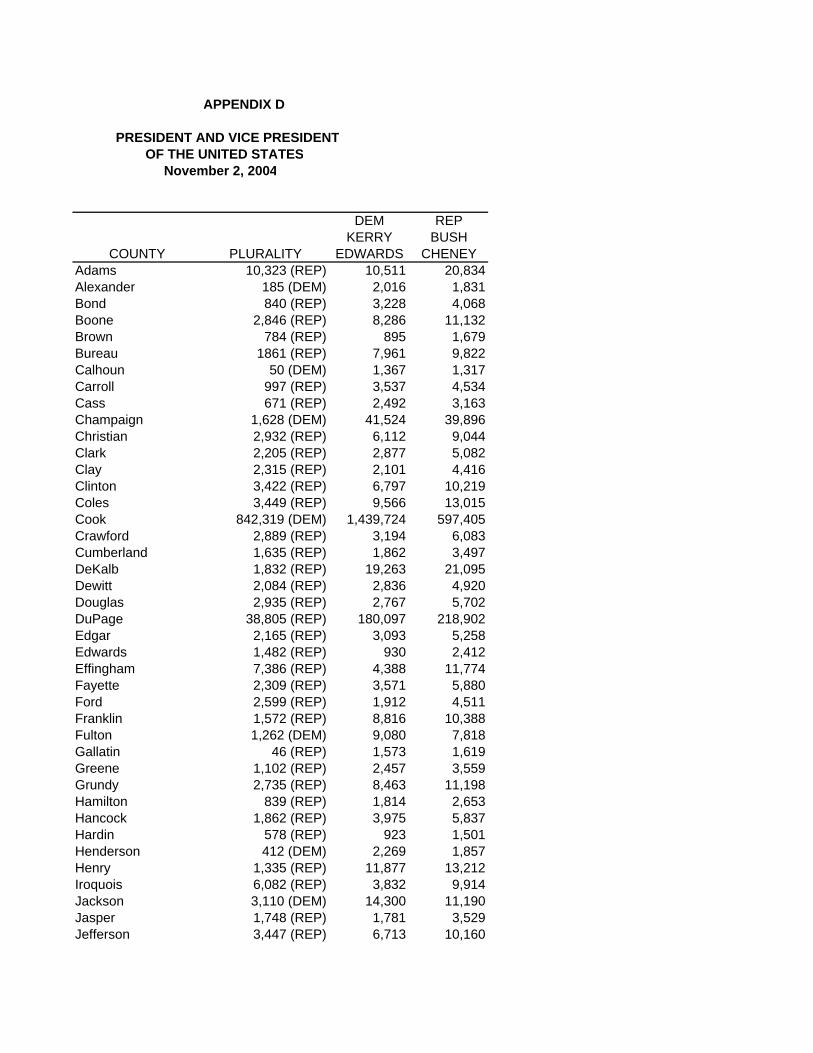
APPENDIX D
PRESIDENT AND VICE PRESIDENT OF THE UNITED STATES November 2, 2004
DEM REPKERRY BUSH
COUNTY PLURALITY EDWARDS CHENEYAdams 10,323 (REP) 10,511 20,834Alexander 185 (DEM) 2,016 1,831Bond 840 (REP) 3,228 4,068Boone 2,846 (REP) 8,286 11,132Brown 784 (REP) 895 1,679Bureau 1861 (REP) 7,961 9,822Calhoun 50 (DEM) 1,367 1,317Carroll 997 (REP) 3,537 4,534Cass 671 (REP) 2,492 3,163Champaign 1,628 (DEM) 41,524 39,896Christian 2,932 (REP) 6,112 9,044Clark 2,205 (REP) 2,877 5,082Clay 2,315 (REP) 2,101 4,416Clinton 3,422 (REP) 6,797 10,219Coles 3,449 (REP) 9,566 13,015Cook 842,319 (DEM) 1,439,724 597,405Crawford 2,889 (REP) 3,194 6,083Cumberland 1,635 (REP) 1,862 3,497DeKalb 1,832 (REP) 19,263 21,095Dewitt 2,084 (REP) 2,836 4,920Douglas 2,935 (REP) 2,767 5,702DuPage 38,805 (REP) 180,097 218,902Edgar 2,165 (REP) 3,093 5,258Edwards 1,482 (REP) 930 2,412Effingham 7,386 (REP) 4,388 11,774Fayette 2,309 (REP) 3,571 5,880Ford 2,599 (REP) 1,912 4,511Franklin 1,572 (REP) 8,816 10,388Fulton 1,262 (DEM) 9,080 7,818Gallatin 46 (REP) 1,573 1,619Greene 1,102 (REP) 2,457 3,559Grundy 2,735 (REP) 8,463 11,198Hamilton 839 (REP) 1,814 2,653Hancock 1,862 (REP) 3,975 5,837Hardin 578 (REP) 923 1,501Henderson 412 (DEM) 2,269 1,857Henry 1,335 (REP) 11,877 13,212Iroquois 6,082 (REP) 3,832 9,914Jackson 3,110 (DEM) 14,300 11,190Jasper 1,748 (REP) 1,781 3,529Jefferson 3,447 (REP) 6,713 10,160
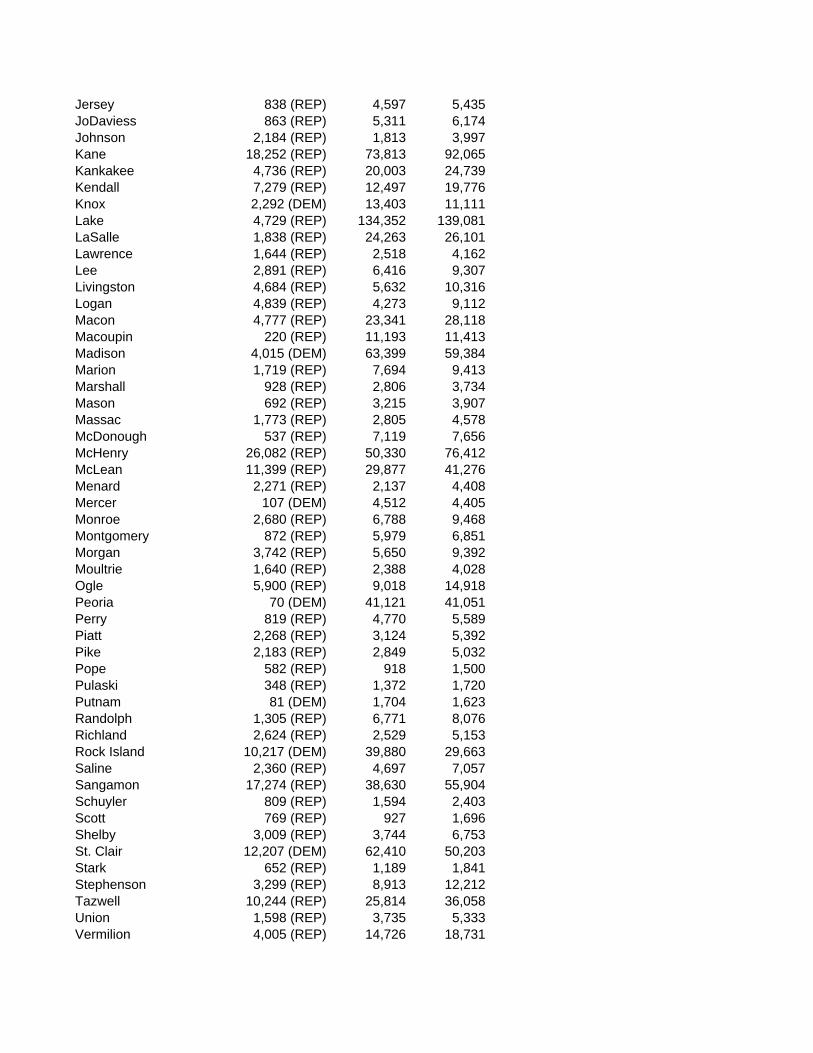
Jersey 838 (REP) 4,597 5,435JoDaviess 863 (REP) 5,311 6,174Johnson 2,184 (REP) 1,813 3,997Kane 18,252 (REP) 73,813 92,065Kankakee 4,736 (REP) 20,003 24,739Kendall 7,279 (REP) 12,497 19,776Knox 2,292 (DEM) 13,403 11,111Lake 4,729 (REP) 134,352 139,081LaSalle 1,838 (REP) 24,263 26,101Lawrence 1,644 (REP) 2,518 4,162Lee 2,891 (REP) 6,416 9,307Livingston 4,684 (REP) 5,632 10,316Logan 4,839 (REP) 4,273 9,112Macon 4,777 (REP) 23,341 28,118Macoupin 220 (REP) 11,193 11,413Madison 4,015 (DEM) 63,399 59,384Marion 1,719 (REP) 7,694 9,413Marshall 928 (REP) 2,806 3,734Mason 692 (REP) 3,215 3,907Massac 1,773 (REP) 2,805 4,578McDonough 537 (REP) 7,119 7,656McHenry 26,082 (REP) 50,330 76,412McLean 11,399 (REP) 29,877 41,276Menard 2,271 (REP) 2,137 4,408Mercer 107 (DEM) 4,512 4,405Monroe 2,680 (REP) 6,788 9,468Montgomery 872 (REP) 5,979 6,851Morgan 3,742 (REP) 5,650 9,392Moultrie 1,640 (REP) 2,388 4,028Ogle 5,900 (REP) 9,018 14,918Peoria 70 (DEM) 41,121 41,051Perry 819 (REP) 4,770 5,589Piatt 2,268 (REP) 3,124 5,392Pike 2,183 (REP) 2,849 5,032Pope 582 (REP) 918 1,500Pulaski 348 (REP) 1,372 1,720Putnam 81 (DEM) 1,704 1,623Randolph 1,305 (REP) 6,771 8,076Richland 2,624 (REP) 2,529 5,153Rock Island 10,217 (DEM) 39,880 29,663Saline 2,360 (REP) 4,697 7,057Sangamon 17,274 (REP) 38,630 55,904Schuyler 809 (REP) 1,594 2,403Scott 769 (REP) 927 1,696Shelby 3,009 (REP) 3,744 6,753St. Clair 12,207 (DEM) 62,410 50,203Stark 652 (REP) 1,189 1,841Stephenson 3,299 (REP) 8,913 12,212Tazwell 10,244 (REP) 25,814 36,058Union 1,598 (REP) 3,735 5,333Vermilion 4,005 (REP) 14,726 18,731
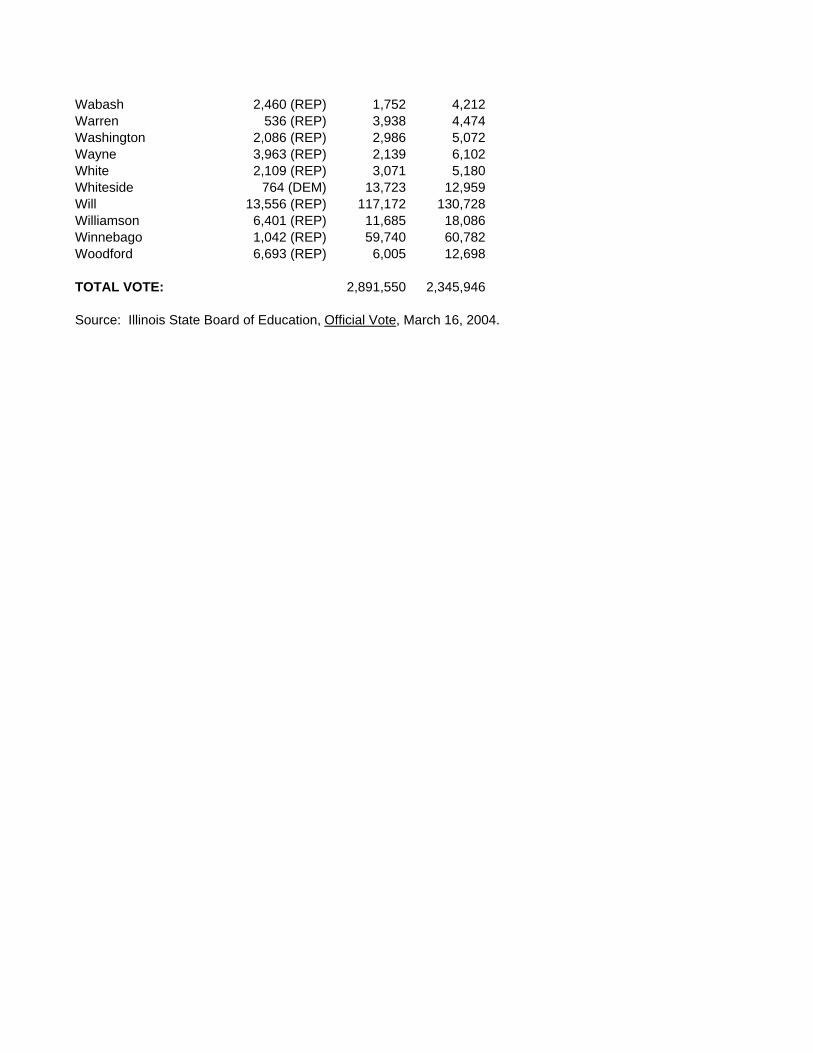
Wabash 2,460 (REP) 1,752 4,212Warren 536 (REP) 3,938 4,474Washington 2,086 (REP) 2,986 5,072Wayne 3,963 (REP) 2,139 6,102White 2,109 (REP) 3,071 5,180Whiteside 764 (DEM) 13,723 12,959Will 13,556 (REP) 117,172 130,728Williamson 6,401 (REP) 11,685 18,086Winnebago 1,042 (REP) 59,740 60,782Woodford 6,693 (REP) 6,005 12,698
TOTAL VOTE: 2,891,550 2,345,946
Source: Illinois State Board of Education, Official Vote, March 16, 2004.