the malaysian fertilizer market · 3. agromate (m) sdn bhd 4. agro-tech npk (m) sdn bhd 5. all...
TRANSCRIPT

21/10/2015
1
MOHD TOHIT BIN LIRI
Chairman, Fertilizer Industry Association of Malaysia
(FIAM)
The Malaysian Fertilizer Market
CONTENT
1. Introduction
2. Fertilizer Industry Association of Malaysian (FIAM)
3. The Malaysian Fertilizer Market • Area of Crop Cultivation
• Fertilizer Consumption
• Fertilizer Imports
• Fertilizer Distribution in Malaysia
4. Summary
5. Acknowledgement

21/10/2015
2
FIAM was established on August 13, 1987 with the objectives of:-
1. To promote and develop the fertilizer industry, i.e. import, manufacture, produce, process and/or distribute fertilizers.
2. To co-operate with and offer advice to Authorities on matters related to the fertilizer industry.
3. To inform members on the existing or proposed legislation and Government or scientific committees reports which affect the fertilizer industry.
4. To promote proper and efficient handling and usage of fertilizers.
5. To establish liaison with similar organization and agriculture associations in Malaysia or overseas.
6. To encourage, support and inform members on commercial or technical developments related to the fertilizer industry.
7. To foster the development and utilization of fertilizer products in Malaysia.
8. To conduct industry meetings and conventions.
FERTILIZER INDUSTRY ASSOCIATION OF MALAYSIA (FIAM)
Objectives of FIAM
1. Agrifert Malaysia Sdn Bhd
2. AgroBridge (Malaysia) Sdn Bhd
3. Agromate (M) Sdn Bhd
4. Agro-Tech NPK (M) Sdn Bhd
5. All Cosmos Industries Sdn Bhd
6. Behn Meyer AgriCare (M) Sdn Bhd
7. CCM Fertilizers Sdn Bhd
8. FPM Sdn Bhd
9. Gransea (M) Sdn Bhd
10. Hap Seng Fertilizers Sdn Bhd
11. Minerals & Chemicals Corporation Sdn
Bhd
12. PETRONAS Chemicals Group Berhad
13. Pertubuhan Peladang Kebangsaan
14. PK Fertilizers Sdn Bhd
15. Twin Arrow Fertilizers Sdn Bhd
16. Union Harvest Sdn Bhd
17. Union Harvest (M) Sdn Bhd
18. Yara International (M) Sdn Bhd
19. Yinpolin Agriculture Sdn Bhd
FERTILIZER INDUSTRY ASSOCIATION OF MALAYSIA (FIAM)
FIAM Members
* as of September 30, 2015 (in alphabetical order)

21/10/2015
3
Malaysian has a total land area of 327,733 square
kilometer. The soils are highly leached infertile acid
tropical soils and as such fertilizer application is
essential in Malaysian agriculture. Large tracts of land
are cultivated with perennial tree crops such as oil palm
where large quantities of fertilizers are required annually
to sustain high crop yields and ultimately profitability.
Besides oil palm, the other cultivations are rubber,
paddy and others.
THE MALAYSIAN FERTILIZER MARKET
Profile of Malaysia
Peninsular : 131,575 km2 Sabah :
73,711 km2
Sarawak : 124,449 km2
Total land area : 329,733 km2
Temperature range : 21 – 32 oC Average annual rainfall : 2500 mm Humidity : 85% Sunshine : Good
North – East Monsoon : November – March
South – West rains : June – August
THE MALAYSIAN FERTILIZER MARKET
Profile of Malaysia

21/10/2015
4
Total Area of Crop Cultivation in Malaysia (2009 – 2013)
Industrial Crops
(' 000 Hectares)
Year
2009 2010 2011 2012 2013
Oil palm 4,691 4,853 5,001 5,076 5,392
Rubber 1,032 1,029 1,026 1,048 1,060
Rice (paddy) 574.9 677.9 687.5 692.3 688.2
Cocoa 17.4 19.4 20.5 21.7 20.59
Sugarcane 14.73 14.24 14.68 14.67 14.67
Tobacco 7.6 3.7 4.2 2.5 2.0
Coffee 9.96 8.53 7.52 7.1 6.67
Pepper 13.6 14.1 14.6 14.8 15.2
Coconut 143.09 121.01 117.47 117.65 115.84
AREA OF CROP CULTIVATION
Source: From various Malaysian Government Ministries and Departments including Malaysian Palm Oil Board (oil palm), Malaysian Rubber Board (rubber), Department of Agriculture, Malaysia (paddy), Malaysian Pepper Board (pepper), Malaysian Cocoa Board (cocoa), National Kenaf & Tobacco Board (tobacco)
0
1000
2000
3000
4000
5000
6000
2009 2010 2011 2012 2013
Oil palm
Rubber
Paddy
AREA OF CROP CULTIVATION
Major Crop Land Use (2009 – 2013)
Year
‘00
0 H
ecta
res

21/10/2015
5
AREA OF CROP CULTIVATION
Yield of Major Crops (2009 – 2013)
2009 2010 2011 2012 2013
Palm Oil (CPO)
17,565,000 16,993,000 18,911,000 18,785,000 19,216,000
Rubber 857,000 939,000 996,000 923,000 826,000
Rice (Paddy) 1,620,000 1,588,000 1,660,000 1,774,000 1,847,000
Cocoa 18,152 15,654 4,605 3,645 2,809
Pepper 21,195 24,227 25,660 26,050 26,500
Source: Malaysian Palm Oil Board (oil palm), Malaysian Rubber Board (rubber), Department of Agriculture, Malaysia (paddy), Malaysian Pepper Board (pepper) & Malaysian Cocoa Board (cocoa)
(in metric tonnes)
Nitrogen (N) Phosphorus (P) Potassium (K) Total
2009 2,005,000 821,000 1,169,000 3,995,000
2010 1,805,000 999,000 1,921,000 4,725,000
2011 1,865,000 1,072,000 2,088,000 5,025,000
2012 1,998,000 1,142,000 2,154,000 5,294,000
2013 2,065,000 1,178,000 2,204,000 5,447,000
FERTILIZER CONSUMPTION (2009 – 2013)
(in metric tonnes, fertilizer)

21/10/2015
6
Malaysian Fertilizer Consumption (2009– 2013)
0,00
2,00
4,00
6,00
2009 2010 2011 2012 2013
3,95
4,73 5,03
5,29 5,45
Quantity (Million Tonnes)
Source: Department of Statistics, Malaysia; FIAM and industry estimates
FERTILIZER CONSUMPTION (2009 – 2013)
Malaysian fertilizer Consumption (2009 – 2013)
0
2
4
6
2009 2010 2011 2012 2013
4,02
4,93 5,38 5,31 5,44
Value
(RM Billion)
FERTILIZER CONSUMPTION (2009 – 2013)
Source: Department of Statistics, Malaysia; FIAM and industry estimates

21/10/2015
7
272 (5%)
763 (14%)
1,250 23%)
3,160 (58%)
Government Subsidies
Smallholders & Farmers
Government Agencies
Private PlantationCompanies
Quantity (‘000 mt)
Total: 5.45 million mt
FERTILIZER CONSUMPTION
Annual Fertilizer Consumption by Segment
FERTILIZER CONSUMPTION
Fertilizer Consumption by Major Crops
Palm Oil (CPO); 4 310
000
Rubber; 150 000
Rice (Paddy); 420 000
(in metric tonnes) Source: Industry estimates

21/10/2015
8
-
200 000
400 000
600 000
800 000
1 000 000
1 200 000
1 400 000
20092010
20112012
2013
1 123 332 1 026 302
1 341 698
1 171 657 1 172 760
Quantity (Metric Tonnes)
FERTILIZER IMPORTS
Import of Total Nitrogen Fertilizer (2009 – 2013)
-
500,00
1 000,00
1 500,00
2 000,00
20092010
20112012
2013
1 165,30 1 238,94 1 324,34 1 511,48 1 618,18
Value (RM Million)
FERTILIZER IMPORTS
Import of Total Nitrogen Fertilizer (2009 – 2013)
21/10/2015
9
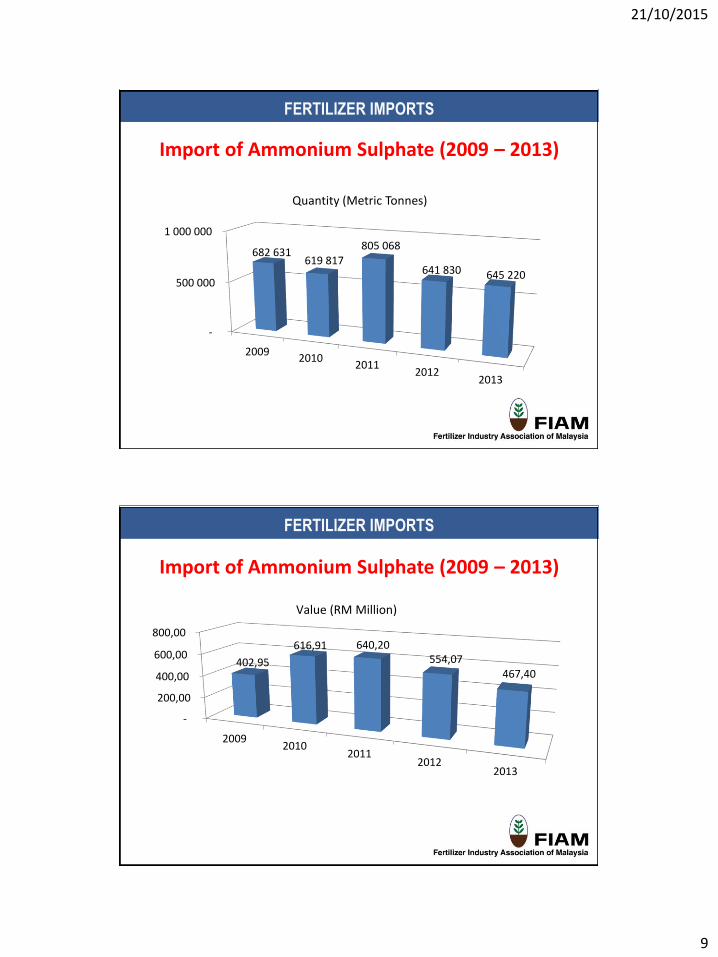
-
500 000
1 000 000
20092010
20112012
2013
682 631 619 817
805 068
641 830 645 220
Quantity (Metric Tonnes)
FERTILIZER IMPORTS
Import of Ammonium Sulphate (2009 – 2013)
-
200,00
400,00
600,00
800,00
20092010
20112012
2013
402,95
616,91 640,20 554,07
467,40
Value (RM Million)
FERTILIZER IMPORTS
Import of Ammonium Sulphate (2009 – 2013)
21/10/2015
10
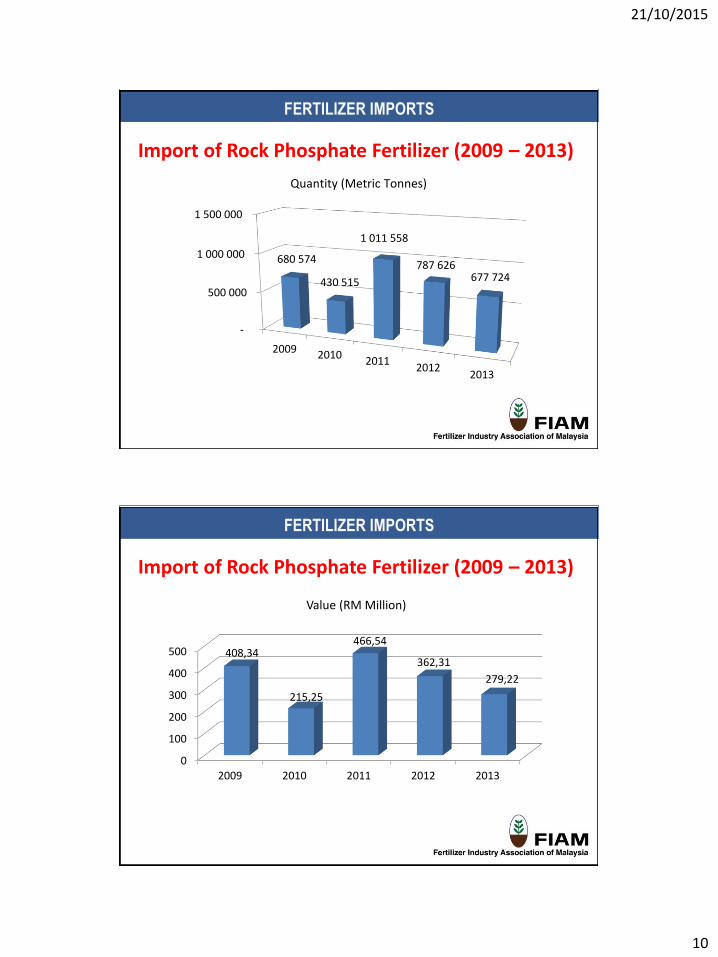
-
500 000
1 000 000
1 500 000
2009 20102011
20122013
680 574
430 515
1 011 558
787 626 677 724
Quantity (Metric Tonnes)
FERTILIZER IMPORTS
Import of Rock Phosphate Fertilizer (2009 – 2013)
0
100
200
300
400
500
2009 2010 2011 2012 2013
408,34
215,25
466,54
362,31
279,22
Value (RM Million)
FERTILIZER IMPORTS
Import of Rock Phosphate Fertilizer (2009 – 2013)

21/10/2015
11
0
500 000
1 000 000
1 500 000
2 000 000
20092010
20112012
2013
794 720
1 770 702 1 842 867
1 409 200
1 938 340
Quantity (Metric Tonnes)
FERTILIZER IMPORTS
Import of Muriate of Potash (2009 – 2013)
-
1 000,00
2 000,00
3 000,00
20092010
20112012
2013
1 748,38
2 478,98 2 764,30
2 043,34 2 326,00
Value (RM Million)
FERTILIZER IMPORTS
Import of Muriate of Potash (2009 – 2013)

21/10/2015
12
0
100 000
200 000
300 000
400 000
500 000
2009 2010 2011 2012 2013
249 070
499 510
443 517 461 535 412 255
Quantity (Metric Tonnes)
FERTILIZER IMPORTS
Import of Compound Fertilizers – 2 or More Nutrients (2009 – 2013)
0
200
400
600
800
2009 2010 2011 2012 2013
492,68
738,55 723,07 787,99
694,61
Value (RM Million)
FERTILIZER IMPORTS
Import of Compound Fertilizers – 2 or More Nutrients (2009 – 2013)
21/10/2015
13
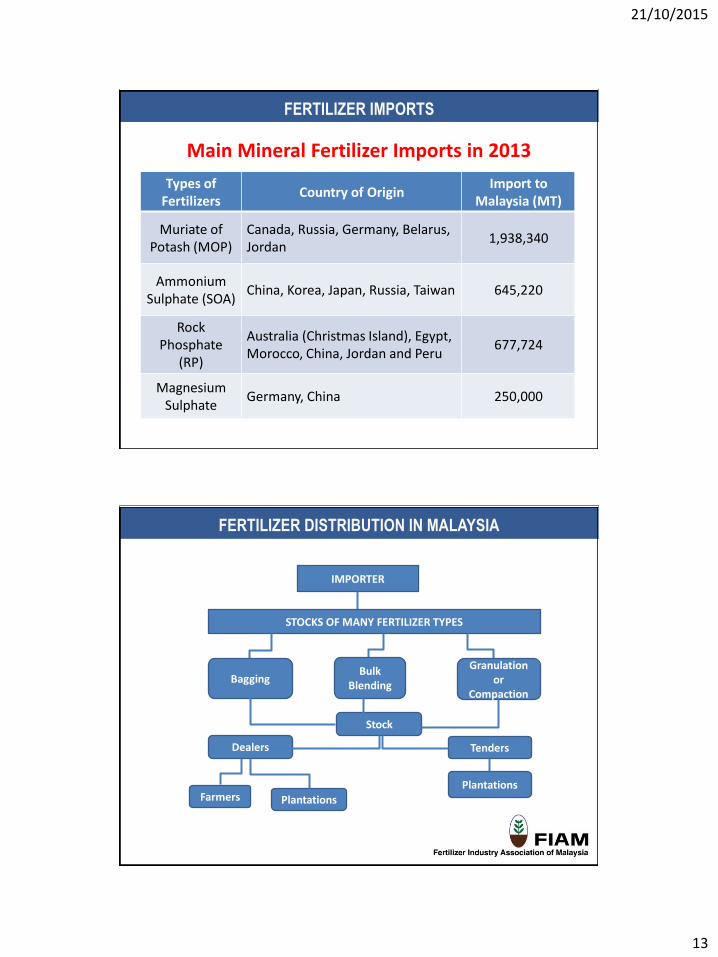
MAIN MINERAL FERTILIZER IMPORTS IN 2013
Types of Fertilizers
Country of Origin Import to
Malaysia (MT)
Muriate of Potash (MOP)
Canada, Russia, Germany, Belarus, Jordan
1,938,340
Ammonium Sulphate (SOA)
China, Korea, Japan, Russia, Taiwan 645,220
Rock Phosphate
(RP)
Australia (Christmas Island), Egypt, Morocco, China, Jordan and Peru
677,724
Magnesium Sulphate
Germany, China 250,000
FERTILIZER IMPORTS
Main Mineral Fertilizer Imports in 2013
IMPORTER
STOCKS OF MANY FERTILIZER TYPES
Bagging Bulk
Blending
Granulation or
Compaction
Stock
Dealers Tenders
Farmers Plantations Plantations
FERTILIZER DISTRIBUTION IN MALAYSIA

21/10/2015
14
1. With oil palm being the major plantation crop in
Malaysia, large quantities of fertilizers are required
annually to sustain the high crop yields.
2. The Government is speeding up the effort to replant the
old and low yielding oil palm areas both in the
plantation and the smallholders sector. This will result in
increase of compound fertilizers consumption in the
young areas but a possible reduction in the matured
areas.
SUMMARY
3. Moving forward to 2016 basing on current scenario:
a. CPO price has just moved upward from low RM1,800 per metric tonne in August 2015 to average of RM2,150 in October, many plantation companies are expected to maintain their fertilizer order volume in 2016.
b. However due to the uncertainty of the Malaysian Ringgit, most plantation companies are seen to be deferring their calling of tenders for 2016 to late October or November 2015. Normally it was done in September.
SUMMARY
21/10/2015
15
c. As suppliers, FIAM members had agreed with the
plantation companies that an adjustment on the
award price will be made on three monthly interval
should the exchange rate moves by 5% either way.
SUMMARY
Special thanks to:
1. IFA for inviting us to present this paper.
2. FIAM members in preparation of the paper.
3. The Department of Statistics, Malaysia for the
figures
4. Other individuals and organizations for their
assistance.
ACKNOWLEDGEMENT

21/10/2015
16