the management of new product introductions in the ... management of new product introductions in...
TRANSCRIPT

The Management of New Product Introductions in the Pharmaceutical Industry
Stuart J.H. Grahama,b, Matthew J. Higginsb,*
a University of California, Berkeley
b Georgia Institute of Technology
26 November 2007 ________________________________________________________________________ Abstract How well are pharmaceutical firms able to manage new product introductions given a complex innovation environment and long time horizons? This paper demonstrates the importance that downstream complementary assets play in the innovation process, providing for the first time theory and evidence on the timing of firms’ new product introductions. We employ novel pharmaceutical-firm data, including a combination of actual new product introductions, their associated product sales data, and information about firms’ research pipelines and patents to analyze the timing of pharmaceutical firms’ new product introductions. By demonstrating that this timing is substantially explained by the loss of FDA-sanctioned market exclusivity on a current product, we provide primary evidence that firms are effectively managing their long and complex innovation processes. We also examine the determinants of firms’ demonstrated ability to hit these targets, and find evidence that minimizing the “adjustment costs” associated with mismatched specialized complementary assets plays a primary role in explaining the behavior of firms. JEL classifications: L11, O30, O32
Keywords: Patenting; Pharmaceutical industry; New product management; Research productivity ________________________________________________________________________ We received helpful comments and suggestions from Wes Cohen, Bronwyn Hall, Bart Hamilton, Zeynep Hansen, Daniel Levy, Frank Rothaermel, Jason Simon, Michael Stonebrook, Jerry Thursby, Marie Thursby, Brian Wright, Andrew Young and Rosemarie Ziedonis as well as seminar participants at the 2006 REER conference at Georgia Institute of Technology, the 2007 Academy of Management meetings, and seminar participants at Georgia Tech and UC Berkeley. Graham acknowledges research funding by the Ewing Marion Kauffman Foundation, and notes that the contents of this paper do not reflect the views of the Kauffman Foundation. Higgins acknowledges research support from the Imlay Professorship. Authors are listed alphabetically and the usual disclaimers apply.
*Corresponding author contact information: E-mail address: [email protected]

2
1.0 Introduction
How well are pharmaceutical firms able to manage new product introductions given a complex
innovation environment and long time horizons? Our paper explores this question by using novel
pharmaceutical-firm data, using a combination of actual new product introductions, their associated
product sales data, and information about the firms’ research pipelines and patents, including therapeutic
classes. We add to these data information about the product market into which new products are being
introduced. Our analysis demonstrates that pharmaceutical firms appear quite adept at timing their new
product introductions to substitute for their loss of monopoly position on other of the firm’s products
selling in the marketplace.
Our explanation for this behavior recognizes the strong incentives firms have to effectively
manage complementary assets. Downstream complementary assets have been shown to be a significant
factor in determining incumbent firms’ success at bringing new products to market (Teece, 1986), no less
so in the pharmaceutical industry. Several studies of firm innovation have shown that possessing these
assets is advantageous, but previous research has tended to examine changes in the character of
technology inputs, focusing on derivative measures of innovative success such as market share or overall
firm profitability (Tripsas, 1997; Rothaermel, 2001). We, conversely, remain agnostic about the
technology inputs into the process, and how firms manage their access to new technologies. Instead, our
paper focuses upon firms’ performance at timing their new product introductions.
Mismanaging the timing of new product introductions increases “adjustment costs” associated
with the relevant complementary assets (Chan et al., 2007), while managing their timing may be
particularly difficult given the technological complexity of pharmaceutical development, the cumbersome
regulatory environment, and the long innovation lags. For example, new products take an average of ten
to fifteen years to develop from initial discovery to final FDA approval (DiMasi, 2001). The downstream
assets needed to bring products to market are costly to create and maintain, particularly when those assets
are specific to the innovation (Williamson, 1985). Firms face strong incentives to ensure access to these
complementary assets. Conversely, holding unproductive assets is costly, particularly if these

3
downstream assets tend to atrophy when not employed. Accordingly, the effective management of such
assets we suggest has implications for firm performance in the innovating company.
Our analysis in this paper demonstrates that the timing of pharmaceutical firms’ new product
introduction is substantially explained by the loss of FDA-sanctioned market exclusivity on a current
product, providing evidence that firms are effectively managing long and complex innovation processes.
To test the implications of these findings, we also analyze the determinants of firms’ demonstrated ability
to hit these targets, and find evidence that minimizing the “adjustment costs” of mismatched specialized
complementary assets plays a primary role.
The remainder of the paper adheres to the following structure. Section 2 briefly discusses
innovation in the pharmaceutical industry, and the role of downstream specialized assets in this process
Section 3 offers a description of our data and our sample, followed in Section 4 by our empirical findings
and discussion. Section 5 concludes.
2.0 New product development and the innovation process in pharmaceuticals
2.1 Research productivity trends
Prior research on research productivity in the pharmaceutical industry (as measured by the
aggregate industry drug-exclusivity horizon) declined in the late 1990s (Higgins and Rodriguez, 2006) -
precisely when pharmaceutical patenting was exploding (Hall, et al., 2001).1 The loss of “exclusivity
protection” is a substantial factor contributing to this decline: Current-market drugs are losing exclusivity
protection at a much higher rate than they are being replaced by new FDA-approved products. The term
exclusivity refers to exclusive regulatory marketing rights granted by the FDA under 21 C.F.R. 314.108,
which prevent generic products from entering the market.2 The pharmaceutical industry had a combined
1 One explanation put forth by industry representatives for this decline is that the “easiest” drugs have previously been developed, while drugs currently under development are much more sophisticated and target more difficult diseases. A second explanation, described in the Wall Street Journal (2004), suggests that the heavy reliance on combinatorial chemistry and high-throughput screening did not produce the hits that were initially hoped for when this technology was adopted in the 1990s. 2 This exclusivity offers more monopoly over the market than patent protection, the latter offering protection over the technology, and not necessarily over substitutes.

4
total of approximately 1,100 years of aggregate exclusivity protection in 1998. By 2001, the exclusivity
horizon had fallen to just over eight hundred years.
In contrast to this decline, the number of drug candidates in some phase of clinical testing has
dramatically increased (Higgins and Rodriguez, 2006). Nonetheless, the number of products approved by
the FDA has remained relatively constant over the past 15 years. This discrepancy suggests that a
comparatively large number of drug candidates fail or are withdrawn during the testing process. For
example, the ratio of candidates that mature to an NDA filing compared to the number of candidates in
Phase III testing declined from 29 percent to 17 percent through the 1990s.3 Further compounding the
industry’s problem, new products take an average of ten to fifteen years to develop while development
costs increased more than three-fold between 1987 and 2000 [constant dollar] (DiMasi, 2001).
Unfortunately these productivity issues are not occurring in isolation. Rather, they come while
the industry is under criticism for its pricing practices and faces more aggressive challenges by generic
manufacturers. The generic industry has metamorphosed from one that traditionally waited until patent
protection ended on a product before introducing a drug to one that is actively challenging the validity of
pharmaceutical patents. By challenging approved patents in this manner, the generic industry is
effectively compressing the incumbent firms’ payback period.4 Moreover, this trend may be growing as
the industry matures. For example, Teva Pharmaceuticals, an Israeli generic manufacturer, reported in
their 2006 annual report seventy-eight challenges (“Cert-IV”) pending at the FDA. Accordingly, the loss
of exclusivity on approved products has become a more significant event for the incumbent firm, and
appears to us to have replaced the loss of patent protection as the more economically-meaningful event.
2.2 The role of downstream assets in the innovation process
3 Author’s calculations based on data from Pharmaprojects. 4 At the end of exclusivity for an approved product a generic firm may submit an abbreviated new drug application (ANDA) with a paragraph IV certification challenging the approved product’s patent. The generic firms have to argue that either their patent does not violate the pharmaceutical patent or that the pharmaceutical patent is invalid. “Cert-IV” challenges set off a process which effectively requires the pharmaceutical firm to sue the generic firm for patent infringement.

5
The foregoing describes a crisis in the innovation processes of pharmaceutical firms. Schumpeter
(1934) differentiated invention from innovation, using the latter term to describe the process by which
firms commercialize new technological discoveries. It is now well-understood that the possession of
complementary assets is often a necessary condition for firms’ success in the innovation process (Teece,
1986; Tripsas, 1997; Rothaermel, 2001). Examples of complementary downstream assets include
distribution channels, manufacturing and production capabilities, reputation, strategic alliances, customer
relationships, licensing agreements, and marketing capabilities.
Williamson (1985) offers a view into how firms gain access to such assets, dealing with the
relative advantages of the "make [them] versus buy [them]" choice, explaining how a firm may reduce
transaction costs by integrating into downstream assets, and answering why the firm may be unwilling—
or indeed unable—to purchase necessary complementary assets in the marketplace. Fundamental to that
analysis is the condition of asset specificity, the degree to which assets are specific to a transaction, and
the comparative cost savings that obtain when the firm avoids hold-up by organizing the transaction
inside the firm.
Teece (1986) builds upon this logic, differentiating between “generic” downstream assets that can
be easily accessed in the marketplace and “specialized” complementary assets that are specific to the
commercialization of a particular technology. 5 It is these specialized assets, difficult to build internally
or access externally, that can explain the failure of technology pioneers, and why an imitator with the
necessary complementary assets may win in the marketplace. In the face of discontinuous technological
change, complementary assets held by incumbent firms have been shown to offer shelter from the winds
of creative destruction (Tripsas, 1997) and to be positively related to firm financial performance
(Rothaermel, 2001). However, the ability of firms to effectively manage these assets, particularly over
long product development timelines, has not been the subject of much empirical research.
5 While Teece (1986) differentiates between specialized and co-specialized assets, we follow Tripsas (1997) and call both these classes of assets “specialized” because the distinction made in Teece is not crucial to our analysis.

6
Williamson (1985) demonstrated that integration has its costs: organizing disparate functions
within the hierarchy (firm) brings with it the loss of high-powered market incentives, a reduction in
autonomy, and increased bureaucracy. These disadvantages can be expected to affect the management of
diverse activities under one corporate umbrella, and raise questions about the firm’s ability to efficiently
coordinate a long and complex innovation process. In the pharmaceutical industry, firms are innovators
by necessity. Product life cycles are limited, both by market forces and by regulatory and legal (e.g.
patent) regimes. Firm survival is conditioned on making or buying inventions, and then managing the
innovation process to successfully bring developed products to market.
Simple economics suggests that the profit-maximizing firm would always choose to
commercialize its new products sooner rather than later. But this simple view fails to account for the role
of complementary assets in the innovation process. The timing of new product introductions can be vital
to success, because the relevant complementary assets are costly to create, to purchase, and to maintain.
Assets such as firm capabilities in distribution, manufacturing, and marketing are relevant to the
successful merchandizing of new products, and the effective management of these assets can increase the
likelihood that the firm will possess them when needed. Avoiding undersupply is beneficial to the firm
because these capabilities often require substantial resources and time to create, and thus an undersupply
would leave the firm either lacking them (and thus unable to commercialize) or, if the assets are
specialized, subject to hold-up in small-numbers bargaining when trying to acquire these assets in the
marketplace (Williamson, 1985).
There is a flip-side to this logic: While the firm does not want to be undersupplied in these
downstream assets, it also does not want to be oversupplied in them. Maintaining unproductive
downstream assets is costly. Moreover, if the assets are specialized to a particular technology, the firm
will generally be unable to direct the assets to alternative uses internally, or sell (lease) them in the
marketplace. The firm may face even greater costs due to attrition: underutilization of the downstream
assets may lead to their erosion, thus forcing upon the firm the costs associated with undersupply of the
assets when the firm next needs to commercialize a relevant product.
7
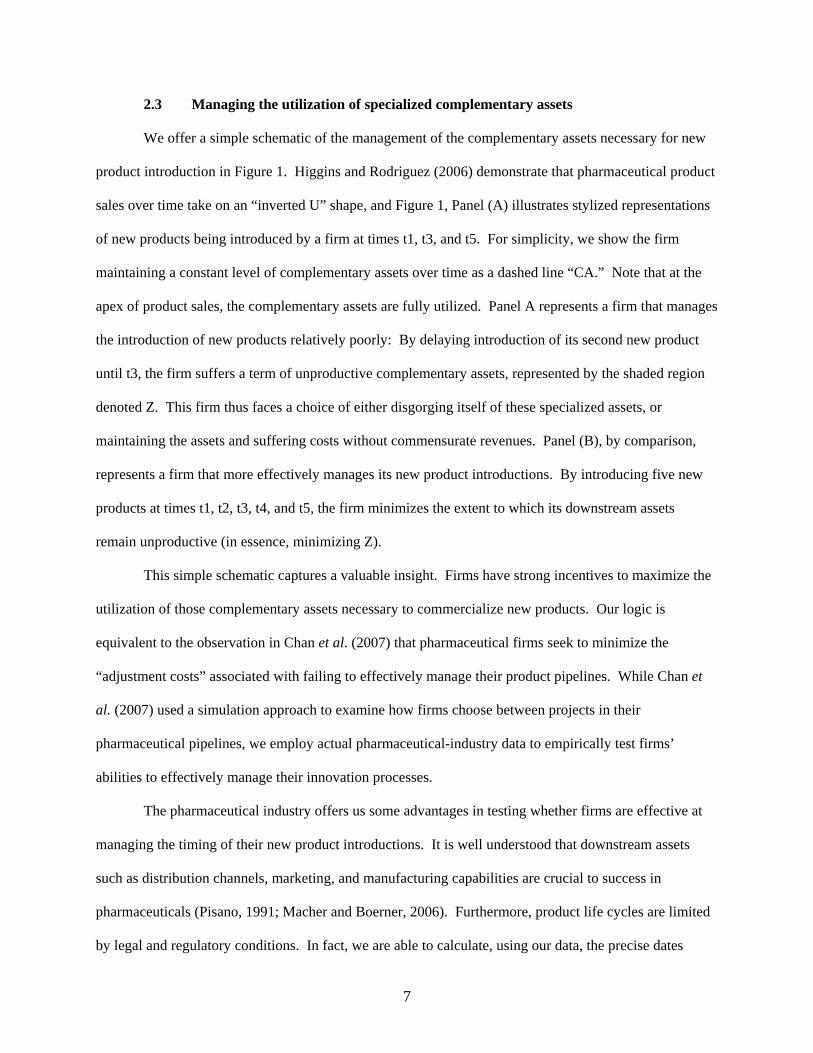
2.3 Managing the utilization of specialized complementary assets
We offer a simple schematic of the management of the complementary assets necessary for new
product introduction in Figure 1. Higgins and Rodriguez (2006) demonstrate that pharmaceutical product
sales over time take on an “inverted U” shape, and Figure 1, Panel (A) illustrates stylized representations
of new products being introduced by a firm at times t1, t3, and t5. For simplicity, we show the firm
maintaining a constant level of complementary assets over time as a dashed line “CA.” Note that at the
apex of product sales, the complementary assets are fully utilized. Panel A represents a firm that manages
the introduction of new products relatively poorly: By delaying introduction of its second new product
until t3, the firm suffers a term of unproductive complementary assets, represented by the shaded region
denoted Z. This firm thus faces a choice of either disgorging itself of these specialized assets, or
maintaining the assets and suffering costs without commensurate revenues. Panel (B), by comparison,
represents a firm that more effectively manages its new product introductions. By introducing five new
products at times t1, t2, t3, t4, and t5, the firm minimizes the extent to which its downstream assets
remain unproductive (in essence, minimizing Z).
This simple schematic captures a valuable insight. Firms have strong incentives to maximize the
utilization of those complementary assets necessary to commercialize new products. Our logic is
equivalent to the observation in Chan et al. (2007) that pharmaceutical firms seek to minimize the
“adjustment costs” associated with failing to effectively manage their product pipelines. While Chan et
al. (2007) used a simulation approach to examine how firms choose between projects in their
pharmaceutical pipelines, we employ actual pharmaceutical-industry data to empirically test firms’
abilities to effectively manage their innovation processes.
The pharmaceutical industry offers us some advantages in testing whether firms are effective at
managing the timing of their new product introductions. It is well understood that downstream assets
such as distribution channels, marketing, and manufacturing capabilities are crucial to success in
pharmaceuticals (Pisano, 1991; Macher and Boerner, 2006). Furthermore, product life cycles are limited
by legal and regulatory conditions. In fact, we are able to calculate, using our data, the precise dates

8
when new drugs were approved for sale by the Food and Drug Administration as well as the dates on
which companies lost their exclusivity protection on currently marketed products. These latter dates are
well known to the firms ex ante, and thus allow managers to predict precisely when sales will erode due
to competition from generic producers. As such, firms are able to easily forecast the point in our Figure 1
when an existing product’s sales will collapse, thus offering managers a readily available target for
introducing a new product if, as we hypothesize, the objective is to minimize adjustment costs.
2.4 Intellectual property capabilities as a complementary asset
Teece (1986) theorizes that in addition to complementary assets, the appropriability regime is a
major determinant of success in taking a new technology to market. Both legal protections (intellectual
property) and technological characteristics of the firm’s product or process dictate the strength of the
appropriability regime, and determine whether firms will have an opportunity to capture profits from an
innovation. Accordingly, a firm’s capabilities in managing the intricate rules and strategic landscape of
patent law can be a critical complementary asset in the innovation process (Graham and Somaya, 2006).
Developing capabilities in using the patent law is a crucial asset for firms operating in the
pharmaceutical industry. Cohen et al. (2001) demonstrate that patenting in medical products (drugs and
devices) is the most effective at capturing value from innovation among all the thirty-three industrial
segments they surveyed, and that nearly all (95.50 percent) of pharmaceutical-product innovations are
patented. Pharmaceutical firms are increasingly interested in the strength, breadth, and depth of their
patent protection, and in strategically managing their patent portfolios (Eisenberg, 2003). Patent
strategies among pharmaceutical firms generally involve both serial patenting (the patenting of
modifications in series to protect cumulative innovation over a long time horizon) and extensively
employing “continuations” in the patent application process to manage the timing of patent grants
(Graham, 2006).
Graham (2006) further suggests that pharmaceutical firms are using the procedural mechanisms
available to them to maximize patent term, and to ensure that patent protection is mapped to the
emergence of drugs from the FDA-approval process. We believe that such “timing” considerations in

9
pharmaceutical-firm patent strategies have implications for the management of the timing of new product
introductions described above. Because patenting has routinely been used in studies of innovative
performance of firms, and because patenting capabilities are an important means of capturing value in
drugs innovation and have ramifications for the “timing” of new product introductions, we devote a
substantial amount of data analysis below to pharmaceutical-firm patenting.
3.0 Data and sample
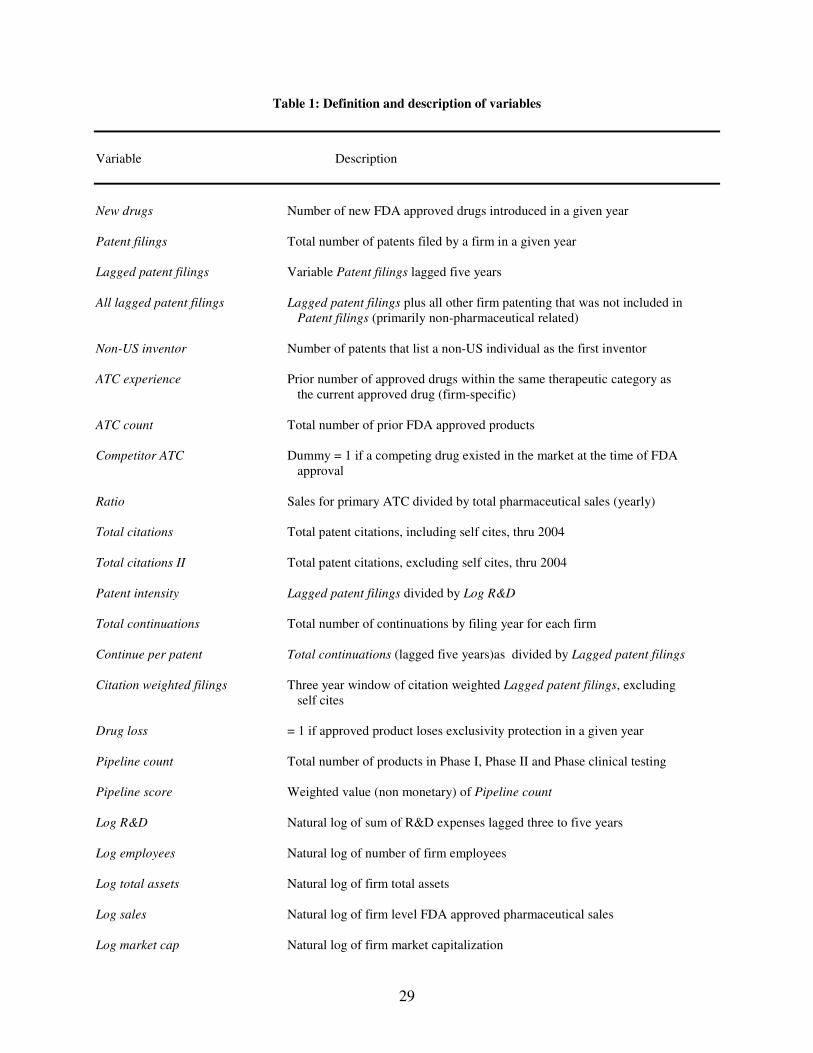
Table 1 presents definitions for the variables we employ in this analysis while Table 2 presents
descriptive statistics and correlations for these variables. We collected financial data from Compustat,
stock market data from CRSP, proprietary pharmaceutical sales data from IMS Health and ReCombinant
Capital, research pipeline data from Pharmaprojects, and patent data from IMS Patent Focus and the
USPTO. All financial variables are presented in constant 2000 dollars. When the original source is in a
foreign currency, we convert into U.S. dollars using the average of the 12 monthly foreign/U.S. exchange
rates over the relevant year.
3.1 Pharmaceutical firm sample selection
We limited our sample to firms having at least one approved product during the period 1985 to
2001 in order to make the overall sample more homogenous and to concentrate our analysis on firms that
have demonstrated commercial success. Unique firms are identified from the FDA Orange Book.
Subsidiaries are identified using the LexisNexis Corporate Affiliations database.
Firm size tends to vary widely in the pharmaceutical industry, ranging from the smallest start-up
to the largest multi-national firm, and thus parallels the large variability in patenting and commercial
activity. Our sample selection criteria map onto the questions we explore in this paper, which are for the
most part appropriate for more established firms. Furthermore, we are fairly confident that our selection
captures a reasonably complete picture of the industry: For example, in 2001 our sample firms’ sales
totaled 79 percent of the entire industry.6
3.2 Research pipeline profiles 6 Author’s calculations based on sales data from IMS Health.

10
We believe that determining product-pipeline characteristics for our firms is a useful analytical
innovation, and particularly meaningful given our research questions. In an effort to determine which
products are in development at our sample firms we use data from Pharmaprojects from 1990 to 2001.
These data contain information relating to the various stages of product development. For purposes of
this study we focus on the following phases: Pre-Clinical, Phase I, Phase II, and Phase III. In the FDA-
drug approval process, Phase I involves safety testing, Phase II is concerned with small-scale human
efficacy trials, and Phase III focuses on large-scale human efficacy trials.
We consider two measures of a firm’s research pipeline. Our first measure, Pipeline count, is a
count variable, in a given year, of the number of projects that a sample firm has in either Phase I, Phase II
or Phase III clinical testing. Our second measure follows Higgins and Rodriguez (2006) and assigns
clinical probabilities to each of the phases of research. These assigned clinical probabilities reflect the
likelihood that a potential treatment has of receiving FDA approval. Theses values are aggregated in
order to construct a weighted value of each company’s pipeline products (Pipeline score).
3.3 Patent profiles
In this paper, we use patents issued in the U.S. by the United States Patent and Trademark Office
(USPTO). The patents assigned to pharmaceutical firms may be characterized into two different types.
First, firms are issued patents that are directly attached to an FDA-approved drug (as identified in the
FDA Orange Book.) Second, firms are assigned a stock of non-attached patents. These stocks of non-
attached patents contain patents that are related to pharmaceutical research and patents that are related to
other types of activities (e.g., medical devices, consumer products, management software, etc.) In
contrast to much of the extant literature that and in order to obtain a more meaningful picture of firm-level
"pharmaceutical" patenting, we employ a mechanism to select patents from among this stock, so as to
isolate patents germane to our pharmaceutical R&D study.
Following an approach used in Graham and Mowery (2004) for identifying software patents, we
distinguish relevant pharmaceutical-related patents by reference to their international patent classification
(IPC). Based on the patenting by the twenty-five largest pharmaceutical firms (by market capitalization,

11
year 2000), we identified 11,090 U.S. patents granted to those organizations between 1975 and 2002.
Analysis of the primary international patent classes into which these patents fall demonstrates that 36.4
percent were classed in “A61K” and 26.4 percent are classed in “C07D.” The next most frequent class
includes only 5.3 percent of patents. These two classes (A61K and C07D)7 thus account for a cumulative
62.8 percent of these firms' patents, and we use these classes as our filter to identify "pharmaceutical
patents."
As a robustness check on our definition, we generated the population of 1,951 products identified
in the FDA Orange Book from 1982 to June 2006 (these include all reformulations, over-the-counter and
generic products) and isolate the relevant applicant and patent information. For the associated 1,267
unique patents attached to NDAs through 2002, we found that over 83 percent (73.1 percent and 7.0
percent, respectively) are classed into our defined classes A61K and C07D. Moreover, when we employ
the 36 NBER patent database "technological subcategories" derived from 418 USPTO (as opposed to
IPC) classifications (Hall et al., 2003), we find that 75.6 percent of our 11,090 sample patents fall into
two aggregated categories (numbered 14 and 31). This share compares with the 93.7 percent of the 1,267
NDA-associated patents that fall into these same two categories. Since patents attached to FDA-approved
products are primarily classed in these two categories, we can be reasonably confident that the underlying
research related to patents in classes A61K and C07D is pharmaceutical related.
We make use of these two IPCs to build a sample of pharmaceutical-research patents assigned to
commercially active pharmaceutical firms. Employing our population of 1,951 products identified in the
FDA Orange Book from 1982 to June 2006, we create a sample of firms to which at least one FDA-
approved product was assigned. These firms match to 325 unique USPTO organization codes, and we
find that these organizations were issued a total of 154,775 patents during 1975 to 2001, and that 50,466
(32.6 percent) of these patents are assigned into the primary "pharmaceutical" classes A61K and C067.8
Excluding the patents attached to FDA-approved products nets us 49,563 patents, 96.5 percent of which
7 We exclude subclass A61K 07 which primarily comprises cosmetics (Harhoff and Hall, 2003). 8 We used a year 2001 truncation because elements of our product level sales data are available only to that year.

12
are assigned into the Hall, et al (2003) technology subcategories 14 and 31 described above. For each
major commercial drug firm in our sample, therefore, we produce a patent profile that includes both (1)
all firm patents attached directly to FDA-approved products (n=903) and (2) the firm's other
pharmaceutical-related patents (n=49,563).
We make one more correction to the patent data. It is common for researchers to use the
"application date" disclosed on the front page of the U.S. patent document to represent the approximate
date on which an invention was created, or entered the formal patent system. As described in Graham
(2006), this practice fails to account for the string of "continuations” in the application history of the
patent. When working with pharmaceutical-patent data, the practice is particularly problematical because
continuation rates may be as high as 60 percent of all issued patents (Graham, 2006). The continuation is
a procedure available in the U.S. patent law that permits an applicant to re-start the application process, at
will. There is no limit to the number of times that an application may be continued,9 and the "application
date" specified on the face of the patent document is merely the last of what may be a string of continued
applications (Graham and Mowery, 2004).
In our sample of pharmaceutical research patents, 46.2 percent of our sample of 50,466
"pharmaceutical research" patents assigned to major commercial firms had at least one continuation in
their patent application lineage. We also empirically test the lag between the first continuation date and
the grant date in our sample, finding a mean lag of 35 months (median 32 months). These measures
compare with a mean of 24 months (median 22 months) when one uses the "application date" on the face
of the U.S. patent document.
Figure 2 shows the time trend in patenting for our sample firms within the defined technology
classes. The dotted line plots patent applications while the solid line accounts for new patent grants
within our defined technology classes. The trend in patent grants for our sample firms has gradually been
increasing from approximately 1,700 in 1990 to nearly 2,500 patents issued per year in 2001.
9 Although, since 1995, the applicant is limited to a total window of 20 years in which to both apply-for and enjoy protection upon a patent.

13
Finally, we explore the propensity to patent. Consistent with Hicks et al., (2001) we define
“propensity to patent” as the ratio of patents to R&D expenditures (constant dollars, in millions). Our
numerator in this measure equals the total number of pharmaceutical patents issued to our sample firms.
Using a similarly-constructed measure, Hicks et al., (2001) find a constant propensity to patent of 0.38
from 1991 to 1998 in the chemical sector, which includes pharmaceuticals in their study.10 For our
sample firms, the “propensity to patent” has steadily declined from 1987 to 2001 with a sharp downturn
in the post-1995 period. In contrast, the ratio of real R&D expenditures to real sales has remained
reasonably constant at around 15 percent throughout the same time period. Accordingly, it appears that
increases in R&D expenditures have kept pace with increases in sales. At the same time, however,
overall patenting within our defined technology classes has also increased. Taken together this suggests
that the rate of R&D expenditures is increasing at a faster pace than is patenting, thereby depressing the
overall “propensity to patent”. Our interpretation is consistent with the overall decline in research
productivity in the pharmaceutical industry described by Higgins and Rodriguez (2006).
3.4 Patent lags
The lag between patent filing and FDA approval has diminished considerably from 1985 to 2001.
In 1985, the mean lag between patent filing and FDA approval was 180.6 months (median is 167
months). This lag declined to a mean of 117 months (median is 107 months) in 1990 and to a mean of
77.6 months in 1995 (median is 71 months). By 2001, the mean lag between patent filing and FDA
approval fell to 35.3 months (median is 47 months). Over the entire sample period, the mean lag is 59.6
months while the median lag is 61 months.
Since we find an average lag from 1990 to 2001 of 71 months, an average lag from 1995 to 2001
of 60 months, and an overall sample mean lag from 1985 to 2001 of 60 months, we use as our benchmark
a lag of five years, or 60 months. We employ this figure to examine the relationship between patent
10 The time frame was broken into two patent year samples. The first period consisted of patent years 1991 to 1994 with R&D expenditure years 1989 to 1992. The second period consisted of patent years 1995 to 1998 with R&D expenditure years 1993 to 1996. It should be noted that the Hicks et al. sample was limited to firms that received 50 or more patents per year.

14
filings from 1985 to 1996 (and citation-weighted filings) on new FDA product introductions from 1990 to
2001.11
3.5 Size of the firm
Studies that have considered firm-size in the context of patenting and firm performance have
come to inconsistent conclusions about the role that firm size plays. On one hand, Jensen (1987) employs
actual new products as a dependent variable and reports that firm size has no effect when introduced as an
independent variable. On the other hand, studies that have proxied for new products have shown firm
effects to be significant (e.g., Rothaermel and Hess, 2007; Shan et al., 1994; and, Acs and Audretsch,
1989). We find in Graham and Higgins (2007) that patents are not a valid proxy for new product
introductions in the pharmaceutical industry. As such these studies that use patents to proxy for new
products may really be detecting a relationship between patenting and firm size.
We are able, like Comanor and Scherer (1969) and Jensen (1987), to use actual new product
introductions, and not proxies, as our dependent variable. We introduce four different measures of firm
size in order to ensure that we are adequately controlling for any possible size effects. These are the
natural logarithms of: firm market capitalization (Log market cap); number of employees (Log
employees); firm total assets (Log total assets); and, pharmaceutical sales (Log sales).
4.0 Empirical findings
4.1 New FDA approved product introductions
Table 3 presents negative binomial estimates for our data regressing New drugs on a series of
independent variables expected to affect the introductions of new FDA approved products. The
dependent variable, yit, is a count of the number of drugs a firm i introduces in a specific year t. Given the
nature of our dependent variable in Table 3, New drugs, we test for overdispersion in the data to
determine whether a Poisson or negative binomial model is warranted. We test for overdispersion
utilizing a likelihood ratio test based on the Poisson and negative binomial distributions (Cameron and
11 Our empirically derived lag is longer than the three-year lag empirically derived by Comanor and Scherer (1969) and also longer than that used in several other studies (e.g., Rothaermel and Hess, 2007; Henderson and Cockburn, 1994). For robustness we discuss results derived from using both a three- and five-year lag.

15
Trivedi, 1998). We reject the null hypothesis and as a result of overdispersion in our data we utilize a
negative binomial model. We also apply a Hausman (1978) specification test which revealed that fixed-
effects estimation is appropriate.12
“Continuation” application practices permitted in the U.S. patent system allow firms to manage
the timing of their patent grants. Because patent applicants may choose to “continue” an application at
will, even in the face of a positive grant decision by the patent examiner, the patentee is able to have
significant control over the ultimate grant-date of the issued patent.13 Discussions with patent attorneys,
and empirical evidence in Graham (2006), support the notion that pharmaceutical firms use continuation
applications to map the grant-date of important patents to the approval of drugs in the FDA-endorsement
process. The continuation is an important strategic option available to firms (Hegde, et al. 2007), and its
extensive use proxies, we contend, for a firm-specific strategic capability in using patents.
Accordingly, we include patent, citation, and continuation measures in our regressions. For
independent variables we use five-year lagged counts of firm patent applications (Lagged patent filings),
the number of patent forward citations (Total citations II), and the average number of patent continuations
per patent (Continue per patent). We also include the total number of prior FDA approved drugs by the
firm (ATC count), an indicator if a firm loses exclusivity protection on an existing product in years
ranging from (t-1) to (t+1) (Drug loss), a measure of each firm’s research pipeline (Pipeline count), the
natural log of R&D expenses (Log R&D), the natural log of the number of employees (Log employees)
and the natural log of firm market capitalization (Log market cap). Firm and year dummies are included
in all models. As a robustness check, we include an alternate measure of each firm’s research pipeline
(Pipeline score) and alternate lags for Lagged patent filings. See Table 1 for variable definitions and
Table 2 for descriptive statistics and variable correlations.
12 Results remain qualitatively robust to a random effects specification. 13 This practice promised greater reward for the pharmaceutical firms prior to 1995 when the patent term was 17 years from date of issue. In the current regime, the patent term is 20 years from date of first application, and thus the firm suffers one day of lost patent term for each additional day of continuation application it chooses. See Graham (2006).

16
Across all five models reported in Table 3 (Model 1 to Model 5), we find a positive and
significant relationship between patenting (Lagged patent filings) and new product introductions (New
drugs). Coefficients range from 0.0288 to 0.0513 with corresponding marginal effects ranging between
0.32 percent and 0.85 percent. These marginal effects imply that for a one standard deviation change in
Lagged patent filings that there is between a 4.54 percent and 12.06 percent increase in the expected
number of new product introductions.14
Brouwer and Kleinknecht (1999) contend that simple patent counts may be a problematic
indicator for innovation due to varying patenting intensities of firms. In order to address this issue we
replace Lagged patent filings and Log R&D with Patent intensity where Patent intensity is defined by
Lagged patent filings divided by Log R&D. In regressions replicating those presented in Table 3 we find
coefficients ranging from 0.1613 to 0.1730, with marginal effects ranging from 4.17 percent to 4.48
percent. These marginal effects imply that for a one standard deviation change in Patent intensity that
there is between a 1.72 percent and 1.85 percent increase in the expected number of new product
introductions.
We know from prior research that continuations are an important strategic tool available to firms
(Hegde et al. 2007). We find positive and significant results on Continue per patent with marginal effects
ranging from 7.24 percent to 7.28 percent. Our results suggest that pharmaceutical firms may well be
using the continuation practice strategically to help with new product introductions. Previewing results in
the next section we show that continuations also help firms time the introduction of new products.
Our findings for Drug loss and its various lags are reported in Models 2 to 5. The coefficients are
largest on Drug loss (t-1) and decline in magnitude to Drug loss (t+1). This result may be interpreted as 14 Some researchers have moved away from raw patent counts and instead focus on citation-weighted counts in order to determine the “strength” or “importance” of a patent, or as a proxy for its “value” (e.g., Aspden, 1983; Stuart, 2000; Bloom and Van Reenen, 2002). As a result, we replicate our analysis, replacing Lagged patent filings with Citation weighted filings in order to test whether citation-weighted counts affect the expected number of FDA approved product introductions. Consistent with our previous findings with respect to Lagged patent filings, we find a positive and significant relationship between Citation weighted filings and New drugs across all five models with coefficients range from 0.0039 to 0.0091 and marginal effects ranging from 0.05 percent to 0.14 percent. All are significant at the 1 percent level. These marginal effects imply that for a one standard deviation change in Citation weighted filings there is between a 1.06 percent and 2.97 percent increase in the expected number of new product introductions.

17
suggesting that firms focus new product introductions on the three year period surrounding the loss of
exclusivity protection of a current drug, with the largest emphasis on (t-1). Coefficients range from
0.4871 to 0.6111 for Drug loss (t-1); 0.4278 to 0.6104 for Drug loss; and, 0.3603 to 0.5440 for Drug loss
(t+1). Corresponding marginal effects range from 15.41 percent to 21.90 percent for Drug loss (t-1);
13.05 percent to 21.36 percent for Drug loss; and, 10.60 percent to 19.28 percent for Drug loss (t+1).15
As a robustness check, we redefine our dependent variable, New drug indicator, to equal one if a
firm introduced a new FDA approved product in a given year and zero otherwise. We test this new
dependent variable using a probit model. Across models that replicate the specifications in Table 3, we
find a positive and significant impact of Drug loss on the probability that a FDA-approved product is
introduced in a given year. Marginal effects for Drug loss (t-1), Drug loss, and Drug loss (t+1) range
from 7.23 percent to 7.70 percent; 4.72 percent to 4.94 percent; and, 1.97 percent to 4.53 percent,
respectively. Viewed cumulatively with the results in Table 3, the loss of exclusivity in the three-year
window surrounding the introduction of a drug is by far the largest predictor a new drug will be
introduced. The composition of these new drugs will be discussed in Section 4.4.
It should be no surprise that pharmaceutical firms attempt to manage product introductions so as
to smooth revenues, especially given the increased pressure from generic firms. What is more surprising
is that firms appear to be successful in managing that process, especially given the long lags involved in
new product development. The loss of exclusivity on an existing drug is an important and economically
meaningful event to the firm.16 As such, we take it that firms are aware of which revenue streams they
have that are threatened, and have strong incentives to act strategically. In an effort to illustrate this point,
we combine proprietary sales data from IMS Health with FDA drug approvals from 1990 to 2001.
Consistent with Higgins and Rodriguez (2006), we find that approximately 74 percent of sales occur
15 For robustness, we tested both Drug loss (t-2) and Drug loss (t+2). Neither is significant at conventional levels. 16 A successful challenge by a generic firm would open the path for generic introduction prior to patent expiration. Merck’s Fosamax™ is an example of a product that was challenged after the loss of exclusivity but prior to the expiration of the underlying patents. The courts have upheld the generic firm’s claims of non-infringement thereby allowing the generic to produce effective February 2008. According to Merck’s annual report, Fosamax™ revenues exceed $1 billion.

18
during this five-year exclusivity protection period after FDA approval, while approximately 15 percent of
sales are realized in the three years following the loss of exclusivity.
In three models, Model 3 to Model 5 in Table 3, variable Log R&D is positive and significant,
with marginal effects ranging from 1.93 percent to 3.87 percent. The literature is replete with findings
that relate R&D expenditures to patenting (e.g., Cockburn and Griliches, 1988; Acs and Audretsch, 1989).
However, there are fewer studies focusing on the relationship between R&D spending and new product
development, especially in the pharmaceutical industry. An exception is Jensen (1987) who studies the
effects of R&D on new chemical entities (NCEs), producing a finding that increases in R&D expenditures
increase the probability that a new drug is discovered.
Interested as we are in the role that these product introductions are playing, we add an empirical
innovation and, in contrast to existing research, we explicitly control for the underlying research pipelines
of the sample firms. We consider two different measures: Pipeline count and Pipeline score. Both
measures involve counts of the underlying number of research projects a firm has active in a given year.
Pipeline score is a more complex measure in that it attaches probability weightings to the various-stage
projects to generate an overall value in each time period (Higgins and Rodriguez, 2006). Even though it
is more complex in its construction, unreported regressions show the effects remain similar to Pipeline
count. Overall, we find positive and significant effects across all four models on the probability of new
product introduction, with marginal effects ranging from 0.08 percent to 0.16 percent. With a mean value
of 27.87 and a standard deviation of 41.56, this suggest that for a one standard deviation change in
Pipeline count there is between a 2.90 percent and 5.40 percent increase in the probability a new product
is introduced.
Finally, we directly measure firm size by Log market cap and Log total assets and indirectly by
Log employees and Log sales. Contrary to other work that has found some effect, either positive or
negative, between firm size and innovative performance, we find no effect between firm size, either direct
or indirect, and new product introductions. As we indicated before, many of these studies proxied new
product introductions with patenting. Our findings, which are consistent with Jensen (1987), coupled

19
with our findings in Graham and Higgins (2007), suggest that these previous firm size findings are related
in some way to patenting and not new product introductions.
4.2 Strategic timing of new product introductions
We now move beyond simply asking what predicts or influences new product introductions and
explore whether firms are able to strategically time their introductions. Table 4 presents probit estimates
for our data regressing Window on a series of independent variables expected to affect the probability that
a firm strategically introduces a new product. Window is a dummy variable that equals one if a firm
introduces a new product (“the focal drug”) within the three-year window surrounding the loss of
exclusivity on an existing product, and is zero otherwise. Independent variables are similar to those
previously used with a few additions. We define ATC experience as a count variable that identifies the
number of drugs within the same therapeutic category as the focal drug that a firm has previously
introduced. Ratio serves as a relative measure of the value of a specific therapeutic category and is
defined by the total sales within a specific therapeutic category divided by total pharmaceutical sales in a
given year. Competitor ATC is a dummy that equals one if a competing firm has an existing product
within the same therapeutic category as the drug that is being introduced. Finally, NDA total citations,
NDA claims, NDA generality and NDA continuations are patent-specific measures that relate directly to
the specific patent(s) attached to the new drug application (NDA).
We find a positive and significant relationship between ATC experience and the firm’s ability to
strategically time product introductions. Our interpretation of this variable is that it serves as a proxy for
a firm’s specialized assets. Given the importance of this finding, we will delay this discussion until
Section 4.3 where it will be addressed directly.
The size of a firm’s research pipeline, Pipeline count, also positively impacts the probability that
a firm can strategically introduce new products. Results are robust if we replace Pipeline count with the
more complex Pipeline score. Research pipelines can be built in many ways; they can be internally
developed, built by acquisitions (Higgins and Rodriguez, 2006) and/or alliances (Rothaermel and Deeds,
2004). The combinations of these activities can even change over time. For example, in December 2004,

20
Merck had 42 products in either Phase I, II or III clinical testing with six of these being the result of
license, alliance or acquisition. By August 2007, Merck had 47 products in either Phase I, II or III
clinical testing with 12 the result of license, alliance or acquisition. We are agnostic on how firms build
their research pipelines what is important to us in the current context is the sheer size of their pipeline.
Interestingly, the presence of a competitor’s drug in the same therapeutic class being currently
marketed has no impact on the probability that a firm strategically introduces its patent. This lack of a
relationship suggests that firms introducing “me-too” drugs are not affected by the presence of
competition in the market, at least with respect to product introductions.17
We measure the relative value of a specific therapeutic market by summing up all prescription
drug sales in that ATC code and dividing it by total prescription sales in a given year. Ratio ranges from
0.001 to 0.19 with a mean (median) value of 0.10 (0.11) and a standard deviation of 0.06. Coefficients
across all four models are positive and significant with marginal effects ranging around 29 percent. The
relative value of a particular market appears to matter to a firm when they are strategically timing the
introduction of their new products.
We use three firm-specific patent variables in our regressions, Patent intensity and Lagged patent
filings and Continue per patent. The former is a measure of patent productivity per dollar of input (R&D
spending), while including the latter two variables in the same regression we theorize captures other
patent-strategy capabilities of the firm. Patent filings in year t shows only a -0.19 correlation with firm
Log employees in that year, suggesting that its inclusion does not simply proxy for firm size. Referencing
Table 3, the variables Lagged patent filings and Continue per patent both positively and significantly
predict the probability a new drug is introduced. Likewise, in Table 4, both variables remain positive and
significant across all four models.
Finally, we include proxies for value, importance, and scope associated with patents attached to
the focal product (NDA) from the FDA Orange Book. We collect these variables from the NBER
database, supplemented and updated with information from the USPTO. Our measures NDA total 17 “Me-too” drugs are those that are structurally similar to those products currently on the market.

21
citations (the count of forward citations collected by the patent through 2006, mean=11.8) and NDA
claims (mean=16.0) are included as value correlates, consistent with previous literature (Lanjouw and
Schankerman, 2001; Hall et al., 2003). We also include NDA Generality (the concentration index of US
patent classes into which the patent’s forward citations are ordered, mean=0.3712) as a proxy for patent
breadth, and NDA continuations (mean=1.60) as a count of the continuations applications used by the
patentee on the focal patent, intended to proxy for strategic action, but which has also may serve as a
value correlate (Graham and Mowery, 2004). We find that none of these variables are significantly
different from zero in our models, either individually or jointly. These results suggest to us that because
these new products (NDAs) are all highly valuable, they create incentives for firms to seek broad patents
through strategic prosecution. As such, variation in these measures is not effective at as a predictor of the
timing of new product introduction.
4.3 Specialized assets One of the variables with the most pronounced effect in our models is our proxy for firm specialized
assets, ATC experience. Chan et al. (2007) argue that downstream specialized assets are important for
R&D pipeline choice. We go one step further and hypothesize that it will particularly important for firms
to manage the timing of its new product introduction so as to efficiently utilize these specialized assets.
ATC experience is the count of previous introductions of products by firm i within the same therapeutic
class as the focal product introduced in year t. By way of description, this variable has a mean of 0.59
with minimum value 0 and maximum value 6 across our sample of newly-introduced firm products.
Table 4 shows that, across all models, this variable is both positive and significant. Marginal
effects show that the previous marketing of one additional drug in the focal therapeutic class makes it
approximately 15 percent more likely that a firm will strategically introduce a new drug within the 3-year
window of the loss of exclusivity on a current product. Accordingly, the previous firm experience and
building of complementary assets—specialized to a particular therapeutic class of drugs—appear to be the
most significant predictor that a firm will target the introduction of a new drug within the narrow window
surrounding the loss of exclusivity on another portfolio product.

22
4.4 The composition of strategically timed new product introductions
In Table 4 we analyzed whether firms were able to strategically introduce new products. Our
results suggest that firms are in fact successful in this type of strategic behavior. The question now
becomes what types of products are firms strategically introducing?18 Analyzing the therapeutic
classification of approved products we identify three broad categories of new drugs: (1) reformulations of
existing drugs, (2) substitute drugs, and (3) novel, unique drugs. Reformulations of existing drugs require
that additional clinical data be provided and, as a result, a period of new exclusivity protection is granted
by the FDA. Common reformulations are drugs that move from being taken twice-a-day to once-a-day,
for example, Claritin™ and Claritin-D™. Substitutes are new drugs that replace older drugs for the same
indication. For example, AtraZeneca’s antacid Nexium™ replaced its Prilosec™. Novel drugs are those
for which the firm had no prior approved drugs for a specific therapeutic indication.
For products that are introduced within the three-year window surrounding the loss of exclusivity
protection we find the following shares: novel (41.5 percent), reformulations (30.5 percent) and
substitutes (28 percent). In our entire sample of approved drugs, we find the following: : novel (68.5
percent), reformulations (18.6 percent) and substitutes (12.9 percent).19 These figures suggest that over
50 percent of drugs introduced within a 3-year window of exclusivity-loss rely on a firms’ past research
experience and thus are comparatively more likely to be products for which specialized downstream
assets are necessary.
5.0 Conclusions
Our foregoing analysis provides strong evidence that pharmaceutical firms are both effectively
managing the timing of their new product introductions, and that reducing adjustment costs associated
with mismatched downstream specialized assets are driving this strategic choice. This paper thus
supports previous research that has found the possession of downstream complementary assets to be
critical to innovative success (Teece, 1986; Tripsas, 1997; Rothaermel, 2001). We are furthermore able
18 We thank Professor Brian Wright for drawing our attention to this point. 19 Differences between results are significantly different from zero at the 1 percent level.

23
to extend this research by bringing the first empirical evidence of which we are aware on the performance
of firms at managing the timing of new product introductions, and the extent to which specialized
complementary assets play a role in the necessity of managing that timing effectively.
These finding have implications for our understanding of the role of specialized downstream
assets in the innovation process. While Williamson (1985) gives us a framework to understand the
importance of maintaining specialized assets inside the firm, he also reminds us that, by integrating all
these functions within one organization, the firm suffers the costs of low-powered incentives and
increased bureaucracy. The pharmaceutical firms in our study appear to be able to manage these complex
assets within the firm, even in the face of these costs that would seem to militate against such successful
timing. Our study thus raises questions about the “costliness” of these downsides to hierarchy, at least in
the modern pharmaceutical firm, and how the players in this industry have seemingly been able to
mitigate the harshness of these attributes.
We make multiple contributions to the literature. First, we demonstrate that the most important
predictor of the introduction of a new drug is the loss of exclusivity protection on a current product. Our
evidence suggests that pharmaceutical firms are acting strategically, targeting the three-year window
around the loss of exclusivity to introduce new products. The apparent ability of pharmaceutical firms, in
general, to smooth firm revenues by targeting introductions appears to us impressive given the long
development periods they face.
Second, we explore this notion of strategic product market timing in more depth. Our findings
suggest that three main factors predict whether a pharmaceutical firm is able to engage in this type of
strategic market timing: the weighted measure of a firm’s research pipeline, their cospecialized
investments and experience in a particular therapeutic category and their use of the continuation process.
Third, we explore the implications of relying upon the original filing date of United States
patents, instead of relying upon the artificial "application date" listed on the front page of the patent
document. Consistent with Graham (2006), we use the first in what may be a string of patent application
continuations, as an indicator of the date on which the granted patent originally entered the patent system.

24
This correction is particularly important in the pharmaceutical industry, since a large share of granted
patents in this sector have had at least one continuation in their application lineage. In our analysis, we
find significant differences in the amount of pre-grant application lag that this correction offers.
Moreover, we find that continuation counts are a positive and significant predictor of new product
introductions, suggesting to us that this variable contains information about the strategic use of the
patenting process by firms.
Fourth, unlike the extant empirical literature, we explicitly control for each pharmaceutical firm’s
underlying research portfolio. Across all specifications tested we find a positive and significant impact on
new product introductions. This finding confirms prior research that shows the importance for firms to
maintain healthy research pipelines (Higgins and Rodriguez, 2006).
Finally, we find no relationship between firm size and new product introductions. Other work
that uses patenting as a proxy for new product development has found a relationship between these two
variables, either positive or negative (Rothaermel and Hess, 2007; Shan et al., 1994; and, Acs and
Audretsch, 1989). In contrast, our findings are consistent with prior work that uses actual new product
introductions as a dependent variable and introduces firm size as an independent variable, and finds the
size effect is not significantly different from zero (Jensen, 1987).

25
References:
Acs, Z., Audretsch, D., 1989. Entrepreneurial strategy and the presence of small firms. Small Business Economics 1, 193-213. Bloom, N., Van Reenen, J., 2002. Patents, real options and firm performance. The Economic Journal 112, C97-C116. Brouwer, E., Kleinknecht, A., 1999. Innovative output, and a firm’s propensity to patent. An exploration of CIS micro data. Research Policy 28, 615-624. Cameron, A.C., Trivedi, P.K., 1988. Regression Analysis of Count Data. Econometric Society Monograph No. 30, Cambridge University Press. Chan, T., Nickerson, J.A., Owan, H., 2007. Strategic management of R&D pipelines with cospecialized investments and technology markets. Management Science 53(4), 667-682. Cockburn, I., Griliches, Z., 1988. Industry effects and appropriability measures in the stock market’s valuation of R&D and patents. American Economic Review 78, 419-423. Cohen, W., Nelson, R., Walsh, J., 2000. Patenting their intellectual assets: appropriability conditions and why U.S. manufacturing firms patent or not. NBER Working Paper 7522. Comanor, W., Scherer, F.M., 1969. Patent statistics as a measure of technical change. Journal of Political Economy 77, 392–398. DiMasi, J.A. 2001. New drug development in U.S. 1963-1999. Clinical Pharmacology and Therapeutics 69, 286-296. Eisenberg, R.S., 2007. The role of the FDA in innovation policy. Michigan Telecommunications and Technology Law Review 13, 345-388. Ernst, H., 2001. Patent applications and subsequent changes of performance: evidence from time-series cross-section analyses on the firm level. Research Policy 20, 143-157. Federal Trade Commission, 2002. Generic entry prior to patent expiration: FTC study. U.S. Government Printing Office, Washington, D.C., July. Graham, S.J.H., 2006. The determinants of patentees' use of 'continuation' applications in the United States patent and trademark office, 1980-99. In Andersen (ed.), Intellectual Property Rights: Innovation, Governance and the Institutional Environment. Edward Elgar Publishers. Graham, S.J.H, Higgins, M.J., 2007. Comanor and Scherer revisited: do patents proxy for new product introductions. Unpublished working paper, College of Management, Georgia Institute of Technology. Graham, S.J.H., Higgins, M.J., McKenzie, E., 2006. How well do markets value innovation in the pharmaceutical industry? Unpublished working paper, College of Management, Georgia Institute of Technology. Graham, S.J.H., Mowery, D.C., 2004. Submarines in Software? Continuations in U.S. Software Patenting in the 1980s and 1990s. Economics of Innovation and New Technology 13(5), 417-442.

26
Graham, S.J.H., Somaya, D., 2006. Vermeers and Rembrandts in the same attic: complementarity between copyright and trademark leveraging strategies in software. Unpublished working paper, College of Management, Georgia Institute of Technology. Hall, B.H., Jaffe, A., Trajtenberg, M., 2001. The NBER Patent Citation Data File: Lessons, Insights, and Methodological Tools. NBER Working Paper 8498. Hall, B.H., Jaffe, A., Trajtenberg, M., 2003. Market value and patent citations. Rand Journal of Economics 36, 16-38. Harhoff , D., Hall B.H., 2003. Intellectual Property strategy in the global cosmetics industry. Unpublished working paper, University of. Munich. Hausman, J., 1978. Specification tests in econometrics. Econometrica 46, 1251-1271. Hegde, D., Mowery, D.C., Graham, S.J.H., 2007. Pioneers, submariners, or thicket-builders: Which firms use continuations in patenting? NBER Working Paper 13153. Henderson, R., Cockburn, I., 1994. Measuring competence? Exploring firm effects in pharmaceutical research. Strategic Management Journal 15, 63-84. Hicks, D., Breitzman, T., Olivastro, D., Hamilton, K., 2001. The changing composition of innovative activity in the US – a portrait based on patent analysis. Research Policy 30, 681-703. Higgins, M.J., Rodriguez, D., 2006. The outsourcing of R&D through acquisition in the pharmaceutical industry. Journal of Financial Economics 80, 351-383. Jaffe, A., 1986. Technological opportunity and spillovers of R&D: evidence from firms’ patents, profits, and market value. American Economic Review 76, 984-1001. Jensen, E., 1987. Research expenditures and the discovery of new drugs. The Journal of Industrial Economics 36, 83–95. Lanjouw, J.O., Schankerman, M., 2001. Characteristics of patent litigation: A window on competition. Rand Journal of Economics 32(1), 129-151. Macher, J.T., Boerner, C.S., 2006. Experience and scale and scope economies: tradeoffs and performance in drug development. Strategic Management Journal 27(9), 845-865. Pakes, A., 1985. On patents, R&D, and the stock market rate of return. Journal of Political Economy 93, 390–409. Pisano, G.P., 1991. The governance of innovation: vertical integration and collaborative arrangements in the biotechnology industry. Research Policy 20, 237–249. Rothaermel, F.T., 2001. Incumbent advantage through exploiting complementary assets via interfirm cooperation. Strategic Management Journal 22, 687–699. Rothaermel, F. T., Deeds, D. L., 2004. Exploration and exploitation alliances in biotechnology: A system of new product development. Strategic Management Journal, 25(3), 201-221.

27
Rothaermel, F.T., Hess, A., 2007. Building dynamic capabilities: innovation driven by individual, firm, and network level effects. Organization Science 18, forthcoming. Schumpeter, J.A., 1934. The Theory of Economic Development. Cambridge: Harvard University Press and New York: Oxford University Press, 1961. Shan, W., Walker, G., Kogut, B., 1994. Interfirm cooperation and startup innovation in the biotechnology industry. Strategic Management Journal 15, 387-394. Stuart, T., 2000. Interorganizational alliances and the performance of firms: a study of growth and innovation rates in a high-technology industry. Strategic Management Journal 21, 791-811. Teece, D.J., 1986. Profiting from technological innovation: implications for integration, collaboration, licensing and public policy. Research Policy 15, 285-305. Tripsas M., 1997. Unraveling the process of creative destruction: complementary assets and incumbent survival in the typesetter industry. Strategic Management Journal 18, 119–142. Wall Street Journal, 2004. Drug industry’s big push into technology falls short. February 24. Williamson, O.E., 1985. The Economic Institutions of Capitalism: Firms, Markets, and Relational Contracting. Free Press, New York.

28
Fig. 1. A simple schematic of the management of complementary assets.
0
500
1000
1500
2000
2500
3000
3500
4000
4500
1985 1986 1987 1988 1989 1990 1991 1992 1993 1994 1995 1996 1997 1998 1999 2000 2001
Num
ber o
f pat
ents
Applications Issue Fig. 2. The dotted line accounts for all patent applications filed on behalf of sample firms within defined technology classes (with right side truncation). The solid line accounts for new patents granted to our sample firms within defined technology classes. The mean time lag between an application and its subsequent grant in our sample is 35 months, while the median lag is 32 months.
29
Table 1: Definition and description of variables
Variable Description
New drugs Number of new FDA approved drugs introduced in a given year
Patent filings Total number of patents filed by a firm in a given year
Lagged patent filings Variable Patent filings lagged five years
All lagged patent filings Lagged patent filings plus all other firm patenting that was not included in Patent filings (primarily non-pharmaceutical related)
Non-US inventor Number of patents that list a non-US individual as the first inventor ATC experience Prior number of approved drugs within the same therapeutic category as the current approved drug (firm-specific) ATC count Total number of prior FDA approved products
Competitor ATC Dummy = 1 if a competing drug existed in the market at the time of FDA approval Ratio Sales for primary ATC divided by total pharmaceutical sales (yearly) Total citations Total patent citations, including self cites, thru 2004 Total citations II Total patent citations, excluding self cites, thru 2004
Patent intensity Lagged patent filings divided by Log R&D
Total continuations Total number of continuations by filing year for each firm
Continue per patent Total continuations (lagged five years)as divided by Lagged patent filings
Citation weighted filings Three year window of citation weighted Lagged patent filings, excluding self cites
Drug loss = 1 if approved product loses exclusivity protection in a given year
Pipeline count Total number of products in Phase I, Phase II and Phase clinical testing
Pipeline score Weighted value (non monetary) of Pipeline count
Log R&D Natural log of sum of R&D expenses lagged three to five years
Log employees Natural log of number of firm employees
Log total assets Natural log of firm total assets
Log sales Natural log of firm level FDA approved pharmaceutical sales
Log market cap Natural log of firm market capitalization

Table 2: Descriptive statistics and correlation matrix
Mean S.D. 1 2 3 4 5 6 7 8 9 10 11 12 13 14 15
1. New Drugs 0.26 1.17 1.0000 2. Patent filings 5.91 14.39 0.2533 1.0000 3. Non-US inventor 2.59 8.36 0.1470 0.3282 1.0000 4. Total citations I 31.39 91.15 0.0731 0.8201 0.1218 1.0000 5. Total citations II 24.41 65.04 0.0444 0.7900 0.1446 0.9803 1.0000 6. ATC experience 0.59 0.98 0.3304 -0.0882 -0.0096 -0.0980 -0.0855 1.0000 7. Total continuations 5.83 15.73 0.1582 0.9133 0.1545 0.8496 0.8334 -0.0936 1.0000 8. Drug loss 0.10 0.67 0.3145 0.0063 0.0929 0.0079 -0.0054 0.4033 -0.0328 1.0000 9. Pipeline count 27.87 41.56 -0.0052 0.1562 0.0272 0.1713 0.1558 0.1498 0.1557 0.0117 1.0000 10. Log R&D ($M) 7.20 2.01 0.1046 0.2450 0.0839 -0.3016 -0.2286 0.1083 -0.2329 0.0439 0.0234 1.0000 11. Employees (000s) 47.46 53.33 -0.0947 -0.1931 0.0591 -0.2132 -0.1463 0.1720 -0.1771 0.0713 0.0270 0.4765 1.0000 12. Log total assets ($M) 7.87 2.17 -0.0923 -0.2245 0.0810 -0.2580 -0.1888 0.1211 -0.2139 0.0533 0.0155 0.9160 0.8880 1.0000 13. Log sales ($M) 8.35 2.49 0.3584 0.3123 0.2553 0.2146 0.1863 0.1228 0.2445 0.0520 0.3737 0.0437 0.1224 0.0092 1.0000 14. Log market cap ($M) 10.25 2.53 0.0545 0.0193 0.0263 -0.0280 -0.0255 0.1583 -0.0113 0.0385 0.2567 0.1861 0.2001 0.1791 0.2316 1.0000 15. Ratio 0.10 0.60 -0.1098 -0.0374 0.1882 0.0322 0.0729 0.1797 -0.0245 -0.0478 0.1069 0.1496 0.2125 0.1621 0.1846 0.0656 1.0000
*** All financial variables are in constant 2000 dollars. Statistics are based on firm-year figures.

31
Table 3: Patenting and new FDA approved product introductions
Negative binomial estimates for our data regressing New Drugs on a series of independent variables expected to impact the number of introductions of new FDA approved products by a firm. We apply a Hausman specification test (1978) the results reveal that a fixed-effects estimation is appropriate. The universe of firms for this analysis includes all firms that have at least one FDA approved product from 1985 to 2001. Firm and year effects are included in all models. See Table 1 for independent variable definitions. Robust standard errors are reported in parentheses. a denotes significance at the 1% level; b denotes significance at the 5% level; and c denotes significance at the 10% level
Model 1 Model 2 Model 3 Model 4 Model 5
Independent variable Model 1 ∂Φ/∂x Model 2 ∂Φ/∂x Model 3 ∂Φ/∂x Model 4 ∂Φ/∂x Model 5 ∂Φ/∂x
Lagged patent filings 0.0513 0.0032 0.0337 0.0085 0.0323 0.0085 0.0288 0.0080 0.0297 0.0082 (0.0045)a (0.0044)a (0.0042)a (0.0038)a (0.0046)a
Total citations II 0.0044 (0.0039)
Continue per patent 0.2600 0.0724 0.2623 0.0728 (0.0680)a (0.0672)a ATC count 0.0456 0.1734 0.0507 0.1934 0.0511 0.1955 (0.0674)a (0.0688)a (0.0688)a Drug loss (t-1) 0.4871 0.1541 0.6111 0.2118 0.6029 0.2190 0.5870 0.2137 (0.1960)a (0.1632)a (0.1943)a (0.1979)a Drug loss 0.4278 0.1305 0.6104 0.2113 0.5848 0.2136 0.5581 0.1984 (0.1755)b (0.1582)a (0.1979)a (0.1848)a
Drug loss (t+1) 0.3603 0.1060 0.5292 0.1361 0.5440 0.1928 0.5365 0.1886 (0.2025)c (0.3242)c (0.1710)a (0.1705)a Pipeline count 0.0053 0.0013 0.0032 0.0008 0.0058 0.0016 0.0057 0.0016 (0.0015)a (0.0012)a (0.0014)a (0.0014)a Log R&D 0.0528 0.1471 0.0387 0.0688 0.0191 0.0739 0.0193 (0.0431) (0.0615)b (0.0417)c (0.0413)c Log employees 0.0309 -0.0895 (0.0411) (0.0875) Log market cap -0.0070 -0.0032 (0.0199) (0.0201)
Non-US Inventor 0.0122 (0.0081)
Constant -3.8142 -2.2887 -2.3968 -2.2327 -2.1908 (0.1302)a (0.4159)a (0.3789)a (0.3838)a (0.3845)a Firm dummies Yes Yes Yes Yes Yes Year dummies Yes Yes Yes Yes Yes N 8,311 3,196 3,196 3,196 3,196 Log likelihood -2529.25 -1501.37 -2053.46 -1522.09 -1520.93
χ2 651.67 287.74 304.95 207.78 221.64

32
Table 4: Strategic introduction of FDA approved products
Probit estimates for our data regressing Window on a series of independent variables expected to impact a firm’s probability of strategically introducing new FDA approved products during the three-year window surrounding the loss of exclusivity of another portfolio drug. The sample time period covers 1985 to 2001. See Table 1 for independent variable definitions. Firm and year effects are included in all models. Robust standard errors are reported in parentheses. a denotes significance at the 1% level; b denotes significance at the 5% level; and c denotes significance at the 10% level.
Model 1 Model 2 Model 3 Model 4
Independent variable Model 1 ∂Φ/∂x Model 2 ∂Φ/∂x Model 3 ∂Φ/∂x Model 4 ∂Φ/∂x
ATC experience 0.4239a 0.1502 0.4252a 0.1507 0.4235a 0.1501 0.4212a 0.1493 (0.0783) (0.0780) (0.0779) (0.0783)
Pipeline count 0.0026c 0.0009 0.0025b 0.0009 0.0027b 0.0009 0.0025c 0.0009 (0.0014) (0.0010) (0.0011) (0.0014) Lagged patent filings 0.0117a 0.0041 0.0115a 0.0041 0.0115a 0.0041 0.0116a 0.0041 (0.0041) (0.0041) (0.0041) (0.0040)
Ratio 0.8220b 0.2924 0.8167b 0.2905 0.8209b 0.2920 0.8218b 0.2923 (0.3992) (0.3550) (0.4264) (0.4236) Patent intensity 0.1404c 0.0524 0.1361c 0.0511 0.1376b 0.0487 0.1452b 0.0515 (0.0803) (0.0740) (0.0694) (0.0684) Log employees 0.0102 0.0110 0.0121 0.0112 (0.0355) (0.0041) (0.0356) (0.0356) Competitor ATC 0.1021 0.0874 0.0976 0.1327 (0.1138) (0.1189) (0.1011) (0.1087) Continue per patent 0.1091c 0.0387 0.1046c 0.0371 0.1072c 0.0380 0.1094c 0.0388 (0.0630) (0.0633) (0.0630) (0.0640)
NDA total citations -0.0041 (0.0036)
NDA claims -0.0058 (0.0059) NDA generality -0.0621 (0.2124)
NDA continuations 0.0090 (0.0342) Constant -0.7514a -0.7222a -0.7976a -0.8269a (0.2519) (0.2657) (0.2556) (0.2493) Firm dummies Yes Yes Yes Yes Year dummies Yes Yes Yes Yes N 451 451 451 451 Pseudo R2 0.2350 0.2347 0.2332 0.2332
χ2 84.40 87.29 85.93 86.78