the manitowoc company, inc.s21.q4cdn.com/264200883/files/doc_presentations/2016/nov/... ·...
TRANSCRIPT
The Manitowoc Company, Inc.
INVESTOR DAY
NOVEMBER 10, 2016
2INVESTOR DAY
NOVEMBER 10, 2016
Safe Harbor Statement
Any statements contained in this presentation that are not historical facts are “forward-looking statements.” These statements are based on the current expectations of the management of the company, only speak as of the date on which they are made, and are subject to uncertainty and changes in circumstances.
We undertake no obligation to update or revise forward-looking statements, whether as a result of new information, future events, or otherwise. Forward-looking statements include, without limitation, statements typically containing words such as “intends,” “expects,” “anticipates,” “targets,” “estimates,” and words of similar import. By their nature, forward-looking statements are not guarantees of future performance or results and involve risks and uncertainties because they relate to events and depend on circumstances that will occur in the future.
There are a number of factors that could cause actual results and developments to differ materially from those expressed or implied by such forward-looking statements. These factors include, but are not limited to, those relating to revenue growth of the company, future market strength of the company’s business segments and products, market acceptance of existing products and new product introductions and technology, economic conditions, successful acquisitions, manufacturing and facility utilization efficiencies, risks relating to actions of activist shareholders, and other factors listed in the company’s preliminary offering circular with respect to the notes, dated May 5, 2016. Any “forward-looking statements” in this presentation are intended to qualify for the safe harbor from liability under the Private Securities Litigation Reform Act of 1995.
3INVESTOR DAY
NOVEMBER 10, 2016
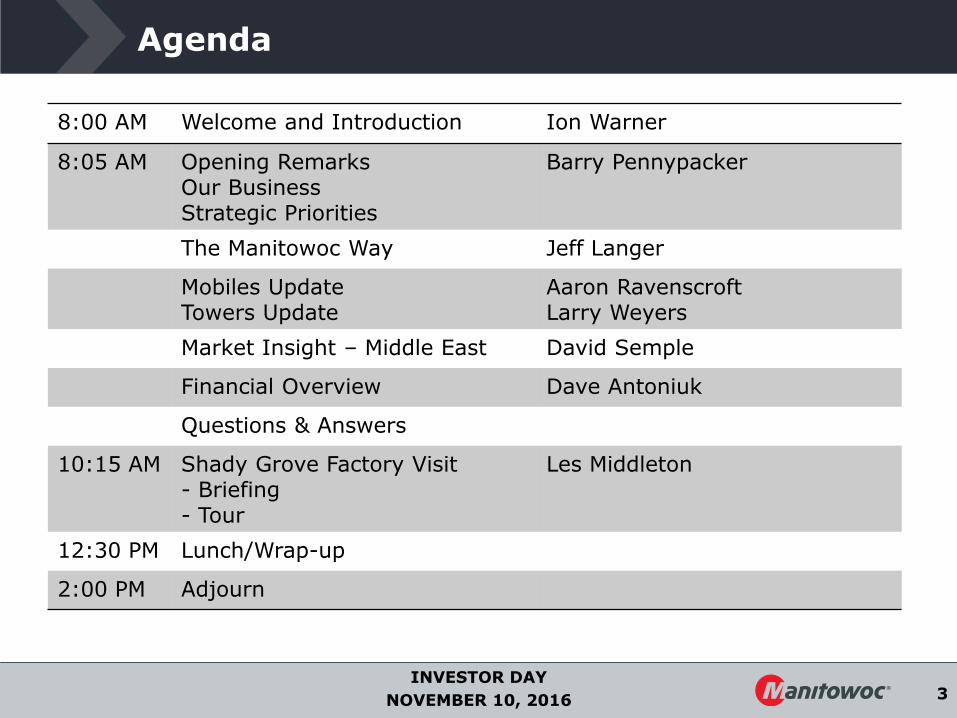
Agenda
8:00 AM Welcome and Introduction Ion Warner
8:05 AM Opening RemarksOur BusinessStrategic Priorities
Barry Pennypacker
The Manitowoc Way Jeff Langer
Mobiles UpdateTowers Update
Aaron RavenscroftLarry Weyers
Market Insight – Middle East David Semple
Financial Overview Dave Antoniuk
Questions & Answers
10:15 AM Shady Grove Factory Visit- Briefing- Tour
Les Middleton
12:30 PM Lunch/Wrap-up
2:00 PM Adjourn
4INVESTOR DAY
NOVEMBER 10, 2016
President & Chief Executive OfficerBarry Pennypacker

5INVESTOR DAY
NOVEMBER 10, 2016
Investment Highlights
Leading Global Crane Manufacturer with industry-leading innovations
Well-positioned to capitalize on opportunities when market improves
Unique aftermarket support drives recurring revenue
Geographically diverse customer and end market base
Executing on strategic priorities to improve margins, earnings, and cash flow
New, Operationally-Focused Team Driving Results
Early stages of transformation to a high quality, higher margin crane company compared to peers

6INVESTOR DAY
NOVEMBER 10, 2016
MTW Summary
• Global leader in lifting equipment
• Serve wide range of end markets
• Broadest product and service offering
• Innovation leader
• Global channel and reach
• Aftermarket solutions
• Financing solutions
Leading crane manufacturer

7INVESTOR DAY
NOVEMBER 10, 2016
Leading Global Crane Company with Well-Known Brands
Government Municipal
All Terrain
Rough Terrain
Truck Mounted
Industrial
Telecrawler
Self Erecting Tower
Top Slewing Tower
Lattice Boom Crawler
Boom Truck
Top Slewing Tower
8INVESTOR DAY
NOVEMBER 10, 2016
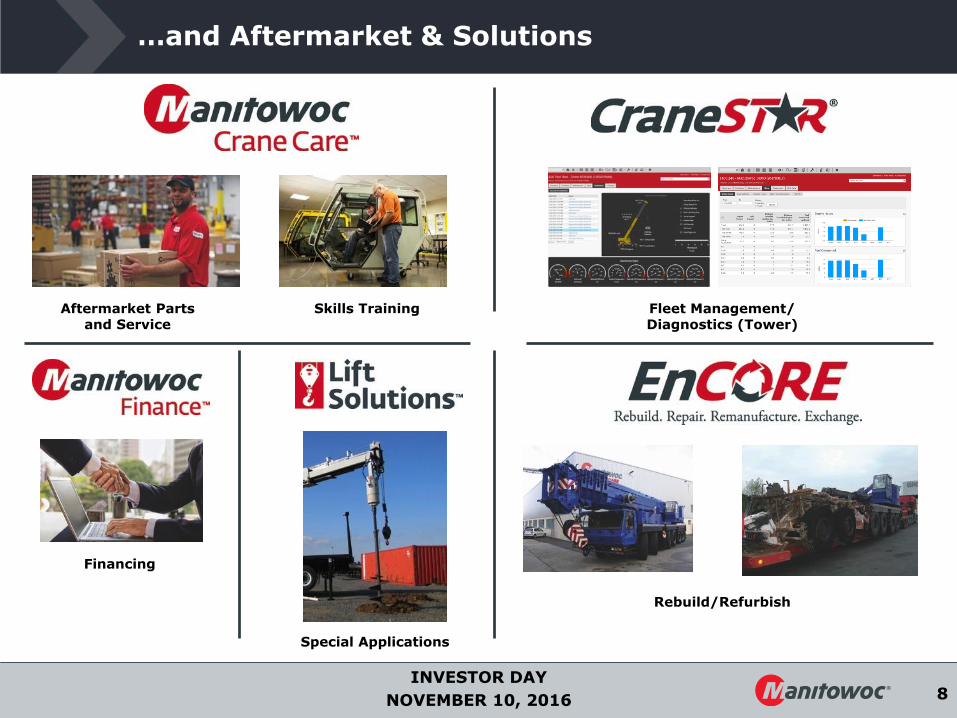
…and Aftermarket & Solutions
Aftermarket Parts and Service
Skills Training
Financing
Rebuild/Refurbish
Special Applications
Fleet Management/Diagnostics (Tower)

9INVESTOR DAY
NOVEMBER 10, 2016
Diversified End Markets and Global
Geographic Exposure
End Markets 1
Americas52%
APAC12%
EMEA36%
1 Includes new equipment sales only.
Growth DriversIndustrial /
Petrochemical35%
Power / Utilities18%
Commercial25%
Residential5%
Infrastructure17%
• Leading brands and products
• Strong distribution channels globally
• Products for wide range of end markets
• Large installed base
• Aftermarket opportunities
• Need for increased lifting capacity and performance
• Energy sector recovery
• Alternative energy sources – e.g., Wind
• Infrastructure investment

10INVESTOR DAY
NOVEMBER 10, 2016
Situational Analysis -- Mobiles
• Uncertainty on industry trough
• Depressed energy markets
• Infrastructure investments
• Lower resale values
• Lower rental rates
• Lower utilization rates
Summary
Persistently weak market conditions; Looking for signs of stabilization
11INVESTOR DAY
NOVEMBER 10, 2016
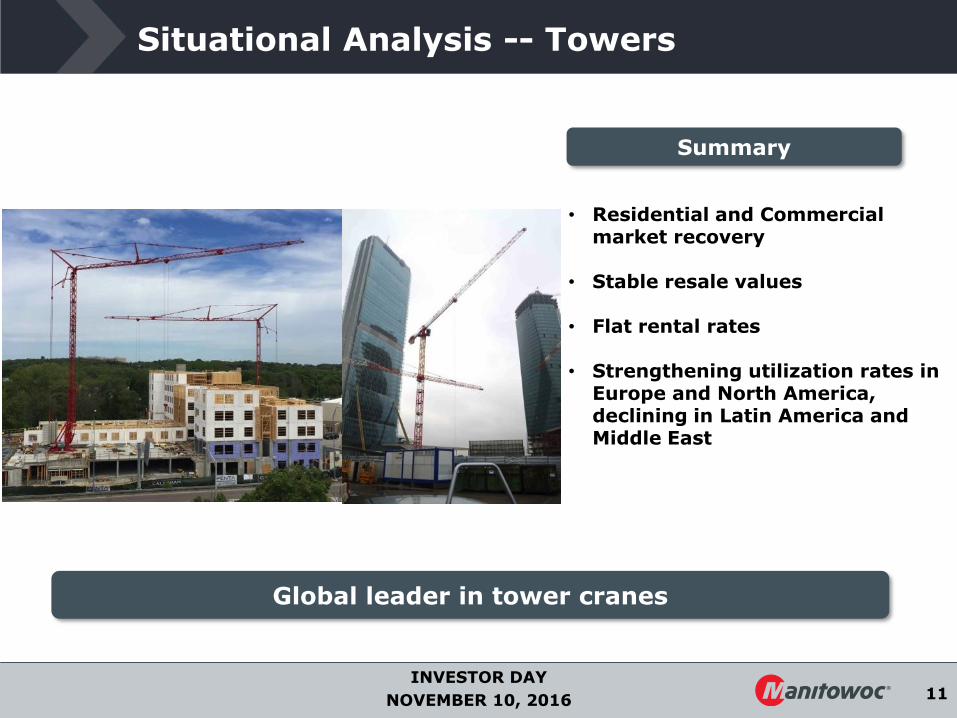
Situational Analysis -- Towers
Summary
Global leader in tower cranes
• Residential and Commercial market recovery
• Stable resale values
• Flat rental rates
• Strengthening utilization rates in Europe and North America, declining in Latin America and Middle East
12INVESTOR DAY
NOVEMBER 10, 2016
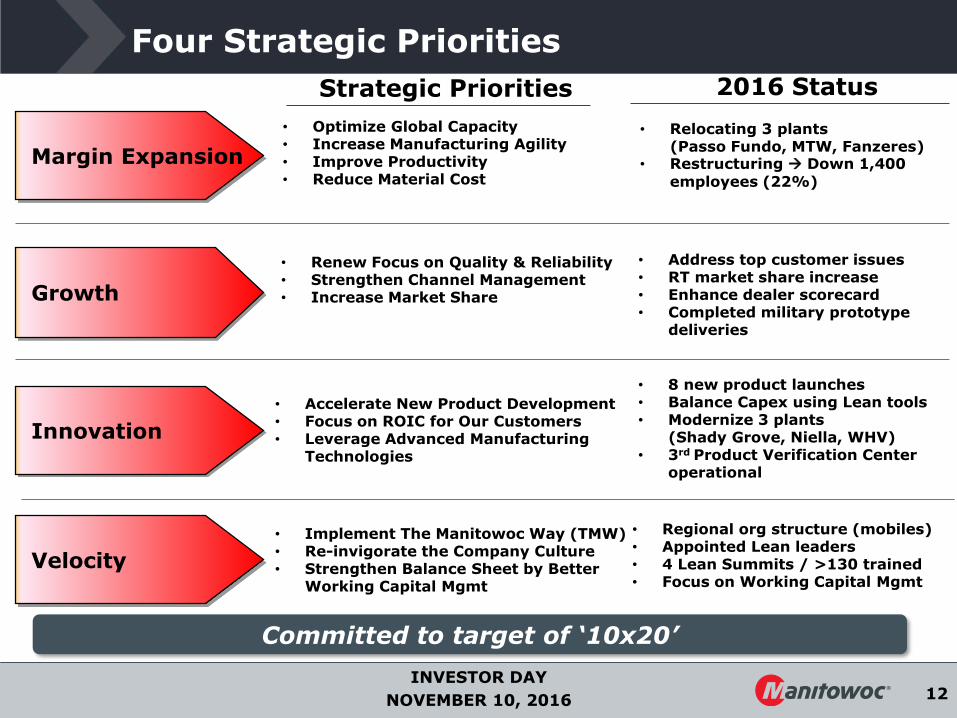
Four Strategic Priorities
• Renew Focus on Quality & Reliability• Strengthen Channel Management• Increase Market Share
• Optimize Global Capacity • Increase Manufacturing Agility• Improve Productivity• Reduce Material Cost
• Accelerate New Product Development• Focus on ROIC for Our Customers• Leverage Advanced Manufacturing
Technologies
Margin Expansion
Growth
Innovation
Velocity
• Implement The Manitowoc Way (TMW)• Re-invigorate the Company Culture• Strengthen Balance Sheet by Better
Working Capital Mgmt
Strategic Priorities 2016 Status
• Address top customer issues• RT market share increase• Enhance dealer scorecard• Completed military prototype
deliveries
• Relocating 3 plants (Passo Fundo, MTW, Fanzeres)
• Restructuring Down 1,400
employees (22%)
• 8 new product launches• Balance Capex using Lean tools• Modernize 3 plants
(Shady Grove, Niella, WHV)• 3rd Product Verification Center
operational
• Regional org structure (mobiles)• Appointed Lean leaders• 4 Lean Summits / >130 trained• Focus on Working Capital Mgmt
Committed to target of ‘10x20’
13INVESTOR DAY
NOVEMBER 10, 2016
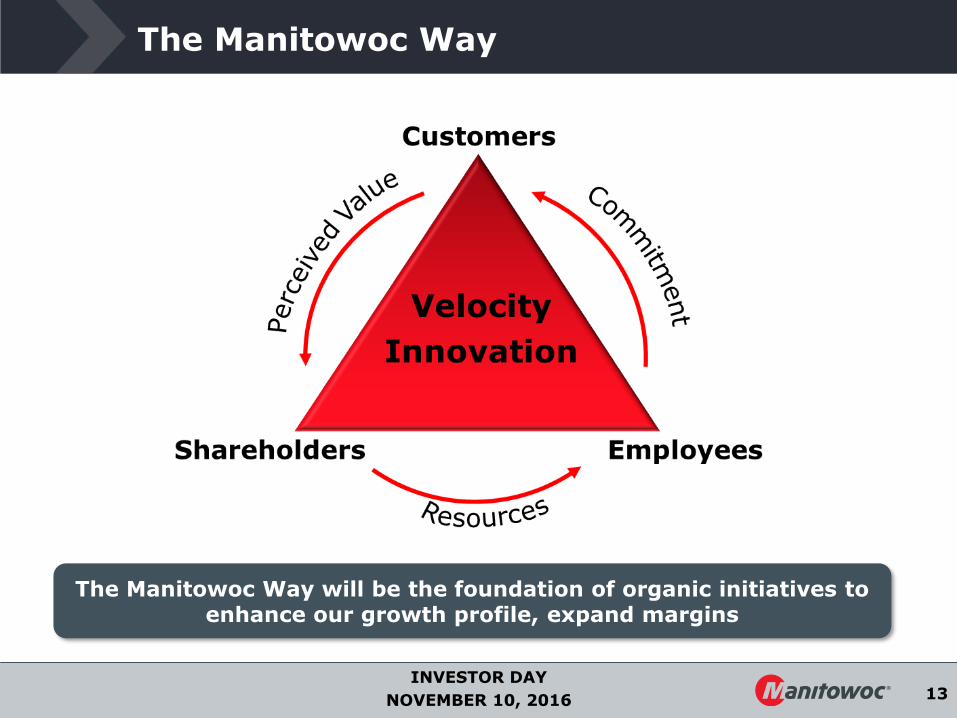
The Manitowoc Way
The Manitowoc Way will be the foundation of organic initiatives to enhance our growth profile, expand margins
14INVESTOR DAY
NOVEMBER 10, 2016
Vice President, The Manitowoc WayJeff Langer

15INVESTOR DAY
NOVEMBER 10, 2016
The Manitowoc Way – Strategy Lean
Corporate StrategicObjectives (CSO)
Strategic Plan(STRAP)
Identify CriticalValue Streams
Value Stream Mapping (VSM)
Current StateFuture StateAction Plan
KaizenSchedule
• Tracked by Priority Deployment(PD)
• Material & Info Flow
• Value Add vs Non-Value Add (VA/NVA) Ratio
• What is critical to the Customer
• Identify Opportunities
• Prioritize Based on Results
STRATEGIC CONTINUOUS IMPROVEMENT

16INVESTOR DAY
NOVEMBER 10, 2016
The Manitowoc Way – 2016 Implementation Plan
• Each Facility will appoint a dedicated Manitowoc Way champion
• Executive Staff members will participate in two Major Kaizen activities per year
• Develop The Manitowoc Way portal site
Publish the Kaizen schedules for each facility Training document library Templates/Forms Contact lists Lessons Learned
17INVESTOR DAY
NOVEMBER 10, 2016
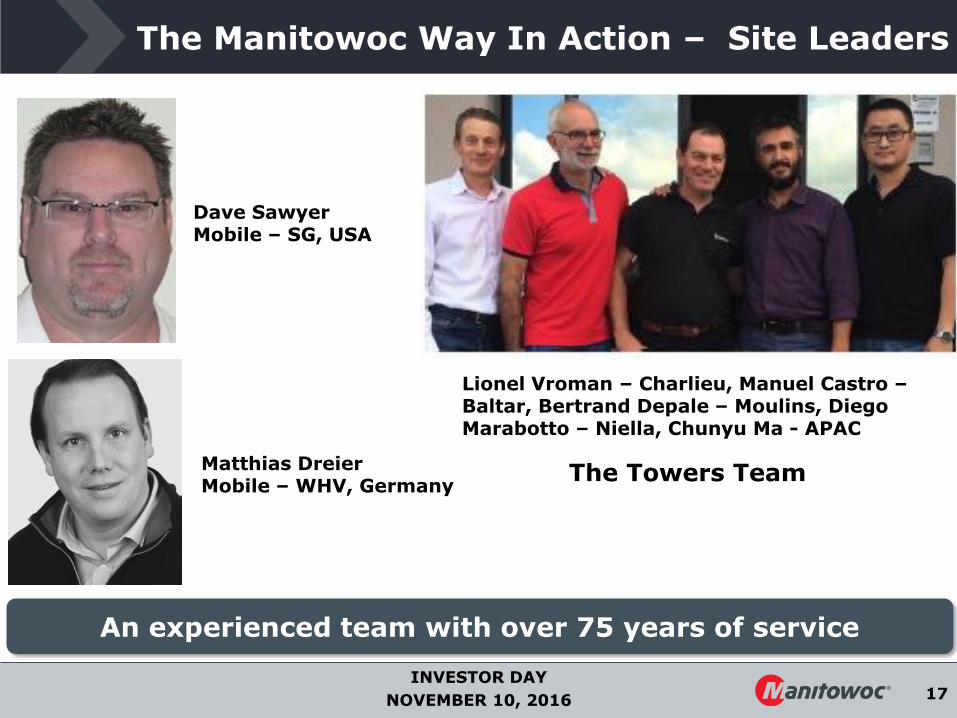
The Manitowoc Way In Action – Site Leaders
The Towers Team
Dave SawyerMobile – SG, USA
Matthias DreierMobile – WHV, Germany
An experienced team with over 75 years of service
Lionel Vroman – Charlieu, Manuel Castro –Baltar, Bertrand Depale – Moulins, Diego Marabotto – Niella, Chunyu Ma - APAC
18INVESTOR DAY
NOVEMBER 10, 2016
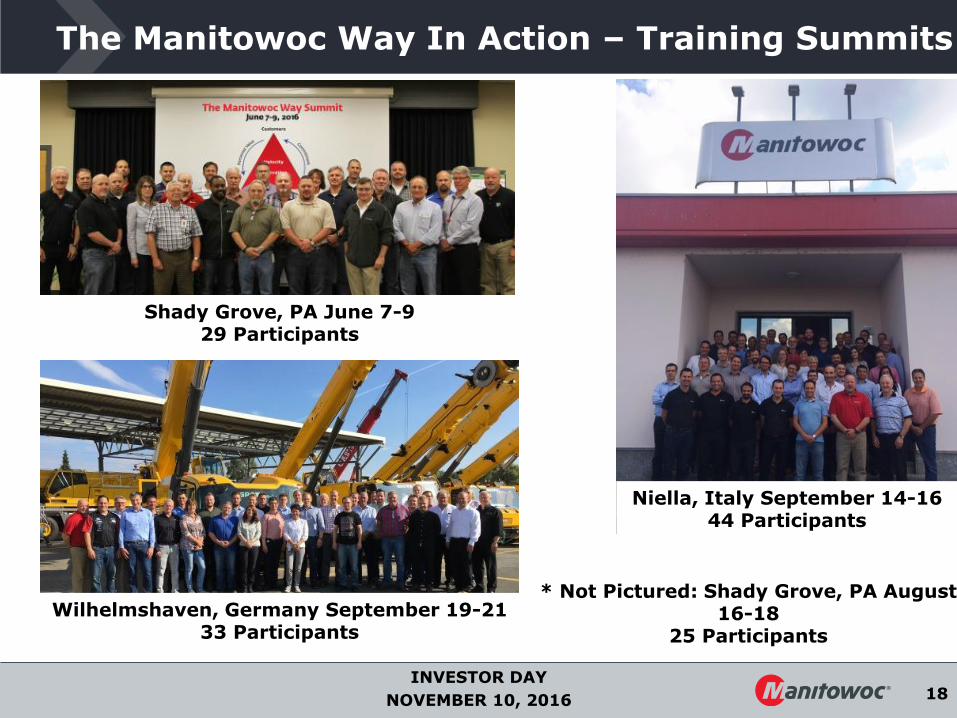
The Manitowoc Way In Action – Training Summits
Niella, Italy September 14-1644 Participants
Wilhelmshaven, Germany September 19-2133 Participants
* Not Pictured: Shady Grove, PA August 16-18
25 Participants
Shady Grove, PA June 7-929 Participants
19INVESTOR DAY
NOVEMBER 10, 2016
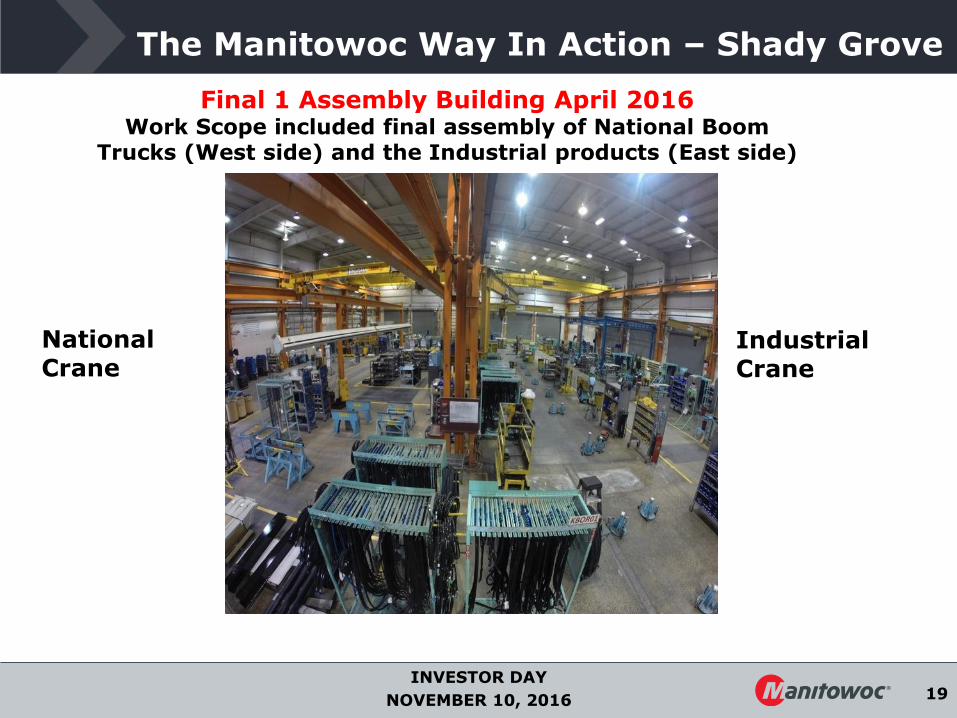
The Manitowoc Way In Action – Shady Grove
Final 1 Assembly Building April 2016Work Scope included final assembly of National Boom
Trucks (West side) and the Industrial products (East side)
National Crane
Industrial Crane
20INVESTOR DAY
NOVEMBER 10, 2016
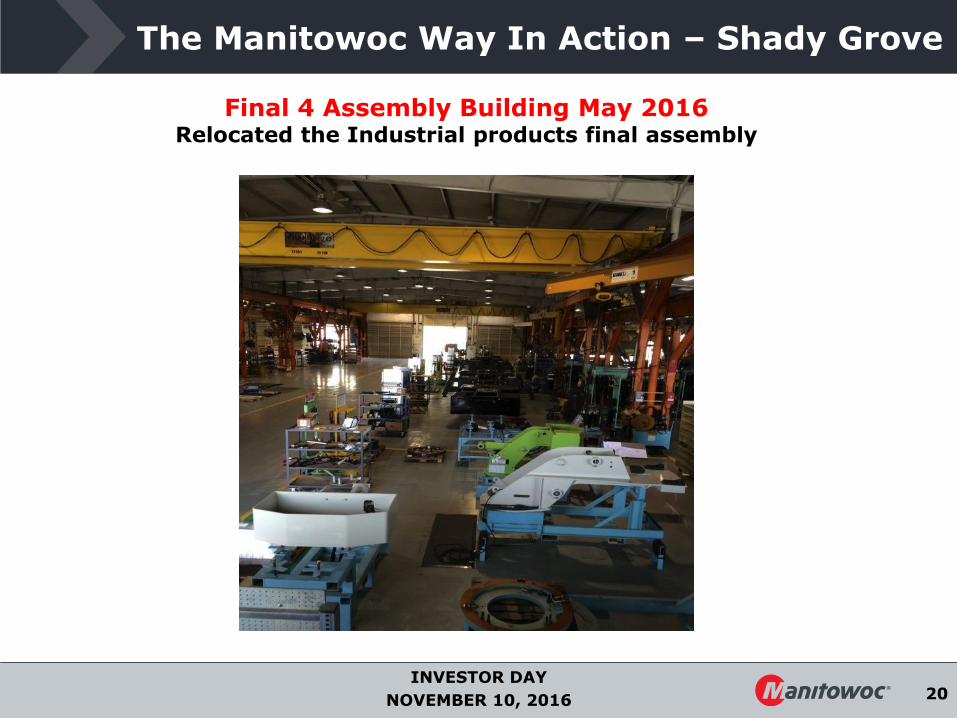
The Manitowoc Way In Action – Shady Grove
Final 4 Assembly Building May 2016Relocated the Industrial products final assembly

21INVESTOR DAY
NOVEMBER 10, 2016
The Manitowoc Way In Action – Shady Grove
Final 2 Assembly Building April 2016TM final assembly with 8 work Stations
Final 1 Assembly Building May 2016Consolidated the TM final assembly from 8 to 4 work stations and relocated it from F2 to F1
Assembly line moves freed up approximately 24,000 sq ft

22INVESTOR DAY
NOVEMBER 10, 2016
The Manitowoc Way In Action – Wilhelmshaven, Germany
Hall 9, Paint shop improvements
Before After
Hall 13, Boom Assembly
23INVESTOR DAY
NOVEMBER 10, 2016
Executive Vice President, MobilesAaron Ravenscroft
24INVESTOR DAY
NOVEMBER 10, 2016
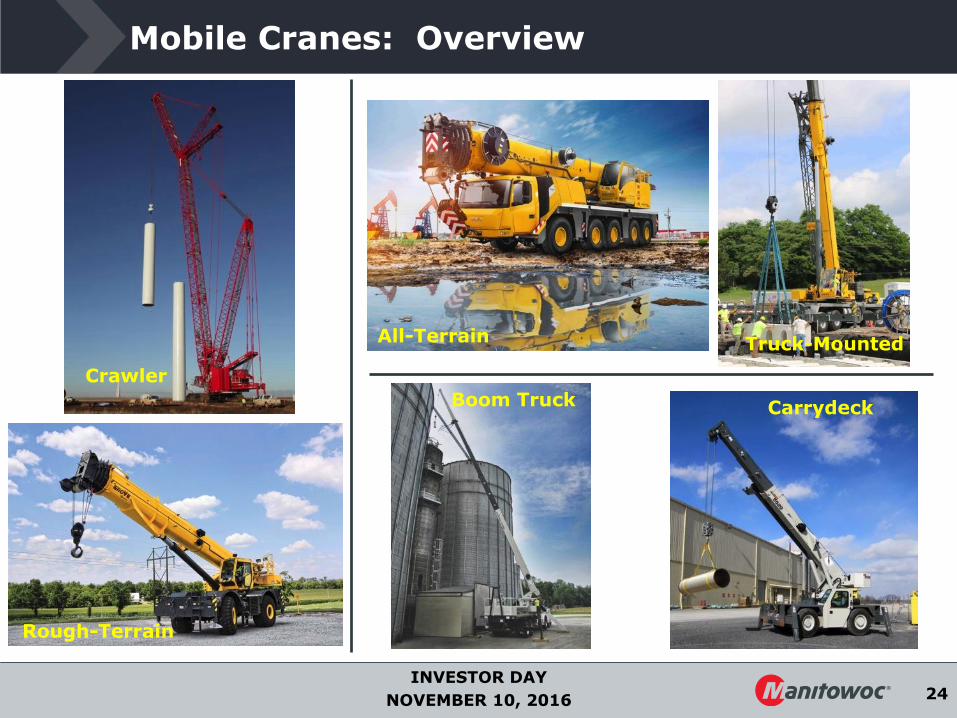
Mobile Cranes: Overview
Carrydeck
All-Terrain
Boom Truck
Rough-Terrain
Crawler
Truck-Mounted
25INVESTOR DAY
NOVEMBER 10, 2016
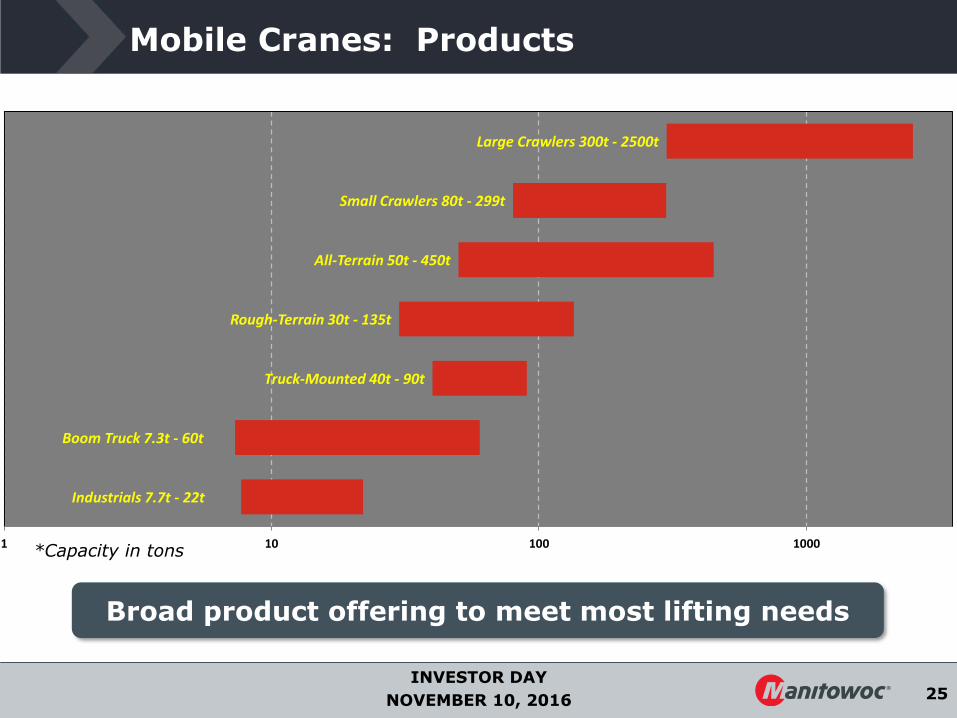
Mobile Cranes: Products
*Capacity in tons
Broad product offering to meet most lifting needs
Industrials 7.7t - 22t
Boom Truck 7.3t - 60t
Truck-Mounted 40t - 90t
Rough-Terrain 30t - 135t
All-Terrain 50t - 450t
Small Crawlers 80t - 299t
Large Crawlers 300t - 2500t
1 10 100 1000
26INVESTOR DAY
NOVEMBER 10, 2016
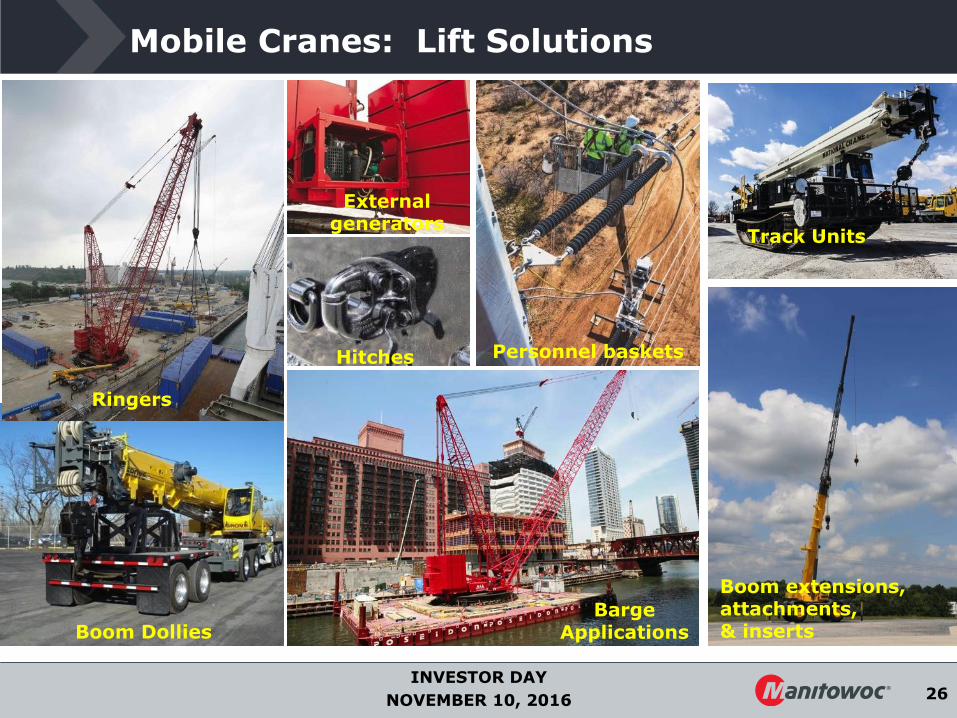
Mobile Cranes: Lift Solutions
Boom Dollies
Hitches
Track Units
Ringers
External generators
Personnel baskets
Boom extensions, attachments, & inserts
Barge Applications

27INVESTOR DAY
NOVEMBER 10, 2016
Mobile Cranes: Manufacturing
• Founded 1947
• 300+ acres
• 1.3 million square feet
• Manufacture rough-terrain,truck-mounted, boom trucks, industrials, and crawler cranes
• Capability: R&D, welding, machining, assembly, testing
• Founded 1946
• 50+ acres
• 410,000 square feet
• Manufacture all-terrain cranes
• Capability: R&D, welding, assembly, testing
Shady Grove, Pennsylvania Wilhelmshaven, Germany

28INVESTOR DAY
NOVEMBER 10, 2016
Mobile Cranes: Market
North America• Weak demand, lower
rental rates, lower utilization rates
APAC• India: fragile demand• SE Asia: slowing down• ANZ: Modest signs of
improvement
Europe • Germany & France stable• UK stable• Southern EU: slight
recovery
Middle East• KSA: liquidity crisis/
Other conflicts • Region: Geopolitical
instability
Africa• Flat to declining demand
LATAM• Depression-like market

29INVESTOR DAY
NOVEMBER 10, 2016
Mobile Strategy
Strategic Priorities
1. Margin Expansion
2. Growth
3. Innovation
4. Velocity
• Optimize Manufacturing footprint• Increase Manufacturing Agility• Reduce Material cost
• Sales Channel Expansion• Aftermarket growth and expansion• Increase Market share via new products
• IPD• Implement the Manitowoc Way• Safety < 1 RIR
• Accelerate New Product Development• Focus on ROIC for our Customers• Leverage advanced manufacturing technologies

30INVESTOR DAY
NOVEMBER 10, 2016
Mobile Cranes: Margin Expansion
• Intent to relocate from Manitowoc, WI to Shady Grove, PA
• Completion: year end 2016
• Cross-functional task force in place to implement plan
Crawler plant relocation
• Annualized pre-tax cost savings: $25-30M
• Cash outflows: $35-50M• Non-cash charges:
Approx. $95-100M
31INVESTOR DAY
NOVEMBER 10, 2016
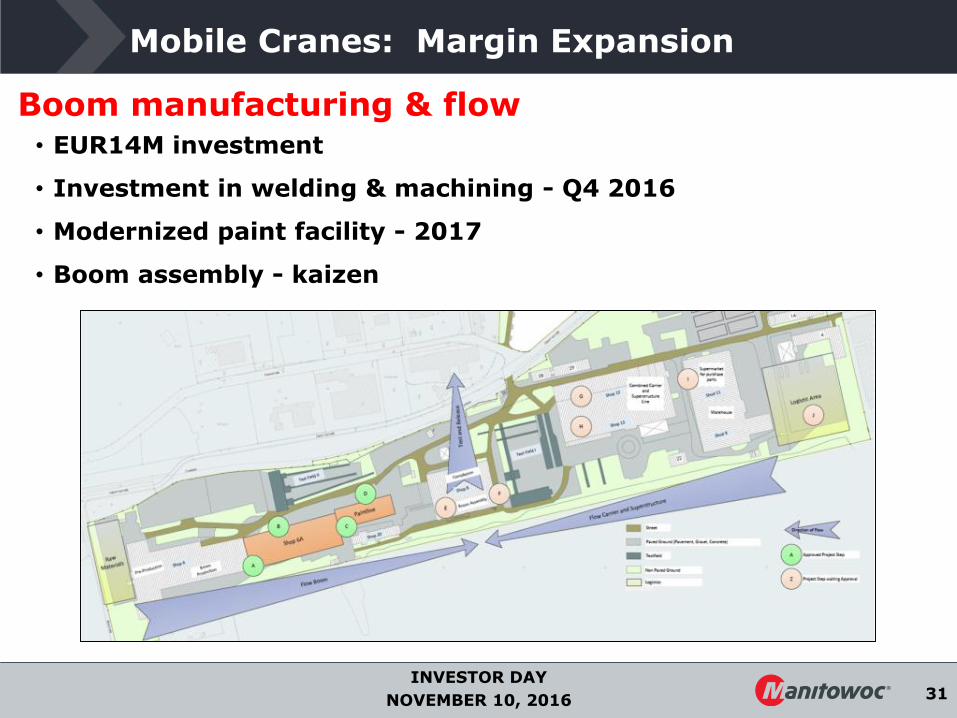
Mobile Cranes: Margin Expansion
• EUR14M investment
• Investment in welding & machining - Q4 2016
• Modernized paint facility - 2017
• Boom assembly - kaizen
Boom manufacturing & flow

32INVESTOR DAY
NOVEMBER 10, 2016
Mobile Cranes: Growth
GMK4060HC
• $192M/5 years; total $270M with 2-year option exercised
• 3 Prototypes completed in Q3 2016
• Government testing starts Nov. 2016
• First production shipments Q4 2017
• Yearly production of 20 units starting 2018
• Long-term aftermarket parts revenue
AT422T Service Life Extension Program (SLEP)
• Pilot Build of 4 Cranes Complete
• Production area ready Q3 2017
• Shipments start Q4 2017
• Estimate 60 Units Delivered Annually
• $75-100M potential
Military
Unique Defense Opportunity
33INVESTOR DAY
NOVEMBER 10, 2016
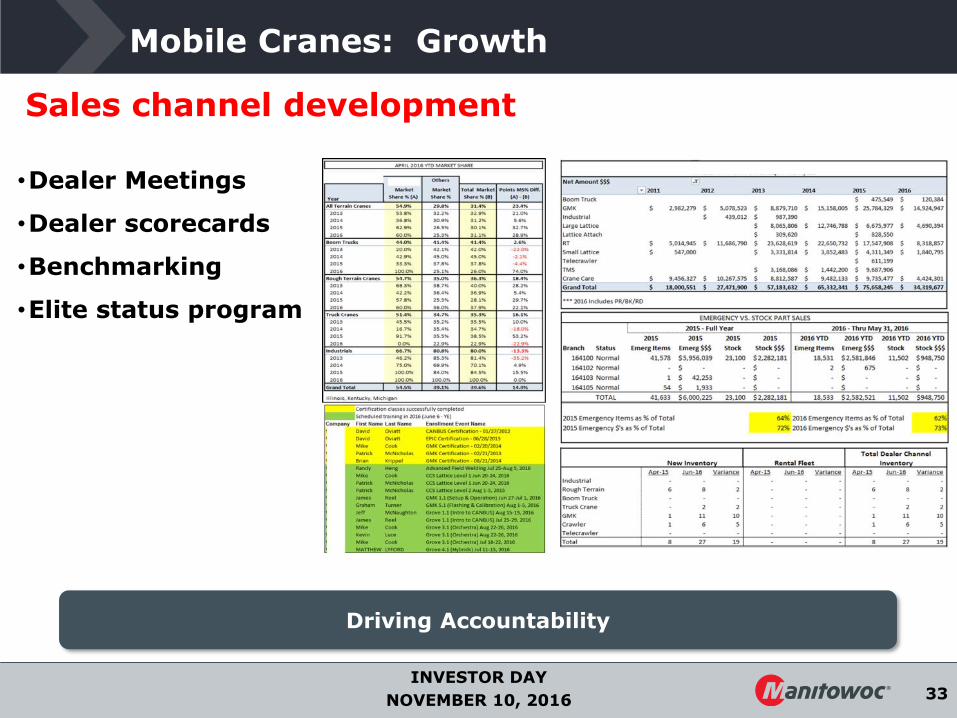
Mobile Cranes: Growth
Driving Accountability
•Dealer Meetings
•Dealer scorecards
•Benchmarking
•Elite status program
Sales channel development
34INVESTOR DAY
NOVEMBER 10, 2016
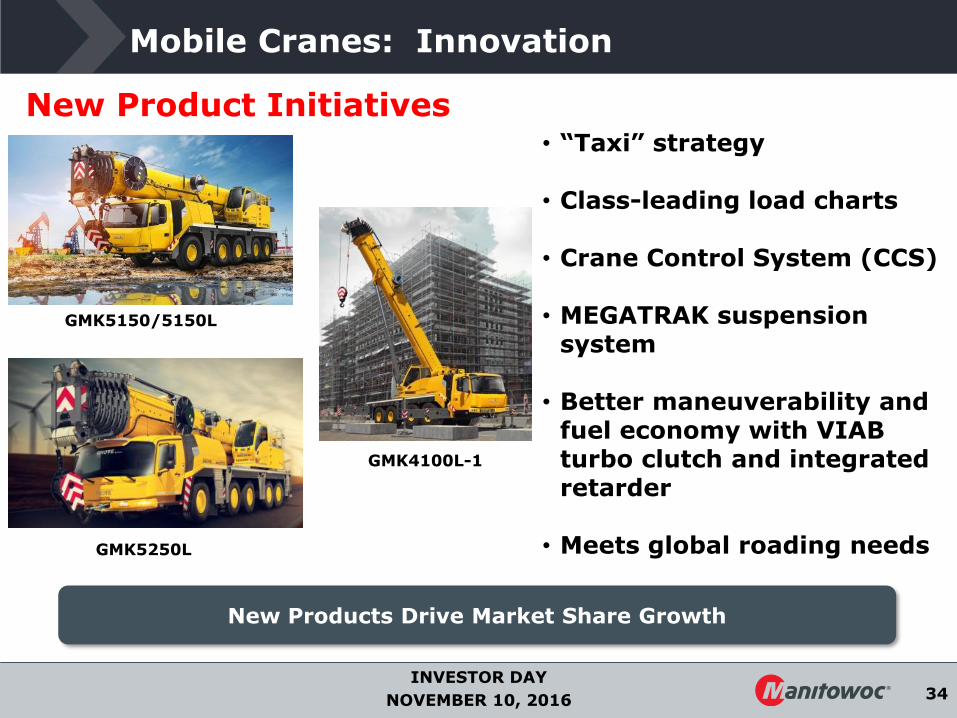
Mobile Cranes: Innovation
New Products Drive Market Share Growth
GMK4100L-1
GMK5150/5150L
GMK5250L
New Product Initiatives• “Taxi” strategy
• Class-leading load charts
• Crane Control System (CCS)
• MEGATRAK suspension system
• Better maneuverability and fuel economy with VIAB turbo clutch and integrated retarder
• Meets global roading needs

35INVESTOR DAY
NOVEMBER 10, 2016
Mobile Cranes: Innovation
New Products Drive Market Share Growth
New Product Initiatives
• Global product strategy
• Greater capacity than competitors – up to 27%
• Full-power booms & best-in-class line pulls
• Crane Control System (CCS)
• Broad jib options; new stowage systems
GRT880
GRT8100
“New” Models

36INVESTOR DAY
NOVEMBER 10, 2016
Mobile Cranes: Velocity
The Team is Accountable & Responsible
IPD process – New mobile crane
• Designated team of 10
• Streamlined IPD process
• VOC – 3 crane operators involved in process
• Goal: class-leading capacity, boom, and load charts
• Launch: ConExpo 2017

37INVESTOR DAY
NOVEMBER 10, 2016
Mobile Cranes: Velocity
• Dedicated Manitowoc Way leaders appointed at each facility
• Executive Staff members will participate in two Major Kaizen activities per year
• The Manitowoc Way portal site
The Manitowoc Way
The Team is Accountable & Responsible

38INVESTOR DAY
NOVEMBER 10, 2016
Executive Vice President, TowersLarry Weyers
39INVESTOR DAY
NOVEMBER 10, 2016
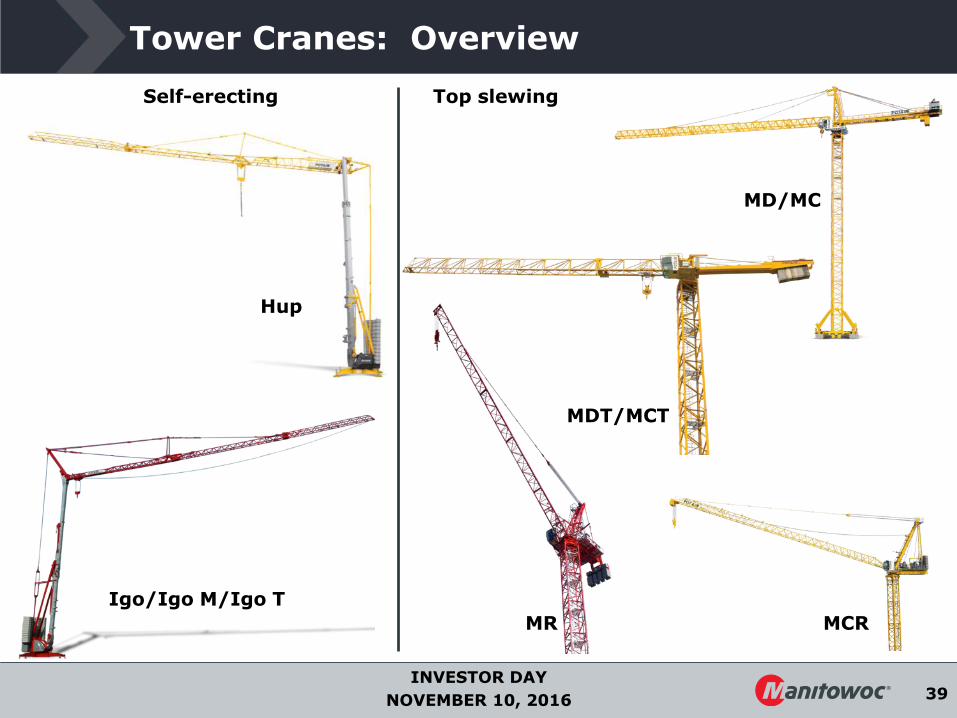
Tower Cranes: Overview
Igo/Igo M/Igo T
Hup
MD/MC
MDT/MCT
MCRMR
Self-erecting Top slewing
40INVESTOR DAY
NOVEMBER 10, 2016
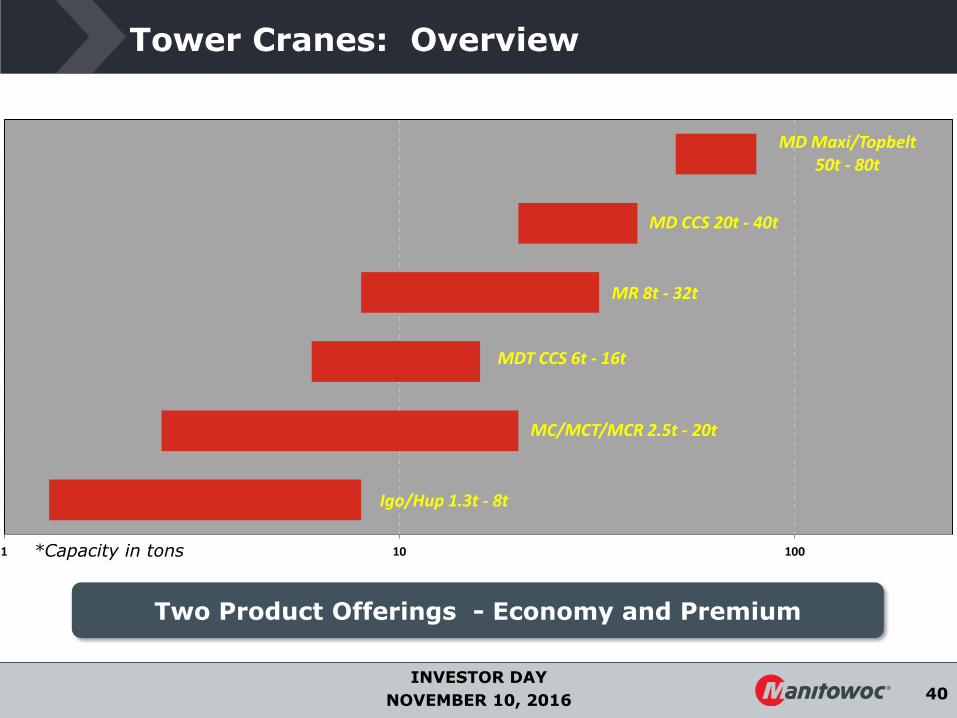
Tower Cranes: Overview
*Capacity in tons
Two Product Offerings - Economy and Premium
Igo/Hup 1.3t - 8t
MC/MCT/MCR 2.5t - 20t
MDT CCS 6t - 16t
MR 8t - 32t
MD CCS 20t - 40t
MD Maxi/Topbelt50t - 80t
1 10 100

41INVESTOR DAY
NOVEMBER 10, 2016
…with Special Applications
Broad product offering for a variety of applications
Internal climbing Anchorages
Dam and bridge construction
42INVESTOR DAY
NOVEMBER 10, 2016
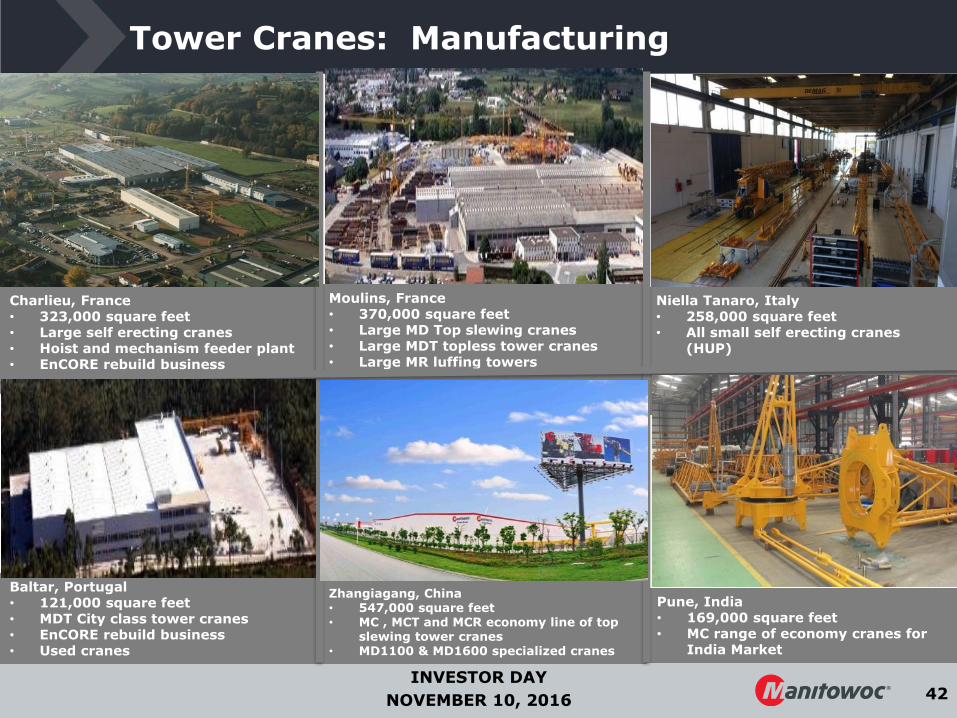
Tower Cranes: Manufacturing
Charlieu, France• 323,000 square feet• Large self erecting cranes • Hoist and mechanism feeder plant• EnCORE rebuild business
Baltar, Portugal• 121,000 square feet• MDT City class tower cranes• EnCORE rebuild business• Used cranes
Moulins, France• 370,000 square feet• Large MD Top slewing cranes• Large MDT topless tower cranes• Large MR luffing towers
Niella Tanaro, Italy• 258,000 square feet• All small self erecting cranes
(HUP)
Zhangiagang, China• 547,000 square feet• MC , MCT and MCR economy line of top
slewing tower cranes• MD1100 & MD1600 specialized cranes
Pune, India• 169,000 square feet• MC range of economy cranes for
India Market

43INVESTOR DAY
NOVEMBER 10, 2016
Tower Cranes: Market
Americas• NA: modest increase,
higher utilization rates• Brazil: depressed• LATAM: impacted by
Brazil slowdown
APAC• China: depressed• S. Korea: high activity• Rest of Asia: growing
Europe• Germany, France: growing
and increasing market share with CCS intro
• Central Europe: slight growth• CIS: activity recovering but
financing remains difficult
Middle East• GCC: slowing down due
to lack of financing• Other: Declining demand
Africa• Declining demand in
some countries, mainly impacting Chinese manufacturers

44INVESTOR DAY
NOVEMBER 10, 2016
Tower Strategy
Strategic Priorities
1. Margin Expansion
2. Growth
3. Innovation
4. Velocity
• Optimize Manufacturing footprint• Increase Manufacturing Agility• Product line rationalization
• Increase Market share via new products• Aftermarket growth and expansion• Used and Crane Rental business• Sales Channel Expansion
• Accelerate New Product Development• Leverage advanced manufacturing
technologies
• IPD• Implement the Manitowoc Way• Safety < 1 RIR
45INVESTOR DAY
NOVEMBER 10, 2016
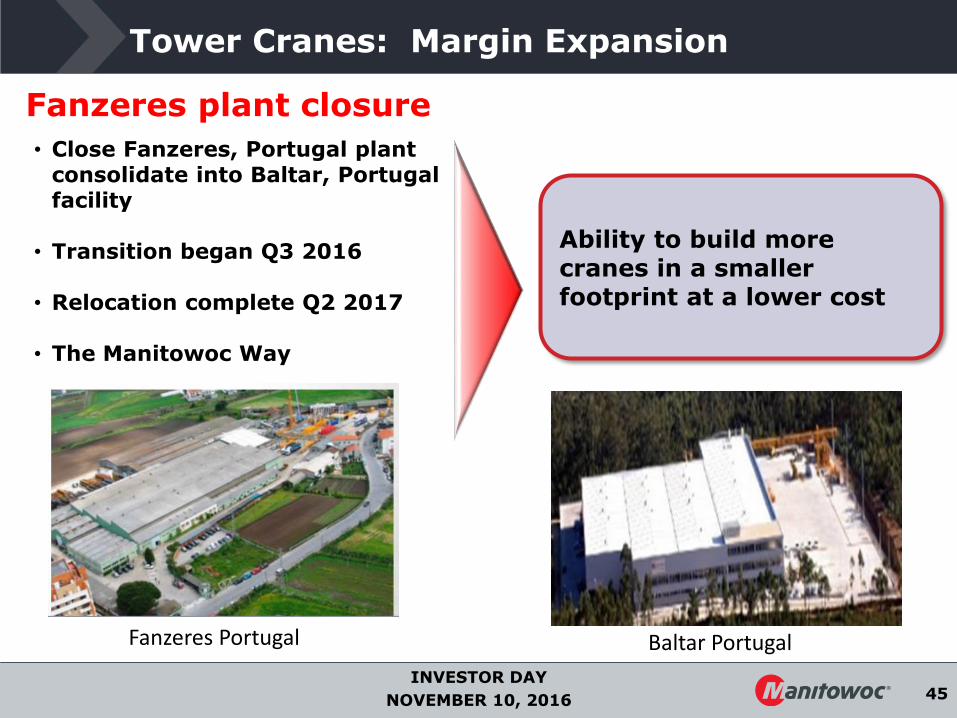
Tower Cranes: Margin Expansion
• Close Fanzeres, Portugal plant consolidate into Baltar, Portugal facility
• Transition began Q3 2016
• Relocation complete Q2 2017
• The Manitowoc Way
Fanzeres plant closure
Ability to build more cranes in a smaller footprint at a lower cost
Baltar PortugalFanzeres Portugal

46INVESTOR DAY
NOVEMBER 10, 2016
Tower Cranes: Margin Expansion
Igo26 Igo30 Igo32 Igo36
6 to 2 models
HUP 32-27Q3 2016 Shipments
Igo42 Igo50
HUP 40-30Q4 2016 Shipments
Product line consolidation drives margin improvement

47INVESTOR DAY
NOVEMBER 10, 2016
Tower Cranes: Margin Expansion
Niella Tanaro, Italy - Transformation Complete
• Optimized material flow - improved VA:NVA ratio
• Modernized paint line w/ auto load system
• Higher productivity with less manpower
• 80% of chassis welding by robot
• Improved Safety
Advanced manufacturing
48INVESTOR DAY
NOVEMBER 10, 2016
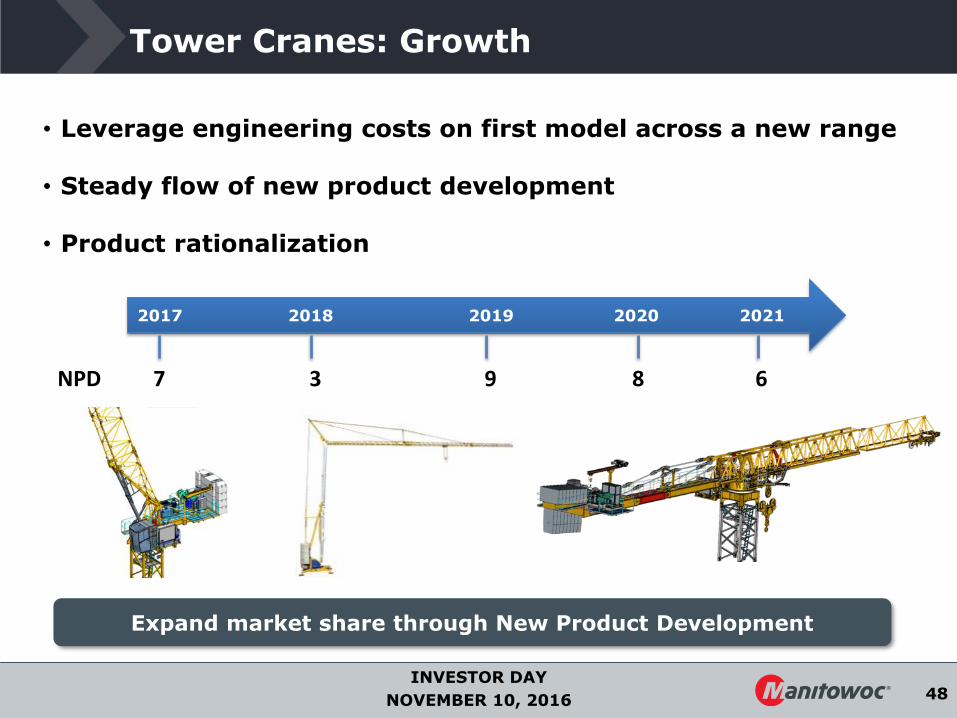
Tower Cranes: Growth
Expand market share through New Product Development
• Leverage engineering costs on first model across a new range
• Steady flow of new product development
• Product rationalization
2017 2018 2019 2020 2021
NPD 7 3 9 8 6

49INVESTOR DAY
NOVEMBER 10, 2016
Tower Cranes: Growth
Comprehensive service and support model and large install base
Aftermarket Growth• Complete value added support model
including crane erection, tie-off engineering, transport and anchorage design.
• Improvement of velocity and capability in service network via CraneStar DIAG and CCS. Diagnose the issue without sending a service technician
• Revenue opportunity from crane passenger lift requirement in Europe above 98 ftheight
• High fill rate driving increased parts sales and customer satisfaction

50INVESTOR DAY
NOVEMBER 10, 2016
Tower Cranes: Growth
Energize secondary market potential
• Reorganize resources to promote double digit growth
• Proactive purchasing
• Unique market positioning
Leverage EnCORE operations & partners
Optimize global sales network Strengthen warranty Tool to enter emerging markets
Used crane business
BEFORE
AFTER

51INVESTOR DAY
NOVEMBER 10, 2016
Tower Cranes: Innovation
Integrated Solution for Operator Lift Requirement
Cablift
• New regulations in France to require operator lift for all tower cranes erected above 98 ft high
• Patent pending integrated crane driver lift
• Replacing current access features (ladders and platforms)
• Used for Tower crane erection assistance and crane cabin access
• Internal vs external allowing higher erection heights
Innovative solution for both new and existing cranes

52INVESTOR DAY
NOVEMBER 10, 2016
Tower Cranes: Velocity
The Manitowoc Way – The foundation of our culture
Lean implementationLean implementation
• Dedicated Manitowoc Way leaders appointed at each facility
• Executive Staff members will participate in two Major Kaizen activities per year
• The Manitowoc Way portal site

53INVESTOR DAY
NOVEMBER 10, 2016
Vice President, Sales – Middle East and Asia PacificDavid Semple
54INVESTOR DAY
NOVEMBER 10, 2016
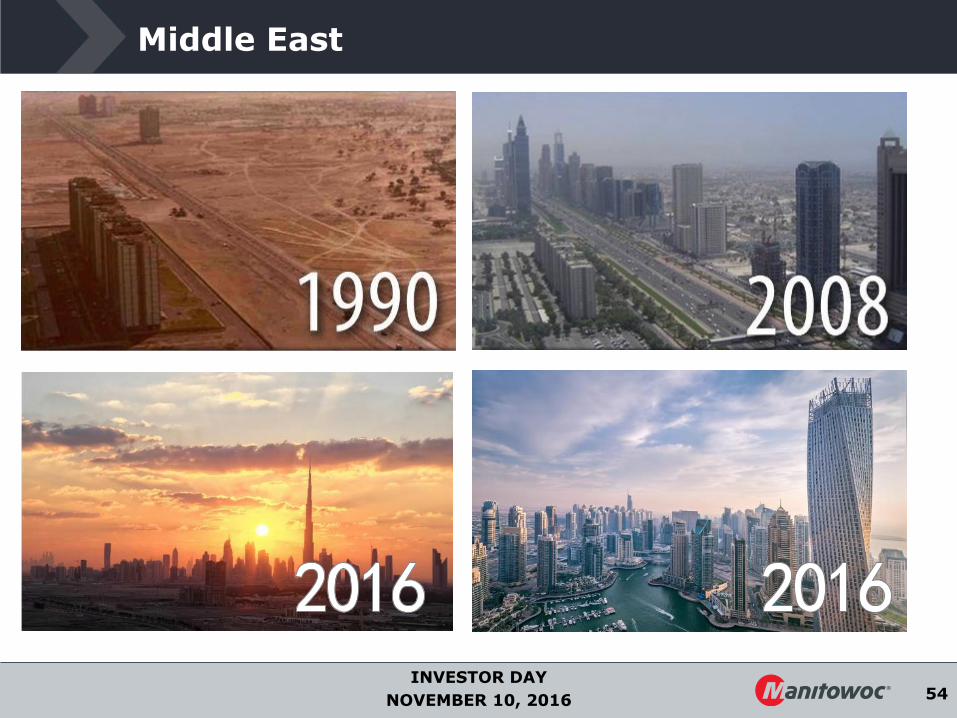
Middle East
55INVESTOR DAY
NOVEMBER 10, 2016
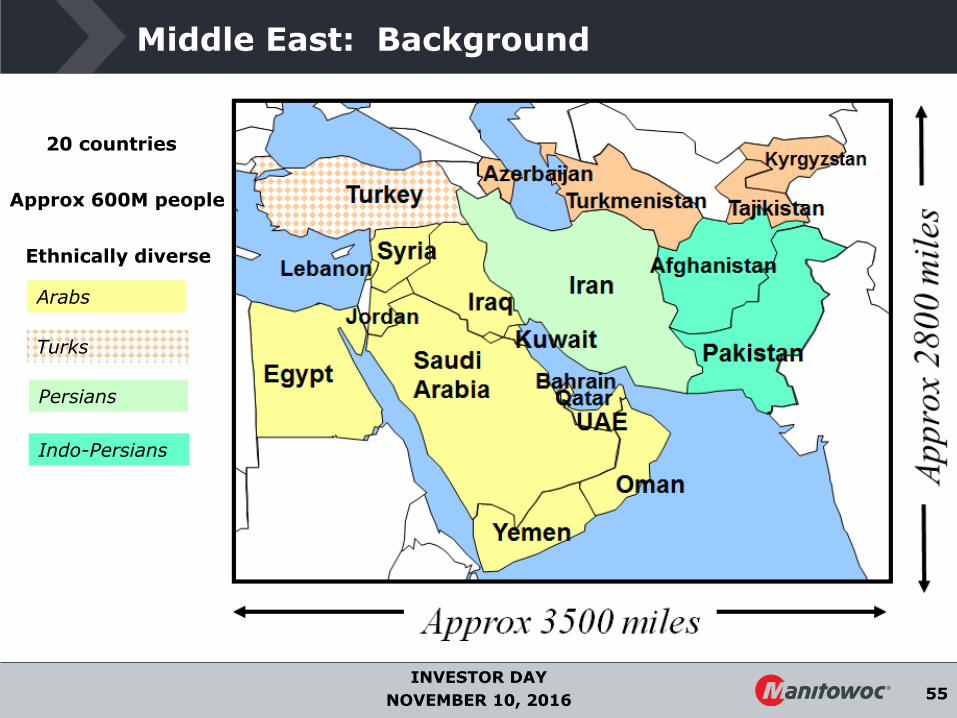
Middle East: Background
20 countries
Arabs
Turks
Persians
Indo-Persians
Ethnically diverse
Approx 600M people

56INVESTOR DAY
NOVEMBER 10, 2016
Middle East: Background
Cost to produce 1 barrel of oil
Source: UCube by Rystad Energy; Interactive published Nov. 23, 2015
$10 $20 $30 $40 $50
Extraction costs of oil from the Middle-East : 1/5 of the current oil price…

57INVESTOR DAY
NOVEMBER 10, 2016
Middle East: Background
0 50 100 150 200
SYRIA
BAHRAIN
YEMEN
PAKISTAN
TURKMENISTAN
AZERBAIJAN
EGYPT
OMAN
QATAR
KUWAIT
IRAQ
UAE
IRAN
SAUDI ARABIA
Billion USD
Yearly income potential from Oil & Gas(assuming $50/b for oil and $3/mBTU for gas)
income from Gas (Bn$/y)
income from Oil (Bn$/y)
* Saudi Arabia, UAE, Kuwait, Qatar, Iraq:
Total yearly O&G income~$450B
Less costs of extraction~$100B
Net ~$350B
*
*
*
*
*
Half of world’s oil reserves/one-third of world’s gas reserves

58INVESTOR DAY
NOVEMBER 10, 2016
2011 – 2012 – 2013 – 2014 – 2015 - 2016
Negative
Impact
on o
ur
busin
ess
Arab SpringEgypt, Bahrain, Yemen, Syria,
Peak impact late 2012
TurkeyGezi Park protestsSummer 2013
ISIS in parts of IraqSummer 2014
Saudi war in YemenQ1-2015
Dealing with « structural instability »
Saudi / Iran relationship ?
Middle East: Political Instability

59INVESTOR DAY
NOVEMBER 10, 2016
Middle East: Manitowoc
• Grove, Potain, & Manitowoc brands popular since the 1960s• 2007: Opened in Jebel Ali Free Zone, Dubai• 35 employees, ~ $200M of business in the region
60INVESTOR DAY
NOVEMBER 10, 2016
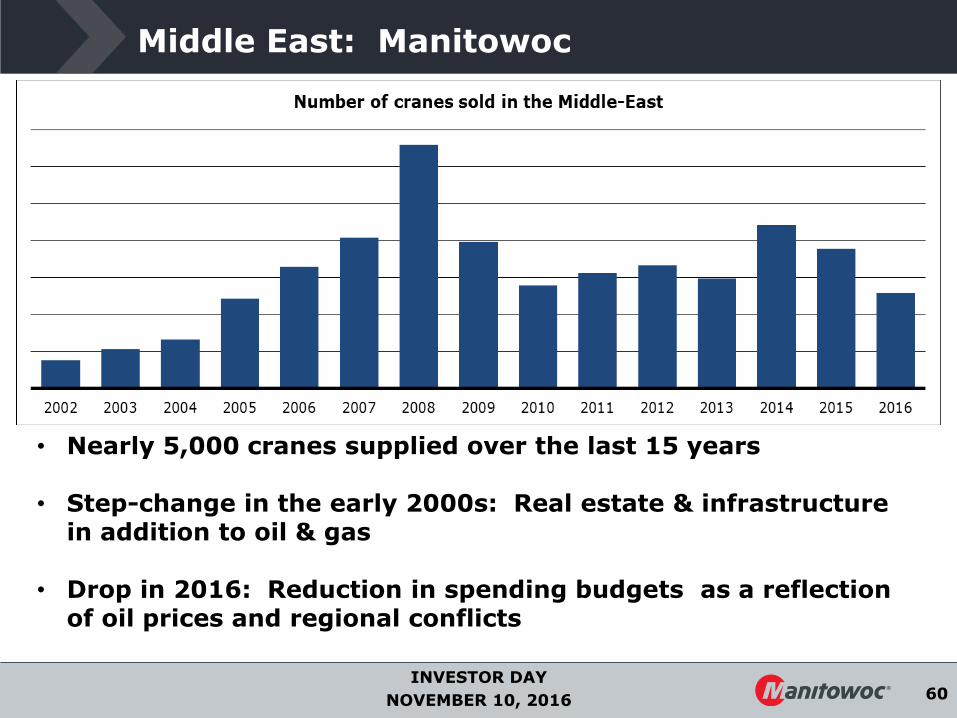
Middle East: Manitowoc
• Nearly 5,000 cranes supplied over the last 15 years
• Step-change in the early 2000s: Real estate & infrastructure in addition to oil & gas
• Drop in 2016: Reduction in spending budgets as a reflectionof oil prices and regional conflicts

61INVESTOR DAY
NOVEMBER 10, 2016
Middle East: Long-Term

62INVESTOR DAY
NOVEMBER 10, 2016
Middle East: Thank you !

63INVESTOR DAY
NOVEMBER 10, 2016
Senior Vice President & Chief Financial OfficerDave Antoniuk

64INVESTOR DAY
NOVEMBER 10, 2016
Finance Overview
New Operationally-Focused Leadership Team Driving Transformation
Ability to manage the cycle… contingency planning
Margin expansion commitment… “The Manitowoc Way”
Laser focus on cash… Disciplined working capital management
Role of Finance… Business partner, transparency, conservatism, balance sheet clean-up
Focused on Liquidity & Earnings Growth

65INVESTOR DAY
NOVEMBER 10, 2016
$-
$500
$1,000
$1,500
$2,000
$2,500
$3,000
$3,500
1st
Qtr
-03
2n
d Q
tr-0
3
3rd
Qtr
-03
4th
Qtr
-03
1st
Qtr
-04
2n
d Q
tr-0
4
3rd
Qtr
-04
4th
Qtr
-04
1st
Qtr
-05
2n
d Q
tr-0
5
3rd
Qtr
-05
4th
Qtr
-05
1st
Qtr
-06
2n
d Q
tr-0
6
3rd
Qtr
-06
4th
Qtr
-06
1st
Qtr
-07
2n
d Q
tr-0
7
3rd
Qtr
-07
4th
Qtr
-07
1st
Qtr
-08
2n
d Q
tr-0
8
3rd
Qtr
-08
4th
Qtr
-08
1st
Qtr
-09
2n
d Q
tr-0
9
3rd
Qtr
-09
4th
Qtr
-09
1st
Qtr
-10
2n
d Q
tr-1
0
3rd
Qtr
-10
4th
Qtr
-10
1st
Qtr
-11
2n
d Q
tr-1
1
3rd
Qtr
-11
4th
Qtr
-11
1st
Qtr
-12
2n
d Q
tr-1
2
3rd
Qtr
-12
4th
Qtr
-12
1st
Qtr
-13
2n
d Q
tr-1
3
3rd
Qtr
-13
4th
Qtr
-13
1st
Qtr
-14
2n
d Q
tr-1
4
3rd
Qtr
-14
4th
Qtr
-14
1st
Qtr
-15
2n
d Q
tr-1
5
3rd
Qtr
-15
4th
Qtr
-15
1st
Qtr
-16
2n
d Q
tr-1
6
3rd
Qtr
-16
Orders Backlog
Cyclicality of The Business
Weathering the Downside of the Cycle
($ Millions)

66INVESTOR DAY
NOVEMBER 10, 2016
Reinvigorated Operational Focus
Prepared for Economic Volatility
Innovation
↓ 1,400 Employees,
22% reduction
Relocate3 plants
Hup 40-30, GMK5250L,
GMK4100L-1, GRT8100
$270M U.S. Army
Contract
Margin Expansion
Lean transformations
in U.S., Germany, Italy
Next generation crane; intro at ConExpo 2017
Velocity Growth
The Manitowoc Way
67INVESTOR DAY
NOVEMBER 10, 2016
0.0%
1.0%
2.0%
3.0%
4.0%
5.0%
6.0%
7.0%
$-
$5
$10
$15
$20
$25
$30
Q1 2015 Q2 2015 Q3 2015 Q4 2015 Q1 2016 Q2 2016 Q3 2016*
EBITDA EBITDA/ Rev
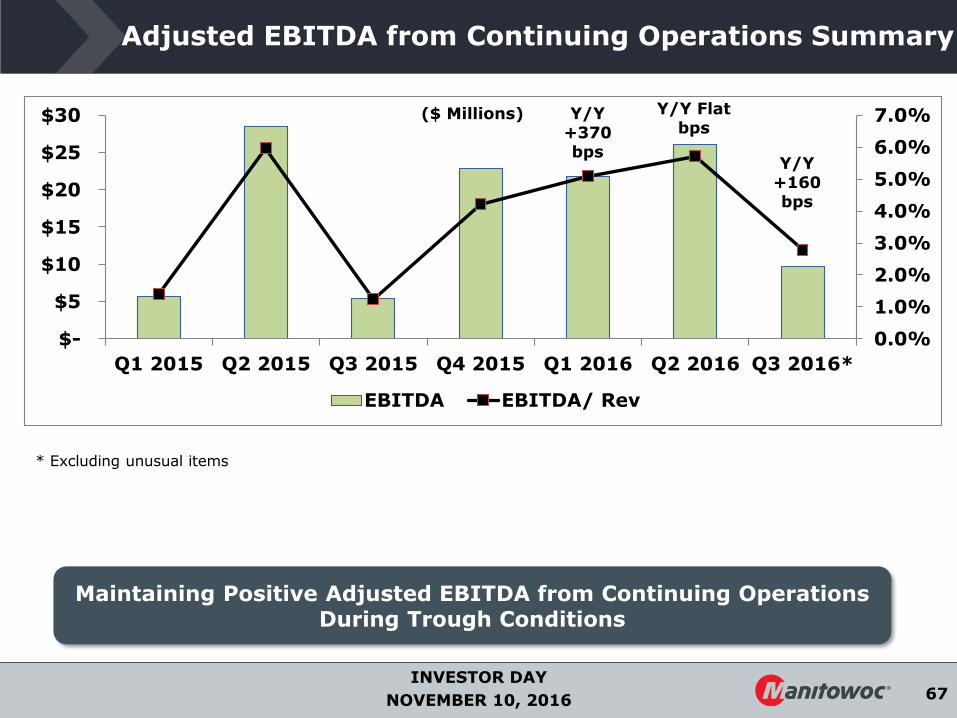
Adjusted EBITDA from Continuing Operations Summary
Maintaining Positive Adjusted EBITDA from Continuing Operations During Trough Conditions
* Excluding unusual items
($ Millions) Y/Y +370 bps
Y/Y +160 bps
Y/Y Flat bps
68INVESTOR DAY
NOVEMBER 10, 2016
$-
$100
$200
$300
$400
$500
$600
$700
Mar
2014
Jun
2014
Sep
2014
Dec
2014
Mar
2015
Jun
2015
Sep
2015
Dec
2015
Mar
2016
Jun
2016
Sep
2016
Dec
2016
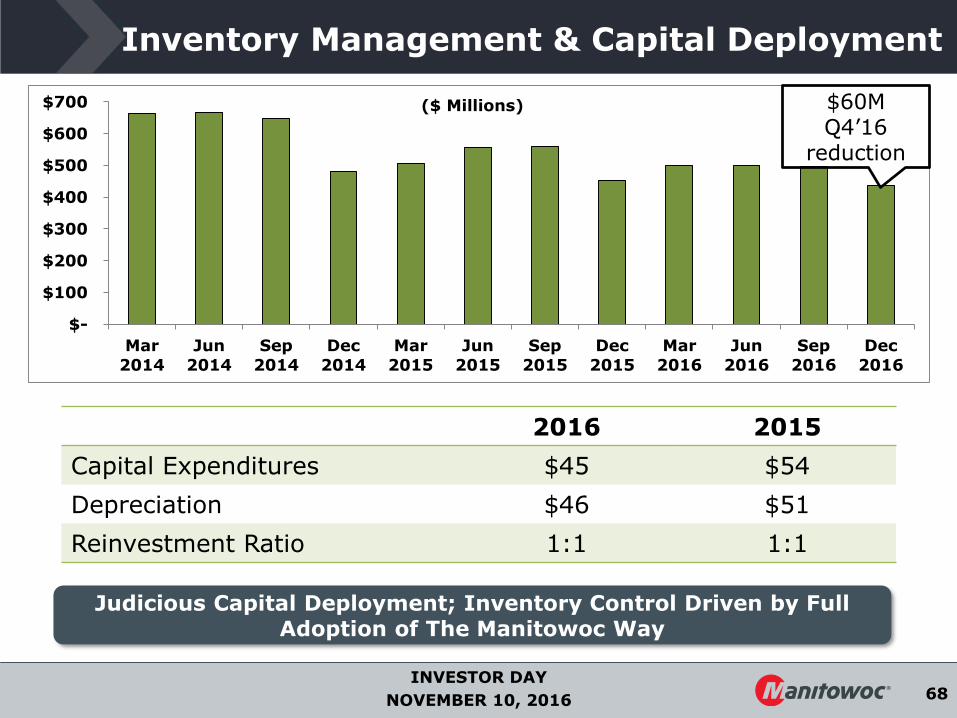
Inventory Management & Capital Deployment
Judicious Capital Deployment; Inventory Control Driven by Full Adoption of The Manitowoc Way
2016 2015
Capital Expenditures $45 $54
Depreciation $46 $51
Reinvestment Ratio 1:1 1:1
$60M Q4’16
reduction
($ Millions)
69INVESTOR DAY
NOVEMBER 10, 2016
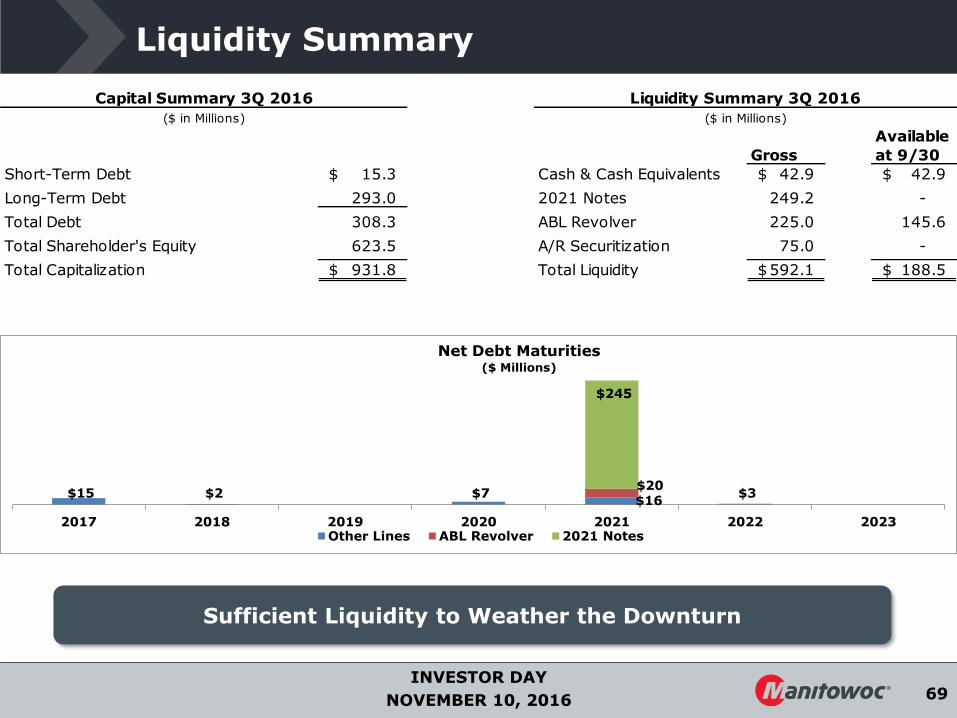
Liquidity Summary
Sufficient Liquidity to Weather the Downturn
$15 $2 $7 $16
$3 $20
$245
2017 2018 2019 2020 2021 2022 2023
Net Debt Maturities($ Millions)
Other Lines ABL Revolver 2021 Notes
Gross
Available
at 9/30
Short-Term Debt 15.3$ Cash & Cash Equivalents 42.9$ 42.9$
Long-Term Debt 293.0 2021 Notes 249.2 -
Total Debt 308.3 ABL Revolver 225.0 145.6
Total Shareholder's Equity 623.5 A/R Securitization 75.0 -
Total Capitalization 931.8$ Total Liquidity 592.1$ 188.5$
Capital Summary 3Q 2016
($ in Millions)
Liquidity Summary 3Q 2016
($ in Millions)

70INVESTOR DAY
NOVEMBER 10, 2016
Internal Long-Term Financial Goals
“10 x 20”
Financial Metrics 2015 2016 5-Year Target
Revenue $1.9B ~$1.6B $1.8- $2.0B
Adjusted Operating Margin 0.6% ~ (1)-(2) % 10%
Assumes Normalized Market Growth
Continued Margin Expansion… The Manitowoc Way
>100% Cash Conversion… Utilize Tax NOL’s
71INVESTOR DAY
NOVEMBER 10, 2016
Questions & Answers
72INVESTOR DAY
NOVEMBER 10, 2016
Senior Vice President, The AmericasLes Middleton
73INVESTOR DAY
NOVEMBER 10, 2016
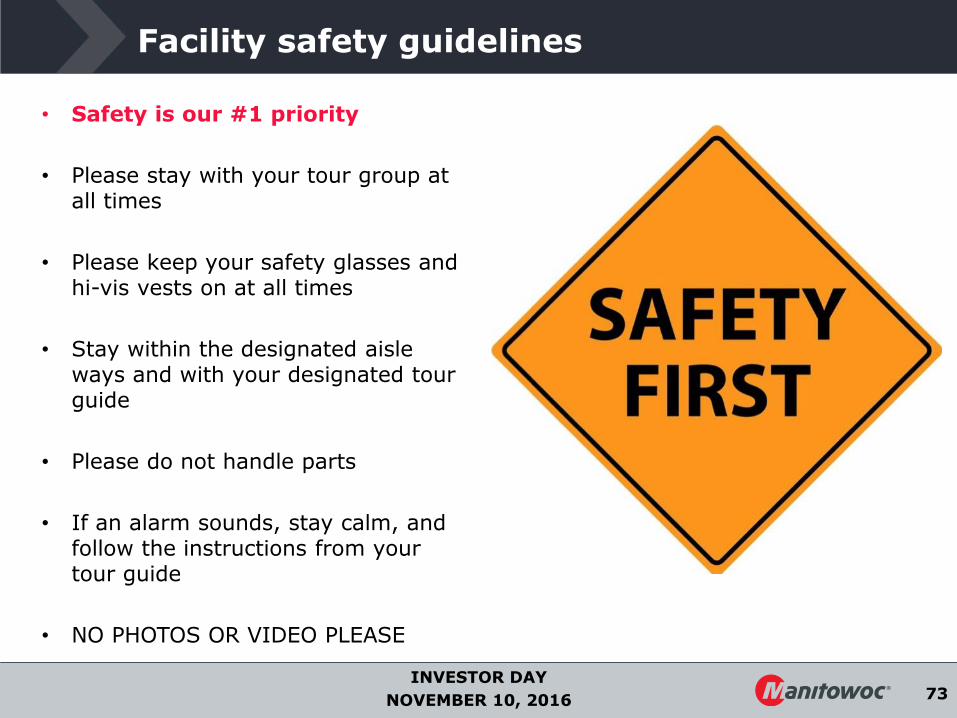
• Safety is our #1 priority
• Please stay with your tour group at all times
• Please keep your safety glasses and hi-vis vests on at all times
• Stay within the designated aisle ways and with your designated tour guide
• Please do not handle parts
• If an alarm sounds, stay calm, and follow the instructions from your tour guide
• NO PHOTOS OR VIDEO PLEASE
Facility safety guidelines
74INVESTOR DAY
NOVEMBER 10, 2016
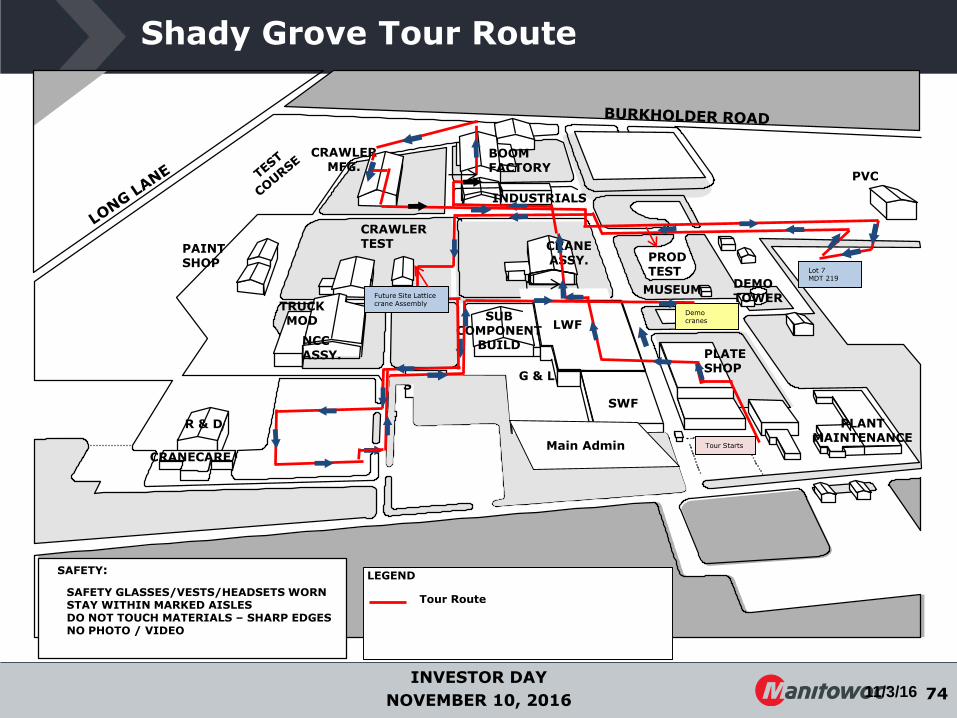
Shady Grove Tour Route
11/3/16
STORE
NCC ASSY.
CRANE ASSY.
BOOM FACTORY
PLATE SHOP
SWF
SUB COMPONENT
BUILD
LWF
MAIN OFFICE
PLANT MAINTENANCE
PAINT SHOP
MUSEUM
PROD TEST
PVC
DEMO TOWER
INDUSTRIALS
CRANECARE
CRAWLER MFG.
SAFETY GLASSES/VESTS/HEADSETS WORNSTAY WITHIN MARKED AISLESDO NOT TOUCH MATERIALS – SHARP EDGESNO PHOTO / VIDEO
TRUCK MOD
SAFETY:
G & L
Demo cranes
LEGEND
R & D
Lot 7MDT 219
Main Admin
Tour Route
Future Site Lattice crane Assembly
CRAWLER TEST
Tour Starts

INVESTOR DAY
NOVEMBER 10, 2016
Appendix: Additional Materials and Financials

76INVESTOR DAY
NOVEMBER 10, 2016
Manitowoc: Large Installed Base
~55,000 7-9 years
~50,0003 Self-Erecting: 6-8 yearsTop-Slewing: 10-12 years
~9,000 9-12 years
~27,000 7-9 years
Mobile Telescopic Cranes
Tower Cranes
Lattice-Boom Cranes
Boom Trucks
Leading Brands Active Installed Base1Category
Extensive installed base across diverse geographies provides recurring service and replacement parts revenue opportunities
1 Reflects management approximation of the active installed base based on internally available data.2 Reflects management approximation of the average fleet replacement based on available data and feedback from the customers.3 Includes top-slewing and self-erecting tower cranes.
Average Fleet Replacement2
Total: ~140,000
77INVESTOR DAY
NOVEMBER 10, 2016
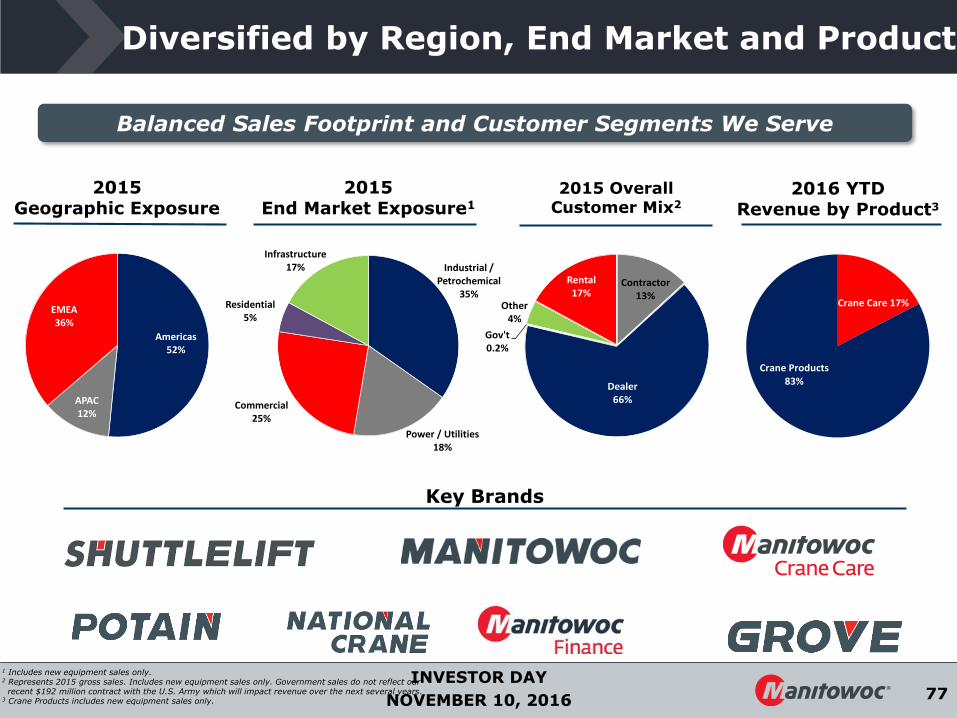
Diversified by Region, End Market and Product
Key Brands
2015Geographic Exposure
2015End Market Exposure1
2016 YTDRevenue by Product3
Americas52%
APAC12%
EMEA36%
1 Includes new equipment sales only.2 Represents 2015 gross sales. Includes new equipment sales only. Government sales do not reflect our recent $192 million contract with the U.S. Army which will impact revenue over the next several years.
3 Crane Products includes new equipment sales only.
Balanced Sales Footprint and Customer Segments We Serve
2015 Overall Customer Mix2
Industrial / Petrochemical
35%
Power / Utilities18%
Commercial25%
Residential5%
Infrastructure17%
Contractor13%
Dealer66%
Gov't0.2%
Other4%
Rental17%
Crane Care 17%
Crane Products 83%
78INVESTOR DAY
NOVEMBER 10, 2016
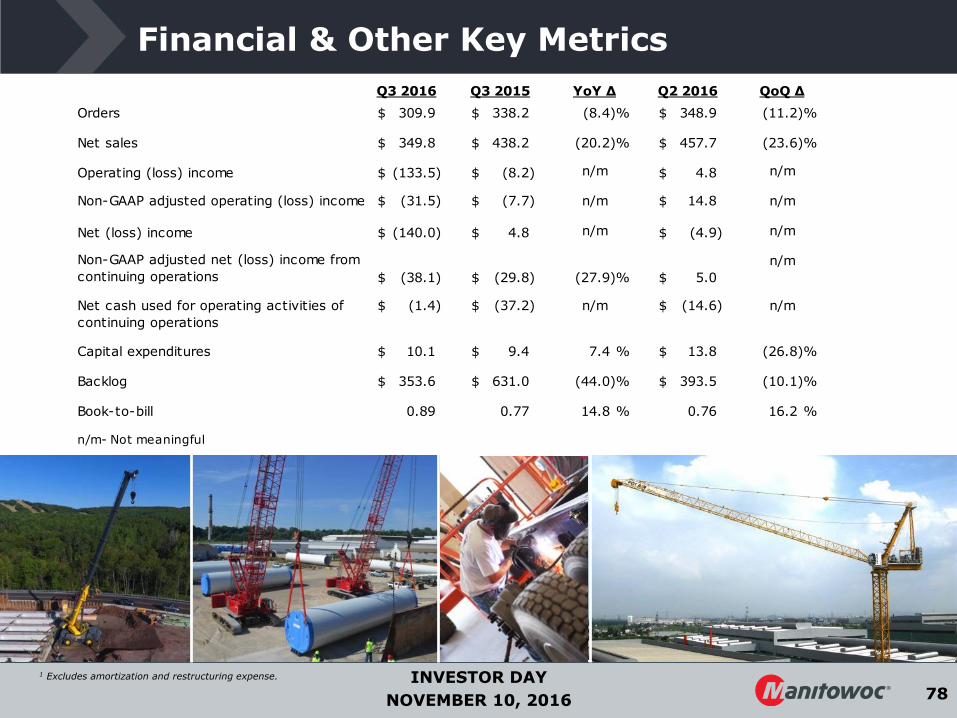
Q3 2016 Q3 2015 YoY ∆ Q2 2016 QoQ ∆
Orders 309.9$ 338.2$ (8.4)% 348.9$ (11.2)%
Net sales 349.8$ 438.2$ (20.2)% 457.7$ (23.6)%
Operating (loss) income (133.5)$ (8.2)$ n/m 4.8$ n/m
Non-GAAP adjusted operating (loss) income (31.5)$ (7.7)$ n/m 14.8$ n/m
Net (loss) income (140.0)$ 4.8$ n/m (4.9)$ n/m
Non-GAAP adjusted net (loss) income from
continuing operations (38.1)$ (29.8)$ (27.9)% 5.0$
n/m
Net cash used for operating activities of
continuing operations
(1.4)$ (37.2)$ n/m (14.6)$ n/m
Capital expenditures 10.1$ 9.4$ 7.4 % 13.8$ (26.8)%
Backlog 353.6$ 631.0$ (44.0)% 393.5$ (10.1)%
Book-to-bill 0.89 0.77 14.8 % 0.76 16.2 %
n/m- Not meaningful
Financial & Other Key Metrics
1 Excludes amortization and restructuring expense.

79INVESTOR DAY
NOVEMBER 10, 2016
GAAP Reconciliation Summary

80INVESTOR DAY
NOVEMBER 10, 2016
Historical Revenue and EBITDA
(US$ in millions)
Revenue EBITDA & Margin
Cranes generates significant revenue and EBITDA during cyclical upturns
During industry downturns, predictable replacement demand and differentiated product offerings support demand
Restructuring initiatives in progress
$1,708
$2,135
$2,427 $2,506
$2,305
$1,862
2010 2011 2012 2013 2014 2015
Revenue
$149
$172
$214
$266
$210
$110
8.7% 8.1%8.8%
10.6%9.1%
5.9%
0.0%
5.0%
10.0%
15.0%
20.0%
25.0%
30.0%
$-
$50
$100
$150
$200
$250
$300
2010 2011 2012 2013 2014 2015
EBITDA % Margin
Note: Revenue and EBITDA from 2010 – 2015 represent historical Cranes segment results. EBITDA is calculated as Operating Earnings from Continuing Operations plus Depreciation and excludes corporate allocations.

81INVESTOR DAY
NOVEMBER 10, 2016
Historical Capital Needs & Cash Flow
(US$ in millions)
Capex & % of Sales
Note: Capex and Unlevered Free Cash Flow represent historical Cranes segment results. EBITDA calculated as Operating Earnings from Continuing Operations plus Depreciation and excludes corporate allocations. 1 Free Cash Flow defined as EBITDA less Capex.
Free Cash Flow1 & % Conversion
Moderate capital intensity and working capital requirements allow earnings to largely flow to cash flow
Working capital needs decrease when revenue declines, providing a strong cash flow offset during industry downturns
Free cash flow¹ generation through the cycle
$21
$52 $53
$69
$57 $52
1.2%2.4% 2.2% 2.8% 2.5% 2.8%
0.0%
5.0%
10.0%
15.0%
20.0%
25.0%
30.0%
$-
$20
$40
$60
$80
$100
$120
$140
2010 2011 2012 2013 2014 2015
Capex % of Sales
$129 $120
$161 $196
$152
$58 86.2%69.7% 75.4% 73.9% 72.7%
52.9%0.0%
50.0%
100.0%
150.0%
200.0%
250.0%
300.0%
0
50
100
150
200
250
300
350
400
450
500
2010 2011 2012 2013 2014 2015
FCF % Conversion
82INVESTOR DAY
NOVEMBER 10, 2016
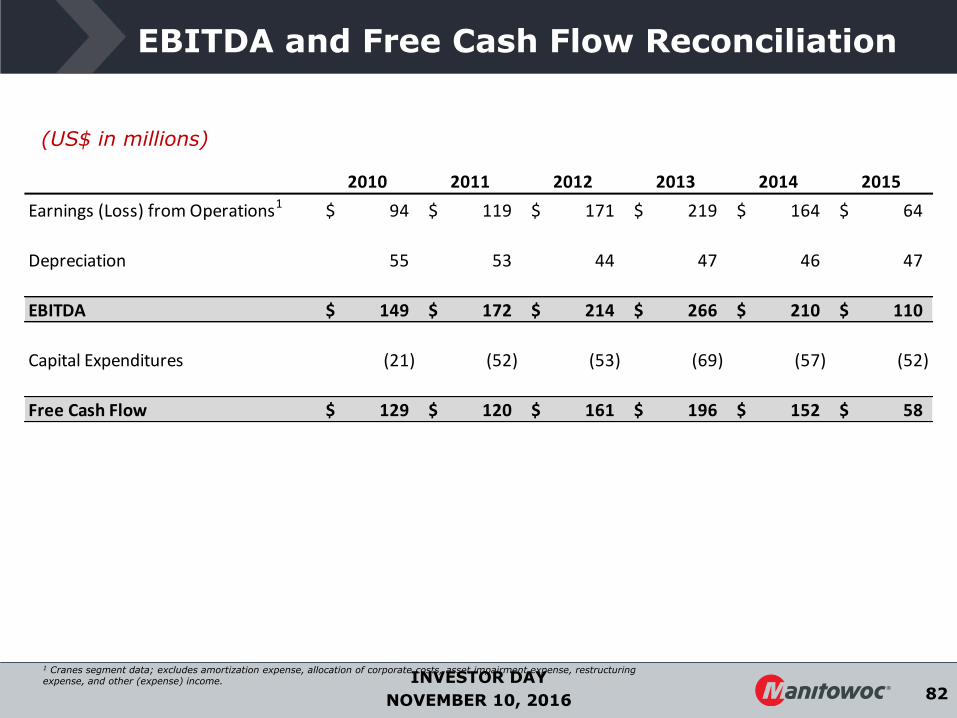
EBITDA and Free Cash Flow Reconciliation
(US$ in millions)
2010 2011 2012 2013 2014 2015
Earnings (Loss) from Operations1 94$ 119$ 171$ 219$ 164$ 64$
Depreciation 55 53 44 47 46 47
EBITDA 149$ 172$ 214$ 266$ 210$ 110$
Capital Expenditures (21) (52) (53) (69) (57) (52)
Free Cash Flow 129$ 120$ 161$ 196$ 152$ 58$
1 Cranes segment data; excludes amortization expense, allocation of corporate costs, asset impairment expense, restructuring expense, and other (expense) income.
83INVESTOR DAY
NOVEMBER 10, 2016