the mark ii detector for the slc* - …slac.stanford.edu/pubs/slacpubs/4500/slac-pub-4558.pdf ·...
TRANSCRIPT

SLAC-PUB-4558 LBL-26671 March 1989
(I/E)
THE MARK II DETECTOR FOR THE SLC*
G. Abrams,(l) C. E. Adolphsen,c2) C. Akerlof,c3) J. P. Alexander,(4)>(s) M. Alvarez,(5)l(b) D. Averill, A. R. Baden,(l)$(c) J. Ballam,c4) B. C. Barish,(‘) T. Barklow,c4) B. A. Barnett,c8) J. Bartelt,c4) D. Blockus, W. de Boer,(4)v(d) G. Bonvicini,t3) C. Boswell,(‘) A. Boyarski,c4) J. Bayer,(l) B. Brabson,(‘) K. Braune,(4)y(e) A. Breakstone,cg) J. M. Brom,(6)*(f) F. Bulos,t4) P. R. Burchat,t2) D. L. Burke,t4) F. Butler,(‘)‘(g) F. Calvino,(5)9(h) R. J. Cence,cg) J. Chapman,(3) M. Chmeissani,t3) D. Cords,c4) D. P. Coupal,(4) P. Dauncey, c8) H. C. DeStaebler,t4) D. E. Dorfan,c2) J. M. Dorfan,c4) P. S. Drell,(l)j(a) D. C. Drewer,(‘) J. Fay,(l)y(i) G. J. Feldman,t4) D. Fernandes,t4) E. Fernandez,(5)y(b) R. C. Field,c4) W. T. Ford,c5) C. Fordham,t4) R. Frey,c3) D. Fujino,c4) K. 1~. Gan,c4) C. Gatto,c2) E. Gero,c3) G. Gidal,(l) T. Glanzman,t4) G. Goldhaber,(‘) J. J. Gomez Cadenas,(2)y(j) X. Gong,(g) G. Gratta,(2)y(k) A. Green,(4)t(1) P. Grosse- Wiesmann,t4) J. Haggerty,(‘)f(“) G. Hanson, c4) R. Harr,(l) B. Harral,(s) F. A. Harris,cg) C. M. Hawkes,(‘) K. Hayes,c4) C. Hearty,(‘) D. Herrup,(‘)T(“) C. A. Heusch,t2) T. Himel,c4) D. A. Hinshaw, t5) M. Hoenk,(‘) S.-O. Holmgren,(l)j(‘) S. J. Hong,t3) D. Hutchinson,(4) J. I-Iylen,(8) W. R. Innes,(4) R. G. Jacobsen,(4) M. Jaffre,(l)l(P) J. A. Jaros,c4) C. K. Jung,c4) I. Juricic,(l)j(q) J. A. Kadyk,(‘) D. Karlen,(4)y(‘) J. Kent,t2) M. King,t2) S. R. I(lein,(4) L. Koepke,(2)j(e) D. Koetke,t4) A. I(oide,(g)t(s) S. Komamiya, c4) W. Kosl;a,(3) L. Ai I~owalski,(4) W. Kozanecki,(4) J. F. Kral,(l) M. Kuhlen,(‘) L. Labarga,(2)y(t) A. J. Lankford,(4) R. R. Larsen,t4) M. E. Levi,(l) Z. Li,(‘) A. M. Litke,c2) V. Li.ith,c4) G. R. Lynch,(‘) J. A. R4cKenna,(‘) J. A. J. Matthews,c8) T. Mattison,t4) B. D. Milliken,(‘) K. C. Moffeit,c4) L. Miiller,(4)T(u) C. T. Munger,t4) W. N. Murray, c6) J. Nash,c4) M. E. Nelson,(‘) D. Nitz,t3) H. Ogren,(“) R. A. Ong,(4)j(v) K. ‘F. O’Shaughnessy, (4)y$ S. I. Parl;er,(g) C. Peck,(‘) J. Perl,t4) M. L. Perl,c4) F. Perrier,(4)y(W) A. Petersen,(4)y(x) M. Petradza,c3) R. Pitthan,c4) F. C. Porter,(‘) P. Rankin,c5) J. D. Richman,( K. Riles,c4) F. R. Rouse,(‘) D. R. Rust,(‘) II. F. W. Sadrozinski,(2) M. W. Schaad,(‘) W. B. Schmidke,(‘) B. A. Schumm,(‘) A. S. Schwarz,(2)l(d) A. Seiden,(2) J. G. Smith,t5) A. Snyder,(‘) E. Soderstrom,(‘) D. P. Stoker,(‘) R. Stroynowski,(‘) M. Swartz,c4) R. E. Taylor,c4) R. Thun,t3) G. H. Trilling,(‘) R. Tschirllart,(3)y(‘) M. Turala.,(2)y(CC) R. Van Kooten,(4) S. Vejcik,(‘) I-1. Veltman,(3)y(aa) P. Voruga,nti,(4) S. R. Wa.gner,(5) S. Watson,(2) P. Weber,c5) A. Weigend,c4) A. J. Weinstein,(7) A. J. Weir,(‘) S. Weisz,(2)j(e) S. L. Whit,e,(5)j(bb) E. Wicklund, R. C. Wolf,(‘) D. R. Wood,(‘)>(“) M. Woods,(4) G. Wornxxr,(4)T(P) R. Wright,(4) D. Y. Wu,(‘) h4. Yurko,(“) C. Zaccardelli,(2) a,nd C. von Zanthierc”)
Submitted to Nuclear Instruments and Methods A.
* This work was supported in part by Department of Energy contracts DE-AC03-81ER40050 (CIT), DE-AM03-7GSFOOOlO (UCSC), DE-AC02-86ER40253 (Colorado), DE-AC03-83ER40103 (Hawaii), DE-AC02-84ER40125 (Indiana), DE-AC03-7GSF00098 (LBL), DE-AC02-84ER40125 (Michigan), and DE-AC03-7GSF00515 (SLAC); and by the National Science Foundation (.Johns Hopkins).

(I) Lawrence Berkeley Laboratory and Department of Ph.ysics, University of California, Berkeley, California 94 720
t2) University of California, Santa Cruz, California g5064
c3) University of Michigan, Ann Arbor, Michigan 48109
c4) Stanford L inear Accelerator Center, Stanford Universit yi . Stanford, California 94309
c5) University of Colorado, Boulder, Colorado 80309
c6) Indiana University, Bloomington, Indiana 47405
t7) California Institute of Technology, Pasadena, California 91125
c8) Johns Hopkins University, Baltimore, Maryland 21218
(‘) University of Hawaii, Honolulu, Hawaii 96822
(a) Present address: Cornell University, Ithaca, NY 14853
(b) Present address: Universidad Autonoma de Barcelona, Bellaterra, Spain
(c) Present address: Harvard University, Cambridge, MA 02138
(d) Present address: Max-Planck Institut, Miinchen, F. R. Germany
(e) Present address: CERN, CH-1211, Geneve 23, Switzerland
(f) Present address: Centre de Recherches Nucleaires, F-67037 Strasbourg, France
(g) Present address: University of Oklahoma, Norman, OK 73019
(h) Present address: Universitat Politecnica de Catalunya, ETSEIB-DEN Barcelona, Spain
(i) Present address: IPN Lyon, F-69622 Villeurbanne, France
(j) Permanent address: IFIC, Valencia, Spain
(k) Permanent address: Universita di Roma I, Roma, Italy
(1) Present address: O’Conner and Associates, Chicago, IL 60604
(m) Present address: Brookhaven National Laboratory, Upton, NY 11973
(n) Present address: Fermilab, Batavia, IL 60510
(0) Present address: University of Stockholm, Stockholm, Sweden
(p) Present address: Laboratoire de 1’Accblerateur Linbaire, F-91405 Orsay, France
(q) Present address: Columbia University, New York, NY 10027
(r) Present address: Carleton University, Ottawa, Ontario, Canada, KlS 5B6
(s) Present address: Vista Research Inc., P.. 0. Box 998, Mountain View, CA 94042
(t) Permanent address: Universidad Autbnoma de Madrid, Madrid, Spain
(u) Present address: Lab. fiir Hochenergie Physik Bern, CH-3012 Bern, Switzerland
(v) Present address: University of Chicago, Chicago, IL 60637
(w) Present address: CEN Saclay, Gif-sur-Yvette, France
(x) Present address: SCS, Hamburg, F. R. Germany
(y) Present address: University of California, Santa Barbara, CA 93106
(z) Present address: Princeton University, Physics Department, Princeton, NJ 08544
(aa) Present address: University of California, Berkeley, CA 94720
(bb) Present address: University of Tennessee, Knoxville, TN 37996
(cc) Present address: Institute of Nuclear Physics, Krakow, Poland
$ Editor

ABSTRACT
The Mark II detector has been upgraded in preparation for its role as the first detector to take data at the Stanford Linear Collider. The new det,ector com- ponents include the central drift chamber, the time-of-flight system, the coil, the endcap electromagnetic calorimeters and the beam energy and luminosity mea- suring devices. There have also been improvements in detector hermeticity. All of the major components were installed for a test run at the PEP storage ring (,/S = 29 GeV) in 1985. This paper describes the upgraded detector, includ- ing its trigger and data acquisition systems, and gives performance figures for its components. Future improvements are also discussed.
4

TABLE OF CONTENTS .
1. Introduction .................... 7
2. Central Drift Chamber ................ 7
2.1 Drift Chamber Design ............. 8
2.2 Electronics .................. 9
. 2.3 Operation ................... 10
2.4 Performance .................. 10
3. Time-of-Flight System ................ 13
3.1 Physical Description .............. 13
3.2 Electronics .................. 14
3.3 Calibration Systems .............. 14
3.4 Data Analysis ................. 15
3.5 Performance .................. 15
4. Mark II Solenoid .................. 16
5. Liquid Argon Barrel Calorimeter ........... 16
5.1 Physical Description .............. 17
5.2 Cryogenics System ............... 17
5.3 Electronics .................. 18
5.4 Performance .................. 18
6. Endcap Calorimeter ................. 19
6.1 Physical Description .............. 20
6.2 Electronics .................. 20
6.3 Performance .................. 21
7. Muon System .................... 21
7.1 Physical Description .............. 21
7.2 Performance .................. 22
5

8. Luminosity Monitors . . . . . . . . . . . . . . . . 23 . 8.1 Small-Angle Monitor . . . . . . . . . . . . . . 23
8.2 Mini-Small-Angle Monitor . . . . . . . . . . . 25
9. Small Electromagnetic Shower Detectors . . . . . . . . 26
9.1 Catcher/Mask Plug . . . . . . . . . . . . . . 27
9.2 Active Mask . . . . . . . . . . . . . . . . . . 27
. 9.3 Endcap Veto Counter . . . . . . . . . . . . . . 28
9.4 Liquid Argon Hole Taggers . . . . . . . . . . . 28
10. Trigger System . . . . . . . . . . . . . . . . . . . 29
10.1 Data Trigger . . . . . . . . . . . . . . . . . 30
10.2 Cosmic Ray Trigger . . . . . . . . . . . . . . 32
11. Extraction Line Spectrometer . . . . . . . . . . . . . 32
11.1 Spectrometer Description . . . . . . . . . . . . 33
11.2 Magnetic Field Monitoring . . . . . . . . . . . 33
11.3 Detection of Synchrotron Radiation . . . . . . . 34
11.4 Performance . . . . . . . . . . . . . . . . . . 34
12. Data Acquisition System . . . . . . . . . . . . . . . 35
13. Further Improvements . . . . . . . . . . . . . . . . 37
13.1 Silicon Strip Vertex Detector . . . . . . . . . . 37
13.2 Drift Chamber Vertex Detector . . . . . . . . . 38
13.3 Muon System Upgrade . . . . . . . . . . . . . 41
13.4 Wire Imaging Synchrotron Radiation Detector . . . 42
13.5 Online Processing . . . . . . . . . . . . . . . 43
14. Summary . . . . . . . . . . . . . . . . . . . . . 45
15. Acknowledgments . . . . . . . . . . . . . . . . . . 45
1. INTRODUCTION
The Mark II detector is the first detector to take data at the Stanford Lin-
ear Collider (SLC) [l]. The SLC p rovides electron-positron colliding beams with
a center-of-mass energy around the 2’ resonance (approximately 92 GeV). The
detector is an upgraded version of the device previously used successfully at the
PEP. and SPEAR storage rings. Newly constructed components include the cen-
tral drift chamber, the time-of-flight system, the coil, the endcap electromagnetic
calorimeters and the luminosity monitors [2]. There have also been improvements
in detector hermeticity. In addition, spectrometers for making precise measure-
ments of both electron and positron energies on a pulse-by-pulse basis have been
designed and implemented. Finally, several further additions to the detector (new
vertex detectors, increased muon coverage and online processors) are being con-
structed and tested but are not currently installed. They will be briefly discussed
at the end of the paper.
A cut-away view of the detector can be seen in fig. 1. Emerging from the
interaction point, a particle emitted perpendicular to the beam would traverse
the beampipe, the central drift chamber, a time-of-flight counter, the coil of the
solenoid magnet, the liquid argon calorimeter and finally the muon detection sys-
tem. The following sections describe these components as well as the endcap
calorimeters and small-angle monitors. When available, performance figures from
a test run at PEP (29 GeV center-of-mass energy) are quoted. For systems not
installed for the test run at PEP, data from test beam studies or Monte Carlo
simulations are presented.
2. CENTRAL DRIFT CHAMBER
A new central drift chamber was built to improve the momentum resolution,
the two-track separation and the pattern recognition. Some charged particle iden-
tification capability through dE/d x measurements is also provided.
7

i 2.1 Drift Chamber Design
The drift chamber design is based on a six sense-wire cell, a shortened version
of the jet-chamber configuration [3]. Th e cells are arranged in 12 concentric cylin-
drical layers, alternating between wires parallel to the cylinder axis (axial layers)
or inclined at approximately f3.8’ to the axis to provide stereo information. The
inner radius of the drift chamber is 19.2 cm, the outer radius is 151.9 cm and the
active length is 2.30 m. The design parameters are given in table 1.
The detailed cell design is shown in fig. 2. The sense wires (30-pm-diameter
gold-plated tungsten) are staggered f380 pm from the cell axis to provide local
left-right ambiguity resolution. The electric field is controlled primarily by the
voltage on a row of 19 field wires at each edge of the cell. There are also guard and
potential wires interspersed with the sense wires which help to adjust the electric
field and the gains on the sense wires.
The wires are strung between 5.1-cm-thick aluminum endplates which are held
apart by a 2-mm-thick beryllium inner cylinder and a 1.27-cm-thick aluminum
outer shell. In addition there are eight 2.5-cm by 5.1-cm aluminum ribs attached
to the outer shell which provide structural support. The aluminum shell and
beryllium cylinder are lined with skins of copper-clad Kapton; a voltage is applied
to these skins to maintain a uniform electric field in the innermost and outermost
layers.
The wires in one plane in a cell are located in machined notches in a Delrin
feedthrough which is pinned to accurately machined holes in the endplate. The
average uncertainty in wire location is 35 pm and is primarily due to errors in
machining and placement of the feedthroughs and endplates. A more detailed
description of the chamber design can be found in ref. 4.
8

2.2 Electronics
The drift chamber signals are amplified in two stages and then digitized. Both a
time digitization and a pulse shape digitization (allowing the dE/dx measurement)
are made. Figure 3 is a schematic drawing of the drift chamber electronics.
The preamplifier (first stage) boards are mounted directly on the feedthroughs
at the chamber face, inside an aluminum RF shield. The circuitry is based on the
Plessey SL56OC chip. The second stage of amplification is performed by the 24-
channel postamplifiers located in crates mounted on the ma:gnet iron. In a.ddition,
these boards shape and split the signal. The timing half of the postamplifier has a
gain of 70 and discriminates the pulses using a LeCroy MVL407 comparator. The
threshold set for the comparator corresponds to 80 pV at the preamp input. This
is equivalent to 4% of the mean pulse height due to a minimum ionizing particle.
The gain setting for the pulse height measurement can be varied. More details on
the preamplifiers and postamplifiers can be found in ref. 5.
At this point the two sets of signals (timing and pulse shape) are brought out
approximately 30 m to the electronics house. The drift times are digitized by 96-
channel LeCroy 1879 TDCs located in four FASTBUS crates. These modules have
multi-hit capability and a time bin width of 2 ns. The drift chamber pulse shapes
are digitized by SLAC-designed [6] FASTBUS b oards. These boards are 16-channel
loo-MHz Flash-ADCs with 6-bit resolution based on the TRW 1029J7C chip. (For
the test run at PEP, only one-third of the drift chamber was instrumented with
FADCs.)
The readout of both the TDCs and FADCs is controlled by SLAC Scanner
Processors (SSPs) [7], which are programmable FASTBUS modules. One SSP is
used in each FASTBUS crate to preprocess (e.g., perform zero suppression and
pedestal corrections) and format the data, The crate SSPs are read out via cable
segments by system SSPs, which buffer the data and interface with the experiment
host computer, a VAX 8600. Programs on the host computer correlate the TDC
and FADC hits on each wire. The timing and pulse height channels are calibrated
9
separately. For both, the calibration pulse is injected at the input to the pream- .
plifier. The timing calibration measures the time propagation differences for ea.ch
channel. The pulse height calibration is used to determine a pedestal, gain and
quadratic correction for each channel.
2.3 Operation
A graded high voltage is supplied to the field wires of each cell through a
resistor-divider chain. The voltage on a field wire in the center of a cell is typically
-4.5 kV, the potential wire and guard wire voltages are typically -1.5 kV and
-200 V, respectively, and the sense wires are grounded. The copper skins lining
the inner and outer cylinders are typically set at -2.5 kV. The drift chamber high
voltages and currents are controlled and monitored using an IBM PC.
The chamber gas is a mixture of 89% Ar, 10% CO2 and 1% CH4 (HRS gas)
and is at a pressure slightly above 1 atmosphere. The above voltages result in a.
gas gain of 2 x lo4 with an electric drift field of 900 V/cm and the typical drift
velocity is 52 pm/ns. For most of the test run at PEP the magnetic field was
4.5 kG, giving a Lorentz angle of 17.8’.
2.4 Performance
2.4. l Tracking eficiency
The drift chamber tracking program was implemented using hits found by
the TDCs. It utilizes the multi-sense-wire feature of the cells and forms track
segments within cells. These segments are later matched to form tracks through
the chamber [8]. The track-finding routine efficiency has been measured at PEP
and estima.ted for SLC from Monte Carlo programs. For low multiplicity events at
PEP with tracks that go through all sublayers, the efficiency was measured to be
approximately 99%. It is estimated to drop to 96% for high multiplicity hadronic
events of the type expected at SLC energies. Figure 4 shows the efficiency as a
function of cos 0 for these two classes of events.
10
Z.4.Z Position and momentum resolution
The position resolution in the chamber is primarily limited by diffusion in the
gas. Calculations show that this effect contributes an error of M 150 pm for the
longest drift distances. Other errors are M 50 pm from the time measurement error
in the electronics and x 35 pm from wire placement. When a single drift velocity
was used for all cells and layers to convert the drift times to positions, the achieved
resolution averaged over the cell width was 185 pm. Fitting velocities for each of
three drift distance regions in a cell and for different groups of wire layers improved
the resolution to M 170 pm.
The information from the FADCs can be included in the timing measurement
by using the deposited charge to make a “time-slewing” correction. This correc-
tion compensates for the change in measured time as a function of pulse height and
improves the resolution by a small amount. Figure 5 shows the resolution versus
drift distance with and without the time-slewing correction. However, the major
tracking improvement provided by the FADC s is a better double hit separation.
Scanning algorithms that use the pulse shape have an efficiency of 80% for sep-
arating hits 3.8 mm apart compared to 6.4 mm if only the TDCs are used (see
fig. 6).
From Bhabha scattering events in the PEP data taken with a 4.5 kG field, a
momentum resolution of a(p)/p2 = 0.46% (GeV/c)-’ was measured in the central
drift chamber for single tracks with lcos0l < 0.64. The resolution is o(p)/p2 =
0.31% (GeV/c)-’ if th e t racks are constrained to originate from a single point
(see fig. 7). The multiple scattering contribution to the resolution from the drift
chamber itself is 1.4%. Beam diagnostic devices and other material inside the
drift chamber radius also contribute to the vertex constrained resolution through
multiple scattering.
11
i 2.4.3 Particle identification
The main purpose of the FADC system is to provide some degree of particle
identification, particularly for separating electrons from pions. The charge de-
posited by a particle traversing the drift chamber is proportional to its energy
loss (dE/dx). Th e value of dE/dx coupled with the measured momentum allows
a rough determination of the particle mass. For a track travelling the full radial
extent of the central drift chamber, the 72 possible charge measurements would
provide an expected dE/dx resolution for minimum-ionizing particles of 6.9% [9].
The FADC pulse shapes are processed to provide the time and integrated charge
for each hit. The “difference of samples” algorithm [lo] that is currently used scans
the pulse and looks for sharp changes in its shape. The time is determined by a.
weighted average over the bins where there is a change, and the charge is calculated
by summing the counts between the start and end of the pulse as identified by the
algorithm.
The charge collected depends on the path length, the angle that the tra.ck
makes with the wire, the drift distance, and whether the staggered sense wire is
on the near or far side of the wire plane from the track. There are also variations
in the gas gain due to pressure and temperature, differences in gain in each of the
72 sublayers of the drift chamber, and variations from channel-to-channel due to
the electronics. After correcting each measured charge for these effects, a (75%)
truncated mean of the samples is calculated to arrive at a dE/dx value for the
track. The corrected values are shown as a function of momentum for particles
at PEP in fig. 8. The different particle types were identified using other detector
components or event topologies.
From a sample of Bhabha scattering events from PEP data, a dE/dx resolution
of 7.2% was obtained. Figure 9 shows the resulting separation between electrons
and pions for tracks in a momentum range of 0.25 GeV/c to 0.60 GeV/c. The
electrons were identified using the barrel electromagnetic calorimeter and pions
were defined as tracks that were not identified as electrons, kaons or protons.
12
i The peaks were obtained from different event samples within the same data runs.
. Electron-hadron separation for all momenta is discussed in the next chapter.
3. TIME-OF-FLIGHT SYSTEM
The time-of-flight (TOF) system is used to provide charged particle identifi-
cation including the detection of cosmic rays. The time is measured by detecting
signals generated in scintillator slabs located between the central drift chamber
and the magnet coil.
3.1 Physical Description
The TOF system consists of 48 counters forming a barrel of inner radius
152.4 cm that is outside and coaxial with the central drift chamber. Each counter
is 300 cm long and has a trapezoidal cross section with a smaller width of 19.8 cm.
The counters are 4.5 cm thick except for two counters bordering 4 = 0’ and two
counters bordering $ = 180” which are 3.8 cm thick. The addition of eight struc-
tural ribs along the drift chamber body (which are equally spaced in $ starting
at $ = 0’) required cutting 1.6 cm from the width of the 16 adjacent counters.
The counters are cast from a plastic scintillator based on cross-linked polystyrene
(SCSN-38 [l l]) h h w ic was chosen for its high resistance to crazing due to mechani-
cal stress. The mounting system was designed to provide stress-free support. Both
ends of the counters are coupled to light guides made from UV-light-transmitting
acrylic. These guides narrow from the width of the counters (an average of 20 cm)
to 5.3 cm over a length of 43 cm and then extend 84 cm further to bring the light
outside the flux return iron. An Amperex XP2222 12-stage photomultiplier tube
is attached to the end of each light guide, with optical coupling provided by a soft
Sylguard “cookie” [12]. The phototubes are shielded from stray magnetic fields by
concentric cylinders of mu-metal and soft iron. CAMAC-controlled LeCroy 4032A
high voltage supplies power the voltage dividers in the phototube base. These
voltage dividers have been designed to minimize phototube transit time jitter.
13

i 3.2 Electronics
I
i The electronics of the data acquisition system are those used by the pre-upgrade
Mark II at PEP [13]. Each phototube channel consists of two independently dis-
criminated Time-to-Amplitude Converters (TACs) and a pulse height integrator.
The analog times and pulse integrals are collected and digitized by a 12-bit ADC
incorporated in a 16-bit microprocessor (BADC) [14]. The BADC then performs
pedestal subtractions, linear gain corrections, and threshold cuts to the raw digi-
tized values. The timing acceptance window is 60 ns which is large enough for the
possible observation of slow particles, but which also allows for rejection of cosmic
rays.
3.3 Calibration Systems
There are two independent calibration systems. The calibration of the elec-
tronics is carried out using a variable amplitude pulser and delay cables of known
length. Calibration constants are computed using a second order fit of channel
response to input pulses. These constants provide an accuracy of u = 60 ps over
a 35-ns interval for the TACs and u = 70 pC over a 1700 pC range for the pulse
height integrators.
The laser calibration system, illustrated in fig. 10, monitors the response of the
counters and associated electronics to short light pulses which simulate the effect
of charged particles passing through the scintillator. A pulsed nitrogen laser illu-
minates optical fibers attached to each counter 90 cm from each end. A CAMAC-
controlled mirror allows for the illumination of one fiber at a time in the system,
and a set of neutral density filters allows for variation of input light intensity. The
timing reference is provided by a photodiode exposed to the laser light; the pho-
todiode also measures the intensity of each pulse. The system provides enough
redundant information to monitor the gains of the phototubes, the propagation
delays through the scintillator, light guides, cables and electronics and the atten-
uation length of the scintillator. It has been observed that the phototube current
I
14

saturates at high light levels in the scintillator. A correction for this saturation .
with the same functional form for each phototube is determined using the laser
calibration system.
3.4 Data Analysis
The measured times from each phototube are corrected for the time that the
light takes to propagate through the scintillator and for channel-to-channel prop-
agation delays through the phototube. The saturation correction is applied, then
a time walk correction [15] proportional to the inverse square root of the corrected
pulse integral is also applied. The time walk constant is determined for each pho-
totube using the data from the test run at PEP. A final time of flight t is obtained
by taking the weighted average of the times from both phototubes.
Particle identification is determined from the velocity p = L/(ct), where the
path length L from the interaction point is determined from the central drift cham-
ber information and t is the time of flight. The squared mass of the particle is then
given by m2 = p2 [l/p” - I], where p is the particle momentum as measured by
the drift chamber.
3.5 Performance
Figure 11 shows the difference between the time measured by the TOF system
and the expected time of arrival of electrons from the Bhabha scattering process
e+e- -+ e+e- measured during the PEP test run. The achieved single counter
resolution varied from 180 to 250 ps and averaged over all counters and all data
runs was 221 ps. This gives the r/K/p separation shown in fig. 12. The measured
TOF and dE/d x resolutions are combined to give the electron-hadron separation
seen in fig. 13. The two systems together also give at least a 20 r/K separation
up to momenta of 10 GeV/ c and K/p separation up to 2.0 GeV/c in momentum.
However, it should be pointed out that the resolutions in high-multiplicity events
will be slightly worse, implying poorer separation in those classes of events.
15

i
. The reassembled TOF system at the SLC experimental hall is monitored by
the same laser calibration system which has shown that the constants leading to
the resolution achieved at PEP are still valid. Data from cosmic rays at the SLC
provide further evidence that the resolution remains at the previous level.
4. MARK II SOLENOID
The Mark II solenoid is a conventional cylindrical coil producing a ma,gnetic
field of up to 5.0 kG in the center of the detector. Its thickness is 1.3 radiation
lengths. The coil consists of twelve aluminum conductors wound in series into four
contiguous cylinders. The solenoid is 405 cm long, with inner and outer radii of
156 cm and 171 cm, respectively. For a field of 4.75 kG, the current is 7325 A and
the total heat dissipation is 1.8 MW.
The inner radius of the coil is covered by a heat shield which helps to isolate
it thermally from the inner detector components. A flow of 40 liters per minute of
temperature controlled water through the heat shield keeps the temperature within
the central drift chamber stable to a few degrees. The magnetic field inside the
cylindrical volume occupied by the drift chamber has been measured and fit to a
set of polynomials in the coordinates r and t. Within the tracking volume the field
is uniform to within 3% while the fit describes the magnetic field with an error of
less than 0.1%. The magnetic field used in charged particle tracking is obtained
from the fit normalized using the data from two Hall probes positioned at each end
of the central drift chamber. The absolute error on the field strength is less than
0.1%.
5. LIQUID ARGON BARREL CALORIMETER
The central electromagnetic calorimeter of the Mark II is a lead/liquid argon
sampling device with strip readout geometry. The calorimeter system consists of
eight independent liquid argon cryostats enclosed in a common vacuum vessel. The
system was-designed and built as part of the Mark II at SPEAR [16].
16

i 5.1 Physical Description
Each module is 1.5 x 3.8 x 0.21 m3. The modules are arranged in an octagonal
barrel outside the magnet coil. Together they cover the polar angle range of 47’ <
8 < 133’ and the full azimuthal angle except for 3” gaps between each pair of
modules. The total solid angle coverage is 63.5%.
Each module contains a stack of alternating layers of 2-mm lead sheets and
lead strips with the 3-mm gaps between them filled with liquid argon. The lead is
strengthened with 6% antimony to minimize sagging. The strips are aligned either
perpendicular to the beam axis to measure the polar coordinate 8, parallel to the
beam axis to measure the azimuthal coordinate 4 or at 45’ relative to the other
two sets of strips (labeled “U”) to aid in track reconstruction. Table 2 gives the
details for this design.
Spacing is maintained both between strips and between layers by ceramic spac-
ers which contribute an overall dead space of 5%. In order to reduce the number of
electronic channels many of the strips are ganged together, both from strip to strip
in certain layers and from layer to layer. The ganging results in six interleaved
readout layers and a total of 326 channels for each module. The ganging scheme is
shown in fig. 14. There is an additional pair of 8-mm liquid argon gaps formed by
1.6-mm-thick aluminum sheets and strips in front of the lead stack to allow correc-
tions to measured shower energy for radiative losses in the magnet coil. The strips
are oriented in the $ direction and there are 36 in each module. Altogether, 1.86
radiation lengths of material precede the lead stack. Together this material and
the calorimeter represent 16.0 radiation lengths of material at normal incidence.
5.2 Cryogenics System
The total volume of liquid argon in the modules is 6400 liters. The argon is not
circulated; instead the modules are connected to a common storage vessel through
gas phase transfer lines. With an insulating vacuum of 10S6 torr surrounding the
modules, the major load for the cooling system is the compensation for heat losses
17

in the transfer lines. Temperature is maintained at approximately 85 K using
liquid nitrogen refrigeration at the module shells. The system consumes 160 liters
of liquid nitrogen per hour during normal operation.
5.3 Electronics
Charge produced through ionization in the liquid argon drifts to the readout
strips in a field of 12 kV/cm. Each readout strip is impedance matched to a
TIS75 FET through a small ferrite pot core transformer. The electronic noise
is dominated by Johnson noise generated in the conduction channel of the FET
and is minimized using a bipolar shaping amplifier [17] with a resolving time of
1.5 ps. The equivalent noise energy in the ganged readout channel varies from
0.3 to 1.5 MeV and is a function of the capacitance of the channel which varies
from 0.9 to 8 nF. The preamplifiers and shaping amplifiers are mounted on the
detector. RF shielding encloses the modules, the amplifiers, and the twisted-pair
signal cables that run from the amplifiers to the electronics house.
Sample-and-hold modules (SHAMS [IS]) f o 11 ow the output voltage of the am-
plifiers and are gated to hold at the peak. The charge stored in the SHAMS is
measured with BADCs [14]. The BADC in each of the six CAMAC crates per-
forms pedestal subtractions, linear gain corrections, and threshold cuts. The max-
imum time for digitization and reduction of all data in a CAMAC crate is about
8 ms. Thresholds are normally set so that the noise occupancy is about 5%. After
ten years of operation, the number of dead channels in the system (due to failing
electronics or unrepairable internally shorted strips) is less than 1%.
5.4 Performance
The measured energy distribution from Bhabha scattering events at PEP is
shown in fig. 15. The resolution is a/E = 4.6%, measured using the width of the
distribution at the half maximum. However, the distribution is not Gaussian due to
several reasons. Dead space in the calorimeter active volume creates a low energy
tail, the size of which depends on the number of failing channels in the system.
18

Saturation in the readout electronics for the first active layer, used to correct for
losses in the coil, further degrades the resolution for high energy electrons in the
upgrade data sample. The gain in the amplifiers for the first layer has been reduced
so that saturation will not affect running at the SLC. As fig. 15 shows, the Monte
Carlo simulation [19], including the effects of dead space and saturation, roughly
reproduces the distribution. The energy dependence of the resolution expected in
future runs, without saturation, has been studied using Monte Carlo programs and
is shown in fig. 16. The position resolution measured with the Bhabha scattering
events is a+ = 3 mrad and gz = 0.8 cm and both measurements are consistent with
Monte Carlo simulation.
An inclusive electron production analysis [20] performed with data taken before
the upgrade provides an example of the electron-hadron separation capability of
the barrel calorimeter. Electrons were identified by comparing the momentum
measured from a drift chamber track with the energy deposited in various groupings
of layers in a narrow region around the extrapolated track. In hadronic events,
the identification efficiency varied from 78% at 1 GeV/c to 93% at the highest
momenta. The probability for misidentifying a hadron as an electron was typically
0.5% but could be as large as 3% for tracks of momentum below 2 GeV/c in the core
of a jet. A more detailed discussion of the performance of the barrel calorimeter
can be found in ref. 21.
6. THE ENDCAP CALORIMETER
The endcap calorimeters (ECCs) [22] were added to increase the electromag-
netic coverage of the detector. These lead/proportional tube calorimeters are 18
radiation lengths (X0) thick, and cover the angular region between approximately
15’ and 45’ from the beam axis. The first layer of the calorimeter is located 1.37 m
in z from the interaction point. Together with the liquid argon calorimeter, they
provide full electromagnetic calorimetry for 86% of the total solid angle (fig. 17).
19

6.1 Physical Description
Each ECC consists of 36 layers of 0.28-cm-thick lead (0.5 X0) followed by a
plane of 191 proportional tubes. The tubes are aluminum and have a rectangular
cross section of 0.9 X 1.5 cm 2. The 191 tubes are glued together with epoxy to
form an annular plane with inner and outer radii of 40 cm and 146 cm. A 50-pm-
diameter Stablohm 800 ( nit e c romium alloy) wire is strung through the center of k l- h
each tube. Alternating layers of tubes and lead are bonded together with 0.02-cm-
thick epoxy-saturated fiberglass cloth to a flatness tolerance of 0.06 cm. The first
twenty tube planes are oriented alternately in four different directions: vertically
(X), horizontally (Y), canted -45’ (U), and canted $45’ (V). The remaining
sixteen layers alternate between X and Y layers.
The gas (HRS gas) flows at slightly above atmospheric pressure through the
proportional tubes at a rate of one volume per two days. The outer radius of the
ECC consists of sixteen 0.16-cm-thick Lexan panels, which are made gas-tight with
vinyl tape and epoxy.
To compensate for the variation of the gas gain with gas density, the tem-
perature is measured with thermistors embedded in each ECC and the pressure
is measured with transducers on the gas inlets and outlets. The variation of the
ECC response is less than 2% after correcting for density changes. This stability
is verified by the pulse height spectrum recorded by two small tubes that contain
“Fe sources. These tubes, which are mounted on the inlet and outlet of the gas
system for each ECC, are primarily used to monitor the gas quality.
6.2 Electronics
The signals from several tubes are ganged together to reduce the number of
electronic channels to 1276 per endcap. Tubes are grouped in depth and in some
cases laterally to give 10 interleaved measurements of the longitudinal shower de-
velopment. The ganging follows a projective geometry so that all tubes in a channel
lie approximately in a plane containing the interaction point.
20

The first half of the readout electronics [23] of the ECCs consists of charge-
sensitive preamplifiers and shaping amplifiers mounted in electronics crates close
to the detector. These are connected to the tube anodes by coaxial cables that
carry both high voltage and signals. The second part of the system is a set of
SHAM 11s and BADCs [18, 141 1 ocated in the electronics building. The system
is calibrated by injecting a variable amount of charge into the front end of the
preamplifiers. During readout, pedestal and gain corrections are applied to the
data and a threshold cut is made.
6.3 Performance
One of the ECCs was tested in a positron beam and a. pion beam prior to
installation. Figure 18 shows the response of the ECC to pulses containing between
one and five lo-GeV positrons. The five peaks are clearly distinguisha.ble. The
beam test data has been used to develop algorithms that reject 99% of isolated
pions while retaining 95% of electrons at a momentum of 5 GeV/c.
A study of Bhabha scattering events in the ECCs at PEP gave an energy
resolution of 22%/a (E in GeV). S ince the PEP run there has been a substantial
decrease in the number of dead channels and an improvement in the gas tightness
of the system, so this resolution may well improve. A position resolution of 0.27 cm
in both the z and y directions was measured.
A minimum-ionizing particle traversing an ECC deposits energy equivalent to
a 380 MeV photon. The readout electronics are quiet and sensitive enough to allow
this track to be reconstructed in the presence of low backgrounds.
7. MUON SYSTEM
7.1 Physical Description
The Mark II muon system is made up of layers of hadron absorber and pro-
portional tubes mounted on four sides around the central detector. Each wall of
the muon system consists of four-alternating layers of iron and proportional tubes.
21
i The solid angle coverage is 45% at the outermost layer, and the total number of
. interaction lengths is 7.3. The tubes in the innermost layer are oriented perpen-
dicular to the beam direction to measure the polar coordinate of a track, while
the tubes in the outer three layers are oriented parallel to the beam direction to
measure the azimuthal coordinate. The thickness of the muon absorber and the
distance of each plane of chambers from the interaction point are shown in table 3.
Each muon layer consists of extruded aluminum modules made up of eight
triangular tubes as illustrated in fig. 19. The wire spacing of 2.5 cm was chosen
to approximately match the expected multiple-scattering deviation for a particle
passing through each layer of absorber. Each tube contains a 45-pm wire of gold-
plated tungsten held at a voltage of 2.0 kV. The gas used in the tubes is a mixture
of 95% Ar and 5% CO2 at a pressure slightly above atmospheric.
There are 3264 channels (408 modules) in the entire muon system. Signals
from each wire are discriminated at, a level of 2 mV and stored in a shift register
array for readout in a serial chain upon receipt of a trigger signal. Since it is
a digital system, no calibration is necessary. Pulsing the high-voltage line and
reading out all channels allows the integrity of the readout system to be checked
at the beginning of each data-taking run.
7.2 Performance
The muon system provides an identification efficiency of typically great.er than
85% for incident tracks with momentum greater than M 1.8 GeV/c. Below this
momentum all charged particles are expected to range out before the fourth layer,
due to dE/dx losses. Chamber inefficiencies are -N 1 - 2% per plane.
To reject background from hadronic punchthrough and muonic decays of pi-
ons and kaons in multihadronic events, we typically require an extrapolated drift
chamber track to have associated hits in all four layers. These hits are required to
be within a search region of twice the expected rms deviation due to multiple sca,t-
tering and track extrapolation error. Using this strict requirement, the observed
22

i identification efficiency for muons in multihadronic events in the pre-upgrade data . sample was 21 85%. The observed per track muon misidentification probability
was 21 0.5% at low momenta, rising to II 0.8% at 10 GeV/c. At SLC energies
the increased track densities and momenta will lead to more hits in the muon sys-
tem. However, the misidentification probability is not expected to be substantially
higher than at PEP as the better position resolution of the new drift chamber leads
to a smaller search region in each muon system layer.
8. LUMINOSITY MONITORS
Two detectors whose main function is to measure precisely the integrated lu-
minosity have been built especially for SLC running. The Small-Angle Monitor
(SAM) covers the angular range 50 mrad < 8 < 160 mrad, and the Mini-Small-
Angle Monitor (Mini-SAM) covers 15 mrad < 8 < 25 mrad. Both detectors use
small-angle Bhabha scattering to measure luminosity, and both detectors provide
rejection of radiative Bhabha backgrounds in neutrino-counting experiments.
8.1 Small-Angle Monitor
8.1 .l Mechanical design
The SAM consists of a tracking section with nine layers of drift tubes and
a sampling calorimeter with six layers each of lead and proportional tubes (see
fig. 20). Each layer of lead is 13.2 mm thick, giving a total of 14.3 radiation
lengths. There are four SAM modules, two on each side of the interaction point
(IP). The front f ace of the SAM is 1.38 m from the IP. Pairs of SAM modules are
assembled around the beam pipe as is shown in fig. 21. The layers are arranged in
three different orientations. The tubes in the first layer (Y) are horizontal and the
other two layers (U,V) are rotated f30° from Y when looking at the front face of
the SAM from the IP. For both the tracking and calorimetry layers, the pattern of
layerorientation is a series of repeating triplets YUV as seen from the IP.
23
Both the drift and proportional wire planes are constructed from square alu-
minum tubes 9.47 mm wide with a wall thickness of 0.25 mm. The sense wire in
each tube consists of 38-pm-diameter gold-plated tungsten. Positive high voltage is
applied to the sense wires with respect to the tube wall, which is at ground poten-
tial. This voltage is 1800 V for the tracking tubes and 1700 V for the calorimeter
tubes. Each of the four SAM modules contains 30 tubes per layer, giving 270
tracking and 180 calorimeter cells per module. All tubes operate with HRS gas.
Since the gas gain depends strongly on the density, the temperature and pressure
of the gas are monitored by thermistors and transducers mounted on the SAM
modules.
8.1 .Z Electronics
The electronics for the tracking part of the SAM consist of LeCroy LD604
amplifier/discriminators and TACs [IS] that are read out by BADCs [14]. The
calorimeter part is instrumented with custom-designed amplifiers and the signals
are stored in SHAMS [18] which are also read out by BADCs.
Calibration pulses are injected at the input to the amplifier with variable time
delays and constant pulse height for TACs and with constant time delay and vari-
able pulse heights for SHAMS. The resulting signals are fit linearly or quadratically
to extract the calibration constants that are then stored in the BADCs for subse-
quent application to incoming data.
8.1.3 Performance
One of the four identical SAM modules was tested in a beam of positrons at
5, 10 and 15 GeV. The measured tracking resolution was 250 pm, which yields
an intrinsic angular resolution for Bhabha tracks of 0.2 mrad assuming the SLC
interaction point is known. The measured energy resolution in the range of 5-
15 GeV can be parametrized by a/E = 45%/G (E in GeV) for showers near
the center of the SAM active area. The resolution worsens somewhat at the edges
because of radial shower leakage. Longitudinal shower leakage increases from 9% at
24

5 GeV to about 22% at 50 GeV, and fluctuations in this leakage degrade the energy
resolution. The position resolution for locating showers with just the calorimeter
section of the SAM is 5 mm. This number is used for matching tracks with showers
and also represents the precision with which photons entering the SAM can be
located. The SAM Bhabha rate is estimated to be roughly 20% higher than the
visible Z” rate. The expected systematic error on the luminosity measurement is
= 2%.
8.2 Mini-Small-Angle Monitor
8.2.1 Mechanical design
The Mini-SAM surrounds the beam pipe at 2.05 m on either side of the IP (see
fig. 22). It is composed of six layers of 0.64-cm-thick scintillator (BC404 [24] plas-
tic) interleaved with 0.79-cm-thick tungsten slabs providing 15 radiation lengths
in total thickness and resulting in an expected energy resolution of 35%/a (E
in GeV). The first scintillator layer is preceded by two layers of tungsten (4.5
radiation lengths) as a preradiator.. The layers are divided into four equal az-
imuthal segments, each read out with a Hamamatsu R2490 photomultiplier tube
viewing a wavelength shifter bar running the length of each azimuthal segment.
Angular acceptance windows are sharply defined by 5.08-cm-thick conical tungsten
masks (15 radiation lengths). These masks are asymmetric; this reduces changes
in acceptance due to motion of the interaction point, motion of the center-of-mass
of the electron-positron system and bremsstrahlung. The angular acceptance is
15.2 mrad < 8 < 25.0 mrad on one side of the IP, and 16.2 mrad < t9 < 24.5 mrad
on the other side.
8.2.2 Electronics
The Mini-SAM readout electronics are described below in the chapter on small
electromagnetic shower detectors. The Mini-SAM is read out on every trigger to
monitor noise and to provide electron detection for vetoing events in studies such as
neutrino counting. In addition, coincidences are scaled and read out at four-minute
25

intervals to provide an online luminosity measurement. Signals are also sent from
the Mini-SAM to the trigger logic to provide an additional Bhabha trigger.
8.23 Performance
The Mini-SAM as installed was not tested in a beam; however, a very similar
prototype was placed in a 10 GeV e - test beam, and these tests confirmed EGS [25]
shower studies of both the shower profile and the predicted performance of the
tungsten aperture masks. A test of the integrity of the Mini-SAM has been done
using cosmic rays. The observed cosmic ray signals have been used to set an
approximate energy scale for the device.
To make a measurement of the luminosity, small-angle Bhabha pairs must be
detected above a potentially large background from the SLC beams. A Bhabha
pair is defined by back-to-back coincidences of discriminated signal sums of adja-
cent azimuthal segments as shown in fig. 23. The rate of accidentals is measured by
delaying signals from the south Mini-SAM until the next beam crossing and form-
ing coincidences with undelayed signals from the north monitor, and by forming
coincidences between azimuthal segments which are not back-to-back. The tung-
sten masks defining the angular acceptance result in a Mini-SAM Bhabha rate of
approximately eight times the total estimated visible 2’ rate at fi = I&Iz. A lumi-
nosity measurement with a 10% statistical error at a luminosity of 10” cmv2 s-l
would therefore take 1 .l hours.
9. SMALL ELECTROMAGNETIC SHOWER DECTECTORS
The requirements of hermeticity and low-angle coverage have prompted the de-
sign and construction of four small detector systems which provide shower counter
coverage in the solid angle regions not covered by the main calorimeters. Figure 22
shows the small-angle coverage in the 15-250 mrad region provided by three of the
systems described below along with the SAM and the Mini-SAM. The functions
of these detectors include luminosity and noise monitoring as well as detecting
electrons and/or photons escaping through cracks.
26

The photomultiplier tube signals from these four detector systems and the
Mini-SAM are read out and processed as a group, using a BADC-SHAM IV
combination [14, 261 similar to that used by the liquid argon barrel and endcap
calorimeter systems. Calibration and a check of system integrity is performed by
flashing LEDs mounted in detector elements. The brightness of the LED flash
is varied under CAMAC control by changing the time width of the LED driving
pulse: Three CAMAC-controlled LeCroy 4032A 32-channel high-volta.ge units are
used to supply the photomultiplier tube high voltages.
9.1 Catcher/Mask Plug
The Catcher/Mask Plug is located between 25 and 40 mrad in 8 and surrounds
the beam pipe 1.02 m on either side of the interaction point. It consists of two
layers of SCSN-38 scintillator separated by a layer of tungsten, all in the shape
of flat annuli. Light is collected by wavelength shifter bar wrapped around the
outer radius of the detector in 180’ segments. Optical fibers at one end of each
wavelength shifter segment lead the light out to Amperex XP2262 photomultiplier
tubes mounted outside of the solenoidal magnetic field volume.
The Catcher/Mask Plug acts as a crude luminosity monitor, as it detects
Bhabha scattering events at a rate of one-third of that of the Mini-SAM. More im-
portantly, in conjunction with the active mask, it is used to veto radiative Bhabha
events which are a background to neutrino counting.
9.2 Active Mask
The Active Mask is a Cerenkov detector located inside a tungsten synchrotron
radiation mask positioned 63.5 cm from the interaction point. The detector is
comprised of three cylindrical layers of high purity silica optical glass fibers (2400
fibers per mask, each fiber 230 pm in diameter) sandwiched between layers of lead,
each about 0.14 cm thick, which act as a preradiator. The resulting electromagnetic
showers radiate Cerenkov light in the glass fibers which also transport the light from
the detector. Upon leaving the mask, the fibers are collected into bundles which
27

I
are led along the beam pipe and out of the high magnetic field region. Each fiber .
bundle is then viewed by an Amperex 2252H photomultiplier tube. The outer
layer of optical fibers is read out independently of the inner two layers to allow a
coincidence to be made.
The Active Mask provides coverage for the region between the SAM and the
Mask Plug (30 mrad < 0 < 50 mrad), and also acts as a background monitor for
off-energy electrons that strike the beam pipe. Beam test data for a prototype
showed a yield of 1 or 2 photoelectrons per GeV of incident electron energy.
9.3 Endcap Veto Counter -
The purpose of the Endcap Veto Counter is to detect energetic electrons and
photons (2-50 GeV) h h w ic could otherwise pass undetected between the SAM and
the endcap calorimeter. Its efficiency is predicted by computer simulation to be
greater than 99% in this energy range.
The Endcap Veto Counter is an annular electromagnetic shower count,er located
between the endcap calorimeter and the endcap door. It is located at a distance in
z of 1.9 m from the interaction point and covers an angular region of 150-250 mrad
in 8. The counter is composed of four alternating layers of lead and scintillator
resulting in a total of 4.6 radiation lengths of material. Eight wavelengt,h shifter
bars collect the light signal from equal sections of the outer edges of the scintillator
layers. The light is then transmitted through optical fibers to Amperex 56AVP
photomultiplier tubes. By taking a weighted average of photomultiplier signals, a
typical (b resolution of ad = 10’ was measured with cosmic rays; the same resolution
is expected for a 50 GeV electron.
9.4 Liquid Argon Hole Taggers
For 1 cos 191 < 0.7, at each junction between liquid argon calorimeter modules,
a 3’ region in 4 is not instrumented with calorimetry. Liquid Argon Hole Tagger
counters are mounted on the outside surface of the liquid argon cryostat to fill
28

in these “cracks” and to detect. photons escaping through them. They also pro-
vide a very crude energy measurement to assist in the correction of the energy
measurement of showers near or in cracks between modules.
Each counter consists of a slab of 2.5-cm-thick scintillator, 20 cm wide and
1.65 m long, at a radius of 2.4 m from the interaction point. Each counter is
faced with 1.9 cm of lead preradiator, which, along with other detector elements,
gives-a total of 6 radiation lengths of material preceding the scintillator. A Monte
Carlo simulation implies that this should result in a detection efficiency of greater
than 9870 for electrons and photons with energies above 1 GeV. The scintillator
is viewed at both ends by Amperex XP2230 photomultiplier tubes. A single hit
position resolution of oz = 35 cm is obtained for cosmic rays by comparing relative
signal pulse heights at each end. Due to interference from cryogenic plumbing,
individual counters could not extend the entire length of the liquid argon cryo-
stat, so additional shorter hole tagger counters are placed to cover the remaining
uninstrumented region. The crack between the modules at $ = 270’ could not be
instrumented due to physical constraints.
10. TRIGGER SYSTEM
The trigger used for running at the SLC combines a modification of the trigger
used at PEP with new FASTBUS-based logic. At SLC the beam crossing rate can
range between 10 and 180 Hz, although it is not expected to exceed 120 Hz during
the Mark II experiment. Since this allows sufficient time to run the trigger logic
on every beam crossing, beam crossing signals supplied by the accelerator provide
the primary trigger. These signals also provide a highly accurate timing reference
for the electronics systems of the detector components. The interface between the
trigger logic and the host VAX is provided via CAMAC by the Master Interrupt
Controller (MIC) module.
29

10.1 Data Trigger
There are three components of the normal data trigger. They use informa-
tion from the central drift chamber, electromagnetic calorimeters and small-angle
monitors. Each component operates independently and provides a degree of re-
dundancy to assist in monitoring the performance of the other components. This
redundancy is also used to measure their relative triggering efficiencies.
10.1.1 Charged particle trigger
The charged particle trigger uses a fast track-finding processor [27] to count
- the number of charged tracks traversing the drift chamber. Pattern recognition can
be done with up to 12 detector layers; currently, the 12 layers of the central drift
chamber are used. No information about the z-coordinate is used. This design
requires approximately 60 ps to count the charged tracks.
A drift chamber cell is considered “hit” when at least four of the six sense
wires in the cell have signals detected by the TDCs. (The number of wires which
determine a hit is programmable.) This requirement is a powerful means of re-
jecting backgrounds which do not produce track segments. Requiring a track to
traverse more than half a cell produces a geometrical inefficiency of less than 0.5%
for tracks of pt X 1 GeV/c.
The pattern of hits in each layer is loaded into a shift register and transferred
serially into special hardware curve-finding or “curvature” modules as shown in
fig. 24. Each curvature module is programmed to identify patterns of hits falling
within a specific range of radii of curvature called a road. These modules currently
require hits in at least five axial and five stereo layers to define a track, but can
also be programmed to require any pattern of layers.
Track counters are used to record the total number of tracks found as well as
the azimuth of each track. All tracks found by all curvature modules within N 10’
in azimuth of each other are counted as a single track. The total number of tracks
found is encoded into two bits which are passed to the MIC for the trigger decision.
30

i 10.1.2 Calorimeter energy trigger
-
The calorimeter energy trigger uses a table of constants stored in a memory
module to find events with topologies of interest. The event topology is defined by
thresholds placed on the energy deposited in the liquid argon, endcap and SAM
calorimeters, and in small-angle counters.
A programmable Memory Logic Module (MLM) encodes 32 input bits into two
output bits which are returned to the MIC; this requires a few hundred nanosec-
onds. The MLM uses information from the SAM, Mini-SAM and active mask
to form a low-angle Bhabha trigger for luminosity monitoring, while calorimeter
information is used for the Total Energy Deposition (TED) trigger. The TED trig-
ger uses groups of eight adjacent channels (strips in the liquid argon calorimeter;
proportional tubes in the endcap) which are summed at the detector. The sum
representing each LA module is compared with a threshold voltage by a strobed
discriminator [28]. The sum for each endcap is fed into two discriminators with
different thresholds. The value of these thresholds is ultimately limited by the
maximum trigger rate permitted by the data acquisition system.
10.1.3 SSP-based software trigger (SST)
The SST was more recently designed to duplicate the capability of the TED
trigger and, in addition, to provide new software flexibility for improving both its
noise sensitivity and pattern recognition characteristics. The redundancy avail-
able to the two triggers can also provide an important cross check for calorimeter
triggering. A SLAC Scanner Processor (SSP) is the component of the SST which
processes the calorimetric data in a much more flexible manner than the TED trig-
ger. Copies of the LA and EC trigger sums are made by summing/buffer boards
which are then digitized by LeCroy 1885N FASTBUS ADCs. In one pass the SSP
reads out the ADCs and defines “hits” based on three software thresholds. Trigger
algorithms then find calorimetric “towers” (clusters of energy which point to the
IP) by using the hits to index a table of precalculated patterns. (The complexity
31

. of the algorithm is constrained only by the time available between beam crossings.)
Since only the energies of the channels contributing to a tower are summed, the
SST eliminates noise from other channels in the modules. More details on the SST
system may be found in ref. 29.
In addition to the calorimeters, the SST reads out various monitors through its
ADCs. There are 48 ionization chambers in the last section of the SLC beamline,
and 16 proportional tubes along the beamline in the experimental hall (and inside
the Mark II). A n increase in the signals from these monitors is indicative of various
accelerator-related problems such as klystron tube and magnet failures or mis-
steering of the beams.
10.2 Cosmic Ray Tn’gger
Cosmic ray events are needed for debugging and performance evaluation of
individual detector components, including the charged particle trigger, Cosmic
rays can be recorded between beam crossings or during dedicated cosmic ray runs.
The trigger is either the normal charged particle trigger or a coplanar track finder
(CTF) that is used to look specifically for back-to-back tracks. The CTF uses two
curvature modules to estimate the azimuth of tracks, and returns a bit to the MIC
when a pair of tracks is found that are coplanar to within w 11’. The TOF system
provides the absolute time measurement of the cosmic ray that is required by the
drift chamber reconstruction software.
11. EXTRACTION LINE SPECTROMETER
In order to determine the center-of-mass energy (Ecm) at the SLC intera.ction
point (IP), p recise measurements of the beam energies (Ebeam) for both the e-
and e+ beams are essential. To meet the resolution goal of ~E~~/E~,,, < 0.05%,
precision spectrometers have been installed [30] in the SLC extraction lines, 150 m
downstream of the IP in both beam lines.
32

-
11.1 Spectrometer Description
Figure 25 shows a conceptual design of the extraction line. In the line, the
e* bunch travels through a string of three dipole magnets (B31, B32, and B33).
Magnet B32 is a well-measured spectrometer magnet (set at s BdZ = 30.5 kG . m
when Beam is 50 GeV) which bends the beam by an amount proportional to
j- B+hmn~ Magnets B31 and B33 bend the beam perpendicular to the bend
direction of B32 and cause the beam to emit two 5-cm-wide swaths of synchrotron
radiation. Synchrotron light detectors located at the beam focal point (approxi-
mately 15 m from B32) measure the distance between these swaths (approxima.tely
27 cm) and thus the angle through which the beam has been bent by magnet B32.
Combining this information with the strength of the magnet allows a determina-
tion of the energy of the beam. Analysis of the thickness of the synchrotron stripe
yields the energy spread of the beam.
11.2 Magnetic Field Monitoring
Two high-precision, absolute methods were used to make a determination of
the magnetic strength of the B32 magnets before their installation in the extraction
line. The first measured J BdZ directly by moving NMR probes along the length
of the magnet, measuring B and dl for each step. In the second method, f Bdl
was measured by monitoring the voltage induced on a moving loop of wire. These
methods are described in detail elsewhere [31]. The techniques a.greed to better
than 0.008%.
The absolut,e measurements were used to simultaneously calibrate three online
methods of determining the spectrometer strength: a flip coil, NMR probes, and
current monitors. Figure 26 shows a cross section of the magnet with these devices
installed in the gap. Agreement between the flip coil and Nhp1R probes is better
than 0.01%.
33

11.3 Detection of Synchrotron Radiation .
The bend magnets cause the beam to emit intense swaths of synchrotron ra-
diation with a critical energy [32] of approximately 3.0 MeV. An energy spread of
0.2% in the bunches causes the stripe from B33 to be dispersed by about 540 pm at
the detector plane. Two independent detectors have been built to detect the sepa-
ration and width of the two synchrotron swaths: a Phosphorescent Screen Monitor
(PSM) (fig. 27) and a Wire Imaging Synchrotron Radiation Detector (WISRD),
which is not yet in operation (see sec. 13.4).
The PShl consists of two identical target and camera systems to monitor both
stripes simultaneously. An Invar [33] support structure holds both targets and fixes
the distance between them. Each target consists of an array of lOO-pm-diameter
fiducial wires with center-to-center spacing of 500 pm and a phosphorescent screen
that emits light where struck by the synchrotron beam [34]. The individual wires
and the spacing between the two arrays were measured on precision optical com-
parators to an accuracy of better than 10 pm. A camera system records both
the fiducial wires and the synchrotron stripe which runs parallel to them. The
video frame is digitized and compressed by a DSP Technology 2030/4101 signal
averager into a one-dimensional array (perpendicular to the wire direction) before
readout. Ultimate system resolution has been measured to be better than 25 pm
and readout rates up to SLC design repetition rate (lS0 Hz) are possible.
-
11.4 Performance
In addition to the errors on the measurement of J Bdl and the separation be-
tween the synchrotron stripes, there are other contributions to the error on measur-
ing Ebean. Th ese contributions include the survey of distance and misalignments
between B32 and the detectors, and misalignments between bend magnets. Com-
bining these contributions in quadrature yields an estimated total error on Ebea,,,
of 15 MeV. However, knowledge of the average energy of the beam bunch does
not necessarily determine the luminosity-weighted E,, at the IP. Complete under-
standing of correlations between particle position and energy in the two colliding
34

* bunches is essential to limit the systematic error on the energy measurement. Pre-
. liminary measurements of Abeam have been made in both extraction lines using the
PSM’s and the magnetic monitors. An absolute accuracy of 35 MeV on E,k has
been achieved.
12. DATA ACQUISITION SYSTEM
Data acquisition for the Mark II detector is performed by a system of soft-
ware and hardware elements. The software consists of a number of independent
processes running on the host VAX 8600 under the control of the VMS operating - system. Each process performs a primary function and communicates with the
other processes via shared memory (global) variables, shared instructions and a
form of interprocess communication known as event flags. These functions include:
reading CAMAC data; reading FASTBUS data; merging of raw data with results
from online event tagging; tape logging of data records; disk logging of tagged data
records; monitoring of detector performance, electronics and environmental status;
online analysis and histogramming; and operator control of the experiment.
All data from the detector are channeled into the VAX through either the
CAMAC or FASTBUS interfaces. The amount of data read per event varies with
the event topology. A Z” decaying into 20 charged particles will typically result in
approximately 50 kbytes of data.
The CAMAC interface is a UNIBUS-based microprocessor system called the
VAX CAMAC channel or VCC [35]. This system is capable of transferring 24 bits
of data every 2 p.s. Generally, however, only the least significant 16 bits are used
resulting in a transfer rate of 1 Mbyte/s. The VCC operates a parallel branch
serving two system crates [13]. Th ese system crates contain a total of 11 branch
drivers which connect with the 44 data acquisition crates. Event triggers are gen-
erated within the CAMAC system and are posted as AST (Asynchronous System
Trap) interrupts on the VAX. CAMAC event acquisition consists of multiple VAX
reads of individual BADC memories and other general instrumentation modules.
35

. The FASTBUS system interface consists of two parts. The first part is a DEC
DR-780 32-bit parallel port which connects the VAX SBI (Synchronous Backplane
Interconnect) with a DDI (DR-32 Device Interconnect) cable. This DDI cable
connects with another interface [36] which provides access to a FASTBUS crate
segment through a simple buffer module, BAFFO (see fig. 28). The combined in-
terface supports interrupt messages and block transfer data rates of approximately
5.5 Mbyte/s between the VAX and an SSP. Two FASTBUS crates running in par-
allel serve as system crates. One system crate contains five system SSP modules
that each in turn control one of the five FASTBUS cable segments connected to
the 25 remote data acquisition crates [37]. Each remote crate contains a single SSP
acting as an intelligent crate controller and data processor, along with the data
acquisition modules. The second system crate contains a pair of SSPs managing a
sixth cable segment used for a future project involving online data processing (see
sec. 13.5). Event acquisition begins with remote crate SSPs performing local data
readout and processing, then reporting to the appropriate system SSP. The master
system SSP acts as an event builder, collecting the entire FASTBUS component of
an event into its own local memory before interrupting the VAX. In this way, the
FASTBUS system is able to buffer several events before being read out. The VAX
then performs a single block read from the master system SSP.
Event acquisition proceeds in the following way. A signal is generated at every
beam crossing (e.g., 8.3 ms at 120 Hz). This signal starts the trigger logic (see
sec. 10) and BADC processing which requires approximately 8 ms. Note that no
dead time is introduced as a result of running the trigger logic for every beam
crossing. The VAX reads data from the entire CAMAC system and awaits a signal
from the master system SSP that the FASTBUS system is ready to accept the
next event. When the signal is received the trigger is reset. FASTBUS data is
subsequently read into the VAX, combined with the CAMAC data and a simple
event tagging algorithm is executed. The event is then placed into a global buffer
where consumer processes, such as the online analysis program, sample the com-
36

plete events. The tape logging process is the final consumer of all events and, after
logging is completed, removes the event from the buffer.
13. FURTHER IMPROVEMENTS
There are several projects which improve the Mark II detector that are in the
process of being installed. They will be briefly described here.
13.1 Silicon Strip Vertex Detector
The Silicon Strip Vertex Detector (SSVD) consists of 36 independent detector
modules housed in two hemi-cylindrical structures that attach to the beam pipe at
the interaction region. The modules are grouped into three radial layers (starting
at 2.8 cm from the beam axis) that provide a solid angle coverage comparable
to the central drift chamber (see fig. 29). The strips are oriented parallel to the
beam axis and hence track position. is measured only in the r - 4 plane. The
detecting element in each module is a single-sided, 512-strip silicon detector of
300-pm thickness. Additional properties of the detectors are given in table 4.
The problem of reading out a high density of silicon strips in the limited space
available for the vertex detector in the Mark II was solved with the development
of a custom 12%channel VLSI chip (the “Microplex”) [38]. The circuit integrates
and stores the charge deposited on a strip and multiplexes the analog signal onto
a serial bus. In the construction of a module, four chips are wire bonded to a
detector as shown in fig. 30 so that all 512 strips can be read out. The module
also includes a hybrid circuit which provides control signals, a switchable capacitor
bank for the power, and a differential amplifier and line driver for the analog output
signals. Thin flexible cables are used to carry signals to both ends of the modules
and from the hybrids to the readout chips. The analog output signals are sent to
an intelligent digitizer, the BADC [14], which does online pedestal updating and
subtraction; common mode correction and cluster finding.
37

-
The 36 modules are housed in two hen&cylindrical structures each consisting of
two slotted aluminum endplates connected by an inner and outer beryllium shell.
A spring fixture on either end of the modules holds them in the endplate slots.
This system sets the parallelism of the detector strips to better than a milliradian,
a requirement that follows from the z resolution of the central drift chamber.
The precise determination of the relative alignment of the modules is obtained by
optical measurements during assembly, and later by a method that uses a beam
of collimated X-rays. Once the SSVD is installed in the center of the Mark II
detector, it will be aligned as a whole relative to the other tracking chambers using
tracks from beam-beam interactions. Also, a capacitive sensor system has been
attached to the outer shells of the SSVD to monitor any movement of the beam
pipe, and hence the SSVD, relative to the drift chamber vertex detector.
Tests of the modules with X-ray sources and particle beams show that they
have a spatial resolution, CT, of better than 5 pm, a two-track separation of ap-
proximately 150 pm and a single-channel rms noise level 19 t,imes smaller than
the signal corresponding to the most probable energy loss of a minimum ioniz-
ing particle incident at 90’ [39]. Th is signal-to-noise ratio allows a threshold cut
that gives essentially 100% detection efficiency with a negligible number of noise
hits. Combining hits from high momentum tracks in the central drift chamber
with those from the SSVD yields an impact parameter resolution for high momen-
tum tracks comparable to cr. Multiple scattering in the material of the SSVD and
beam pipe worsens this resolution at low momentum. The resultant error can be
approximated by 0 + 36/p (pm) f or momenta, p, of less than 8 GeV/c.
13.2 Drift Chamber Vertex Detector
The Drift Chamber Vertex Detector (DCVD) has been designed to provide
vertexing information that is both independent of and complementary to the in-
formation provided by the Silicon Strip Vertex Detector. The DCVD alone is
designed to provide an impact parameter resolution of 20 pm for high momentum
tracks, and submillimeter double-track resolution. The powerful pattern recogni-
38

tion of the DCVD will provide an important aid to hit assignment in the SSVD, .
particularly in a high noise environment. The DCVD will also improve the charged
particle momentum resolution, enhance dE/dx particle identification, and improve
the noise rejection of the charged particle trigger.
The active volume of the DCVD extends from 5 to 17 cm radially and 55 cm
axially, covering 85% of 47r in solid angle at the outer radius of the detector. The
chamber is divided into 10 axial cells which, as for the SSVD, provide information
only in the r-4 plane (fig. 31). T o allow resolution of the left-right ambiguity, as
well as to ensure that radial tracks do not spend their entire length close to a wire
- plane, each cell is tilted so that the inner edge of the sense plane is at an angle of
15’ from radial.
Each cell contains a plane of 40 sense (anode) wires, at a voltage of $3 kV,
alternating with grounded field shaping wires (fig. 32). These sense planes are
sandwiched between ‘grid’ planes at -0.5 kV that provide the electrostatic stability
of the sense wires and serve to focus the drifted electrons onto the sense wire.
A drift field of 2.3 kV/ cm, uniform to within 0.1% over two-thirds of the active
volume, is provided by planes of cathode wires, with voltage graded between -3 kV
at the inner radius of the detector to -12.5 kV at the outer radius. The longest
drift distance, between the cathode and sense planes at the outer edge of the active
volume, is about 5.5 cm.
The wires are supported by Macor wedges, which are affixed to circular alu-
minum endplates which form the ends of the active region (fig. 31). Within each
plane, wire position was established by grooves machined into two Invar cylinders,
which were used to hold the wires in place as they were epoxied to the Macor
wedges. In this way, tolerances of f2 pm were obtained for wires within a single
plane, and of f15 pm for the offset between planes. A more detailed description
of the cell construction can be found in ref. 40.
The chamber volume is sealed by two aluminum pressure heads, surrounded
by an outer shell of aluminum and an inner core of beryllium. Including the beam
39

-
pipe and SSVD, the material between the interaction point and the active region
of the chamber comprises a total of about 0.03 radiation lengths.
To achieve the best spatial resolution, the DCVD gas (92% COz, 8% ethane)
is run in the unsaturated regime, which provides low electron diffusion and a slow
(6 pm/nsec) drift velocity. A sufficient electron lifetime, in excess of 30 psec,
is obtained by use of an Oxisorb filter, which reduces oxygen contamination to
less than 1 ppm. In addition, chamber performance in a slow gas is sensitive
to the density of the gas, requiring the use of feedback-controlled pressure and
temperature regulation. The latter is implemented by a computer-controlled water
bath (Haake N2-R), h h w ic circulates water through a 6-mm aluminum tube around
the two pressure heads and the outer shell of the detector. The temperature field
is monitored by 48 thermistors surrounding the active volume of the detector.
This system is expected to keep the temperature of the detector constant and
spatially uniform to within 0.1’ C. Chamber pressure is regulated to within 0.7 x
10s3 atmospheres by a Datametrics I501 Pressure Controller.
Electronic readout and processing begins with fast integrating Radeka hybrid
preamps (BNL Hybrid IO-354), which are mounted onto feed-throughs at the
pressure head, and enclosed in aluminum Faraday cages. The signals then travel
to postamplifiers and FADCs [41], both of which are similar to the corresponding
electronics of the central drift chamber (discussed in sec. 2.2). Because of the long
drift times associated with the low drift velocity, the FADC digitization window
has been increased to 1024 lo-nsec buckets.
Tests have been conducted [42] on a prototype chamber with a single sense/grid
plane containing 22 sense wires, a drift field of 1 kV/cm/atmosphere, and using
92% C02, 8’3’ I b t o so u ane at 3 atmospheres. The single hit spatial resolution u was
found to be dominated by the electron diffusion in the pressurized thermal gas,
and can be parametrized by:
40

cr2 [pm2] = 162 + D - 232 ,
where D is the drift distance in centimeters.
-
13.3 Muon System Upgrade
13.3.1 Ph ysicaI description
The Mark II muon upgrade provides additional coverage on the front and rear
of the detector, as shown in fig. 1. The “facades” increase coverage for muon
detection to jcos0\ M 0.85, an increase of 15% in solid angle.
A schematic drawing for a lower facade can be seen in fig. 33. The facade is
attached to the end flux return iron and is 2.7 m in z from the IP. A particle coming
from the interaction point will penetrate the endcap electromagnetic calorimeter,
the flux return and 30 cm of lead, a total of 6.0 interaction lengths, before it reaches
the first detection chambers. After passing through an additional 20 cm of iron
there is a second layer of chambers at the rear of the facade. This set of chambers
is shielded from synchrotron radiation by a 3-cm iron plate.
The chambers are constructed from the same aluminum extruded stock as the
original Mark II muon system (see fig. 19 ). The triangular chambers are grouped
together to form modules, with 72 modules (576 chambers) in all. Both layers
in a facade have wires oriented in the horizontal direction. The construction and
assembly followed the same steps as the central muon system described in sec. 7.1.
This system does differ from the original system in that HRS gas is used in the
chambers.
13.3.2 Electronics
Signals from a muon module (8 channels) are carried on 90-R AMP ribbon
coaxial cables to half-size VME cards that use Signetics NE592 amplifiers with
gains of 200. The amplified signals pass to VME crates, mounted on the plate on
the rear of the facade, containing 16-channel TDC cards in VME format. Common
41

clock, clear and threshold signals are supplied to each VME crate and distributed
on a local timing bus. The clock period is 13 ns.
The system contains a total of four crates with TDCs, all read from a common
master crate through VME Micro Systems Model 485 long-line extenders. Com-
mand input and event readout is handled by an AT&T 321SB computer located
in the master crate. The event information is sent to a FASTBUS FIFO module
over a 32-bit parallel path at RS422 levels. The FIFO module is located in one of
the data acquisition system FASTBUS crates.
The electronics system will provide drift time information in addition to the
wire number that was hit. For a small test module, the precision of the position
measurement is about 250 pm. A precision of 500 pm in the installed system is
estimated.
13.3.3 Muon identi.cation
The implementation for muon -identification in the upgrade will follow the
scheme used by the main system. A drift chamber track is first extrapolated
to the muon facade. An expected rms deviation due to multiple scattering is
calculated and a search region of twice the deviation (a road) is defined around
the extrapolated track. To be identified as a muon, the track must have hits in
both layers in the defined road. Additionally, the track hits must pass an angle cut
and a position-angle correlation cut. Monte Carlo simulations have shown that the
efficiency for muon identification is comparable to the existing muon system. The
punchthrough probability for pions and kaons can be parameterized as 0.055 x p%,
where p is the momentum of the track in GeV/c.
13.4 Wire Imaging Synchrotron Radiation Detector (WISRD)
The WISRD will provide redundancy and a check on the systematic error
in the measurement of the position of the synchrotron stripes in the extraction
line spectrometer. In the WISRD, there are two targets held in position by an
Invar support structure (fig. 34). The targets consist of arrays of 75-pm-diameter
42

copper wires spaced 100 pm apart (center-to-center). The wires are held in place . in a ceramic card which is glued to the support structure. Incident synchrotron
radiation ejects electrons from the wire via Compton scattering. The residual
charge (calculated to be 200 fC with 101’e* in the beam bunch) is sampled by
a charge sensitive preamplifier (LeCroy HQVSZO), then amplified, shaped, and
digitized. Design resolution of this system is 25 pm with a readout rate of 180 Hz.
13.5- Online Processing
The 3081/E [43] is a specialized reduced instruction set processor, developed
jointly by SLAC and CERN, to provide significant numerical computation capa- -
bility at a reasonable cost. The name derives from its emulation of the instruction
set of an IBM mainframe computer. It can realize most FORTRAN 77 directives
including double precision floating point arithmetic operations.
13.5.1 Hardware
The hardware architecture is characterized by a modular structure, permitting
separation of functions and reduction of control logic complexity. There are four
distinct execution boards performing computations involving integer arithmetic,
floating point addition, floating point multiplication, and floating point division.
Each processor contains up to 7 Mbytes of fast static memory (55-nsec access time)
and the processor cycle time is 120 nsec.
13.5.2 Software
Programs for execution on the processor are prepared by a software procedure
called the Translator, resident on the IBM mainframe computer. This procedure
reads IBM object code, translates it to processor microcode, and links elements
together to form an absolute load module. The Translator eliminates the need
for a complex hardware interpreter to decode the IBM instructions. In addition,
it automatically generates simultaneous overlap of parallel operations (pipelining)
to yield significant gains in effective processor execution speed. The two types
43

of pipelining include overlap of memory address calculations with memory access, . and overlap of instructions permitted by separated function execution modules.
13.5.3 Implementation
The 3081/E p rocessor hardware is incorporated into the Mark II online data
acquisition system and the software is currently undergoing testing before imple-
mentation. The data flow between the VAX and 3081/E is controlled by two
SSPs on a cable segment. The communication between the SSPs and the 3081/E
processor is facilitated by an interface [37, 441 within the 3081/E chassis. The in-
- terface consists of two boards, one of which is specific to FASTBUS and the other
a common interface board useable by other interfacing schemes. The FASTBUS
board is a dual-ported slave, permitting access from either of two cable segments.
This arrangement provides for loading new data into one processor while fetching
processed output from another. The common interface board supports transfers
at 25 Mbyte/set to and from 3081/E memory and provides control of program
execution.
13.5.4 Performance
‘The degree to which a particular application software permits pipelining can
result in large performance variations. A version of the full Mark II event re-
construction analysis program has been successfully implemented on the 3081/E.
Preliminary performance tests used high-multiplicity Monte Carlo hadronic events
at SLC energies. When the kernel of the program (the dominant user of CPU time)
is translated with pipelining options, the processor takes about twice as long to
process events as the SLAC IBM 3OSlK mainframe computer. When the pipelining
is suppressed, the performance degrades by about 40%. Similar results have been
achieved with a sample of PEP Bhabha scattering events.
44

* 14. SUMMARY
-
The properties of the various components of the detector are summarized in
table 5. Most of the quoted resolutions were measured using Bhabha scattering
events at PEP; the individual chapters should be consulted for more details.
15. ACKNOWLEDGMENTS
There are many people who have contributed to the design, construction and
operation of the Mark II detector over the past 12 years. The fact that several
components of the original detector built at SPEAR are in use today is a tribute
to the skill of those involved. We gratefully acknowledge all of the physicists,
engineers and technicians who have helped us over the years. We also wish to
acknowledge the important contributions of the following people to the design
and engineering studies leading to the successful upgrade of the Mark II detector:
R. Baggs, D. Bernstein, L. Barker, K. Bouldin, H. Brafman, D. Briggs, R. Cooper,
D. Day, B. Denton, S. Dyer, R. Fuzesy, B. Gray, J. Hanson, C. Hoard, D. Horelick,
R. Horne, N. Hower, R. Jared, F. Kirsten, M. LaTeur, J. Mann, J. Mark, B. hlartin,
K. Mirk, T. Nakashima, W. Nilsson, J. Olsen, E. Ordinario, L. Paffrath, W. Pope,
D. Porat, H. Rogers, W. Rowe, R. Stickley, M. Studzinski, Y.-Y. Sung, J. Tinsman,
T. Walker, K. Warfield, and T. Webster.
Several of us are supported by outside foundations. M. W. Schaa.d acknowl-
edges the support received from the Swiss National Science Foundation. G. Gratta
acknowledges the Italian INFN for their support. J. J. Gomez Cadenas and
L. Labarga thank the Fulbright Foundation. M. Kuhlen acknowledges the Alexan-
der von Humboldt Foundation for their support.
This work was supported in part by Department of Energy contracts DE-
AC03-SlER40050 (CIT), DE-AM03-76SFOOOlO (UCSC), DE-AC02-86ER40253
(Colorado), DE-AC03-83ER40103 (Hawaii), DE-AC02-84ER40125 (Indiana),
DE-AC03-76SF00098 (LBL), DE-AC02-84ER40125 (Michigan), and DE-AC03-
76SF00515 (SLAC); and by the National Science Foundation (Johns Hopkins).
45

REFERENCES
1. B. Richt,er, SLAC-PUB-4367, 1987 Lepton and Photon Symposium.
SLAC-229, C onceptual SLC Design Report, June 1980.
2. hlark II Collaboration, Proposal for the Mark II at the SLC, CALT-GS-1015?
April 1983 (also SLAC-PUB-3561, January 1985).
3. W. Farr et al., Nucl. Instr. and Meth. 156 (1978) 283.
4. G. Hanson, Nucl. Instr. and Meth. A252 (1983) 343.
5. D. Briggs et al., IEEE Trans. Nucl. Sci. NS-32 (1985) 653.
6. D. Bernst,ein et al., IEEE Trans. Nucl. Sci. NS-33 (1986) 86.
7. H. Brafman et al., IEEE Trans. Nucl. Sci. NS-32 (1985) 336.
8. J. Per1 et al., h’ucl. Instr. and Meth. A252 (19%) 616.
9. J. Va’Vra et al., Nucl. Instr. and Meth. 203 (1982) 109.
10. D. Schaile et al., Nucl. Instr. and Meth. A242 (19%) 247.
11. Manufactured by Kyowa Gas Chemical Industry, Japan.
T. Inagaki and R. Takashima, Nucl. Instr. and Meth. 201 (1982) 511.
12. Sylguard 184 resin and curing agent mixed with Dow Corning 200 Electronic
Fluid with the viscosity of 20 cent. stokes.
13. J. E. Grund, IEEE Tmns. Nucl. Sci. NS-27 (1980) 599.
J. S. Brown et al., Nucl. Instr. and Meth. 221 (1984) 503.
14. M. Breidenbach et al., IEEE Trans. Nucl. Sci. NS-25 (1978) 706.
15. W. Braunschweig et al., Nucl. Instr. and Meth. 134 (1976) 261.
16. G. S. Abrams et al., IEEE Trans. Nucl. Sci. NS-25 (1978) 309.
G. S. Abrams et al., IEEE Tmns. Nucl. Sci. NS-27 (1980) 59.
17. W. J. Willis and V. Radeka, Nucl. Instr. and Meth. 120 (1974) 221.
18. E. Cisneros et al., IEEE Tmns. Nucl. Sci. NS-24 (1977) 413.
46

19. R. L. Ford and W. R. Nelson, EGSS, SLAC-210, June 1978.
20. M. Nelson et al., Phys. Rev. Lett. 50 (1983) 1542.
21. M. E. Nelson, Ph.D. thesis, LBL-16724mc, October 1983.
D. A. Karlen, Ph.D. thesis, SLAC-325, March 1988.
22. J. A. Kadyk, Proceedings of the Gas Sampling Calorimetry Workshop II,
Batavia, IL (1985) 373.
23. R. C. Jared et al., IEEE Trans. Nucl. Sci. NS-33 (1986) 916.
24. Manufactured by BICRON Corporation, Newbury, OH.
25. W. R. Nelson et al., SLAC-Report-265, December 1985.
26. E. Cisneros et al., IEEE Trans. Nucl. Sci. NS-28 (1981) 465.
27. H. Brafman et al., SLAC-PUB-2033, October 1977.
T. Himel, Ph.D. thesis, SLAC-REP-223, October 1979.
28. J. E. Grund, IEEE Trans. Nucl. Ski. NS-26 (1979) 220.
29. R. Aleksan et al., Proceedings of the International Conference on The Impact
of Digital Microelectronics and Microprocessors on Particle Physics, World
Scientific (1988) 38.
30. Mark II Collaboration and SLC Final Focus Group, SLAC-SLC-PROP-2,
April 1986.
31. M. Levi et al., Precision Measurements of the SLC Spectrometer Magnets,
SLAC-PUB-4654.
32. There are different definitions of critical energy that are commonly used.
This paper uses J. D. Jackson, Classical Electrodynamics, 2nd edition, John
Wiley and Sons (1975) 675.
33. Iron-nickel alloy with low thermal expansion coefficient.
34. J. Seeman et al., SLAC-PUB-3945, April 1986, published in proceedings
LINAC86, 441.
47

35. D. J. Nelson et al., IEEE Trans. Nucl. Sci. NS-28 (1981) 336.
36. E. J. Siskind, IEEE Trans. Nucl. Sci. NS-30 (1983) 188.
37. A. J. Lankford and T. Glanzman, IEEE Trans. Nucl. Sci. NS-31 (1984) 225.
T. Barklow et al., IEEE Trans. Nucl. Sci. NS-33 (1986) 775.
38. J. T. Walker et al., Nucl. Instr. and Meth. 226 (1984) 200.
- G. Anzivino et al., Nucl. Instr. and Meth. A243 (1986) 153.
39. C. Adolphsen et al., IEEE Trans. Nucl. Sci. NS-33 (1986) 57.
C. Adolphsen et al., Nucl. Instr. and Meth. A253 (1987) 444.
C. Adolphsen et aE., IEEE Trans. Nucl. Sci. NS-35 (1988) 424.
40. K. Hayes, Nucl. Instr. and Meth. A265 (1988) 60.
J. Jaros in Vertex Detectors, F. Villa, ed., Plenum Press, New York (1988) 37.
41. L. Barker, SLAC-PUB-4757, October 1988.
42. J. Alexander et al., Nucl. Instr. and Meth. A252 (1986) 60.
43. P. Rankin et al., Proceedings of the Conference on Real-Time Computer
Applications in Nuclear and Particle Physics, Chicago, Illinois (1985) 1321.
P. F. Kunz et al., Proceedings of the Symposium on Recent Developments
in Computing, Processor, and Software Research for High-Energy Physics,
Guanajuato, Mexico (1984) 197.
P. F. Kunz et al., Proceedings of the Three-Day In-Depth Review on the
Impact of Specialized Processors in Elementary Particle Physics, Padova,
Italy (1983) 84.
44. L. Barker et al., Proceedings of the Nuclear Science Symposium, San Fran-
cisco, California (1985) 793.
48

FIGURE CAPTIONS
-
1) Cut-away view of the upgraded Mark II detector showing major components.
The two vertex detectors are not currently installed.
2) Cell design for the central drift chamber.
3) Schematic of the central drift chamber electronics.
4) Tracking efficiency for the central drift chamber as a function of cos 8. The
hadronic events (boxes) are from a Monte Carlo study at SLC energies; the
Bhabha scattering events (dots) are from a sample of PEP data. Error bars
are shown only for the Monte Carlo events.
5) Central drift chamber position resolution versus drift distance, with (solid
circles) and without (open circles) the time-slewing correction.
6) Efficiency for separating two tracks as a function of their distance apart for
the central drift chamber TDCs (X’s) and FADCs (closed circles).
7) Momentum resolution for the central drift chamber. The tracks are selected
from Bhabha scattering events and a constraint that the track 0riginat.e from
a single point is used. The magnetic field was 4.5 kG.
8) dE/dx versus momentum as measured for tracks at PEP. The number of
particles in the electron, muon, kaon and proton bands are enhanced relative
to the pion band that would normally dominate the plot.
9) Electron-pion separation for tracks in the momentum range 0.25-0.60 GeV/c.
The particles are from two different event samples and so are not in their
usual proportions.
10) Laser calibration system schematic for the TOF system. The figure also
shows the locations for the calibration optical fibers in a typical counter.
11) Resolution of TOF system obtained from a sample of Bhabha events.
12) Pion/kaon/proton separation using the TOF system. Data are from PEP.
49

I
-
13) Electron-hadron separation for dE/dx without (solid line) and with (dashed
line) TOF information. The dips in the solid line occur when the noted
particle and the electron have the same dE/dx value for the same momentum
(see fig. 8).
14) Ganging scheme for the channels in the liquid argon barrel calorimeter.
15) Measured energy distribution for the liquid argon calorimeter from Bhabha
scattering events at PEP. The histogram represents Monte Carlo simulation.
16) Monte Carlo simulation of the barrel calorimeter energy resolution a.s a func-
tion of energy and angle of incidence. The three values shown for angle of
incidence are 8.1’ (open circles), 25.0’ (closed circles), and 35.7’ (boxes).
2
17) Total calorimeter thickness (solid line) and number of sampling layers (dashed
line) vs. cos 8. The shaded area shows the region used for calculating the solid
angle coverage.
18) Response of the endcap calorimeter to small numbers (l-5) of lo-GeV positrons.
19) Cross section of a muon module.
20) Side view of one of the four SAM modules showing its location inside the
Mark II detector.
) View of two SAM modules as seen from the interaction point. The figure
shows the orientation of drift and proportional tubes as well as the method
of assembly around the beam pipe.
) Small-angle coverage in the Mark II.
23) Geometry of the Mini-SAM. As an example, in the ‘Signal Used’ definition,
12s means the signal sum of quadrants 1 and 2 being over a Bhabha threshold
in the south monitor.
24) Block diagram of the charged particle trigger.
25) Conceptual design of the Extraction Line Spectrometer (ELS) system.
50

26) Cross section of a B32 magnet showing the locations of magnetic strength
measuring devices in the magnet gap.
27) Schematic view of the Phosphorescent Screen Monitor (PSM).
28) FASTBUS architecture for the Mark II data acquisition system.
29) The layout of the Silicon Strip Vertex Detector (SSVD).
30) The plan for a silicon detector module. All dimensions are in mm.
31) Cut-away drawing of the Drift Chamber Vertex Detector (DCVD).
32) Wire and electrode placement in the jet cells of the DCVD. -
33) Schematic drawing of lower muon facade.
34) Schematic view of the Wire Imaging Synchrotron Radiation Detector (WISRD).
51

Table 1. Design parameters for the cen’tral
drijt chamber.
Radius at Stereo Angle Number ;ayer Center (Degrees)
(cm) Wire 1 Wire 6 Czls
1 27.05 0 0 26
2 38.25 3.65 4.07 36
3 48.45 0 0 46
4 59.25 -3.73 -4.00 56
5 69.45 0 0 66
6 80.15 3.76 3.96 76
7 90.35 0 0 86
8 100.95 -3.77 -3.93 96
9 111.15 .o 0 106
10 121.65 3.77 3.91 116
11 131.85 0 0 126
12 142.35 -3.78 -3.89 136

Table 2. Orientation, width and number of
strips per layer in each liquid argon module. .
Strip 1 :;ziunrF / F;i; / StriycI)idth Strip Coordinate
I
umber Strip Width Layer Layer Measured Strips (cm)
d 4 e U
rrigger rrigger d
1 1 4
2 2 e 3 3 U
4 4 d
5 5 e
6 6 U
7 7 4
8 8 e 9 9 U
10 10 4
11 11 e 12 12 e 13 13 e 14 14 4
15 15 4
16 16 4
17 17 4
18 18 4
d e U
4
e U
4
e e e
4
4
4
4
4
36 3.5
38 3.5
100 3.5
70 5.4
38 3.5
100 3.5
70 5.4
40 3.5
100 3.5
36
38
100
70
38
100
70
40
100
70
40
100
100
100
40
40
40
40
40
70 5.4
40 3.5
3.5
3.5
3.5
5.4
3.5
3.5
5.4
3.5
3.5
5.4
3.5
3.5
3.5
3.5
3.5
3.5
3.5
3.5
3.5
100 3.5
100 3.5
100 3.5
40 3.5
40 3.5
40 3.5
40 3.5
40 I 3.5

* Table 9. Muon absorber geometry: d is the perpendicular distance of
. the absorber from the interaction point; X is the thickness of the absorber
in nuclear interaction lengths.
-
Level
Before 1
1
2
3
4
Total
r East
d (4
3.2
3.6
4.0
4.5
T TOP I West I Bottom I
x 1.17
1.38
1.40
1.85
1.49
7.28
cl WI x I d (4
2.5
2.8
3.2
3.6
1.17
1.38
1.40
1.81
1.40
7.16
3.2
3.6
4.0
4.5
Xldol 1 1.17 1.17
1.38 2.5 1.38
1.40 2.8 1.40
1.85 3.2 1.85
1.85
7.65

Table 4. Properties of the Silicon Strip Vertex Detector. .
Detector Property Layer 1 Layer 2 Layer 3 Units
Layer radius 28 33 37 mm
Strip pitch 25 29 33 Pm
Strip width 8 8 8 Pm
Active length 72 82 90 mm
Depletion voltage N 55 N 55 N 55 V
Capacitance* 8.2 8.8 9.3 PF (to other strips)
Capacitance* 0.6 0.8 1.0 PF (to backplane)
* Calculated.

Table 5. Summary of detector properties. .
Central Drift Chamber l Active length 2.30 m. l Inner radius 0.192 m, outer radius 1.52 m.
0 Six axial layers, six stereo layers.
l Jet-chamber cell with six sense wires.
l 89% Ar, 10% COz, 1% CH4. 0 Position resolution 170 pm.
l Momentum resolution a(p)/p2 = 0.31% (GeV/c)-‘.
l dE/dx resolution 7.2% for minimum ionizing particles.
Time-of-Flight l 48 scintillation counters read out at both ends.
l Inner radius 1.52 m, covers 70% of 47~.
0 c7 = 221 ps.
l e/a separation up to momenta of 10 GeV at 2a level
Magnet
(combined with dE/dx).
l 5.0 kG Al coil solenoid.
l 1.56 m inner radius.
Electromagnetic
Calorimetry
Barrel l Eight modules of Pb/liquid argon
in an octagon around the coil.
l 14.1 X0, covers 64% of 47r. l 2-mm Pb sheets separated by 3-mm liquid argon gaps.
l Strip readout in 6, 4, U directions.
l AE/E = 13.3%/a $3.3%.
Endcaps l Two annular Pb/proportional tube modules.
l Inner radius 0.40 m, outer radius 1.46 m.
l 18 X0, 22% of 47r. - with the barrel, get full coverage for 86% of 47r.
l 0.28-cm Pb sheets with 0.9 x 1.5 cm tubes.
l 89% Ar, 10% CO2, 1% CH4. l Ganged readout in X, Y, U, V directions.
l AE/E Z 22%/a.
Continued.. .

Muon System l Proportional tubes interleaved with steel
absorber (4 layers for 1.2-m total thickness).
0 Covers 45% of 47r.
Luminosity Small Angle Monitor (SAM)
Monitors l Covers 50 to -160 mrad, 1.38 m in z from IP.
l Nine layers of drift tubes for tracking.
l Position resolution 250 pm.
l 89% Ar, 10% CO2, 1% CH4. l Readout in Y, U, V directions.
l Six layers of Pb/proportional tubes for
calorimetry, 14.3 X0.
l AEIE = 45%ffi. Mini-SAM
l Covers 15-25 mrad, 2.05 m in z from IP.
0 Six layers of tungsten/scintillator, 15 X0.
l AEJE = 3570/a.
Small Electromagnetic Catcher/Mask Plug Shower Detectors l 25-40 mrad, 1.02 m in z from IP.
l Two layers of tungsten/scintillator.
Active Mask l 30-50 mrad, .635 m in z from IP.
l Three layers of lead/optical fiber.
Endcap Veto Counter l 150-250 mrad, 1.9 m in z from IP.
l Four layers of lead/scintillator.
Liquid Argon Hole Taggers
l 1.65 m long, inner radius 2.4 m. l Cover the 3’ regions at junctions of liquid argon
I
barrel calorimeter modules. l 2.5-cm-thick scintillator with 1.9 cm of lead preradiator. I

i
.
MARK II AT SLC
Muon Chambers
Hadron Absorber
- Muon Chambers
Drift Chamber . Vertex Detector
Central Drift Chamber
Time-of-Flight counter
12-88
Solenoid Coil Lead/Proportional Tube Electromagnetic Calorimeter ~~;;,“,~a11 Angle
$;;(o~wle
Silicon Strip Vertex Detector
Lead/Liquid Argon Electromagnetic - Y Calorimeter +
6147AI
Fig. 1
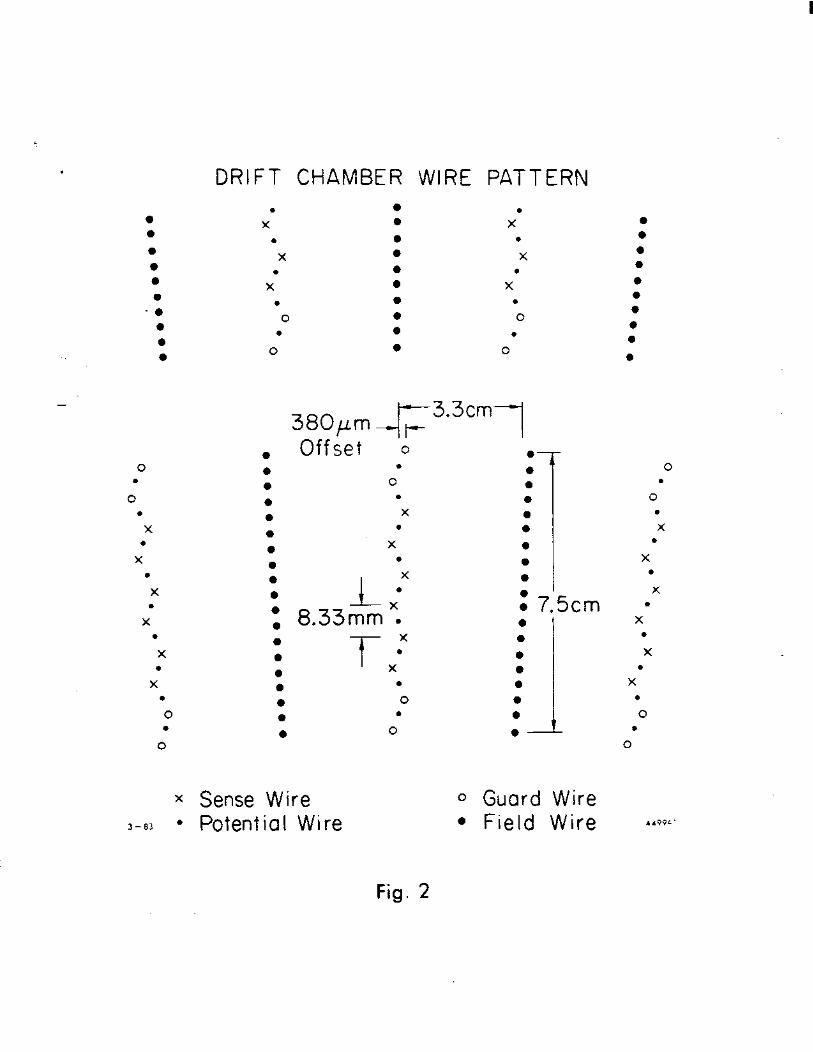
.
0 0
0 0 0 0
- 0 0 0 0
0 .
0 .
X .
X .
X .
X .
X .
X . 0 .
0
DRIFT CHAMBER WIRE PATTERN .
X .
X .
X .
0 .
0
0 0
0 0 0 0 0 0 0
0
. X
.
X .
X .
0 .
0
380pm $3*3cml . Offset 0 0 . 0 0
0 . 0 X
. 0 0 X
0 . 0 -l X
0
z 8.33mm ‘1 0
T X
0 .
0 X
l .
0 0
0 .
0 0
I 0 0 0 0 0 0 0 0 0 1 : 7.5cm 0 0 0 0 0 0 0 0 I
x Sense W ire 0 Guard W ire 3 - 83 l Potential W ire l Field W ire
0 .
0 .
x .
X .
X .
X .
X .
X .
0 .
0
4499t.l
Fig. 2

i
.
-
Cal Mapnet
Feedthrduph -
11 II 6117A,
,---m-w ______________--____------------ ------- ! htn I I
I - I I
Variable Gain Ampllfler
A-(0-15)1/8
I I I ,30 m
4-l TDC
I Postampllfler VThr.shold Lc-c! 1 ._-_________-_____-_------------------------- :23 m
Fig. 3

0 c - al .- .- ; 0.8
0.6
1-89
I I I I I
[I
l ~p~r~~~ur~pu~0s~rn~~~~‘~~~
f
pg I
c3 0
? 0
0
0 1 0 1
I I I I I
0 0.2 0.4 0.6 0.8 1.0
lcosel 6147A31
Fig. 4

.
10-88 DRIFT DISTANCE (mm) 6147A5
250
200
150
100
3
D -0 0
m - 0 - 0 0
0 0
0 0
0 0
8
0 l
0 0 0 0
0 0 -0. 0. 0
0 : .
-20 0 20
Fig. 5

.
> - c) z .uJ 0 Ez LL W
l-89 6147
I I I I I
30- .
oa- ,+++++ttktiiiitti~~~?tt~~t~~ -
. t + * *
t i 06- .
t + 04- t t .
t 02- .
+ * &J)p *
0 I I I ‘ 0 5 10 15
A32 TWO-TRACK SEPARATION (mm)
Fig. 6

i
. 2000
-2 1500 > a . (3
d 1000
x 2 f 500
0
12-66 6147A4
o/p=O.31 p% (GeV/c)-’
-
-
-
0 5 10 15
MOMENTUM (GeVlc)
Fig. 7

.
-
4
3
2
I
0
JO-88
q-y--py ’ ’ “1 I I I ///I/ I I-
P -
--6- -
I I IIll I I I Ii,,,] I I I I ,,,,I I J
IO--’ IO0 IO’ P (GeVk > 5771A2
Fig. 8
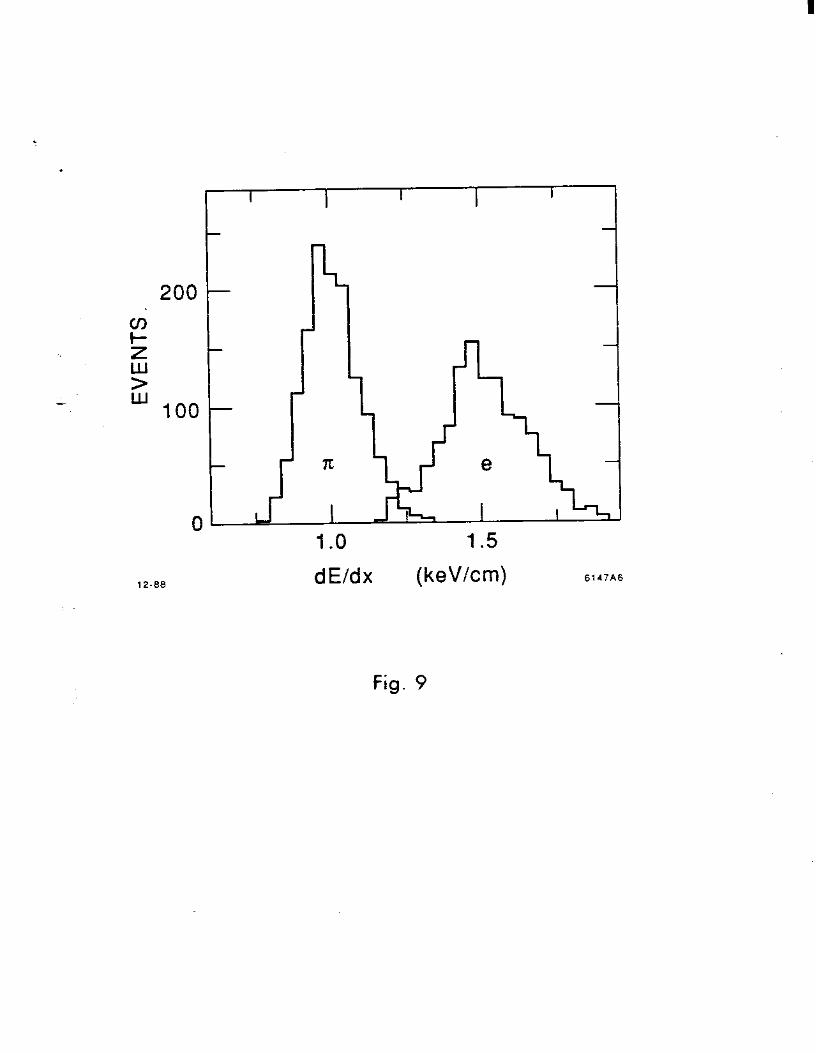
I
.
I
e E - W
200
100
0
12-66
1 .o 1.5 dE/dx (keV/cm) 6147A6
Fig. 9

.
Start Signal South
Photodiode
‘. ‘. i’
Diffuser I& I I I t I I 2 wmmme --em
Beam Splitter
,____ ~~~~~-~ __ 7 North Fibers
L Fi,ter ---4---l ----
Wheel 2 Position Mirror
-
NortFiFeytical
\ -T--
South Phototube
North J Phototube 10-88
6147A7
Fig. 10

-
10000
z 8000 c v d 5 4000
2 CT I-- 2000
0
10-88 8147A8
I I I I I
0=221 ps
-2 -1 0 1 2
t measured -t predicted (ns>
Fig. 11

.
- > 3 t- 7 W > 0 >
2.0
1.5
I .o
0.5
12-88
:,:.... ‘. -:. ,’ ” .,. “’ ,“. .: . . . ‘. - ,‘.‘..,., -1 ,,. ‘. ‘L , ; .:.
I .: : ‘. ‘:
.,, ; ,,,, r,.. .;$ ..;i’,_,, ;<” +,:- ,;’ ” ,.. ‘:. I. \ . :, .-.;, I .,.‘.‘L. ., ),‘: ..,“.
: .’ .,
::;, ‘,, :, ..:: ,:. f,‘. :: ,,,.. . ...” ., . . , ,:
i.. ., *. .‘..‘. ;,i AC. i ti , :.:,- .‘i.. ”
,’ ;. ;‘.. s ; ._. ,,\ 9.
. . .‘.
:‘..;‘,,‘:::,p” ,‘;.., .e * .’ ,. ’
:zi’:.s; ;.. jti .’ ‘.,‘. ..; .: ; : ..,
-.,, :, J.:I’,.::‘~~‘~~.,~..i:,.~.:::.... .I” 4:..’ ‘L’, (. .,
,” ; - :, ; , .;: i,-.‘...L,“:.: .:
.:. ‘.: ‘8 : 1.
i e*,_..* .‘.., ‘. :; y&r’: ,I .,,. y:~.,.‘;‘;;:. ; ,‘., .,‘, : , ,; ” :.l.r, ,-. s ,; ,’ :. ;, ,; j’.Y, ,’ . . :‘, ,~ I,,.’ :
. . .,
,* :,: ‘t T..
.‘. . . ?I,, ‘.:.,‘~11:.r.:;;,.“~.~: ,J‘ ” : ‘., ,,‘, . . . ‘, :, .y .,
;.
.,..- :.:.+<+ ‘,. .- ‘. ,.‘. ;
.’
,a’ ‘.’
-. ‘.
,..’ : ‘, ,. ‘\,
:_:’ .’
. . .:
: . -..,:
,.. (..‘...,
.: ‘. .. ; ,.
. : ‘.“‘. ”
.’ .,:. .
i -., .:
. .
I.5
MASS SQUARED (Gev*) 6147A5
Fig. 12

i
.
IO
i 8
0 - 26 - cc a
0 1
12-66 MOMENTUM (GeVk) 6147AlO
Fig. 13

.
F3
T2
F2
AT1 Fl
I Massless Gap 10-88 - 6147All
Fig. 14

80 1 I I I ’ I I I
40 -
20 -
O----la IO 12 14 16 18 20
6147A30 Measured Energy (GeV) 1-89
Fig. 15

.
b
l-a9
0.25 1 I I I I i 1 I I I lllll~
0.20
0.15
-I
0.10
0.05
9
0’ ““” I I I I Illll I 0.5 1 2 5 10 20
Energy (GeV) 6147A12
Fig. 16

I
.li
.
0)
m
Rad
iatio
n Le
ngth
s N
-0
00
;;;
P U
&:
::;::
,;::. .-
‘, ,.:$
:::i::
::.;.:
..:.
: :j::
: ,: j,:.
..:
,: .:.
:. :.‘.
:.‘. ;:.: .:
...;:j
,. $;<:
::‘,:,
. ::j
:-:.;j
: .: .
. . . . . . :
... ..
.. .:.
:y:.:
: ..
::... ‘.
:. .,
:y:
I I
. . .
.:,: :
...’
,. :
. .:.
.: .:
. . . . . :
. ..:
:‘.
,; :....
,:I.
. . . .:.
.: Ir
..‘.: :
: :, .::
.. .. :..
:...
ID
..’
0 :
. . .:
I
iu
N
Cal
orim
eter
Th
ickn
ess,
0 bo
A 60
=:
$ z
ol
b To
tal
Num
ber
of
z Sh
ower
Sa
mpl
es
(laye
rs)
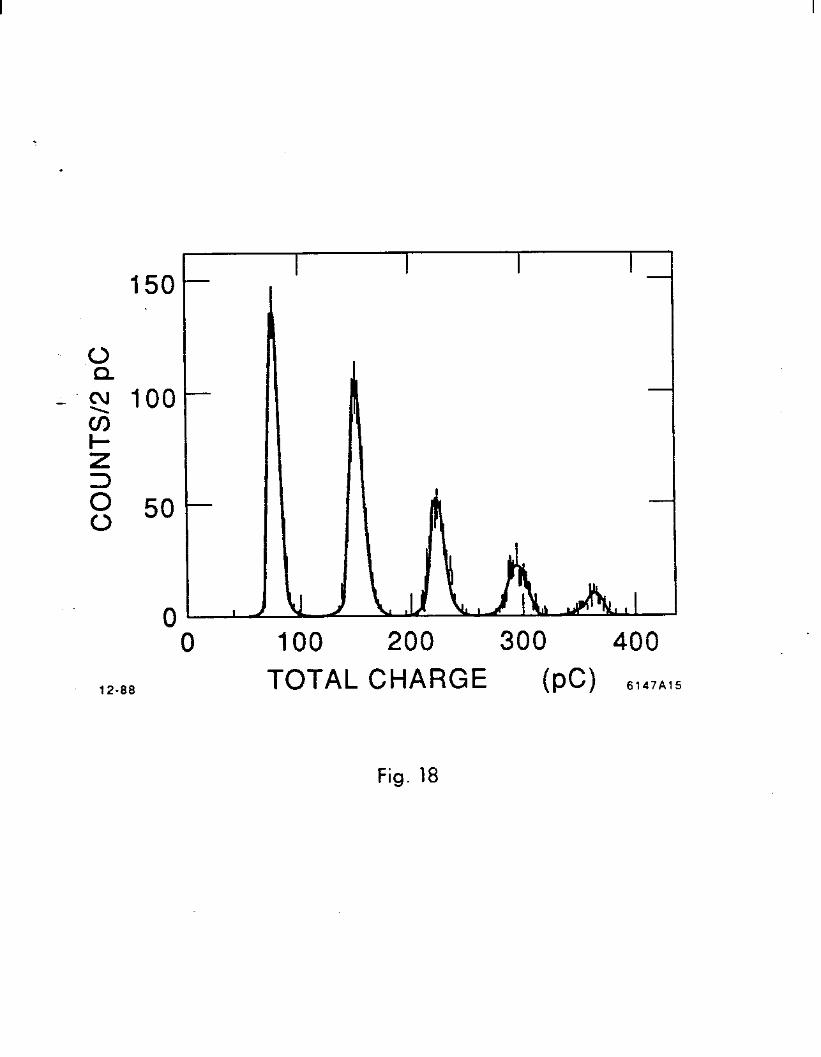
.
.o Q
- .cil
12-88
150
100
50
0 0
II
100 200 TOTAL CHARGE (PC> 6147A15
300 400
Fig. 18

i
.
-
4 20 cm --_I
2.5 cm 10-88 6147Al3
Fig. 19

.
-
150 mr
100 mr
50 mr
Endcap Calorimeter
Ik-Calorimetrv-Trac k
Drift Chamber End Plate ,
25 mr r.., ,L .‘.... . . . . . . . . . . . . . . . :...: . . . . . . ,.,.,: ,,:,. :. ..I.::.::.::..:..::.:. :::.,j:,::.., ..:... ., . . . . . ,, 1 I Beam
I Mask f I I 0
12-88 Horizontal Distance from IP
E
a. - E 2 - 8 5 5 .- n
120 6147A16
Fig. 20
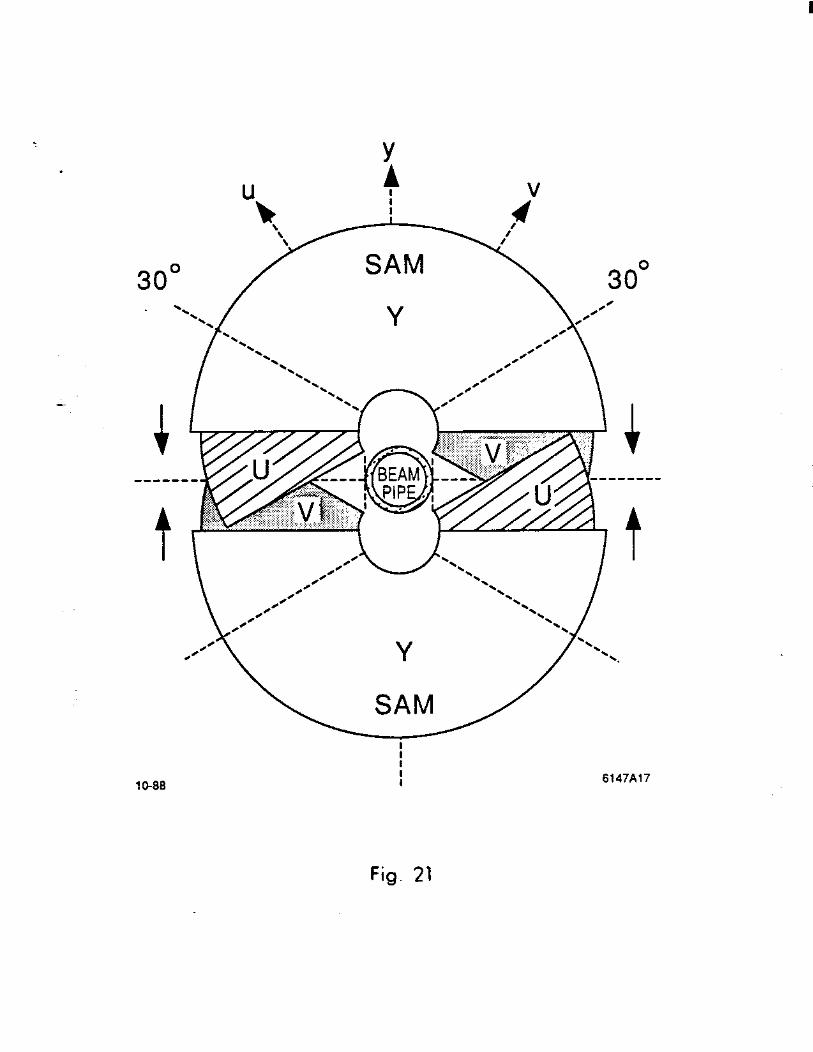
.
I I 10-86 46 i i 6147A17 6147A17
Fig. 21
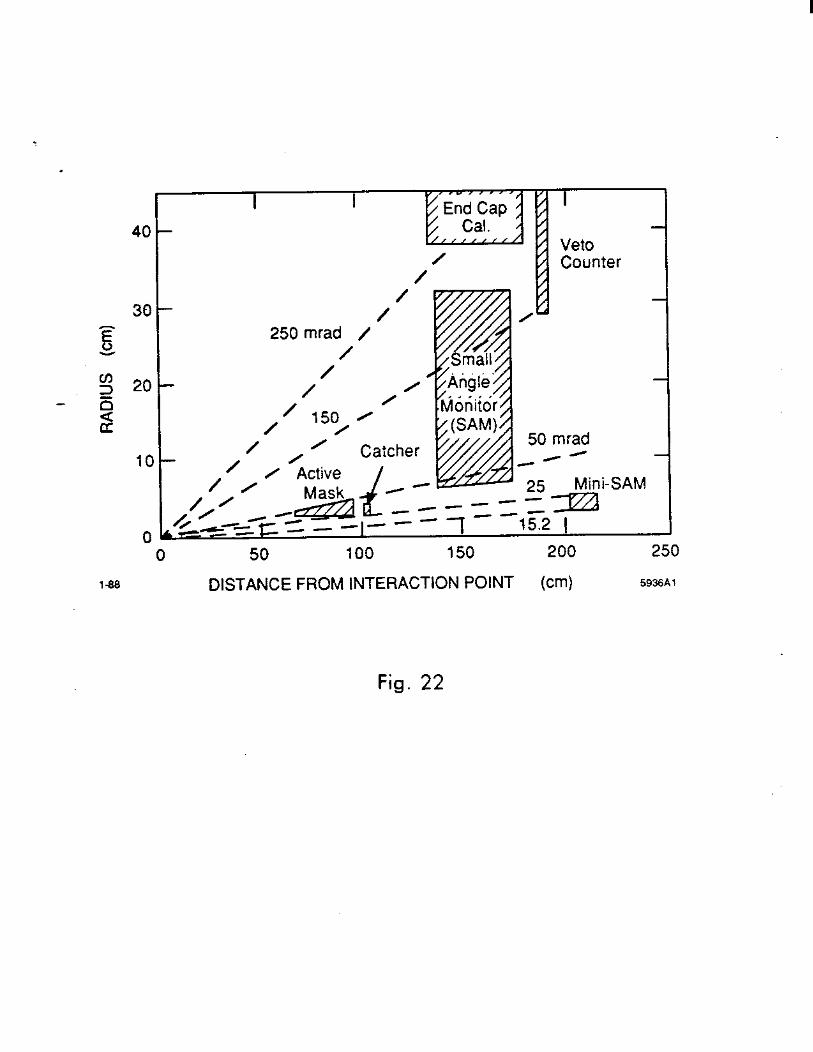
.
40
30 z 22
‘3 20 25 a u
l-88
V”“““‘/ / $ End Cap ; 5 I 4 Cal. / /
///I * /
5 Veto / Counter
/ $
0 50 100 150 200 250
DISTANCE FROM INTERACTION POINT (cm) 5936Al
Fig. 22
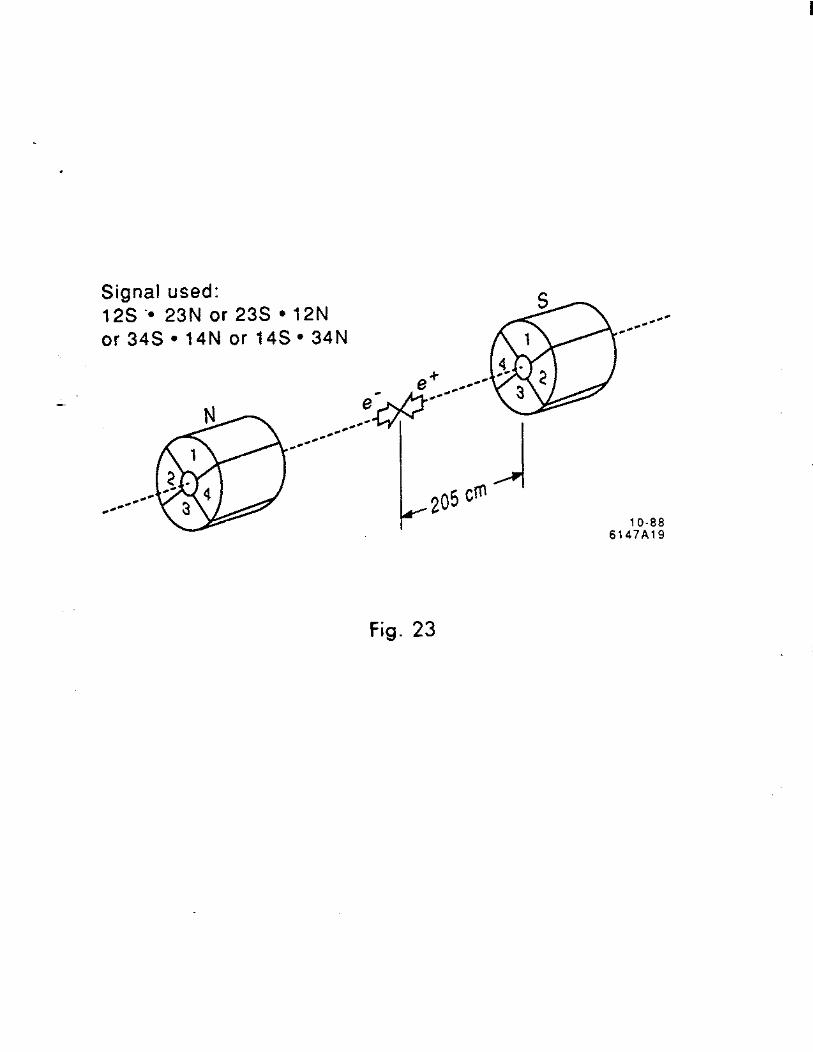
.
Signal used: 12S’.23Nor23S*12N or 34s l 14N or 14Sa 34N
4 - e+ cccc--' *-
N- ec _A@ A .
e*~~~~~$jy-*OO--- rv L*$ cflY 10-66
6147A19
c
Fig. 23

.
-
I Shift Register
Serial Outputs I . . .
- . -I 1
r r I t ITj
Srhift Registers 6147A20
Fig. 24

.
Spectrometer Quodrupole Mogne t
Doublet Vertical
-
--_ -0
Dump Synchrotron
Light Monitor
4-87 \e+ 5771Al
Fig. 25

.
-
Fig. 26
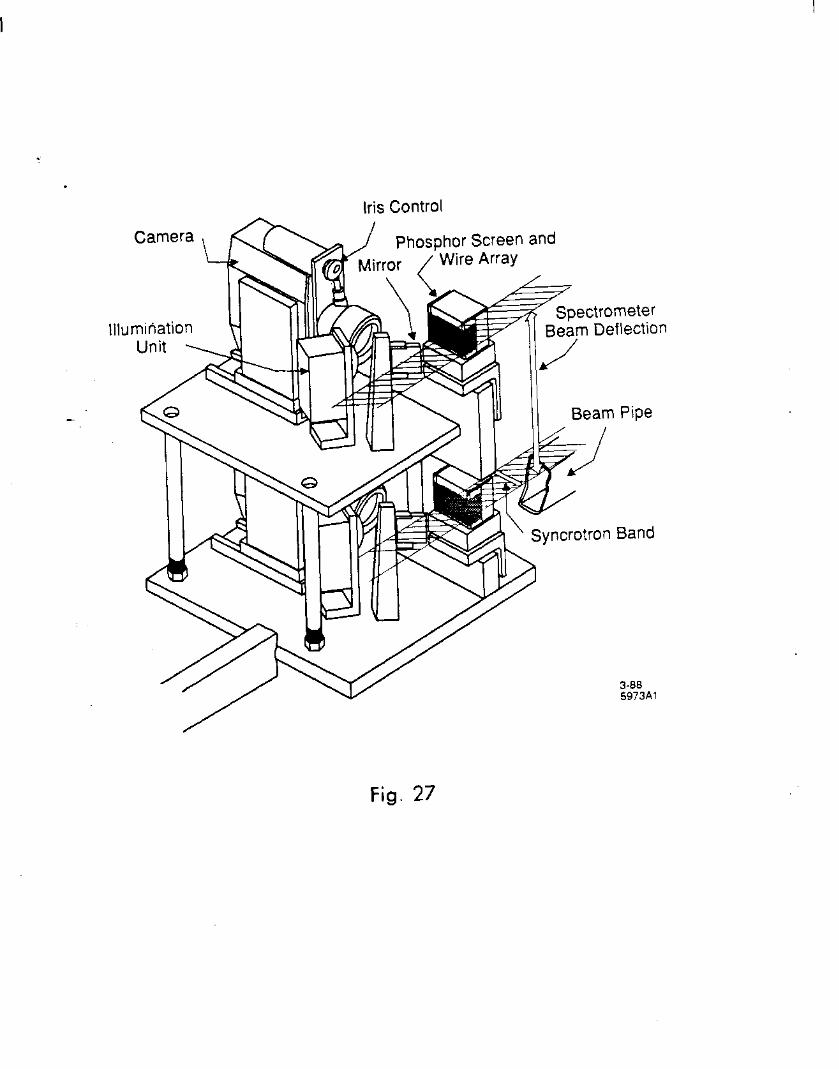
Iris Control
Phosphor Screen and
3-88 5973Al
Fig. 27

.
-
Central Drift Chamber
(Timing)
1 (x6 crates) k-4
>&& (x6 crates) “Fiif
1 b&g (x6 crates) I Vertex Drift Chamber Trigger & Muon upgrade
Ax& (x2 crates) -6
FASTBUS crate segments 27 FASTBUS cable segments 6 SSPS 32 10-M 6147A21
Fig. 28

I
.
,- Ver+ex Drift Chamber - i Inner WoII)
\
“-Beam Pipe --, 1
l--Y 1 cm
Fig. 29
: ; : ,

.
FOI-0”’ --_ (512 Strl;s)
Mlcropiex Chips
.-r:
::‘,;.
Fig. 30

.
,-GRID 7 CATHODE
\
-
HARP (guard wires not shown)
MACOR
ENDPLATE
PRE HEA
% : l . 1
l . l
.# l0.y
g .
A > / / / , A /d I4
2-89 6147833
Fig. 31
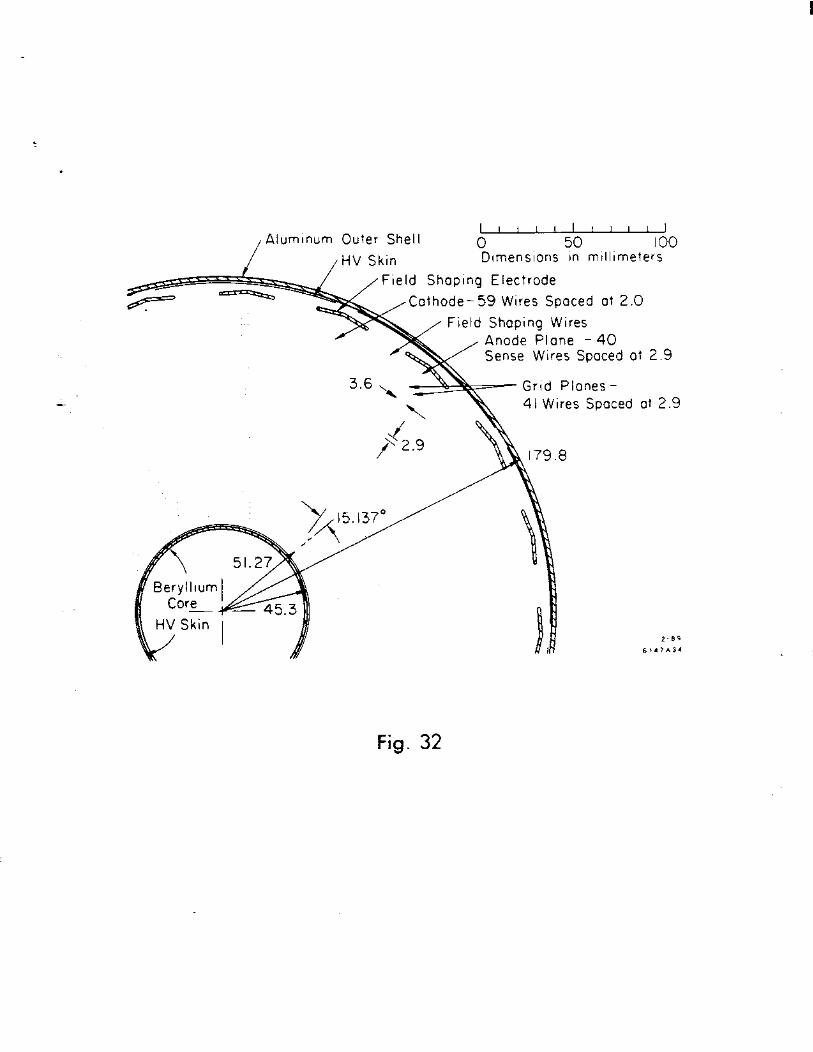
i
.
I I I I I I I I I I , Aluminum Outer Shell 0 50 100
/HV Skin Dimensions In millimeters
Field Shaping Electrode Cathode-59 Wires Spaced at 2.0
Field Shaping Wires Anode Plane -40 Sense Wires Spaced at 2.9
Grid Planes - 41 Wires Spaced at 2.9
\ 179.8
2-89
6147A34
Fig. 32

i
.
t-- 556 cm
-I
t147A29
Fig. 33
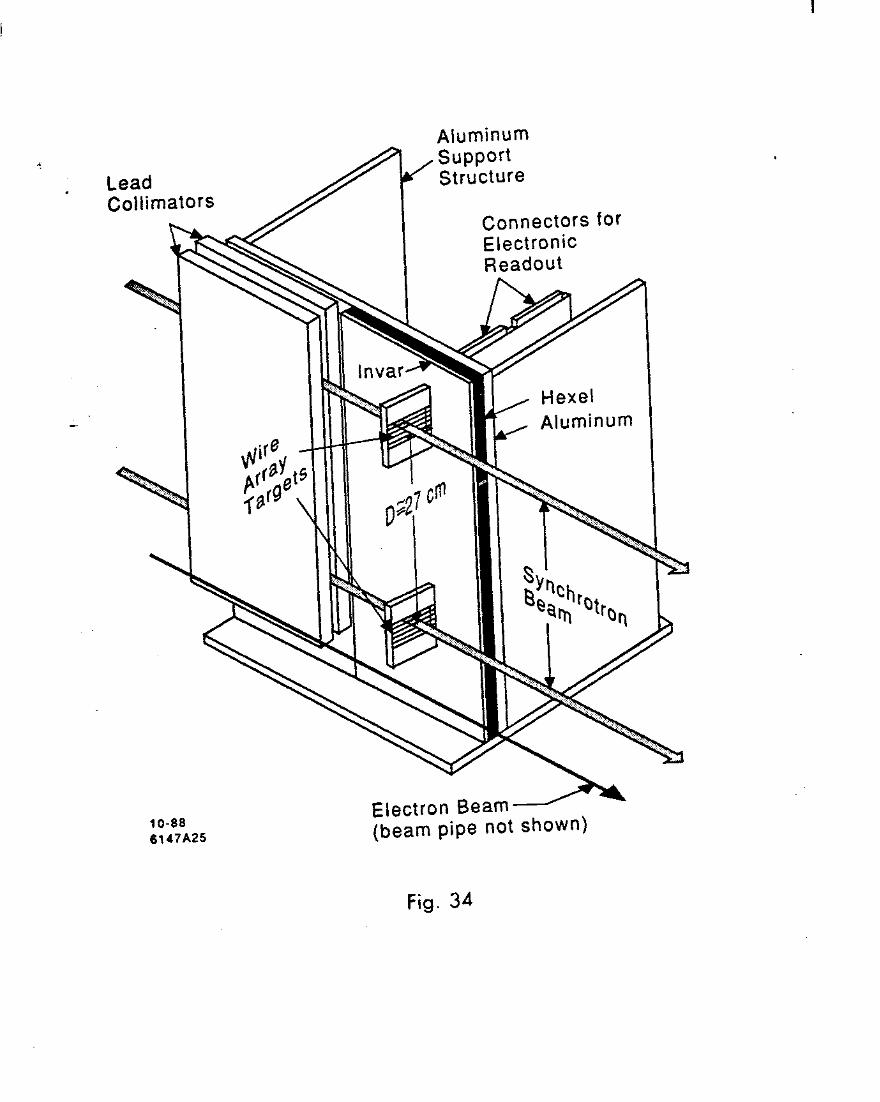
i
. Lead Collimators
Aluminum support
J Structure
Connectors for Electronic Readout
- - Electron Bear11 - (beam pipe not shown) 10-88
6147A25
Fig. 34