the market forces of supply and demand - · pdf filesupply and demand qsupply and demand ......
TRANSCRIPT
The Market Forces of Supply and Demand
M. En C. Eduardo Bustos Farías
2Análisis Económico de la Empresa
M. En C. Eduardo Bustos Farías
Supply and Demand
Supply and demand is an economic model
Designed to explain how prices are determined in certain types of markets
What you will learn in this lectureHow the model of supply and demand works and how to use itStrengths and limitations of model
3Análisis Económico de la Empresa
M. En C. Eduardo Bustos Farías
The Market Forces of Supply and Demand
Supply and demand are the two words that economists use most often.Supply and demand are the forces that make market economies work.Modern microeconomics is about supply, demand, and market equilibrium.

4Análisis Económico de la Empresa
M. En C. Eduardo Bustos Farías
Markets
A market is a group of buyers and sellers of a particular good or service. The terms supply and demand refer to the behavior of people . . . as they interact with one another in markets.
5Análisis Económico de la Empresa
M. En C. Eduardo Bustos Farías
Markets
Specific location where buying and selling takes place, such as
Supermarket or a flea marketIn economics, a market is not a place but rather
A group of buyers and sellers with the potential to trade with each other
Economists think of the economy as a collection of individual marketsFirst step in an economic analysis is to define and characterize the market or collection of markets to analyze
6Análisis Económico de la Empresa
M. En C. Eduardo Bustos Farías
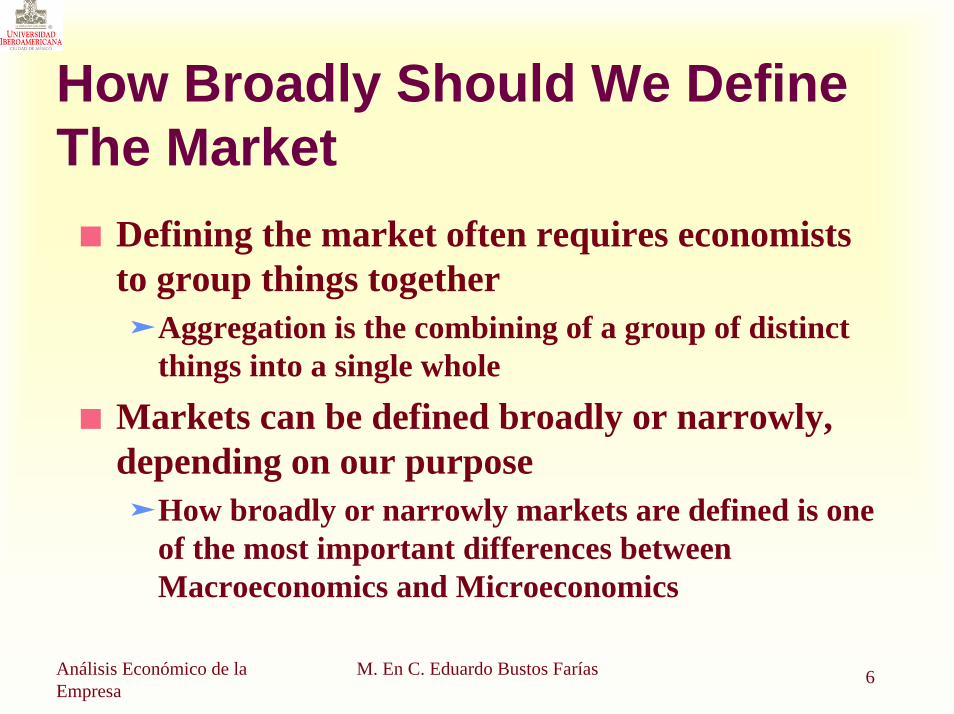
How Broadly Should We Define The Market
Defining the market often requires economists to group things together
Aggregation is the combining of a group of distinct things into a single whole
Markets can be defined broadly or narrowly, depending on our purpose
How broadly or narrowly markets are defined is one of the most important differences between Macroeconomics and Microeconomics
7Análisis Económico de la Empresa
M. En C. Eduardo Bustos Farías
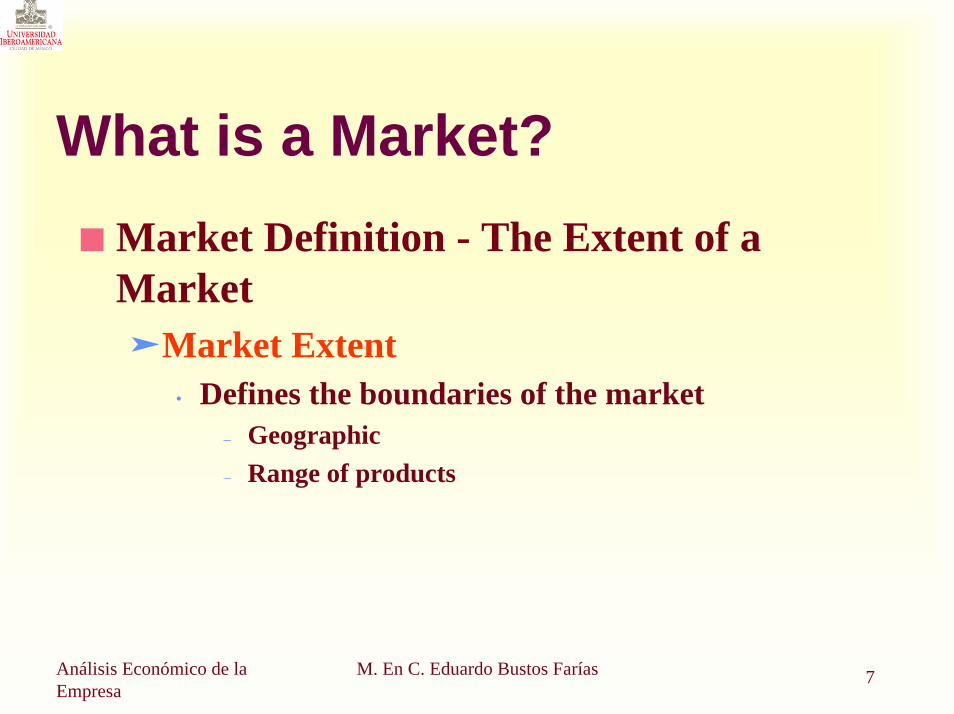
What is a Market?Market Definition - The Extent of a Market
Market Extent• Defines the boundaries of the market
– Geographic– Range of products
8Análisis Económico de la Empresa
M. En C. Eduardo Bustos Farías
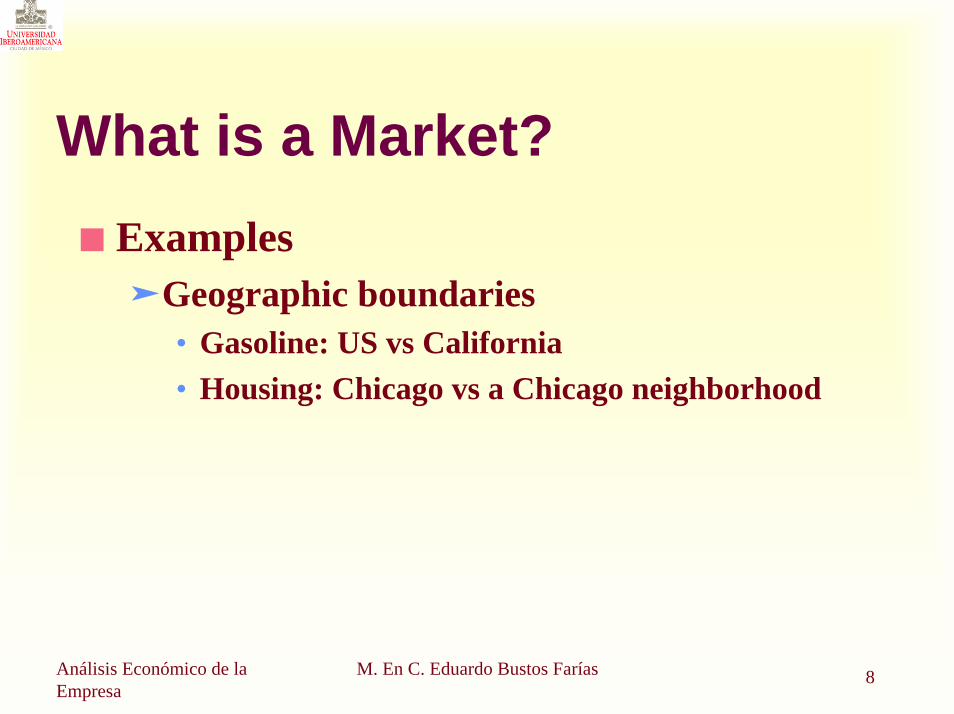
What is a Market?Examples
Geographic boundaries• Gasoline: US vs California• Housing: Chicago vs a Chicago neighborhood
9Análisis Económico de la Empresa
M. En C. Eduardo Bustos Farías
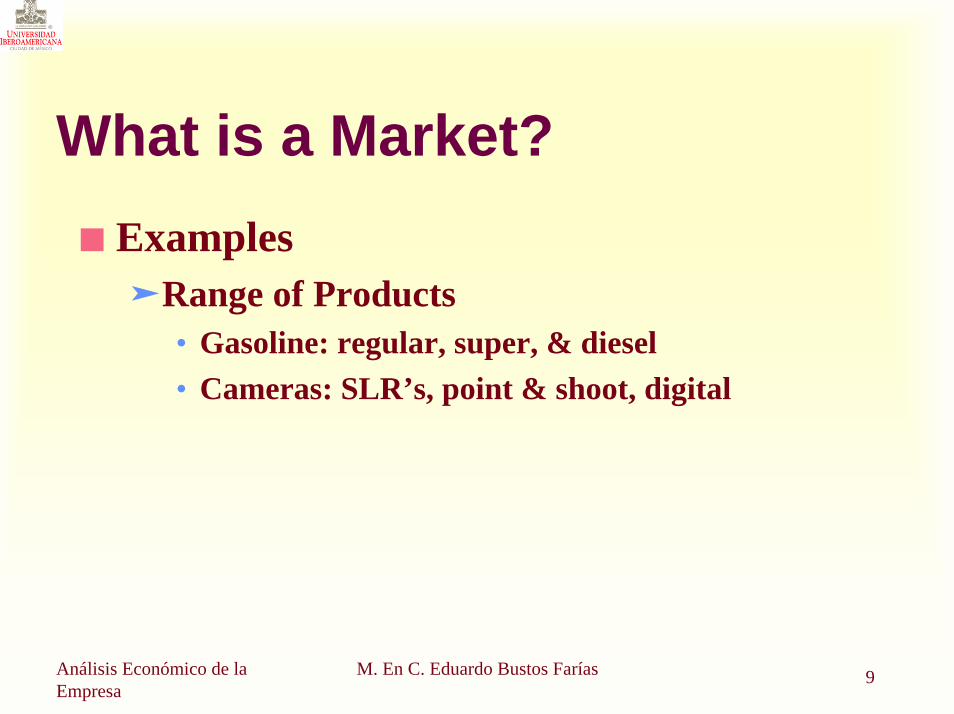
What is a Market?Examples
Range of Products• Gasoline: regular, super, & diesel• Cameras: SLR’s, point & shoot, digital

10Análisis Económico de la Empresa
M. En C. Eduardo Bustos Farías
Markets Buyers determine demand.
Sellers determine supply.

11Análisis Económico de la Empresa
M. En C. Eduardo Bustos Farías
Buyers and Sellers
Buyers and sellers in a market can beHouseholdsBusiness firmsGovernment agencies
All three can be both buyers and sellers in the same market, but are not alwaysFor purposes of simplification this class will usually follow these guidelines
In markets for consumer goods, we’ll view business firms as the only sellers, and households as only buyersIn most of our discussions, we’ll be leaving out the “middleman”

12Análisis Económico de la Empresa
M. En C. Eduardo Bustos Farías
Market Type: A Competitive Market
A competitive market is a market. . .
…with many buyers and sellers.
…that is not controlled by any one person.
…in which a narrow range of prices are established that buyers and sellers act upon.

13Análisis Económico de la Empresa
M. En C. Eduardo Bustos Farías
Competition in Markets
In imperfectly competitive markets, individual buyers or sellers can influence the price of the productIn perfectly competitive markets (or just competitive markets), each buyer and seller takes the market price as a givenWhat makes some markets imperfectly competitive and others perfectly competitive?
Perfectly competitive markets have many small buyers and sellers
• Each is a small part of the market, and the product is standardized
Imperfectly competitive markets have just a few large buyers and sellers
• Or else the product of each seller is unique in some way

14Análisis Económico de la Empresa
M. En C. Eduardo Bustos Farías
Competition: Perfect and Otherwise
Perfect Competition
Products are the sameNumerous buyers and sellers so that each has no influence over priceBuyers and Sellers are price takers

15Análisis Económico de la Empresa
M. En C. Eduardo Bustos Farías
Competition: Perfect and Otherwise
MonopolyOne seller, and seller controls price
OligopolyFew sellersNot always aggressive competition

16Análisis Económico de la Empresa
M. En C. Eduardo Bustos Farías
Competition: Perfect and Otherwise
Monopolistic CompetitionMany sellersSlightly differentiated productsEach seller may set price for its own product
17Análisis Económico de la Empresa
M. En C. Eduardo Bustos Farías
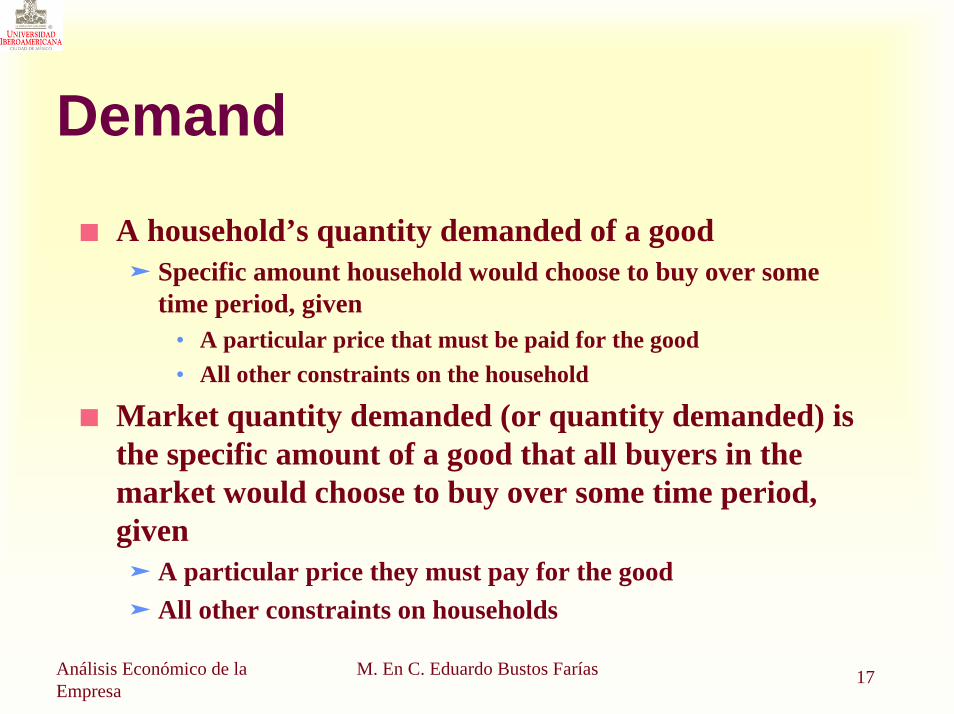
Demand
A household’s quantity demanded of a goodSpecific amount household would choose to buy over some time period, given
• A particular price that must be paid for the good• All other constraints on the household
Market quantity demanded (or quantity demanded) is the specific amount of a good that all buyers in the market would choose to buy over some time period, given
A particular price they must pay for the goodAll other constraints on households
18Análisis Económico de la Empresa
M. En C. Eduardo Bustos Farías
Demand
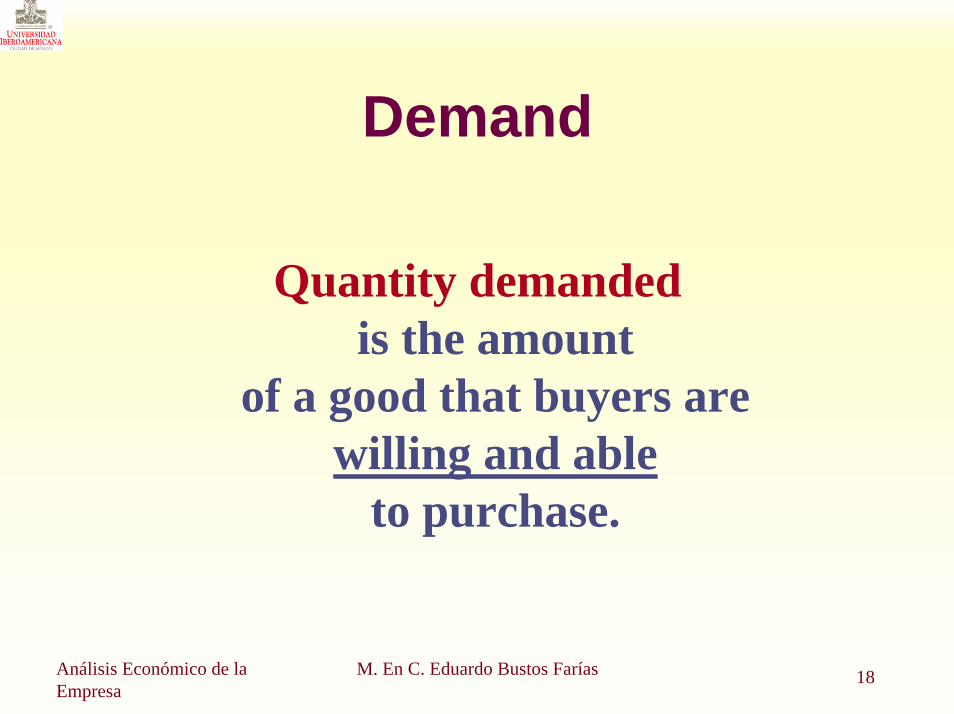
Quantity demandedis the amount
of a good that buyers are willing and able
to purchase.

19Análisis Económico de la Empresa
M. En C. Eduardo Bustos Farías
Quantity DemandedImplies a choice
How much households would like to buy when they take into account the opportunity cost of their decisions?
Is hypotheticalMakes no assumptions about availability of the goodHow much would households want to buy, at a specific price, given real-world limits on their spending power?
Stresses pricePrice of the good is one variable among many that influences quantity demandedWe’ll assume that all other influences on demand are held constant,so we can explore the relationship between price and quantity demanded
20Análisis Económico de la Empresa
M. En C. Eduardo Bustos Farías
Law of Demand
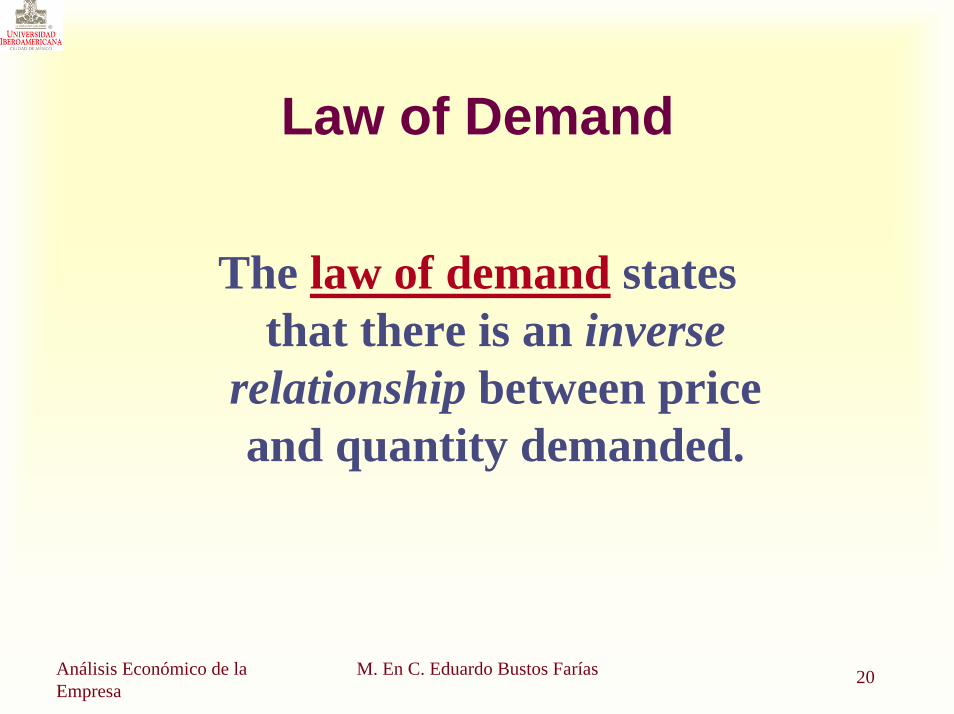
The law of demand states that there is an inverse
relationship between price and quantity demanded.
21Análisis Económico de la Empresa
M. En C. Eduardo Bustos Farías
The Law of Demand
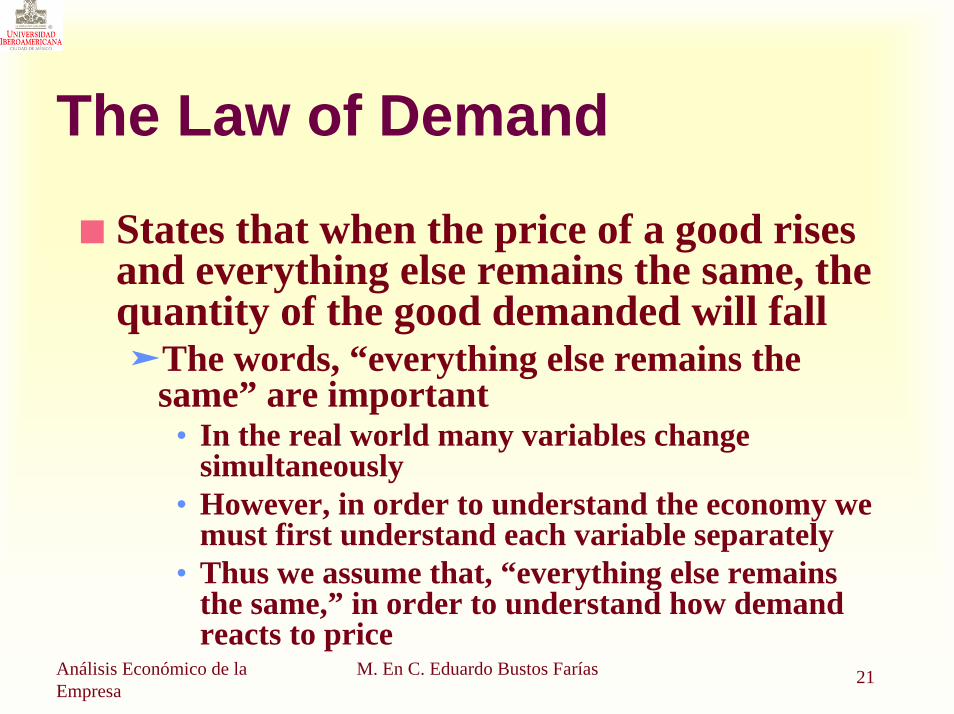
States that when the price of a good rises and everything else remains the same, the quantity of the good demanded will fall
The words, “everything else remains the same” are important
• In the real world many variables change simultaneously
• However, in order to understand the economy we must first understand each variable separately
• Thus we assume that, “everything else remains the same,” in order to understand how demand reacts to price
22Análisis Económico de la Empresa
M. En C. Eduardo Bustos Farías
Demand Schedule
The demand schedule is a table that shows the relationship
between the price of the good and the quantity demanded.
23Análisis Económico de la Empresa
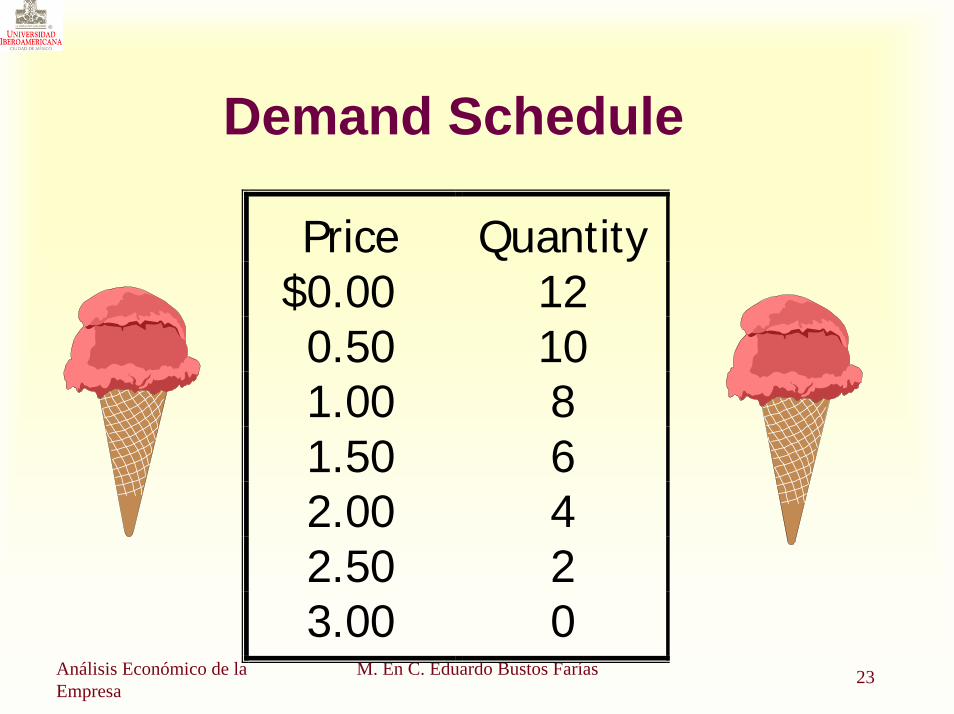
M. En C. Eduardo Bustos Farías
Demand Schedule
Price Quantity$0.00 120.50 101.00 81.50 62.00 42.50 23.00 0
24Análisis Económico de la Empresa
M. En C. Eduardo Bustos Farías
The Demand Schedule and The Demand Curve
Demand scheduleA list showing the quantity of a good that consumers would choose to purchase at different prices, with all other variablesheld constant
The market demand curve (or just demand curve) shows the relationship between the price of a good and the quantity demanded , holding constant all other variables that influence demand
Each point on the curve shows the total buyers would choose to buy at a specific price
Law of demand tells us that demand curves virtually always slope downward
25Análisis Económico de la Empresa
M. En C. Eduardo Bustos Farías
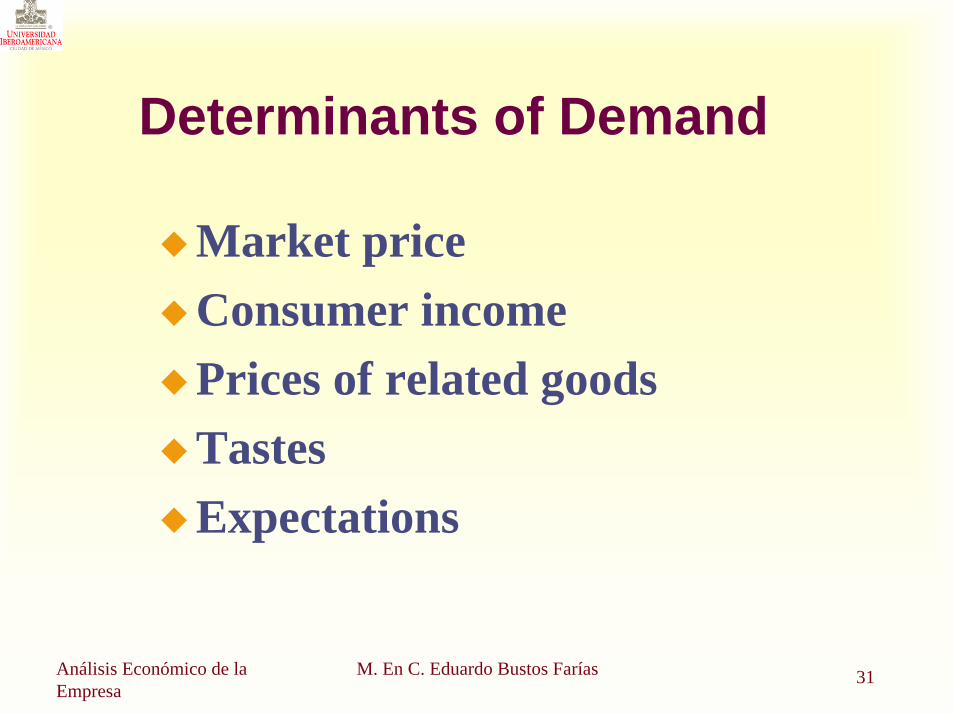
Determinants of Demand
Market priceConsumer incomePrices of related goodsTastesExpectations
26Análisis Económico de la Empresa
M. En C. Eduardo Bustos Farías
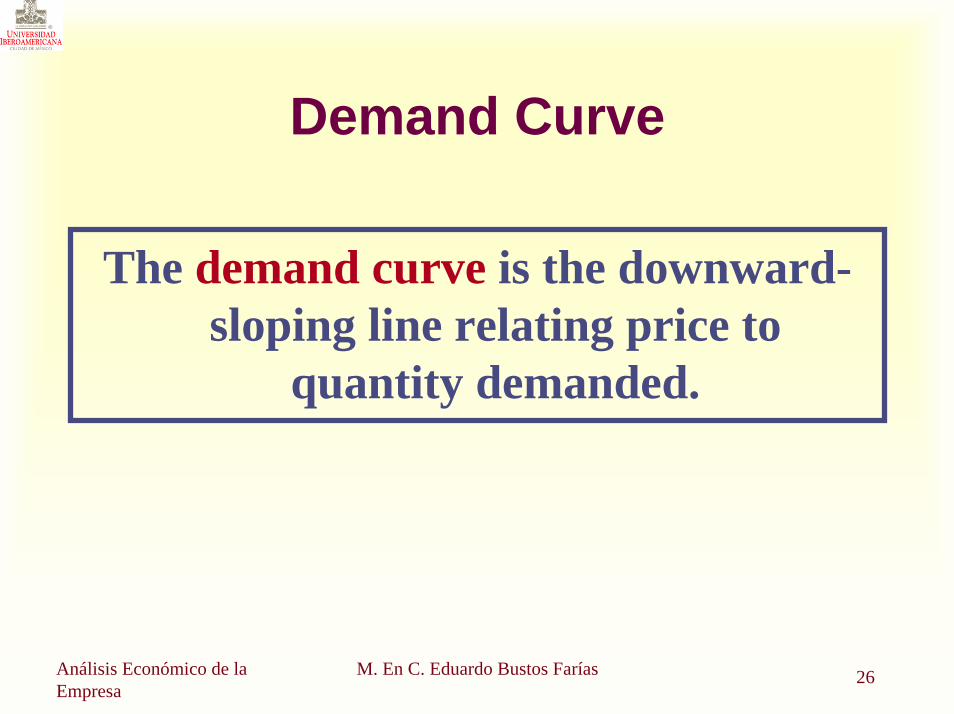
Demand Curve
The demand curve is the downward-sloping line relating price to
quantity demanded.
27Análisis Económico de la Empresa
M. En C. Eduardo Bustos Farías
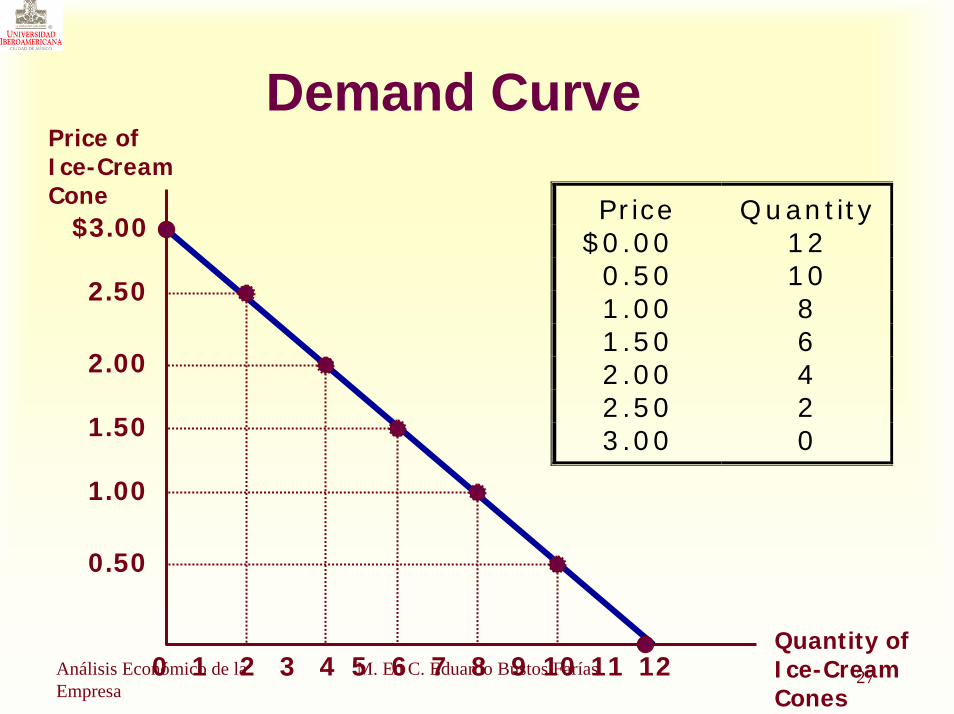
Demand Curve
$3.00
2.50
2.00
1.50
1.00
0.50
21 3 4 5 6 7 8 9 10 1211
Price of Ice-Cream Cone
0
P r ic e Q u a n t ity$ 0 .0 0 1 2
0 .5 0 1 01 .0 0 81 .5 0 62 .0 0 42 .5 0 23 .0 0 0
Quantity of Ice-Cream Cones
28Análisis Económico de la Empresa
M. En C. Eduardo Bustos Farías
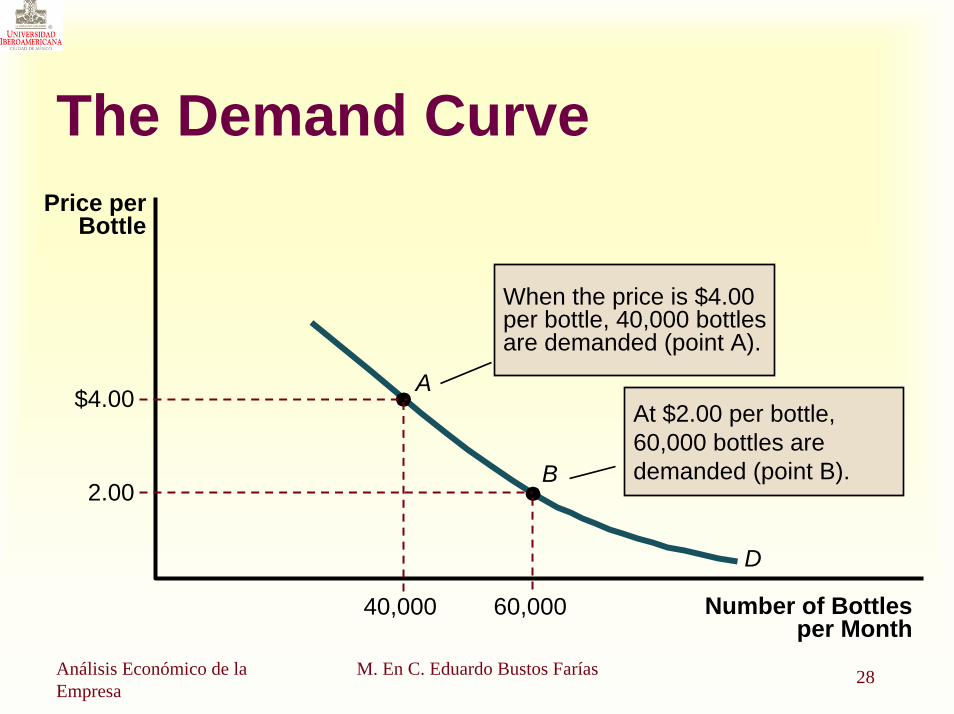
The Demand Curve
Number of Bottles per Month
Price per Bottle
A
B
$4.00
2.00
D
40,000 60,000
At $2.00 per bottle, 60,000 bottles are demanded (point B).
When the price is $4.00 per bottle, 40,000 bottles are demanded (point A).

29Análisis Económico de la Empresa
M. En C. Eduardo Bustos Farías
Ceteris ParibusCeteris paribus is a Latin phrase that
means all variables other than the ones being studied are assumed to be
constant. Literally, ceteris paribusmeans “other things being equal.”
The demand curve slopes downward because, ceteris paribus, lower prices
imply a greater quantity demanded!
30Análisis Económico de la Empresa
M. En C. Eduardo Bustos Farías
Market Demand
Market demand refers to the sum of all individual demands for a particular good or service.Graphically, individual demand curves are summed horizontally to obtain the market demand curve.
31Análisis Económico de la Empresa
M. En C. Eduardo Bustos Farías
Determinants of Demand
Market priceConsumer incomePrices of related goodsTastesExpectations
32Análisis Económico de la Empresa
M. En C. Eduardo Bustos Farías
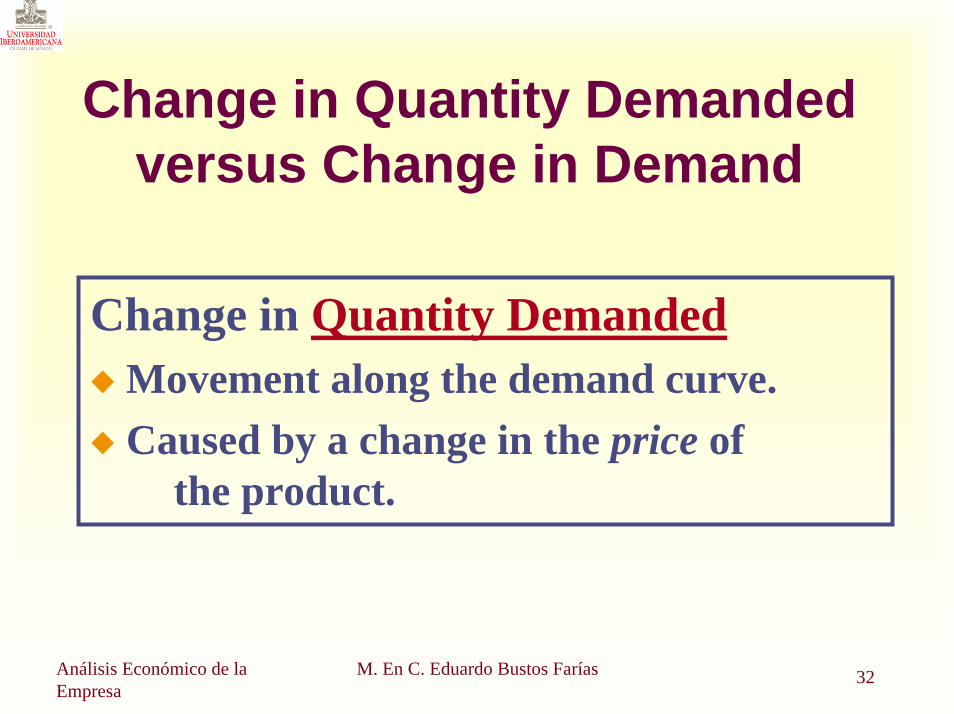
Change in Quantity Demanded versus Change in Demand
Change in Quantity DemandedMovement along the demand curve.Caused by a change in the price of
the product.
33Análisis Económico de la Empresa
M. En C. Eduardo Bustos Farías
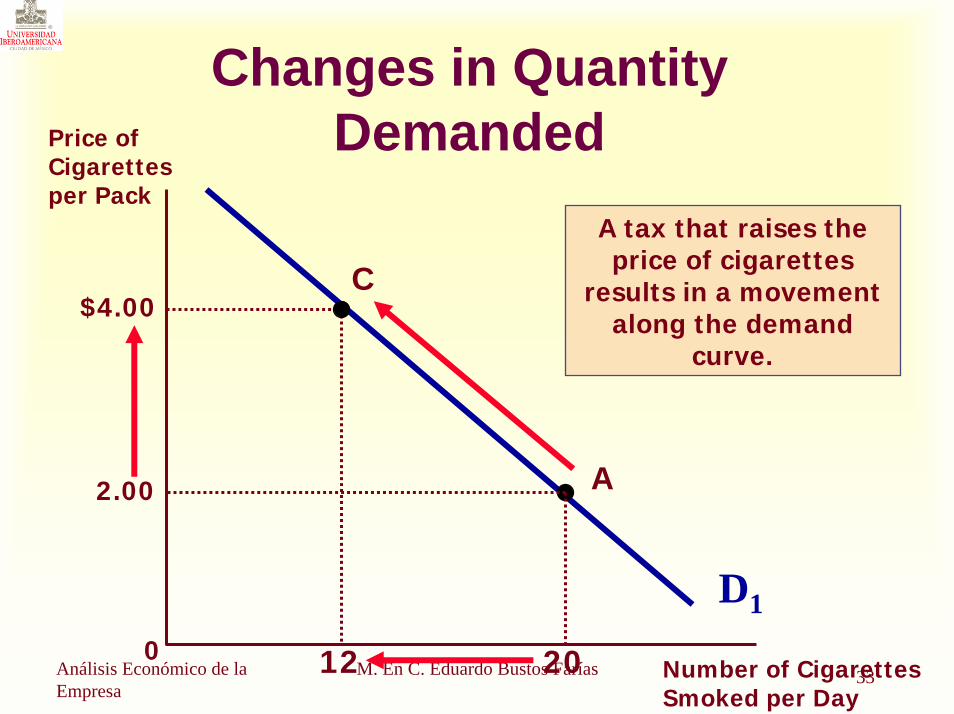
Changes in Quantity DemandedPrice of
Cigarettes per Pack
D1
0Number of Cigarettes Smoked per Day
A tax that raises the price of cigarettes
results in a movement along the demand
curve.
A
C
20
2.00
$4.00
12
34Análisis Económico de la Empresa
M. En C. Eduardo Bustos Farías
Change in Quantity Demanded versus Change in Demand
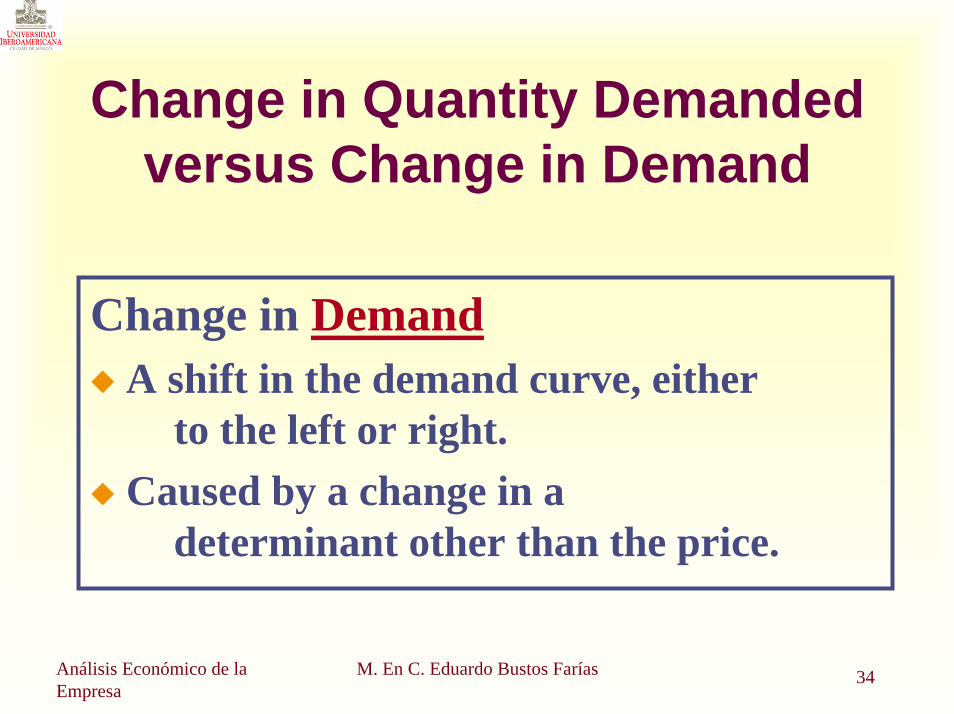
Change in DemandA shift in the demand curve, either
to the left or right.Caused by a change in a
determinant other than the price.
35Análisis Económico de la Empresa
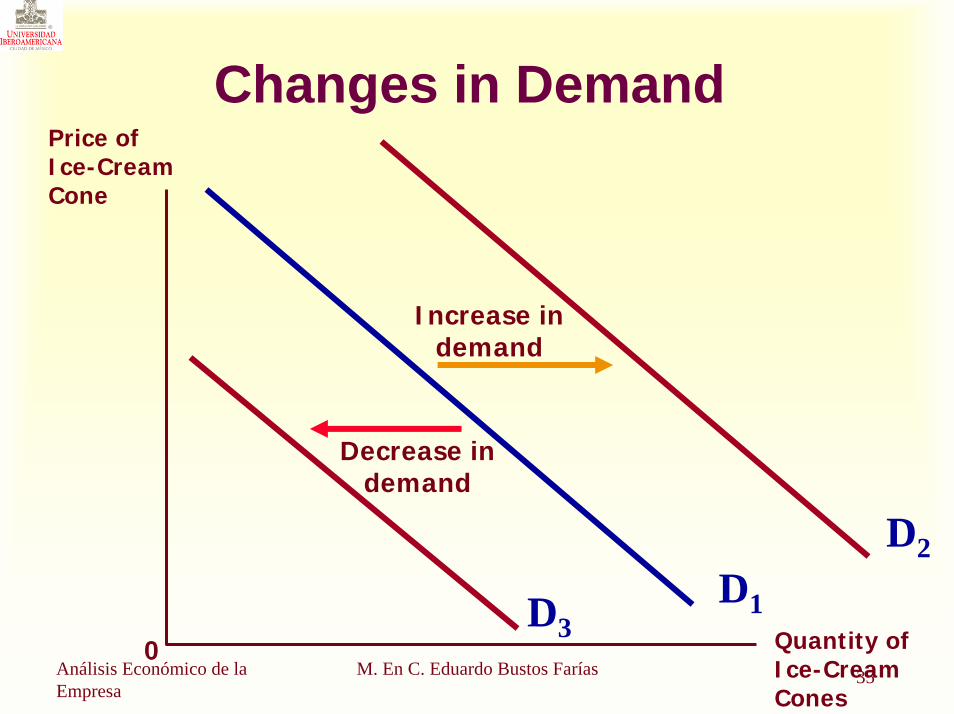
M. En C. Eduardo Bustos Farías
Changes in DemandPrice of Ice-Cream Cone
0
D1Quantity of Ice-Cream Cones
D3
Increase in demand
Decrease in demand
D2
36Análisis Económico de la Empresa
M. En C. Eduardo Bustos Farías
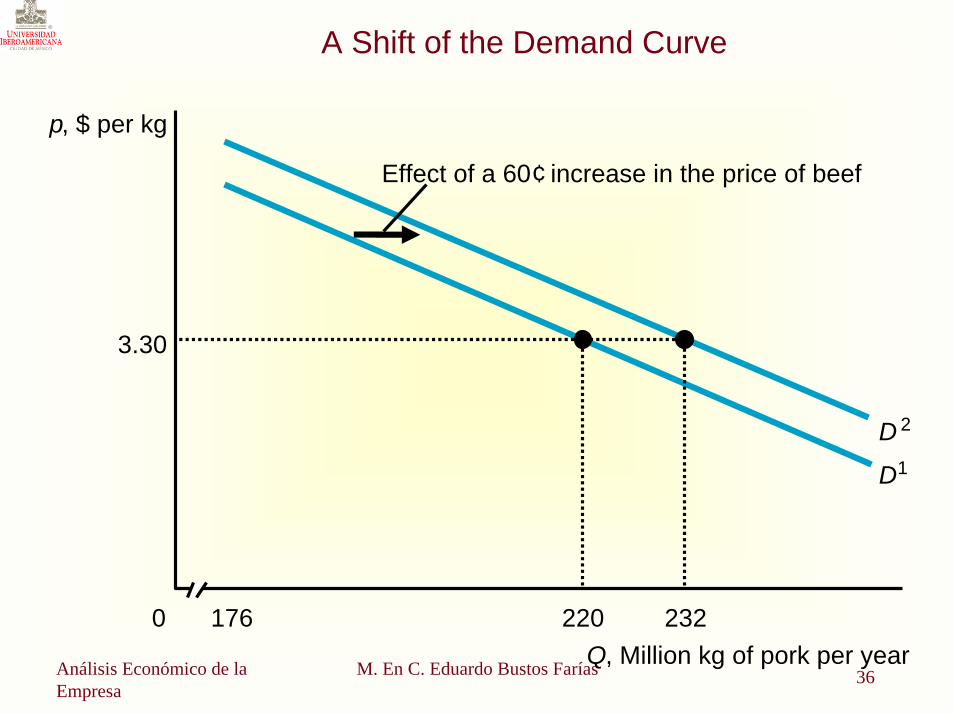
A Shift of the Demand Curve
p, $ per kg
220176
Effect of a 60¢ increase in the price of beef
D1
D 2
2320
3.30
Q, Million kg of pork per year
37Análisis Económico de la Empresa
M. En C. Eduardo Bustos Farías
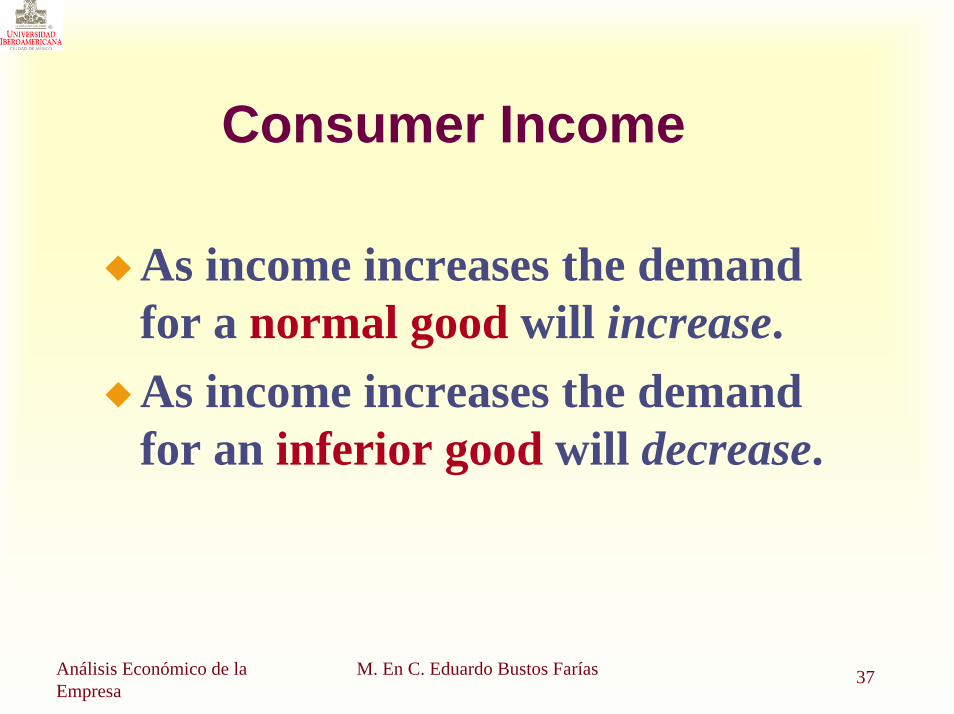
Consumer Income
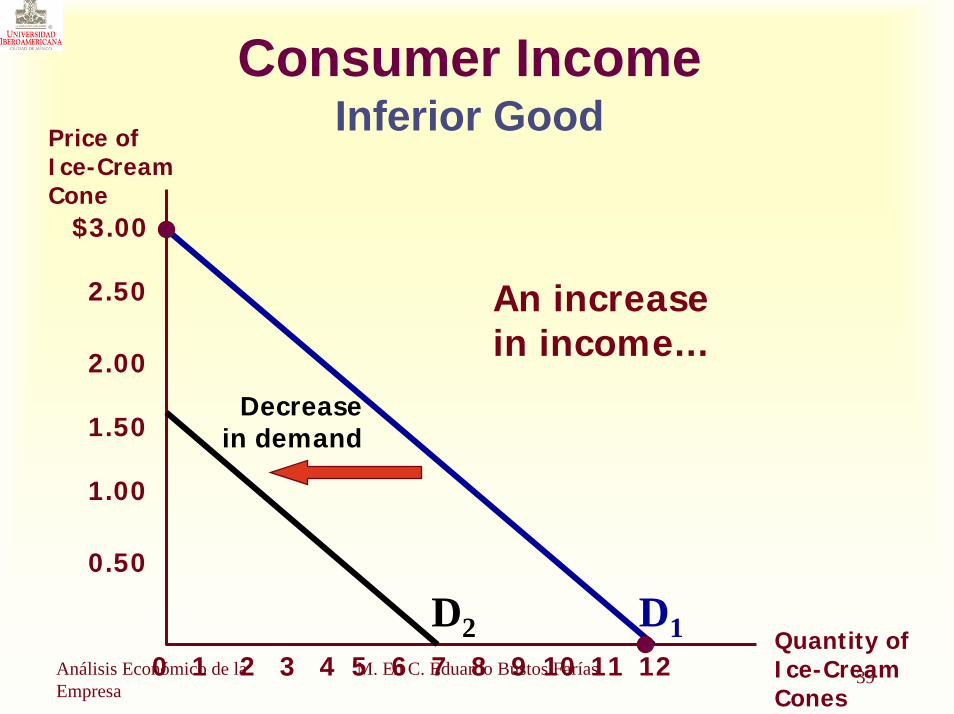
As income increases the demand for a normal good will increase.As income increases the demand for an inferior good will decrease.
38Análisis Económico de la Empresa
M. En C. Eduardo Bustos Farías
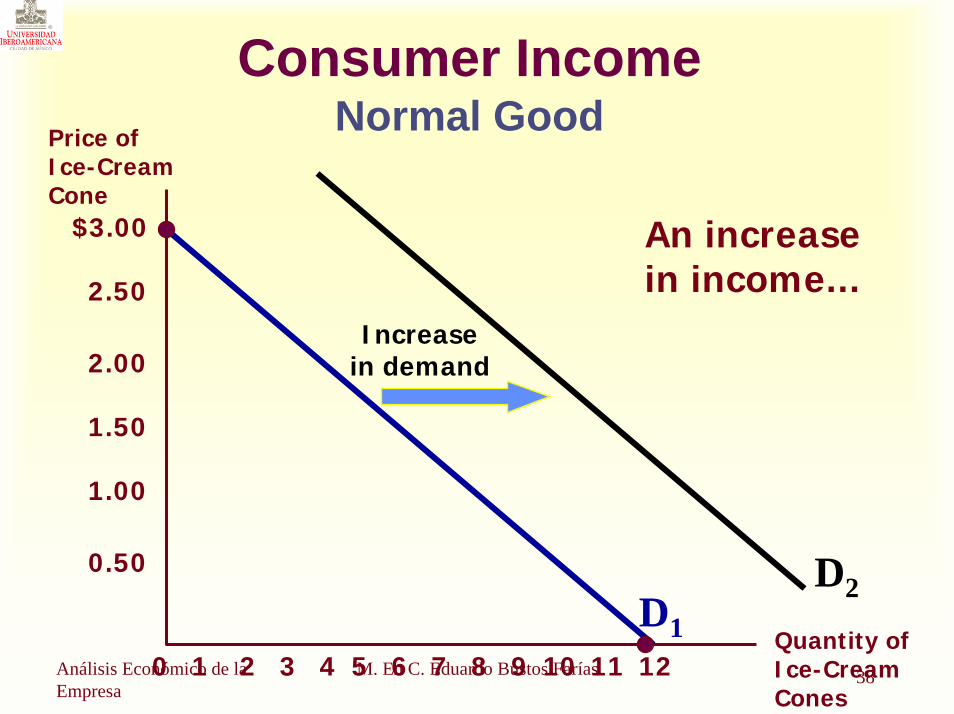
Consumer IncomeNormal Good
$3.00
2.50
2.00
1.50
1.00
0.50
21 3 4 5 6 7 8 9 10 1211
Price of Ice-Cream Cone
Quantity of Ice-Cream Cones
Increasein demand
An increase in income...
D1
D2
0
39Análisis Económico de la Empresa
M. En C. Eduardo Bustos Farías
Consumer IncomeInferior Good
$3.00
2.50
2.00
1.50
1.00
0.50
21 3 4 5 6 7 8 9 10 1211
Price of Ice-Cream Cone
Quantity of Ice-Cream Cones
0
Decreasein demand
An increase in income...
D1D2
40Análisis Económico de la Empresa
M. En C. Eduardo Bustos Farías
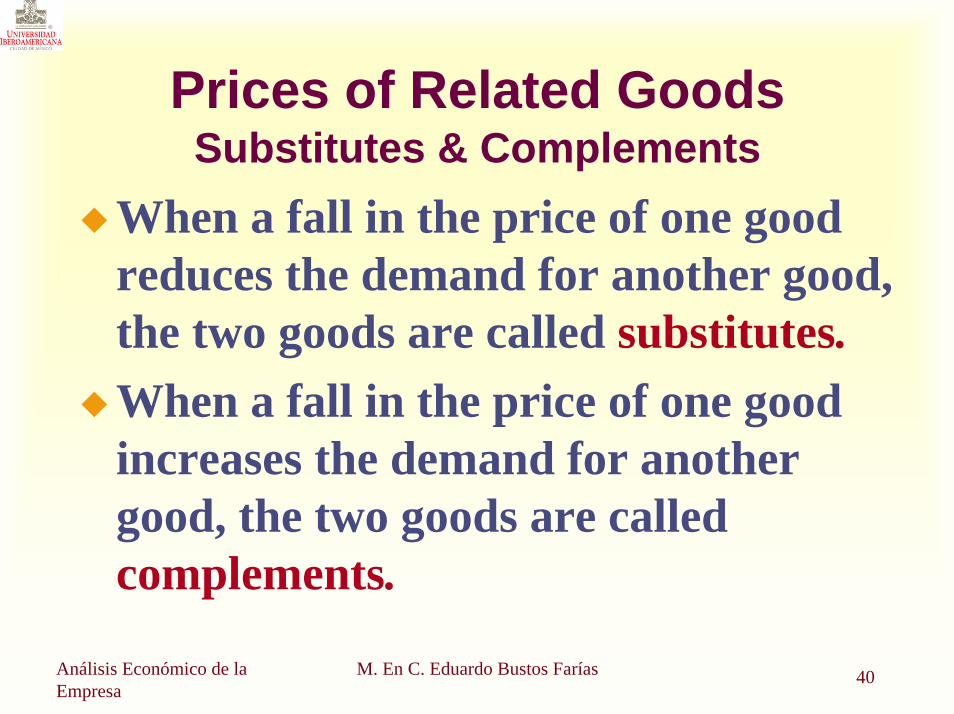
Prices of Related GoodsSubstitutes & Complements
When a fall in the price of one good reduces the demand for another good, the two goods are called substitutes.When a fall in the price of one good increases the demand for another good, the two goods are called complements.
41Análisis Económico de la Empresa
M. En C. Eduardo Bustos Farías
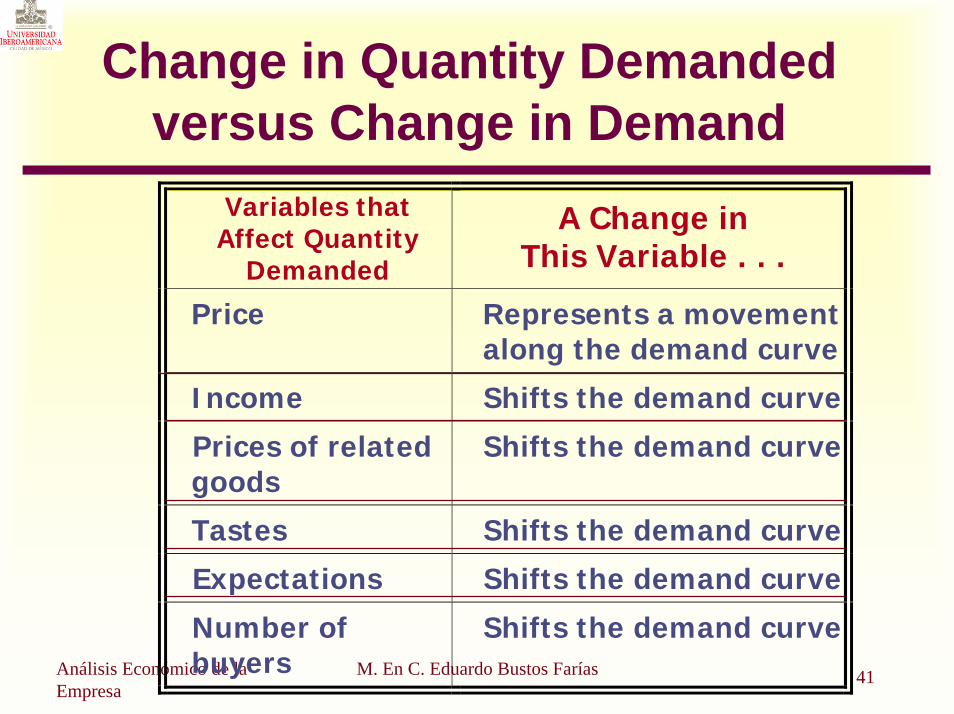
Change in Quantity Demanded versus Change in Demand
Variables that Affect Quantity
Demanded
A Change in This Variable . . .
Price Represents a movementalong the demand curve
Income Shifts the demand curve
Prices of relatedgoods
Shifts the demand curve
Tastes Shifts the demand curve
Expectations Shifts the demand curve
Number ofbuyers
Shifts the demand curve
42Análisis Económico de la Empresa
M. En C. Eduardo Bustos Farías
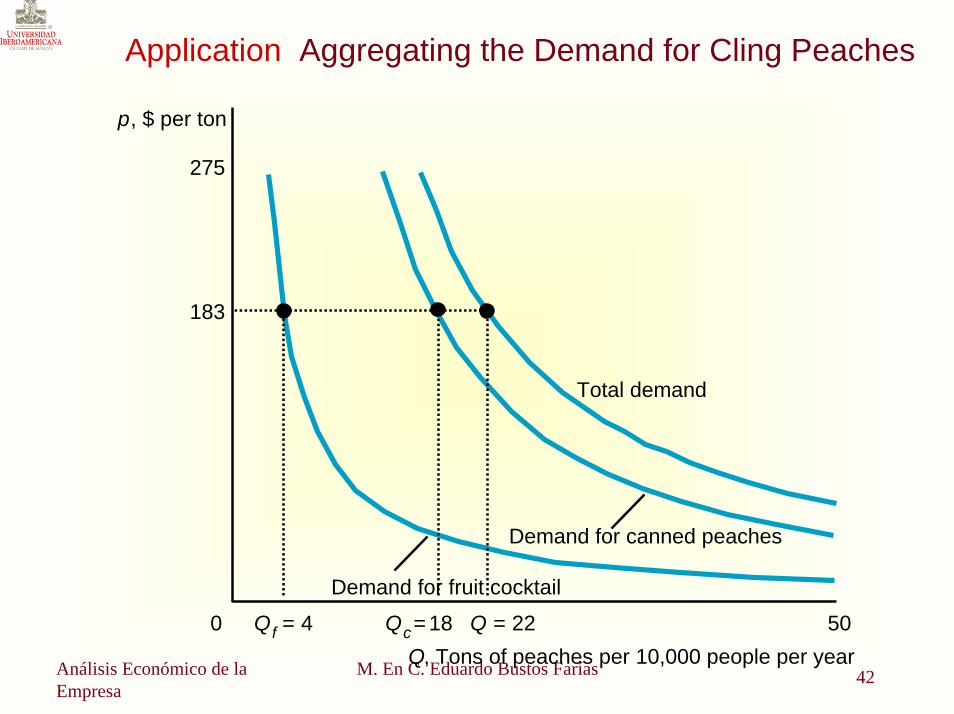
Application Aggregating the Demand for Cling Peaches
p, $ per ton
275
183
Total demand
Demand for canned peaches
Demand for fruit cocktail
Qf = 4 50Q, Tons of peaches per 10,000 people per year
Qc= 18 Q = 220
43Análisis Económico de la Empresa
M. En C. Eduardo Bustos Farías
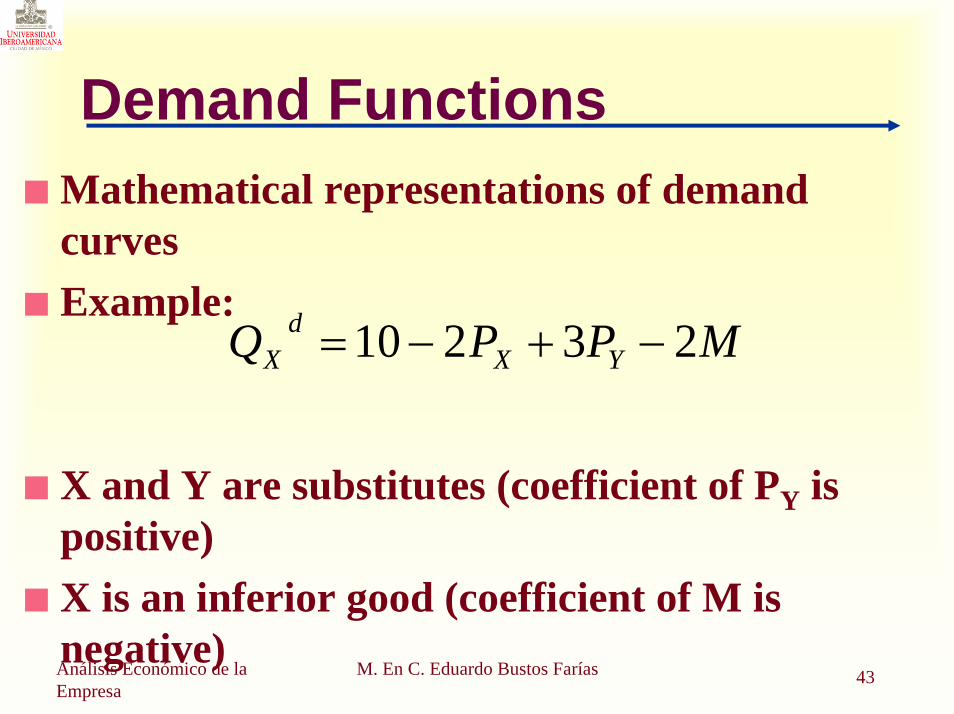
Demand FunctionsMathematical representations of demand curvesExample:
X and Y are substitutes (coefficient of PY is positive)X is an inferior good (coefficient of M is negative)
MPPQ YXd
X 23210 −+−=
44Análisis Económico de la Empresa
M. En C. Eduardo Bustos Farías
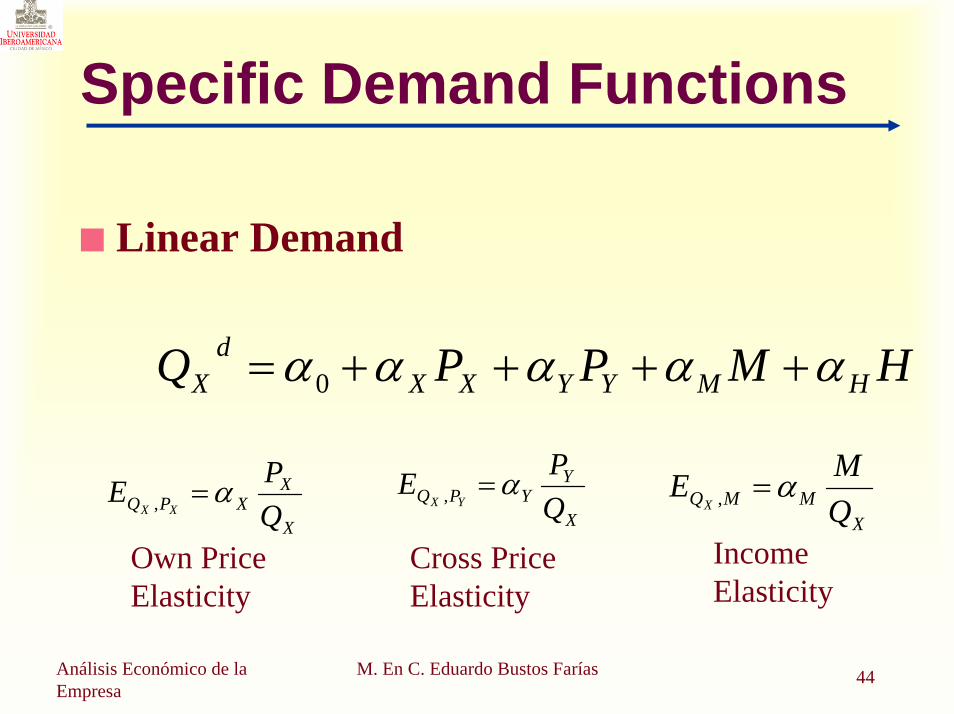
Specific Demand Functions
Linear Demand
HMPPQ HMYYXXd
X ααααα ++++= 0
XMMQ Q
MEX
α=,X
YYPQ Q
PEYX
α=,
X
XXPQ Q
PEXX
α=,
IncomeElasticity
Cross PriceElasticity
Own PriceElasticity
45Análisis Económico de la Empresa
M. En C. Eduardo Bustos Farías
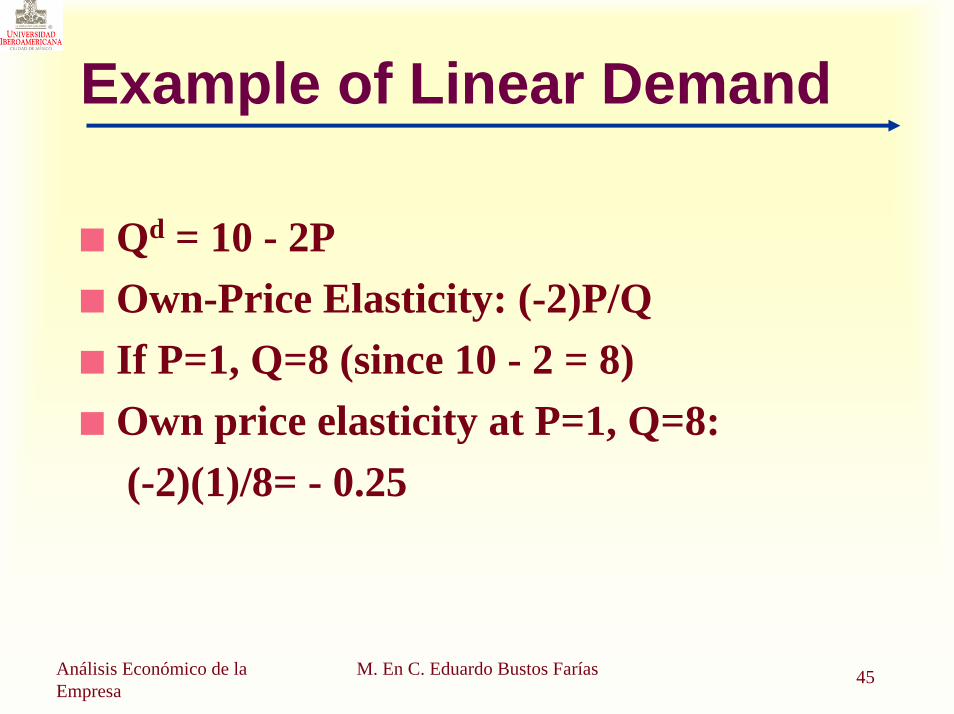
Example of Linear Demand
Qd = 10 - 2POwn-Price Elasticity: (-2)P/QIf P=1, Q=8 (since 10 - 2 = 8)Own price elasticity at P=1, Q=8:(-2)(1)/8= - 0.25
46Análisis Económico de la Empresa
M. En C. Eduardo Bustos Farías
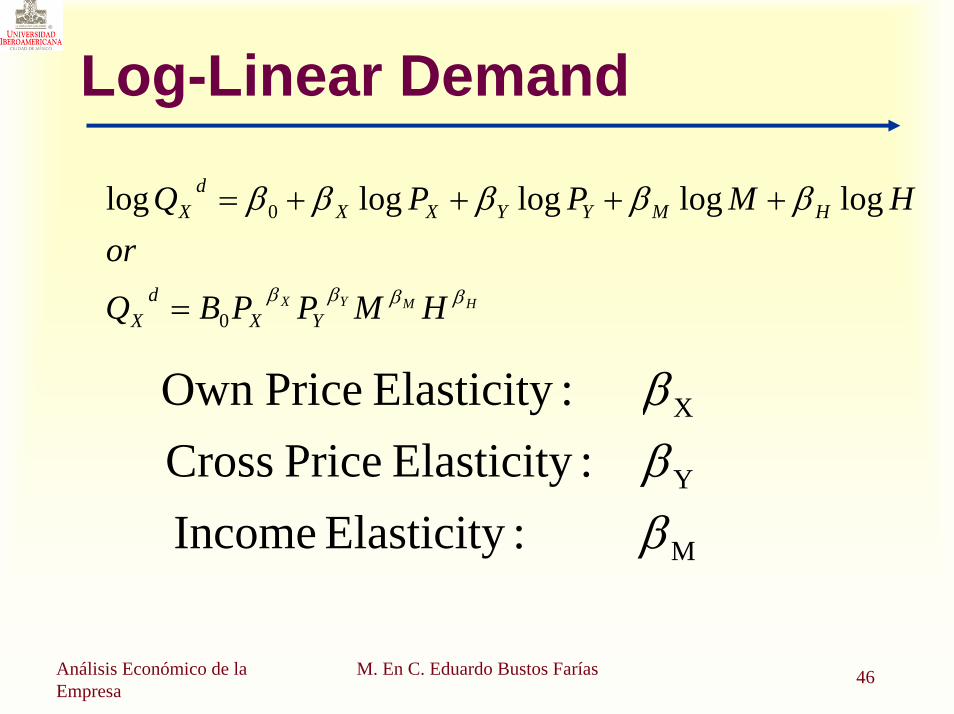
Log-Linear Demand
HMYX HMPPBQ
orHMPPQ
YXd
X
HMYYXXd
X
ββββ
βββββ
0
0 logloglogloglog
=
++++=
M
Y
X
:Elasticity Income:Elasticity Price Cross :Elasticity PriceOwn
βββ
47Análisis Económico de la Empresa
M. En C. Eduardo Bustos Farías
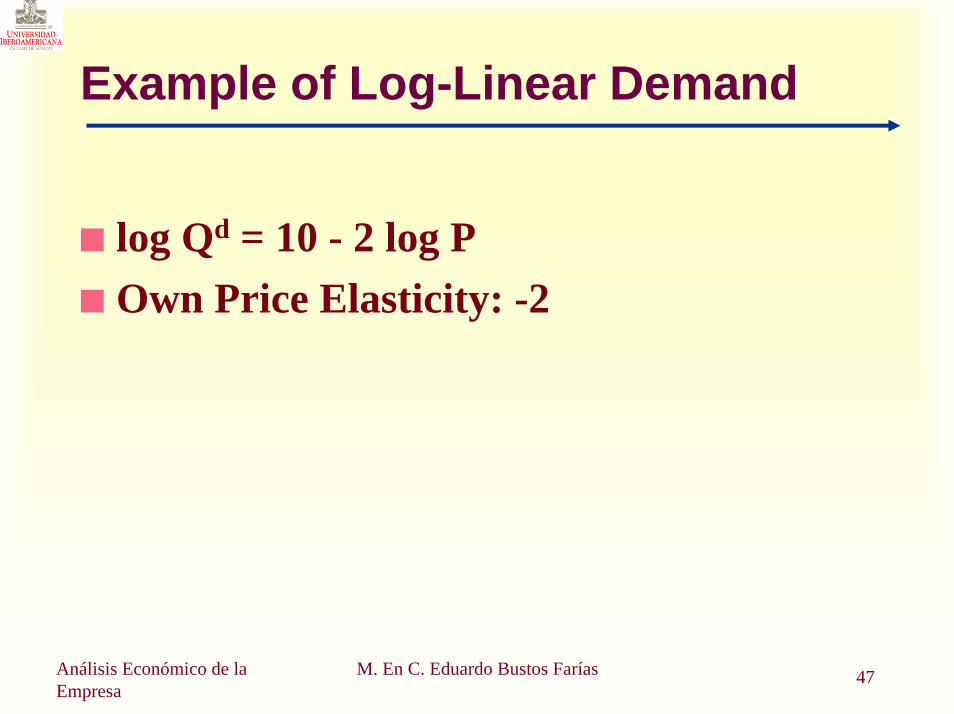
Example of Log-Linear Demand
log Qd = 10 - 2 log POwn Price Elasticity: -2
48Análisis Económico de la Empresa
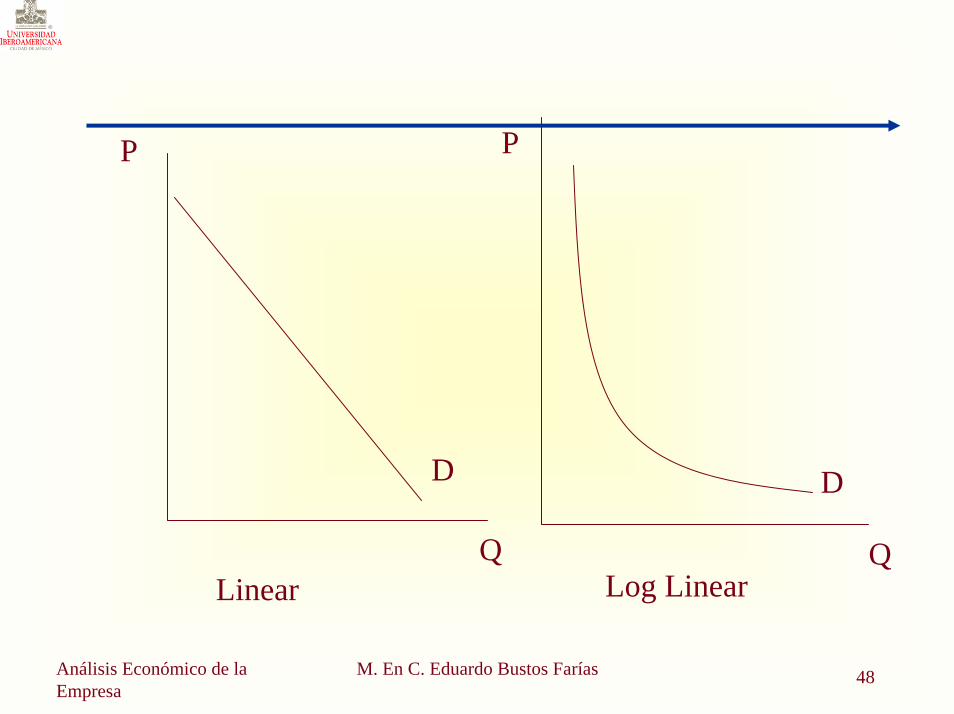
M. En C. Eduardo Bustos Farías
P
Q
P
D D
QLog Linear Linear

49Análisis Económico de la Empresa
M. En C. Eduardo Bustos Farías
Supply
Quantity supplied is the amount of a good that sellers are willing and able
to sell.
50Análisis Económico de la Empresa
M. En C. Eduardo Bustos Farías
Law of Supply
The law of supply states that there is a direct (positive) relationship between
price and quantity supplied.
51Análisis Económico de la Empresa
M. En C. Eduardo Bustos Farías
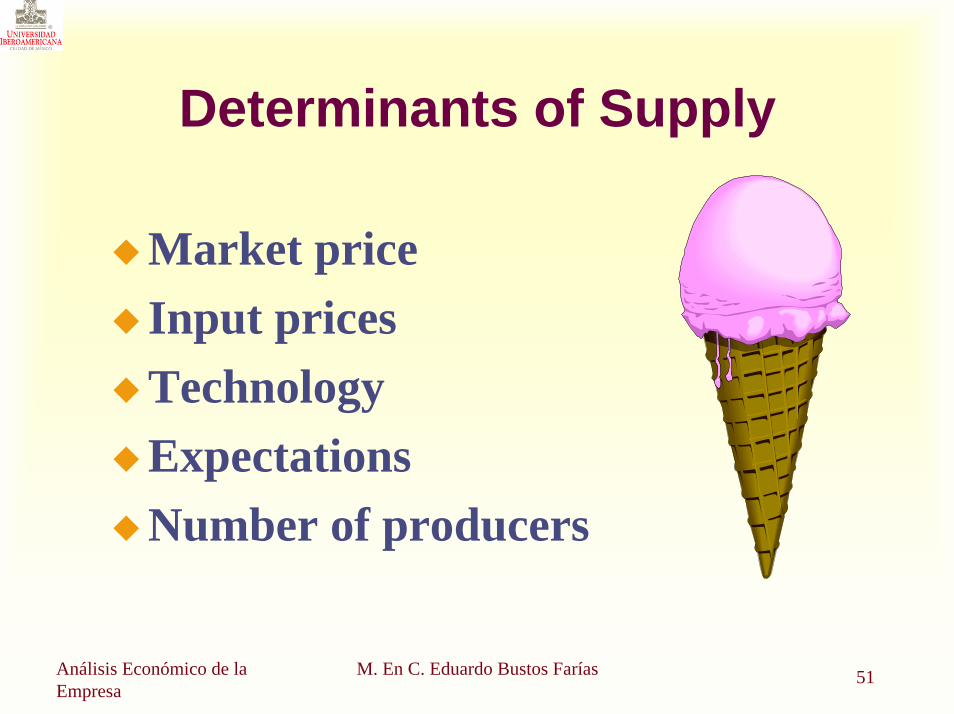
Determinants of Supply
Market priceInput pricesTechnologyExpectations Number of producers
52Análisis Económico de la Empresa
M. En C. Eduardo Bustos Farías
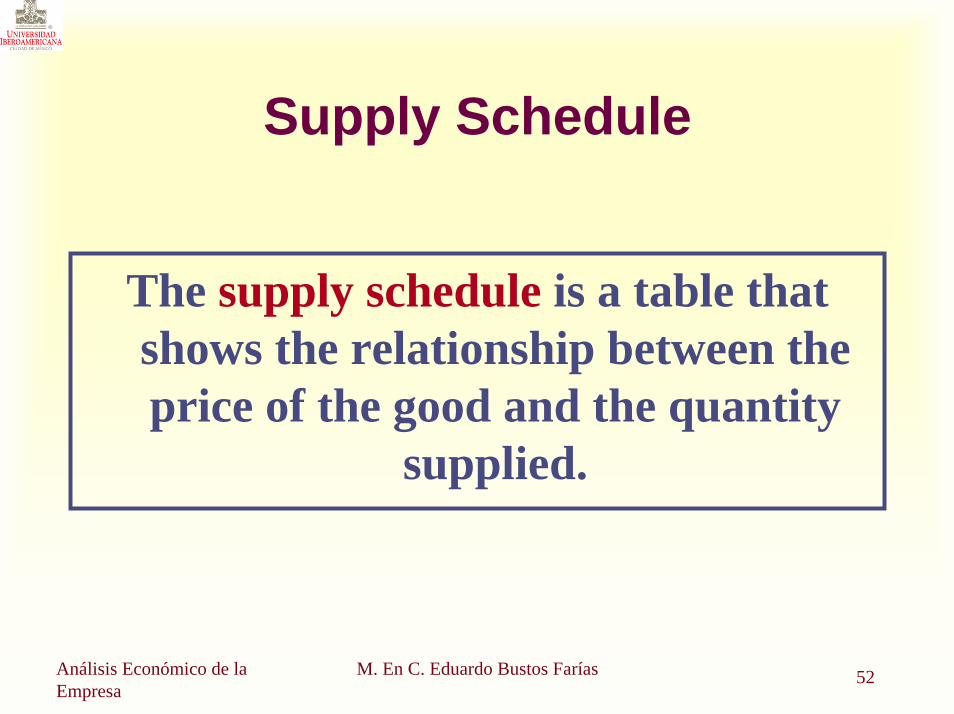
Supply Schedule
The supply schedule is a table that shows the relationship between the price of the good and the quantity
supplied.
53Análisis Económico de la Empresa
M. En C. Eduardo Bustos Farías
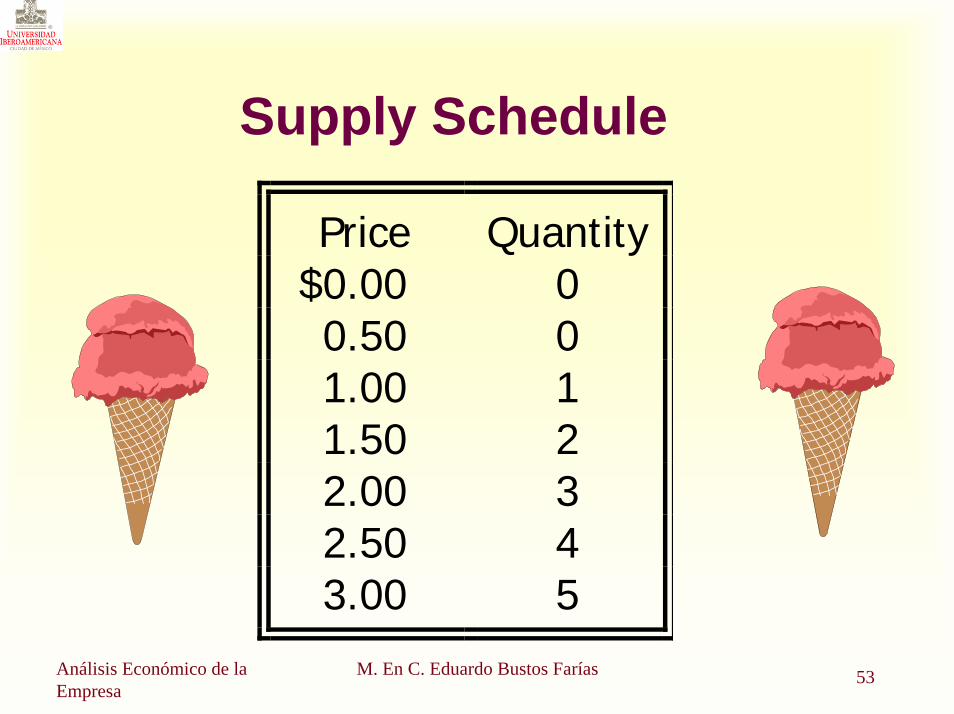
Supply Schedule
Price Quantity$0.00 00.50 01.00 11.50 22.00 32.50 43.00 5
54Análisis Económico de la Empresa
M. En C. Eduardo Bustos Farías
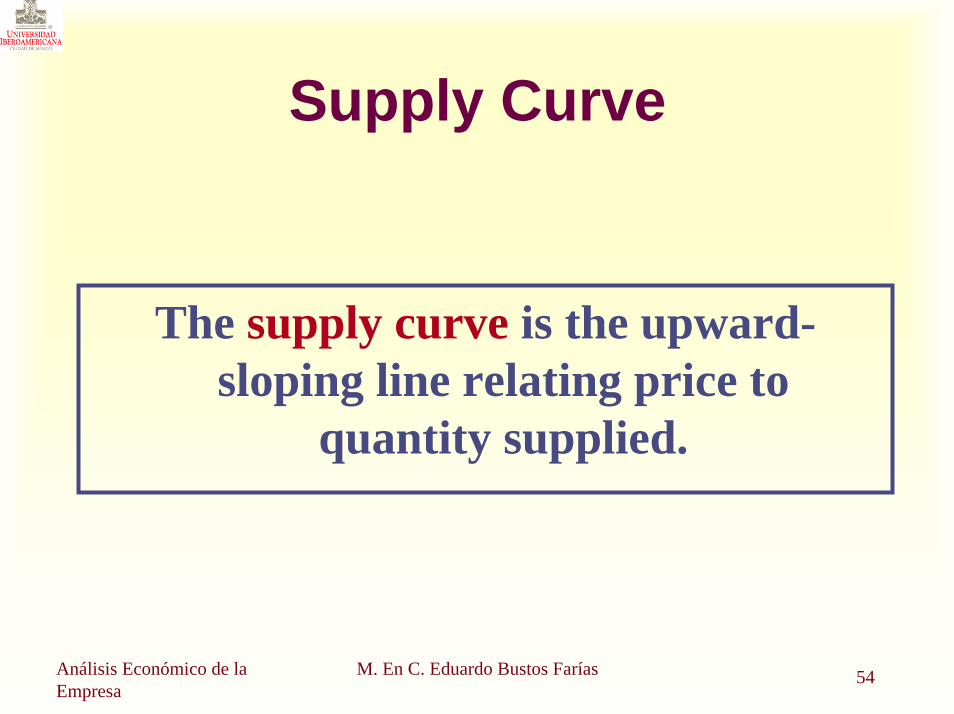
Supply Curve
The supply curve is the upward-sloping line relating price to
quantity supplied.
55Análisis Económico de la Empresa
M. En C. Eduardo Bustos Farías
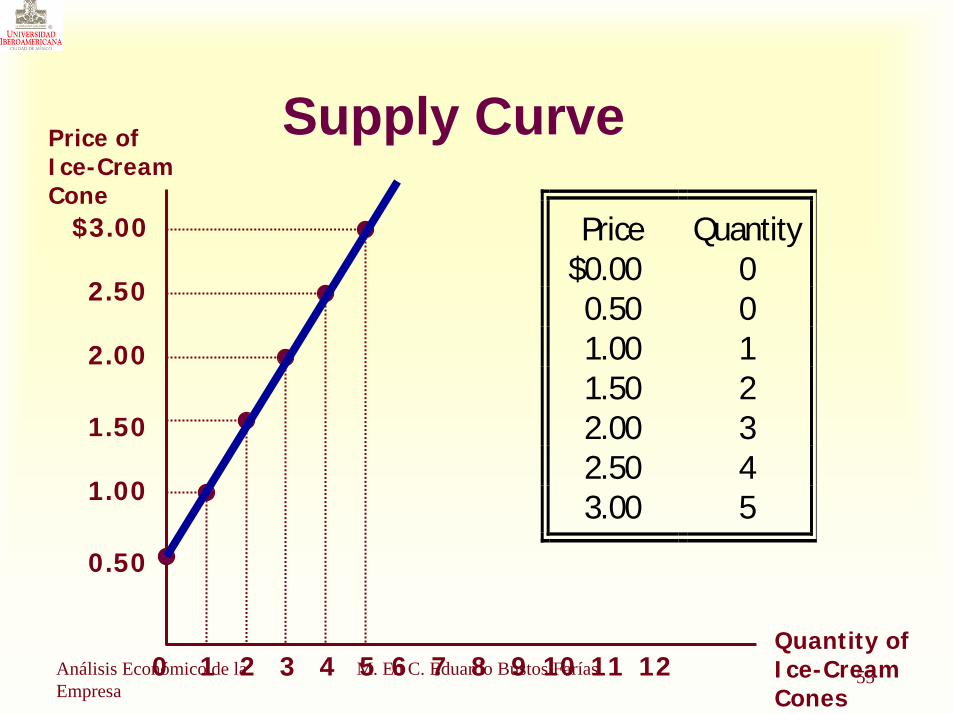
Supply Curve
$3.00
2.50
2.00
1.50
1.00
0.50
21 3 4 5 6 7 8 9 10 11
Price of Ice-Cream Cone
0Quantity of Ice-Cream Cones
Price Quantity$0.00 00.50 01.00 11.50 22.00 32.50 43.00 5
12
56Análisis Económico de la Empresa
M. En C. Eduardo Bustos Farías
Market Supply
Market supply refers to the sum of all individual supplies for all sellers of a particular good or service.Graphically, individual supply curves are summed horizontally to obtain the market supply curve.
57Análisis Económico de la Empresa
M. En C. Eduardo Bustos Farías
Determinants of Supply
Market priceInput pricesTechnologyExpectations Number of producers
58Análisis Económico de la Empresa
M. En C. Eduardo Bustos Farías
Change in Quantity Supplied versus Change in Supply
Change in Quantity SuppliedMovement along the supply curve.Caused by a change in the market price of the product.
59Análisis Económico de la Empresa
M. En C. Eduardo Bustos Farías
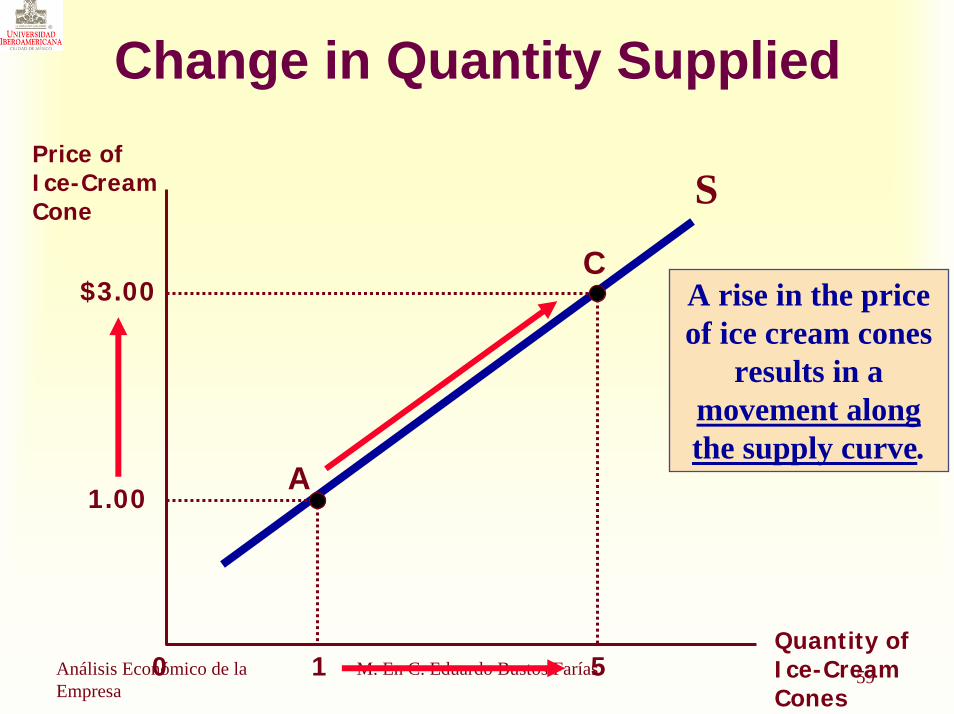
Change in Quantity Supplied
1 50
Price of Ice-Cream Cone
S
1.00
Quantity of Ice-Cream Cones
A
C$3.00 A rise in the price
of ice cream cones results in a
movement along the supply curve.
60Análisis Económico de la Empresa
M. En C. Eduardo Bustos Farías
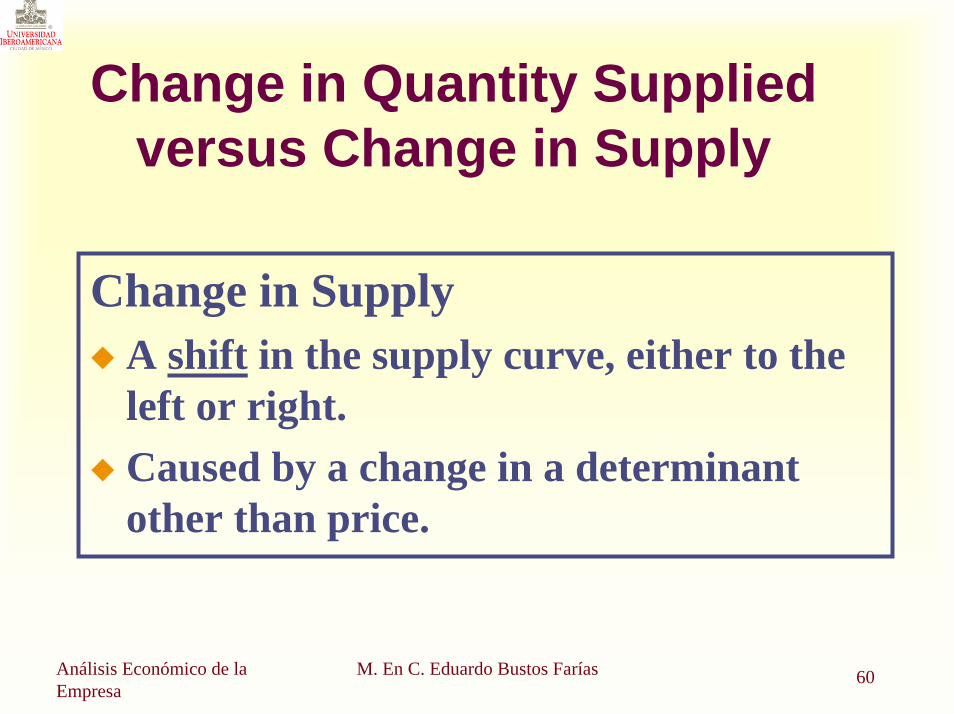
Change in Quantity Supplied versus Change in Supply
Change in SupplyA shift in the supply curve, either to the left or right.Caused by a change in a determinant other than price.
61Análisis Económico de la Empresa
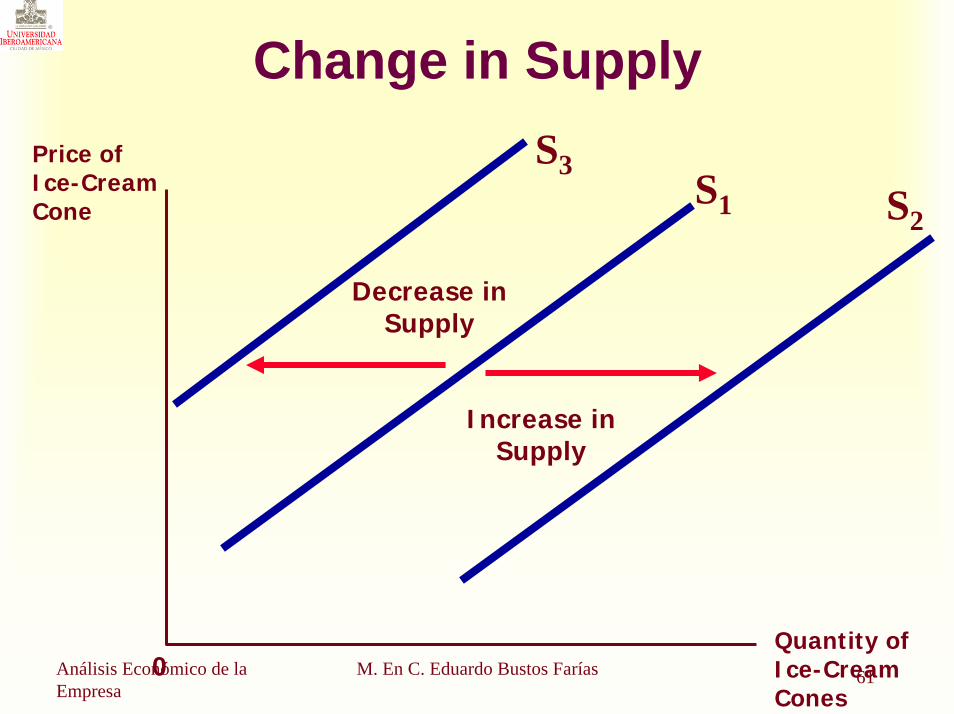
M. En C. Eduardo Bustos Farías
Change in SupplyPrice of Ice-Cream Cone
Quantity of Ice-Cream Cones
0
S1 S2
S3
Increase in Supply
Decrease in Supply
62Análisis Económico de la Empresa
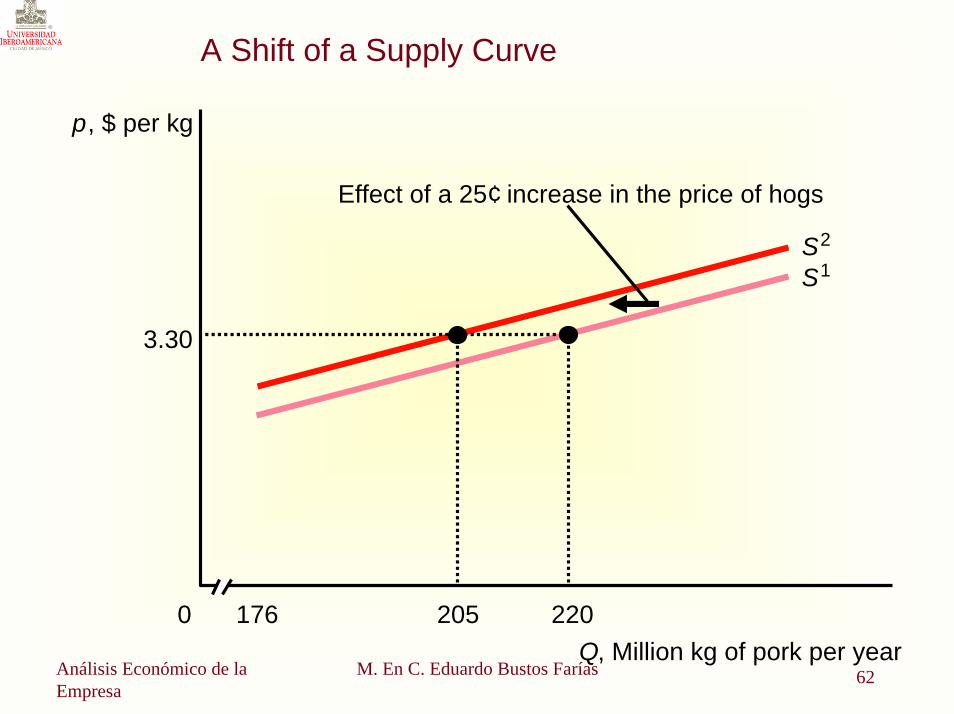
M. En C. Eduardo Bustos Farías
A Shift of a Supply Curve
p, $ per kg
205176
Effect of a 25¢ increase in the price of hogs
S1S2
2200
3.30
Q, Million kg of pork per year
63Análisis Económico de la Empresa
M. En C. Eduardo Bustos Farías
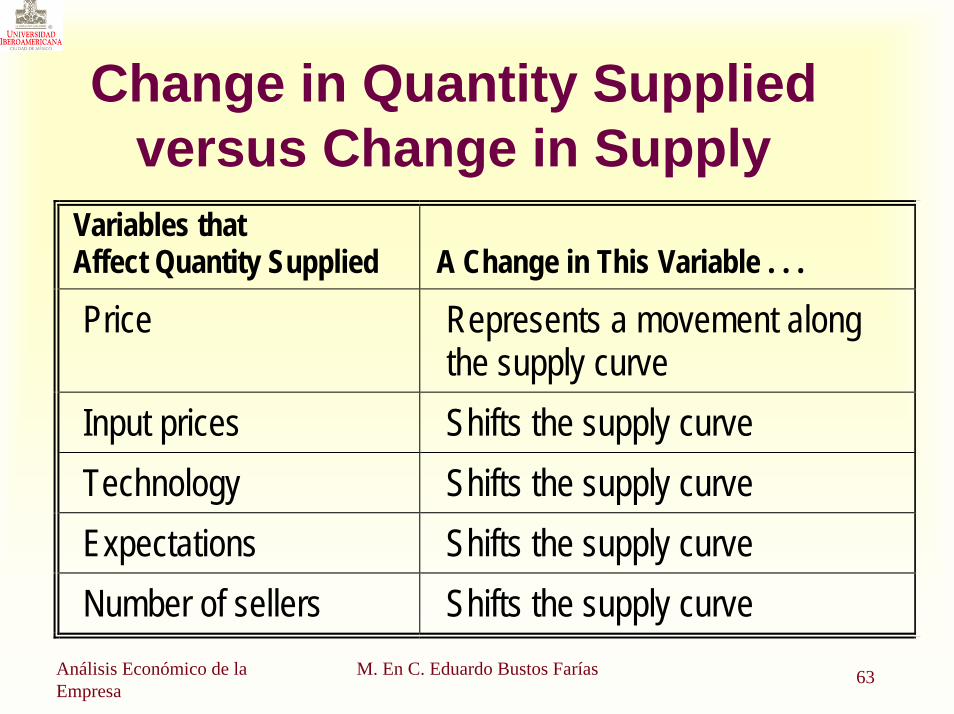
Change in Quantity Supplied versus Change in Supply
Variables that Affect Quantity Supplied
A Change in This Variable . . .
Price Represents a movement along the supply curve
Input prices Shifts the supply curve Technology Shifts the supply curve Expectations Shifts the supply curve Number of sellers Shifts the supply curve
64Análisis Económico de la Empresa
M. En C. Eduardo Bustos Farías
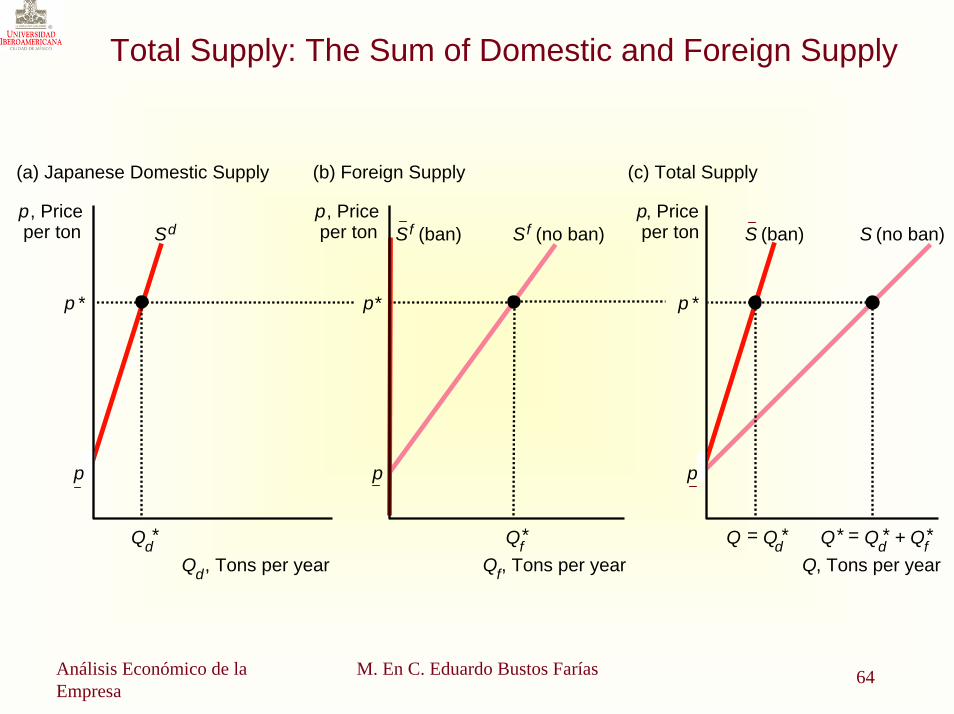
Total Supply: The Sum of Domestic and Foreign Supply
(a) Japanese Domestic Supply (b) Foreign Supply (c) Total Supply
p, Priceper ton
p, Priceper ton
p, Priceper ton
Qd*
Sd Sf (ban)
Qf* Q = Qd
* Q* = Qd* + Qf
*Qd, Tons per year Qf, Tons per year Q, Tons per year
p * p* p *
S (ban) S (no ban)Sf (no ban)
p p p
65Análisis Económico de la Empresa
M. En C. Eduardo Bustos Farías
Supply and Demand Together
Equilibrium PriceThe price that balances supply and demand. On a graph, it is the price at which the supply and demand curves intersect.
Equilibrium QuantityThe quantity that balances supply and demand. On a graph it is the quantity at which the supply and demand curves intersect.
66Análisis Económico de la Empresa
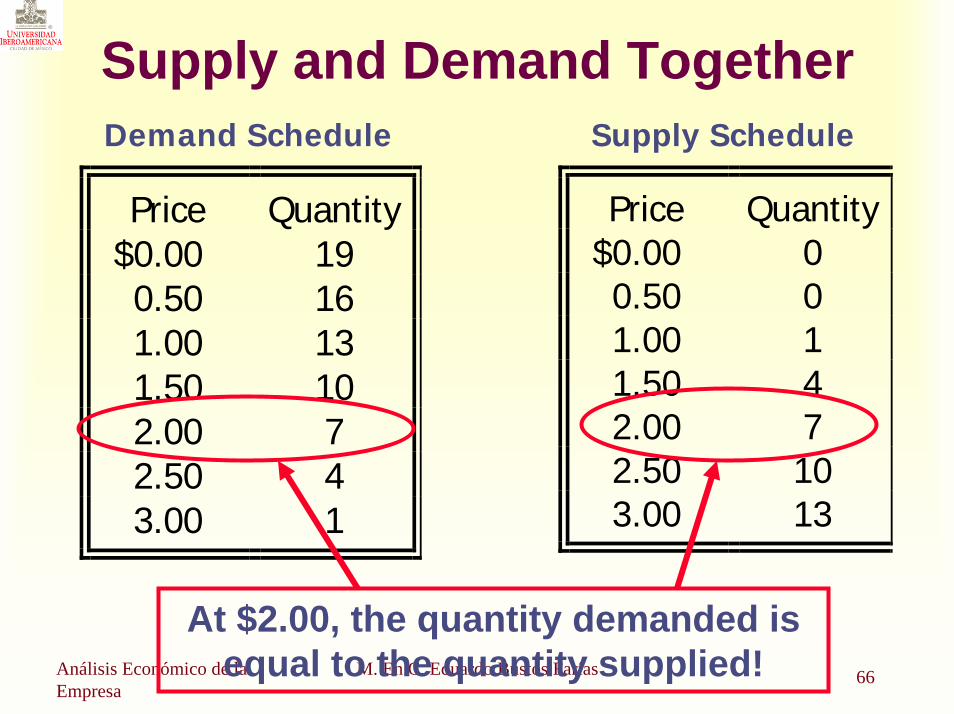
M. En C. Eduardo Bustos Farías
Supply and Demand TogetherDemand Schedule Supply Schedule
Price Quantity$0.00 00.50 01.00 11.50 42.00 72.50 103.00 13
Price Quantity$0.00 190.50 161.00 131.50 102.00 72.50 43.00 1
At $2.00, the quantity demanded is equal to the quantity supplied!
67Análisis Económico de la Empresa
M. En C. Eduardo Bustos Farías
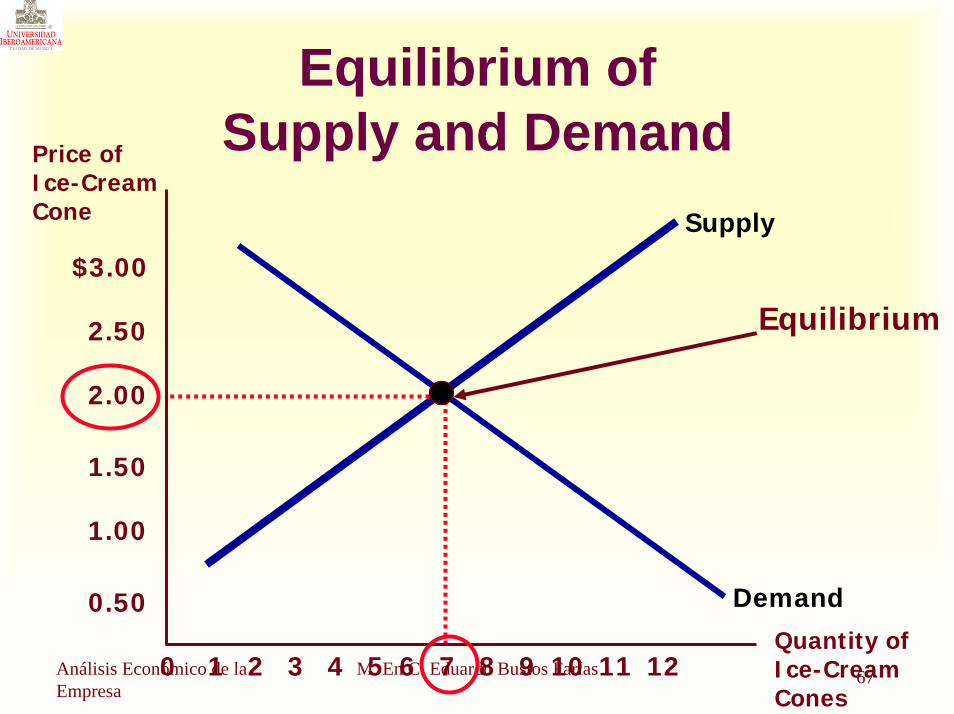
Equilibrium of Supply and Demand
Supply
Demand
Price of Ice-Cream Cone
$3.00
QuantiIce-Cream Cones
21 3 4 5 6 7 8 9 10 12110
2.50
2.00
1.50
1.00
0.50ty of
Equilibrium
68Análisis Económico de la Empresa
M. En C. Eduardo Bustos Farías
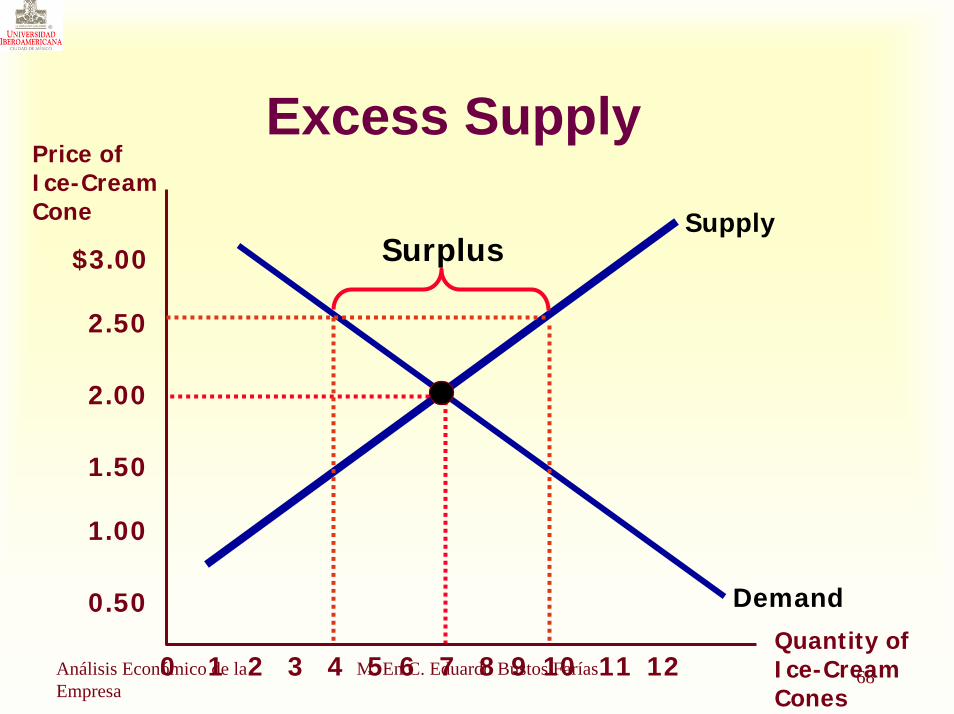
Excess SupplyPrice of Ice-Cream Cone
21 3 4 5 6 7 8 9 10 12110Quantity of Ice-Cream Cones
Supply
Demand
Surplus$3.00
2.50
2.00
1.50
1.00
0.50
69Análisis Económico de la Empresa
M. En C. Eduardo Bustos Farías
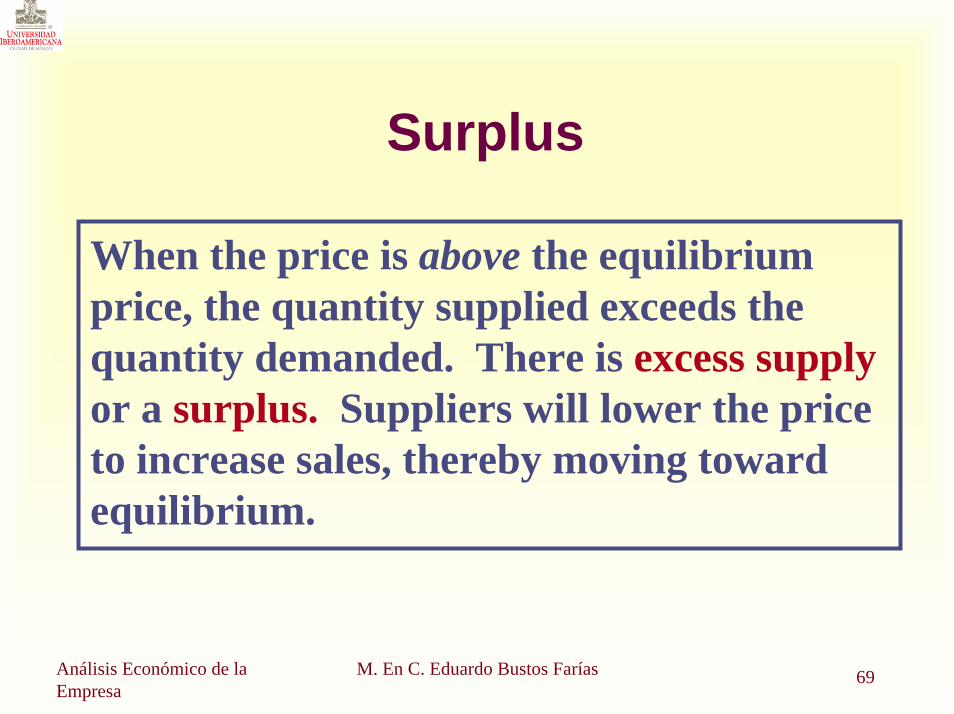
Surplus
When the price is above the equilibrium price, the quantity supplied exceeds the quantity demanded. There is excess supplyor a surplus. Suppliers will lower the price to increase sales, thereby moving toward equilibrium.
70Análisis Económico de la Empresa
M. En C. Eduardo Bustos Farías
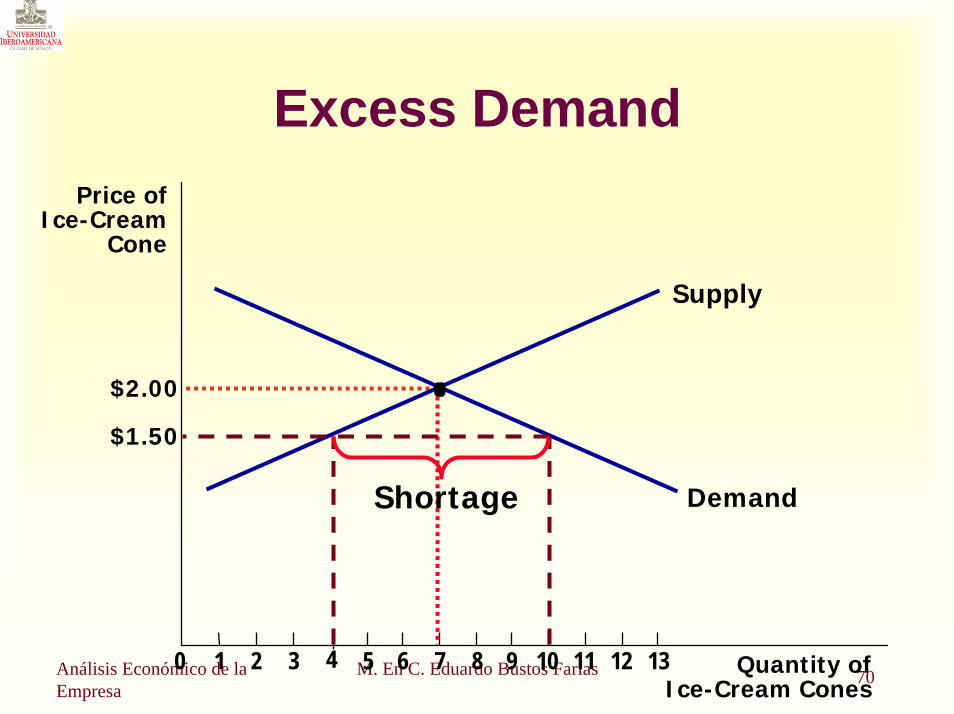
Excess Demand
Quantity ofIce-Cream Cones
Price ofIce-Cream
Cone
$2.00
0 1 2 3 4 5 6 7 8 9 10 11 12 13
Supply
Demand
$1.50
Shortage
71Análisis Económico de la Empresa
M. En C. Eduardo Bustos Farías
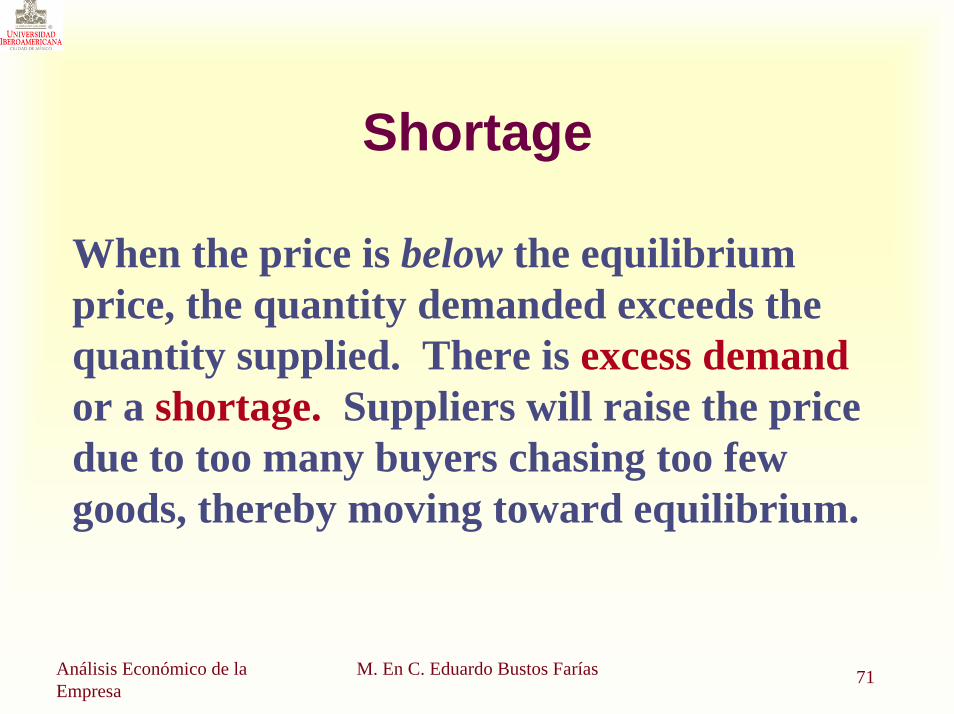
Shortage
When the price is below the equilibrium price, the quantity demanded exceeds the quantity supplied. There is excess demandor a shortage. Suppliers will raise the price due to too many buyers chasing too few goods, thereby moving toward equilibrium.
72Análisis Económico de la Empresa
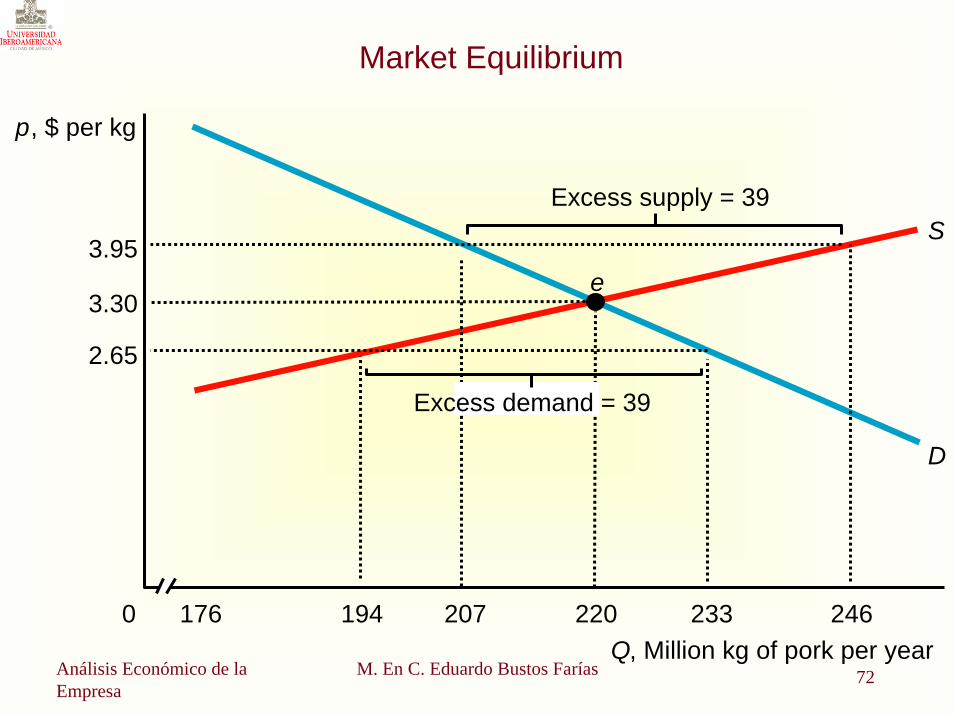
M. En C. Eduardo Bustos Farías
Market Equilibrium
p, $ per kg
220176
D
S
e
233 246194 2070
3.95
3.30
2.65
Excess supply = 39
Excess demand = 39
Q, Million kg of pork per year
73Análisis Económico de la Empresa
M. En C. Eduardo Bustos Farías
Three Steps To Analyzing Changes in Equilibrium
Decide whether the event shifts the supply or demand curve (or both).Decide whether the curve(s) shift(s) to the left or to the right.Examine how the shift affects equilibrium price and quantity.
Harcourt, Inc. items and derived items copyright © 2001 by Harcourt, Inc.
How an Increase in Demand Affects the Equilibrium
Price ofIce-Cream
Cone
2.00
0 7 Quantity ofIce-Cream Cones
Supply
Initialequilibrium
D1
1. Hot weather increasesthe demand for ice cream...
D2
2. ...resultingin a higherprice...
$2.50
103. ...and a higherquantity sold.
New equilibrium
75Análisis Económico de la Empresa
M. En C. Eduardo Bustos Farías
Shifts in Curves versus Movements along Curves
A shift in the supply curve is called achange in supply.A movement along a fixed supply curve is called a change in quantity supplied.A shift in the demand curve is called achange in demand.A movement along a fixed demand curve is called a change in quantity demanded.
76Análisis Económico de la Empresa
M. En C. Eduardo Bustos Farías
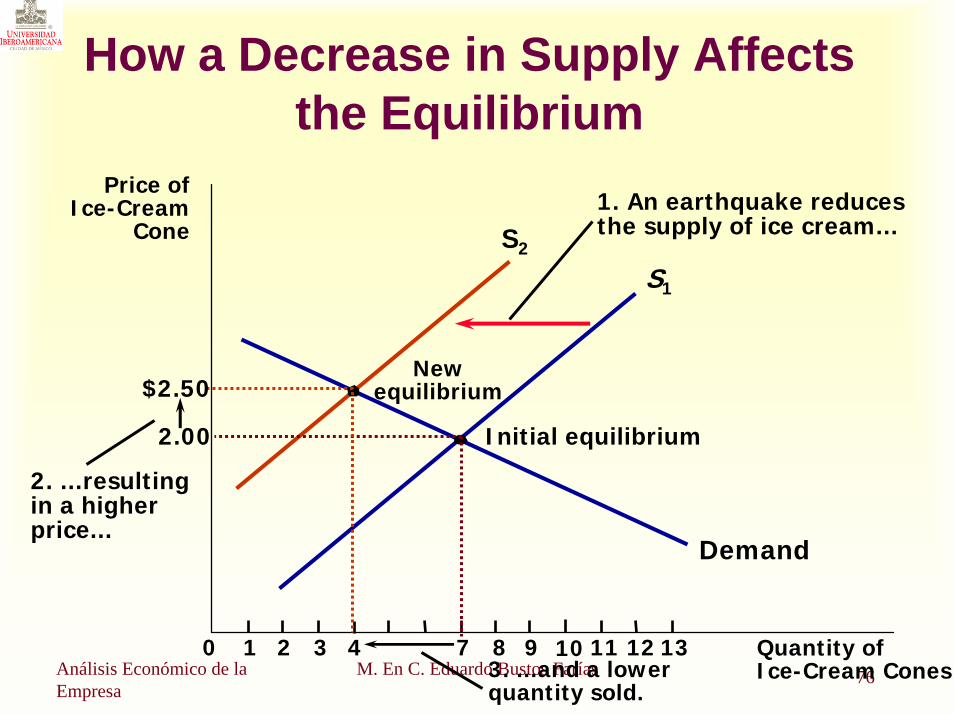
How a Decrease in Supply Affects the Equilibrium
S2
Price ofIce-Cream
Cone
2.00
0 1 2 3 4 7 8 9 11 12 Quantity ofIce-Cream Cones
13
Demand
Initial equilibrium
S1
10
1. An earthquake reducesthe supply of ice cream...
Newequilibrium
2. ...resultingin a higherprice...
$2.50
3. ...and a lowerquantity sold.
77Análisis Económico de la Empresa
M. En C. Eduardo Bustos Farías
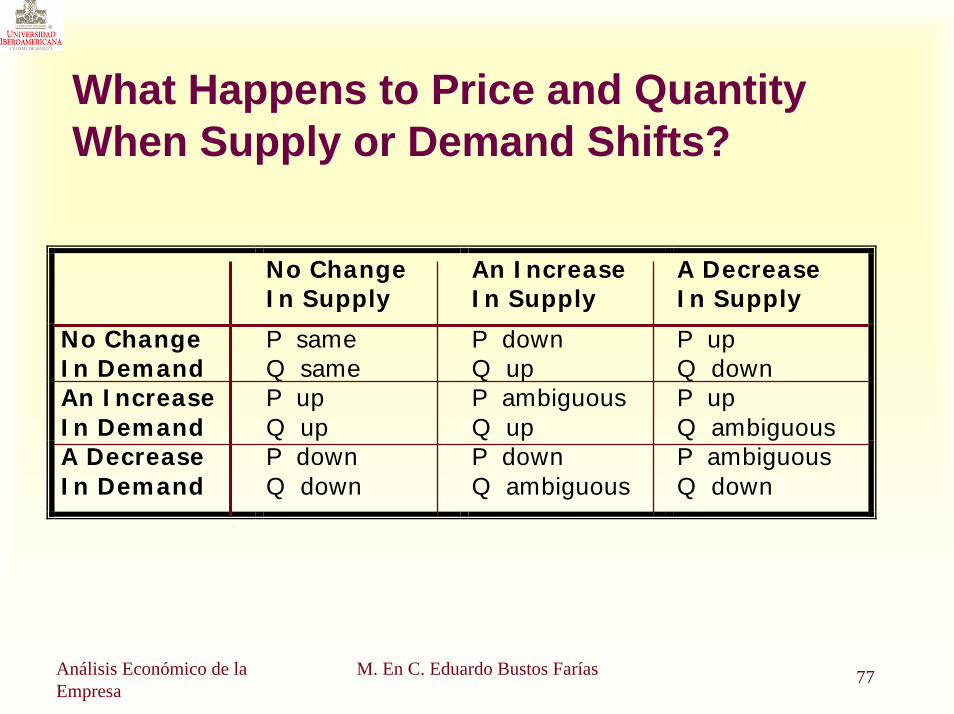
What Happens to Price and Quantity When Supply or Demand Shifts?
No Change In Supply
An Increase In Supply
A Decrease In Supply
No Change In Demand
P same Q same
P down Q up
P up Q down
An Increase In Demand
P up Q up
P ambiguous Q up
P up Q ambiguous
A Decrease In Demand
P down Q down
P down Q ambiguous
P ambiguous Q down
78Análisis Económico de la Empresa
M. En C. Eduardo Bustos Farías
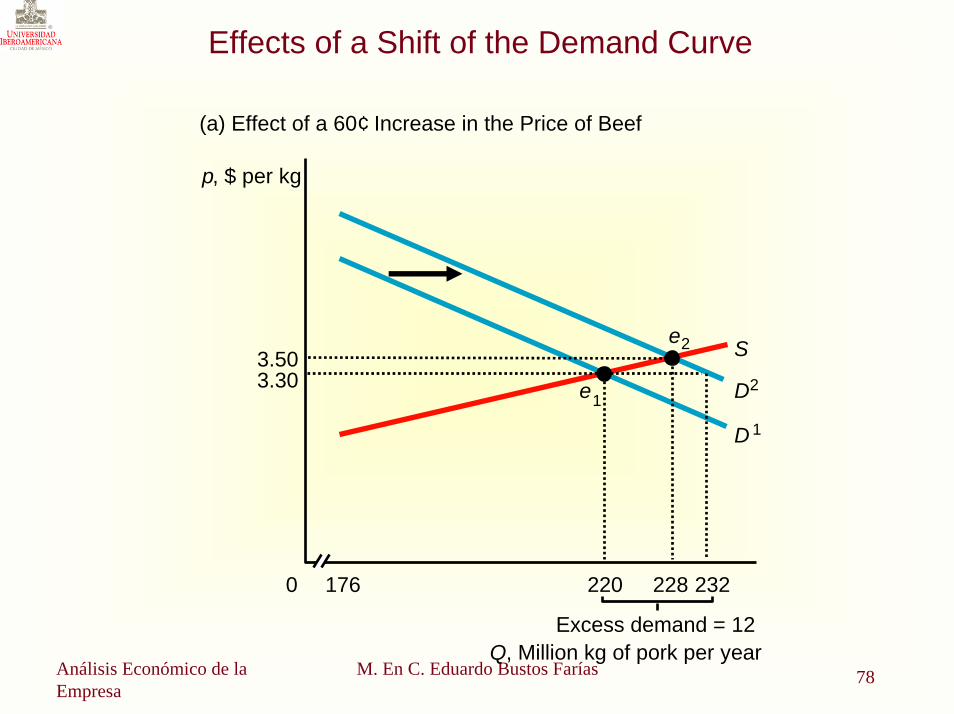
Effects of a Shift of the Demand Curve
(a) Effect of a 60¢ Increase in the Price of Beef
D 1
D2
S
1760 220 228 232
Q, Million kg of pork per yearExcess demand = 12
3.303.50
e2
e1
p, $ per kg
79Análisis Económico de la Empresa
M. En C. Eduardo Bustos Farías
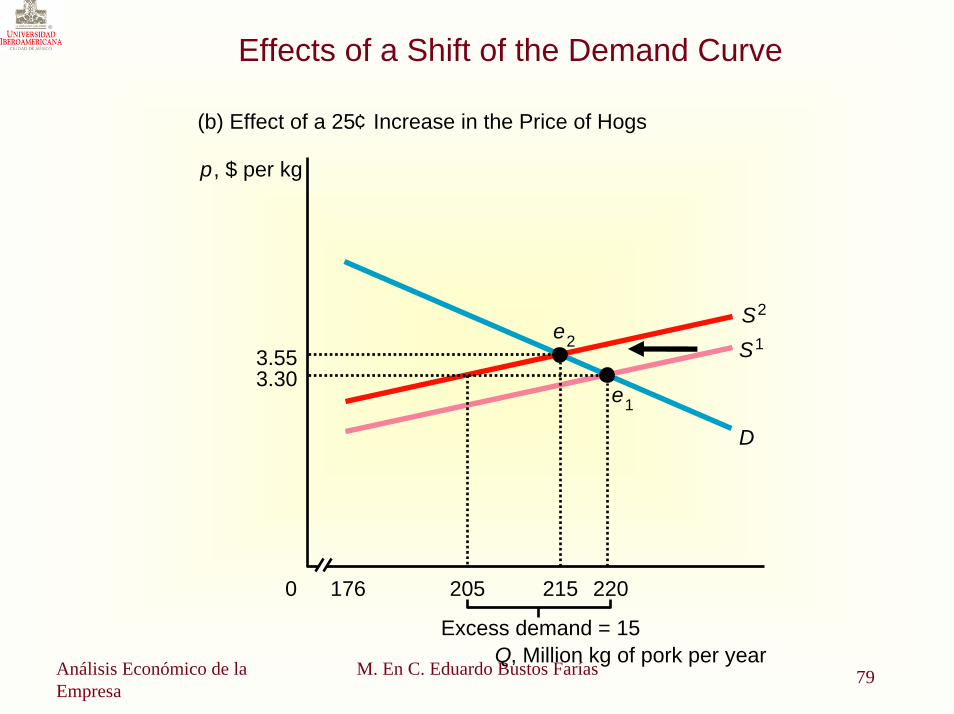
Effects of a Shift of the Demand Curve
(b) Effect of a 25¢ Increase in the Price of Hogs
S1
S2
Q, Million kg of pork per year
3.303.55
e1
e2
D
p, $ per kg
1760 220205 215
Excess demand = 15
80Análisis Económico de la Empresa
M. En C. Eduardo Bustos Farías
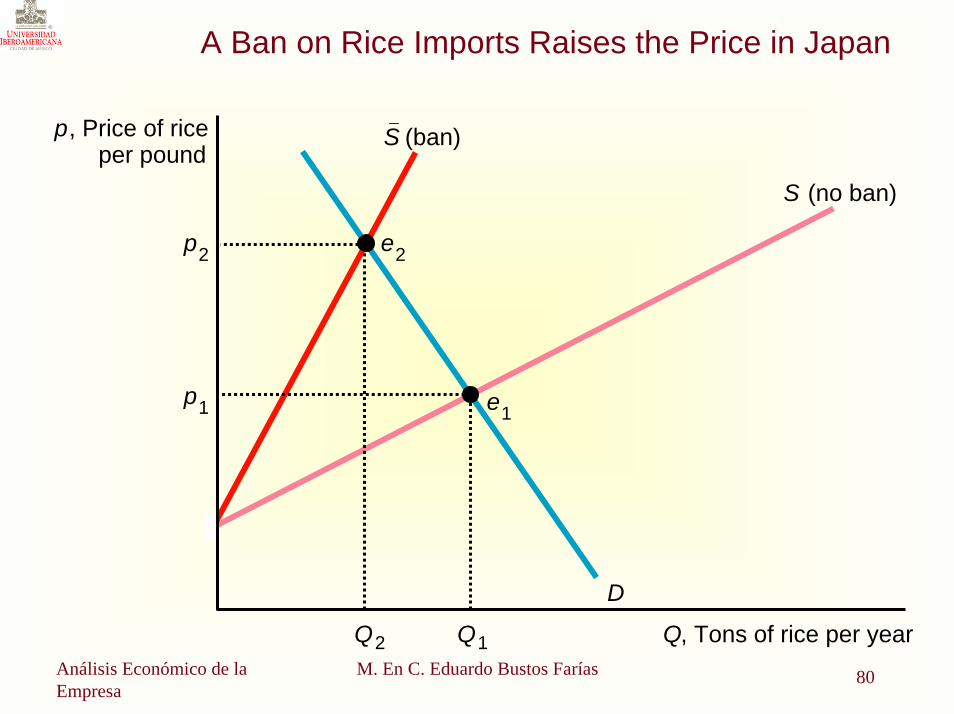
A Ban on Rice Imports Raises the Price in Japan
p, Price of riceper pound
S (no ban)
D
p2 e2
e1p1
S (ban)
Q, Tons of rice per yearQ1Q2
81Análisis Económico de la Empresa
M. En C. Eduardo Bustos Farías
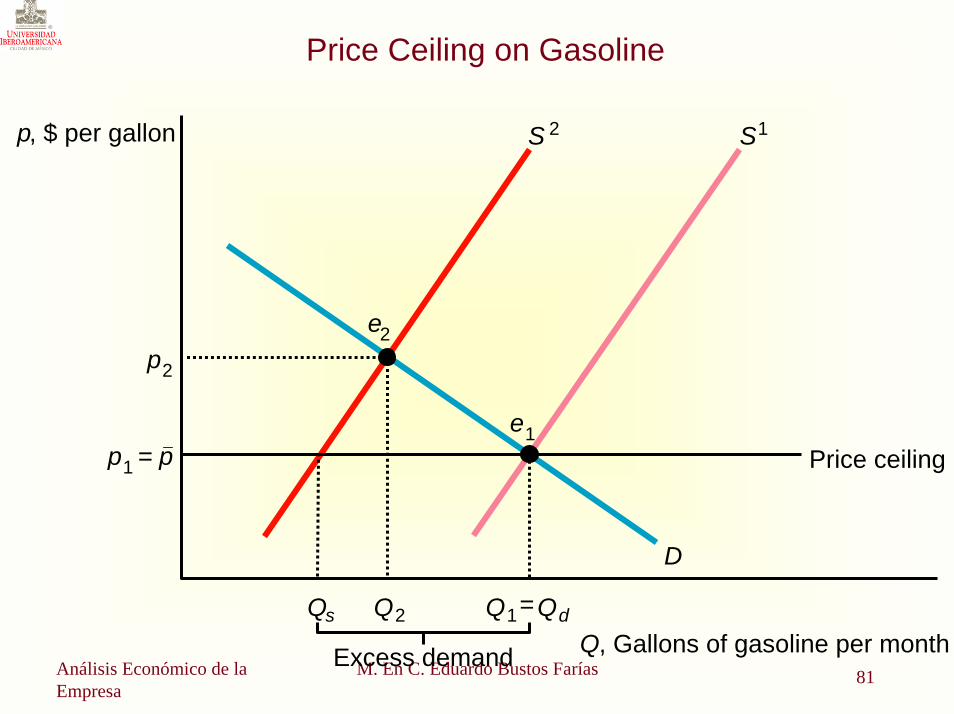
Price Ceiling on Gasoline
p, $ per gallon
Price ceiling
S1
D
S 2
p2
e2
e1p1 = p
Qs Q2 Q1=Qd
Excess demand Q, Gallons of gasoline per month
82Análisis Económico de la Empresa
M. En C. Eduardo Bustos Farías
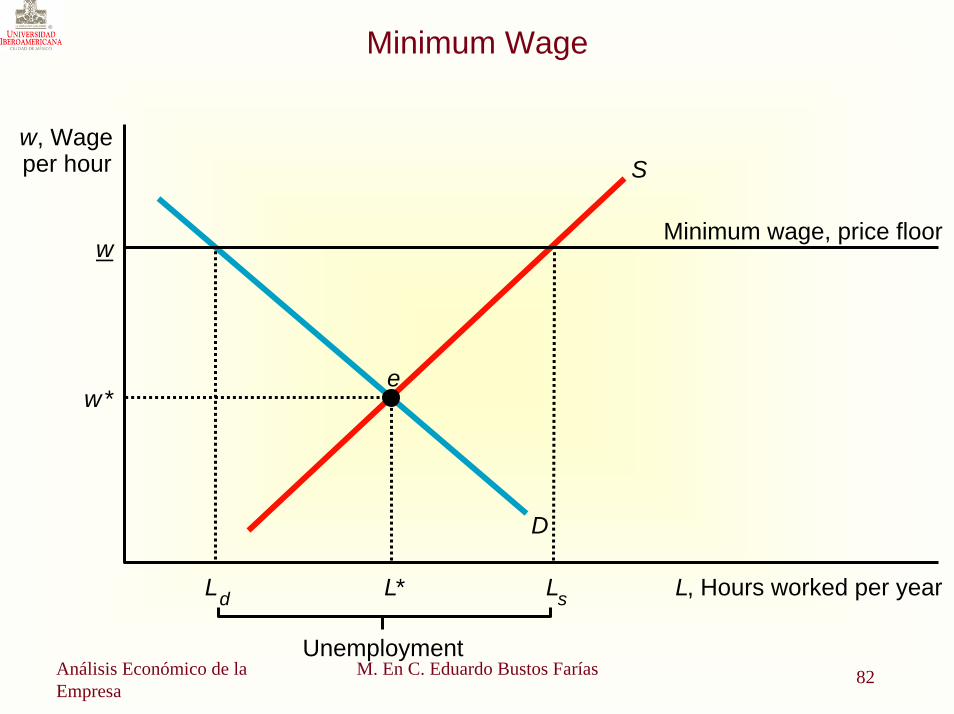
Minimum Wage
w, Wageper hour
Minimum wage, price floor
S
D
ew *
w
L, Hours worked per yearLd L* Ls
Unemployment