the mars analysis correction data assimilation (macda...
TRANSCRIPT
The Mars Analysis Correction Data Assimilation (MACDA)Dataset V1.0
L. Montabone1,2*, K. Marsh3, S. R. Lewis4, P. L. Read1, M. D. Smith5, J. Holmes4, A. Spiga2,D. Lowe3,† and A. Pamment31Department of Physics, University of Oxford, Oxford, UK2Laboratoire de M�et�eorologie Dynamique, Universit�e Pierre et Marie Curie, Paris, France3Rutherford Appleton Laboratory – STFC, UK4Department of Physical Sciences,The Open University, Milton Keynes, UK5NASA Goddard Space Flight Center, Greenbelt, MD, USA†Current Address: Australian Bureau of Meteorology, Melbourne, Australia
*L. Montabone, Correspondence: Department of Physics, University of Oxford, Parks Road, Oxford OX1 3PU, UK,E-mail: [email protected]
This article was funded by a grants from STFC, grant numbers ST/I001948/1, ST/K00106X/1 and ST/J001597/1, and UKSA/STFC, grant number ST/I003096/1.
The Mars Analysis Correction Data Assimilation (MACDA) dataset version 1.0 contains the reanalysis of fundamental atmosphericand surface variables for the planet Mars covering a period of about three Martian years (a Martian year is about 1.88 terrestrialyears). This has been produced by data assimilation of observations from NASA’s Mars Global Surveyor (MGS) spacecraft duringits science mapping phase (February 1999–August 2004). In particular, we have used retrieved thermal profiles and total dustoptical depths from the Thermal Emission Spectrometer (TES) on board MGS. Data have been assimilated into a Mars global cli-mate model (MGCM) using the Analysis Correction scheme developed at the UK Meteorological Office. The MGCM used is the UKspectral version of the Laboratoire de M�et�eorologie Dynamique (LMD, Paris, France) MGCM. MACDA is a joint project of the Uni-versity of Oxford and The Open University in the UK.
Geosci. Data J. 1: 129–139 (2014), doi: 10.1002/gdj3.13
Received: 31 July 2013, revised: 3 March 2014, accepted: 27 March 2014
Key words: mars atmosphere, mars reanalysis, mars Global Surveyor, global climate model (GCM), data assimilation
Dataset
Identifier: doi:10.5285/78114093-E2BD-4601-8AE5-3551E62AEF2BCreator: University of Oxford and The Open University. [Montabone, L., S. R. Lewis, P. L. Read]Title: Mars Analysis Correction Data Assimilation (MACDA): MGS/TES v1.0Publisher: NCAS British Atmospheric Data CentrePublication year: 2011Resource type: Data EntityVersion: 1.0
Introduction
Ever-increasing numbers of atmospheric observationsfrom orbiting spacecraft, and increasingly sophisti-cated numerical models, have recently permitted dataassimilation techniques to be applied to planetsbeyond Earth. A meteorological ‘reanalysis’ is theapplication of a single consistent scheme to assimilatedata spanning an extended historical period. Mars isthe first extraterrestrial planet for which reanalyses ofthe atmospheric state are now available (Montabone
et al., 2006a; Lewis et al., 2007; Greybush et al.,2012; Lee et al., 2013).
The Thermal Emission Spectrometer (TES) (Chris-tensen, 2001) on board NASA’s Mars Global Surveyor(MGS) has produced an extensive atmospheric datasetduring its scientific mapping phase between February1999 and August 2004. The well-sampled spatial andtemporal coverage given by the 2-h, sun-synchronouspolar orbit has permitted the observation of Mars atlocal times centred around 2 AM and 2 PM (at tropicaland mid-latitudes), while displacing about 30° in
ª 2014 The Authors. Geoscience Data Journal published by Royal Meteorological Society and John Wiley & Sons Ltd.This is an open access article under the terms of the Creative Commons Attribution License, which permits use, distribution andreproduction in any medium, provided the original work is properly cited.

longitude at each new orbit, corresponding to about12 complete orbits per mean solar day.
Thermal profiles for the atmosphere up to about40 km altitude and infrared column dust optical depths(almost entirely limited to daytime) have been retrievedfrom TES absorption spectra in nadir view, among otherproducts (Smith, 2004). These data cover almost threecomplete Martian seasonal cycles,1 from late northernsummer in MY 24 to late northern spring in MY 27.2
This dataset of global atmospheric observations isideal for data assimilation into a global climate model.We have, therefore, used it to produce the 4-year (MY24-27) reanalysis of the atmosphere of Mars which isdescribed in this article.
The use of this reanalysis for scientific studies hasalready led to several publications. In particular, here wemention those on the interannual variability in duststorms (Montabone et al., 2005) and their impact onthe landing of NASA’s Mars Exploration Rovers as well asESA’s Beagle 2 (Montabone et al., 2006b), on the inter-annual variability in thermal tides (Lewis and Barker,2005), on a teleconnection event during the planet-encircling dust storm in 2001 (MY 25, Mart�ınez-Alvaradoet al., 2009), on the radiative effects of tropical waterice clouds (Wilson et al., 2008), and on Martian weatherpredictability (Rogberg et al., 2010). More recent ongo-ing work involves the use of the MGS/TES Mars AnalysisCorrection Data Assimilation (MACDA) reanalysis for thestudy of the solstitial pause in the intensity of high lati-tude baroclinic waves, studies of the Martian boundarylayer, and the interannual variability in polar vortexdynamics and atmospheric angular momentum.
In Section 2, we summarize key information aboutthe MGS/TES observations, the global climate modeland the data assimilation scheme that we have used.Section 3 is devoted to the description of the MACDAMGS/TES v1.0 dataset. In Section 4 we describe theavailable web interface for the dataset visualization.How to access the database and the visualization toolis detailed in Section 5. Finally, we mention futureimprovements of the database in Section 6.
1. MGS/TES Observations and DataAssimilation
TES nadir retrievals of thermal profiles and total (i.e.integrated over the whole atmospheric column) dust
optical depths have been analysed by assimilation intoa Mars global climate model (MGCM), making use of asequential procedure known as the Analysis Correction(AC) scheme. This is a form of successive correctionsmethod which was originally developed for Earth dataassimilation at the Meteorological Office (Met-Office)in the UK (Lorenc et al., 1991).
Only a limited number of TES limb profiles are avail-able (Smith et al., 2001), which are not used in thecurrent assimilation. Our reanalysis of TES retrievals,therefore, does not include observations of tempera-ture above about 40 km altitude.
TES retrievals of absorption-only column dust opticaldepth are in the infrared (wavelength around 1075cm�1, or 9.3 lm), whereas the GCM radiation schemecomputes dust heating rates based on mean visibleopacities (about 670 nm). To convert to equivalent visi-ble values, infrared dust opacities from TES have beenmultiplied by a factor of 2.0. This factor includes thevalue for the conversion from absorption-only to fullextinction (absorption and scattering), which Smith(2004) and Wolff (2006) indicate as roughly 1.3. Clancyet al. (1995, 2003), Lemmon et al. (2004), and Wolff(2006) provide values for the conversion factor frominfrared extinction to visible optical depth, measured inseveral observational campaigns. For dust particle sizesin the range 1.5–2.0 lm, the average of these values is2.5 � 0.6, which has a large associated uncertainty. Bychoosing a single factor 2.0 to convert from infraredabsorption to visible extinction optical depth, we mightunderestimate the mean visible opacities, but given thelarge uncertainties on particle sizes at different seasonsand locations, this might not be the case at all timesand places. Montabone et al. (2006a), for instance,showed that there are no significant differences in theresults of the assimilation during the 2001 (MY 25) pla-net-encircling dust storm when using visible extinction/infrared absorption factors between 1.5 and 2.5.
In the version of the reanalysis described in thisarticle, we have not used the dust lifting, transportand sedimentation model available in the MGCM tocarry out the complete assimilation of dust observa-tions. We have just continuously updated theprescribed column-integrated dust optical depth fieldin the MGCM with increments from the analysis oftotal dust optical depth retrievals, when observationsare available. When there are no dust observationsavailable, the dust field is simply kept constant untilnew observations become available again. The verticaldistribution of the dust is analytically prescribed in themodel using the Conrath distribution (Conrath, 1975),see also details in Montabone et al. (2006a).
It is also worth mentioning that the MGCM used toproduce the reanalysis described in this article doesnot include the microphysical modelling of carbondioxide condensation, particularly under supersatu-rated conditions. Instead, this version of the MGCMuses a simple scheme for condensation andsublimation of carbon dioxide, based on not exceedingsaturation (Forget et al., 1999). To avoid too much
1Each Martian seasonal cycle (Martian year, MY) correspondsto 668.5921 mean solar days, and the Martian mean solarday (called ‘sol’) is about 24 h and 40 min (more precisely,88775.244 s, i.e. 1.0275 times an Earth day). A MY is aslong as 1.88 Terrestrial years.2Clancy et al. (2000) proposed an arbitrary convention tonumerate the MYs starting from 11th April 1955 (MY 1). Thisdate corresponds to the Martian northern spring equinoxpreceding the planet-encircling dust storm of 1956. Thisstorm marks the beginning of the new period of scientificobservation and exploration of the planet Mars. Using thisconvention, all scientific data can be easily compared using acalendar based on Mars years and seasons.
130 L. Montabone et al.
ª 2014 The Authors.Geoscience Data Journal published by Royal Meteorological Society and John Wiley & Sons Ltd.Geoscience Data Journal 1: 129–139 (2014)
condensation as a result of supersaturation, andtherefore too much seasonal and interannual variationin surface pressure with respect to observations byViking landers, we have not assimilated TEStemperature profiles that exhibit values below thecarbon dioxide condensation temperature (see alsoMontabone et al., 2006a). The number of such pro-files represents about 8.2% of the total number ofavailable retrieved profiles (over 50 million).
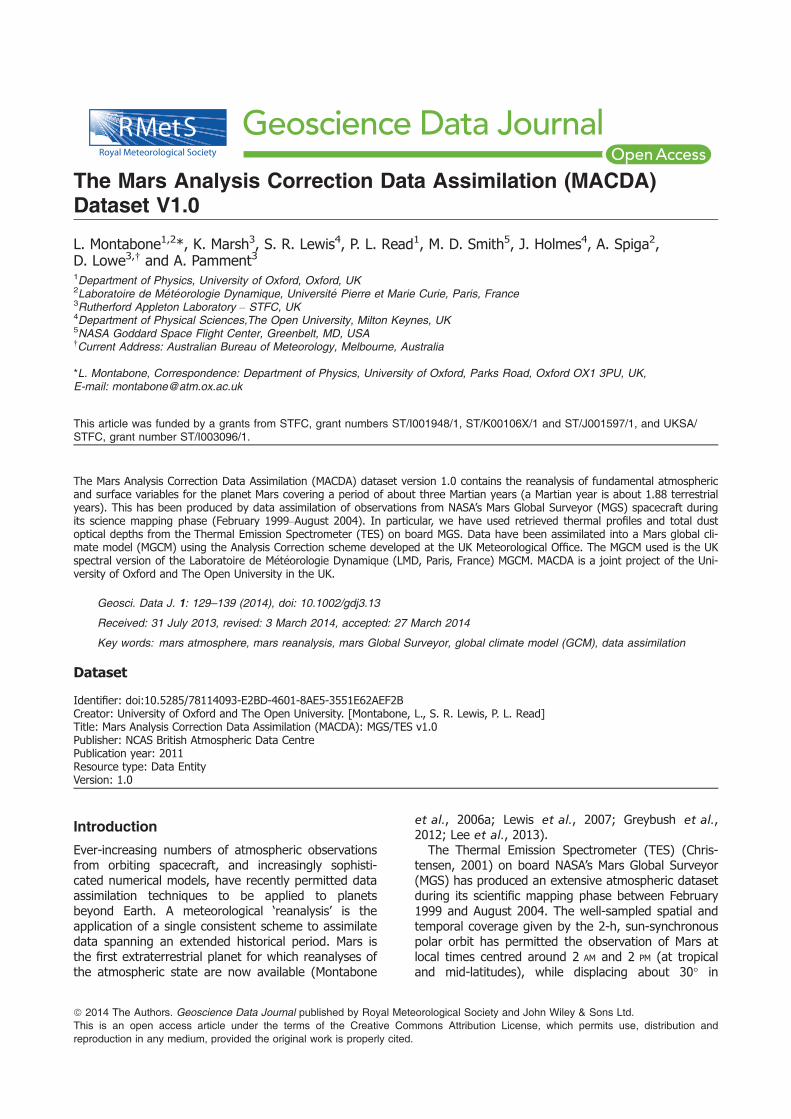
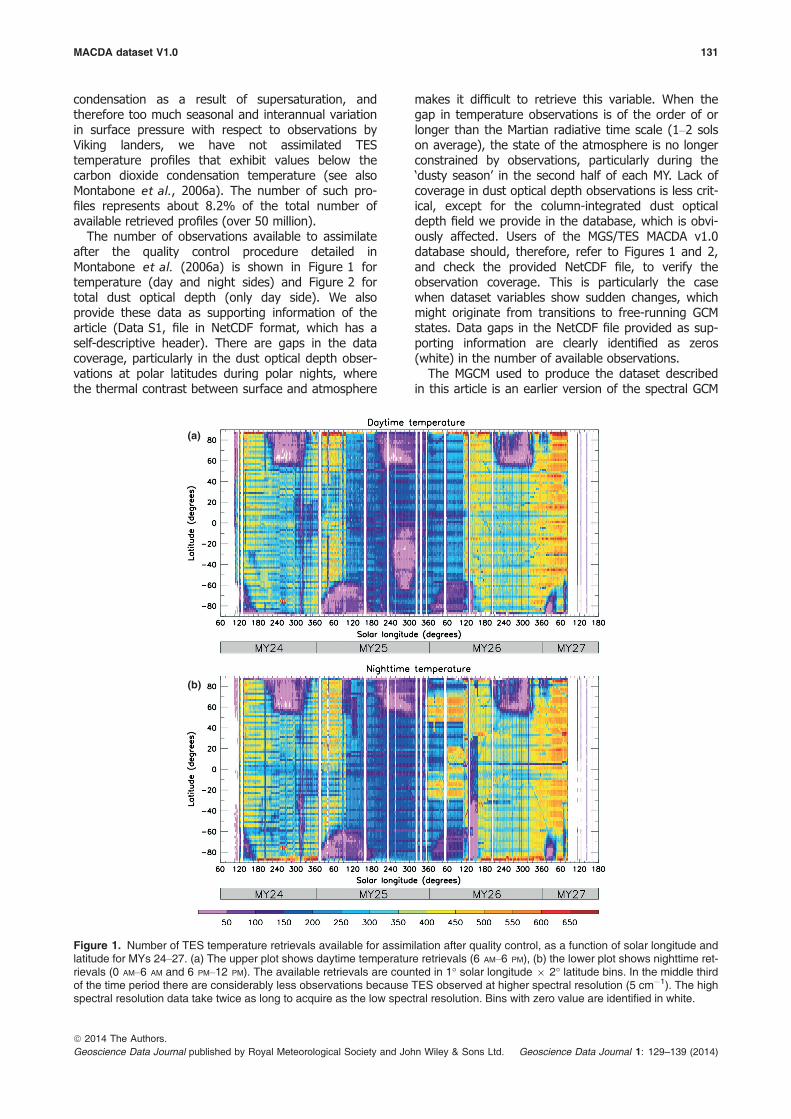
The number of observations available to assimilateafter the quality control procedure detailed inMontabone et al. (2006a) is shown in Figure 1 fortemperature (day and night sides) and Figure 2 fortotal dust optical depth (only day side). We alsoprovide these data as supporting information of thearticle (Data S1, file in NetCDF format, which has aself-descriptive header). There are gaps in the datacoverage, particularly in the dust optical depth obser-vations at polar latitudes during polar nights, wherethe thermal contrast between surface and atmosphere
makes it difficult to retrieve this variable. When thegap in temperature observations is of the order of orlonger than the Martian radiative time scale (1–2 solson average), the state of the atmosphere is no longerconstrained by observations, particularly during the‘dusty season’ in the second half of each MY. Lack ofcoverage in dust optical depth observations is less crit-ical, except for the column-integrated dust opticaldepth field we provide in the database, which is obvi-ously affected. Users of the MGS/TES MACDA v1.0database should, therefore, refer to Figures 1 and 2,and check the provided NetCDF file, to verify theobservation coverage. This is particularly the casewhen dataset variables show sudden changes, whichmight originate from transitions to free-running GCMstates. Data gaps in the NetCDF file provided as sup-porting information are clearly identified as zeros(white) in the number of available observations.
The MGCM used to produce the dataset describedin this article is an earlier version of the spectral GCM
(a)
(b)
Figure 1. Number of TES temperature retrievals available for assimilation after quality control, as a function of solar longitude andlatitude for MYs 24–27. (a) The upper plot shows daytime temperature retrievals (6 AM–6 PM), (b) the lower plot shows nighttime ret-rievals (0 AM–6 AM and 6 PM–12 PM). The available retrievals are counted in 1° solar longitude 9 2� latitude bins. In the middle thirdof the time period there are considerably less observations because TES observed at higher spectral resolution (5 cm�1). The highspectral resolution data take twice as long to acquire as the low spectral resolution. Bins with zero value are identified in white.
MACDA dataset V1.0 131
ª 2014 The Authors.Geoscience Data Journal published by Royal Meteorological Society and John Wiley & Sons Ltd. Geoscience Data Journal 1: 129–139 (2014)
in use at the University of Oxford and at The OpenUniversity in the UK. This GCM shares the Mars physi-cal parameterizations with the finite difference GCMdeveloped and constantly updated by the Laboratoirede M�et�eorologie Dynamique (LMD) in Paris, France(See Forget et al., 1999, for a description of theearlier version of the GCM).
Lewis and Read (1995) and Lewis et al. (1996,1997) first tested the implementation of the AC dataassimilation scheme in the MGCM. It has since beenadapted to assimilate TES retrievals using observa-tions made during the less-than-ideal MGS aerobrak-ing period between September 1997 and January1998 (Lewis et al., 2007). The reanalysis we presenthere is based on the assimilation of TES retrievalsusing observations made during the subsequent MGSscience mapping phase. Montabone et al. (2006a)describes both the assimilation procedure and thevalidation of the mapping phase reanalysis. One maindifference between the reanalysis dataset describedin this article and the one described in Montaboneet al. (2006a) is that TES retrievals have since beenrevised. The revision has been characterized by fourbasic improvements: (1) surface temperature hasbeen retrieved simultaneously with aerosol opticaldepth, (2) the model for the spectral dependence ofdust and ice absorption has been updated, (3) theabsorption from minor ‘hot bands’ of carbon dioxidehas been treated by reading from a map instead ofattempting their retrieval from each individual spec-trum and (4) water ice has been restricted to formabove the water condensation level instead of assum-ing a well-mixed profile. In relation to point (4),there is no impact of this change on the temperatureretrievals, but there is some potential impact (albeitsmall) on the dust retrievals, because dust and iceoptical depths are retrieved simultaneously.
2. Dataset Description
The MGS/TES reanalysis version-1.0 is available from141° solar longitude3 in MY 24 through 86° solarlongitude in MY 27.
The reanalysis dataset is divided into 63 data files,each one including data for 30 Martian sols. All 30-solperiods are consecutive, with no interruption. With theassistance of the BADC, the data files have been madeavailable in CF-NetCDF format,4 where the metadataused conform to the international ‘Climate andForecast’ (CF) standard. The advantage of producingstandard-compliant data files is that it promotes easyaccess using several types of software, data reuse,compatibility, and cross-disciplinarity. Only twovariables included in the database and specificallyrelated to the Martian calendar are not (yet) standardCF variable names. These are the ‘Martian year’ andthe ‘sol’ (or Martian mean solar day).
The name of each file includes the approximated(integer) solar longitude and MY of the first and lastavailable sols within the file. The format for the filenames is as follows:
mgs-tes-reanalysis mars MY�Ls� MY�Ls� v1�0:nc;
Figure 2. Number of TES dust optical depth retrievals available for assimilation after quality control, as a function of solar longi-tude and latitude for MYs 24–27. The available retrievals are counted in 1° solar longitude 9 2° latitude bins. Dust optical depthretrievals are almost entirely available only during daytime. The number of dust optical depth retrievals is considerably less in themiddle third of the time period because TES observed at higher spectral resolution. Bins with zero value are identified in white.
3The solar longitude (Ls) is the angle described by the lineconnecting the Sun to the position of Mars in its orbit, rela-tive to the planet’s position at northern hemisphere springequinox (Ls = 0°). Ls = 90° thus corresponds to summer sol-stice, Ls = 180° marks the autumn equinox and Ls = 270°the winter solstice (all relative to the northern hemisphere).4See http://cfconventions.org for details on the ‘Climate andForecast’ (CF) standard and http://www.unidata.ucar.edu/software/netcdf/index.html for details on the NetCDF datafile format.
132 L. Montabone et al.
ª 2014 The Authors.Geoscience Data Journal published by Royal Meteorological Society and John Wiley & Sons Ltd.Geoscience Data Journal 1: 129–139 (2014)

where the asterisks correspond to the values of MYand solar longitude of the first and last sols. Each Net-CDF file contains the same header with detailed infor-mation about the variable dimensions, a shortdescription of all the variables that are present in thefile (including units and CF standard names), and gen-eral information about the dataset (i.e. global attri-butes of the NetCDF file). The 63 data files, eachabout 295 MB in size, have been added to the BADCarchive, where they are freely available for downloadfollowing the procedure explained in Section 5. Thetotal size of the uncompressed dataset is about18.6 GB.
We briefly describe here the variables included inthe dataset, and provide information that we consideruseful for potential users.
2.1. Dimensions
Each NetCDF file includes variables which can dependon up to three spatial dimensions and one temporaldimension (see Table 1). Dimensions are integers withno units.
There are 6 one-dimensional variables (longitude,latitude, model sigma level, sol, solar longitude andMY), 4 three-dimensional variables (amount of depos-ited carbon dioxide ice, surface pressure, surfacetemperature, and total dust optical depth), and 3 four-dimensional variables (atmospheric temperature, zonaland meridional wind components). This gives a totalof 13 variables.
2.2. One-dimensional spatial variables
The three spatial variables are reported in Table 2.Longitude and latitude values are provided with 5°
spacing. All variables that depend on the longitudeand latitude dimensions are, therefore, provided on a5° 9 5° horizontal grid. Given Mars’ mean radius
(3389 km), this corresponds to 296 km resolution atthe Equator.
The vertical grid is determined by the model sigmalevels, which are non-dimensional terrain-following lev-els, with values between 1 at the ground and 0 at infi-nite distance from the ground. The sigma value at aparticular model level is defined as the ratio betweenthe atmospheric pressure at that level and the surfacepressure, for each horizontal grid point. The atmo-spheric pressure at each model level and grid pointcan, therefore, be calculated by using the formulap(i, j, k) = psurf(i, j)�lev(k), where i, j, k are indices oflongitude, latitude, and level, p is the atmosphericpressure, psurf is the surface pressure value and lev isthe sigma value. One can also associate a pseudo-alti-tude above the local surface to each model level,using the formula zp = �H ln(lev(k)), where zp is thepseudo-altitude value, and H is the Martian scaleheight (about 10 km).
The vertical levels are not evenly spaced. They aredenser closer to the ground and more widely spacedwhen they are closer to the top of the model. The first(lowermost) level has a pseudo-altitude of about 5 m;the last (uppermost) level has a pseudo-altitude ofabout 98 km. On average, they correspond to pres-sures ranging between 610 Pa and 0.034 Pa. The lastthree levels are also used as ‘sponge levels’ in theMGCM, to inhibit the reflection of vertically propagat-ing waves (see also Forget et al., 1999).
The pseudo-altitude value is only a rough approxi-mation to the real altitude. To calculate the precisealtitude of a particular model level at a required gridpoint and time, the user needs to integrate the hydro-static equation using the appropriate atmospherictemperature profile for that grid point and time.
2.3. One-dimensional temporal variables
The three temporal variables are reported in Table 3.Our main continuous time variable in the dataset is
the Martian mean solar day (sol), which does not resetto zero at the beginning of a new year. The solar lon-gitude value, instead, resets to zero each time Marscrosses the position of the northern hemisphere springequinox, thus defining the beginning of a new year.
The integer part of each time value defines the sol,and the decimal part defines the fraction of the sol,from which one can calculate the corresponding MarsUniversal Time (MUT), i.e. the local time at the PrimeMeridian. The time origin in the dataset (sol = 0.0)
Table 1. Dataset dimensions.
Dimensionname
Numberof values Description
lon 72 Longitudelat 36 Latitudelev 25 Leveltime 360 Time
Table 2. One-dimensional spatial variables.
Variablename Dimension Description
CF standardname Units Type
lon lon Longitude Longitude degree_east Floatlat lat Latitude Latitude degree_north Floatlev lev Model sigma
levelAtmosphere_sigma_coordinate
N/A Float
MACDA dataset V1.0 133
ª 2014 The Authors.Geoscience Data Journal published by Royal Meteorological Society and John Wiley & Sons Ltd. Geoscience Data Journal 1: 129–139 (2014)
corresponds to midnight MUT at northern spring equi-nox (Ls = 0°) in MY 24, which is the first year of avail-able MGS/TES observations during the mappingphase. It is important to remark here that it is onlyour convention to start the GCM with assimilation atmidnight MUT at Ls = 0° in MY 24. The astronomicalMY 24 northern spring equinox did not precisely occurwhen it was midnight MUT. There is, therefore, a con-stant bias of about 6 h between the model solar longi-tudes reported in the dataset and the astronomicalsolar longitudes.5 The bias is present to ensure that allobservations are assimilated in the model using boththeir precise local time and solar declination, whichare important parameters to calculate heating rates inthe GCM, and have the correct relative time differ-ence. The only way to remove the small offset in Ls,while retaining these much more important features ofthe assimilation, would be to introduce a more com-plex and complete ephemeris to the GCM. If onerequires more precise values of Ls than those reportedin the dataset, a good approximation consists in sub-tracting a constant offset of 0.12°. Sols are dividedinto 24 Martian hours, and output fields are providedevery 2 h (a period deemed to be useful for capturinglarge-scale waves and tides in Martian climate datawithout generating excessively large files, Lewis et al.,1999), beginning at 2 AM MUT on sol 301 (first avail-able sol in the dataset, corresponding to Ls = 141.5°in MY 24) and ending at midnight MUT on sol 2190(last available sol in the dataset, corresponding toLs = 86.3° in MY 27. Note that TES retrievals practi-cally end after Ls = 82.5° in MY 27).6 Because the vari-able ‘Sol’ is not yet included in the standard CFvariable list, there is no corresponding unit related toa standard Martian calendar. In the dataset, we usethe standard time unit for the Earth calendar referredto a reference date of 0000-00-0 00:00:00, mainly forease of use of software that automatically recognizestime variable units. The values of the time variable,though, are intended as ‘sols since 0.0’ where 0.0 isthe time reference in the dataset as mentioned above.
The scientific community primarily uses a combina-tion of MY and solar longitude when referring to the
Martian calendar. This combination, though, is not sat-isfactory in a reanalysis dataset, because of therequirement to keep track of the fraction of a sol atthe beginning of each new year, when the solar longi-tude resets to zero at sol 668.6. There is, therefore,the need to standardize a Martian calendar based onMYs, months and sols, which can be used for precisetemporal determination in reanalyses datasets. Onepossible choice could be to divide the Mars orbit into12 or 24 months of approximately 30° or 15° solarlongitude each, and have leap years to accommodatethe fraction of the sol left at the end of each year. Wenote that, because of the eccentricity of Mars’ orbit,7
the relationship between solar longitude and sol num-ber is not linear throughout a year, i.e. 1° of solar lon-gitude corresponds to 2.04 sols at spring equinox,2.15 sols at summer solstice, 1.66 sols at autumnequinox, and 1.58 sols at winter solstice. The numberof sols in each month of such a Martian calendarwould, therefore, need to change accordingly. Lewiset al. (1999) have adopted the convention to dividethe MY into 12 months (‘seasons’) of 30° solar longi-tude, but they have approximated the number of solsin a year to 669. This convention simplifies the Martiancalendar, but is not ideal to keep track of thefractions of sol at the end of each year in multiannualreanalyses.
At the time of writing, the CF community is engagedin discussions to standardize the Martian calendar andintroduce the variable ‘Sol’ in the CF standard variablelist. The ‘Martian year’ is not a standard CF variableeither, and could be simply calculated from the timeand solar longitude variables. We decided to explicitlyinclude it for ease of use of the dataset. Futurereleases of the MACDA reanalysis may be able to befully CF-compliant in relation to the Martian calendar.
2.4. Three-dimensional variables
The four variables that provide time-evolving surfacedata are described in Table 4. Note that variabledimensions in a NetCDF file are usually reported inreverse order, e.g. when interrogating the file with thecommand ncdump. The proper order of the dimen-sions in every dataset array is the one indicated inTables 4 and 5.
The ‘surface carbon dioxide ice’ variable refers tothe mass per square metre of carbon dioxide depos-
Table 3. One-dimensional temporal variables.
Variablename Dimension Description
CF standardname Units Type
Time Time Sol Time Sols since 0.0 DoubleLs Time Solar longitude solar_longitude degrees FloatMY Time Martian year N/A N/A Short
5See, e.g. the NASA-GISS ‘Mars24 Applet’ athttp://www.giss.nasa.gov/tools/mars24/.6The conversion between MY/solar longitude and Earth date(and vice versa) can be operated using the tool available atthe Mars Climate Database websitehttp://www-mars.lmd.jussieu.fr/mars/time/mars_date_to_earth_date.html.
7The eccentricity of Mars is e = 0.0935, about 5.6 times thatof the Earth (e = 0.0167).
134 L. Montabone et al.
ª 2014 The Authors.Geoscience Data Journal published by Royal Meteorological Society and John Wiley & Sons Ltd.Geoscience Data Journal 1: 129–139 (2014)
ited as ice on the ground at polar latitudes, afterhaving condensed from the atmosphere in the winterseasons.
Surface pressure and surface temperature reflectthe seasonal condensation and sublimation of carbondioxide in the Martian atmosphere. In particular, inthe presence of carbon dioxide ice on the ground, thesurface temperature assumes the value equal to thecarbon dioxide condensation temperature at the corre-sponding surface pressure. The surface pressure ateach grid point shows a seasonal behaviour compati-ble with the cycle of condensation and sublimation ofthe carbon dioxide, which is the main component(about 95%) of the Martian atmosphere.
The ‘total dust optical depth’ variable is related tohow much radiation (at average visible wavelengths ofabout 670 nm) would be removed from a beam duringits path through the entire atmosphere by absorptionand scattering due to airborne mineral dust. The totaldust optical depth at each horizontal grid point in thedataset can be referred to a specific pressure level(e.g. 610 Pa) by dividing its value by the surfacepressure and multiplying by the value of the referencepressure (assuming that dust is well mixed and thedust properties are consistent throughout). Thisinterpolation/extrapolation eliminates the effects oftopographical inhomogeneity.
It should be noted that surface temperature, surfacepressure, surface carbon dioxide amount, as well asthe horizontal wind components, although not directlymodified by observations, are indirectly adjusted bythe data assimilation procedure, which dynamicallymodifies these fields according to the analysis of atmo-spheric temperature and the update of the model col-umn-integrated dust optical depth. Because we havenot used the dust lifting, transport, and sedimentationmodel available in the MGCM to carry out the completeassimilation of dust observations, the ‘total dust optical
depth’ variable should not be considered as a fullyanalysed variable. We include it in the dataset to spec-ify the dust distribution which has been used in theMGCM. We provide the total dust optical depth vari-able also at those times and locations where there isno information from TES total dust optical depthobservations (see Figure 2). These values correspondto the observed values retained after the last availableassimilation update.
2.5. Four-dimensional variables
The three variables that provide time-evolving atmo-spheric data are described in Table 5.
We remind users that atmospheric temperatures aredirectly modified by TES observations only belowabout 40 km altitude. Atmospheric temperatures inthe boundary layer (where TES vertical resolution doesnot allow accurate retrievals) and above about 40 kmaltitude are indirectly modified by dynamical adjust-ment in the MGCM during the analysis procedure.
The zonal wind component is positive for eastwardwinds (westerlies), and the meridional wind compo-nent is positive for northward winds (southerlies).
3. Dataset Visualization
We have developed a web visualization tool (the ‘MAC-DA Plotter’), coded in Python, that allows explorationof the variables included in the MACDA dataset.Figure 3 shows the graphical user interface which isdisplayed when the web interface (version 1.0) isopened, as explained in Section 5.
This version of the tool does not perform interpola-tion in time or space. The variables included in thedataset can only be displayed as maps at the timesand sigma levels provided, which coincide with thosedescribed in Section 3. When a specific value of solar
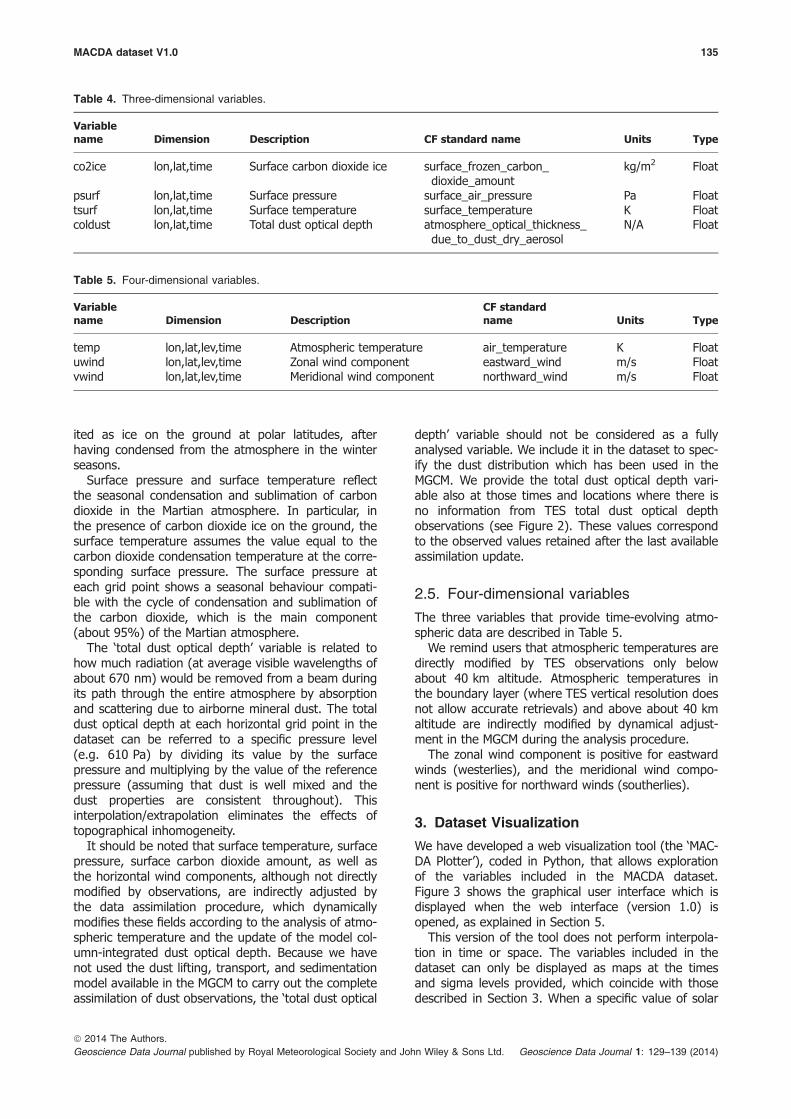
Table 4. Three-dimensional variables.
Variablename Dimension Description CF standard name Units Type
co2ice lon,lat,time Surface carbon dioxide ice surface_frozen_carbon_dioxide_amount
kg/m2 Float
psurf lon,lat,time Surface pressure surface_air_pressure Pa Floattsurf lon,lat,time Surface temperature surface_temperature K Floatcoldust lon,lat,time Total dust optical depth atmosphere_optical_thickness_
due_to_dust_dry_aerosolN/A Float
Table 5. Four-dimensional variables.
Variablename Dimension Description
CF standardname Units Type
temp lon,lat,lev,time Atmospheric temperature air_temperature K Floatuwind lon,lat,lev,time Zonal wind component eastward_wind m/s Floatvwind lon,lat,lev,time Meridional wind component northward_wind m/s Float
MACDA dataset V1.0 135
ª 2014 The Authors.Geoscience Data Journal published by Royal Meteorological Society and John Wiley & Sons Ltd. Geoscience Data Journal 1: 129–139 (2014)
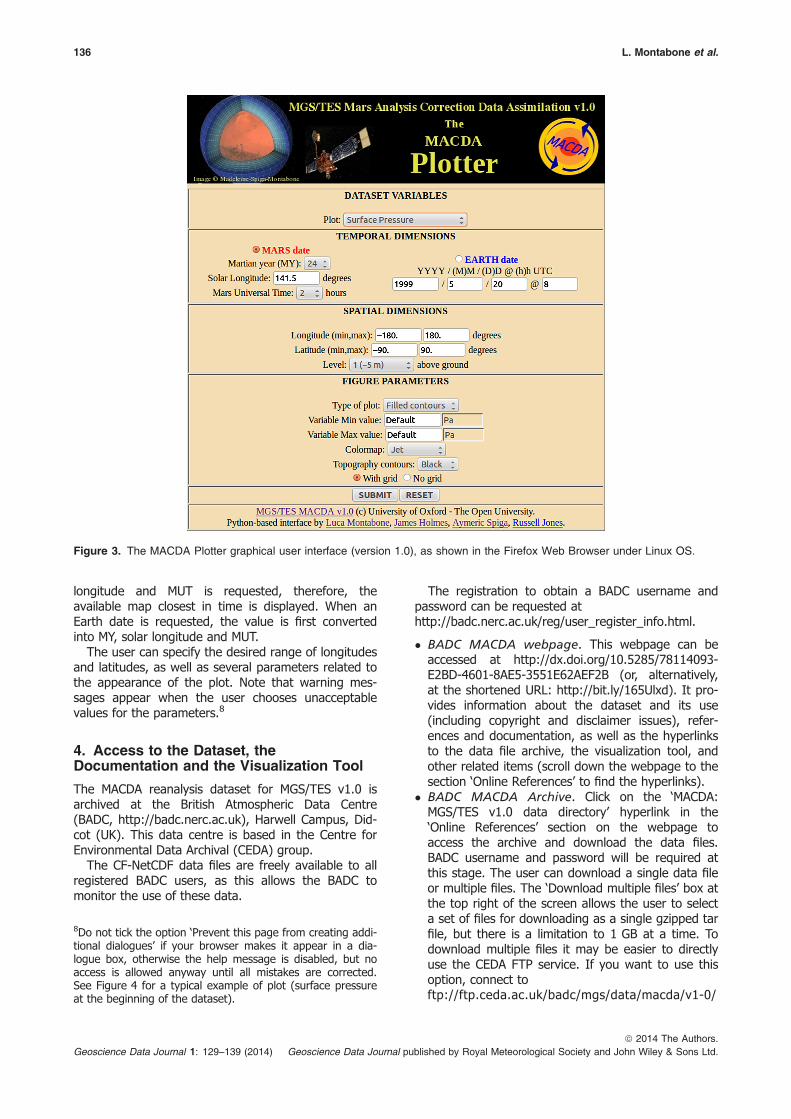
longitude and MUT is requested, therefore, theavailable map closest in time is displayed. When anEarth date is requested, the value is first convertedinto MY, solar longitude and MUT.
The user can specify the desired range of longitudesand latitudes, as well as several parameters related tothe appearance of the plot. Note that warning mes-sages appear when the user chooses unacceptablevalues for the parameters.8
4. Access to the Dataset, theDocumentation and the Visualization Tool
The MACDA reanalysis dataset for MGS/TES v1.0 isarchived at the British Atmospheric Data Centre(BADC, http://badc.nerc.ac.uk), Harwell Campus, Did-cot (UK). This data centre is based in the Centre forEnvironmental Data Archival (CEDA) group.
The CF-NetCDF data files are freely available to allregistered BADC users, as this allows the BADC tomonitor the use of these data.
The registration to obtain a BADC username andpassword can be requested athttp://badc.nerc.ac.uk/reg/user_register_info.html.
� BADC MACDA webpage. This webpage can beaccessed at http://dx.doi.org/10.5285/78114093-E2BD-4601-8AE5-3551E62AEF2B (or, alternatively,at the shortened URL: http://bit.ly/165Ulxd). It pro-vides information about the dataset and its use(including copyright and disclaimer issues), refer-ences and documentation, as well as the hyperlinksto the data file archive, the visualization tool, andother related items (scroll down the webpage to thesection ‘Online References’ to find the hyperlinks).
� BADC MACDA Archive. Click on the ‘MACDA:MGS/TES v1.0 data directory’ hyperlink in the‘Online References’ section on the webpage toaccess the archive and download the data files.BADC username and password will be required atthis stage. The user can download a single data fileor multiple files. The ‘Download multiple files’ box atthe top right of the screen allows the user to selecta set of files for downloading as a single gzipped tarfile, but there is a limitation to 1 GB at a time. Todownload multiple files it may be easier to directlyuse the CEDA FTP service. If you want to use thisoption, connect toftp://ftp.ceda.ac.uk/badc/mgs/data/macda/v1-0/
Figure 3. The MACDA Plotter graphical user interface (version 1.0), as shown in the Firefox Web Browser under Linux OS.
8Do not tick the option ‘Prevent this page from creating addi-tional dialogues’ if your browser makes it appear in a dia-logue box, otherwise the help message is disabled, but noaccess is allowed anyway until all mistakes are corrected.See Figure 4 for a typical example of plot (surface pressureat the beginning of the dataset).
136 L. Montabone et al.
ª 2014 The Authors.Geoscience Data Journal published by Royal Meteorological Society and John Wiley & Sons Ltd.Geoscience Data Journal 1: 129–139 (2014)

using your BADC username and password. Thereis no size limitation via the ftp server.
� MACDA Visualisation tool. Click on the ‘DataVisualisation’ hyperlink in the ‘Online References’section to access the web visualization tool, whichdoes not require BADC username and password.The MACDA Plotter can also be directly accessed athttp://macdap.physics.ox.ac.uk.
For any data access problems, please contact theBADC helpdesk directly (http://badc.nerc.ac.uk/help/contact.html) or send an email to the correspondingauthor of this paper.
Scientific use of the data included in the MACDAdataset is freely allowed provided that the origin of thedata is appropriately acknowledged in any publica-tions. The correct reference to the dataset is providedat the beginning of this article, in the Section ‘Dataset’,or at the end in the Section ‘References’ (Montaboneet al., 2011). The authors provide no warrantiesregarding the reliability, validity or accuracy of thedata, and bear no responsibility for any use made ofsuch data.
5. Future versions
Updated versions of the dataset will become availablein future. People interested in the most recent versionare encouraged to contact the corresponding authorof this article to ascertain the status of the work inprogress.
Future improvements of the MACDA reanalysis willinclude the following:
1. Update of the MGCM to the latest available version(Forget et al., 2011).
2. Full assimilation of dust observations using the lift-ing, transport and sedimentation model for dustparticles available in the MGCM.
3. Parameterization of the carbon dioxide condensa-tion under supersaturation conditions, to allow theassimilation of supersaturated temperature profiles.
4. Extension of the reanalysis period to cover observa-tions from the Mars Reconnaissance Orbiter/MarsClimate Sounder radiometer (2006 to date, i.e. fromlate northern summer of MY 28 to beyond MY 31).
5. Inclusion of other available observations, particu-larly related to dust opacity.
6. Possible release of higher order diagnostic variables,such as vorticity and stream function.
7. Release of a ‘control simulation’, i.e. a GCM simula-tion that does not assimilate temperature observa-tions. Such simulation already exists for the MACDAv1.0, but it is not currently made publicly available.Interested people can nevertheless contact the cor-responding author to request access to it.
Acknowledgements
MGS/TES retrievals of thermal profiles and infraredtotal dust optical depths have been provided byMichael D. Smith (NASA Goddard Space Flight Center,Greenbelt, MD, USA) to the University of Oxford in2005. The MACDA reanalysis has been processed bythe University of Oxford, Department of Physics, andThe Open University, Department of Physical Sciences,
Figure 4. The MACDA Plotter graphical user interface: example of a plot (surface pressure).
MACDA dataset V1.0 137
ª 2014 The Authors.Geoscience Data Journal published by Royal Meteorological Society and John Wiley & Sons Ltd. Geoscience Data Journal 1: 129–139 (2014)
in the UK. The reanalysis data files were provided tothe British Atmospheric Data Centre in August 2011. L.Montabone wishes to thank Russell Jones at the Uni-versity of Oxford for his invaluable help in setting upthe MACDA web plotter tool, as well as Giacomo Corr-enti for useful tips in html and python programming.The authors are extremely grateful to J.-B. Madeleineand to another anonymous reviewer for their very use-ful comments, which helped to improve the paper. L.Montabone and S. R. Lewis wish also to acknowledgesupport from the UK Science and Technology FacilitiesCouncil and the UK Space Agency during the course ofthis work (Grant Refs. ST/I001948/1, ST/K00106X/1,ST/J001597/1, ST/I003096/1). Last but not the least;special thanks are due to BADC for supporting theMACDA v1.0 dataset.
References
Christensen PR, Bandfield JL, Hamilton VE, Ruff SW, Kief-fer HH, Titus TN, Malin MC, Morris RV, Lane MD, ClarkRL, Jakosky BM, Mellon MT, Pearl JC, Conrath BJ, SmithMD, Clancy RT, Kuzmin RO, Roush T, Mehall GL, GorelickN, Bender K, Murray K, Dason S, Greene E, SilvermanS, Greenfield M. 2001. Mars Global Surveyor ThermalEmission Spectrometer experiment: investigationdescription and surface science results. Journal of Geo-physical Research 106(E10): 23823–23871.
Clancy RT, Lee SW, Gladstone GR, McMillan WW, RouschT. 1995. A new model for Mars atmospheric dust basedupon analysis of ultraviolet through infrared observa-tions from Mariner 9, Viking, and PHOBOS. Journal ofGeophysical Research 100(E3): 5251–5263, doi:10.1029/94JE01885.
Clancy RT, Sandor BJ, Wolff MJ, Christensen PR, SmithMD, Pearl JC, Conrath BJ, Wilson RJ. 2000. An intercom-parison of ground-based millimeter, MGS TES, and Vik-ing atmospheric temperature measurements: seasonaland interannual variability of temperatures and dustloading in the global Mars atmosphere. Journal of Geo-physical Research 105(9553–9571): 2000.
Clancy RT, Wolff MJ, Christensen PR. 2003. Mars aerosolstudies with the MGS TES emission phase functionobservations: optical depths, particle sizes, and icecloud types versus latitude and solar longitude. Journalof Geophysical Research 108: E9, doi:10.1029/2003JE002058.
Conrath BJ. 1975. Thermal structure of the Martian atmo-sphere during the dissipation of the dust storm of 1971.Icarus 24: 36–46, doi:10.1016/0019-1035(75)90156-6.
Forget F, Hourdin F, Fournier R, Hourdin C, Talagrand O,Collins M, Lewis SR, Read PL, Hout J-P. 1999. Improvedgeneral circulation models of the Martian atmospherefrom the surface to above 80 km. Journal of Geophysi-cal Research 104: 24155–24176.
Forget F, Madeleine J-B, Millour E, Colaitis A, Spiga A,Montabone L, Chaufray JY, Lefevre F, Montmessin F,M€a€att€anen A, Gonzales-Galindo F, Lopez-Valverde MA.2011. Understanding Mars meteorology using a ‘newgeneration’ Mars Global Climate Model, EPSC-DPS JointMeeting, Nantes, France, EPSC-DPS2011-1568.
Greybush SJ, Wilson RJ, Hoffman RN, Hoffman MJ, Miyo-shi T, Ide K, McConnochie T, Kalnay E. 2012. EnsembleKalman filter data assimilation of Thermal EmissionSpectrometer (TES) Temperature Retrievals into a MarsGCM. Journal of Geophysical Research 117: E11008,doi:10.1029/2012JE004097.
Lee C, Lawson G, Richardson MI, Anderson JL, Collins N,Hoar T, Mischna MA. 2013. Ensemble Data Assimilationof radiance observations from the Thermal EmissionSpectrometer with MarsWRF and DART. Journal ofGeophysical Research 116: E11011, doi:10.1029/2011JE003815.
Lemmon MT, Wolff MJ, Smith MD, Clancy RT, Banfield D,Landis GA, Ghosh A, Smith PH, Spanovich N, WhitneyB, Whelley P, Greeley R, Thompson S, Bell JF III, Squy-res SW. 2004. Atmospheric imaging results from theMars exploration rovers: spirit and opportunity. Science306: 1753–1756.
Lewis SR, Barker PR. 2005. Atmospheric tides in a Marsgeneral circulation model with data assimilation.Advances in Space Research 36(11): 2162–2168.
Lewis SR, Read PL. 1995. An operational data assimilationscheme for the Martian atmosphere. Advances inSpace Research 16(6): 9–13.
Lewis SR, Collins M, Read PL. 1996. Martian atmosphericdata assimilation with a simplified general circulationmodel: orbiter and lander networks. Planetary andSpace Science 44: 1395–1409.
Lewis SR, Collins M, Read PL. 1997. Data assimilation witha Martian atmospheric GCM: an example using thermaldata. Advances in Space Research 19(8): 1267–1270.
Lewis SR, Collins M, Read PL, Forget F, Hourdin F, Four-nier R, Hourdin C, Talagrand O, Huot J-P. 1999. A cli-mate database for Mars. Journal of GeophysicalResearch 104(E10): 24177–24194.
Lewis SR, Read PL, Conrath BJ, Pearl JC, Smith MD.2007. Assimilation of Thermal Emission Spectrometeratmospheric data during the Mars Global Surveyoraerobraking period. Icarus 192: 327–347.
Lorenc AC, Bell RS, Macpherson B. 1991. The Meteoro-logical Office analysis correction data assimilationscheme. Quarterly Journal of the Royal Meteorologi-cal Society 117: 59–89.
Mart�ınez-Alvarado O, Montabone L, Lewis SR, Moroz IM,Read PL. 2009. Transient teleconnection event at theonset of a planet-encircling dust storm on Mars. An-nales Geophysicae 27(2009): 3663–3676.
Montabone L, Lewis SR, Read PL, 2005. Interannual vari-ability of Martian dust storms in assimilation of severalyears of Mars Global Surveyor observations. Advancesin Space Research 36, 2146–2155.
Montabone L, Lewis SR, Read PL, Hinson D. 2006a. Vali-dation of Martian meteorological data assimilation forMGS/TES using radio occultation measurements. Icarus185(113–132): 2006.
Montabone L, Lewis SR, Read PL, Withers PL. 2006b.Reconstructing the weather on Mars at the time of theMERs and Beagle2 landings. Geophysical Research Let-ters 33: L19202, doi:10.1029/2006GL026565.
Montabone L, Lewis SR, Read PL, University of Oxfordand The Open University. 2011. Mars Analysis Correc-tion Data Assimilation (MACDA): MGS/TES V 1.0. NCAS
138 L. Montabone et al.
ª 2014 The Authors.Geoscience Data Journal published by Royal Meteorological Society and John Wiley & Sons Ltd.Geoscience Data Journal 1: 129–139 (2014)
British Atmospheric Data Centre: Didcot, UK, doi:10.5285/78114093-E2BD-4601-8AE5-3551E62AEF2B.
Rogberg P, Read PL, Lewis SR, Montabone L. 2010.Assessing atmospheric predictability on Mars usingnumerical weather prediction and data assimilation.Quarterly Journal Royal Meteorological Society 136:1614–1635.
Smith MD. 2004. Interannual variability in TES atmo-spheric observations of Mars during 1999-2003. Icarus167: 148–165.
Smith MD, Pearl JC, Conrath BJ, Christensen PR. 2001.Thermal Emission Spectrometer results: Mars atmo-spheric thermal structure and aerosol distribution.Journal of Geophysical Research 106(E10): 23929–23945.
Wilson RJ, Lewis SR, Montabone L, Smith MD. 2008.Influence of water ice clouds on Martian tropical atmo-spheric temperatures. Geophysical Research Letters35: L07202.
Wolff MJ, Smith MD, Clancy RT, Spanovich N, WhitneyBA, Lemmon MT, Bandfield JL, Banfield D, Ghosh A,Landis G, Christensen PR, Bell JF, Squyres SW, 2006.Constraints on dust aerosols from the Mars ExplorationRovers using MGS overflights and Mini-TES. Journal ofGeophysical Research 111: E12S17, doi:10.1029/2006JE002786.
Supporting information
The following supporting information is available aspart of the online article:
Data S1. Number of TES retrievals available forassimilation after quality control, as a function of solarlongitude and latitude for MYs 24–27. The availableretrievals are counted in 1� solar longitude 9 2� lati-tude bins. The file is in NetCDF format, with a self-descriptive header.
MACDA dataset V1.0 139
ª 2014 The Authors.Geoscience Data Journal published by Royal Meteorological Society and John Wiley & Sons Ltd. Geoscience Data Journal 1: 129–139 (2014)