the measurement of customer service quality as a
TRANSCRIPT

TECHNIKON WITWATERSRAND
THE MEASUREMENT OF CUSTOMER SERVICE QUALITY AS A COMPETITIVE STRATEGY IN AN INDUSTRIAL ENVIRONMENT
being a Dissertation submitted in partial fulfillment of the requirement for the degree Magister Technologiae in Business
Administration at the Technikon Witwatersrand
by
Melvin Hickers
February 2004
Supervised by Prof RWE van der Wal

To Chantal and Mimi
ii

Vv/
nhrersity ofJo Buntinij Roidigimpus,
: . sTuDy COLLECTION TeL (o11):93 364,3o798
• :NON RENEWABLE ..EXPIRY DATE
UNIVERSITY
JOHANNESBURG
LIBRARY BUNTING ROAD CAMPUS
Please setups thislteinanlb•gare the last date Stesteped•RO 12EIVASVALS Aup.vglp.: Fpus.r. :• ..•■
UJ LIC LIBRARY ITEM: 124034
il

DECLARATION
I , Melvin Hickers, declare that this dissertation is my own and original work. All sources have been accurately reported and acknowledged. I am indebted, to the contribution of knowledge, made by Carol Bond. This document, as it exists, has not in its originality, entirety or part been submitted at any institution to obtain an academic qualification.
Melvin Hickers 04 February 2004
iii

ACKNOWLEDGEMENTS
This dissertation has been a journey of discovery. In the beginning it was about learning later evolving into an experience. I was encouraged by this study to become vocal, and cognitive about the subject matter, this became most fascinating and insightful for me academically and in practice. I am grateful for the opportunity.
Appreciation to my family and friends for the support.
A heartfelt thank you to my supervisor Professor Ruurd van der Wal.
To my sister Carmen Hickers who knew what I was trying to say all along — thank you.
To a role model who deserves great admiration and respect, Benny Jiyane — thank you for always believing.
To my dearest friend Thabo Skosana — thank you.
To my study group, David Bell, Robert Disemelo and Edwin Mashinini thank you for the "meetings of the mind" that we often had.
To the customers, colleagues and the company that supported the initiative — thank you always.
iv

ABSTRACT
This study deals with the measurement of customer service quality in an industrial environment. The concept was to measure service quality and then develop a competitive strategy based on this. The mechanism used is the SERVQUAL model. Subsequently reengineering aspects of customer service based on the findings is proposed as a competitive advantage.
The study is diagnostic in nature offering insights on the application of a well researched service quality model in an industrial environment.
The study was undertaken due to the necessity and position that the research organisation found itself in. Critical factors, that shaped the business environment contributed to the choice of the research.
These being :
Change
Customers
Competitors
Michael E. Porter shows, in his book Competitive Advantag, creating and sustaining superior performance, that two competitive advantages can be accessed by most organisations, these being cost leadership and differentiation.
Adding to this three generic strategies enable competitive advantage(s) through :
Cost leadership (low cost production)
Differentiation
Focus.
Based on the above the first and the last strategy, cost leadership and focus respectively, was not feasible for the organisation. The first strategy failed the sustainability hurdle while the last strategy was not entirely applicable.
The answer emanated in differentiating from competitors. It was decided to differentiate on customer service.

Research was conducted through questionnaires derived from the SERVQUAL model. The original customer questionnaire was modified to suit the research context, an industrial environment. Primary data was gathered via face to face interviews from a sample of 70 customers and 30 employees inclusive of management. Subsequently data was analysed by the SPSS statistical package. Findings are discussed, supported by tables and figures.
The conclusions of this study shows that :
o The SERVQUAL model is valid and reliable in an industrial environment.
o The customer service as it exists is deficient substantiated by negative SERVQUAL gaps. A reengineering intervention can be applied to specific areas based on the findings. The competitive advantage aspect of reengineering customer service can be reevaluated in future using the present gaps as benchmarks.
vi

Table of Contents
Chapter 1 ackground and Scope of Research
1.1. Title 1
1.2. Background 1
1.3. Aim 9
1.4. Objective 9
1.5. Defining concepts 10
1.5.1. Reengineering 10
1.5.2. Customer service 10
1.5.3. Competitive strategy 10
1.5.4. Industrial Environment 10
1.6. Limitations 10
1.7. Value of the research 11
1.8. Research design_ 11
1.9. Sampling technique 11
1.10 Outline of research report 11
1.10.1. Chapter 1. Introduction 11
1.10.2. Chapter 2. Literature review 12
1.10.3. Chapter 3 .. Research methodology 12
1.10.4. Chapter 4. Data analysis and findings 12
1.10.5. Chapter 5. Conclusions and recommendations 13
vii

Chapter 2 Literature Review
2.1.
2.2.
Introduction
2.1.1. Customer service as a strategy
2.1.2. What is the importance of customer service ?
A case study of customer service
14
15
17
18
2.2.1. Taco Bell vs McDonalds 18
2.2.2. Xerox '19
2.2.3. Coca-Cola 21
2.3. What are the important links to customer service ? 21
2.3.1. Customer service and reengineering 21
2.3.2. Customer service and customer satisfaction. 25
/ 2.34. Customer service and competitive advantage. 26
2.4. Which customers are we talking about ? 27
2.5. Customer service quality 28
2.5.1. What is service quality ? 28
2.5.2. The measurement of customer service quality. 29
2.5.3. What happens when you don't measure service quality ? 30
2.6. Perspectives of customer service metrics 31
2.6.1. Horrowitz's perspective 31
2.6.2. Berry, Parasuraman & Zeithaml's perspective 33
2.6.3. The Services Marketing triangle perspective 36
2.6.4. The Kaizen perspective 38 (Kai : change + Zen : good = improvement)
viii
2.7.
2.8.
Service quality measurement
2.7.1. The Research instrument used : SERVQUAL
Profile on the SERVQUAL pioneer • Parsu.
39
39
Parasuraman 39
2.9. The SERVQUAL Model 40
2.9.1. The development of SERVQUAL 40
2.9.2. Why was SERVQUAL used ? 42
2.9.3. Where has SERVQUAL been used ? 42
2.9.3.1. SERVQUAL in a retail setting 42
2.9.3.2. SERVQUAL in an international recreational service 42
2.9.3.3. SERVQUAL in retail banking 43
2.9.3.4. SERVQUAL in the steel industry 43
2.9.4. What does SERVQUAL identify ? 43
2.9.4.1. Customer expectations (Gap 1) 43
2.9.4.2. Service quality standards (Gap 2) 44
2.9.4.3. Service performance (Gap 3) 44
2.9.4.4. What gets promised vs what is delivered (Gap4) 45
2.9.4.5. The difference between expected and perceived service quality (Gap 5) 45
2.9.5. What does SERVQUAL measure ? 47
2.9.6. How does SERVQUAL measure ? 48
2.10. Developments in SERVQUAL 50
ix

2.10.1. Berry, Parasuraman & Zeithaml (1988) 50
2.10.2. Berry, Parasuraman & Zeithaml (1990) 50
2.11. Critiques of SERVQUAL 50
2.11.1. Conceptual and operational issues regarding SERVQUAL. 51
2.11.2. Practical and diagnostic value of SERVQUAL 51
2.11.3. Operational and theoretical flaws of SERVQUAL 52
2.11.4. Reliability and validity of SERVQUAL measures 53
2.11.5. The dimensions of service quality 54
2.11.6. The efficiency of the SERVQUAL instrument as a measurement of service quality 54
2.12. What other models of service quality exist ? 55
2.13. Synopsis of literature reviewed on service quality 67 models
2.13.1. Synopsis of literature reviewed on critiques of the SERVQUAL model 67
2.13.2. Synopsis of literature reviewed on critiques of other service quality models 68
Chapter 3 Research Methodology
3.1. Introduction 70
3.1.1. Literature review 70
3.1.2. Exploratory research 70
3.2. Sample frame & methodology 71
3.2.1. Customer sample 71
3.2.2. Employee sample 72
3.3. Data collection instrument 72
3.3.1. Customer questionnaire 74
3.3.2. Employee questionnaire 74
3.4. Data collection technique 74
3.4.1. Customer interviews 75
3.4.2. Employee interviews 75
3.5. Data processing 75
3.6. Pilot study 76
Chapter 4 Data Analysis and Findings
4.1. Introduction 77
4.2. Findings on Customer questionnaire 77
4.2.1. . Findings on reliability and validity of 78 SERVQUAL
4.2.1.1. Factor analysis 78
4.2.1.2. Reliability analysis 81
4.3. Discussions on reliability and validity findings of questionnaire 82
4.3.1. Tangibles 82
4.3.2. Reliability 82
4.3.3. Responsiveness 82
4.3.4. Assurance 83
4.3.5. Empathy 83
xi
4.4. Summary of reliability and validity 83
4.5. Findings on the importance of dimensions in predicting service quality 84
4.6. Findings on customer importance, expectation & perceptions 85
4.7. Importance of service quality dimensions from the customer's perspective 86
4.7.1. Importance 86
4.7.2. Expectation 86
4.7.3. Perception 86
4.8. Findings on SERVQUAL score : Customers 87
4.8.1. Overall SERVQUAL score : Customers (Gap 5)
87
4.8.2. SERVQUAL score for the tangible dimension 88
4.8.3. SERVQUAL score for reliability dimension 89
4.8.4. SERVQUAL score for responsiveness 90 dimension
4.8.5. SERVQUAL score for assurance dimension 91
4.8.6. SERVQUAL score for the empathy dimension 92
4.9. Findings on employee questionnaire 93
4.9.1. Findings regarding importance of dimensions in predicting service quality 93
4.9.2. Importance of service quality dimensions from the employees perspective 94
xii

4.9.2.1. Importance 94
4.9.2.2. Expectation 94
4.9.2.3. Perception 94
4.10. Relative importance, expectation and perception of the service quality dimensions (customers and employees). 96
4.11. Findings on SERVQUAL score : Employees (Gap 5) 97
4.12. Comparitive SERVQUAL scores for customers and employees 98
4.13. Findings on Gaps 1 to 4 identified by SERVQUAL 99
4.13.1. Gap 1 : the distance between customer expectations and employee/management perceptions of the customer expectation 99
4.13.1.1. Unweighted scores 99
4.13.1.2. Weighted scores 99
4.14. Reliability coefficients measuring the antecedants to the gaps identified by SERVQUAL 100
4.14.1. Answers to questions related to the antecedents in gaps 1 to 4
100
4.15. Discussion on antecedants to gaps 101
4.15.1. Antecedant to Gap 1
101
4.15.2. Antecedant to Gap 2
101
4.15.3. Antecedant to Gap 3
101
4.15.4. Antecedant to Gap 4
101
4.16. Results from the questions leading to the measurement of gaps 2 to 4
102
4.17. Measurement of gaps 2 to 4 102

Chapter 5 Conclusions and Recommendations
5.1. Conclusions and recommendations
5.1.1. To investigate the reliability and validity of the SERVQUAL model in an industrial environment
5.1.2. To explore the difference between expected and perceived service experienced by customers in an industrial environment 105
5.1.2.1. Tangibles 105
5.1.2.2. Reliability 105
5.1.2.3. Responsiveness 106
5.1.2.4. Assurance 106
5.1.2.5. Empathy 106
5.1.3. To explore the difference between customer expectations and management perception of the customer's expectation in an industrial environment 107
5.1.4. To determine where the service quality gaps 107 exists
5.1.4.1. Gap 1 107
5.1.4.2. Gap 2 108
5.1.4.3. Gap 3 108
5.1.4.4. Gap 4 108
5.1.4.5. Gap 5 108
5.1.5.
To determine the predictors of service 109 quality
5.1.6. Concluding remarks 109
104
104
xiv

5.1.6.1. To analyse service quality models 109 based on a literature review
5.1.6.2.
5.1.6.3.
5.1.6.4.
To investigate the reliability and validity of the SERVQUAL model in an industrial environment.
To explore the difference between expected and perceived service experienced by customers in an industrial environment
To explore the difference between customer expectations and managements perception of the customer's expectation in an industrial environment
109
110
110
5.1.6.5. To determine where the service quality gaps exists
110
5.1.6.6. To determine the predictors of service quality 111
5.1.7. General observation 111
5.2. Recommendations for future studies 112
I: ibliography
Appendix I Questionaires
Appendix II Factor analysis
Appendix ILI Regression analysis
Appendix IV Antecedants to gaps 1,2,3 and 4
Appendix V Comparison between scores
Appendix VI Environments where SERVQUAL has been applied by year
xv
List of Tables and Figures
Table and Title
Table 4.1. Factor loading 78
Table 4.2. Eigen values 79
Table 4.3. Reliability analysis 81
Table 4.4. Findings on the importance of dimensions in predicting service quality 84
Table 4.5.
Table 4.6.
Table 4.7.
Table 4.8.
Comparison of the relative importance of the five service quality dimensions (customers) 85
Comparison of the relative importance of the five service quality dimensions (employees) 93
Relative importance of the five service quality dimensions (customers and employees) 96
Antecedants to gaps 1 to 4 100
Table 4.9. Results from the questions leading to the measurement of gaps 2 to 4 102
Table 4.10. Measurement of gaps 2 to 4 102
Table 5.1. Organisational responsibility for closing gaps 111
xvi

Figure and Title
Figure 1.1. Overview of the elements leading to service 8 advantage and service oblivion.
Figure 2.1. Measurement objective relative to service aspect. 31
Figure 2.2. The main techniques described by Horrowitz. 33
Figure 2.3. Services marketing triangle. 36
Figure 2.4. The SERVQUAL model. 46
Figure 2.5. The SERVQUAL model extended. 47
Figure 2.6. The five dimensions of service quality. 48
Figure 2.7. Gronroos's Service Quality model. 55
Figure 2.8. Kano's Two Factor model. 57
Figure 2.9. Multistage model. 58 TECHNIr:ON \NO ATERSRAND
LIBRPRI Figure 2.10. SERVPERF model. 59
Figure 2.11. Organisational Service Quality model. 61
Figure 2.12. Service Quality Trade-off Continuum model. 62
Figure 2.13. The Modified Service Journey model. 64
Figure 2.14. The Customer Processing Operations model. 65
Figure 2.15. The Behavioral Service Quality model. 66
Figure 2.16. Primary focus of service quality models. 69
Figure 4.1. Scree plot 80
Figure 4.2. Comparison of relative importance of the five service quality dimensions : Customers 85
Figure 4.3. Overall SERVQUAL score : Customers 87
xvii

Figure 4.4. SERVQUAL score for tangible dimension 88
Figure 4.5. SERVQUAL score for reliability dimension 89
Figure 4.6. SERVQUAL score for responsiveness dimension 90
Figure 4.7. SERVQUAL score for assurance dimension 91
Figure 4.8. SERVQUAL score for empathy dimension 92
Figure 4.9. Comparison of relative importance of the five service quality dimensions : Employees 93
Figure 4.10. Difference and similarities in importance, expectation and perception of service quality dimensions from a customer and employee perspective 96
Figure 4.11. SERVQUAL score : Employees 97
Figure 4.12. Comparitive SERVQUAL scores for customers and employees 98
Figure 4.13. Weighted and unweighted SERVQUAL scores 99
xviii

Chapter ackground and Scope of Research
1.1. Title
The Measurement of Customer Service Quality to be reengineered, as a competitive strategy, in an industrial environment.
1.2. ackground
This study deals with the measurement of service quality in a metals "heat" treatment plant representing an industrial manufacturing environment marketing its capacity, with a focus on :
The customers perception of the service quality received
The service provider's perception of the service quality provided
The gap between the two
Following a new strategic intent for the heat treatment business unit to pursue wider commercial interests, inclusive of a more competitive landscape, with the objective of customer retention and acquisition a diagnostic study was conducted to assess a competitive strategy for the business unit from a customer service perspective.
The diagnosis used in this study, the SERVQUAL model, designed by Parasuraman et al. shows activities that influence the perception of service quality. The identification of pertinent service quality factors, their interaction and links within the organization is highlighted.
1

The strategic diagnosis originated from Porter's five forces and provides the background of the industrial environment in which the business unit operates.
According to Wright et al. (1998 : 32), Porter contends that an industry's profit potential (the long run return on invested capital) depends on five basic competitive forces within the industry : these being
The threat of new competitors entering the industry The intensity of rivalry among existing competitors The threat of substitute products or services The bargaining power of buyers The bargaining power of suppliers
Therefore the key to competing effectively is for the company to find a position in the industry from which it can influence these five forces to its advantage or can effectively defend itself against them (Wright, et al., 1998 : 32).With this in mind the influence of service quality is evaluated.
For the purpose of this study all five forces are significant to the metals treatment business unit.
The first is the threat of new competitors entering the industry, in the guise of manufacturing organisations who are able to install a heat treatment facility for their own consumption rather than utilising a heat treatment service provider.
The second is the intensity of rivalry among existing suppliers dominated by key service providers competing for the same customers.
The third is the threat of substitute products or services, consisting of a selection of processes operating on different technology platforms. In essence this represents a competing solutions scenario where two processes achieve the same result through different mechanisms.
The fourth is bargaining power of buyers. Based on the above buyers are empowered with a wider choice, characterised by low switchover costs enabling defection.
The fifth is bargaining power of suppliers, where the supplier struggles to achieve leverage on customers based on the interaction of the above four factors.
2
In essence this plant sells metals treatment capacity to the general engineering, automotive, and metal casting industries. The nature of the business requires clients to submit metal components for conversion and processing as follows :
the component is submitted by the customer
the requested heat treatment is evaluated according to plant capability
the requested heat treatment is performed if feasible
the component is dispatched in the customers requested state
In addition to the above, the environment in which the study is being conducted is different from pure services based industries in the following ways :
According to Dale et al. (1997 : 242) the variability in manufacturing processes is much more difficult to control than the human element in the delivery of services.
The issues which impact on manufacturing quality are wider ranging than those facing service organizations in delivering service quality.
The consequences of getting it wrong in a manufacturing situation are considerably greater than upsetting a customer say at McDonald's, in a hotel or in a chain store.
The consequences of not meeting the high performance standards which are demanded in manufacturing are likely to be much more punitive than a failure to meet requirements in a service situation.
In general, product quality is very much dependent on the state of equipment and machinery which can often be complex and involve high levels of technology. This places demands on the levels of skills and understanding of those operating such equipment to ensure that there are adequate levels of process capability. This factor is much less critical in delivering service quality.
A key issue in a manufacturing situation is to convince the senior production people that quality is just as important as meeting the production schedule. This is something that those responsible for managing quality in a service environment do not have to face.
In most manufacturing situations, there is a strong competitive element. If a supplier fails to meet a customer's requirements then it
3

is highly likely that the customer will switch to another source of supply; the customer is not necessarily restricted, with local or even national sources of supply. The assessment of supplier performance is aided by the more precise nature of what is required in the transaction. The failure of a supplier to meet a customers' requirements can result in a significant reduction in an individual supplier's order book and can sometimes result in failure of the business. There are also the cases of product recall with the loss of consumer confidence for a period of time, or altogether, and the considerable costs associated with this process.
In service situations any problem is likely to be spotted more or less immediately and remedied "on the spot" with minimal expense and loss of customer confidence. In manufacturing this is not the case. If problems are found by the customer they put the shipment on hold, ask the supplier to carry out checks and sorting of good from bad product, and require them to specify what corrective and preventative action is going to be taken by them. If the product is found to be defective then the supplier would have a quantity of defective products on their hands. The margin for error in manufacturing is much less than in service and the scale of operation is much longer involving more interconnecting links within the customer-supplier contact chain. This need to meet exacting technical requirements is very important for suppliers wishing to break into new markets and climb the technological ladder. Failure to satisfy the technical requirements of a customer with a product will often not lend itself to a second chance. (Dale, et al., 1997 : 243).
In service situations the competitive and failure elements do not appear to be as strong. While writers such as Cowell (1991) and Lovelock (1991) discuss the implications of getting it wrong in a service situation, rarely are the implications as far reaching as they are in manufacturing. The legal implications of failure in manufacturing are much higher. In addition to litigation claims the customer can invoke the warranty clause to penalize unsatisfactory performance. Also, through adequate analysis of warranty claims and field failures the customer can learn from the mistakes made by suppliers and use this data in relation to the cost of transactions in the negotiation of contracts. Any rejection and reworking of product tends to reduce employee morale, in particular when it impacts on salaries which compounds the difficulty of managing quality in a manufacturing environment.(Dale, et al., 1997 : 243).
If a customer is upset because of service problems they may decide not to use that organization again, but their loss of a customer will
4

in most cases be relatively low in relation to the loss of an order in manufacturing. In addition, service recovery is easier than its equivalent in manufacturing. What might be questioned is the degree of negative word of mouth communications as outlined by writers such as Stauss and Hertschel (1992), who comment "The amount of word-of-mouth activities is tremendous. The respondents tell an average of ten people about a critical incident, independently of the incident's violence" and Goodman et al. (1990) who say "the negative word of mouth generated by dissatisfied customers is double the positive word of mouth spread by satisfied customers". In service situations perception is a key characteristic and what some people believe is good service others may consider to be lousy. For example, just consider the range of views which people usually have about a particular airline, restaurant, fashion design or hotel. So if this is the case it may be a question of swings and roundabouts. Because of this in service type situation, it is much more difficult to assess a customer's degree of dissatisfaction. In manufacturing the situation is much clearer because of the longer term relationship built up between customer and supplier.
In services, consumers exercise "zones of tolerance" between adequate and desired expectations. However, such zones vary among individuals because of the subjective assessment. The tolerance levels are likely to be wider in service compared to manufacturing. Consider, for example, just-in-time supply between a supplier of components to an assembler in relation to waiting for a meal in a restaurant. In manufacturing, apart from those related to niche products, the customer has a real choice. This choice may not be as widespread in services due to issues such as: geographical location, convenience, timings of travel, routes, size of facility, monopoly type supply and technology.
A number of factors involved in manufacturing processes are associated with technology. In addition, the level of variables and defects can be controlled and considerably reduced by internal actions. In manufacturing if things go wrong they can, in most cases, be caught and corrected before they reach the customer. Having identified the problem, there is the cost of rectification and scrapping the product. There is usually good interaction between the customer and supplier processes. Staff from both groups work together to resolve problems, sometimes through joint improvement teams. The control of service processes are often dependent on the behaviour and attitudes of staff, their training, commitment to continuous improvement and customer care. (Dale, et al., 1997 : 243). In manufacturing there is greater use of technology in process but in service technology this is increasing through the use, for example,
5
of automatic teller machines, operation of electronic point-of-sale systems, and computerized reservation systems, and services are becoming increasingly reliant upon technology.
Understanding and then reducing the variability of processes, in particular those involving interfacing and different technologies, where there is some process volatility.
The number of interfaces is high, the flows of material is complex and that of information is even more complicated. Synchronization and control of these flows over time is not easy.
Additional contrasts to pure services include
Managing the suppliers of raw materials, componentry and the detailed quality planning and level of communication which is needed between customer and supplier; this is made more problematic when the customer has specified to the supplier which suppliers it should use on their contracts.
Ensuring the capability of the equipment, gauges, fixtures and tools required in the production of product(s).
Ensuring that operating staff follow the standard operating procedures which have been laid down.
Producing products, in particular new ones, where the technology is not fully understood, to exacting requirements under strict delivery lead time conditions.
Gaining cross-functional co-operation across all departments.
Controlling the impact of factors such as stock control, planning, scheduling and the technology of equipment on the control and management of quality. In some industries (e.g. speciality chemical processes and heat treatment), the complex nature of processes is still not fully understood and consequently process control is perceived as a "black art".
The time from the first customer contract and interface to delivery is often longer, giving rise to variations and potential wrongs.
Producing small batches of products for which the specifications are frequently changing over time. (Dale, et al., 1997 : 247).
6

The threat is accentuated by the increase in industry heat treatment capacity which is faster than the demand. In such a competitive scenario only those companies, which are able to fulfill the expectations of its customers would survive. (Ghoshal and Sinha 1999 : 32).
In addition the metals treatment services offered are situated at the mature stage of the product life cycle influenced by a competitive landscape.
The slowdown in the rate of sales growth, at this stage, creates over capacity in the industry. This over capacity leads to intensified competition. The industry eventually consists of well-entrenched competitors whose basic drive is to gain competitive advantage. (Kotler, 1997 : 355).
According to Brown (1997 : 7) we need a new strategy, one that builds on a strong foundation of fundamentals yet creates that degree of differentiation that leads to long term success. The organisation must be transformed. But in what area? Product? No it will be copied in short order. Price? No you don't want to be just the lowest price provider. The answer is customer service. That gives an organisation perhaps the last strategic edge!
Complex buyer-seller relationships result from intangible qualities of product augmentation, which is rapidly becoming the central focus of industrial marketing. The intangible aspects of relationship marketing are much more difficult for competitors to imitate and, if efficiently managed, can therefore provide a sustainable competitive advantage for an organisation. (www.sabusinessreview.co.za , 20/04/2002).
One instrument that was developed to satisfy these goals in service quality measurement is the SERVQUAL scale. (Parasuraman, Zeithaml & Berry 1988 : 12).
7

Service Marketing
Service delivery system
r-->
Delight
Satisfaction
Dissatisfaction
Irritation
Anger
Customer —> experience —>
—>
Service measurement/monitoring and recovery process
Marketing Customer Perception
Operations
Execution —>o f
promise
A
Service oblivion
Service advantage
Customer Expectations
Promise
A schematic representation of the environment and context in which the research is being conducted is shown.
Figure 1.1. Overview of the elements leading to service advantage and service oblivion. (Chase, et al., 1998: 150).
As Figure 1.1. shows marketing typically has the responsibility for communicating the service promise to the customer, thereby creating customer expectations about service outcomes.
Operations is responsible for the actions executing the promise and managing the customer experience. The feedback loop indicates that if outcomes are not satisfactory or do not create service advantage, management may alter either the service marketing strategy or delivery system. The need to monitor the execution phase and have a recovery plan to diffuse negative reactions before the customer leaves the system is also indicated.
Monitoring and controlling involve the standard managerial actions of reassigning workers to deal with short run demand variations, checking with customers how things are going and for many services simply being available to customers.
8

Recovery planning involves training frontline workers to respond to such situations as overbooking capacity, late deliveries, and reworks.
A company that can't achieve competitive advantage in its service delivery must at least achieve parity with its competitors.
One approach to measuring the economic value of customer satisfaction is to survey your customers. Ask them to rate each a list of service and quality dimension items on two scales : importance and satisfaction. The point is to focus your attention on factors that are most important to your customers. In particular focus on factors where their satisfaction rating is below their importance rating. (Chase, et al., 1998 : 150).
Achieving competitive advantage in services requires integration of service marketing with service delivery to meet or exceed customer expectations. This holds true no matter what competitive dimensions are emphasised. (Chase, et al., 1998: 149).
Traditionally, companies have looked to marketing and product development for sources of competitive advantage. In today's information-intensive environment, however, these advantages can soon be replicated and converted into competitive requirements. Consider instead, customer service as a source of competitive adavantage. (Brown, 1997 : 5).
1.3. Aim
To evaluate the customer service, to be reengineered, in an industrial environment for competitive advantage.
1.4. Objective
1.4.1. To analyse service quality models based on a literature review
1.4.2. To investigate the reliability and validity of the SERVQUAL model in an industrial environment
1.4.3. To explore the difference between expected and perceived service experienced by customers in an industrial environment
9

1.4.4. To explore the difference between customer expectations and management perception of the customer's expectation in an industrial environment
1.4.5. To determine where the service quality gaps exists
1.4.6. To determine the predictors of service quality
1.5. Defining concepts
1.5.1. Reengineering
Methods by which physical and mentally induced constraints are eliminated from the organisation and reestablished in a way that better meets the goals of the organisation based on customer needs, competitive and change demands.
1.5.2. Customer service
The flow of customer needs information through stages of analysis in the organisation toward the achievement of those customer needs.
Customer service is regarded quite literally as part of the product-service that the customer is paying for.
1.5.3. Competitive strategy
The application of organisation resources to fulfill the customers needs better than those of the competitor leading to customer retention, loyalty, repeat purchases and ultimately a barrier to entry by competitors.
1.5.4. Industrial Environment
An industrial environment can be described as the exchange of goods and/or services in industrial markets essentially for use in the production process or the provision of services, as well as marketing between organisational buyers and organisation users.
1.6. Limitations
The organisation under review is identified as VEKTOR a division of DENEL, see www.vektor.edx.co.za , trading as a business unit specialising in the treatment of metal components positioned in the general engineering market segment.
Research will be limited to the customer and employee base of this
10
business unit geographically confined to Gauteng.
1.7. Value of the research
Define the organisation's Customer Service Quality level from a customer and employee perspective.
Guage the competitive advantage, if any, that Customer Service Qua can yield.
Sug-get improvements in the organisations effort toward Customer 'ervice Quality.
1.8. Research design
Research will be undertaken in a quantitative (action research context) with customers, who are users of the heat-treatment services to establish primary data on service quality.
According to Sayre (2001 : 5) we use quantitative methods to give us explanations of cause and effect so that we can approach planning from a bottom-line approach.
Evaluation will focus on service quality consisting of a structured questionaire constructed from a previously researched instrument known as SERVQUAL. The technique employed comprises surveys and face to face .interviews aimed at probing existing levels and desired levels of. customer service. This will be conducted cross sectionally for this research topic at this point in time.
1.9. Population and sampling technique
1.9.1. Population
Vektor a division of Denel, Gauteng.
1.9.2. Sampling technique
100 % sampling, based on 70 active customers and 30
1.10. Outline of research report
1.10.1. Chapter 1. Introduction
•
UNIVERSITY JOHANNESBURG
LIBRARY BUNTING ROAD CAMPUS
employees.
This chapter discusses the background of the research, outlining the construction of the metals treatment plant as it exists, within an industrial environment and the strategic intent relative to the
11

customer objective. The importance of service quality as a competitive mechanism is outlined. Subsequently the aim, objectives and scope of the research is stated.
1.10.2. Chapter 2. Literature review
This chapter reviews theory, aspects and the measurement of service quality. The SERVQUAL model is highlighted as the chosen research instrument augmented by the presentation of developments, critique and actual applications.
Other service quality models are reviewed expanding into aspects and the necessity of service quality measurement.
1.10.3. Chapter 3. Research methodology
The research methodology is outlined in this chapter, with the focus on both customers and employees.
A structured customers questionaire based on SERVQUAL, modified in context, was applied enabling data collection through face to face interviews. Face to face interviews allowed the customers and employees privacy and immediate response within reasonable time. The customer sample of 70 was drawn from the organisation's customer database.
The employee sample was drawn from the current population of 30 Vektor heat treatment employees (100 % sampling).
Sampling of the customers and employees (including management) is considered to be representative of the populations from which they originate.
Pilot interviews applying, the modified questionaire, was conducted to check flow and sensitivity to questions and eliminate misunderstandings.
1.10.4. Chapter 4. Data analysis and findings
Data was analysed using the SPSS statistical programme (Statgraphics). The analytical methodology is adopted from the original study conducted by Parasuraman et al. (1988).
12

1.10.5. Chapter 5. Conclusions and recommendations
The conclusions and interpretation originating from the data analysis is outlined in this chapter. Conclusions are aligned to the research objectives and subsequent recommendations are made.
The research adds to the existing SERVQUAL body of knowledge, in the context of it's unique application relative to a South African industrial environment.
13

Chapter 2 Literature Review
2.1. Introduction
In most industries, providing quality service is no longer simply an option. The quick pace of developing technologies and increasing competition make it difficult to gain strategic advantage through physical products alone. Plus, customers are more demanding. They not only expect excellent, high quality goods; they also expect high levels of service. (Zeithhaml & Bitner, 2000 : 7).
As companies have realized the strategic and financial benefits of service quality, they have created programmes that measure customers views of service quality, and processes for viable system changes to be implemented. (Bolton & Drew, 1991).
The chosen method of measurement for this research is the SERVQUAL model, proposed by Parasuraman, Zeithaml & Berry in 1988. There are several considerations when determining service quality
Customer service as a strategy
The importance of customer service
The links to customer service
Customer service metrics
The SERVQUAL model and its reliability
Other models of service quality
The literature review outlines the abovementioned points as important components in understanding service quality. In relation to these points the application of SERVQUAL provides a basis for the measurement of customer service quality to be reengineered as a competitive strategy in an industrial environment — a heat treatment plant.
14
°j1 LK,
2.1.1. Customer service as a strategy
A service strategy starts by looking at a company through its customers eyes. But first you have to get to know the customers well. Who are they, what are their needs, what is of interest to them ? What will motivate them to buy and buy again ? What will make them satisfied , overwhelmed ? (Horovitz, 2000 : 1).
Smart people have been writing about management for close to 100 years and they've offered "solutions" to just about every business problem. Yet executives everywhere still seek The answer to a simple question: How do you choose what to do .... and how do you get it done?
Or put differently, what is the best way to take your company from here to the future, and make a bundle of money on the way? Whether you think of your company as "old economy" or "new economy", as "bricks-and-mortar", "B2B" (business-to-business), or "B2C" (business-to-consumer), or whatever, the race for tomorrow's customers and profits hinges on two things: business model design and implementation capability. (Manning, 2001 : 9).
The fashionable notion that all stakeholders rank equally is not grounded in reality. Firms that balance the demands of shareholders, customers, and their own people tend to outperform others. But lets be clear: the reason to care for customers is because they're the source of economic profit — the indicator that investors care most about. (Manning, 2001 : 29).
The business model that delivers jam tarts is one thing; it takes another design to sell networking equipment or bulldozers. Within any industry there's likely to be a range of models. But while every company should strive to be unique in the customer's mind, all have to build strategies on the same basic principles. Winning and keeping customers depends 100 percent on them.
15
Whatever you sell and whomever you sell it to you have to do three things or you won't survive
Focus your resources where you'll get the most from them Continually drive up your customer's perception of value Simultaneously drive down the cost of doing it
These are obviously more than just marketing or branding issues. They are matters of business design and of execution. Apply these basic strategic principles, and your car, DVD player, sofa, savings plan, bottled water, tank top, ethical drug, or whatever has a chance of grabbing attention and customers. But deny these principles or try something else and you can be sure the good times won't last.
Focus is a decision that may be made by a few people in your organisation and holding your course is a leadership matter. But driving value up and costs down depends on everyone. Even if you alone or a small group — make initial choices about how to do it (i.e. the processes) everyone on your team must apply themselves to the doing. Their imagination and spirit enable you to "push the envelope" and take value delivery to new levels. Customer satisfaction becomes a moving target-which you move. (Manning, 2001 : 33).
In the 19" century companies were product-driven, with great emphasis on what they sold — take it or leave it. During the 1950s companies became sales-driven, with their focus on advertising and distribution. In the 1980s the emphasis was on database marketing, with innovative direct marketing, sales and distribution services.
Over the past few years all successful companies have focussed on their customer requirements. Within the next few years we will see the emergence of the real-time company, able to implement innovative ideas quickly and integrated with suppliers and customers globally.
This move has been driven mainly by the following strategic factors:
Customers are looking for innovative new product selection, buying and delivery services; Customers are demanding quality products and higher levels of service. Customers want to do business on their own terms — for example 24 hours a day, seven days a week. New marketing channels such as the Internet and mobile telephony have opened up
16

It has become more difficult to keep clients — "the competition is a click away" Deregulation and globalization have created more competitors Customer buying patterns and product demands have become more sophisticated Acquiring and servicing customers has become more expensive. Obtaining a new customer costs up to five times more than keeping one.
Customer profitability has become critical in many companies efforts to maintain profitability. (Sunday times, 2001 : 3)
2.1.2. What is the importance of customer service ?
Ask most executives about their organisations customer service strategy, and they will respond with pabulum about courtesy, response time and guaranteed satisfaction. If you point out that such things do not represent a strategy, it may end the conversation.
These same executives spend little time thinking about customer service. They view it as a department or function, where the phone gets answered (after negotiating voice mail), orders are taken, information is given, repair people are dispatched, or complaints are handled. A log of how these executives spend their time would show few activities related to customer service. As a function it is usually so submerged organisationally that it may not even show up as line item at budget time. It reports to somebody, who reports to somebody, who reports to somebody.
On reflection this is curious. There is common understanding that we are becoming a service economy., but the facts behind the statement are not fully appreciated. The challenge is that if you provide too little service, or the wrong kind, customers will leave; provide too much, even the right kind, and you will go broke or price yourself out of the market. These are not happy alternatives but we see them being played out on the pages of the business press every day in stories about companies headed by executives who fail to grasp that the essence of their business, whatever it may seem to be, is really customer service. Some companies attempt to segment customers choosing which ones to serve, thus improving productivity without imperiling customer satisfaction. The problem with the term segmented is that it smacks of the old mass-marketing mentality that arranges numbers in orderly patterns as though they represented information and knowledge, not merely data. To segment with semblance of sensitivity requires understanding and awareness of the fundamentals of human behavior. (Masnick, 1997 : 145).
17

Take for example, First Bank in Chicago. They segmented their customers into those who use ATM's and those who prefer to go to human tellers (Teller transactions are much more expensive for the bank than ATM transactions). Wanting to reduce its costs and make more money, the bank decided that the way to get people to use ATM's was to punish them for using tellers by levying a heavy teller transaction charge. This could be regarded as the cattle prod approach.: If people don't do what you want them to do, hit them with an electric shock. How much better it would have been, and in the end how much more profitable, to simply provide an incentive for using ATM's. (Masnick, 1997 : 145).
At the heart of the idea is the necessity of developing a customer service strategy the need for a valid, consistent, comprehensive customer satisfaction measurement system. Otherwise organisations are afflicted with management by intuition as opposed to management by fact. This is not to say intuition is not important; it is just that intuitive leaps bound higher and truer from a pad of facts. (Masnick, 1997 : 145).
Even the best customer service systems are doomed to deteriorate unless they are supported by an effective measurement system. The world is a passing parade, with changing competitors, customer preferences, technologies and employee capabilitities. Measures establish the feedback loops through which companies learn to respond. (Masnick, 1997 : 145)2
2.2. A case study of customer service
2.2.1. Taco Bell vs McDonalds
TECHNIKON WITWATERSRAND LIBRARY
Take for example, Taco Bell. It entered a world dominated by phenomenally successful McDonald's. The success of McDonald's is attributed to its quick service, clean surroundings, and uniform products. To achieve these customer-centered objectives, McDonald's used a mass-production approach. Taco Bell perceived that attracting and retaining today's customer requires a different approach.
To understand the difference you need only to compare shopping at McDonald's and Taco Bell. Taco Bell is every bit as clean and predictable as McDonald's, but the food is less expensive and served much faster and the servers are friendlier and seem more competent. On investigation, you find that Taco Bell has reversed the polarity of fast food operations, shifting from manufacturing meals to serving customers.
Harvard Business School professor Leonard Schlesinger, who has studied McDonald's and Taco Bell in depth, made this observation: "While all these changes have been taking place at
18

Taco Bell, McDonald's focus has focussed on more of the same: more advertising and promotion efforts, more new products, more new locations. But more of the same no longer works. Competing against Taco Bell and other redesigned service businesses demand a shift in management's mindset as well as a new appreciation for the real value of service.
John E. Martin, president and CEO of Taco Bell, commented: "Taking action is a very frightening proposition for many companies. That is why the vast majority of organisations today continue subscribing to the notion that "if it's not broken, don't fix it". If ever there was a cliché that needed to be eradicated from our collective mindset this is it. "The break-it organisation places customers at the forefront of every important strategic decision, keeping nimble, flexible, and ready to respond on a moments notice rather than frozen by paradigms of the past. Talk about shattering paradigms! Taco Bell, a restaurant chain, decided to virtually get rid of its kitchens. Can you imagine the shocked looks on people's faces when the suggestion was first made? How can you have a restaurant without a kitchen? Martin explains: "Large multifunctional kitchens did not provide customers with what they wanted most: great food at a great price delivered by people who cared about their needs.
The McDonald's vs Taco Bell saga illustrates how market conditions can change, requiring a change in customer service strategy. The challenge is to understand what consumers really want and value. The example is sometimes given that when cars came only in black, the market appeared to want black cars. But once consumers were give a choice, everything changed forever ! (Masnick, 1997 : 145).
According to Wiersema (2001 : 133) within the fast food business, each chain seeks a feature to set it apart from others : some strive to be the cheapest, others the fastest, still others the tastiest. Taco Bell is the cheapest and McDonald's is generally regarded as the fastest and most consistent, which is precisely how it wants to be regarded, since speed and dependability are what the fast food business is all about.
2.2.2. Xerox
When efforts to improve customer service fail, it is mostly for one reason: they are not fully integrated into the normal management processes of the company. Unless integrated, service will not be represented in the list of priority actions set for the company as a whole. One company that got it right is Xerox. In 1983, it felt threatened by Canon and launched its first programme of "leadership through quality". The initiative ran until 1987 when it was followed by a customer satisfaction
19
programme, still in action today. The first programme emphasised doing things right : achieving zero defects, making efficient products, delivering speedier time to market, and new product introduction. The second emphasised customer service. It led to the launch in 1990 of a "satisfied" guarantee that allowed unhappy customers to change their photocopier. In tandem with this effort, Xerox embarked on a value extension programme, moving from being a supplier of photocopying machines to its position as "the document company". (Horrowitz, 2000 : 116).
Fifteen years later, customer satisfaction is close to 100 percent (the goal set in 1987), return on assets is at 20 per cent, and market share has been retained-even increased compared with the level at which it was in 1983. Xerox was also an early winner of the Malcolm Baldridge US quality award. What is so striking about Xerox as a benchmark is the tenacity and the systematic approach it brought to bear on the issue. When one looks at Xerox and similar companies-Otis with its service 2000 challenge, and Microsoft with its new customer satisfaction programme-it becomes obvious that defining and sustaining a long term service strategy is not a one off initiative. Its far more than a speech from the CEO, or a matter of measuring customer satisfaction or carrying out some other survey. To use a visual metaphor, a customer satisfaction strategy can be imagined as a set of interrelated elements, like spokes, supporting a wheel that rolls service strategy forward. (Horrowitz, 2000 : 116).
Let's start by looking at the entire wheel, before going to each element in turn. No element is independent. An a la carte approach whereby you choose one item and disregard others will not work. Success will come from a systematic, enduring and balanced approach to all elements. (Horrowitz, 2000 : 116).
Does this sound trivial ? It isn't. Consider companies with large numbers of customers, and consider the ease with which technology can help them build databases. Then consider the lack of detailed customer knowledge: it is appalling. Beyond simple demographics, not much is done. (Horrowitz, 2000 : 116).
Only when Xerox decided to have a single corporate objective-100 percent customer satisfaction did it achieve significant movement on this front. Before 1987, the service goal was on an equal footing with return on assets and market share. It was not until top management appreciated a number of things about customer satisfaction that Xerox was able to embark on a fully-fledged improvement plan. The turning point was the realisation that customer satisfaction (together with employee satisfaction) would lead to more sales (yielding greater volume with lower production and marketing costs) and increased productivity.
20

These factors in turn would lead to more profit, hence a greater return on equity. (Horrowitz, 2000 : 116).
2.2.3. Coca-Cola
Take for example the drink Coca Cola. Its consumers needs are thoroughly and continuously researched to the extent that the company knows more about its target populations lifestyle, leisure and career ambitions than possibly any other company (though it admits it committed an error of judgement when it launched New Coke in response to what its consumer research correctly showed was a widespread and growing trend toward favouring foods with less sugar and more natural ingredients. What the research did not indicate was that however much other recipes should be altered the taste of Coca-Cola is as sacrosanct as the design of the Stars and Stripes and not to be tampered with. It is available in 185 countries worldwide and is the most universally recognised brand name on earth. It delivers its promised benefits (though these have been considerably toned down from an early claim that, "this intellectual beverage ...(is) a valuable brain tonic and cure for all nervous afflictions — sick headache, neuralgia, hysteria, melancholy...!). It is presented in a choice of flavors (eg Classic Coke, Diet Coke), and its quality is purer than the general water supply in some of the nations in which it is sold. Its presentation is instantly recognisable irrespective of the language printed on its famous hobble-skirt bottle or its recyclable cans. Its associated images (health , fun, youth, summer, success, wholesomeness) are promoted heavily (the company's annual advertising and marketing spend worldwide is around $4 billion). Its price is highly variable — in the UK in the summer of 1994, for example, I could pay anything from 24p to 95p from a London street vendor for a can of Coke -yet its perceived value for money is invariably high. Needless to say, just about everyone is familiar with Coca-Cola : there is nil purchase risk; and consumers expectations are fulfilled — what is expected is delivered time after time. (Wellington, 1995 : 56).
And yet, its market share is constantly under successful attack by Virgin Cola and Sainsbury's own brand of cola drink; even Dr Pepper is gaining popularity, though not necessarily at Coke's expense. Which of the Satisfaction Elements, then, is the Coca-Cola company failing to deliver given its Product Element is so nearly perfect ? (Wellington, 1995 : 56).
2.3. What are the important links to customer service ?
2.3.1. Customer service and reengineering
Holland & Kumar (1995), as cited in Gerber (2002 : 1), in Getting Past the Obstacles to Successful Re-engineering, discuss
21

combining an external focus on satisfying customer needs and an internal focus on the development of unique resources that should drive reengineering efforts. These efforts need to be fully supported by top management. Companies have to discover what customer's value. Customer expectations are based on three contact points between the customer and the organisation: (1) interaction with the company in the ordering process; (2) the use of the actual product or service; and (3) the delivery and post delivery process. Based on their expectations, customers judge each of these points of contact on whether they are (1) correct and appropriate; (2) timely, and (3) economical.
Customer satisfaction with the three points of contact defines for the company what the customer's value and which processes might be reengineered. A firm's investment in resources should not only provide value to the customer but should enable the firm to maintain a profitable edge over its competitors. To sustain a competitive advantage, the company's reengineering efforts should be invested in resources that cannot easily be developed, replicated, substituted or bought by competitors. (www.sabusinessreview.co.za , 19/02/2002).
Reengineering is about achieving a significant improvement in process so that contemporary customer requirements of quality, speed, innovation, customisation and service are met.
Anjard (1996), as cited in Gerber (2002 : 1), maintains that reengineering is redetermined how the job should be done and that the key to reengineering is to concentrate on the macro level. At this level, the full support of top management is needed because the changes are far-reaching and dynamic for the organisation. Through the radical and rapid redesign of critical core processes and the systems, policies and organisational structures that support them, reengineering achieves breakthrough results. This should take a maximum of one year. Reengineering focuses on the processes of delivering goods and services to customers. It is not based on functional specialities associated with the way work is currently being organised. The initial reengineering efforts are directed to critical core processes 'that actually add value to what the customer is offered. Value added can be defined as "something the customer cares about and is willing to pay for."
Most theories of Business Process Reengineering (BPR) encompass an internal and external focus. Externally, the focus is always on providing a product or service that is valued by the customer. Competing in the market with a sustainable competitive advantage is also imperative. Internally, theories tend to focus on different components of the business. These theories address a
22

number of aspects, including top management support; the empowerment and motivation of employees; the enabling of technology; the management of change and corporate culture; communication (of the BPR process); and the rapid and dramatic change of the way things are done (processes). These can be grouped under three sections: (1) technology; human resources; and (3) organisational elements. The involvement of these aspects is regarded as ensuring the success of the BPR process. (www.sabusinessreview.co.za , 19/02/2002).
Despite a genuine interest in providing service quality, many companies miss the mark by thinking inside out — rather than outside in. When this happens, companies provide services that do not match customers expectations : important features are left out and the levels of performance on features that are provided are inadequate. (Parasuraman, et al., 1990 : 51).
According to Parasuraman, et al. (1990 : 71) a recurring theme in the executive interviews in our research was the difficulty experienced in attempting to match or exceed customer's expectations. Many executives cannot or will not change company systems of service delivery to enhance customers expectations. Doing so often requires altering the very process by which work is accomplished. At other times, change requires new equipment or technology. Change also necessitates aligning executives from different parts of the firm to collectively understand the big picture of service quality from the customer's point of view. And almost requires a willingness to be open to different ways of structuring, calibrating and monitoring the way service is provided.
Reengineering that seeks to improve company performance without including sales and other customer-facing positions is missing a big piece of the picture. Sales and marketing have too much impact on the firm's customer effectiveness not to be included in reengineering efforts. Reengineering for better product is not enough, because customers are all too aware that they buy much more than a product. Customers are buying solutions and applications, and the supplier's representatives they deal with on a day-to-day basis determine whether or not the customer's purchases produce the targeted impact on performance. (Blessington & O'Connell, 1995 : 3).
According to Blessington and O'Connell (1995 : 3) reengineering is tailor-made for dealing with the customer/supplier relationship. Its focus on process aligns with the quality initiatives that have driven purchasing to where it is today. Its emphasis on radical, out-of-the-box thinking introduces the potential for improvements that will not easily be copied by
23

competitors. And, its embrace of technology offers hope that suppliers can regain even footing in the age of information.
When should the supplier choose to undergo a massive reengineering campaign in the hopes that it will lead to a quantum shift change rather than reengineering for continuous improvement? A company might well be advised to engage in a quantum leap effort if it's one of the suppliers forming enduring customer relationships in an industry, which is shrinking its supply base. Conversely, if a company has a major share of stable relationships with the industry's largest customers, then it may be more advisable to pursue reengineering efforts, which focus on continuous improvement. (Blessington & O'Connell, 1995 : 3).
We see three major options for a reengineering effort. First, a company can pursue the quantum leap approach proposed in the early literature- surrounding reengineering (for example, Hammer and Champy, •Reengineering the Corporation, 1993). However we have seen too many reengineering efforts choke on the philosophy of massive change. This has led us to conclude that, while many companies need to reengineer their processes, most cannot do so radically.
Two other reengineering options are available :
o First, companies can look for narrow improvement opportunities during the early phase of reengineering (the "quick win" approach). These enhancements are made as a broader, more radical vision of the change effort is being completed and tested. Reengineering purists would scoff at diverting the company's attention away from designing and implementing the quantum shift. But, the company needs a higher success rate, and the quick win approach is one way to increase the positive impact of reengineering.
o Second, companies can accept the challenge of crafting a radical vision for their future, but then develop intermediate designs that move the company forward in a pattern of continuous improvement toward the bold future vision. As employees make changes and see success, the vision becomes more believable and attainable.
The quantum-shift approach of first generation reengineering is most appropriate when there is a limited window of opportunity. The best opportunities for radical reengineering occur* when there is already a break or change in production, such as a major new product line rollout, or some other dramatic event that might cause a natural and radical shift in the business - a merger or an immediate and substantial competitive threat, for example.
24

The quick win approach is attractive when a company recognises it has some major flaws in its approach to customers. These can be addressed with a reengineering effort that first establishes a broad vision for the future, the immediately plunges into the detail of making a limited number of immediate corrections that have quick payoffs. It is practically impossible for a company to address practical improvement opportunities if management initially stresses radical, quantum-shift change; the design team will be too concerned with radical change to address incremental improvement. (Blessington & O'Connell, 1995: 187).
The continuous improvement approach to reengineer begins with a radical vision for the future and assumes that many pieces of the company's operation must be enhanced incrementally and simultaneously. More realistic expectations are set for the pace of change, and enhancements are developed and implemented over the course of years. (Blessington & O'Connell, 1995 : 188).
In observing first-generation efforts, we have concluded that gradual rollout of enhancements is indeed a more accurate description of the actual pace of change anyway. There are two very real impediments to rapid change, especially of customer contact areas of the company. First, employees do not change their behaviors and expectations that quickly. Second, customers change even more slowly. (Blessington & O'Connell, 1995 : 190).
Not all organisations are the same, nor are all customers; and therein lies the first challenge. What must change within the organisation must be different for each company and possibly for each customer grouping.
Breakthrough customer service is not about giving more service. It is about giving differentiated service. (Brown, 1997 : 7).
Business Process Reengineering (BPR) literature is based primarily on North American and British experience. Clearly, the experience of these two regions is based on different economic and socio-political factors from those that prevail in South Africa.
Local issues such as rampant unemployment, poor levels of education in the workforce and a highly politicised work environment have to be balanced with the imperatives of global competition.(www.sabusinessreview.co.za , 19/02/2002).
2.3.2.Customer service and customer satisfaction.
During the formative years of the global quality movement, the emphasis was on product quality. Thus the burden has rested most heavily on production and engineering. Gradually, the emphasis
25

is shifting to service in recognition that sources of customer dissatisfaction most often have nothing to do with the product. They fall in some area of customer relationships.
Earl Naumann explained in Creating Customer Value : " From the customer's perspective product quality and service quality are virtually inseperable". Delivering high service quality is now absolutely essential to creating good customer value.
Due to the rapidly changing technological environment, service quality now holds more potential for creating a competitive advantage than does product quality. But the delivery of service quality may be even more difficult than improving product quality.
Recognising this, alert and far sighted leaders of organisations, business, nonprofit and government are ushering in a new era in which customer satisfaction measurement is destined to play a vital role. (Masnick, 1997 : 69).
Both customer retention and customer acquisition are driven by meeting customers needs. Recent research has indicated that just scoring adequately on customer satisfaction is not sufficient for achieving high degrees of loyalty, retention and profitability. Only when customers rate their buying experience as completely or extremely satisfying can the company count on their repeat purchasing behavior.
Most organisations have internal measures of performance. Many organisations these days have a mechanism for gathering customer satisfaction feedback. Few organisations, however, measure the effectiveness of their internal processes and link these measures to quality and customer satisfaction.
Let me emphasise that measuring customer service requires repeated assessments of customer satisfaction. You must be sure that you're getting it right, keeping it right, and continuing to focus on the right things. Customer priorities often shift over time, as external situations or customer strategies change. You must monitor these changes. Remember too, that every time you measure, the results of customer satisfaction, research can have immediate uses and benefits. (Brown, 1997: 77).
2.3.3. Customer service and competitive advantage
Achieving competitive advantage in services requires integration of service marketing with service delivery to meet or exceed customer expectations. This holds true no matter which competitive dimensions are emphasised. (Chase. et al., 1998 : 150).
26
2.4. Which customers are we talking about ?
According to Wiersema (2001 : 4) market leaders choose their customers very carefully because they know they will be judged by them : Nothing says more about a business than it's customers. Unfortunately, conventional wisdom can't help in this task. The first rule in sales is, go after the low hanging fruit-that is, the easy-sell customers-rather than clamber for what is hard to reach. But this is good advice only if there is a plethora of fruit on the low branches, and in the era of customer scarcity the pickings are getting slimmer. The real plums are in the high branches.
Market leaders deliberately pursue some of the most difficult and demanding clients they can find because they know that satisfying these customers will stretch their abilities and help them become better at what they do.
But not all tough customers are desirable matches. Some of them are simply the wrong ones to have because their demands don't play to a company's strengths. That doesn't necessarily mean they are undesirable for other suppliers. Picky critical eaters who want personal service could be ideal stretch customers for a swanky full service restaurant but a very bad match for McDonald's.
There are three main steps that a customer goes through when using a service. The purchase; use of the product or service; then repurchase. Logically, we should then measure customer quality of service at each step.
Are the customers satisfied with the company's effort to help them buy ?
Are the customers happy about the delivery and or use of the service ?
Did the customers satisfaction lead to their continuing to use or to repeat purchases ?
Unfortunately, the customer at various stages in the process may not be the same. There are those who buy and those who do not buy. At renewal time, one finds those who have bought again, and those who have not ("the lost customers"). So logically, a good measurement should include all three groups
Prospective customers who did not buy
Customers who did buy
Lost customers
27

From the first category-prospective customers-the company may learn what goes wrong with the attracting and selling process: why some potential customers have perceived it as inadequate and did not purchase. What would make people buy ? This input will help the sales process. (Horovitz, 2000 : 44).
It does not rely solely on feedback from those who have bought to assess either the current perceived quality of the sales activities, or what the new sales activities should be put in place to convert non-buyers.
When considering potential customers in this context, one should also distinguish between those who come to your company and decide not to buy and those who have never approached the company although they are part of your target market. (Horovitz, 2000 : 45).
The following questions illustrate the type of guidelines that help companies, with limited resources, develop target customer profiles.
Are large or small customers profitable? Do the most profitable customers start out small and grow, or do they start out large? Do our best customers have particular types of operation, or particular types of management philosophies?
If the cost, quality, and speed goals of reengineering effort are to be reached, it is critical to identify what makes for a good customer, because these characteristics will define the company's strengths and conserve the firms resources. It also helps ensure that the increasingly greater amount of investment it takes to convert a prospect to a customer is spent on those prospects with the greatest chances of yielding an attractive return for the company. (Blessington & O'Connell, 1995 : 122).
2.5. Customer Service Quality
2.5.1. What is service quality ?
Zeithalm & Bitner (2000), as cited in van der Wal, et al. (2002 : 325), state that service quality differs from quality of goods, in that services are intangible. This presents a challenge to marketers; services cannot easily be communicated to customers, and hence quality may be difficult for customers to assess. Services are characterised as being intangible, perishable, produced and consumed simultaneously, and heterogeneous. A major challenge for companies is to deliver service quality consistently.
28

2.5.2. The measurement of customer service quality
According to van der Wal et al. (2002 : 325) service and product quality is in the mind of the customer. This means that measuring quality requires talking with customers. Quality reflects the extent to which a product or service meets or exceeds customer's expectations. For companies to understand how customers perceive their quality, they must measure customer satisfaction with their products and services.
What kind of telemetry and diagnostic tests are used in business or other organisations? The most frequently measured are financial : sales, profits, cash flow, return on equity, return on investment, capital spending, budgets, productivity and more recently, economic value added. There are a few other measuring sticks, such as market share, market penetration and head counts. In recent years measurement has gone beyond the usual financial tools to include quality-things like statistical process control, scrap rates, reject rates and performance against quality standards (such as failure rates per million units produced).
No authority less than Professor Robert Simons of the Harvard Graduate School said: "Traditional financial indicators must be augmented by new diagnostic measures that monitor market based variables such as quality and customer satisfaction. These non-financial measures, which focus attention on customers, key internal processes, and innovation are an important step in the right direction. You want to measure not only what customers say but what customers do also. And here's the rub. Customers are people. As members of the species , we all know how complex, fickle, unpredictable, ungrateful, demanding, emotional unreasonable, unfair-and pleasant, friendly, kind and nice people can be. Sometimes it seems that the primary trait of the customer is sheer cussedness, and at other times being wonderful and remarkable.
All customer satisfaction measurement is for naught if no actions occur as a result. While this seems painfully obvious, a lack of response to customers seems more the rule than the exception. Usually it is not a matter of insensitivity or lack of good intent; it is the absence of process. When fundamental issues are identified through customer satisfaction measurement, there should be a process that gets them placed on managements agenda . for decision making. Often the issues are complex, involving trade-offs between alternatives and difficult decisions about resource allocations. (Masnick, 1997 : 157).
One of the compelling reasons for attaching high priority to customer satisfaction measurement is that it allows you to find out whether your decisions are successful. Measurement methods
29

that identify issues can also gauge the success of solutions to those issues. It takes some guesswork out of executive decision-making. Customer satisfaction measurement should be a closed loop of information, sensitive and self-adjusting. It should function like a thermostat controlling temperature in a building, or an autopilot flying an airplane. It should sense what matters to customers, compare that information to the goods and services provided to those customers, indicate where changes are needed, monitor the implementation of those changes, and assess their effectiveness in adjusting the overall relationship with the customer. It is indeed simple: The key to success is to find out what the customer wants and give it to them. (Masnick, 1997 : 167).
Conducting an examination rigorous enough to gain true insight into where improvements can be made may require a team from various functions of the organisation. But an internal examination, although valuable, may not justify a major change effort. To complete any analysis of a firm's effectiveness with customers, some external studies must be initiated. (Blessington & O'Connell, 1995 : 165)
2.5.3. What happens when you don't measure service quality?
The greatest danger in not measuring quality lies in the potential failure of your organisation to provide what the customer needs when he or she needs it. The obvious consequences of this for you is the loss of respect and ultimately loss of business from the people necessary for your survival. If you don't know what your customers expect from you and, further, how well you are meeting those expectations, you will not know where improvement efforts are needed. You risk focussing your attention on areas that your customers do not value, a serious waste of both time and resources. Osborne & Gaebler (1996) in Reinventing Government as cited in Brown (1997 : 17) see performance measurement as the key strategy for developing results orientated government. They make three points relevant to all organisations.
If you don't measure results, you can't tell success from failure.
If you can't see success, you can't reward it-and if you can't reward success, you are probably rewarding failure.
If you can't recognise failure, you can't correct it.
By measuring quality as defined by your customers, you will direct your efforts and resources where they will add the most value : to the issues most important to your customers. In addition, you will be able to recognise trends in performance
30

outcomes that affect customer satisfaction, allowing you to attend to problems before customers become disgruntled. You can track your performance with regard to customer satisfaction and plan strategic objectives accordingly. (Brown, 1997: 17).
2.6. Perspectives of customer service metrics
2.6.1. Horrowitz's perspective
"If you can't measure it, then you can't manage it", is an old management maxim. But first it is essential to define precisely what is to be measured, and the reasons for measuring it. What is the company's aim ?
To evaluate customers ideal preferences to plan for the future.
Is the company comparing its present performance to what it did in the past or is it seeking to outdo competitors by comparing its services with what they do, or measuring itself against world class companies ? Is the organisation looking at progress in terms of how the customer perceives the quality it delivers (perceived quality) or is it attempting to measure progress in terms of what is really delivered (actual quality). Are you talking of progress for all customers, potential customers, some customers or reducing the risk of losing customers?
Depending on the company's objectives, the measurements will differ in content, in perspective (what they are compared with or measured against) and in target. For each objective there is a tool : here are some of the techniques for measuring different aspects of customer service. (Horovitz, 2000 : 41).
Value to customer Quality
Actual Quality
Performance required to make a difference to
customers
Actual performance of product or services
Perceived Quality
New dimensions of value desired by customers
Current customer satisfaction with
dimensions of quality that are perceived to
be important
Figure 2.1. Measurement objective relative to service aspect (Horovitz, 2000 : 41).
31

Decide what to measure
o Trade-off (or conjoint) analysis allows customers to identify which combination of features in a product or service they prefer, and prioritize accordingly (for instance, by choosing speed of delivery rather than additional options when buying a car, or deciding between width of seat versus amenities when choosing an airline). In 1996, British Airways embarked on major research into the future needs of its customers. Thirty focus groups and a quantitative conjoint analysis carried out with the help of 2500 customers gave the airline some idea of what it should be doing in the future.
o Qualitative interviews with existing or potential customers, or an analysis of customer complaints (what, where, when) may highlight what the customers are looking for and what may be missing in the product or service currently offered.
Such qualitative interviews are also often used to prepare a sound customer satisfaction survey — that is a questionaire in which one makes sure that all dimensions of service are included and expressed in the customers language. (Such questionaires also serve as a basis for quantitative trade-off analysis). Qualitative surveys are powerful. They are listening posts, giving valauble intelligence about the attitudes of a company's customers. For large organisations, they can also be used to provide effective customer segmentation. By analysing the information provided, a company may be able to classify customers, grouping them in segments according to their wishes and priorities. Segmentation can be used to improve service on the basis of customers expressed wishes.
Indicators such as delays in delivery, failure rates and breakdowns can tell you without having to ask customers what is going wrong. On the other hand "mystery shopper" checklists — in which researchers act as customers to test the response of an organisation's staff and systems — measure how the company's doing against its own current standards. Finally, customer satisfaction surveys, whether face-to-face, by post or by telephone permit an assesment of how customers perceive the company with respect to the products or services it currently provides. (Horovitz, 2000 : 41).
32

Value
Trade-off analysis
nnalifitty
Indicators of quality "Mystery shoppers"
Qualitative interviews Individuals
Focus groups Complaints
Quantitative Customer satisfaction
surveys
Figure 2.2. The main techniques described by Horrowitz. (Horovitz, 2000: 41).
2.6.2. Berry, Parasuraman & Zeithaml's perspective
During the 1980's three American researchers, Berry, Parasuraman & Zeithaml studied the quality of services.
According to Parasuraman et al. (1990: 15) when we started our research program in service quality, we expected to find a varied and rich literature that would guide us. We found nothing of the kind! Instead we found literature almost exclusively devoted to tangible goods quality, defined in terms of conformance to manufacturers specifications. As a result, quality control principles and practices that we uncovered, while pertinent to evaluauting and ensuring goods quality , were inadequate for understanding service quality. This inadequacy stems from the three fundamantal ways services differ from goods in terms of how they are produced, consumed and evaluated.
First, services are basically intangible. Because they are performances and experiences rather than objects, precise manufacturing specifications concerning uniform quality can rarely be set.
Second, services with a high labor content are heterogenous : their performance often varies from producer to producer, from customer to customer and from day to day.
Third, production and consumption of many services are inseperable. Quality in services often occurs during service delivery, usually in an interaction between the customer and the provider. Unlike goods producers, service providers do not have
33

the benefit of a factory serving as a buffer between production and consumption.
The three key points that arise from this are:
Service quality is more difficult for customers to evaluate than the quality of tangible goods.
Customers do not evaluate service quality solely on the outcome of a service; they also consider the process of the service delivery (the manner in which the service is delivered).
The only criteria that counts in evaluating service quality is defined by the customer. Only customers judge quality; all other judgements are essentially irrelevant.(Parasuraman, et al., 1990 : 16).
According to Parasuraman et al. (1985 : 41) customers' assessment of service quality is the result of a comparison between their expectations and experience of after service delivery. If their expectations have been met, they are satisfied, if not, they are dissatisfied. If expectations have been exceeded, they are more than satisfied.
In further studies of service quality the three authors found that there are two levels of customers' expectations of the service : `adequate' and 'desired' (Parasuraman, et al., 1991 : 420).
The first level is what the customer finds acceptable and the second is what he or she hopes to receive. The distance between the adequate level and the desired level is the 'zone of tolerance'. This zone expands and contracts and may vary from customer to customer and from one situation to another for the same customer. Similarly they vary, depending on the quality dimension involved.
Parasuraman et al. (1988 : 12) discusses distinctions between various aspects of quality, these being :
Perceived quality versus objective quality. Researchers have emphasised the difference between objective and perceived quality. The conceptual meaning distinguishes between mechanistic and humanistic quality: "mechanistic (quality) involves an aspect or feature of a thing or event; humanistic (quality) involves the subjective response of people to objects and is therefore a highly relativistic phenomenon that differs between judges".
34

Quality as attitude. Exploratory research conducted by Parasuraman et al., supports the notion that service quality is an overall evaluation similar to attitude. Quality serves as a relatively global value judgement and is a form of attitude, and results from a comparison of expectations with perceptions of performance.
Quality versus satisfaction. Consistent with the distinction between attitude and satisfaction, is a distinction between service quality and satisfaction : perceived service quality is a global judgement, or attitude, relating to the superiority of the service, whereas satisfaction is related to a specific transaction. Service quality focuses on the dimensions of service, whilst satisfaction is generally considered as a broader concept.
Expectations compared to perceptions. The study strongly supports the notion that service quality, as perceived by consumers, stems from a comparison of what they feel service firms should offer (i.e. from their expectations) with their perceptions of the performance of firms providing the services.
Parasuraman et al. (1988 : 16) proposes that
"Service quality is the customers' perception, compared to their expectations of service".
"Perceived quality is therefore viewed as the degree and direction of discrepancy between consumers' perceptions and expectations"
"Perceived quality is the consumer's judgement about an entity's overall excellence or superiority".
"Service quality is an overall attitude towards a service firm, whereas, customer satisfaction is specific to an individual service encounter".
35
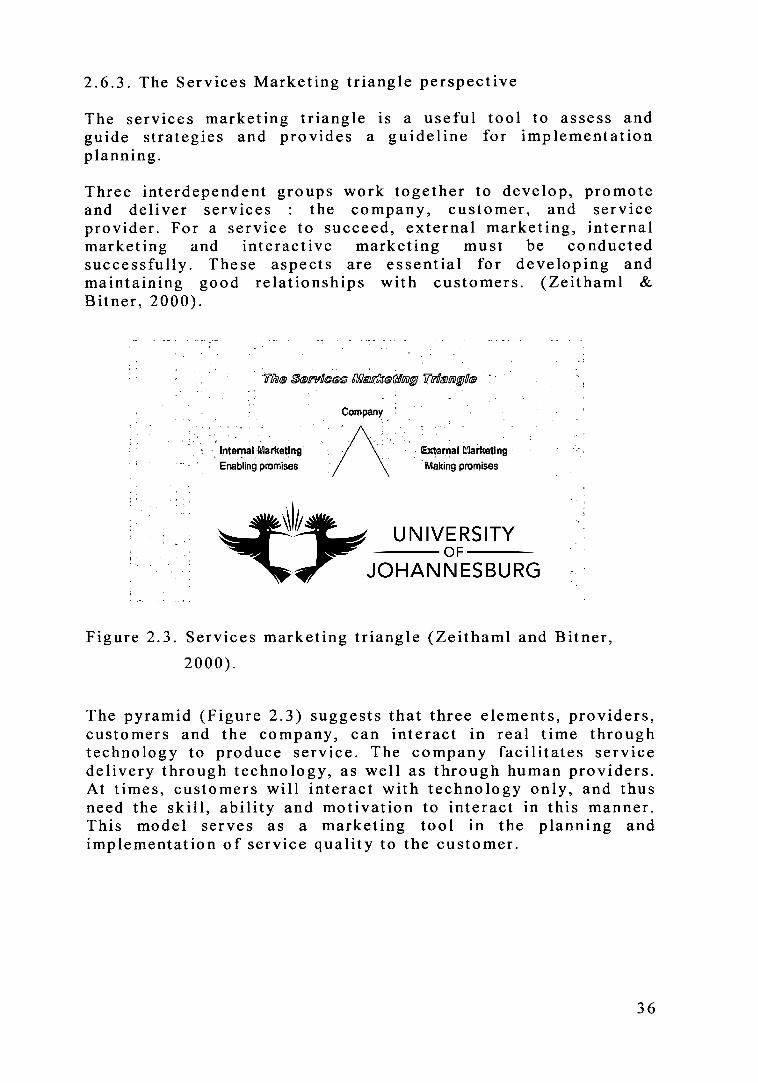
The Servibez INarfxotiVog Folsom'is
Company
Internal Marketing External Marketing
Enabling promises Making promises
Providers Customers
Interactive Marketing
Keeping promises
2.6.3. The Services Marketing triangle perspective
The services marketing triangle is a useful tool to assess and guide strategies and provides a guideline for implementation planning.
Three interdependent groups work together to develop, promote and deliver services : the company, customer, and service provider. For a service to succeed, external marketing, internal marketing and interactive marketing must be conducted successfully. These aspects are essential for developing and maintaining good relationships with customers. (Zeithaml & Bitner, 2000).
Figure 2.3. Services marketing triangle (Zeithaml and Bitner,
2000).
The pyramid (Figure 2.3) suggests that three elements, providers, customers and the company, can interact in real time through technology to produce service. The company facilitates service delivery through technology, as well as through human providers. At times, customers will interact with technology only, and thus need the skill, ability and motivation to interact in this manner. This model serves as a marketing tool in the planning and implementation of service quality to the customer.
36
According to Lovelock (1996), as cited in Bond (2001 : 14) the following five perspectives of quality exist :
.. The transcendent view of quality which is synonymous with innate excellence. It argues that people learn to recognise quality through repeated exposure.
.. The product-based approach views quality as a precise and measurable variable. This is an objective view that does not take into account differences in tastes and needs of customers.
The user-based definition argues that the customer decides on quality, and recognises that customers have different needs and desires.
The manufacturing-based approach is concerned primarily with quality regarding engineering and manufacturing practices.
Value-based definitions define quality according to price and value. Thus quality can be defined as "affordable excellence."
Cronin and Taylor (1992 : 55) argue that "service quality stems simply from perceptions of performance".
Teas (1993 : 18) maintains that
o "quality is not derived from a comparison of performance with ideal standards".
o "service quality is not only an overall attitude, but is also transaction specific".
Looking at customer satisfaction there are various arguments over whether customer satisfaction is an antecedent to service quality, or visa versa. Some authors support the argument that satisfaction leads to quality. (Asubonteng, et al., 1996 : 66).
Robinson (1999 : 23) supports the proposition that "quality leads to satisfaction".
37

2.6.4. The Kaizen perspective (Kai : change + Zen : good = improvement)
According to Wellington (1995 : 50) Kaizen has been called the single most powerful philosophy in Japanese management. And better customer service is probably the single most ubiquitous non financial objective of businesses and agencies of all types in the West.
At the same time, many conventional customer-care programmes are failing to provide satisfaction. Others provide satisfaction for a time, but do not have the flexibility and vision to go on satisfying the ever-increasing demands of customers.
These are the areas where a Kaizen approach can make a vital difference. A Kaizen approach, adapted to suit Western national and business cultures, takes a customer care strategy way beyond a cheery smile or even a genuine desire to please : it embeds attitudes within an organisation. The race to satisfy customers never ends-and neither do the benefits of the Kaizen approach.
In Japan, "the customer is god" is the sentiment which underpins the best companies customer care strategies. How does this compare with the West? What exactly makes excellent customer care? In the West, customer care, has become what one CEO called the "discipline of the decade".
But to what extent is the investment in customer service producing a real pay back for these organisations as intended ? Many customers are no longer seduced by the window dressing of some customer service programs.
This at least tells us how ubiquitous care programmes are; yet paralleling the ever increasing expectations seems to be a growing scepticism that they, customers, are the actual beneficiaries : it seems that greater efficiency is a euphemism for shareholder rather than customer satisfaction. Research (see, for example, "The Customer is Key") suggests that what customers want now is depth-substance the service they are promised; a feeling of complete comfort and delight from more than superficialities; a feeling that what they see is not a veneer but the wood from which the whole company is cut.
The adoption of Kaizen throughout a company can fulfill this customer desire. In a Kaizen company excellent customer care is a natural outcome of daily and long term practices, not a bolted on extra. Kaizen can minimise causes of customer dissatisfaction, lead to positive delight and, ultimately, to greater customer loyalty. (Wellington, 1995 : 53).
38

A company's product or service consists of a number of individual elements which separately and collectively directly influence customer satisfaction. Between them, the elements known as the Satisfaction Elements — represent every aspect in the factory to outlet cycle. The entire company is thus represented in them.
What are the elements to which I have referred? There are six, of which the Culture Element is the most influential for it is the origin of the values and belief systems that determine whom the company will serve - its directors, its shareholders or its customers. (Wellington, 1995 : 53).
2.7. Service quality measurement
2.7.1. The Research instrument used : SERVQUAL
The SERVQUAL authors, Parasuraman et al. (1988 : 30) state " it [the model] provides a basic skeleton ... when necessary, can be adapted or supplemented to fit the characteristics or specific research needs of a particular organization". It should be noted, however, that in 1991, they state: "Since SERVQUAL is the basic "skeleton" underlying service quality, it should be used in its entirety as much as possible. While minor modifications in the wording of items to adapt them to a specific setting are appropriate, deletion of items could affect the integrity of the scale and cast doubt on whether the reduced scale fully captures service quality".
A key difference with respect to the SERVQUAL instrument is the extent to which researchers have adhered to the 22-item format. Most researchers, even while commending SERVQUAL for its face and/or content validity, have added to, deleted from or amended the item content so as to make the questionnaire more relevant to a specific service situation.
2.8. Profile on the SERVQUAL pioneer : Parsu. Parasuraman
Professor Parasuraman has held the James W. McLamore Chair in Marketing at the University of Miami since 1994 prior to which he taught at Texas A&M University, the University of Northern Iowa and Indiana University.
39

Parsu Parasuraman has received numerous awards including, most recently, the Academy of Marketing Science's "Outstanding Marketing Educator" Award (2001), and the "Outstanding Research Award" of the School of Business Administration, University of Miami (2000). (www.emaraldinsight.com , 11/03/2002).
2.9. The SERVQUAL Model
Considerable research has been conducted on how consumers evaluate service quality performance. The most commonly accepted approach is the Gap Theory Model which defines service quality as the direction and magnitude of the difference between customers' expectations and perceptions of the service. This model has been used as an instrument of analysis in several companies. Based on research, SERVQUAL, a multiple item scale for measuring service quality, was developed. The 22-item questionnaire was based on five generic quality dimensions and had become the most popular measure of service quality.
Parasuraman et al. (1988, 1991) describe SERVQUAL as a concise multiple-item scale with good reliability and validity which offers a number of potential applications across a broad spectrum of services. It provides a basic skeleton through its expectations/perceptions format, encompassing statements for each of the five dimensions. This skeleton, the authors argue, can be adapted and supplemented to fit the needs of a particular organisation.
It can be used periodically to track customer perceptions of service quality relative to that of its competitors. The five-dimensional format of the model allows a firm to assess its level of service quality along each dimension, as well as overall. The instrument can also be used to categorise a firm's customers into several perceived quality segments (e.g. high, medium, low) on the basis of their individual SERVQUAL scores. These segments can then be compared and contrasted on characteristics such as demographic and psychographic variables so as to gain managerial insights. The instrument can also be used in multi-unit retail companies to track the level of service provided by individual stores and to group the stores into several clusters with varying quality images. An evaluation of store characteristics in the different clusters may reveal attributes that are critical for ensuring high service quality.
2.9.1. The development of SERVQUAL
According to Parasuraman et al. (1990 : 24) in developing SERVQUAL, our instrument for measuring customers' perceptions of service quality, we followed well established
40

procedures for designing scales to measure constructs that are not directly observable. We developed 97 items capturing the 10 dimensions of service quality identified in our exploratory phase. We then recast each item into a pair of statements — one to measure within the service category being investigated, and the other to measure perceptions about the particular firm whose service quality was being assessed.
A seven point scale ranging from 7 (strongly agree) to 1 (strongly disagree) accompanied each statement.
We refined and condensed the 97-item instrument through a series of repeated data collection and analysis steps. We performed this instrument purification to eliminate items that failed to discriminate well among respondents with differing quality perceptions about firms. We gathered data for the initial refinement of the 97-item instrument from a quota sample of 200 customers, divided equally between males and females. Included in the sample were recent users of one of the following five services : appliance repair and maintenance, retail banking, long distance telephone, securities brokerage, and credit cards. We converted the raw questionaire data into perception — minus -expectation scores for the various items. These difference scores could range from +6 to —6, with more positive scores representing higher perceived service quality. We analysed the difference scores using several statistical analyses. These analyses resulted in the ellimination of roughly two-thirds of the original items and the consolidation of several overlapping quality dimensions into new combined dimensions. To verify the reliability and validity of the condensed scale we administered it to four independent samples of approximately 190 customers each. We gathered data on the service quality of four nationally known firms : a bank, a credit card issuer, an appliance repair and maintenance firm, and a long distance telephone company.
Analysis of data from the four samples led to additional refinement of the instrument and confirmed its reliability and validity. The final instrument consists of 22 items, spanning the five dimensions of service quality described : tangibies, reliability, responsiveness, assurance and empathy.
Early research was about customer-perceived quality in four service industries : banks, credit card companies, stockbrokers, and service companies for household goods. They used focus group interviews with three groups in each industry and expressed the results of their findings as ten factors or dimensions, namely tangibles, reliability, responsiveness, competence, courtesy, credibility, security, access, communication, and understanding. (Parasuraman, et al., 1985 : 41).
41

In a later study Parasuraman reduced the number to five: tangibles, reliability, responsiveness, assurance (which consolidated the competence, credibility, courtesy and security attributes), and empathy (which consolidated the access, communication and understanding attributes).
Tangibles refer to the physical environment in the service organisation: facilities, equipment, staff and their dress, i.e. concrete objects which the customer can easily observe.
Reliability is the company's ability to perform the promised service. Price agreements and other conditions should be fulfilled, time limits kept and the service performed accurately from the start.
Responsiveness entails performing the services promptly and quickly, helping the customer and being available when he or she needs help.
Assurance covers the knowledge and competence of the staff and their ability to elicit trust and confidence.
Empathy was defined as 'caring, individual attention the firm provides to its customers.
2.9.2. Why was SERVQUAL used ?
In all the academic sources that were consulted on service quality, the SERVQUAL model/instrument was mentioned as the fundamental most appropriate method and instrument available to measure service quality. (van der Wal, et al., 2002 : 325).
2.9.3. Where has SERVQUAL been used ?
TECHNIKON WITWATERSRAND
2.9.3.1. SERVQUAL in a retail setting LIBRARY
An examination of the usefulness of SERVQUAL in a retail setting was conducted by Finn and Lamb (1991 : 18). The researchers posited that if the SERVQUAL scales possess construct validity (i.e. if the 22 items in the model measure the five dimensions) in a retail setting, then a survey of retail store customers should produce results that conform to the model.
2.9.3.2. SERVQUAL in an international recreational service - setting
Taylor et al. (1993 : 68) tested the applicability or `generalisability' of the SERVQUAL model using 'confirmatory factor analysis' (Lisrel VII). The study comprised of the following three steps:
42

Confirming the dimensionality and reliability of the original SERVQUAL scale versus importance weighted SERVQUAL. Assessing the performance of the summed—and—averaged dimensions of the SERVQUAL scale. Assessing the influence of service quality on consumer satisfaction.
2.9.3.3. SERVQUAL in retail banking
A study conducted by Blanchard and Galloway (1994 : 5) sought to determine the perceptions of both customers and staff of the requirements of a quality service in retail banking. The gap model and the SERVQUAL model developed by Parasuraman et al. (1985, 1988) were identified as being the most appropriate for modelling the data, but found that, although the service gap model provides an excellent basis for analysis, the SERVQUAL model was of limited value in this specific context due to specific processes being more important than outcome in determining customer perception of service quality.
2.9.3.4. SERVQUAL in the steel industry
Sinha et al. (1999 : 1) applied SERVQUAL to the Indian steel industry where excess capacity, newer technology and cheaper imports compete for customers. The use of customer service to retain and acquire customers, providing strategic advantage, for steelmakers was explored.
The study identified that as technology-based competitive advantage requires very high investment with sustainability concerns. The strategy for sustainable advantage in steel rests on augmentation through service.
2.9.4. What does SERVQUAL identify ?
Parasuraman et al. (1985) developed a model which depicts how various gaps in the service process may affect the customer's assessment of the quality of the service. (Refer to Figure 2.4). The model is useful in assisting managers and staff to examine their own perceptions of quality and to recognise how much they really understand the perceptions of customers as follows :
2.9.4.1. Customer expectations (Gap 1)
Knowing what customers expect is the first and possibly the most critical step in delivering quality service. Stated simply, providing services that customers perceive as excellent requires that a firm know what customers expect. Being a little wrong can mean expending money, time and other resources on things that don't count to customers. Being a little wrong can even mean not
43

surviving in a fiercely competitive market. (Parasuraman, et al., 1990: 51).
Gap 1 is the difference between the customer's expectations and management perceptions of customer expectations. Management does not understand how the service should be designed and what support or secondary services the customer requires, i.e. what the right quality for the customer is.
2.9.4.2. Service Quality standards (Gap 2)
Once managers accurately understand what customers expect, they face a second critical challenge : using this knowledge to set service-quality standards for the organisation. Management may not be willing (or able) to put the systems in place to match or exceed customer expectations. A variety of factors including resource constraints, short term profit orientation, market conditions or management indifference may account for this. (Parasuraman, et al., 1990 : 51).
Gap 2 is the difference between the company's quality specifications and management perceptions of customer expectations of the service and its quality. Often in an attempt to reduce costs, management places internal restrictions on how a service is to be performed, restrictions which deprive the staff of the opportunity to meet the customer's expectations.
2.9.4.3 Service performance (Gap 3)
The difference between service specification and the actual service delivery is the service performance gap : when employees are unable and/or unwilling to perform he service at the desired level. Organisations offering services that are highly interactive, labor intensive and performed in multiple locations are especially vulnerable to Gap 3. Opportunities for mistakes and misunderstandings exist when service providers and customers interact : both customers and providers experience and respond to each other's mannerisms, attitudes, competencies, moods, and language. Greater variability is also more likely in labor intensive services than when machines dominate service delivery. Bank customers who use human tellers experience greater variability than when they use automatic teller machines. Service quality suffers when employees are unwilling or unable to perform at the level required. Maintaining service quality, then, depends not only on recognising customers desires and establishing appropriate standards but also on maintaining a workforce of people both willing and able to perform at specified levels. (Parasuraman, et al., 1990: 89).
44

Gap 3 is the difference between the quality of the service delivery and quality specifications. Even if the quality of the service is carefully specified in a company, the result in practice may be different from what was intended. Service quality is difficult to standardise since it is often dependent on personal contact between the customer and company staff.
2.9.4.4. What gets promised versus what is delivered (Gap 4)
Accurate and appropriate communication about services is the responsibility of both marketing and operations : marketing must accurately (if compellingly) reflect what happens in actual service encounters; operations, in turn, must deliver what is promised in communications. If advertising, personal selling, or any other external communication sets up unrealistic expectations for customers, actual encounters disappoint them.
Discrepencies between service delivery and external communications, in the form of exaggerated promises and/or the absence of information about service delivery aspects intended to serve customers well can powerfully affect consumers perceptions of service quality.(Parasuraman, et al., 1990: 115).
Gap 4 is the difference between the quality of the service delivery and the quality promised in communicating the product/service. It is important not to promise the customer more than the company can deliver. At the same time, it is important for the company to inform customers about the efforts being made to elevate the quality, which would otherwise not be visible to the customer.
2.9.4.5. The difference between expected and perceived service quality (Gap 5) according to customers
Gap 5 is the most crucial gap because it indicates the difference between expected and perceived service quality. This gap is a function of the other four gaps : i.e. Gap 5 = (gaps 1, 2, 3, 4).
The gap model is basically customer-oriented. Quality is realised by the customer after the service has been received and it relates to the difference between expected and perceived quality. The model is also process-oriented because it identifies the gaps that may arise in various parts of the service process, which eventually affect the difference between the customer's expected and perceived quality. The model is thus based on what is known as the `disconfirmation of expectations paradigm' in services marketing literature.
45

a mouth oommunkaticm
i■eireamal nozda
Pciat, escip_grIkence
CUSTOMER
MARKETER
Tiaiattiook ptircoptions. IMO (KtiwItV
Miiiii4manto**0.itaits 0144iiiiturnezOtp¢:ctittsiiis
'Pit91r01 iii tayriWitthitions ier-conalur iti
In addition Figure 2.5. shows a further development of the original gap model. This new model illustrates the inter-organisational factors that affect the different gaps. It thereby facilitates an analysis of what caused the gaps and how they can be reduced.
I. The Cap Modetlearasurarnan, Zeithaml de Ocnry MSS)
Figure 2.4. The SERVQUAL model (Parasuraman, et al., 1985 : 41).
46

Minj4"/16gal
=UpviggticommonitOon
= grianaigout
-co'intentinent: irrazrvico-
• ..
fOirritk .ti
amts giti
Figure 2. Extension or the Gap Motteti (Farasuranlan, Zeitharni & Benry 1 91313)
Figure 2.5. The SERVQUAL model extended (Parasuraman, et al., 1985 : 41).
2.9.5. What does SERVQUAL measure ?
There are two parts to the measuring process: the first step is to establish the customers' perception of an ideal service and the second step is to measure the customers' perception of the services provided by a specific company. Perceived service quality is described as the degree and direction of discrepancy between customers' perceptions and expectations. Consequently, SERVQUAL was developed to measure the 'gap' between expected service and perceived service. This gap corresponds to `Gap 5' in the gap model described earlier.
47

1fr/ ,1\
The measuring procedure requires the customers to react to 22 statements based on the five quality dimensions. Each of the 22 items was recast into two statements - one requiring respondents to identify what company's 'should provide'; the other what the customer perceived the company 'did provide'. There are four or five statements for each quality dimension. Figure 2.6. illustrates the five dimensions.
:sliitvcmtlin
SERVOUAL SURVEY ITEMS
Mal VAIRIANOiS iligutv 3: Service co Any 4s:conceptualised lay. P4 ra.sumatnan et ai..(988)
Figure 2.6. The five dimensions of service quality (Parasuraman, et al., 1988 : 20).
2.9.6. How does SERVQUAL measure ?
The respondents are requested to react to the statements on a Likert scale with seven intervals ranging from 'strongly agree' to `strongly disagree', but with no verbal descriptions for points 2-6. First the expected quality is measured and then the perceived quality. In the first measurement the seven-grade scale produces an 'ideal profile' for each dimension. The profile of customer perceived quality obtained in the second measurement can then be contrasted with the 'ideal'. Deviations between expected quality and perceived quality can then be studied - gap scores or Perceived versus Expected scores (P-E) could be computed and used in further analysis.
48

Thus, a SERVQUAL score is computed as follows:
SERVQUAL score = Perception score - Expectation score
The variables which show the biggest deviations and the customers see as the most important when assessing quality provide guidelines for quality improvement.
It is important to note that Parasuraman et al. (1988) describe this gap as a measure of service quality as distinct from the measures of satisfaction, on the basis of the nature of the expectations included and the timing involved. In other words, perceived service quality is a 'global judgement or attitude relating to the superiority of the service', whereas measures of satisfaction relate to a service encounter. (www.sabusinessreview.co.za , 22/04/2002).
The authors further propose that a company's average service quality along each of the five dimensions can be derived by averaging the SERVQUAL scores across the items on each dimension. Therefore, an overall global service quality score can be obtained by averaging the dimension scores.
To this point the scores are unweighted for relative importance of the different dimensions. Zeithaml et al. (1990) extended the theory to suggest that weighted SERVQUAL scores can also be derived by including importance items that correspond to the original items. The weighted SERVQUAL score is computed as follows:
SERVQUAL score = (Perception score - Expectation score) X Importance score
A revision of SERVQUAL was presented by Parasuraman et al. (1991) which introduced a number of changes. The original SERVQUAL included negative statements that were subsequently deleted since several researchers experienced problems with these measures (e.g. Carman 1990 ; Babakus & Mangold 1992).
Babakus and Boller (1992 : 253) argued that the negatively worded items could be responsible for the factor structure proposed by Parasuraman et al. (1988). A further change focused on the expectations element where respondents were now required to indicate what an 'excellent service would provide' rather than what 'firms in the industry should provide'. Some of the 22 items were changed and/or replaced and minor wording changes were also made.
49

2.10. Developments in SERVQUAL
2.10.1. Berry, Parasuraman & Zeithaml (1988)
"In summary, SERVQUAL has a variety of potential applications. It can help a wide range of service and retailing organisations in assessing consumer expectations about and perceptions of service quality. It can also help in pinpointing areas requiring managerial attention and action to improve service quality. In addition, we hope the availability of this instrument will stimulate much needed emperical research focussing on service quality and its antecedants and consequences". (Parasuraman, et al., 1988 : 36).
2.10.2. Berry, Parasuraman & Zeithaml (1990)
The model was refined again by Parasuraman et al. (1990) based on a number of subsequent studies. This refinement resulted in the addition of a section measuring the importance of each dimension to the customer. (Bond, 2001 : 28).
2.11. Critiques of SERVQUAL
Several researchers have questioned the extent to which the model is generic to all industries, and similarly, have failed to identify its five underlying dimensions. Other issues vital to the consumer's evaluation of the service are not addressed by the model. Some researchers have also questioned the relevance of expectations in the model as well as the timing and frequency of administration. Others have argued against the use of difference scores which has led to psychometric problems in the model. The P-E formulation has been shown to be problematic in that the scores are usually negative, which questions the current base employed by SERVQUAL, and the reasons why positive scores might be obtained.
The use of a midpoint scale in the model also has its shortcomings.
The SERVQUAL model remains an issue of debate in contemporary services marketing literature. Some researchers have recommended the abandonment of the model altogether, while others continue to modify or extend the model in their applications. Despite its criticisms, the groundbreaking work of Zeithaml et al. (1990) has paved the way for a deeper understanding of service quality and the eventual development of an important measurement tool.
50
2.11.1. Conceptual and operational issues regarding SERVQUAL.
Teas (1993), as cited in Bond (2001 : 38), examined conceptual and operational issues regarding the SERVQUAL model.
The objectives of this study included examining and identifying conceptual problems of the "perceived-service, expected-service" (P-E model), to review research identifying validity problems regarding the operationalisation of the P-E framework, to empirically test the problems associated with the P-E model, and finally, to explore the implications of the study. For this study Teas (1993) collected data from a random sample of 120 respondents. Teas (1993) concluded that this study identified problems with respect to the conceptual and operational definitions of the expectations. These problems subsequently create ambiguity regarding the interpretation and theoretical justification of the P-E model. Teas (1993) also identified that expectation measures lack discriminant validity in terms of the concepts of performance forecasts, attribute importance and classic attribute ideal points. Teas (1993 : 31) argued that "a considerable portion of the variance in the SERVQUAL expectations measures may be caused by respondents' misinterpretations of the question rather than to different attitudes or perceptions." (Bond, 2001 : 38).
2.11.2. Practical and diagnostic value of SERVQUAL
Smith (1995) as cited in Bond (2001 : 39) questions whether the practical and diagnostic value of SERVQUAL is, in fact, superior to other methods of evaluation. Smith (1995 : 270) examined literature on the SERVQUAL model and concluded that: "The conceptual, methodological and interpretative problems which have been identified with respect to SERVQUAL suggest that the instrument is now of questionable value for either academics or practitioners".
The fact that many researchers have altered the basic 22 statements, for their particular studies, leads Smith (1995) to conclude that the applicability of the instrument is not generic across a broad spectrum of service industries.
At this point the words of Parasuraman et al. (1990 : 175) should be noted :
"We have designed the instrument to be applicable across a broad spectrum of services. As such it provides a basic skeleton through its expectations/perceptions format encompassing statements for each of the five service quality dimensions (tangibles, reliability, responsiveness, assurance, and empathy.) The skeleton, when necessary, can be adapted or supplemented to fit the characteristics or specific research needs of a company."
51

Smith (1995) argues that the SERVQUAL model fails to address three issues that are significant in a consumer's evaluation of a service, they are: the price/quality or value relationship, the service outcome, and the need to recognise the multifaceted nature of many services.
Smith (1995) questions the need for measuring expectations as research suggests that the perceptions measure alone can predict overall measures of service quality, as effectively as perception-expectation scores. In conclusion Smith suggests that the debate over service quality and its constructs, and the measurement of service quality will continue. This is due in part to the centrality of customer satisfaction to marketing, and the impact of service quality on the marketing industry. (Bond, 2001 : 39).
2.11.3. Operational and theoretical flaws of SERVQUAL
Buttle (1996), as cited in Bond (2001 : 40), argues that "both operational and theoretical flaws exist regarding the use of the SERVQUAL instrument for measuring and managing service quality".
Buttle (1996) raises several operational concerns:
Two administrations of the instrument, one for expectations and
a second for perceptions, causes boredom and confusion among
respondents.
Consumers do not only use expectations to evaluate service
quality; furthermore, SERVQUAL does not measure absolute
service quality expectations.
Four or five items are insufficient to capture the variability
within each of the five service quality dimensions.
Customers' assessments of service quality may vary over time
depending on different 'moments of truths'. Customers evaluate
service quality by multiple encounters with the service
company.
The instrument contains both negatively and positively worded
52

statements; this can cause data quality problems.
The seven-point likert scale is flawed. This argument is
supported by Lewis (1993) and Babakus and Mangold (1992),
as cited in Buttle (1996).
Buttle (1996) argues that "theoretical flaws exist in the SERVQUAL model". These are as follows :
SERVQUAL is based on a disconfirmation paradigm. Buttle
quotes Cronin and Taylor (1992, 1994) in her argument that
perceived quality is best conceptualised as an attitude.
Customers do not necessarily assess service quality in terms of
the gap between perceptions and expectations.
SERVQUAL does not focus on the outcomes of the service
encounter, but rather on the process of service delivery.
The SERVQUAL dimensions are not universal and there are
different numbers of dimensions depending on the context of the
study.
Buttle (1996) concludes that, in view of the criticisms levelled at the SERVQUAL model, there is still a need for fundamental research. (Bond, 2001 : 41).
2.11.4. Reliability and validity of SERVQUAL measures
Asubonteng et al. (1996), as cited in Bond (2001 : 41), provides a review of SERVQUAL research, focussing on two areas, the definition and measurement of service quality, and the reliability and validity of SERVQUAL measures. Asubonteng et al. (1996) states that there are two areas of disagreement in the studies reviewed by them. The first is the proposed linkage between quality and satisfaction. Asubonteng et al. (1996) cite Bowers et al. (1994) who suggest that satisfaction and quality are determined by the same attributes. Asubonteng et al. (1996) cite Bitner (1990) who supports the argument that satisfaction leads to quality. Asubonteng et al. (1996) then cites Woodside et al.
53

(1989) who supports the proposition that quality leads to satisfaction. The second area of disagreement concerns the dimensions of service quality. Some studies have found fewer than five dimensions, whilst others have found more.
Asubonteng et al. (1996) quotes eleven studies which validate the internal reliability of the scale items, and one study which reports inadequate reliability within one of the dimensions. Asubonteng et al. (1996 : 66) also cite Babakus and Boiler (1992) and Carman (1990) who suggest that the re-wording of negatively stated items into positively stated items, would improve the overall reliability of the SERVQUAL model.
Discriminant validity is questioned by Asubonteng et al. (1996) as most studies they reviewed indicated a greater overlap among the SERVQUAL dimensions, than was implied in the original study. Asubonteng et al. (1996) suggest that SERVQUAL is a valuable management tool and that managers should be aware of the criticisms of the model and incorporate them into their use of it. (Bond, 2001 : 42).
2.11.5. The dimensions of service quality
Mets et al. (1997) as cited in Bond (2001 : 43) considered the five-factor structure as proposed by Parasuraman et al., (1988). The results indicated that the five-factor could not be replicated for any of the samples. Alternative solutions, ranging from two-factor to six-factor solutions, were considered. Mets et al., (1997) suggested that a two-factor solution was the most interpretable structure for all five samples.
These results support the proposition that service quality perceptions are largely determined by two dimensions. It suggests that SERVQUAL scores are measures of two factors, namely `intrinsic' and 'extrinsic' service quality.
2.11.6. The efficiency of the SERVQUAL instrument as a measurement of service quality
Robinson (1999), as cited in Bond (2001 : 43), reviews the debate of the efficiency of the SERVQUAL instrument as a measurement of service quality and identifies the key areas of agreement and disagreement. The purpose of measuring service quality is debated, Robinson (1999 : 22) cites Cronin and Taylor (1992) who place emphasis on the predictive validity of a measurement
54
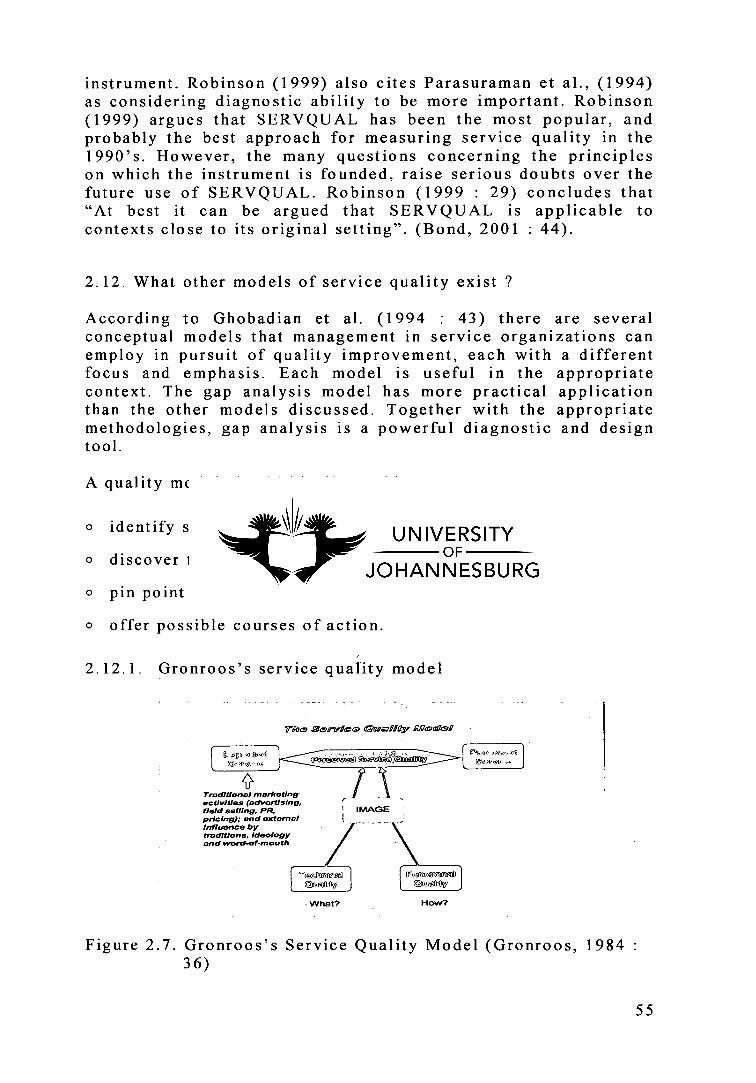
What? How?
Traditional marketing activities (advertising, r field selling, PR, 1 IMAGE pricing); and external _ Influence by traditions, Ideology and word-of-mouth
0416, '4
Ve.,17 ■61.1,
instrument. Robinson (1999) also cites Parasuraman et al., (1994) as considering diagnostic ability to be more important. Robinson (1999) argues that SERVQUAL has been the most popular, and probably the best approach for measuring service quality in the 1990's. However, the many questions concerning the principles on which the instrument is founded, raise serious doubts over the future use of SERVQUAL. Robinson (1999 : 29) concludes that "At best it can be argued that SERVQUAL is applicable to contexts close to its original setting". (Bond, 2001 : 44).
2.12. What other models of service quality exist ?
According to Ghobadian et al. (1994 : 43) there are several conceptual models that management in service organizations can employ in pursuit of quality improvement, each with a different focus and emphasis. Each model is useful in the appropriate context. The gap analysis model has more practical application than the other models discussed. Together with the appropriate methodologies, gap analysis is a powerful diagnostic and design tool.
A quality model should ideally enable management to :
identify sources of quality;
discover the quality problems;
pin point the causes of the observed quality problem;
offer possible courses of action.
2.12.1. Gronroos's service quality model
771717c5. Senrcrica, (Mailman, RgrocIca
Figure 2.7. Gronroos's Service Quality Model (Gronroos, 1984 : 36)
55
According to Ghobadian (1994 : 6) Gronroos argued that "service quality" comprises of three dimensions. These are:
The technical quality of outcome. That is to say, the actual outcome of the service encounter. The service outcome can, often, be measured by the consumer in an objective manner. An example of service outcome, in the case of a car repair garage, is the availability of the car at the agreed time, its tidiness, and its mechanical condition.
The functional quality of the service encounter. This element of "quality" is concerned with the interaction between the provider and recipient of a service and is often perceived in a subjective manner. Returning to the car repair garage example, this element of service quality is concerned with : the courtesy shown to the customer; physical circumstances of the reception area; amount of explanation provided in terms of what needs to be done; contacting the customer if the car is not going to be ready at the agreed time, or if additional expensive work is required.
The corporate image. This is concerned with consumers' perceptions of the service organization. The image depends on: technical and functional quality; price; external communications; physical location; appearance of the site; and the competence and behaviour of service firms' employees.
Gronroos (1984 : 36) stated that a model of service quality was needed, that is , " a model which describes how the quality of service is perceived by customers". A report was presented with the purpose of developing a service quality model. Gronroos (1984) stated that a consumer would compare his expectations of a service with his perception of received service, this process would result in the perceived quality of the service. Gronroos (1984) proposed that quality of service was dependent on these two variables, and further proposed it necessary to know what resources and activities, within and outside the control of a company, have an impact on these variables.
The model was tested in 1981 on a sample of service business executives, across a wide spectrum of service industries. As a result of this study Gronroos (1984) concluded that perceived service quality is measured by the gap between expected service and perceived service. Perceived Service Quality is impacted by three variables: technical quality, functional quality and company image.
Functional quality seems to be a very important dimension of the perceived service, in some cases more important than technical
56
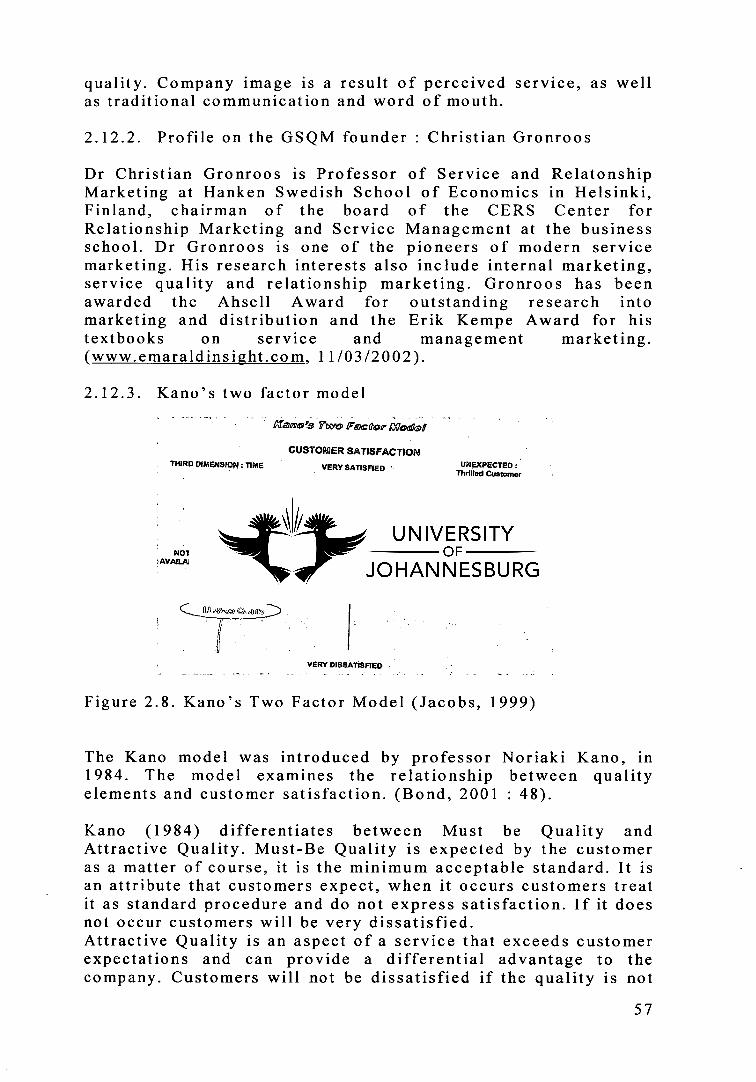
HIGH DEGREE OF AVAILABILITY
NOT ?AVAILABLE
EXPECTED: Customer has no comment
UNEXPECTED: Thrilled Customer
THIRD DIMENSION : 71PRE
CUSTOMER SATISFACTION
VERY SATISFIED
A"'` ° ̀ .toP 2
quality. Company image is a result of perceived service, as well as traditional communication and word of mouth.
2.12.2. Profile on the GSQM founder : Christian Gronroos
Dr Christian Gronroos is Professor of Service and Relatonship Marketing at Hanken Swedish School of Economics in Helsinki, Finland, chairman of the board of the CERS Center for Relationship Marketing and Service Management at the business school. Dr Gronroos is one of the pioneers of modern service marketing. His research interests also include internal marketing, service quality and relationship marketing. Gronroos has been awarded the Ahsell Award for outstanding research into marketing and distribution and the Erik Kempe Award for his textbooks on service and management marketing. (www.emaraldinsight.com , 11/03/2002).
2.12.3. Kano's two factor model
Pfanots FIX10 Factor &bead
VERY DISSATISFIED
Figure 2.8. Kano's Two Factor Model (Jacobs, 1999)
The Kano model was introduced by professor Noriaki Kano, in 1984. The model examines the relationship between quality elements and customer satisfaction. (Bond, 2001 : 48).
Kano (1984) differentiates between Must be Quality and Attractive Quality. Must-Be Quality is expected by the customer as a matter of course, it is the minimum acceptable standard. It is an attribute that customers expect, when it occurs customers treat it as standard procedure and do not express satisfaction. If it does not occur customers will be very dissatisfied. Attractive Quality is an aspect of a service that exceeds customer expectations and can provide a differential advantage to the company. Customers will not be dissatisfied if the quality is not
57

ii r '
• 1.
!!1 ';:! ■ !1
)i •;'
1 ') 4r-14443.' 1.
_ ,
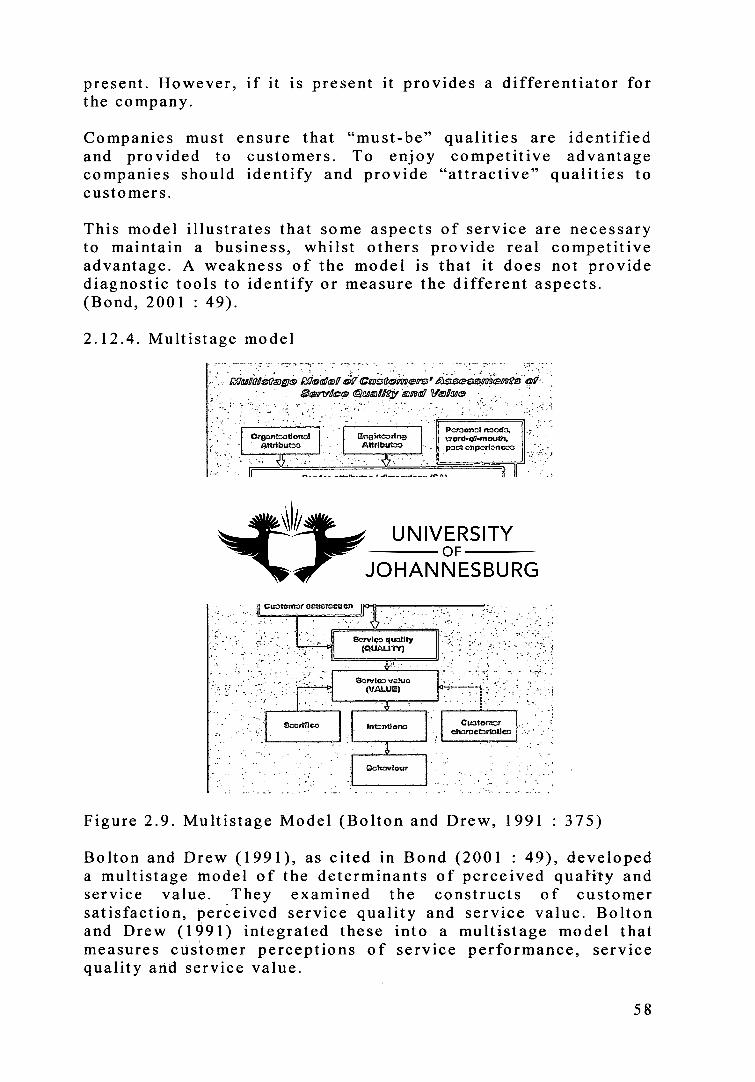
present. However, if it is present it provides a differentiator for the company.
Companies must ensure that "must-be" qualities are identified and provided to customers. To enjoy competitive advantage companies should identify and provide "attractive" qualities to customers.
This model illustrates that some aspects of service are necessary to maintain a business, whilst others provide real competitive advantage. A weakness of the model is that it does not provide diagnostic tools to identify or measure the different aspects. (Bond, 2001: 49).
2.12.4. Multistage model
- ,
lag1-67:a0mecir_INtroideff cif" Crsa-z.-24morzi A.6-9.2ipevii-onez • - Cervffeco emalleif maraff Magma
Pcratotal reaccla, Organtaational Ermine:ado)) vrord•of-rnotstit,
AttribuMa Attribu= pact oaparionoca
EL-mica attriltua I dlotarialono (SA)
Percaptiona of corlorntanco loyalo for
co jita 12ERF C>RL)11_,_
1 Diaconfirt=tion (ESISCOFt7011:1)
i • Cuatontar aatisfacticri
ExigtoctatIona (EXPECT)
Scrvico quality (QUALITY)
Soryica ooluo (VALUE)
S=riVico
IntantIona
Cuattior charactirlatiaa
Schawlow
Figure 2.9. Multistage Model (Bolton and Drew, 1991 : 375)
Bolton and Drew (1991), as cited in Bond (2001 : 49), developed a multistage model of the determinants of perceived quality and service value. _They examined the constructs of customer satisfaction, perceived service quality and service value. Bolton and Drew (1991) integrated these into a multistage model that measures customer perceptions of service performance, service quality and service value.
58

Bolton and Drew (1991 : 37) argue that "A customer's global assessment of a service can be decomposed into a series of interrelated stages : assessments of performance, service quality and value". Whilst this study did not measure expectations concerning service quality dimensions (as SERVQUAL does), it did measure that disconfirmation is a key determinant of overall service quality.
2.12.5. SERVPERF model
Figure 2.10. SERVPERF Model (Cronin and Taylor, 1992 : 55)
Cronin and Taylor (1992), as cited in Bond (2001 : 51), developed the SERVPERF model in response to the SERVQUAL model proposed by Parasuraman et al. (1988).
Cronin and Taylor (1992 : 55) argued that "....the current conceptualisation and operationalisation of service quality (SERVQUAL) is inadequate".They further argue that little evidence exists to support the expectations minus performance gap as an adequate measure of service quality. Carman (1990: 49) supports this argument.
Cronin and Taylor (1992 : 55) suggest that considerable support exist for the superiority of simple performance-based measures of service quality. They cite Bolton and Drew (1991); Churchill and Suprenant (1982); Maziset et al. (1975); and Woodruff et al. (1983) in support of this argument.
The SERVPERF model is based on a simple equation : Service Quality = Performance. Thus the assesment of a company's performance by it's customers results in an efficient measure of service quality.
2.12.6. Batho Pele principle
59

The Batho Pele principle was proposed by Zola Skweyiya, the South African Minister for Public Service and Administration. It is a national framework for service. The guiding principle of the public service transformation model is "service to the people" Skweyiya (1997 : unpublished).
This model is the beginning of the process of introducing service quality into the public services sector. It is, at this stage, more of a philosophy than a service quality model. The model outlines eight principles for service delivery. (Bond, 2001 : 52).
Batho Pele is a Sesotho phrase meaning 'People First', committing the public service to serve all the people of South Africa. The Batho Pele values and principles underpin the country's coat of arms. On 1 October 1997, the public service embarked on a Batho Pele campaign aimed at improving service delivery, to the public. For this new approach to succeed some changes need to take place. Public service systems, procedures, attitudes and behaviour need to better serve its customers — the public. Batho Pele is a commitment to the following values and principles :
Regular consultation with customers about the quality of services provided.
Setting service standards specifying the quality of services that customers can expect.
Increasing access to services especially to those disadvantaged by racial, gender, geographical, social, cultural, physical, communication, and attitude related barriers.
Ensuring higher levels of courtesy by specifying and adhering to set standards for the treatment of customers.
Providing more and better information about services so that customers have full, accurate, relevant and up-to-date information about the services they are entitled to receive.
Increasing openess and transparency about how services are delivered, the resources they use and who is in charge.
Remedying failures and mistakes so that when problems occur, there is a positive response and resolution to the problem.
Giving the best possible value for money so that customers feel their contribution to the state through taxation, is used
60

Identity quality problems Provide staff and
financial resources Integrate quality improvement
with other corporate programmes
Emphasize importance of quality improvement efforts
Define external and Internal customers
Identify expectations
Assess magnitude of quality problems
Identity causes of low quality Estimate cost of low
service quality
Step 1
Obtain management commitment
Stop 6
Monitor performance
Assess effectiveness of quality improvement
Revise standards and plans Identify changes in customers
Step 2
Identity customer
expectation
Step 5
Implement strategy
Change culture Improve performance
Reduce costs
Step 3
Evaluate performance
Step 4
Develop quality
strategy
Commitment statement Quality obiectives Quality standards
Quality action plans Monitoring systems
effectively and efficiently and savings are ploughed back to further improve service delivery.
Batho Pele is about eliminating systems that were not designed first. It is also about making financial planning is in line priorities.
wasteful and expensive internal to put the needs of the people sure that the Public Service's with the public's needs and
Most of the improvements that the public would like to see cost nothing. Things such as: a smile, treating customers with respect and being honest when providing information and apologising if things go wrong. These are not a matter of additional resources -they are a matter of adopting different standards of behaviour. Improving service delivery is about re-aligning everything we do to 'customer service' principles. The implementation of Batho Pele is not a once-off task. It is a continuous, dynamic process, that will go on for many years, gathering momentum all the time. (www.gov.za , 19/03/2002).
2.12.7. The Organisational Service Quality Improvement model
Figure 2.11. Organisational Service Quality model (Ghobadian, 1994 : 43).
61

Professional judgement
Physical process
People behaviour
Physical facilities, process and procedures: Location, layout
Size, decor Facility reliability
Process flow, capacity balance, control of lbw Process flexibility Timeliness. speed
Range of services offered Communication
People's behaviour and conviviality: Professional judgement: Timeliness, speed Diagnosis
Communications (verbal. non-verbal) Advice, guidance, innovation Warmth. friendliness, tact, attitude, tone of voice Honesty, confidentiality
Dress, neatness, politeness Flexibility, discretion Attentiveness, anticipation Knowledge. skill
Handling complaints, solving problems
Key: Short contactnnteraction intensity - low customization, for example, utilities Medium contact/interaction intensity - low customization, for example, theme parks High contactimteraction intensity - low customization, for example, education Low cordact/interaction intensity - high customization, for example, stockbroking High contact/interaction intensity - high customization, for example, medical or design services
Moore (1987) proposed a model consisting of six steps. Figure 2.11. depicts this model and the pertinent factors at each step. The model is prescriptive and provides a route map of how to launch a "quality" drive. It has an external focus, but does not explicitly relate quality problems to the lack of proper market focus. The model also fails to provide a mechanism for identifying the likely areas in which "quality" problems might arise. Steps 2, 3 and 4 are the key components of the model. The key output of step 4 is the "quality action plan". The plan typically will include: (a) an objective statement; (b) an order of priority; (c) a description of the proposed improvement activities; (d) an implementation schedule; and (e) a list of required resources. The proposed monitoring system should attempt to measure both internal and external customer satisfaction. This model provides a framework for addressing broad organizational quality issues. (Ghobadian, et al., 1994 : 43).
2.12.8. Service Quality Trade-off Continuum model
Figure 2.12. Service Quality Trade-off Continuum model (Ghobadian, 1994 : 43).
62

According to Ghobadian (1994 : 43) Haywood-Farmer (1988) argued that a service organization has "high quality" if it meets customer preferences and expectations consistently. The key element in the attainment of "high quality" is the identification of customers' service requirements and expectations. He suggested that the separation of attributes into groups is the first step towards the development of a service quality model. In general, services have three basic attributes: (a) physical facilities, processes and procedures; (b) people's behaviour and conviviality; and (c) professional judgement. Each attribute consists of several factors. In this model, each set of attributes forms an apex of the triangle as shown in Figure.2.12. The management's task is to identify where the organization is located in this nexus. This will enable them to provide a service whose elements are internally consistent and focused on meeting the needs of a specific segment of the target market. In deciding the appropriate position of the service, management needs to consider three "operational" factors. These are: (a) the degree of service customization; (b) the degree of labour intensity; and (c) the degree of contact and interaction. The model put forward by Haywood-Farmer is helpful in terms of identifying the quality trade-offs and the links between "quality" and "operational" factors. The model has the potential to enhance understanding, but it does not offer a practical procedure capable of helping management to identify service quality problems or practical means of improving service quality. Figure 2.12. also shows the likely position of several different organizations on this three-dimensional nexus. In the case of utilities, the important determinant of quality is the physical process; for example, reliability of facilities, capacity balance, control of flow, and timeliness. People behaviour is also important. By identifying their organizations position on the continuum, management will be able to implement more effective quality improvement processes. (Ghobadian, et al., 1994 : 43).
63

2.12.9. The Modified Service Journey model
Figure 2.13. The Modified Service Journey model (Ghobadian, et al., 1994 : 43).
According to Brown (1989 : 53) it is generally recognized that consumers evaluate the service they receive, and their expectations are critically important in determining whether or not they are satisfied. Consequently, the question of how expectations are formed is vital to the provision of quality service. Nash (1988) suggested a model based on the "service journey" idea. Figure 2.13. depicts the typical stages of a "service journey". The experience at a given stage and the expectations formed prior to purchase help to shape the expectations for the next stage. "Service journey" is initiated by "need". Purchase will occur if there is a match between consumers' "need" and the perceived service "offering". Accurate communications and reputation are the key determinants for the consumers' selection of the provider. Promotion and prior communication also influences perceptions at the "participating", "leaving", and "reflecting" phases of the "service journey". (Ghobadian, et al., 1994: 43).
64

[ selection
`
E
Point of
entry
H Follow-up I Response time
Delivery H
Point of
impact
Point of
departure
2.12.10. The Customer Processing Operations model
Figure 2.14. The Customer Processing Operations model (Ghobadian, et al., 1994 : 43).
According to Ghobadian et al. (1994 : 43) the model proposed by Johnston (1988) is based on the same premise. This model is depicted in Figure 2.1.4.. The model identifies the important points prior to, during, and at the end of the service delivery where experiences at each point shape expectations for the next stage. Customers' expectations are dynamic and influenced at each stage of delivery by different factors. These two models are useful because they help the management to identify areas that influence customers' perceptions of "service quality" and where they need to concentrate their quality control and improvement efforts. The focus of these models is predominantly internal rather than external. They view quality from the "operations" and "customer processing" points of view. However, they do not offer practical means for improving service quality. (Ghobadian, et al., 1994: 43).
65

Internal operations:
Staff Process Systems
Service concept
External presentation:
Marketing mix Communication mix
Customer expectations 4 k,
Balancing factor
Service delivery system
The Crunch
Experience
Loyalty
Profit
Staff expectations . 0 4
...
2.12.11. The Behavioural Service Quality model
Figure 2.15. The Behavioral Service Quality model (Ghobadian, et al., 1994: 43).
The interpersonal behaviour of the service provider is an important influence on customers' perceptions of the quality of both "service process" and "service outcome". The model of service success developed by Beddowes et al. (1987) stresses the importance of behavioural considerations. This model is depicted in Figure 2.15. According to this model, one of the most important quality success factors is the balance between customer and staff expectations. Beddowes et al. argue that a common danger faced by many service organizations is inflating customer expectations through marketing efforts without balancing this with what the organization can offer through appropriate development of staff and systems.
According to this model, the other important contributor to service quality is the relevance and effectiveness of the service delivery system. The model identifies the factors that significantly influence service quality. It articulates why quality problems are likely to arise but not what the nature of these problems is and how to overcome them. (Ghobadian, et al., 1994 : 43).
66

2.13. Synopsis of literature reviewed on service quality models
2.13.1. Synopsis of literature reviewed on critiques of the SERVQUAL model
The SERVQUAL model has been subjected to various criticisms, both operational and theoretical. Some of the arguments are presented below.
Buttle (1996), as cited in Bond (2001 : 44), argues that the five service quality dimensions defined by Parasuraman et al. (1988) are not universal. Items do not always load onto expected factors. This argument is supported by Boshoff et al. (1992), Carman (1990), Cronin and Taylor (1992), Donnelly and Shiu (1999), Lam (1995), Lam (1997), Llosa et al. (1998), Orwig et al. (1997) and Pitt et al. (1995).
Parasuraman et al. (1991 : 442) acknowledge that the "five SERVQUAL dimensions are interrelated as evidenced by the need for oblique factor rotations of factor solutions." Carman (1990) proposed that the dimensionality of the model may be partly context specific. Parasuraman et al., (1991) proposed that the anomalies in dimensionality may be due to differences in analytical procedures and in data collection. Buttle (1996 : 9) concludes that "both contextual circumstances and analytical processes have some bearing on the number of dimensions of SQ".
Numerous studies, in various contexts, as shown in Appendix VI concludes that SERVQUAL is a reliable instrument for the measurement of service quality. This is supported by the studies of Du Plessis, A. and Boshoff, C. (1994); Lam S.S.K. (1997); Newman, K. and Cowling, A. (1996); and van der Wal, R et al. (2002).
An interesting observation is that many of the studies were refined by the researchers, as reviewed in Appendix VI.
The question then is, can they, in fact, be considered a true replication of SERVQUAL? The numerous criticisms of the dimensionality of SERVQUAL indicate that the researcher must carefully examine the context of the study and the items in the instrument, before commencing the study. (Bond, 2001 : 45).
67
Teas (1993) argues that a customer may be using any one of six interpretations in the expectations battery of SERVQUAL. They are:
Service attribute importance
Minimum tolerable performance
Ideal performance
Forecasted performance
Equitable performance
Deserved importance
Teas (1993 : 31) suggests that "a considerable portion of the variance in the SERVQUAL expectations measures may be caused by the respondents' misinterpretations of the question rather than to different attitudes or perceptions."
This argument is supported by Buttle (1996) who states that the expectation component, of the model, lacks discriminant validity. Buttle (1996) further posits that if customers expect poor service due to previous experience, having their expectations met will result in no SERVQUAL gap and service quality will be judged to be satisfactory. The perceived shortcomings in the expectation battery is endorsed by Carman (1990) and Lam (1995). Parasuraman et al. (1991; 1994) responded to these criticisms by redefining expectations, as the service customers would expect from excellent companies. Newman and Cowling (1996) defend the expectation scale.
Hussey (1999 : 89) states that, "Despite the substantial criticism, both theoretical and operational that has been levelled at the SERVQUAL Instrument since its introduction in 1988, it remains popular."
2.13.2. Synopsis of literature reviewed on critiques on other
service quality models
The SERVPERF model is a simplistic model which is based on the simple equation of Service Quality = Performance.
In contrast the SERVQUAL model measures five different dimensions of service quality from the perspective of the customer and the perspective of management of the service company. (Bond, 2001 : 54).
68
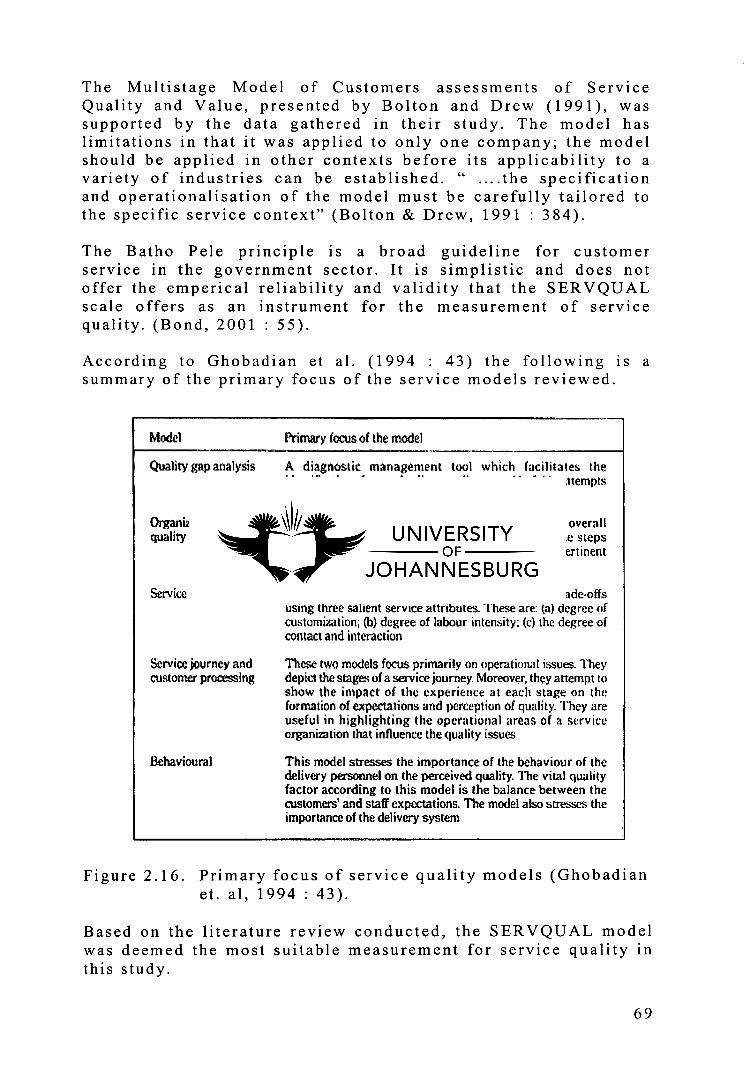
The Multistage Model of Customers assessments of Service Quality and Value, presented by Bolton and Drew (1991), was supported by the data gathered in their study. The model has limitations in that it was applied to only one company; the model should be applied in other contexts before its applicability to a variety of industries can be established. " ....the specification and operationalisation of the model must be carefully tailored to the specific service context" (Bolton & Drew, 1991 : 384).
The Batho Pele principle is a broad guideline for customer service in the government sector. It is simplistic and does not offer the emperical reliability and validity that the SERVQUAL scale offers as an instrument for the measurement of service quality. (Bond, 2001 : 55).
According to Ghobadian et al. (1994 : 43) the following is a summary of the primary focus of the service models reviewed.
Model
Primary focus of the model
Quality gap analysis
A diagnostic management tool which facilitates the identification of several salient quality gaps.. Useful in attempts to improve the quality of the offering
Organizational service The model provides a framework for launching an overall quality improvement quality improvement programme. It highlights the steps
involved in an organizational quality drive and the pertinent factors at each stage
Service quality trade-offs The model facilitates the identification of quality tradeoffs using three salient service attributes_ These are (a) degree of customization; (b) degree of labour intensity; (c) the degree of contact and interaction
Service journey and
These two models focus primarily on operationat issues. They customer processing
depict the stages of a service journey. Moreover, they attempt to show the impact of the experience at each stage on the formation of expectations and perception of quality. They are useful in highlighting the operational areas of a service organization that influence the quality issues
Behavioural
This model stresses the importance of the behaviour of the delivery personnel on the perceived quality. The vital quality factor according to this model is the balance between the customers' and staff expectations. The model also stresses the importance of the delivery system
Figure 2.16. Primary focus of service quality models (Ghobadian et. al, 1994 : 43).
Based on the literature review conducted, the SERVQUAL model was deemed the most suitable measurement for service quality in this study.
69
70
Chapter 3 Research Methodology
3.1. Introduction
This chapter discusses the research objectives, outlined in chapter one, with emphasis on the research methodology applied in capturing the primary data. This primary data originates within the context of a metals treatment plant with the focus on establishing the customer and the employee (including management) perception of the service quality as it exists.
3.1.1. Literature review
Secondary d a t ar i es generated in a erature review as seen in chapter 2. 1 Based on this, the literature
review assisted in developing an understanding of the management of service quality uncovering concepts, perspectives and prior research contexts ultimately assisting in the selection of the SERVQUAL instrument. .
This provided information as follow s
An analysis of service quality models
The applicability of the SERVQUAL, instrument in context of the research being conducted
Additional perspectives from previous research undertaken. The most recent being a publication confirming the suitability of SERVQUAL, in the cellular communications industry, conducted under the auspices of van der Wal et al. 2002.
TECHNIKON WITWATERSRAND 3.1.2. Exploratory research
LIBRARY
According to Saunders et al. (2000 : 97) exploratory studies are a valuable means of finding out "what is happening; to seek new insights; to ask questions and to assess phenomena in a new light".
Primary data was collected as follows :
30 employees (including management) stationed in the heat treatment plant extending their perspectives on the rception and expectations of the service provided according o the questionaire developed by Parasuraman et al. (1990) with

contextual modifications. See Appendix I, Exhibit B-1 for questionnaire.
70 Customers of the metals treatment plant extending their perspectives on the perception and expectations of the service provided according to the questionaire developed by Parasuraman et al. (1990) with contextual modifications. See Appendix I, Exhibit A-1 for questionnaire.
This approach provided information on the research objectives as follows :
To investigate the reliability and validity of the SERVQUAL model in an industrial environment
To explore the differences between expected and perceived service experienced by customers in this industrial environemnt
To explore the difference between customer expectations and management perception of the customers expectation in this industrial environment
To determine where the service quality gaps exist
To determine the predictors of service quality
3.2. Sample frame methodology
The population exists as follows :
Vektor's metals treatment customer database (active customers)
Vektor's metals treatment employees (including management)
Samples are extracted from these populations.
The selection displays sufficient similarity within the populations to support sample representation that is characteristics of the total population. 100 % sampling generated the research sample.
3.2.1. Customer sample
The current population is 70 customers.
71

The population exists as active customers of Vektor's metals treatment services. The sampling unit is a Vektor metals treatment customer.
3.2.2. Employee sample
The current population is 30 Vektor heat treatment employees.
The sampling unit is a Vektor heat treatment employee.
3.3. Data collection instrument
According to Parasuraman et al. (1990 : 175) SERVQUAL is a concise multiple-item scale with good reliability and validity that companies can use to better understand the service expectations and perceptions of their customers. "We have designed the instrument to be applicable across a broad spectrum of services. As such it provides a basic skeleton through its expectations/perceptions format encompassing statements for each of the five service quality dimensions (tangibles, reliability, responsiveness, assurance and empathy)".
Two structured questionnaires were constructed, based on SERVQUAL containing 23 questions (Appendix 1, Exhibit A-1 and B-1). The first was administered to the selected sample of customers through face to face interviews and the second to employees (including management) through face to face interviews.
The Tangibles section of the original SERVQUAL questionnaire was modified to include technology, quality, capacity, location and selection of processes ("menu") to determine expectations and perceptions of service quality in context of the research environment.
Similarly this was duplicated for the employee questionnaire.
The selection of the modified tangibles service quality dimension was guided by two factors these being :
o The context of the research, the tangibles as it existed in original form was not appropriate
o A review of relevant literature provided the aspects to consider and modify.
72
In view of this the Tangible section was constructed to include :
Technology New services can be market driven or technology driven (market pull versus technology push). Market-driven innovations may result from better servicing the needs of customers or more technology in the service delivery process. (Kasper, et al., 1999 : 10).
Quality Quality and the diversity that it brings as critical to service innovation and improvement, and suggests that dynamic questioning (that provokes change) should lead the organisation to answering to the needs of the customer, but also enabling them to see the future. (Peters, 1999 : 6).
Capacity Product or service design can have a tremendous influence on capacity. For example, when items are similar, the ability of the system to produce those items is generally much greater than when successive items differ. Generally speaking the more uniform the output the more opportunities there are for standardisation of methods and materials, which leads to greater capacity. The particular mix of products and services rendered must also be considered since different products or services will have different rates of output. (Stevenson, 1996 : 194).
Selection of processes ("menu") Service organisations cannot continue to rely on their existing product mix for ongoing success. With increasing globalisation and increased competition, organisations will increasingly find it difficult to survive just on their past successes, but will need to continually innovate and strive for the creation of new ideas and new services. (Kelley & Storey, 2000 : 45).
Location The capacity must be located near the customer. In manufacturing, production takes place, and then the goods are distributed to the customer. With services, however, the opposite is true. The capacity to deliver the service must first be distributed to the customer either physically or through some media) then the service can be produced. A hotel room or rented car that is available in another city is not much use to the customer — it must be where the customer is when that customer needs it. (Chase & Acquilano, 1996 : 279).
73

3.3.1. Customer questionnaire
The first section of the customer questionnaire contains a set of 23 statements regarding customers expectations and perceptions related to the five dimensions of service quality (Tangibles, Reliability, Responsiveness, Assurance and Empathy).
The second section gathers data regarding the relative importance of each dimension within the five dimensions. See Appendix 1, Exhibit A-1.
3.3.2. Employee questionnaire
The first section of the employee questionnaire, is identical to the customer questionnaire, and contains a set of 23 statements regarding customers expectations and perceptions related to the five dimensions of service quality (Tangibles, Reliability, Responsiveness, Assurance and Empathy).
The second section gathers data regarding the relative importance of each dimension within the five dimensions.
The third section gathers data regarding employees perception of company specific service standards, service delivery and external communications.
The questionnaires presented in Appendix I, Exhibit C-2 measures antecedents of gaps 1 and 2.
The questionnaires presented in Appendix I, Exhibit C-3 measures antecedents of gaps 3 and 4.
3.4. Data collection technique
Face to face interviews was chosen as the data collection technique for the following reasons :
The, individual, interviews were conducted with limited inconvenience to participants.
Non response factors such as content, anonymity and complexity of questions were addressed during pilot interviews. This resulted in further refinements to the format of the questionaire especially in the tangibles service quality dimension. All respondents, both
74

customers and employees (including management), were assured of anonymity.
Screening questions were not necessary as the sample selected ensured that the correct respondents were being interviewed.
3.4.1. Customer interviews
Face to face interviews were conducted, according to the structured SERVQUAL questionnaire, allowing the customer privacy and immediate response to elaborate within reasonable time.
Interviews were scheduled according to appointments and conducted at agreed times and venues.
The metals treatment manager (the researcher) who is involved in customer service conducted the interviews.
3.4.2. Employee interviews
Similarly face to face interviews were conducted by the researcher according to the modified SERVQUAL questionnaire, allowing employees privacy and immediate response to elaborate within reasonable time.
Employees (including management) at Vektor's metals treatment plant have contact with customers and execute services on a direct and indirect basis qualifying them as respondents.
Interviews were scheduled according to appointments and conducted at agreed times and venues.
3.5. Data processing
Data was 'captured in a Microsoft EXCEL spreadsheet.
The SPSS program was used to conduct statistical analysis.
Data is interpreted and described in Chapter 4.
Conclusions and recommendations is discussed in Chapter 5.
75

3.6. Pilot study and other controls
A pilot study of the questionnaire was conducted to check flow, sensitivity to questions and eliminate misunderstanding.
In the words of Churchill (1983), as cited in Bond (2001 : 64), "The pretest is the most inexpensive insurance the researcher can buy to assure the success of the questionaire and research project."
The questionaire was refined according to the research respondents, providing feedback on flow, question sensitivity, clarity, content and context.
Modifications based on technology, quality, capacity, location and selection of processes ("menu") was added to the tangibles section of the questionnaire and tested for validity and reliability based on customer response. A small sample size (n=30) was a limitation in testing the employee questionnaire identical in construct to the customer questionnaire.
The SERVQUAL questionnaire has two different sections dedicated to the same questions based on client expectations and the perception of service delivery within a defined company. For simplification the two sections — perception and expectation were combined into one section conducive to optimum data gathering.
76

Chapter '4 Data analysis and Findings
4.1. Introduction
Data analysis was conducted using the SPSS Statgraphics programme available from www.spss-sa.com . See Appendix II for details.
To establish reliability and validity data was subject to the following :
o Factor analysis Factor analysis attempts to identify underlying variables, or factors, that explain the pattern of correlations within a set of observed variables. Factor analysis is often used in data reduction to identify a small number of factors that explain most of the variance observed in a much larger number of manifest variables.(www.spss-sa.com , 20/06/20031.
o Reliability analysis Cronbach's alpha (Cronbach 1951) is one measure of item reliability. Item reliability indicates how consistently a set of instruments measure an overall response. Two primary applications of Cronbach's alpha are industrial instrument reliability and questionaire analysis. Nunnally (1979) suggests that a Cronbach's alpha of 0.7 as a rule-of-thumb shows acceptable level of agreement. (www.sas.com , 20/06/2003).
4.2. Findings on Customer questionnaire
In this section findings of the modified customer questionnaire, is discussed in terms of the five service quality dimensions, namely tangibles, reliability, responsiveness, assurance and empathy. The questions related to the dimensions is as follows.
Question Question Question Question Question
1 to 5 6 to 10 11 to 14 15 to 19 20 to 23
: Tangibles : Reliability : Responsiveness : Assurance : Empathy
The questionnaire is attached in Appendix I, Exhibit A-1.
77

4.2.1. Findings on Reliability and Validity of SERVQUAL
4.2.1.1. Factor analysis
Table 4.1. Factor loading of the SERVQUAL questionnaire
Items 1 2 3 4 5 6 7 8 Tangibles
Q1 - 0.46 - - - - - - Q2 0.47 - - - - - - - Q 3 0.47 - - - - - 0.45 - Q4 . 0.60 - - - - - - - Q 5 - - 0.61 - - - - -
Reliability 0 6 1 0.761 - - - - - - - Q 7 0.62 - - - - - - - 08 0.811 - - - - - - - 09 19.751 - - - - - - -
0101 '9.751 - - - - - - - Responsiveness
011 0.721 - - - - - - - Q12 - - 0.50 - - - - - Q13 0.51 - - 0.54 - - - - Q14 - - - - - - - -
Assurance Q15 0.64 - - - - - - - Q161 '0.731 - - - - - - - Q17 0.55 - - - - - - - Q18 0.66 - - - - - - Q19 - 0.68 - - - - - -
Empathy Q 20 0.54 - - - - - - - Q21 - 0.69 - - - - - - Q22 0.741 - - - - - - - Q23 0.58 - - - - - - -
The values in the table indicate the affiliation of the items to a factor. Each statement or question eg. Treatment technology is an item. The factor is the natural affinity of an item into a group. The higher a loading factor the stronger the affiliation of the item to a factor. Scores below 0.45 indicate a weak loading and should not be considered. See Appendix II for the complete table.
78

In the Parasuraman et al. (1998) study, the findings showed that each of the five service quality dimensions homogenously loaded to different factors. This indicates that there is a clear differentiation between the five service quality dimensions in the mind of the customer.
The findings in this study show that all dimensions except reliability load into different factors. Therefore a level of differentiation by the customer regarding the tangibles, responsiveness, assurance and empathy service quality dimensions does exist. A greater differentiation exists for the reliability dimension loading homogenously into one dimension.
Table 4.1. indicates that factor 1 has a strong correlation based on the shaded values. This suggests that the shaded questions can be used in future studies of a similar context. To further challenge this each service quality dimension is subject to reliability testing. Based on reliability testing, the omission of the shaded questions will result in a total scale reliability decrease, this is not recommended. However the omission of specific questions outlined in sections 4.2.1.1 to 4.2.1.5 enable homogenous loading of service quality dimensions into factors reinforcing clearer differentiation of the five service quality dimensions.
Table 4.2. Principal component analysis
Component Initial Eigen values Extraction sum of squared loadings
Total %
variance
%
cumulative Total %
variance %
cumulative
1 8.02 34.89 34.89 8.02 34.89 34.89
2 2.74 11.91 46.80 2.74 11.91 46.80
3 1.68 7.23 54.10 1.68 7.28 54.10
4 1.48 6.41 60.49 1.48 6.41 60.49
5 1.29 5.60 66.10 1.29 5.60 66.10
6 1.23 5.36 71.44 1.23 5.36 71.44
7 1.20 5.21 76.65 1.20 5.21 76.65
8 1.04 4.51 81.16 1.04 4.51 81.16
9 0.87 3.76 84.93
The above table is explained as follows :
The Total column shows the eigenvalue, or amount of variance in the original variables accounted for by each component.
79

The % variance column shows the ratio of the variance accounted for by each component to the total variance in all of the variables.
The % cumulative column shows the percentage of variance accounted for by the first nine components. The cumulative percentage for the second component is the sum of the percentage of variance for the first and second components.
Eigenvalues greater than 1 have been extracted, this shows the first eight principal components form the extracted solution.
The next section of the table shows the extracted components (extraction sum of square loadings).
This shows that 81.16 % variability exists in eight variables, which is significant, therefore data complexity can be reduced by using these components.
Scree Plot
Component Number
10
Figure 4.1. Scree plot for reliability and validity
The scree plot determines the optimal number of components to be used if data reduction is contemplated. To determine this the eigenvalue of each component in the initial solution is plotted.
Generally, the components on the steep slope are extracted, while the components on the shallow slope contribute little to the solution.
80
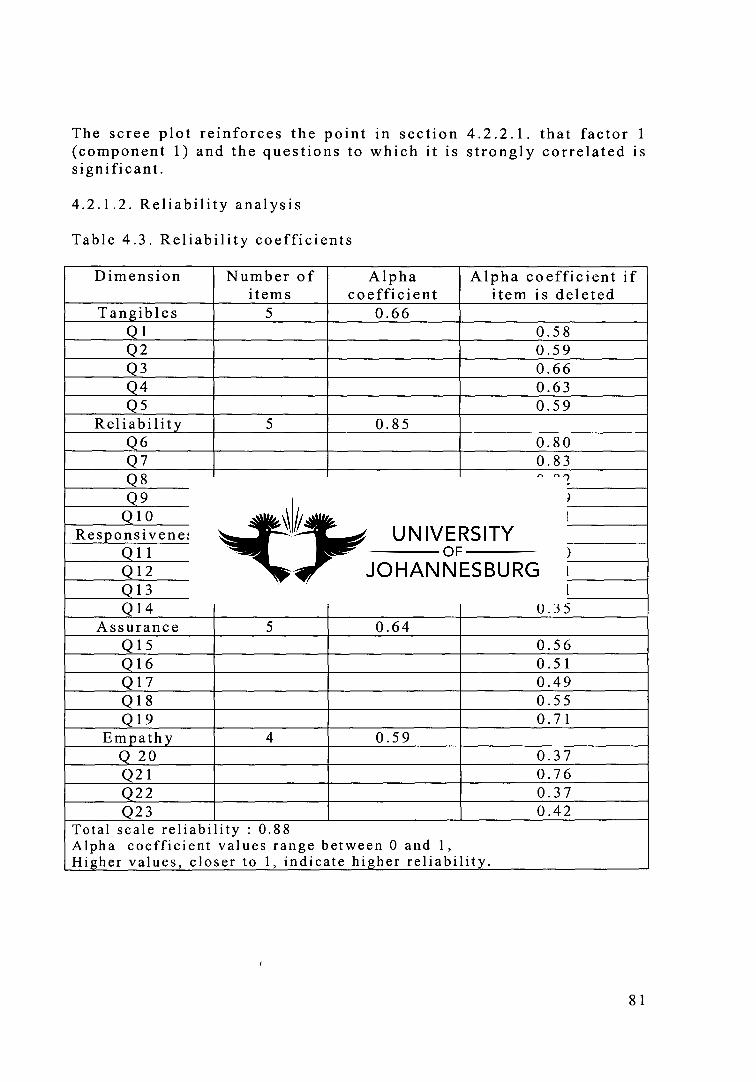
The scree plot reinforces the point in section 4.2.2.1. that factor 1 (component 1) and the questions to which it is strongly correlated is significant.
4.2.1.2. Reliability analysis
Table 4.3. Reliability coefficients
Dimension Number of items
Alpha coefficient
Alpha coefficient if item is deleted
Tangibles 5 0.66 Q1 0.58 Q2 0.59 Q3 0.66 Q4 0.63 Q5 0.59
Reliability 5 0.85 Q6 0.80 Q7 0.83 Q8 0.82 Q 9 0.79
Q10 0.81 Responsiveness 4 0.38
Q11 0.10 Q12 0.51 Q13 0.21 Q14 0.35
Assurance 5 0.64 Q15 0.56 Q16 0.51 Q17 0.49 Q18 0.55 Q19 0.71
Empathy 4 0.59 Q 20 0.37 Q21 0.76 Q22 0.37 Q23 0.42
Total scale reliability : 0.88 Alpha coefficient values range between 0 and 1, Higher values, closer to 1, indicate higher reliability.
81

4.3. Discussions on reliability and validity findings of questionaire
4.3.1. Tangibles
The five items in this dimension have a medium level of cohesion. The omission of items can result in a decrease in the reliability of the results. A difference in alpha's between the 0.66 alpha for this study relative to the 0.72 alpha by Parasuraman et al. (1998) is attributed to the following :
The tangible dimension questions are adapted, for suitability, to an industrial environment Items loading into four different factors within the tangible dimension
While changes in the questions does not yield greater reliability, the original questions for the tangible service quality dimension designed by Parasuraman are unsuitable for this study due to the industrial-manufacturing aspect of the research context.
4.3.2. Reliability
The five items in this dimension have a high level of cohesion. Omitting items can decrease the reliability of results. A difference in alpha's between the 0.85 alpha for this study and 0.83 by Parasuraman et al. (1998) is observed.
The structure of the questions in this dimension has not changed. A higher reliability in this study is indicative of greater homogeneity between the five items in the context of this study.
4.3.3. Responsiveness
The four items in this dimension have a low level of cohesion Omitting question 12, providing prompt service, can increase the reliability of results to 0.51. A difference in alpha's between the 0.38 alpha for this study and a 0.82 alpha by Parasuraman et al. (1998) is observed.
This difference is attributed to the following :
The suitability of the questions used in the context of this study. The type of questions used in this dimension needs to be reviewed. Items loading into three different factors within the responsiveness dimension
82

4.3.4. Assurance
The five items in this dimension have a medium level of cohesion. Omitting question 19, assuring the customer of individual attention, can increase the reliability of results to 0.71. A difference in alpha's between the 0.59 alpha for this study and a 0.81 alpha by Parasuraman et al. (1998) is attributed to — the added question based on assuring the client of individual attention.
Interestingly if question 19 is omitted from the assurance dimension all items load into one factor — see table 4.1. This confirms that question 19 can be omitted, in future studies, for this context.
4.3.5. Empathy
The four items in this dimension, originally five, have a low to medium level of cohesion. Omitting question 21, providing specific attention to customers, can increase the reliability of results to 0.76. A difference in alpha's between the 0.59 alpha for this study and a 0.86 alpha by Parasuraman et al. (1998) is attributed to :
The difference in the number of questions, originally five now four.
Similar to the assurance dimension if question 21 is omitted from the empathy dimension all items load into one factor. This confirms that question 21 should be omitted. The empathy dimension, excluding question 21, can then be used for future studies in this context.
4.4. Summary of reliability and validity
The omission of specific questions, based on their reliability coefficients, can increase the reliability of the service quality dimensions.
Factor loading can become more homogenous after specific questions are omitted. This indicates that clearer differentiation for the five service quality dimensions is possible.
83

4.5. Findings on the importance of dimensions in predicting service quality
Table 4.4. Regression analysis
Dimensions Standard slope coefficient
Significance level of slope
Adjusted R squared
Tangibles 0.219 0.49 0.57 (p<0.10) Reliability -0.009 -0.013 Responsiveness -0.052 -0.054 Assurance -0.075 -0.107 Empathy 0.43 0.50
The results indicate that the dimensions are not affected by the significance level (p<0.10). Therefore no significance exists between the importance of a service quality dimension and the perception of the corresponding quality in this study.
See Appendix III for comparitives between customer and employee regression results.
84

Relative comparison of the service quality dimensions
kr) 4 0
2
1
essors ..vto•A‘t/
lug)
—0—Importance
—=—Expectation Perception
0
,wees
6
5
p,ssA,ice
4.6. Findings on customer importance, expectation and perceptions
Table 4.5. Comparison of relative importance of the five service quality dimensions (customers).
Importance Expectation Perception x a Rank x a Rank x G Rank
Tangibles 4.57 0.60 3 5.90 0.53 2 4.76 0.54 3 Reliability 4.76 0.46 1 6.03 0.05 1 4.92 0.37 2
Responsiveness 4.23 0.64 4 5.48 0.46 4 4.74 0.48 4
Assurance 4.62 0.55 2 5.30 0.82 5 4.61 0.48 5
Empathy 2.97 0.61 5 5.80 0.72 3 5.06 0.31 1
= Mean, a = Standard deviation, 1= most important, 5= least important
Figure 4.3. Comparison of relative importance of the five service quality dimensions (customers).
85

4.7. Importance of service quality dimensions from the customers perspective
4.7.1. Importance
The reliability dimension, in the importance category, is ranked the highest (mean 4.76, ranking 1) and the empathy dimension the least (mean 2.97, ranking 5). The significance being that customers regard the reliability dimension as the most important when ranking the five service quality dimensions. See table 4.5.
4.7.2. Expectation
The reliability dimension, in the expectation category, is ranked the highest (mean 6.03 , ranking 1) and the assurance the least (mean 5.30, ranking 5). The significance being that customers regard the reliability dimension as the most important when experiencing the five service quality dimensions. See table 4.5.
4.7.3. Perception
The empathy dimension, in the perception category, is ranked the highest (mean 5.06 , ranking 1) and the assurance the least (mean 4.61, ranking 5). The significance being that customers regard the empathy dimension as the most important when perceiving the five service quality dimensions. See table 4.5.
Based on the above similarities and differences the following is important.
The highest ranking similarities, importance and expectation, connect in the reliability dimension. Similarities in the lowest rankings, expectation (experience) and perception connect in the assurance dimension.
In the intermediate ranking all three categories importance, expectation and perception connect in the responsiveness dimension.
The starting point in reacting to the customer is a review of the importance rankings and contrasting the rankings with expectation and perception.
This shows that while customers rank reliability as important, experience it to be equally important and perceive it in a similar vane, the focus should be on the assurance dimension ranked high in importance but experienced and perceived the lowest.
86
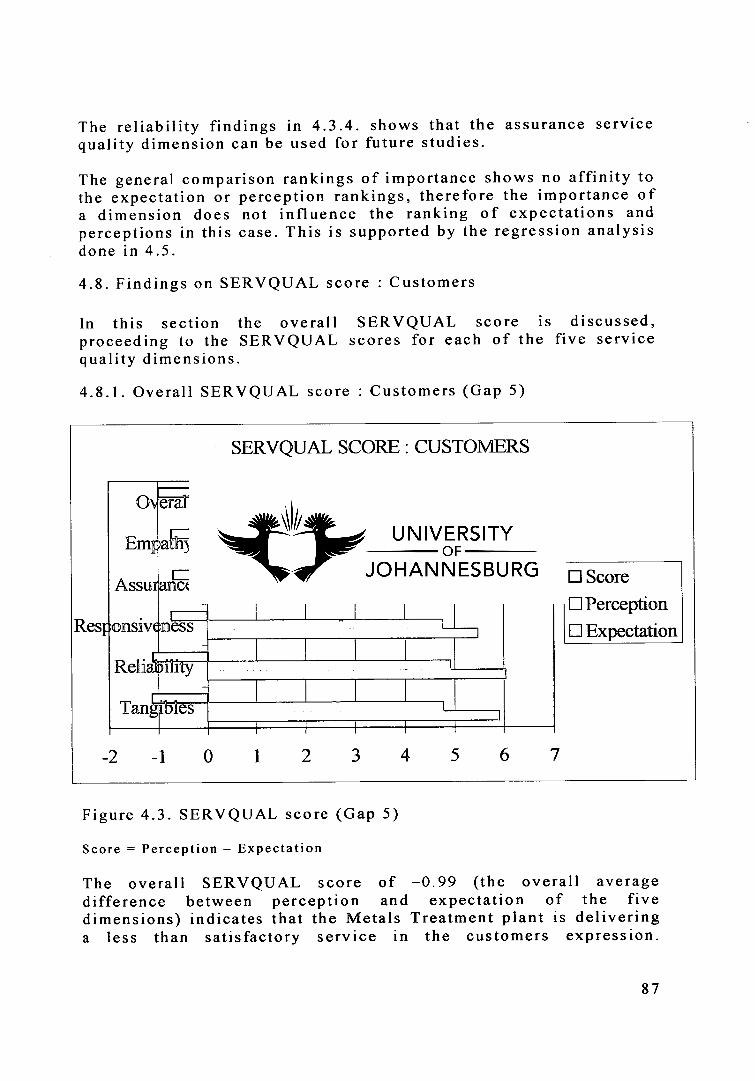
SERVQUAL SCORE : CUSTOMERS
-2 -1 0 1 2 3 4 5 6 7
Assurance
onsiveness
Overall
Empathy 1 1
1 i
1
Relialbility I
I i Tangbles 1 (
Res
Score
Perception
Expectation
The reliability findings in 4.3.4. shows that the assurance service quality dimension can be used for future studies.
The general comparison rankings of importance shows no affinity to the expectation or perception rankings, therefore the importance of a dimension does not influence the ranking of expectations and perceptions in this case. This is supported by the regression analysis done in 4.5.
4.8. Findings on SERVQUAL score : Customers
In this section the overall SERVQUAL score is discussed, proceeding to the SERVQUAL scores for each of the five service quality dimensions.
4.8.1. Overall SERVQUAL score : Customers (Gap 5)
Figure 4.3. SERVQUAL score (Gap 5)
Score = Perception — Expectation
The overall SERVQUAL score of —0.99 (the overall average difference between perception and expectation of the five dimensions) indicates that the Metals Treatment plant is delivering a less than satisfactory service in the customers expression.
87

TANMES
1
-1.50 -1.00 -0.50 -200 0.00
According to Parasuraman et al. (1990 : 33) the key to delivering high-quality service is to balance customer's expectations and perceptions and close the gaps between the two. All service quality dimensions scored negatively, indicating that all service areas need focus. This leads to the following questions :
Which areas of service quality need attention ? What are the priorities ? What are the possible sources ?
These questions are answered in the proceeding section.
4.8.2. SERVQUAL score for the tangible dimension
Figure 4.4. SERVQUAL score for tangible dimension
Figure 4.4. indicates the largest gap between customer perception and expectation is related to selection this translates to the "menu" of treatment processes available. Reality indicates that a wider selection of treatment processes requires financial investment. A cost benefit analysis is needed to examine the feasibilty of increasing the selection of treatment processes focussed on the customers requiring this selection and the dynamics involved.
88

4.8.3. SERVQUAL score for reliability dimension
RELIABILITY
-2.00 -1.50 -1.00 -0.50
0.00
Figure 4.5. SERVQUAL score for reliability dimension
Figure 4.5. indicates that the largest gap between customers perception and expectation of reliability exists as "at promised time" that is delivering at the promised time. This gap may exist for the following reasons :
Scheduling and capacity loading in the metals treatment plant Equipment reliability Process control Operational staff lethargy
The next largest gap is "certain time" translating to the confirmation of when the service will be delivered. This second largest gap can be related to the four points outlined above.
Time delays need to be elliminated by addressing order scheduling, equipment reliability, process control and staff lethargy jointly.
89

4.8.4. SERVQUAL score for responsiveness dimension
RESPONSIVENESS
-1.50 -1.30 -1.10 -0.90 -0.70 -0.50 -0.30 -0.10 0.10
Figure 4.6. SERVQUAL score for responsiveness dimension
Figure 4.6. indicates that the largest gap between customers perception and expectation of responsiveness exists as "when service performed" that is telling customers exactly when services will be performed. This gap may be related to the following :
o Systems (operational systems may be insufficient) o Staff (training and motivation)
The next larger gaps are "never too busy" and "willing to help". These gaps are indicative of system shortcomings, capable of consuming staff and their time.
The "willing to help" gap needs to be examined twofold by firstly establishing system shortcomings, if any, proceeding to the ability and motivation of staff.
In the absence of system shortcomings staff need to be adequately motivated and trained to provide the correct feedback to customers.
90

4.8.5. SERVQUAL score for assurance dimension
ASSURAWE
kriffividIe
-4,
-150 -0.50
GOO
Figure 4.7. SERVQUAL score for assurance dimension
Figure 4.7. indicates that the largest gap between customers perception and expectation of assurance exists as "knowledge to answer" followed by "safe in transactions".
Product knowledge and training is needed to reinforce staff competence in addressing customer questions related to metals treatment. This point is linked to the technical and expertise competence of staff who need to provide specific responses required by customers. A demonstrable competence level can create a safety zone when entering into transactions with the metals treatment plant.
An intervention where clients are made to feel safe in their transactions is required. This needs to be addressed by interrogating the existing customer transaction system.
91

Specific attention
4.8.6. SERVQUAL score for empathy dimension
EMPATHY
-1.50 -1.00 -0.50 0.00
Figure 4.8. SERVQUAL score for empathy dimension
Figure 4.8. indicates that the largest gap between customers perception and expectation of empathy exists as "convenient operating hours".
Presently the metals treatment plant operates on a five day week contrasting the industry shift toward a longer working week.
The need to offer convenient operating hours can be examined and quantified with customers to determine feasibility.
An engagement process involving staff and company policy will need to be reviewed if operating hours are extended.
The next largest gap "specific needs" connects to preceding dimensions where staff issues need to be addressed through training and motivation interventions.
92

Relative comparison of service quality dimensions
Civc 4
'to
4S`r c\ 4S.
`---,--„,,„
cf----'--
6
5
4
3
2
1
0
-0- Importance -a- Expectation
Perception
4.9. Findings on employee questionnaire
4.9.1. Findings regarding importance of dimensions in predicting service quality
Table 4.6. Comparison of the relative importance of the five service quality dimensions (employees).
Importance Expectation Perception X a Rank x a Rank x G Rank
Tangibles 4.46 0.66 1 5.96 0.44 3 5.32 0.47 3 Reliability 4.34 0.80 2 6.23 0.29 1 4.35 0.29 4
Responsiveness 4.09 0.56 4 5.93 0.81 4 4.31 0.29 5
Assurance 4.20 0.83 3 5.49 0.41 5 5.49 0.41 2
Empathy 3.63 0.60 5 6.03 0.51 2 6.03 0.46 1
x = Mean, a = Standard deviation, = most important, = least important
Figure 4.9. Comparison of relative importance of the five service quality dimensions (employees).
93
4.9.2. Importance of service quality dimensions from the employees perspective
4.9.2.1. Importance
The tangibles dimension, in the importance category, is ranked the highest (mean 4.46, ranking 1) and the empathy dimension the least (mean 3.63, ranking 5). The significance being that employees regard the tangibles dimension as the most important when ranking the five service quality dimensions. See table 4.6.
4.9.2.2. Expectation
The reliability dimension, in the expectation category, is ranked the highest (mean 6.23, ranking 1) and the assurance the least (mean 5.49, ranking 5). The significance being that employees regard the reliability dimension as the most important when experiencing the five service quality dimensions. This is a similar case to the customer ranking. See table 4.7.
4.9.2.3. Perception
The empathy dimension, in the perception category, is ranked the highest (mean 6.03, ranking 1) and the responsiveness the least (mean 4.31, ranking 5). The significance being that employees regard the empathy dimension as the most important when perceiving the five service quality dimensions. See table 4.7.
Based on the above similarities and differences are observed as follows :
o Highest ranking In the highest ranking similarities, no connectivity exists in any of the three categories : importance, expectation and perception. However a connection is made by importance and expectation in the responsiveness dimension.
o Intermediate ranking In the intermediate ranking two categories, expectation and perception connect in the tangibles dimension.
The starting point in reacting to the employee is a review of their importance rankings and contrasting the rankings with expectation and perception.
94

The employees rankings can also be compared to those of customers (see 4.10. Table 4.7.). This comparison shows that while employees regard tangibles as important, their expectation and perception defines it lower.
While the comparison rankings by importance shows no affinity to the expectation or perception rankings, - the importance of a dimension does not influence the ranking of an expectation or perception in this case.
95

Ord
er of E
xpec
tatio
n
Or d
er of I
mpo
rtanc
e
Or d
er of I
mpo
rtan
ce
Ord
er of E
xpec
tatio
n
Ord
e r of P
erce
ptio
n C
u sto
mer
s
Ord
er of P
erce
ptio
n
U) a)
0 (E) 0
U
Importance similarities by customer and employees
...-.
• 40
e•
—0—Tangibles --42 " Reliability
Responsiveness Assurance
—a —Empathy
6
5
4
3
2
1
0
4.10. Relative Importance, expectation and perception of the service quality dimensions (customers and employees).
Table 4.7. Relative importance of the five service quality dimensions (customers and employees)
Importance Expectation Perception Customer Employee Customer Employee Customer Employee
Tangibles 3 1 2 3 3 3 Reliability 1 2 1 1 2 4
Responsiveness 4 4 4 4 4 5
Assurance 2 3 5 5 5 2
Empathy 5 5 3 2 1 1 1= most important, 5= least important
Figure 4.10. Differences and similarities in importance, expectation and perception of service quality dimensions (customer and employees)
96

Overall I I I
Parry 1
AssTrance
Response veness
Re la al
r Tar gibles
SERVQUAL SCORE : EMPLOYEES
-2 -1 0 1 2 3 4 5 6 7
Score
Perception
Expectation
Based on the above customers and employees do not agree, in importance expectation and perception, on the ranking of the five service quality dimensions.
According to Parasuraman et al. (1990 : 33) the key to delivering high quality service is to balance customers expectations and perceptions and close the gap between the two.
Therefore employee priorities should be aligned to customer priorities.
4.11. Findings on SERVQUAL score : Employees (Gap 5)
Figure 4.11. Findings on SERVQUAL score : Employees (Gap 5)
Score = Perception - Expectation
The overall SERVQUAL score of —1.32 (the overall average difference between perception and expectation of the five dimensions) indicates that the Metals Treatment plant is delivering a less than satisfactory service according to employees. All service quality dimensions scored negatively, indicating that all service areas need focus.
97
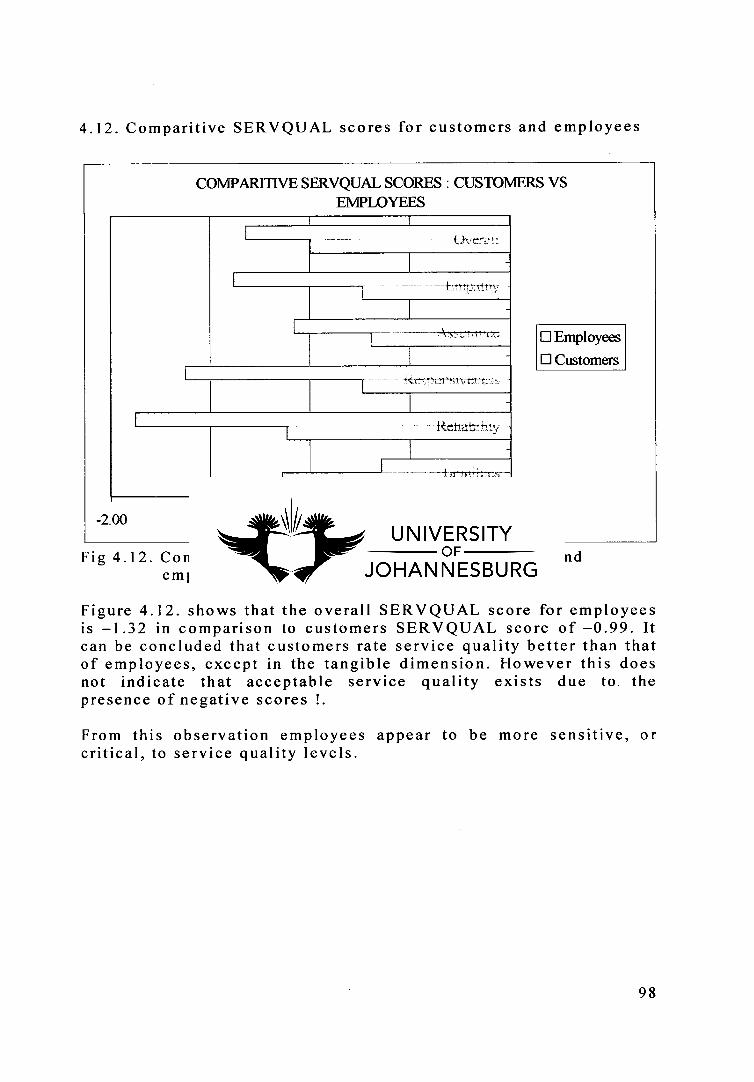
17, 3.1 !):y
Rtitatil;1!.y
COMPARITIVE SERVQUAL SCORES : CUSTOMERS VS EMPLOYEES
-2.00 -1.50 -1.00 -0.50 0.00
0Employees ❑ Customers
4.12. Comparitive SERVQUAL scores for customers and employees
Fig 4.12. Comparitive SERVQUAL scores for customers and employees
Figure 4.12. shows that the overall SERVQUAL score for employees is —1.32 in comparison to customers SERVQUAL score of —0.99. It can be concluded that customers rate service quality better than that of employees, except in the tangible dimension. However this does not indicate that acceptable service quality exists due to the presence of negative scores !.
From this observation employees appear to be more sensitive, or critical, to service quality levels.
98

GAP I : CUSTOMER EXPECTATION VS EMPLOYEES PERCEPTION OF THE EXPECTATION
Overin-L
ibintrpartfryL
Assurance L
Responsi
Reliability L
Tangibles L
Weighted Unweighted
-6.00 -4.00 -2.00
0.00
2.00
4.13. Findings on Gaps 1 to 4 identified by SERVQUAL
4.13.1. Gap 1 : the distance between customer expectations and employee/management perceptions of the customer expectation
Fig 4.13. Weighted and unweighted SERVQUAL scores
4.13.1.1. Unweighted scores
The unweighted score measures perception only, whereas the weighted score takes into account the ranking of perceptions.
Fig 4.13 shows the overall unweighted SERVQUAL gap is -0.13, this indicates that the perception of the expected service (by management) does not exceed the actual expectation (by the customer) in certain quality dimensions.
The largest unweighted gap is in the responsiveness dimension (-0.45), followed by empathy (-0.23) and then reliability (-0.20).
4.13.1.2. Weighted scores
The overall gap is -0.54.
99

Customers expectations, by weighting, shows three service dimensions namely assurance (1.04), reliability (1.62) and tangibles (0.47) as positive, contrasting the remaining two service dimensions. This suggests a need by management to focus, more, on the dimensions where negative weighted gaps exist namely empathy (-4.75) and responsiveness (-1.07).
4.13.1.3. Order of focus
The empathy and responsiveness dimensions need to be improved, based on the negative weighted gaps. Their importance rankings in table 4.7. show that they are not critical to customers - interestingly they are rated the same by customers and employees. However to improve the overall negative gap seen in figure 4.13. empathy and responsiveness must be improved.
4.14. Reliability coefficients measuring the antecedants to the gaps identified by SERVQUAL
4.14.1. Answers to questions related to the antecedants in gaps 1 to 4
Table 4.8. Antecedants of gaps 1 to 4.
Gap Antecedant Dimension Mean Gap 1 Market research orientation 3.96
Upward communication 4.11 Levels of management 3.57 Gap score 3.88
Gap 2 Management's commitment 2.89 Goal setting 2.43 Task standardisation 2.07 Service quality support systems 3.62 Gap score 2.75
Gap 3 Teamwork 4.43 Employee-job fit 3.97 Technology-job fit 4.80 Perceived control 3.55 Supervisory control systems 4.00 Role conflict 3.48 Role ambiguity 3.95 Gap score 4.03
Gap 4 Horizontal communication 4.01 Propensity to over-promise 3.59 Gap score 3.80
Scale : = strongly disagree, 7 = strongly agree
100
4.15. Discussion on antecedants to gaps
4.15.1. Antecedant to Gap 1
Overall Gap score : 3.88
There is low agreement, by management, that there is a market research orientation based on a 3.96 mean. A higher mean, 4.11, shows that management agree slightly that company operations enable upward communication. There is also low agreement that there are many levels of management based on a 3.57 mean.
4.15.2. Antecedant to Gap 2
Overall Gap score : 2.75
There is disagreement, that management commitment exists based on a 2.89 mean. A lower mean, 2.43, in service quality goals shows further disagreement. Similarly task standardisation displays a lower mean, 2.07, indicating a strong disagreement. A low agreement , mean 3.68, indicates that management believe there are systems to support service quality.
4.15.3. Antecedant to Gap 3
Overall Gap score : 4.03
There is fair agreement, mean 4.43, that teamwork exists. A lower 3.97 mean, shows that management agree weakly with employees job-fit. A stronger agreement, mean 4.80, shows that there is a technology-job fit affinity. Similarly management express that they disagree in the control they exercise in their jobs based on a 3.55 mean. A stronger agreement, mean 4.00, shows that supervisory control systems exist. Management also express low agreement with role conflict based on a 3.48 mean, and role ambiguity based on a 3.95 respectively.
4.15.4. Antecedant to Gap 4
Overall Gap score : 3.80
Slight agreement, mean 4.01, suggests that management view communication adequate, while a 3.59 mean indicates disagreement in over-promising.
101

In summary a deficiency in service quality commitment, goals and task standardisation exists based on management's strong disagreement means.
4.16. Results from the questions leading to the measurement of gaps 2 to 4
Table 4.9. Results from the questions leading to the measurement of gaps 2 to 4
Dimension Mean Service delivery 4.73 Service standards 3.07 Performance standards (external communication) 3.30
Mean scale
Mean scale Mean scale
: 1 = Unable to meet standards consistently 7 = Able to meet standards consistently
: 1= Informal standards, 7 = Formal standards : 1 = Unable to meet standards consistently
7 = Able to meet standards consistently
Table 4.9. indicates that management believe that service delivery is capable of meeting the promises made to customers. However service standards and performance standards (external communication) is lower.
4.17. Measurement of gaps 2 to 4
Table 4.10. Measurement of gaps 2 to 4.
Gap Mean Gap 2 1.19 Gap 3 -1.67 Gap 4 1.43
Management perception of customer expectation — service standards Service standards-Service delivery Service delivery-Performance standards (external communication)
102

Table 4.10. shows that Gap 2, the overall score between management's perception of the service and the service standards is 1.19 indicating that service standards need reinforcement.
Gap 3 is negative indicating that service delivery exceeds service standards, in the presence of a negative SERVQUAL score. Service standards once again need reinforcement ; service standards should be raised.
Gap 4 shows that service delivery exceeds performance standards related to external communication. This suggests that performance standards related to communication need reinforcement to meet service delivery and ultimately customer expectations.
103

Chapter 5 Conclusions and Recommendations
5.1. Conclusions and recommendations
The conclusions based on data analysis and interpretation is discussed, in addition recommendations are made where appropriate. Research objectives are stated in conjunction with conclusions and recommendations.
5.1.1. To investigating the reliability and validity of the SERVQUAL model in an industrial environment.
Based on the literature review, a published study on SERVQUAL in an industrial environment does exist. The study Quality customer service : strategic advantage for the Indian steel industry. by Sinha, G., & Ghoshal, T. (2002) however does not test for reliability or validity.
The total scale reliability of this study is 0.88 in comparison to a study by the founders of SERVQUAL Parasuraman et al. (1988) which produced 0.92. As the alpha coeficient approaches 1 it can be concluded that reliability exists.
This study concludes that the SERVQUAL model, based on a modified customer questionnaire, does exhibit reliability and validity in an industrial context.
The findings of this study suggest that the customer questionnaire can be modified for greater reliability. This is recommended for future studies conducted in a similar context.
The validity and reliability of the employee questionnaire, identical to the modified customer questionnaire, was not statistically tested due to a small sample (n=30).
In general the level of reliability and validity for this study is not largely divergent from the original SERVQUAL study.
104

5.1.2. To explore the difference between expected and perceived service experienced by customers in an industrial environment.
The difference between expected and perceived service experienced by customers in this study shows that an overall negative gap exists. Therefore it can be concluded that unsatisfactory service is being provided.
The major contributors per service quality dimensions follows :
5.1.2.1. Tangibles
The selection of processes on offer, driven by customer's specification, is the largest contributor in its own dimension and overall. Before conceding to this contributor considerations should be noted these being :
The present versus future market size and structure
Industry benchmarking
The cost benefit ratio to the organisation
The option to implement lies with the organisation and should be based on a feasibility study.
5.1.2.2. Reliability
The largest contributor in this section is related to providing service at the promised time.
This contributor is attributed to the following :
Scheduling and capacity loading in the plant
Equipment reliability
Process control
Operational staff lethargy
To avoid time delays and improve service quality it is recommended that attention be given to the above points.
105
5.1.2.3. Responsiveness
The largest contributor in this service dimension involves telling customers exactly when services will be performed. Interestingly if the reliability contribution persists a responsiveness contribution can continue.
This is based on the premise:
o How can employees tell exactly when a service will be performed if the systems used to perform and enable services is unstable ?
o Will staff be motivated if there is a persistent sense of uncertainty ?
Therefore the four points outlined in reliability can assist and focus efforts to improve service quality.
It is recommended that the stability of operating systems enabling services and staff motivation/training be addressed.
5.1.2.4. Assurance
The largest contributor is related to knowledgeability.
This contributor can be attributed to a deficiency in product knowledge.
Therefore in a quest to exceed customer expectation it is recommended that staff be equipped with the relevant product knowledge and "know-how".
5.1.2.5. Empathy
The largest contributor is related to convenient operating hours.
This contributor has an organisational origin that contrasts with the industry structure in which the organisation is competing.
Customers are highlighting this benchmark, therefore it is recommended that a review of operating hours is conducted based on the three points outlined in the tangibles dimension to determine feasibility.
106

In summary the reliability, responsiveness and assurance service quality dimensions hold the short term key to improving service quality. This is based on the origin of the respective gaps indicating deficiencies in operational enablers in systems and staff.
The tangible and empathy dimension can be viewed in a medium to long term approach due to the strategic intent involved.
5.1.3. To explore the difference between customer expectations and management perception of the customer's expectation in an industrial environment
Customer's rate, in order of importance, from high to low reliability, assurance, tangibles responsiveness then empathy.
Management rate, in order of their importance, from high to low tangibles, reliability, assurance, responsiveness then empathy.
Misalignment between reliability, assurance and tangibles clearly exists. Based on customer importance reliability should be given priority, this is reinforced by the findings in the reliability service dimension.
The reliability dimension also has the ability to influence the responsiveness dimension positively.
Therefore it is highly recommended that management focus on reliability.
It is recommended that this service dimension be the starting point in reengineering customer service rather than the tangibles.
Management need to evaluate the feasibility of adding more services to an organisation that is deficient in service quality enablers.
5.1.4. To determine where the service quality gaps exists
5.1.4.1. Gap 1
In gap 1, the difference between customers expectations and managements perception of the customers expectation, the following is significant
o The overall gap is negative — there is room for improvement.
107

The gap, unweighted, is negative in all five service quality dimensions, this indicates that management's perception of the expected service exceeds the customers actual expectation in all five service quality dimensions.
The negative gap score is underpinned by shortcomings in the empathy and responsiveness service quality dimensions — these are the largest contributors due to their negative gaps both weighted and unweighted. Of significance is the negative weighted scores larger than the unweighted score; this shows low service delivery. Management needs to define customer service priorities according to the more negative gaps and link these to the importance rating of customers. See Chapter 4. Figure 4.13.
5.1.4.2. Gap 2
The gap between management's perception of customer expectation and service standards and service delivery is positive This indicates that management's perception of customers expectation exceeds service delivery. It is recommended that service standards be raised.
5.1.4.3. Gap 3
The gap between service standards and service delivery is negative indicating that service delivery exceeds service standards. This indicates that service standards need reinforcement relative to a negative overall SERVQUAL (gapl) score. It is recommended that service standards be raised.
5.1.4.4. Gap 4
The gap between service delivery-Performance standards(external communication) is positive. This indicates that service delivery exceeds performance standards related to external communication. It is recommended that performance standards related to communication be raised to meet service delivery and ultimately customer expectations.
5.1.4.5. Gap 5
In gap 5, the difference between customers expected service and customers perceived service the following is significant
The overall gap is negative; there is a need for improvement.
108

o All five service quality dimension gaps are negative this indicates that customers perception exceeds the customers expectation in all five service quality, however the level of service can be low.
o It is recommended that this gap be jointly reviewed with service standards.
The gap between service standards and service delivery is negative indicating that service delivery exceeds service standards. This indicates that service standards need reinforcement relative to a negative overall SERVQUAL score. It is recommended that service standards be raised.
5.1.5. To determine the predictors of service quality
The "prediction" of the five service quality dimensions by rating the importance of the dimension showed no significance in this study. The regression analysis conducted confirms this.
5.1.6. Concluding remarks
The objectives of this study have been achieved as follows :
5.1.6.1. To analyse service quality models based on a literature review.
The models reviewed included the Services marketing triangle, Gronroos's service quality model, Kano's two factor model, the Multistage model, the SERVPERF model, the Batho Pele principle, the Organisational service quality improvement model, Service quality trade off continuum model, the Modified service journey model, the Customer processing operations model, the Behavioural service quality model and the SERVQUAL model.
Each model provided unique perspectives and the SERVQUAL model was selected as the most appropriate.
5.1.6.2. To investigate the reliability and validity of the SERVQUAL model in an industrial environment.
Factor analysis and Cronbach's alpha (reliability coefficient) indicates that the modified customer questionnaire, does exhibit reliability and validity.
109

The total scale reliability is 0.88, which is not largely divergent from the original study by Parasuraman that produced 0.92. It can be concluded that the modified SERVQUAL customer questionaire is applicable in an industrial environment. This validates the application of the SERVQUAL model.
5.1.6.3. To explore the difference between expected and perceived service experienced by customers in an industrial environment
The difference between expected and perceived service experienced by customers in this study was identified. It is shown that an overall negative gap exists. Therefore it can be concluded that an unsatisfactory service level exists. The largest contributor to this gap is the reliability service dimension.
5.1.6.4. To explore the difference between customer expectations and management perception of the customer's expectation in an industrial environment
A difference between customer and management "mindsets" was identified. Customer's rate, in order of importance, from high to low reliability, assurance, tangibles responsiveness then empathy. Management differ in their response. It can be concluded that the reliability service dimension should be given priority.
5.1.6.5. To determine where the service quality gaps exists
The service quality gaps were successfully identified and quantified according to the SERVQUAL model. It can be concluded that service quality gaps do exist and reside in all five gaps of the sevice quality model for this study. Therefore it is recommended that management focus on all the gaps identified in this study, actively involving employees.
Table 5.1. serves as a recommendation on departmental involvement in reengineering customer service.
110

Table 5.1. Organisational responsibility for closing gaps
Gap Requirement Responsibility Gap 1 Consistency between quality
specification of service and customer expectation.
Marketing Operations Service development
Gap 2 Specification of service meets intended design
Marketing Operations Service development Operations Gap 3 Actual service conforms to internal
specified quality level
Gap 4 Promises made to customers concerning service to be delivered
Marketing
GapS Gap 5 is a function of gaps 1 to 4. Marketing Operations Service development
5.1.6.6. To determine the predictors of service quality
Regression analysis identified that the five service quality dimensions by rating the importance of the dimension showed no significance. It can be alluded that the "prediction" of service quality in the context of this study is not feasible.
5.1.7. General observation
The concept of reengineering customer service for competitive advantage can be applied in the reliability service dimension first. This dimension is pivotal in providing a substantial and necessary contribution to service quality. The intervention can be reevaluated and the original scores used as benchmarks.
This reveals an interesting observation, namely, that the reengineering effort can shift from service dimensions (contributors within these dimensions) to gaps or both depending on where the opportunity for improvement to gain competitive advantage exists.
111

In this study three observations are important
All five service quality dimensions (tangibles, reliability, responsiveness, assurance and empathy) have contributors that impact on the level of service quality. An analysis per service quality dimension shows this.
The service quality dimensions should be examined individually and priorities assigned to the largest contributors within each dimension.
Five service quality gaps exist, each being significant. Each gap should be examined and priorities assigned to improve service quality.
Based on the contents of this study the following is note-worthy
Service quality can be linked to a strategic intent, enabling the achievement of strategic goals.
Service quality can be linked to an operational intent, enabling the achievement of operational goals
Service quality can be used in different organisation or industry contexts based on modification and subsequent statistical validation (factor and reliability analysis). .
Service quality is diagnostic and can be used to establish service related priorities based on actual customer expectations.
Service quality should be viewed as a process rather than an event to gain benefit and value. It often involves change, resistance and complexities because it deals with people, such as customers, staff and management. Add new technology, products or services and the picture changes to include an adoption curve. The important realisation being that service quality cannot happen instantly - it takes time and effort.
5.2. Recommendations for future studies
A repeat study, in due course, to explore the intervention ability and further findings of SERVQUAL.
The application of service quality applied on a wider scope to the metals treatment industry to gain deeper understanding of SERVQUAL in this context.
112

Further research on SERVQUAL to determine implementation, cost-benefit and constraint considerations by management.
A comparative study involving SERVQUAL and other service quality models to gain perspectives on similarities and differences.
113
Bibliography
Asubonteng, P., McCleary, K.J. & Swan, J.E. (1996) SERVQUAL revisited : a critical review of service quality. Journal of Services Marketing, 10(6) : 62-81.
Babakus, E & Boller, G.W. (1992) An emperical assessment of the SERVQUAL scale. Journal of Business Research, 24(1) 253 : 268.
Bolton, R.N. & Drew, J.H. (1991) A multistage model of customers' assesments of service quality and value. Journal of Consumer Research, 17 (4) : 375-384.
Bond, C. (2001) The measurement of service quality at cellular telecommunication retail outlets in South Africa. Unpublished.
Boshoff, C., Nel, D. & Mels,G. (1992) Service quality perceptions in insurance brokerage .: A causal modeling analysis. South African Journal of Economic and Management Sciences, 8 (1) : 1-15.
Blanchard, R.F. & Galloway, R.L. (1994) Quality in retail banking. International Journal of Service Industry Management, 5(4) : 5-23.
Blessington, M. & O'Connell, B. (1995) Sales reengineering from outside in. New York : McGraw-Hill
Brown, S. (1997) Breakthrough customer service. Canada : John Wiley & Sons.
Brown, T.J., Churchill, G.A.Jr. & Peter, J.P. (1993) Improving the measurement of service quality. Journal of Retailing, 69 (1) : 127 -139.
Buttle, F. (1996) SERVQUAL : review, critique, research agenda. European Journal of Marketing, 30(1) : 8-33
Carman, J.M. (1990) Consumer perceptions of service quality : an assessment of the SERVQUAL dimensions. Journal of Retailing, 66 (1) : 35-36.
Chase, R., Aquilano, N. & Jacobs, F. (1998) Production and Operations Management : Manufacturing and Services. 8" Edition. New York : McGraw-Hill.
Crainer, S. & Obeng, E. (1994) What's wrong with the organisation anyway ? Making reengineering happen. London : Pitman
114

Cronin, J.J. & Taylor, S.A. (1992) Measuring service quality : A reexamination and extension. Journal of Marketing, 56 (1) : 55 -68.
Dale, B.G., Barber, K.D., Williams, R.T., & van der Wiele, T. (1997) Managing quality in manufacturing versus services : a comparative analysis. Managing Service Quality, 7(5) : 242 - 247.
Du Plessis, A. & Boshoff, C. (1994) Use of SERVQUAL in management education at a technikon. South African Journal of Higher Education, 8(2) : 54-57.
Engelland, B.T.W. & Letty Singh, M. (2000) Ensuring service quality for campus career services centers : A modified SERVQUAL scale. Journal of Marketing Education, 22(3) : 236-245.
Finn, D.W. & Lamb, C.W. (1991) An evaluation of the SERVQUAL scale in a retail setting. Advances in consumer research 1(1) : 18.
Ghobadian, A., Speller, S. & Jones, M. (1994) Service quality concepts and models. International Journal of Quality and Reliability Management, 11(9) : 43-46.
Gronroos, C. (1984) A service quality model and its marketing implications. European Journal of Marketing, 18(4) : 36-44.
Horovitz, J. (2000) Seven secrets of service strategy. London : Pearson Education
Hussey, M.K. (1999) Using the concept of loss : An alternative SERVQUAL measure. Service Industries Journal, 19(4) : 89-101.
Kasper, H. Van Helsdingen, P. & DeVries, W. (1999) Services Marketing Management. New York : John Wiley & Sons.
Kelley, D. & Storey, C. (2000) New service development : initiation strategies. International Journal of Service Industry Management, 11 (1) : 45-62.
Koen, K. (2001) Hi-tech way to win clients. Sunday Times : 3.
Kotler, P. (1997) Marketing Management : Analysis, Planning, Implementation and Control. Ninth edition. New Jersey : Prentice Hall.
Lam, S.S.K. (1997) SERVQUAL : A tool for measuring patients opinions of hospital service quality in Hong Kong. Total Quality Management, 8(4) : 145-152.
115
Llosa, S., Chandon, J. & Orsingher, C. (1998) An emperical study of SERVQUAL'S dimensionality. Service Industries Journal, 18(2) : 16-44.
Lovelock, C.H. (1996) Services Marketing. 3 rd Edition. Upper Saddle River N.J. : Prentice Hall.
Manning, T. (2001) Making sense of strategy. Cape Town : Zebra
Masnick, F. (1997) The customer is CEO. How to measure what your customers want and make sure they get it. New York : AMACOM.
Mittal, B. & Lassar, W.M. (1996) The role of personalisation in service encounters. Journal of Retailing, 72(1) : 95-109.
Mutch, D. (2001) Measure customer satisfaction to win. The Star, Workplace : 8.
Newman, K. & Cowling, .A. (1996) Servive quality in retail banking : the experience of two British clearing banks. International Journal of Bank Marketing, 14(6) : 3-11.
Nel, D., Pitt, L.F. & Berthon, P.R. (1997) The servqual instrument reliability and validity in South Africa. South African Journal of Business Management, 28(3) : 113-122.
Orwig, P.A., Pearson, J. & Cochran, D. (1997) An emperical investigation into the validity of SERVQUAL in the public sector. Public Administration Quarterly, 21(1) : 54-68.
Parasuraman, A., Zeithaml, V.A. & Berry, L.L. (1985) A Conceptual Model of Service Quality and its Implication for Future Research. Journal of Marketing, 49(1) : 41-50.
Parasuraman, A., Zeithaml, V.A. & Berry, L.L. (1988) SERVQUAL : a multiple item scale for measuring consumer perceptions of service quality. Journal of retailing, 64(1) 12-40.
Parasuraman, A., Zeithaml, V.A. & Berry, L.L. (1990) Delivering quality service : balancing customer perceptions and expectations. New York : McMillan Inc.
Parasuraman, A., Berry, L.L. & Zeithaml, V.A. (1991) Refinement & Reassesment of the SERVQUAL scale. Journal of Retailing, 67(4) : 420-450.
Peters, V.J. (1999) Total service quality management. Managing Service Quality, 29 (1) : 6-12.
116

Pitt, L.F., Watson, R.T. &. Kavan, C.B. (1995) Service quality : a measure of information systems effectiveness. MIS Quarterly, 19(2) : 173-187.
Revelle, J.B., Frigon Sr, N.L.& Jackson Jr, H.K., (1995) From concept to customer. New York : Van Nostrand Rheinhold.
Robinson, S. (1999) Measuring service quality : current thinking and future requirements. Marketing Intelligence and Planning, 17 (1) : 21-32.
Sayre, S. (2001) Qualitative methods for marketplace research. California : Sage.
Saunders, M.,Lewis, P.& Thornhill, A. (2000) Research methods for business students. Second edition. Great Britain : Pitman.
Skweyiya, Z., (1997) Batho Pele — "People First" White Paper on Transforming Public Service Delivery. www.policy.org.za/govdocs/white papers/transform.html. (cited 19 March 2002).
Sinha, G., & Ghoshal, T. (2002) Quality customer service : strategic advantage for the Indian steel industry. Managing Service Quality, 9 (1) : 32-39.
Smith, A.M. (1995) Measuring service quality : is SERVQUAL now redundant ? Journal of Marketing Management, 11 (1) : 257-276.
Stevenson, W.J. (1996) Production/Operations management. Fifth edition. New York : McGraw-Hill.
Teas, R.K. (1993) Expectations; Performance Evaluation, and Consumer Perceptions of Quality. Journal of Marketing, 57(1) : 18-34.
van der Wal, R., Pampallis, A. & Bond, C. (2002) Service quality in a cellular telecommunications company : a South African experience. Managing Service Quality, 12 (5) : 323-335.
Wellington, P. (1995) KAIZEN Strategies for customer care How to create a powerful customer care programme — and make it work. London : Pitman Publishing.
Wiersema, F. (2001) The new market leaders : Who's winning and How in the battle for customers. New York : Simon & Schuster Inc.
117

Wright, P., Kroll, M. & Parnell, J. (1998) Strategic Management : Concepts and Cases. Fourth edition. New Jersey : Prentice Hall.
Zeithaml, V.A. & Bitner, M.J. (2000) Services Marketing : Intergrating customer focus across the firm. Second edition. USA : McGrawHill.
www.emeraldinsight.com , Emerald now : Spotlight on A "Parsu" Parasuraman , (cited 11 March 2002).
www.emeraldinsight.com , Emerald now : Spotlight on Christian Gronroos , (cited 11 March 2002).
www.gov.za , The new Coat of Arms enhances Batho Pele, (cited 19 March 2002).
www.kirton.co.za , customer service audit, (cited : 25 February 2002).
www.sabusinessreview.co.za/December 1999/articlesischultz.htm, Relationship marketing for industrial markets (cited : 20 April 2002).
www.sabusinessreview.co.za/December 2001/articles/moolla.htm, Service quality measurement : A critical review of the SERVQUAL model, (cited : 22 April 2002).
www.sabusinessreview.co.za/December 2001/general articles/ gerber.htm, The tree model : creating successful synergy for business process reengineering, (cited : 19 February 2002).
www.sas.com , Statistical Analysis : Cronbachs Alpha, (cited 20 June 2003)
www.spss-sa.corn, Statgraphics, (cited : 20 June 2003)
118

EXHIBIT A-1 Customer questionaire APPENDIX I
Section 1 :
Directions : Based on your experience as a consumer of heat treatment services, please think of a company that would deliver excellent quality of service. Think of the kind of company that you would be pleased to do business with. Please show the extent to which you think such a company Possess the features described by each statement. If you feel a feature is not .ssential, circle 1, if you feel a feature is essential circle 7, if you feel less strong circle one of the numbers in the middle. There are no right or wrong answers, we are interested in the number that reflects your feelings regarding the company that would deliver excellent service quality.
ItCHN /koNievr...
iatelvv
O
1

What are your expectations of an
excellent heat treatment service ?
How do you feel about the heat treatment
service in meeting your expectations ?
Strongly Disagree
Strongly Agree
Strongly Disagree
Strongly Agree
1 Heat treatment companies will have specific treatment technology that you require
1 2 3 4 5 6 7 1 2 3 4 5 6 7
2 Heat treatment companies will provide acceptable quality
3 Heat treatment companies will have a minimum guaranteed capacity available
4 Heat Treatment companies will offer a selection of heat treatment processes
5 Heat Treatment companies will be centrally located
6 When heat treatment companies promise to do something by a certain time they will do so.
7 When a customer has a problem heat treatment companies will show a sincere interest in solving it.
8 Heat treatment companies will perform the service right the first time.
9 Heat treatment companies will provide their services at the time they promise to do so.
10 Heat treatment companies will insist on error free records.
11 Heat treatment companies will tell you when the service will be performed
12 Heat treatment companies will provide prompt service to customers.

What are your expectations of an
excellent heat treatment service ?
How do you feel about the heat treatment
service in meeting your expectations ?
Strongly Disagree
Strongly Agree
Strongly Disagree
Strongly Agree
13 Heat treatment companies will always be willing to help customers.
1 2 3 4 5 6 7 1 2 3 4 5 6 7
14 Heat treatment companies will never be too busy to respond to customers requests.
15 The behavior of employees in heat treatment companies will instill confidence in customers.
16 Customers of heat treatment companies will feel safe in their transactions.
17 Employees in heat treatment companies will be consistently courteous with customers.
18 Employees in heat treatment companies will have the knowledge to answer customers' questions.
19 Heat treatment companies will give customers individual attention.
20 Heat treatment companies will have convenient operating hours.
21 Heat treatment companies will have employees who give customers specific attention.
22 Heat treatment companies will have the customers best interest at heart.
23 Heat treatment companies will understand the specific needs of their customers.
Thank you.

cl.) Et)
-1■4 <L) 0 g 0 0 g.)
CI CO •-= •—■ Q)
V) 0.‘
OCCSCCIO A ›,
^. rn 0 gio 0 a) sa.,
E • >1 • CA "'
-4■4
a) 0 ■ 0
cr
o
a) C.3 o a) et
vs (1) CA 0
0 ,S4 $:14
0.) E -c)
0 a) ""
nz) a. E 0 0
E
a) -4-4 E
o CO
0 0 (4. cL)
C.) >-,
( 0 ••=,
,4 •cn
0
0
0
0 • -j
0 0.
0
0
s•-■
0
rCi
0
0 (/)
ell Cl)
Whic
h f
eatu
re i
s
0
■
cf) a.) c.)
a) cn
V
® (1.)
Ci g
V
a.)
0
a)
••= U
CD
01)
•
G S:4
71-
Sec
tio
n 2
:
The
tec
hn
olo
gy a
bil
ity
(q
uali
ty, cap
acit
y, p
roce
sses
) o
f t h
e he
at tr
ea
tmen
t 1
p
lan
t
The
kn
ow
led
ge an
d co
ur
tesy
of t
he h
ea
t tr
ea
tme
nt '
s em
plo
yee
s an
d t
heir
a b
ilit
y t
o c
onvey
tru
st a
nd c
on
fid
ence
.
The
indiv
idua
lise
d a
tten
tion t
he h
ea
t tr
ea
tmen
t fa
cil
ity p
rov
ides
to
it
's
cus
tom
ers.
'' CI en .71. I

B-
1 Em
plo
yee
que
sti
ona
ire
num
ber
tha
t
CI) o• a.)
"" CI) o E
. a)
—CI
■
.
.0
0
•
'4-1 Cl)
•
.41" 1-. cn = = 0
..-
.., 0.)Cfl
E Cl.) Cl) -,-., a) -,-' = 4-'0
v) a)
as X 0 0 4. 0
c„ a) E-.
© ,-.
(E. '4..' .3.)
a) •-. = s-4 -.-. -0 © 4. -4.-+
P. -1–'
3. C4.1
CI) .., Z
ta0 0 Cl a) g -g c2 g
Cl) 0 03
(1) —. a) v) -. — Cl © 0
a) a) " ,4.1 v-1 C.I.■1 • 1..1
ra•I C.)
a) 0 a) „0 - 0 /DI) -0 4-4 [-I = >-) 0 ® ›,
.. 0 k.4-4 0 = -,-' --. 1-4
CA CO ll
CI) ... .1
E 4.
/1 g (t) 4.; .1.
Cr CI = CI) -4.
.-• a) aD 0 a) 0 — U
4-, CD = 0 • ,-,
,4 0 6 0 4-' Il >
X a) .... 0 ....c1 ou k. a) W CA g a) Cl) (E. v)
Cus
tom
ers
Cus
tom
ers
0
0
cus
cus
tc
trea
tmen
t ccs
M C (." E_, u . 3 0 on
gly
gr
ee r--
v:)
kr)
41-
Str
ong
ly
Dis
agre
e cr)
N
Str
ong
ly
Ag
ree
1---
kr)
-1-
Str
ong
ly
Dis
agre
e
cr.)
N
■ 4
VE
KT
OR
has
spec
ific
hea
t tr
eatm
en
t te
ch
no
log
y
VE
KT
OR
pro
vid
es
acce
pta
ble
q
ua
lity
VE
KT
OR
has
a m
inim
um
gu
aran
tee
d ca
pac
ity a
vail
able
VE
KT
OR
off
ers
a s
ele
cti
on
of
hea
t tr
ea
tmen
t pro
cess
es
VE
KT
OR
is c
en
tra
lly
loc
ated
When
VE
KT
OR
pro
mis
es t
o
do
som
eth
ing
by a
ce
rta
in t
ime
they
wil
l do s
o.
When
y
ou h
av
e a p
rob
lem
V
EK
TO
R w
ill
sho
w a
sin
cere
in
tere
st in
so
lvin
g i
t.
VE
KT
OR
wil
l p
e rfo
rm t
he
serv
ice
rig
ht
the
fir
st t
ime.
..4 N Cr) 'Cr tr) v:) t--- 00
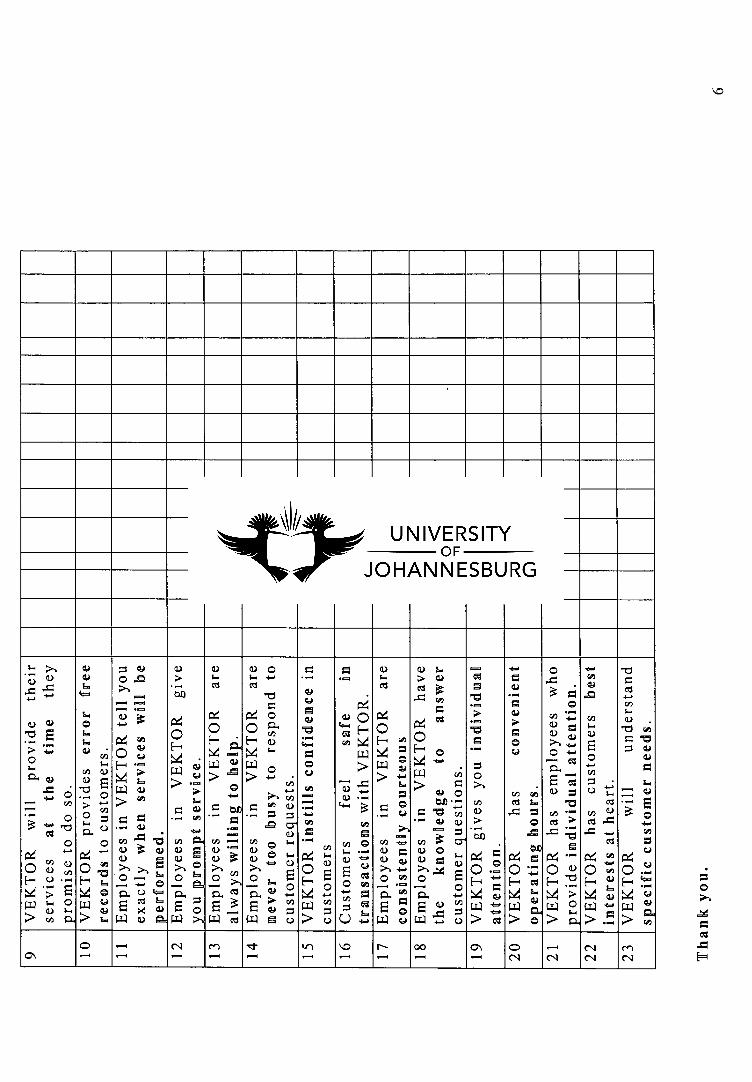
VE
KT
OR
wil
l p
rov
ide t
heir
se
rvic
es a
t t
he t
ime t
hey
p
rom
ise
to d
o s
o.
VE
KT
OR
pro
vid
es err
or fr
ee
reco
rds
to c
ust
om
ers.
E
mp
loy
ees
in
VE
KT
OR
te
ll y
ou
exac
tly
wh
en s
erv
ices
wil
l be
pe
rfo
rme
d.
E
mp
loy
ees
in
VE
KT
OR
giv
e y
ou p
rom
pt se
rvic
e.
Em
plo
yee
s in
V
EK
TO
R a
re
alw
ays
wil
lin
g t
o h
elp
.
Em
plo
yee
s in
V
EK
TO
R a
re
neve
r to
o b
usy
to r
esp
ond
to
cu
sto
mer
req
ues
ts.
VE
KT
OR
ins
till
s co
nfi
de
nce
in
cu
sto
mer
s C
ust
om
ers
feel sa
fe in
tra
nsac
tion
s w
ith V
EK
TO
R.
Em
plo
yee
s in
VE
KT
OR
are
co
ns
iste
ntl
y co
urte
ou
s
Em
plo
yee
s in
V
EK
TO
R h
ave
the
kn
ow
ledg
e to
answ
er
cust
om
er q
uest
ions
. V
EK
TO
R g
ives
you
in
div
idu
al
att
en
tio
n.
VE
KT
OR
has
c
onv
en
ien
t op
era
ting h
ou
rs.
VE
KT
OR
has
em
plo
ye
es w
ho
pro
vid
e in
div
idu
al
att
en
tio
n.
VE
KT
OR
has cu
sto
me
rs
bes
t in
tere
sts
at
hea
rt.
VE
KT
OR
will u
nde
rsta
nd
spe
cif
ic c
us
tom
er n
ee
ds.
C7 \ O ,—t
Il r—■
N —■
cn .—i
:1- v-I
sr) 1-1
.!:> vl
r■ Il
00 v-I
C71 1-1
0 N
.—i
N N N
fr) N
■C)

el) ••4 0
.1■■ 4-4
al s... 0 0 = ›-, Q .F. -F,
aS rn rn czt Cl) ,-. • Li. a) • --' g C)
.-. • -. C> a) fao a) 0 ,-, rn I-. ta.,
.4-. a) g 0 as ,..0 ...-, a) •I■, et
1•Z c,.... 0 '4■1 a) 1:14
0 g
v.g C.) .4 « ° C.:3 A•■. C
•
Z
a) CZ: a) (/) ..
CA a) 41 ;, $.•1
F.
CZ g
g © g 4■• CrS
4■J as E - ..„.
..- al s. •,-, .1 $, o a)
0 s. ad 0
ra, ... r.i.
fa. - En c a)
;... E Q > cn 0 2 - =
-4-, ›' = CD el 0 = ,..., 0 = CD cat .'"' >1 -4-.
c+-1 ..4 fa.. ,•4
0.) E 0 .4- ® 0 0
0 0 ® cu 0) .. g 0
tl0 as -0
..- .4-, 0 0.) = = 0 ,.., I-, 0 co • 4-. 4., •••'
v■I ett -4..A -c) E 6., ›, —
as ,..a.) ,,,, o „, ...=
0 0 .- 0 — .... al — ›,
a..) .- _a -0 .- ..2
• - cz a..) = -0 0.) I-, 0
cL) 0 s•-■ .4-, .4 -I-' Z 0 cn at ..... 0.4 -. al
0.4 0, 4-I Q Q
© © cl
.4-, . .
tre
atm
ent
t
cn .,.., 0 0 rn
a)
Sec
tio
n 2
Dir
ecti
on
s
0
0
0
a)
0 •
C-•
0
0
act s•-■
0
0
CA
t4-1
0 ..g
..g
0
ci)
4■•
a) e.4■1
a)
0
Wh
ich f
eatu
re i
s se
co
nd
mo
st im
po
rtan
t to
you
? (
ind
ica
te o
pti
on
Ra
tin
g
The
tec
hn
olo
gy
off
er
ing
, q
ua
lity
, cap
acit
y, p
roce
ss s
ele
cti
on, a
nd lo
cati
on
o
f th
e he
at t
reat
men
t p
lan
t
The
he
at tr
ea
tmen
t p
lan
t's a
bil
ity t
o p
erfo
rm t
he p
rom
ise
d se
rvic
e d
epen
dab
ly a
nd a
ccur
ate
ly.
T
he h
ea
t tr
ea
tme
nt p
lan
t's
wil
lin
gnes
s to
he
lp c
us
tom
ers
an
d p
rov
ide
pro
mp
t se
rvic
e.
The
kn
ow
ledg
e an
d c
ou
rte
sy o
f t
he h
ea
t tr
ea
tmen
t's
em
plo
yee
s a
nd t
heir
ab
ilit
y t
o c
on
vey
tru
st a
nd c
on
fid
ence
.
The
ca
ring, in
div
idu
ali
sed a
tten
tio
n p
rov
ide
d t
o c
ust
om
ers.
- (NI rn

a.>
•
a) 0 '10 4-0
C-
1 M
an
ag
eme
nt q
ues
tio
na
ire
00
To
wha
t ex
ten
t is
yo
ur
com
pan
y a
nd
its
em
plo
yee
s ab
le t
o m
ee
t t
he p
erfo
rtm
ance
st
andar
ds e
sta
bli
she
d ?
Z o 0 a) (0
Ab
le t
o m
ee
t p
rom
ises
co
nsis
ten
tly
r---
vz.
tr)
-er U
na
ble
to
m
eet
pro
mis
es
con
sis
ten
tly
M
N
To
wha
t ex
ten
t are
p
erfo
rman
ce s
tan
dar
ds
form
ali
sed i
n y
our
com
pan
y ?
Z o = 0 a:,
Fo
rma
l S
tan
dar
ds
r----
VD
tr)
Info
rma
l S
tan
dar
ds :1-
M
N
,--.
To
wha
t ex
ten
t do y
ou
beli
eve
your
com
pan
y a
nd
it's
em
plo
yee
s d
eli
ver
the
le
vel
of
serv
ice
pro
mis
ed
to c
ust
om
ers
?
Ab
le t
o m
ee
t p
rom
ises
co
ns
iste
ntl
y r"--
VD
kin
Un
ab
le t
o
mee
t p
rom
ises
co
nsi
ste
ntl
y
71-
M
N
The
app
eara
nce
of
the
com
pan
y's
phy
sica
l fa
cil
itie
s, e
qu
ipm
en
t,
per
sonne
l, a
nd
com
mu
nic
ati
on
m
ate
ria
ls
The
ab
ilit
y o
f th
e co
mp
any t
o p
erfo
rm
the
pro
mis
ed s
erv
ice
dep
enda
bly
an
d
accu
rate
ly.
The
wil
ling
nes
s o
f th
e co
mp
any t
o h
elp
cu
sto
mer
s an
d p
rov
ide
p
rom
pt
serv
ice.
T
he
kn
ow
ledg
e an
d co
urte
sy o
f th
e co
mp
any
's e
mp
loy
ees
and
the
ir a
bil
ity
to
convey
tru
st an
d co
nfi
de
nce
. T
he c
ar
ing
, in
div
idua
lise
d a
tte
nti
on
the
co
mp
any
p
rov
ides
it
s cu
sto
mer
s.
.--. N en 'I' kr)

01

0 'C e ••-• ) ,-
0. c.) o
eq I.- vs = -.... =
0
o -o -0 >. 4:0
o
ed
cu .—■ 0
0 co)
▪
0 w ,
▪
0 C. cd 1••• 0 1... el cu to — cd
1-.
.... ■-• o ■-•
O ++ o ° ,-o ,,, no tu c , -" 4., a) a.) 0 C -0 $: s- el = 0) cztb4 —1)
10 ea 0 c.) rn . -0 c.o = • ^ -0 a
- ,...— -. -0 .)
1=1 Ch Z >1 C ...• el = ° 74 11)
t) >.' = •.`b
O a) ;-.
— C 0 • 4..., o ,,,,, •,-.
•
- ,,,) „, C C o .,-,,, ..,. I.-
a.) P• 0 0
GA 0
•
•
" 4. ...0.) 1■4 = = Cr VI .0 CD • (1)
1■•■ C .4• ... = CL) = " X 0 .....
0 0 O.) 0 ›-L .. 0 c... C 0 a.) E 0
4.) o ,.., 0 C. 4. .. a.) ••-• cd = 2 a. . — 0
w co — . , as 0.)
es11 05 ... 0 C.)
Co) c 7.) -O0 s.
0 0 . "6 C .0 • •-• L.L.
0
.. W . 0 CA = 6 CO
mC ... et v) 0
X • "n • ,'' " CU ;••• ,.., W.1 CZ I■ 0. = C,)
Str
ong
ly S
trong
ly
Dis
agre
e A
gre
e
We
reg
ula
rly
co
llec
t in
form
at i
on
abou
t t
he n
ee
ds o
f our
cu
sto
mer
s.
We
rare
ly u
se
mar
keti
ng r
ese
arch
info
rma
tio
n t
ha
t is
co
llec
ted a
bou
t o
ur
cus
tom
ers
.
We
reg
ula
rly
co
llec
t in
form
ati
on
abou
t t
he
serv
ice
qu
ali
ty e
xp
ecta
tio
ns
of
our
cus
tom
ers.
T
he
man
ag
ers
in o
ur
com
pan
y r
are
ly i
nte
rac
t w
ith
cu
stom
ers
The
cus
tom
er c
on
tac
t p
erso
nne
l in
ou
r co
mp
any
fr
equ
ent l
y co
mm
un
ica
te
wit
h m
anag
emen
t.
Man
ager
s in
our
com
pan
y r
are
ly
see
k s
ug
ges
t ion
s ab
ou
t serv
ing c
us
tom
ers
fro
m c
us
tom
er c
on
tac
t p
erso
nne
l.
Th
e m
an
ag
ers
in o
ur
com
pan
y f
req
uen
tly
hav
e
face
to
face
in
tera
ct i
on
s w
ith
cus
tom
er c
on
tac
t p
erso
nne
l.
The
pri
ma
ry
mea
ns o
f co
mm
un
ica
t ion
in
ou
r c
om
pan
y b
etw
een
con
tac
t p
erso
nne
l an
d upp
er l
eve
l m
anag
ers
is t
hro
ug
h m
emos.
Ou
r com
pan
y
has
too m
an
y
lev
els
of
ma
na
gem
ent
betw
een
co
nta
ct p
erso
nne
l an
d t
op m
anag
eme
nt.
Our
co
mp
any d
oes
no
t co
mm
it t
he
nec
essa
ry r
eso
urc
es
for
serv
ice
qu
ali
ty
Ou
r co
mp
any h
as
inte
rna
l p
rog
ram
s fo
r im
pro
vin
g t
he q
uali
ty o
f se
rvic
e to
cu
sto
mer
s.
In o
ur
com
pan
y m
anag
ers
who
im
pro
ve
qu
ali
ty o
f se
rvic
e ar
e m
ore
lik
ely
to
be
rew
ar
ded t
han o
ther
manag
e rs.
Ou
r com
pan
y e
mp
has
ises
se
llin
g m
uch m
ore
t
han
it
emp
has
ises
serv
ing
cus
tom
ers
.
Ou
r co
mp
any h
as a
fo
rma
l p
roce
ss
for
se
ttin
g q
uali
ty o
f se
rvic
e g
oals
for
emp
loy
ees.
In o
ur
co
mp
any w
e t
ry t
o s
et
spec
ific
qua
lity
of
serv
ice
goa
ls.
Ou
r co
mp
any
eff
ecti
vely
use
s au
tom
ati
on
to a
chie
ve c
ons
iste
ncy
in
se
rvin
g
cus
tom
ers.
Pro
gra
ms
are
in p
lace
in o
ur
com
pan
y t
o
imp
rov
e o
per
at i
ng p
roce
du
res
so a
s to
pro
vid
e co
nsis
ten
t se
rvic
e.
`Zt VI C) .-.
--, .....
kr) --•
■40 —..
rn

a)
a) 4.
0- a)
ti
a)
O
0
a) a)
O
a: 1■1 No
r•O
fa• RS
Cl
a)
a)
a)
Cc
>.• •
Ecs Ct. u
O 0 CD
0
we
wou
ld g
o
a)
as
a)
a)
O
U) z
4.
O
a)
Cl 01)
a) a.) k -se
0 t•-• 1--•
cr% 1■1
00 (Ni
a)
a)
a)
a)
• ..
"0
0
Un
E a)
co)
co,
op
era
tin
g

0 E 0 Q
.1■, al 4-4
0 En >1
14
al o 0 ,0 C.3 = -4-.
... r.n
0 0
p.. $•-■
0 ■ 1.-. a) PL. 0
0.)
1.-1 ,1 '0
Q -0 -- c>
$. 3. .... Q Q
= Q .F.
CD =
$••■ . „.. IDA
al L'')
c» 1-,
.-. a) -0 ..n
E >-, 0 ti) °
0 a) o =
I. 4_, 4-, .., a)
0
ci) c4-1 o 0 —0)
s- tO 0 a) (1)
>, cri >., 0 `*-1 „, cn 0 0 -,_ , • -. c4-1 - I:, .1 a.,)
_. ›,
RS +.: C.) ,....
RS 0 = " P' a) E >, a) 0 °
-0 E o
•-c- -0.-). )
a 0
a & ci) rn g
= () 4-J 0 CD CZ ° =
Q = a) u,
.1■. .1■. =
a> 4.-. 0 $.., =
CA X ,1- C.3 .4.4 C1) -I■. •■■1
= Cf) a) C1) CI) >< 0,0 -1■■•
Q E •-=
•
0 • = a) ..- v-4
3 ) . a) a
® c
°I) 4–( ■—■ cn i. g1-4 .-0 C.)
- . w
.."
0
-
-0 = °
,... 0 >, l'-,'
a) c4-, 40 c4 0.9 I■4 CA
› N co 0 E at •
0-) 0 p.., cn a.) tap
-.4 , cat . 0 (..) "
Cl) ,•P $-■ ° ,-. $-. 0 4 0
®'
0 ., .....
c,„ 0 6,
y..1 0 a) ° s-, , a) 0 (DJ) ..= S. cci to a> 0
.-0 bi) I-■
bi) 0 "" 0
0 CI)
C■-.1 c) Cl)
con
tinue
d a
nte
cedan
ts of G
aps
3 a
nd 4)
Dir
ecti
ons
to m
ea
sur
e
Str
ong
ly
Str
ong
ly
Dis
agre
e A
gre
e
N
'0
kr)
.1-
N
I fe
el
tha
t I
am
par
t o
f a
team
in
my
co
mp
any
.
Ev
ery
one
in
my
co
mp
any
co
ntr
ibu
tes
to a
tea
m e
ffo
rt
in s
erv
icin
g cu
sto
mer
s.
I fe
el
a s
ense
of
res
po
ns
ibil
ity t
o h
elp
my f
ell
ow
em
plo
yee
s to
do
the
ir j
obs
well
.
My
fell
ow
em
plo
yee
s an
d I
coo
per
ate
mor
e o
ften
th
an w
e co
mp
ete.
0
P. P. E 0 C..) ci) •–■
-=
C4■1 0
1. CD
..r.) E
Ea)
0 03
I. 0 fa.
.c co
,§ at
0-..4
..... Cd = 4--■
a) a)
, c.p.
E
I fe
el
com
fort
ab
le
in m
y j
ob
in t
he s
en
se t
hat I
am
able
to
per
form
th
e jo
b w
ell
.
My
com
pan
y hir
es p
eop
le w
ho a
re q
ual
ifie
d t
o
do t
heir
jo
bs.
-I-.
My
co
mp
any g
ives
me t
he t
oo
ls a
nd
eq
uip
men
t t
hat I n
eed t
o
per
form
my
jo
b w
ell
.
I sp
end a
lo
t o
f t
ime in
my
jo
b t
ryin
g t
o r
eso
lve
pro
ble
ms
ov
er
wh
ich I hav
e lit
tle
(-).
I ha
ve t
he f
ree
dom
in
my
jo
b t
o t
ruly
sa
tis
fy m
y c
ust
om
er'
s n
eeds
.
I so
met
imes
fe
el a
la
ck o
f co
ntr
ol
over
my j
ob b
eca
us
e to
o m
any
cust
om
ers
dem
and
se
rvic
e a
t th
e sa
me
tim
e.
— N en .1. WI V2. N 00 0 \ CD 1■1
—1 Il
v—o

On
e o
f m
y f
rus
tra
tio
ns o
n t
he j
ob
is t
hat I s
om
eti
mes
have t
o
dep
end
on
oth
er e
mp
loy
ees
in s
erv
ing
my
cu
stom
ers (-
).
M
y su
per
vis
or'
s app
rais
al o
f m
y j
ob p
erfo
rman
ce i
nc
lude
s how
we
ll
I in
tera
ct w
ith
cu
sto
me
rs.
In o
ur
co
mp
any
ma
kin
g a
sp
ecia
l e
ffort
to s
erv
e cus
tom
ers
we
ll
does
no
t re
sult
in m
ore
pay
or
reco
gn
itio
n.
In o
ur
co
mp
a ny
em
plo
yee
s w
ho d
o t
he b
es
t jo
b s
erv
ing t
heir
cu
sto
mer
s are
mo
re l
ike
ly t
o b
e r
ewar
ded t
han
oth
er
em
plo
yee
s.
The
am
ou
nt o
f p
ape r
wo
rk in
my
jo
b m
ake
s it
hard fo
r m
e t
o
eff
ecti
ve
ly s
erve m
y c
us
tom
ers
(-)
.
The
com
pan
y p
lace
s so
mu
ch e
mp
has
is o
n s
ell
ing
to
cu
sto
mer
s t
hat
it i
s d
iffi
cu
lt t
o s
erv
e cu
stom
ers p
rop
erly
(-).
Wha
t my
cus
tom
ers
wan
t m
e to
do a
nd
wha
t m
anag
emen
t w
an
t m
e to
do
are
usu
all
y t
he s
ame t
hin
g.
My
co
mp
any
an
d I
hav
e th
e s
ame
ideas
abou
t ho
w m
y j
ob
should
be
per
form
ed.
I r
ece
ive
a s
uff
icie
nt am
ou
nt of in
form
ati
on
from
man
ag
emen
t co
nce
rnin
g w
hat am
I s
up
pos
ed t
o d
o in
my
jo
b.
i I o
ften
fee
l I
do n
ot un
der
sta
nd
the
ser
vic
es o
ffe
red
by m
y c
om
pan
yi
(-)•
I am
ab
le t
o
kee
p u
p w
ith c
han
ges
in
my
com
pan
y t
hat a
ffe
ct m
y
job.
I fe
el
tha
t I
ha
ve n
ot b
een w
ell
tr
ain
ed
by
my c
om
pan
y
in
how
to
in
tera
ct e
ffec
tiv
ely
wit
h c
us
tom
ers
(-).
I am
no
t su
re w
hic
h a
spec
ts o
f m
y j
ob m
y s
up
erv
iso
r w
ill
str
ess
mo
st
in e
va
lua
ting
my p
erfo
rma
nce
(-).
The
peo
ple
who
de
velo
p o
ur a
dve
rtis
ing c
onsu
lt e
mp
loy
ees
like
me
ab
ou
t th
e re
ali
sm o
f p
rom
ises
ma
de i
n a
dver
tis
ing.
I am
oft
en n
ot aw
are in
adv
anc
e o
f t
he p
rom
ises
ma
de i
n o
ur
com
pan
y's
adv
erti
sin
g c
amp
aig
ns (
-).
N 1-4
rn 1-1
.1-
.-4
Lt-1 /-I
■.0 /-I
r-- 1.•-■
00 1-1
a, 1-4
c) N
,-, N
N N
r N
.1- N
kr) N
■4::> N

Sta
tem
en
ts
Em
plo
yee
s l
ike
me i
nte
rac
t w
ith
op
era
tion
s p
eop
le t
o d
iscu
ss t
he
leve
l o
f s
erv
ice
the
co
mp
any
can d
eli
ver
to c
ust
om
ers.
Ou
r co
mp
any
's p
oli
cie
s o
n s
erv
ing c
ust
om
ers
are
co
nsis
ten
t in
the
d
iffe
ren
t o
ffic
es t
hat se
rvic
e c
us
tom
ers
.
Inte
nse
com
pet
itio
n is
cre
ati
ng m
ore
pre
ssure
ins
ide
this
com
pan
y
to g
ener
ate
new
bu
sines
s (-
).
Our
key c
om
pet
itors
ma
ke p
rom
ises
the
y c
an
no
t p
oss
ibly
kee
p i
n a
n
eff
or
t to
ga
in n
ew
cus
tom
ers
(-
).
t oo 0 \ C> N N N cn
ther
efo
re s
hould
be r
ever
se s
core
d

U -- 0 47.
11 c
E E 0
C.)
6 - >, Ts C < C a) C 0
a
0 0 To a 'c7.) c a. -6 0 _. — a) 2
0 4E5 a) -5 U.1
C 0
.). ,c2 w
N- CO 0 C) ct LO CD Cal 0 CO N- 0 C,) LC) LC) 00 C) CO ":1- VD C \ I C \ I LO C \ I CO 0 NI' I- CO CD N. LO CV i ,- CO N. C) CO N- N- h cc? co h co N- c0 cg (c? 0? co 0). cp co co N- c" N- c0 h
,- CV co
0) 0 co co co co
To • C
O c) co c) co 0 0 co c) c) c) co c) Q00 CDOC)0 0000000000000000000 0 0 0 c c 0 : c c c c 0 Q q Q Q Q Q Q Q Q.
1-
00C) CD CD CD Q Q. Q. e- a- N-
O Z. o -c, (7) z. 0 -C Ty tz 0 . o a) CS '0 a)
_,,, c 0 .,r. E --E fo '2 .2 .E.
ro , 0 m"9 c.), 5 _ 8 a)...
H< C9 u) _I C)
cn a) -a 'a) E 6 112 cg --.. ,..., 0 -o _) *-C 4= a3 0 .0 0 2 c■-= g- 9-12 8 ,- ,c ,,, ID. 6.,
Cl) m :.--ce W
-o a) CO .- E o .- 0- „a) L.- a)
a) .0 , 5
u) m 8 co ci) C
CO .-
" o "c 0 E \ CD .- z C •
a) -, • >, 0 15 o co Z al .0 c;'7 ;> S) , : a I 0 0 . . a) 0 •
_au, .0 L0 ....,-- _.___>, a) 6 .6a, a) ,-, o -E" ::: o) _ a) u) ...„,,, 0 .,- Q) -0 au .
0 t. o) "-._ o c .7) -e) 2- E 2 a) = '" .c7). 3 > 12 0 = > ,,_ Co .- c m ,_ ..,, a) 0 co o c -0 o 0 CL 5 Z E C/) 0 Y E 0 .c
c 2 'C' a) = 0 4= o o.
C/) C)
. cf) -0 (/) CD (D a) a) 4 0 .= 4= ..... o a) o. 03 C/)
AP
PE
ND
IX

________________ I

4 ;
0_ a)
Co
mpo
nent
Nu
mbe
r
0
anienue60

Co
mp
one
nt M
atrix
Ext
ract
ion
Me
thod
: Pri
ncip
al C
omp
one
n
CO
a. 8
co
mpo
nent
s e
xtra
cted
.
Whe
n se
rvic
e p
rom
ised
Co
nsis
tent
ly c
ourte
ous
Sin
cere
inte
rest
C
erta
in t
ime
Saf
e in
tra
nsac
tions
Ind
ivid
ual
atte
ntio
n
Bes
t in
tere
sts
Rig
ht fi
rst t
ime
Kno
wle
dge
to a
nsw
er
C 0
a)
Cd)
N N -D
E 4= ID 2
co co E 2 4;
te.
CV 0 Act cv A- N v.- CO CO CO 1.C) CO OD N- CD CO CD CO CO OD CD CO 0) 01 N- N 1.0 1.0 0) CO N O CO 0) 1.0 0 CD 0) Ad' CO CD 0) CD M C) CV 0 A- 0 CD 0 CV CV M N CNI s- CV CV A- 0 CD .
CD 0) .4- CO CO CV CV *I' CD .- CV CO CO 0 1.0 0 CD 0) 0) OD CO CD CO 1.0 •ct CO s- CD 0) CD 0 A- OD 1.0 Nt 0 A- CD CV N A-I' Act N (D N 1- A- CO 0 A- CO CO N 0 0 CV 0 0 CO.
CO CV .- CD CV CO CO CO CO CO CO 10 N- Tr M 1.0 Azt N- CO A- 00 CV CD OD CD A- I- CO et M (D Act CD CV 'I' OD C) A-- a) CD
•
N CO CO CO CO 0 a- I- 0 C•, 0 N A- 0 A- A- CO CO 0 ON MM
CD
10 CD CO sztO C) CD N- N CO CD O N N- O 1- A- CO c0 co (N (N N- O) N N- CO 10 CD CD Lr) 'cr N.- CD N- CD CV CO co to CV CD CD CO 0 CV CV At 0 CV C) c) c) .4: co co c) M c) c) 7 c) N 7 7 ca
C O C O
Attt I' 'I' CO 0) CD N N- CO CV CD CA CD CV 0) CO CD 'I'M N• .4- CO co (N NI- CO CO 0) CO A- CO ..ctO cO N.. CO
Cq V) 0.1 (0 CD Cn M In Tr 0 0 Cn C‘I 0 0 0 C I . . . . .
CV CV CD CO CO 1.0 A- 10 s- 1.0 CV CD N CD CO CV 1.0 0) 0) CO 1.0 N- 0) U) 03 c- CD CV CO CO N- CD CD Act O 1.0 1.0 N 10 CV CO N-
A-NNOCDOONN A-10 A-CON A-COA- N 7 co
C) CV CD CV 0) 0 CO CV 10 A- LO ca cp Lc) cp M o) co 7 A- CV CO CD A- 1.0 CD A-- I' CV CD CD N- 0 CD In CD CO Al' CD CO CO C) N- N1- CO A- CO 0 CO 0 CV 0 0 Nt 0 CV N
•
cp
1111 I
A- 0) CV CO 0) CD 0 CO CD CV et O N- CA CO 03 CD 03 03 CV Lr) N- CD At CO N s-CD 0 CV .- e- CO I' CO 10 CO A- I' CO CO
Nr. C1: CD rl CO co r-- r-- Lr) co co r-- Lo co c) 10 At r•-•
E O

APPENDIX III
Table 1. Regression analysis Customers
Dimensions Standard slope coefficient
Significance level of slope
Adjusted R squared 0.54 (p<0.10) Tangibles 0.219 0.49
Reliability -0.009 -0.013 Responsiveness -0.052 -0.054 Assurance -0.075 -0.107 Empathy 0.43 0.50
Table 2. Regression analysis Employeess
Dimensions Standard slope coefficient
Significance level of slope
Adjusted R squared
Tangibles -0.147 -0.420 0.14 (p<0.10) Reliability -0.010 -0.025 Responsiveness -0.170 -0.242 Assurance -0.013 -0.014 Empathy 0.111 0.197
1

Table 1. Antecedants to Gaps 1,2,3, and 4
APPENDIX IV
Gap Antecedant
Item Dimension Mean Std dev
GAP 1
Market research orientation Q 1 4 0.58 Q 2 4.86 0.69 Q 3 3.14 0.90 Q 4 3.86 0.69
Dimension score 3.96 0.70 Upward communication
Q 5 4.43 0.53 Q 6 4.29 0.76 Q 7 4.00 0.00 Q 8 3.71 0.49
Dimension score 4.11 0.20 Q 9 Levels of management 3.57 0.79
Dimension score 3.57 0.79 GAP score 3.88 0.08
GAP 2
Management's commitment Q 10 3.29 1.70 Q 11 2.43 0.53 Q 12 2.71 1.38 Q 13 3.14 2.19
Dimension score 2.89 1.35 Goal setting
Q 14 2.29 0.49 Q 15 2.57 0.53
Dimension score 2.43 0.35 Task standardisation
Q 16 2.14 0.38 Q 17 2.00 1.00
Dimension score 2.07 0.53 Levels of management
Q 18 3.00 0.58 Q 19 4.00 0.00 Q 20 3.86 0.38
Dimension score 3.62 0.23 GAP score 2.75 0.67
Mean scale : 7 = strongly agree, 1 = strongly disagree.

Gap Antecedant
Item Dimension Mean Std dev
GAP 3
Teamwork Q 1 4.8 0.68 Q 2 4.03 0.62
Q 3 4.2 0.72 Q 4 4.71 0.86
Q 5 4.4 0.98 Dimension score 4.43 0.57 Employee job fit
Q 6 4.11 0.80
Q 7 3.83 1.07 Dimension score 3.97 0.90
Q 8 Technology job fit 4.80 0.83 Dimension score 4.80 0.83 Perceived control
Q 9 3.74 0.82 Q 10 4.40 0.50 Q 11 3.23 0.69 Q 12 2.83 1.29
Dimension score 3.55 0.47 Supervisory control systems
Q 13 4.51 0.89 Q 14 3.17 1.27 Q 15 4.31 0.57
Dimension score 4.00 0.82 Role conflict
Q 16 3.11 0.63 Q 17 3.00 1.03 Q 18 3.57 0.88 Q 19 4.23 1.11
Dimension score 3.48 0.55 Role ambiguity '
Q 20 4.14 0.91 Q 21 3.89 0.63 Q 22 3.94 0.73 Q 23 3.20 0.68 Q 24 4.60 0.85
Dimension score 3.95 0.36 GAP score 4.03 0.46
Mean scale : 7 = strongly agree, 1 = strongly disagree.
2

Gap Antecedant
Item Dimension Mean Std dev
GAP 4
Horizontal communication Q 25 3.54 1.12 Q 26 3.57 0.56 Q 27 4.74 0.61 Q 28 4.20 1.11
Dimension score 4.01 0.38 Propensity to overpromise
Q 29 2.69 1.02 Q 30 4.49 0.51
Dimension score 3.59 0.56 GAP score 3.80 0.30
Mean scale : 7 = strongly agree, 1 = strongly disagree.
3

Table 1 . Comparison between scores (GAP 5)
APPENDIX V
;Customers) Expectation score
Perception score SERVQUAL score
Mean Standard deviation
Mean Standard deviation
Mean Standard deviation
Tangibles 5.90 0.53 4.76 0.61 -1.14 0.19
Q 1 6.06 1.25 5.01 1 -1.05 -0.25 Q2 6.4 0.73 5.4 0.73 -1 0
Q 3 5.09 0.65 4.31 0.6 -0.78 -0.05 Q4 5.69 0.67 4.1 0.42 -1.59 -0.25
Q 5 6.27 1.06 4.99 0.58 -1.28 -0.48 Reliability 6.03 0.05 4.92 0.37 -1.11 0.38
Q6 6.06 0.54 5.04 0.43 -1.02 -0.11
Q 7 6.07 0.49 5.11 0.71 -0.96 0.22 Q8 6.03 0.51 5.06 0.56 -0.97 0.05
Q 9 6.04 0.46 4.26 0.61 -1.78 0.15 Q10 5.94 0.48 5.11 0.4 -0.83 -0.08
Responsiveness 5.47 0.46 4.74 0.48 -0.73 0.23 Q11 5.97 0.51 5.07 0.39 -0.9 -0.12 Q12 5.41 0.67 5.01 0.36 -0.4 -0.31 Q13 5.64 0.68 4.86 0.43 -0.78 -0.25 Q14 4.87 0.45 4.03 0.17 -0.84 -0.28
Assurance 5.6 0.82 4.61 0.49 -0.69 0.37 Q15 4.91 0.44 4.2 0.4 -0.71 -0.04 Q16 5.97 0.64 5.09 0.44 -0.88 -0.2 Q17 5.43 0.81 4.73 0.45 -0.7 -0.36 Q18 6.09 0.58 5.03 0.51 -1.06 -0.07 Q19 4.1 0.42 4.01 0.12 -0.09 -0.3
Empathy 5.80 0.72 5.07 0.31 -0.73 0.48 Q20 6.06 0.59 5.00 0.38 -1.06 -0.21 Q21 4.80 0.50 4.77 0.42 -0.03 -0.08 Q22 5.83 0.48 4.99 0.32 -0.84 -0.16 Q23 6.50 0.68 5.5 0.74 -1.00 0.06
Mean scale : strongly agree = 7, strongly disagree = 1.
SERVQUAL score = Perception score - Expectation score SERVQUAL score is negative if Expectations exceed Perceptions. The more negative the score the more undesirable the result.

Table 2 . Comparison between scores (GAP 5)
ymployees1 Expectation score
Perception score SERVQUAL score
Mean Standard deviation
Mean Standard deviation
Mean Standard deviation
Tangibles 5.96 0.44 5.32 0.47 -0.64 0.19 Q1 6.06 0.42 5.6 0.5 -1.05 -0.25 Q2 6.09 0.85 5.09 0.74 -1 0
Q 3 6.37 0.73 5.6 0.5 -0.78 -0.05 Q4 6.09 0.61 5.71 0.46 -1.59 -0.25
Q 5 5.20 0.58 4.6 0.88 -1.28 -0.48 Reliability 6.23 0.29 4.35 0.28 -1.11 0.38
Q6 6.17 0.51 4.31 0.47 -1.02 -0.11
Q 7 5.94 0.24 4.31 0.47 -0.96 0.22 Q8 5.97 0.66 4.83 0.38 -0.97 0.05
Q 9 6.51 0.61 4.23 0.43 -1.78 0.15 Q10 6.54 0.61 4.09 0.51 -0.83 -0.08
Responsiveness 5.93 0.81 4.31 0.29 -0.73 0.23 Q11 6.4 0.65 4.31 0.47 -0.9 -0.12 Q12 6.83 0.57 4.06 0.24 -0.4 -0.31 Q13 5.2 0.41 4.14 0.36 -0.78 -0.25 Q14 5.29 0.46 4.71 0.46 -0.84 -0.28
Assurance 5.47 0.41 4.44 0.32 -0.69 0.37 Q15 5.86 0.36 4.26 0.44 -0.71 -0.04 Q16 5.03 0.17 4.69 0.47 -0.88 -0.2 Q17 5.09 0.28 4.21 0.41 -0.7 -0.36 Q18 5.89 0.32 4.86 0.36 -1.06 -0.07 Q19 5.57 0.5 4.17 0.38 -0.09 -0.3
Empathy 6.03 0.51 4.65 0.46 -0.73 0.48 Q20 5.83 0.38 4.03 0.45 -1.06 -0.21 Q21 5.51 0.51 4.57 0.5 -0.03 -0.08 Q22 6.06 0.42 4.94 0.24 -0.84 -0.16 Q23 6.71 0.57 5.06 0.34 -1.00 0.06
Mean scale : strongly agree = 7, strongly disagree = 1.
SERVQUAL score = Perception score - Expectation score SERVQUAL score is negative if Expectations exceed Perceptions. The more negative the score the more undesirable the result.

Table 3. Comparison of relative importance of the five service quality dimensions (customers).
Importance Expectation Perception X a Rank x a Rank x a Rank
Tangibles 4.57 0.60 3 5.90 0.53 2 4.76 0.54 3 Reliability 4.76 0.46 1 6.03 0.05 1 4.92 0.37 2 Responsiveness 4.23 0.64 4 5.48 0.46 4 4.74 0.48 4 Assurance 4.62 0.55 2 5.30 0.82 5 4.61 0.48 5 Empathy 2.97 0.61 5 5.80 0.72 3 5.06 0.31 1 x = Mean, a = Standard deviation, 1 = most important, 5 = least important
Table 4. Comparison of the relative importance of the five service quality dimensions (employees).
Importance Expectation x
Perception a x a Rank x a Rank Rank
Tangibles 4.46 0.66 1 5.96 0.44 3 5.32 0.47 3 Reliability 4.34 0.80 2 6.23 0.29 1 4.35 0.29 4 Responsiveness 4.09 0.56 4 5.93 0.81 4 4.31 0.29 5 Assurance 4.20 0.83 3 5.49 0.41 5 5.49 0.41 2 Empathy 3.63 0.60 5 6.03 0.51 2 6.03 0.46 1 x= Mean, a = Standard deviation, 1 = most important, 5 = least important
3

Table 5. Comparison of service delivery and standards
Service delivery
Service standards
Performance standards
Management's perception
Mean Stdev Mean Stdev Mean Stdev Mean Stdev Tangibles 5.17 0.98 4.50 0.55 3.50 0.55 5.96 0.44 Reliability 4.50 0.55 4.50 0.55 4.00 0.00 6.23 0.29
Responsiveness 5.00 0.00 2.17 0.41 3.00 0.00 5.93 0.81 Assurance 4.50 0.84 2.83 0.41 3.83 0.41 5.49 0.41 Empathy 4.50 0.55 1.33 2.07 2.17 1.72 6.03 0.51
Grand Average 4.73 0.58 3.07 0.80 3.30 0.54 5.93 0.49
Table 6. GAPS resulting from service delivery and standards
GAP 2 GAP 3 GAP 4 Tangibles 0.79 -0.67 1.67 Reliability 1.73 0.00 0.50
Responsiveness 0.93 -2.83 2.00 Assurance 0.99 -1.67 0.67 Empathy 1.53 -3.17 2.33
Grand Average 1.19 -1.67 1.43
Mean scale : strongly agree = 7, strongly disagree = 1.
GAP 2 = Management perception of customer's expectation -service standards
GAP 3 = Service standards - Service delivery
GAP 4 = Service delivery - Performance standards
4

AP
PE
ND
IX V
I E
nv
iron
men
ts w
her
e
SE
RV
QU
AL
has
bee
n a
pp
lie
d b
y y
ear
,--.
cu
as H

Fin
din
gs &
Re
sea
rch
Rec
omm
enda
tions
a)
-.0 a)
0 cn E-4 0:1 - - = ...._ r" 0 1.-. 03 er's
,-C .,_, an " cn c.) -1"' (1)
= cn (1) a) *1 -
••••-■ 4-■ r-. • •-■ •-• i•-1 . ,.., '''''' g • ,-.. 0 ..< (I
,
.. ° > v.a =1 > V)
a • > ;' Q cn - •-• -.) .... r'Y cl.) cll = cfc ...."‘ .4-, ci) ,--, .-..
cu a.) Et) 0 cn ,-- "C) g 4-, .,.. cu cp (6. e.- • .... 0 co ,_, = 0 a4 .._ -. ..., . ,...• a..) r 0 ---,
m= Cl) Cn .--■ , ' - 1 Mt 1-o g > a) • ^' g -0 cn = 0 0 cs up 0 0 0 '.1-4 .",.., ,__. • ... -I-. cn
_, cn cn .- 0 7:s ,,, = (1") = 1
• 0)
■/ 9■I -0 u) u) ,.., ,--1 g V) g 0 a) as -=
v.■■ 0 0 0 . ,.., E = • '-' .,-, . •-. ,-. r.r) ,..•, ..0 co 0 i... s''' cti con '70 "0 a) 4--. c„-
' an 0
.-■ 0 CL) .... a) = fa -0 g ''' 1... C.)
0.
> 0 a) .- a> s•-• _ , c.) x 0 • -. , 0 1-• ci) . PIX. CS 0) 4-, -of till Cl) ca. g 4::
a)
a) ,..0 4-4
-4... Z
Cn Cl)
a) <.) 0 ,__ 0 0 -
.4.-■ 4' Cq as cn -1-■ • ... V)
cA u, ta0 0. ct 6+ 0 ,C,'
fl.) ta c.) ;•-• CZ ^0 rz)
7:, ›.la rn (1 ) -. . n , ,.. .... - y..,
0 0 s. 0 00 6. ,..Z 0 c.,..4
._. -4-. "'-' 0 c..-1 4_, , to (.6 0 m '-' = a) a) a) )- cn E 1-, _, .4 • 1..
= •-• V) ;-' •••• 1. 4... -4-, ,..+J cn
cn a) L.' . 4; ..-9 70 4›. "Ct
0 a) 0 4.4 • -. 1-1 = 1.., > •-• c/D 1-, ;-.
4... ,,, = cu ci-o <1..) c4-1 0 cn 0 -0 0 (4-4
.F.,
CD )
0
= 0 0
n cn 0
cl 0 V)
;•••I 0
4-4
A-.
0 0.
cn
0 c6 Cl.) "a
1..a
CD i•-■
cu 4-'
- co, ,__, 40 0 at 0 = 6. ,, 4....
CC: > ° I,
4-.. • >, u) -4-. 0 ----. • -, 0 cti ... as t..)
1 • ,-.. g 1-1 nz:3 cr ''' 0 (I) . Th • ,.. 1..' W C.) >.1 01 ° ..-' > CI. >••
,
77).,_, f24 -0 ° ,.., a.)
Cl)
CCS I -, - 1 Ci) g > C/) 0 • -■
as
0 -4-.
"0 ( a) a) "1:' .4_, = 0 al cn c) as i•-■ . ,-. ,.. =
vSZ 6. > w ••= ©
as -,-. ta •-• s.-• +.4
1■4 0 ci) I-• cn 0. TS "1::, 0 - 0., = 0 (I)
c..) Ufa)
E w 1) CI a) = ••••■ ;._, • ,..., = a> > a) ›.., --, s- . ,c ....t,
v= ,42) a) cn rn
Crl ri)
4) C..) ..i■•+„,
- q-, cf) "c0 pg o 1■I 0 -4. C I p.. = • .- ■ ,.
'''' ...a MI ra. el) C4 03 = C.) 6.
,• ,-. i. >-+ _ _, 0.) -,-. 0 ,,,i IV A-• • .. • '-' -■ c.) = c..) 4) 0 ,-. CV; Cl.) "C.:: a> Cl)„ cf) ct 0 0, cu 0_, "' 0 =
C4 rn s.. Cl) g Cr
En a)
° g CL) = cr.
Cl)
0 0 0
Mo
der
ati
ng
var
iable
s
0
0
Z
SER
VQ
UA
L
app
lica
bil
ity
0
,.. 4-, --, cn 0 0.
1.. 0
Sa
mp
le s
ize
&
Indu
stry
a) c.) -
cn 0 Cl) cc! .bill 0)
a) - 0 a) • •-. 0.) c.) cc) s•-• - -•
IN) 4-4 $-, o . ,... 6A•1 ° as .4-•
0 as > " o? as c,) ,•-• o s. 'as g
VI -c) -0 a) • a) -.0 • •-■
Cl) - s-, , -0 .-•
ctgas-cn. -•-•
-. ,.. C) g s.. > z: ra, ct 4., =
• •-■ CD 0 C1,. . 0 CL) 0 V. N 0 Cn C.F.:: (.171 F-4 E 1-1 ,-.
7:7 0 •
u) -0
g 0 el) 0 n ••-' cct c...) - ••-• ,_,
,..= • •-• - ....., ". a) • --
__, C.) 0 a) a) 0 S. i-I 4., Cl1 - 0
-• g
7:1 0 cat
" C> 0
c1) oo
-0 a) = 0
-
C1) 0 CA Cl)
0 s•-■
s••• I-,
g • -
C.) cei 0 cn Ia. ° Cl) 4-. a)
- 0 . , • -. s•-• g , cn s.., c,) n-ti c) a) 1:4) a)
a) 0 E s.. >, c..) +.,cu g a) g >, 1.0=000000
E 70 i.;', „ as ct • •-• z ,.= as
0 0 U 13-. ' 7 ° -
;_, Cn .-•■ 0 gao 0 0 P. • ."" a) 0 0 Cl) ,+-1 XI 0 CZ C'''3 C .1i 4-. 0
Ob
ject
ive
of
stu
dy
I ;-• -4•-■ 0 0
,--1
.-• •-• -. a) to H
cn • ,...
g 0 s.. ... as .7_, • •-• - ..- c..) • 0- •-• Q $. (1.) ›, 0 4... .1■• ct
NV) ° E w 0 -,-, cn t. .....0 o ^, Cl) • •-• • •-• = - s-i. • •-•
-0 ci.)asEm› -- c> " --'
a) > cu = ,.., a) g • -. ;•-, g ta,
H 4-• -r.-.3 0 .. = cn 0•' 7:2 0. czt ctt
s..
M
Z C.)
"CJ Cn
.-• a) ....• •-•
g os
.-• c.1)
Au
tho
rs
,--,
at 0, i 00
oo - 0\
cts E Il . al '••■•'
Cl) '4 >, 4-, s. 0 s- as N
gl." -, =

Fin
din
gs
& R
ese
arc
h R
eco
mm
enda
tio
ns
ques
tio
na
ble
. P
rob
lem
s
Mo
de
rati
ng
varia
ble
s
a) g 0
Z
SE
RV
QU
AL
app
lica
bil
ity
.4-, ›.., I-, ,_, ›, 0 • 4.
"z
ma c— CY v) •-• 0:1 ^ > > -t:J (1)
11 i. rc) (24 (.4-‘ g (4-1 W o c 0 c/)
Sa
mp
le s
ize
&
Industr
y
—,
CA . , Q 0 cI ̀-' • •-• ,. 0 ' " 0 0
0 $-■ ,,, „T.-, ,.= • ,-. 0
0 cz ;•-, , 0 , c 0 _ cn
7:1 rt:J '''' ^. " I) at 0 cyj VI et g a
.,_, 0.) 0 (I) i• . • ,-.
CD i.., a)
C) 0 CL. o , art 0 00 0 rd 4-4 {--1 Q. ..a
a)
ct c..)
o -Ea $-, 4) 00 ,>" 5 ,..,
rj —,
g o — 0 at -4-. ci;
e) •■•-• a. ,.., ;••• ,,,,, 0-
,—, a) ..., 0 a. 0 c# ,g
Obje
cti
ve
of
stu
dy
cn 01 ,_a.)
0 ''L• Z 0 0 ° C') •-• , •-•• 0 —■ cn 0/ 0 0 Ca. el, 0 4-• > E ;-4 (24 ,..4-)
-(:) = -c) 0 = W ..- = H ccs cn -c) c
Cou
ntr
y
-c, cn a) 0 4-, '' g 2
Cip
Au
thors
g cri rm.,. C)
P cr\ ;"" on al U ,
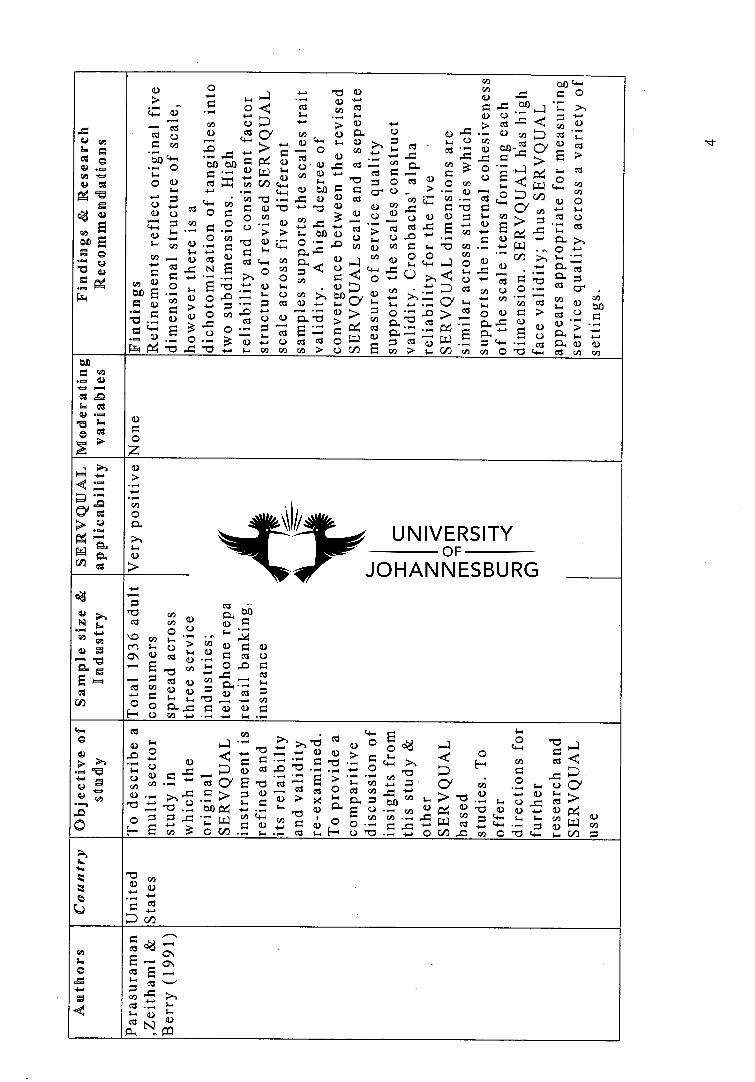
Fin
din
gs
& R
esearc
h R
eco
mm
en
da
tions
Cl tO 4-1 a) o -,-. nti a) cn -,-. I-, 1-- o ,-0 0 0 -, -4-' .-- - o < as cA ocs 0 ,-c bo ,_ ;-, >-, 4-, 0.) ;-, .,- ;•-,
..... ....., ° ..c.). -0 .., '- cu cn 0 > 0 „. > - CI) ,-. Cl::: o 0 ,-0 .„ 0 ,,„ Cri C.) 0 Cr3 Cy C4 0.) a. CC; y._ .--4 ,}-1 m 1 4-4 ;_., tl) ›, Z 1_, 0 .1) cci > 4-• .. ..., 1■. 0 ;. Cl Ct • bi) .-1 CY to 4-4 •,-, -0 4-, _.., = a) w ,-. 0 cn ,..., • r. 1
6. 4-, C.,_, 0 b.0 = = cr. o _ > •- a) --, 0 rn -,-, . rn -0 • ,-. ,-0 a) a) al c„ c.,..,- v) .,- ca 4_, ......, cl) a) 0 0 -,-. as (4-4 ") 0 a) -0 4-' -0 a) a) C4 = = li = k...7 cn 4. 1. 0 o o as 0 0 cn cn a) o 0 ° a) a) 0 ;-, u) .._
c,--_:: cn = 0 0 • ,-, 0 ,„ ,t3 • ,_̂. cd as ,4 E -.- • 9. cz
> > ;••• izo a) .-- 0 an -.-- ... ci.) 4-' p4 = 1-, a) ,.. o u) 0 g CI-) r„.., 4-'
P. >-, ,7-1 0) • ••• 0 • ,--. ;, cn CU . ,, e•-■ - . cq_, ,-0 co) 0 VI 0 $..., "0 r/3 ..-. -I-, F-6-i 0 -4.- 4-, .--' ,", PL. Z , cn Ch ,,, 0 0 Ci) ›N Y-. • "' as 4-4 va Cl. _...1 '... ■• ''''' ;-■ (4-I l■ 0 0 0 „. g cl -C N E 0 ti 0 ''''', C') < (" .-= C j .44 i•-■ .g ,_._, - . ,. CCS ,r,-- g -4-+ • •-. - ,--. 0 ti g 0 4-' >1 -"' 0 -I"' cc: g 70 71" g 4') """ 0 $_, E -0 -4-, a) ;-4 .4-. CI) 0 C6 • . ,.. at cn 0 0 • "" cl cr. to •- 0.) ,r, _ 6. 0 ..) >., to ,-v , •-• >, — ,..-v 4.-, cn • .--' '-',.. cn ,,,. cn
= a.) u) • -4 = as 0 4-. 6. s•-.., ..-- 6. 4-, • -4 •-■ 6. 6. cn ,.., ..... to ... , _ 6,
,-, .., ,., . ,-, 0., .-g (1) 0 ..,, ..- 10 c4:: E 3 = o — 7,,, E — = 124 ms — 1.-- .4 1 (..) .... 1 , ro a) :'-' '"' . r T i'-‘-' E 4- E — 0 — 0 — ,0 „, 0 cc; d 0 ,-, , 0 cz 0 ,--, ... 0 4-4 •,--, ozi Sa. a) a) f=4 -0 -0 -0 •,•-• $-■ cn cn cn > 0 Cr) c/) > :-. (1) cn cn 0 "0 4-4 c cn cn
Mo
dera
ting
varia
ble
s
a) 0 o z
SE
RV
QU
AL
ap
pli
cabil
ity
a) .„ 4.-. ..-1 rn O al.
1-, a) >
Sam
ple
siz
e &
In
du
str
y
-4-■ i: .--■
= CCS -
cn rz, to C cn a) a) =
0 c.) r... •--* ■.0 cn • -4 • ^ ,••• cr) it (..) > co cu g a,) cs\ a) mit ;-1.) 0 ad c.) N •-• i ■-• w ;-■ 0 -0
_, '10 .4-, = Cl ,-. , cq cu cn ":-4 6, Cl Cl) 0 ru = tu al ".., $-. , "0 ,_.., •,. cn = 0 cn -4-. • 1-1 -1,-. I.•■ • •-■
Ob
jec
t ive o
f stu
dy
= 4.1
0 i.' )+.I ""' >1 ... rcj CZ1 rrt .4-1 ,' . .., 0 ° '" -i
-0 ,_] 0 03 ,- o
0 ...1.4 i•-■ ''''' 1-, +. U., 0) 0 = 7.4 0 -4 0 g "". ,,_,' "" g 10 • •-■ ,.., c+-( ›.‘ ,__.,.< cn
$-■ ,-= -0 -0 c.) 4,,) = ,-. — , , • , •-• cn • 0 cn cn • •-. -,-' 0 c i Cy E .7, cs ,--, s-, Ci) +.1 =
,_. Cd Cl 0 Cl c . I ) z 4-. a ... cuV) . ,.., i... 0 CY
-0 > 0 a) -.4.... ....,.. o .,-. ›..., ._, 4-) X $-' la. 0 ti) ci) 1-, > ̀-' - .--. I. U - Cl .."-- "CI +' () to g4 '''' - , a) P-. g c.) .,- cn a) 1:4 a) -0 a) a.) •,, a) p4
-0 u) u) •-• -0 0 0 0 ,.= • ;:-.1 w w `4-' cn = 01 o 0'-' .,„ = = .,.., P4 'il = (4-, „, „ (,) , a)
„ -,-, ..._ 0 a) .4-, as ,, 4-■ •,- cu 1-,-1 En E-0 = cn 0 cn • .-, I. • ,-. czt ;-. H c..) 7:) • -, A... 0 cn „.0 cl) 0 7:1 ti-i ;-. up
Co
un
try
7:3 a) 0 4-, .„, ,.., 0 Cl
C/D
Au
t ho
rs = 03 v-4 cl ON E — C7\ Cl E 6. Cl ....., = cn = >1 1-•• ctS..... s-, 0 $. Cl f....1 (1) 44 ''... PI

]Fin
din
gs
& R
ese
arc
h r
ecom
men
da
t io
ns
ot
gl "=1 ci -•
4- O x o
4-■ .4...
(3) • .-. ,-Z
o cn 3 3
,, ON g _ ON 0 ''' C \ -,-. cn ,-.. 1-1
`..../ 0 Cg
!..1 :" ,.. = .-1 -4-. • ,-I 0 al 4-1 7,
-,-, 0 c„ 0 0 cn U = g 4)
cn al •,.. = ••_• ..., a)
pi. >
0 x = $-, En
(1) 0 sa, 0 $.•a: 0 7)
-g as - 0 E-4 a., -:.:
c =n
._, E .1m.
s-, "0 C•F-I = 0 04
,--. E ,C cz E t
cr) orz4 4) En = - . ,4
036,
a/ el 04 a) „1:16c4) 0
ca 0 ta, E 03 a) g Z
Mo
dera
tin
g
var
iable
s
a) = O Z
SE
RV
QU
AL
app
lica
bil
ity
a)
-• -,-, -• cn O
tz.4
Sam
ple
siz
e &
In
dus
try
'
"0 cci
00 en •••
0 r.) os 1 , c..) a) • '-'
-0 4:-,-4
coc = '-" ••, 0 0
0. • .--. 0 > u) 0 cn 0 = rrl
0 --,0 c)a.) •.:4 : 0 U E."-4 .....' 0
ta0 g g
0 .4-■ • •--. cn .4_,
7:i C el cl. 0 8
r:C1 C-)
Ob
jec
tive
of
stu
dy
g (1) o
g -,- ,-.-* a) cN 0 oct g ,g eNI • g s. .4_, .1. .... a) ms cl cl +. ;-, -1-• ›. 0 0 g c.) 0
^0 = ' -* b.0 17; ,_, g, 7=1 0 m•• • ;... X =
E-4 0 a) ct
cn 4-
cn a) 0 _, .... E ? i. ,, • ,-1 0 0 ir, ti-i r. g ci) o aj a) Cl) = 4-■ $-, a: -,-. ,t 0_, , ..... il) - ,..,‘... C.1
cn $-■ 0
co 0 -•
6-, cu cn
g
cn as co,
0 ›, • c7)
4-, g - 0.) -" -,
cl g • Cr "0
,... .,.. _., -0G -cl ,-,
0 , a
0) > `4 f:4 a) ,
1-64 P. CA
Coun
try
14
o 0
cn
MI 0
;.•1 C••4
<4
Au
t hors
4: '+-1 0
0 cn 0
GO
C/3 ■••■,
(1)
,.....,
ON v■I Cr■ a) Z s-,--t

Fin
din
gs &
Rese
arc
h R
eco
mm
enda
tio
ns
W) 0.0 =
Z rz
44-4,
:-.
.4-• ' o >-, -..-,
a) .,-. " :-. ,-, -• 0 ,--
;-, • •-• a) et as ;-, ,-, • -
i-+ Cd "0 C:1" ° Z 4!
a) 0". • "" •
^ cet , 0
CU Cl.) 01. • 4. 4-. 0
-0 .0 c..) (Ts • -
-0 ..- -c) ci.) Q > -0
0 • '-' al " c3
.1 , a) c.) c.n ct ..z ..-. cn cri=cnctr n _,
oc 0 a
17:: ,_
= 4_,'-' 0 ci ,,) 1-1 • '"' e" -1 , .... Ct ,13 F ,..1 Cy C.F.I 3.
.4, C.T. CL) 1"' ,_, rn Ci) = ft, CZ
C•S..4(1)0'-',.,J cz c > 1-L4 4-.4 -0
Cr "Ci 0 C) ,,,i 44 c'd =
a) 4_, 0 a) -,-1 c.4 ,.= .-,
" C1•4 " ul 44 4-■
. ,... Ci) 0 > V) C.) 'JD v. =
cd crs ,, a.) -4-. 0 ;, a
0 0 0
r. ° (.4) ;-.''' =r 0 -1., Cn = C.) = CZ: -I., "..■ • ...■
' 7:1 a) .4
vl -0 , cl
.-0 cu C.F-(
,.= ,..„ "0 0 cn CI) $•-■ = a) .
c/ c.) >, „ el ,... • •-• ..c)
al ;-■ F., =
4.) co) cn a) us a) .,,,w=s•-•=c,) -"-' C I) 0 cn .,.., ,o ,.., 3-4 •
4 -I... -4. , = ..= C•II CI 0 CZ 0 4" 0
'T. 1.. 41. CI-1 a) ,--, a) • -, ;-. _. al, ..0 cs „0 ''' - ,-. Z -4--, .-C) -4-■2 ,• M cn 0 -I , 0 E = 0. "0 =
0 = . ,...,'" 0 0 0 0 '" czt cr) >-, cq 0-• „
Mt 0 0 4) ''' .. Ji•i- H C.) pC) a) 4.1
Zcu
. _. ;•-•
,..., (L) ...-, c.4_, .,_, rw ,___, 0 ,-. = ct CCI Cll 0 V)
0" ,--, 0" ua 0 . 0 -4-, cZt 0 o a) , 0 0 i- al > 0 0 0 = ,.=
- a) • -• as cn -'-' u) ,..= 0 ;-■ 4-■ ; ■ cn a) 0 z 0 0 a)
rn 0 cn 4-4 E g C..) .•,-. a) czt = -1- -0 Z "0 -W (1--, (3" = • .. = i..1 0
,.° CZ 3..1 .` o cl MI -,...1 0 czt
$:). 0 g E = '-il • •-•' ;. = o .4- o to a.i a) 4-1 66 7:sc.)
1.-4 0 • 1:4 1-.cc;?: .-9 6:1' 14$:14 .: F. Ci-I ril e.41 . ,..., '7, C..) , 4" ri) 0 'CI • .."( 0 - >. > cl • ''' > 0 0 3.-4 ,-0 -.., •4 , 1.) 't g Mi i" - l' 4" s•-• a) ,-, c.) a.. C: cn
cn
a)
^.
cl) vl
'73 0 = F., 0
^.
ta
v. .,..,
: L., ii 4-' (1) '",
-4 s., op
atcU = c.) ;-' = ta.,
Mo
dera
tin
g
var
iab
les
(I) ,..Z -1-'
..-.. -
cn to cu
= = c-) 0 • ..... • ,,_'-' .- ,u e" ' al. „.,
„ - r" c-) 43 a) X '''' = a) o 4.,
^Ci cll = • a) c,)
4:0 0 "0 „, E t) .- 0
.,...-" a) 0 s-, > ,-, > • ,'"' 0 • ,-, ,-, ,-... .., bp <1.)
ai - o ,,;-• 0 0 > a) > - 1-• = ;-' = u) ct (I) lo CI • lo 4-, 0 •.1
cl l-•
. ". -_, ". 0"
a) = cn
_ 0 =
o E 0 ;.., cll .1 ■
as ;-, > 0 an o
= =
>, to _c-'' 0 al ta0 - > • ""
"'" • '^' = = (4
0. ,r) • .--, • ... -F,
SF
RV
QU
AL
,a
pp
lica
bil
ity
a) >
CCI to a) Z
Sam
ple
siz
e &
In
dus
try
-4-. =
C 0 \0
,--. al 4' ° H
. ,
,,,, 0
cn'-' o I$ $. Cl) i•-■ 0 a) cc; -0
"0 = = CI •"" cn 0 y_, = ;..I 0 a. 0 0 C,) 4-4
.4_, 4-. v)
(I) >1 ai 0.4 " '+-1
"0 4:10 ̂ g
0 • :-.- ,-. 1,_, 0 U -4. as 7:, g g a) 0 Cl 0 ^. 0 ,-0 U 0 4-1
Ob
jec
tive
of
stu
dy
CO .4 Cl bA
. ,-. 4-. Ch
>
0 t-4 H
(1)
-4. Cl c.) "-' ct =
ca4 7:2 a) .4 al
CD g = r= 0 0 ,-- c.) • -..
.4-. 0 Cl) a) ■-•4 a. E -,, O .4 a) E-4 rn 0 = g CY • = 0 CA (L) ,-.,, cn z ■• (1) = .4-7' (L)
CF.I W 2 X 7) = s•:, o CA a a) s. 0 = 0 Cl o'
a) a) ,
0 .0
a) a C6 at 0
a) 4-. C.) I-.
... = C.) I..1 0 a) >, v-. cc; = ..„•-• 4-. ._ .,_. = c+-i
u) V c.) cn Cl .
,.., .,... ..4 _cn
s... 1...1
Z C.)
0 ,- •-. =
a) . 't
VD..-,
Au
t hors
0.? = 1..., ,---, -■ 0 N
"-" 0, O >1 0. \ I... Cl ,..4 U E-• .....,

Fin
din
gs
& R
ese
arc
h R
eco
mm
en
da
t ions
a) i-, 0
)-4 $.4 0 0 0 -0 .
cn 't a) 0 4-' ›, 141 0 1.- g 0
cL) 01 ° ° ^0 ,-,'-' 4" 0 0 0 ,_, 0 •-. ..., •■■ 0 . ,, r•O >
• v-1 • •-, ;, 0 cy • ,..o .4-, = .1-• = Ct •-• <1,
>04 4)41 Cl0
-' =. 0 ;-.. s.., V) P. ;.4 -° a) 14 . -0 $. a) --
C./D ›.... tc.I., -A til a, W 3.-1 .4-■
CS . -,' • •-• .-N CZ g C/D (1) CI) CI)
C.) -• •+: Z a . ) ;'•' . C.) '7:j 1..4 - ,4 -- I 0, ;-, __, • , g . -1 ° a) g (1, o a) 'I'-, _0 0 > Z 0 , $-, ad 0 P-. al = g4 sa• a) ° .i.: 'f, up , ••••• s•-. _
Li — ,.... w 0 a, c„") 0
u, > 7:) )4 C4 > 11) o ci) .— 0 -,-, 0 ;-, = -•:
no c.) 0 0 .-, 0 p4 , .4-. • a) tO w --0,0' cct a) „, cn .. = a) '-'„, .
._, ;„ czi -■-■ ....... ccli -,
"0 ..o g cts • "" 0 4i CI. a) a4 *F. • Z CCS = , C.) , 0 -, •,, c., 4-1 0 c,m4 > -0 4-4 0 ad c4-4 c) -0 -0 o CID 0
__ O 0
a) 03 -,
H -0, rn ..., cn = -, ;.,., ,..,, as ' 0 (I, *
., 4 ,_, C., 0 -.*) cs ... CI 0 0 - V cn • -, 0 Z Ct Ct .1: 41)
,.= a., - - .,-. o ,,,f:1-' 0 o Q ..o '''' W cl) -- > 6 6
, ›, 4 0 cn " cn cd a)
0 = I" ..,_
_,"' a) ,_, 0 0 l' -0 0 g • en
vir
on
men
ts. A
ssura
nce
was
no
t in
terp
rett
ed
as
a s
epar
ate
Mo
dera
tin
g
var
iable
s
a) g o Z
a) 0 0 z
SE
RV
QU
AL
ap
pli
cabil
ity . ,..,
E
, a) >
ad OD 0 -0
Z u
a)
.... ,- 0 o
A•4
Sam
ple
siz
e &
In
dus
try
a) -,-. 0
'0 ›N ad •,-, I-. • , cn
C/) -4-4
r-, 0 a)
0 N > -0 -0 -, , 0 cr) g , 4, N 0 0 cn
0 0
,--
0 - c..) up -1-■
H a) __, -0 0•N ,,_, :1- cn
Ob
jec
tive o
f st
udy
r ,4 cn (vs cll .4-. ..
cn Q a) • ::: I-1 • ,.. • •-. cd
›.‘ 0 4=1 p• ...el v■■ >
a) --", at i...■ c n a) ,--. aS > s. ,-- ■ cn ■—.) = 0 al c.) o -o 03 , •,... c.) 03,... E -6 , . , - , , „ = H = 0 En .4a (I) c=6 ›-■ a) czt -, 64 cz
'4-4 ..—. 1 4 • i•-■ CO
0 0 • ^. 0 a" s-, 0 ta. i:', 4 -- c".4 a) 0
-,, 0 p 0 W = al C.F-1 0 44
0 0 $-■ 1•'..1 0 0 = • ,-. C..) (..4 E 0 •--14-' H fa, la. Cn c) . ,. 0" -10 0 0 cu c.) ad
o 4
,4 Q
cz a) ›,
'•-' ,-- 0. ;:, cl
PL. a) g ct cn Cr'
4r 0
a.) c» 4-■ g M czt 0 O • •••• o -. 4_, •,. • ,-,
> a) (I) m 0 '10 _,
1-4 ,-. 0 0 .4... a) -0 H cn a. a)
0 H
a) ..._
- • , > .--_, ;_, ',.. 4.) = cn 0-
cn a) c6 cn cd
c."4 o cn cn a.) ,. o
' cu 0 > +-• m o (- •1 vs
,_,,
w Hg "Ii 0 c/D • - 0
Co
un
try
-0 v, a) 0 -,-. - -,. g cc/
VD
0 -0 0 -,-. • •-• g s-, 0 c4, cAQ
Au
tho
rs
,---, c1 ,3 M
CA -•• en,
■••• 1 1. ,....,
= 0 $-4 6' -, a)
0 - 4-■
Pal 0 P.,
3 0
. ,...
V) C.4..,
V) e+0 0 n.zr
" ,..= e, ,--, 0 - C7N
"z:: Cal .._.,
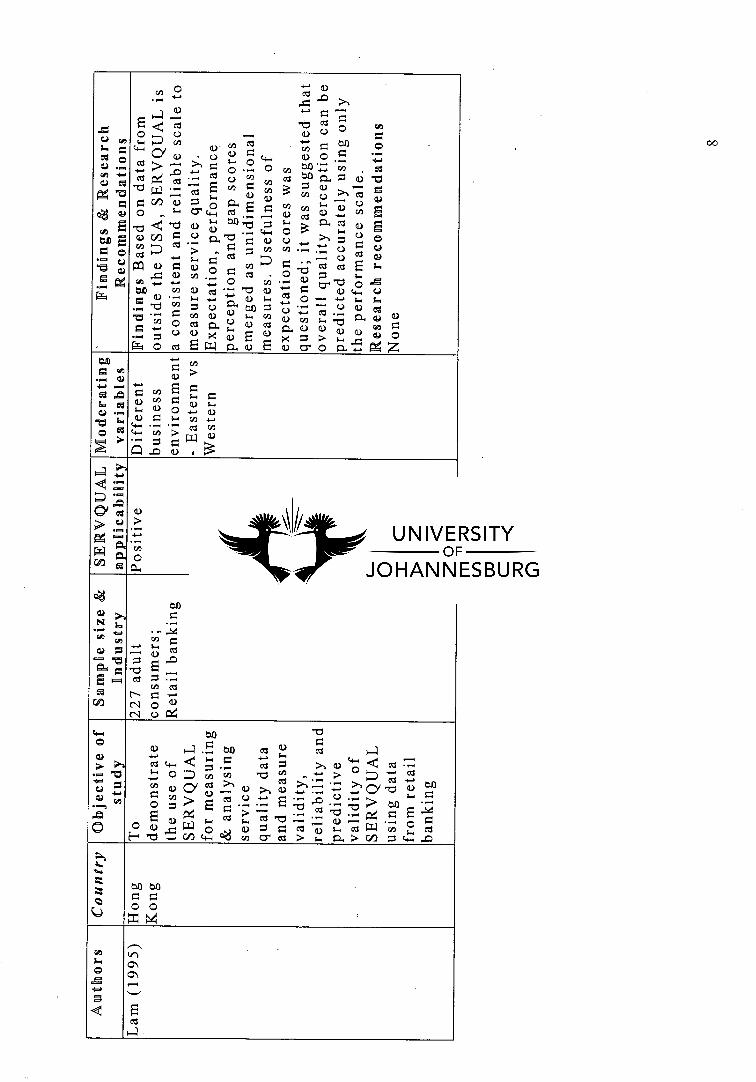
Fin
din
gs R
esearc
h R
eco
mm
enda
tio
ns
4-, ei 1 u) 0
al .... 4-. v.. r0 ›,. ■••Z
o_ ,_,a) .,-.• ,..., ,...
0 ,--, 0 .--. a) 0 0 s-, 1.-d v) -,- a) w cvl = bl) 4-4 ,-,, .m,
'••-• a) • c..) a) g cu 0 cts ,--. — ›, s. 0 c'" 4.,i .—. ■ . 0 aCC,"" Cl) . 0 01 P4 ft ,L.:" c,3.1 0° ̀";" Cl) c`:1 tp " (1.) ' 1 -0 w • ,... as cn = 0
cn •,_ ''" -••• 0 cn 0 . . C/D a) 0 " r:)., = (4 ,, .. .....
0 , " Cr (4--1 ct ,..- 0 a) _,.., ci) -• .1:3 ..: ̂0 cu .8 00 -c, = =—, g-, 2 0 E o cip g 0 cl.:10 • —'0 4—i 0
- ...... -i-, u) cl • ›— , g = cn cn . ,... . ,.., 0 = c..)
,-.. C, ) CI 1) 0:11 „ ) = a) Cl) = '" ms (Ts E 6
,..= 0 cn . ° cl • 0 7:) = s.. on .,_. .4-,
e. 0 cn - .•• CS I:1 0 ..= bk cn a) ms • .-. "ci 0 ' 4-1 Cd = (3) • •—' i. ... -1—',.., CU 1. 2 0 — -4•J 6. 6,
.,., 1Z7 Cl) = CU "' bO = 1-, • '—' 0 a) cl ... 4... CI . -0 • — g cf) a) 0 I—. Cl) 0 cn 4, • :$-* P. 4) c) C13 0 RS ra, iC:) a) cz " a) a) 0 0 co g = i-b ... = cg
0 0 E LT.4 g. cu E a) cr 0 a. .,—. g Z
Mo
dera
tin
g
var
iab
les
-,—, O c6 N
.., g rn E ,.. 0,) ci) 0 6, a.) 0 r°•'. _,... 0 a) g it C/3 4-a
4-4 • •-■ • •-. crj c6 LI■1 cn >
W V •-• z = p...._
Q ,..0 CI) I
SE
RV
QU
AL
app
lica
bil
ity
a)
... ....
CI3 0
gLI
Sam
ple
siz
e &
In
dus
try
b0
^ .-W 0 =
=c am ni 03 = • ,-.
ci) cc% N = .4-. N 0 CU N C.)
Obje
cti
ve
of
stu
dy
Cou
ntr
y
Hong
Kong
Au
t hors

Fin
din
gs R
esearc
h R
ecom
men
da
t ions
4- g z z a) a) 0 . ,.., c•-• cc: E :-.. _ g c.) cp 7::, a) a) u) cts • - a.)
4-4 0 cn 1-. 0 ccli ngt "g . = 0 cn
"" 0 ,.,;-' ›S ° 4-. "Ci z a) 4.,
g ct •— )•-', :44- .17: = o (1.) • "" em ̀-'" . ,.•
"(:) 's CI) r= = ,. V = -a E 0 dn() • "CI ..t CI • = -4-' • "" = 4--. 0 Cd g 0 = 0 0 - "1:3
›, ..,>, cct •,- c6 0 Cl a)
c k c.) "
-c::: g sa., g. -.-' x
as as -,-. E CD = 01 "--tict"-*C)w E o g
E .4 — crs cl) bA 0 0
* • -, 0 al 124 (L) • Ct 0 c.) <L) 4, C4•, . -4-. ,.../ ,-C) .-"ed, • "..' > U n:i ®40 ›, '43' 18 0 CA
.1i
• • ,-. cd 0 4--• 0 • c.) -0 1-T4 •-, > 0 = 0 ,_.1 g ••- E 0) la. .--■ P. 4 > as 6 ' "" 0 z E = =
;.., g 0 czt -.••■ '01, s. s_, ,4 t4.• z a) . g g (i) 0 c.) ••= w • --'
0 - •-• al • •-'
-4 't0 0 E 0 0,-- u '--' 0 = g 1-, c.) _ 0.- 6 0 a) ›, > ' "" -0
g al at -0 ad • -. Q .,... • I.. E =, 0 a) .r. cn p-''. :-, '.4■1 ei, , ''' ....1 • .... -I' 1.4 I:i V -4.. > = 0 • mg, g g ,.,0 - cz: ›. --, crl 0 —. tz g g -,- „, - Cl) CL) -4... WI ,... ;..I CCI ••••• -I-..
0 0,.•,.. OW Cl.:14 _9 0 _,CI) a.) 0 C.) C..) "0 4-, C/) ci 0 Ki Pgi cn Cr PA "0 0
Mo
dera
tin
g
varia
ble
s
z •••• g < o (/)
4-■
g z E a) rn g .= " ,._, a) 0 .,- 03
,4-, • - • -. , • ,-. ,_, 4-, i•-■ p--)
v•-■ g CA t4■1
.0 a) I < c?
SE
RV
QU
AL
app
lica
bil
ity
a)
4., .-• z 0
O•
Sam
ple
siz
e &
In
dus
try
Cl) 1--- g s•• -0 ( -) C c/D o 0 c■I 0 cn 4.) at .,..., . .. 44
. , I. = 44 ° a) C,, c,) c4.• g as Oota) 0 z 1-• 4. , $, a.) a) , ,. -4 ' .."! ,. 0 • ... = = (.....* • '' a.) • .... = 03 • ,...1 "4'.. "...' 4.,7', 0-■ . ,.., ‘,.0 .t. c4 CO
77j
4... -1
w °
' = Cl.) ,.0 • ■■■ ',.' ° = I... 0 ,7: o E to „ t-N1 E a) 0 o
od $t z a. 0 • ,... g = .4-, (4 cT, 6, as 0 .., ,.., . -4 g tr")= 0 =0 4a. 0m4--, ,„Og rl`n E0>',7 i- ;•• 1-., z •-• c.1-1 as ,_, c•i-i ;-. 00 000=0 . gooug a. 0 . g a) 0 V0 o es 0 4, 0 . c4:1 .. --I 03 ...• g c.) 4= • --, cn -.0
Ob
jec
t iv
e o
f st
udy
a a) ) g g
■-•1
cd...
$-, • •-■ VI CU 1•••■ ,..., V)
-• vs 0 .4■.b . . ,..,
CA '. -0
fa
L. 0 f=4 ct
cl) 0 > "c7ci
, ,.g g• cn r4 0 a) r• -1.-• ect cn CA -4-.. cn Cr
-...
C.)
ct" 03 .-.• ..... ,,,,.
CID <
Au
t ho
rs 0
z
as mg
> P.- \ Cl tr) .4...- k ,4 CI\ .,.- i"'' Cl ,-. ,--o
0-, 03 ......

Fin
din
gs
& R
es
earc
h R
ecom
men
da
t ions
a) an En . P.. o > cfl 0 0 cu o as .-... • ,-, >., ;-. .-. • .-. o — = ..... az sue.. :-. cs > ,•— 0 1—.1 •0 ;-, 1-4 CZ al ° ;-■ • ,-". • ,-, .‹ at
= > 7 > 7. ›. C.) /7.; Z
= cn czt 03 "'" at "--' s' -c) > m -4—■ cn ---4 CY > — CY a) = crs c = 4-1 0 ,..0 0 ri 0 V . 4-4,_. 4-- E r••,, ...:, as .1: • ,-. 0 CCS H ,:: a) c) -0 > *.< 1-?'
0 a) 4) Cl—,- 00›, czt0a) ;_,P4 .Erz4 0 "ai ... ;... 0 4.) w 0 ,•, 4.1 r.,) E " cn act = o n ...., P. a) 1-. a) = t cl ° s '
o
c-)
i) 70 cu z
t) -0
.-. k a) 6 i-, ,t,, , u] _ ,..z = — 0 = ,.= a, > cn ,--, 0 _ „.0 <I.) >1 = UE", 0 ■-.C1 e') a) E -4-, CCI • Mt Crl 0 .... = . 0,.) E = 7::: , •— . ,.., = w — a.) (3.) a..) ,_. .. •-• cv: a) cn 0 -1;; • ,—. 0 fa, ., z.: )_.. O.) Z OA • .—. _,,, ..C) ̂C, Sa. 6 c) 7:1 7, al. ..y al >, -1q-• a) 0 g ct cn — CD
e1 CA $• 1 ai , w ,_ .c
4-, • ^' u .,-. 0 4:0 '—' > cl) e" -' c+-1 cn ry 6
'0 0..- c.,_,•"" a4 cn Z c) en 71 7:34) 4) '0 ....."' '...1 a) t:4 at 0 cn 4-1 • ,—. cn $-. cf) • —. ,=, 0 .,—. i.1.1 k cn a) .C.!1 _.,,t)
:. .7) Cl) a) cvl 10. 5 0" Sa. H -0 a) 03 (...) o Cl) GA
Mo
dera
ting
varia
ble
s
a) Z 0 Z
S]E
RV
QU
AL
app
lica
bil
ity
a) = 0 Z
Sam
ple
siz
e &
In
du
stry
cn ., ;.-. 0 rrl
1- 0 = 01
4-■ .t el2 C) 01
-4+
ct 00 " CI) CO .1- cn -,-. 7, ,_, 0... oi I—, ,—, ̀1) "c) 00 = u),... -4--. a) a)
0 a) a.) ,..0 , ,_ en .1- ,..,4 ,..w E a) i-r-i 0., g - = _.4 = Z
W CT CO ,..C.2 CN CS CI ..4‘ 4 CCI = a, H C/0 cn ,—I ..$) c) A —1 '''. ' ...0 • • • ■-.0 ,...., Cl)
Ob
jec
t iv
e o
f st
udy
a) -cf et
a) 0 (4-,1.4
4-4 c) =
,_ • ccs co 4-. a) (L) Z > = pel) 70 ,i0 cn Z ..4-. 0 H 7. . ,... 0 VI
7:3 • 7., • :., 0, > > -= cu ,--, '— u ›, ..... 0 4-. 0 .--, cy
al ,0
-2 $-■ 1-. = S' cl o E ct a -0 0 0 f:1"0 q8P4
0 > s-, .`: X) w W H c.) a) c/) 03 L.) a. E-4 t+-, cq = Cl) cn
1..
M
C...)
a) "0
= ..-
Au
t hors
= on Cl = r.
:LI
CN 0 o C\
Z (-) --'
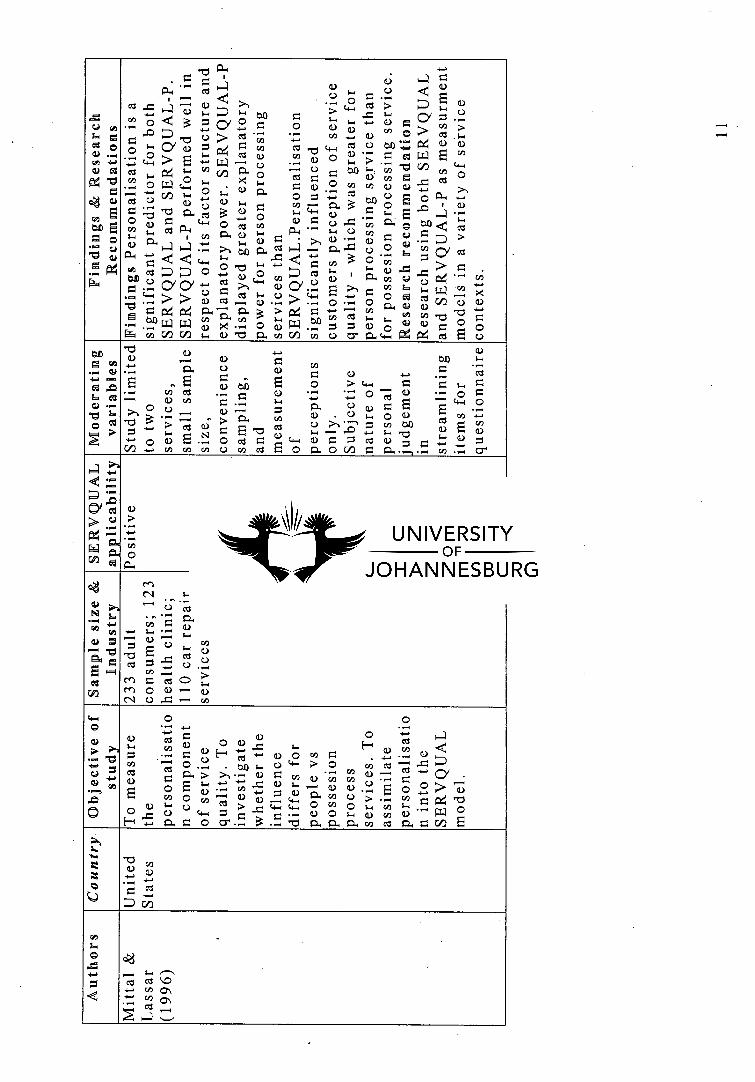
Fin
din
gs
& R
ese
arc
h R
eco
rnm
enda
tio
ns
. 4-..
0-0f:1-' , 0 $--
P-i ■ 4 a) " 0 • ,-. 't (1) c.) c.)
I 0 03 ›. ,, cl) 0 -0 1.4 --' (1.) .-. ›.. (I-. c...) 0 t,.., ,__, " OA g -0 a = — c, p¢ = cy 0 z 0 „ " .„ 0 =
4_, CI) 0 > (1) >
0 ‘. ,...,, ^0 u > et_, .-' c.) b.1) C4 a) cl) 0 6 LI a) = 4 .-, u) 0 -0 c.-I -60 0 ....,_ f_. 1.... cz ci.) cn a) 0 cl) ....„" 0 0 r.4 ei) , = .4..+ V.i u ..-., ;-.1 1.-- • •-1 , up t.4_,
0 " u) VD " 0 '7-d' uo = 11° :5' r — „, .....
c,..1 - ,.., — ,.., ,..., ,..,, ct 0 '
a..) cl., 0 z —. an c) E 0 0, — 0 tu ;-. O cn --- pl._ 0 -0 ' u " -0 ci., al ,-, 0 1,.., c.-1 0 0 ;_, E ,... ._. -0 0
0 O Li, 0 az = • cn" ■ s. c/) ,4 03 o. p..4 •- $..4 c..) „, 0 ;.., . c,) $a•■ a) " g 0 Q a) O. s-, 0.) • ›.., cu • -, cu ,,, • -
to sm., 0 °-' 4-' ', <4 ...,
0 4-, = .‹ = w 3 0 '7, o ,.....,_
o -0 I- — , ,... 0 z, n.= 1•••- = . WI cd ° i•■, 0 0 rn CS ,..." • -. cA tit 0 0..) " cn ca , 1_,,
CY a c'l >-1 4.-1 0-) a .(-) >, 0 up 6 .-,- (.4 __, c..) ,, c... .....„ .--„, _ 03 a) .--> c4--/ -4-. ,..., 0 0 et T." ,,., A ., 'Z •-• P- P." a) ,.. -- a.) • .-. r" • .. 0 • .4 V ad. •-• -, ,L., -
c4 ta. u) ;-■ osr, c/) .,.. ;-■ 1..., co rn ,-1:1 0 .: 1:43 W W 0 X 0 (uW .',Z Z 0 0 .14 _el) = ,._,C) 0 rn C/D CA $, 0 '0 fa., cn CI) rn o 0" 0., Li.-1 KA ,I czi 0 0
Mo
dera
tin
g
varia
ble
s
-0 o -..■ 0 __. a) 0 ba .--■ a) ri) = •^. ._. 0 U ..... E - E., 0 0 .,..
0 t4) E 0 > 44 = s. = Cip Cd . ,.. = a) • ..* • '-' 0 71 Ci) • '' 0 = 0.) CO)
° • '' +, A...
›, 0 0 0 ,_., cu i
• ' .--1 ••• > P. V) cu • 0 6., 0
4-' 1-■ MI, tCL,1 = E -c) cz` C.) ›'-.% • ,...7. 0 (/) et0 al = c/)
0.) ,-, a, _. 0 a) O ...... 0 ad O r. (1-4 CU CZ 0 0 0 -4-■ ,... ̂' C/) -4..■ cn Cl) cn 0 cn cl 0 0 ra. c) up z 1:1., •,--, •.-. cn . -. Cr
SE
RV
QU
AL
ap
pli
ca
bil
ity
a) > .-■
ci) 0
P..■
Sa
mp
le s
ize
&
Indu
stry
cn N ;..
V 03 .., .- fa, En= a) .4■• I, • ••..
VI a) ;. (1)
ni 14 CI Co)
En ,, M = CZ CD tn 0 4.) ■-4 a) N C...) rO ,'•, (/)
Ob
jec
tive
of
stu
dy
0 0 r.■ ,...
• iv CZ 0 a) cu
0 )- i-, H
+-. rn el) -0 -,
-•-■ 0 ,.,c1) 0 .) cn 0 ._Th al , -•-
rn .--' 0 .- . to 1_ c.) `•61 0 cn as --' 6-' az: • - Cl) N . -- al -,. 01 a) 0 O. > >, • ^. a) = v) ci.) u) rn • .. g
0 E t 1 • A - '. - 4 ' a ,"•E 0 0 > a)
cn 0 cn •--. 0 "" c.:4 al* c4 c) >. . ,.., rn 4". r:4 at ,--. g -0 c.) = ,o 4--( c+-i 0 c/) 6. .
.-■ a) 0 I-I (1) En ,--. c" cr. 1 0
&--1 -,- Cl., = o 0" . -. 3. ,-. "0 1:1. f21. Sa. cn cl a= C/D E
Co
un
try
10 a) a) .-. .4-. 0-. et
C/D
Au
tho
rs
.z
.— ;, /..^.
CI CC: ■..0 4-- ') 01 4-' cn 01

Fin
din
gs
& R
ese
arc
h R
eco
mm
en
da
tions
'Furt
her
rese
arc
h o
n s
erv
ice
qua
l ity
in
dif
fere
nt ty
pes
of
indus
trie
s w
ithin
Sou
th A
fric
a.
Res
earc
h in
the
are
a o
f co
mm
un
ica
t ion a
nd c
ross
cu
ltura
l co
mp
aris
on
s; s
ubse
quen
tly
the
re
lia
bil
ity
of
trans
lati
ng t
he
or i
gin
l ques
t iona
ire
to b
e
rev
iew
ed
Mo
dera
tin
g
var
iable
s
cn .I—. =
"0 0 0
C/) a)
P4
0 .1—. - 0 ,,.. ,--, -• ,.c "0 CCC/ CI 0 '—' P., , 0 cat
0 I. ,_—,'CI 0r" , an 0 0 C-1•••I
CCI ..0 cat 0
'70 = ...■
^." 0
014
0 0
,= ...I .. t,i)
44 0
Ipl E
RV
QU
AL
a
p lic
ab
ilit
y
0
4-> •••••I ri)
0
0.1
Sam
ple
siz
e &
In
dus
try
O
bje
ct i
ve o
f s t
udy
C
ou
ntr
y
Au
t hors
{
CA 1.--1
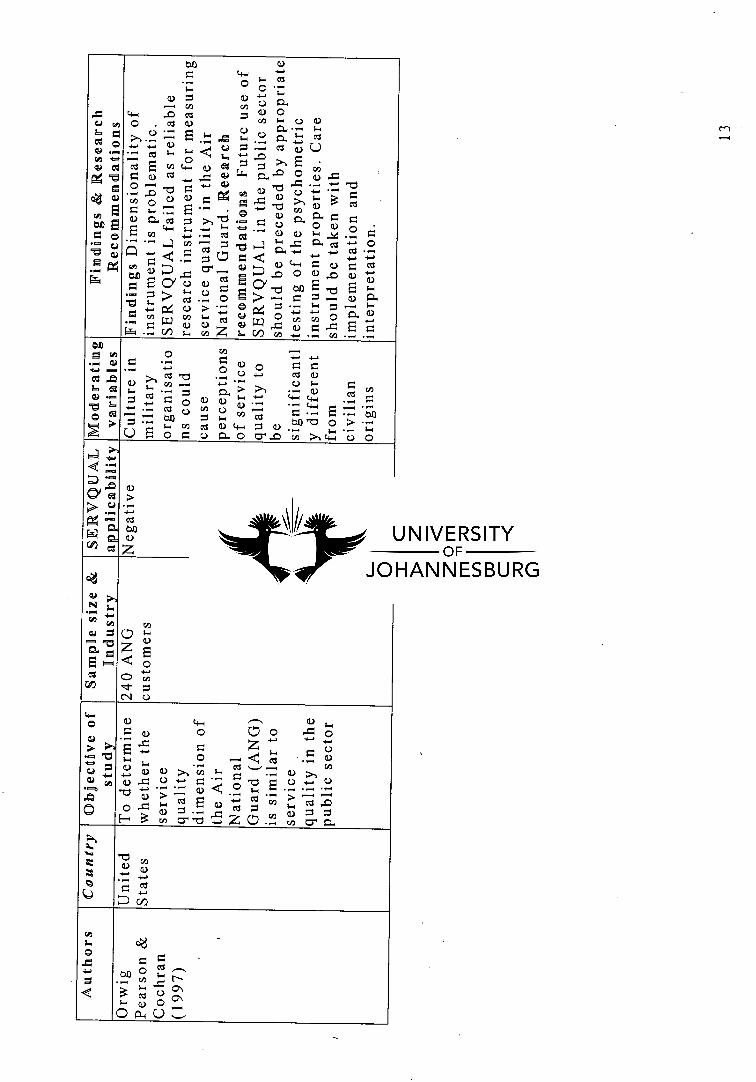
Fin
din
gs D
imens
ion
ali
ty o
f in
str
um
ent is
pro
ble
ma
t ic.
S
ER
VQ
UA
L f
ail
ed a
s re
lia
ble
re
sear
ch
ins
tru
men
t fo
r m
easu
rin
g
serv
ice
qu
ali
ty i
n t
he
Air
N
at i
ona
l G
uar d
. R
eearc
h re
com
men
da
t ions
Fu
ture
us
e o
f S
ER
VQ
UA
L i
n t
he
pu
bli
c se
cto
r s h
ou
ld b
e p
rece
de
d b
y a
pp
rop
r ia
te
tes
t ing o
f t h
e p
sychom
etr
ic
ins
trum
ent p
rop
ert i
es. C
are
sh
ou
ld b
e t
aken
wit
h im
ple
men
tat i
on a
nd
inte
rpre
tat i
on
.
I ER
VQ
UA
L
app
lica
bil
ity
N ›..
4-, as tO N
Z
Sam
ple
siz
e &
In
dus
try
Obje
ct i
ve
of
stu
dy
T
o de
term
ine
whe
t her
the
se
rvic
e q
ua
lity
dim
ens
ion o
f th
e A
ir
Na
t iona
l G
uar
d (
AN
G)
is s
imil
ar
to
serv
ice
qu
ali
ty i
n t
he
pu
bli
c s
ec
tor
Co
un
try
1
Au
t ho
rs

Fin
din
gs R
esearc
h R
eco
mm
end
at i
on
s
O - 0 a) -0 0 0 "a 0
0 cd o A cd - 4... 0 '0 . a) c.) ,__, .1.... 11.)
0 = ,-, 0 ..... Cl 4) b") .7:7 0 > V) '.0 ›, CI oCZ 0 > 0 ...0 g 0 cp ,-. -1-• up -4--, ;-■ co')
•,-• cn 4.4 0 ..._, 0 44 ..1 ..., .... 0 al ••= ;•-■ -4...• g . , cc) = 0 0 = ,-.1 0 rn i, 0 *--' - ..--
.,.., as " o -= ctc) c) a) ..0u, 0 .e., 0 C" . Ci) = (L) C..) = 4-.
^, 4-■ >1 0 0
= = E
;-,
cn - 0 " cl -, u) a) > as •-• o -- = cn • -. .,.., --. rn c,, A 0 -,- '0 up r:4 v) 0 ....- 0 ;-■ z o 0 a) 6, = cz a) ,,,, >, ,... ,J-, c.) 0 :" ." > .< 4- .,- .- 0
•-■ ' '' '-;.. A a) ,--, al-4 0 0 0 CU • ,-.. . a) -0 .-' o v u) -0 cn A 41.) En 0 cn a) (.1 = >, A -4-. ...,_ r_. .--■ ... 0.)
,_, 0 .4... 03 tl...1 = .,..,..-- ' = cci I4 r- 0" 4/4 • Ca
"C:i • ri) (1) E :. - sl ›-. 0 ei , e.--.■ 0 " >1 V)
.,=, .-o C...)•• 00 . ,_, = 4... E ,-, ._ _ c„ v ;.., — = _ 0 ,,, •- _ :--, _ g 0
al • •-• aivr.., g.."" C.) g „ 7:j = a) I-. 4-, c:, E cil cz u c.) co E ,,,,, c„ a.) _
— ,.. — co ,.., Z CL) czt = 0 cci = CO CO , 0 0 cn "CJ ■--, ;-, Z V 64 4•t = i-4 4-4 C.) ct .0 rA .r)
Mo
dera
t in
g
var
iab
les
a) a) --. a) ct 0
cn ,-0 c..) 0 cn • •-■ a) "_,c.) 0" 0 cn 4-v - .--. •
„a • ,•-■ +-a cn = 0 a)
,L, (1) E t,„ r.,, a.) Q. cu ,•-
V] cn Pi +-■ 0 Cl -0 A - Cl 0
fpE
R 1
7Q U
AL
ap
pli
ca
bil
ity
0° . ..-
.- -0 1--, 0 cn
a> I-- a) o Cl cn
a) c. - a) ›. o -0 0 a) 0 0 a) s-, •-. .._, -,- o c.) ry V) 4.,
a..)
a> ›. a.) ›, rn ̀-',,, V) > 6, s•"' V) ;... C1) ›...
.4., c4 ;... ..-■ En -1-., uo • I-■ 0 > 0 v-. = C.) •4••-• Cl a.) -4-, • --, 0.) 0 c...)•-4-' c4-. 0 co) ..- .-" bp = c•i-( (1) 0 '-',,t •-■ • •-■
• •... , , ,... c-, _0 = 4-4 a) cn . : a4 0 co > ---0
,..., Q - 4.) " Z ° 7:1 . ,.., = • •- ■ 0.) ,0 0 cl.) '+-I F-L-I (I) =
--, bi) L-. 0" -0 -0 -,--, ga-4 s..1 0 C4 ci) Cl u) 0"
Sam
ple
siz
e &
In
dus
try
. .. c/) ;•-■
a> rte."rte." bll 0 0
-0 0 .,,,-' Cl u) ..x.
0 0 N o Cl ■.0 0 A
Obj
ecti
ve
of
stu
dy
Cou
ntr
y
Fra
nce
Au
t hors
_ _

Fin
din
gs
& R
esea
rch
Rec
omm
enda
tion
s F
indin
gs
Exce
ssiv
e cr
oss
loa
din
g
of
item
s in
tang
ible
an
d ass
ura
nce
dim
ens
ion
. T
he r
efi
ne
d in
str
um
ent
ind
ica
ted
goo
d in
tern
al
con
sis
ten
cy. It
pro
ve
d an
exce
llen
t to
ol
for
t he
ov
era
ll
stra
teg
ic p
lan
nin
g p
roce
ss.
Res
earc
h r
eco
mm
enda
t ion
s T
he
rev
ised in
str
um
ent s
hou
ld b
e te
ste
d a
cro
ss l
arg
er s
amp
les
an
d d
iver
sity
.
Fin
din
gs
Tw
o d
imen
sio
ns
nam
ely
ta
ng
ible
s an
d r
eli
abil
ity l
oa
d i
nto
se
par
ate
fac
tors
. T
he r
ema
inin
g
thre
e d
imen
sio
ns,
res
pons
iven
ess,
as
sura
nce
an
d e
mp
ath
y a
ll l
oa
d in
ton
one
fac
tor,
in
dic
at i
ng
th
ere
is n
o r
ea
l d
iffe
ren
ce a
mo
ng
st t
he
t hre
e d
imen
sio
ns
in t
he c
us t
om
ers
Mo
der
ati
ng
var
iabl
es ,.- 0
g ■--) 0 '-rJ
cy g o .,-• ..-• • ,-. ,..1
6-. P-- , • .•-•
...• '-0 -I-' LT-1 CID 0 0
= 0
C4 • r. E 0
a) g 0 Z
r t EpR V
QU
AL
a
lica
bil
ity
.-0 0..., 0. ..-■ cd x • a) "0 (1) czt •,-.
,, r,) a) c.) 0 .4
a., 3 °
0 g c" cn a)• ,.. ,.. = at .,.. ....,1) >, 0 E "0
^ as 4-, CL) • " ,..._ 0 .--. ,.0 4"b i•-■ ""' .- • .-. ., ,, = cn
V:, .-0 ., 0) CA • ,-. ,--4,, et tn = as — c.0 . ■.. • 1.41 CI
4., ■4■1 01 bo Cl 0 0 0 • • 1■1 ,,, +-A
Sa
mp
le s
ize
&
Ind
us t
ry
rn ....,
;-. a) 0 cn 0 -,•-• a) i•-1
(4-( W "0 0 •• Z 4.
Cl N. = 'Ci -e' .' (1) ;. t'l 0 of Cn 0 ..1 -1. , cz C \ I • ., i. .., s . s cn .4-, ur — ‘,... • '4.1
0 1.4 e■ cl ‘... tO cd 0 c-s--1 0 >-, .0 Ici3 0 c.) .,.., . ,_, CNI 0., 1:i ."' '0 ::: "0 t E
■ox••-•czgog a) "cz, (Ni a) cy) ›. 0 c.) czt cn of
v) f•., a)
E 0-1. cn
c..)
en 00 i.r)
Obj
ecti
ve o
f st
udy
0 -,—. ci) 0 o
0 1— g "t:J . ,.... g 0 4.. ›-
0. = '7) -,: a) 0 0 4., 0 0 E ,..4 ,,,:j g g ›,-, i-, —■ • .. al CL) 4--• (1) 0 .4-, (4-, a.) 0 E E cf)
cn at .,. cy ,... ce., act r., 0, ;-■ rn „,;-' I-. a)
p•-- cf, a.) a) cp v) ‘-• a) r. f./
"0 clq E "" Ct "'.. 1-4 cn • " ;•.1 0 0 = cl, 44 ,..9 0 03 a) cn cd 0 H cs of cztv) q cn ›- 0. al 0 C.) c.)
.,—. 0 ° • ct = cti -1--. cn
a) .... +.1 Q = • 1. ;-• 0 - --. a) = 4-, 1.4 cn
J.. 0 c.,..., 0 ,.. _.., p 0 ri) s... '4't OD 0 a, ›., cl „, a) c.) .... 0 = • -. • ,-. z (1) ''= $. ("" ,..., ,... Cl ,... = > 0 s •, 4-,
0 0 = cu 0 =-= H n Cr co 0 (4 a) H
0 0 1..1 4., 0, 0 c..)
(1) 0.
= 0
"0 = Cl
LI. 0
= 0 .,_,
4.-. czt ., 0
0. x (1)
0
•-■
;.., 0 cn
>
cct
a.) 0 rn ›- ..,
c+-( " *:, a) >, E 6 •-+ 0 04
4. VI ct cn ;••.
= a, Cr 0 Q.
Cou
ntr
y
"0 cn a) a, 4.. ., 0 cl .-.
C/D
cl -0 c.) .., .,..,
. 0 c..-■
C/D <
Au
tho
rs C)
CD - 7:i CD = N of c„ s.-..,
cu›, ,4 " ... O.0 444
0 a) .:. W ‘- V)
,..._ ...) al .y CNI
,--,
0 •-■ CD
$-1 ... --, . 0) Cl ̀,."
-c) fa. ,t)
cd cl 0 > a.. CC)
1-r)

UNIVERSITY
JOHANNESBURG
LIBRARY BUNTING ROAD CAMPUS