the mechanical behaviour of a 25cr super duplex stainless
TRANSCRIPT

THE MECHANICAL BEHAVIOUR OF A 25Cr SUPER DUPLEX STAINLESS
STEEL AT ELEVATED TEMPERATURE
B. A Lasebikan, A. R. Akisanya1 and W.F. Deans School of Engineering, University of Aberdeen,
Aberdeen AB24 3UE, U.K.
ABSTRACT
Super duplex stainless steel (SDSS) is a candidate material for production tubing in oil and
gas wells and subsea pipelines used to transport corrosive hydrocarbon fluids. The
suitability of this material for high temperature applications is examined in this paper. The
uniaxial tensile properties are determined for a 25Cr super duplex stainless steel over a
range of temperature relevant to high pressure – high temperature oil and gas wells. It is
shown that there is a significant effect of temperature on the uniaxial tensile properties.
Elevated temperature was shown to reduce the Young’s modulus and increase the strain
hardening index; temperature effects on these two parameters are usually neglected in the
design of subsea pipelines and oil well tubulars and this could lead to wrong predictions of
the collapse pressure. The manufacturing process of the super duplex tubular did not lead
to significant anisotropy in the hardness and the ultimate tensile and uniaxial yield
strengths.
Keywords:
Stainless steel. Mechanical testing. Environmental performance. Elastic/Plastic behaviour.
1 INTRODUCTION
Duplex and super duplex stainless steels are used extensively for various products and
components in numerous industries, including refining and petrochemical industry,
nuclear power plants and oil and gas industry [1‐4]. These alloys are typically categorised
1 Corresponding Author. Email: [email protected]. Tel.: +44 1224 272989. Fax: +44 1224 272497

by their nominal chromium content (e.g. 18Cr, 22Cr and 25Cr) and the main alloying
elements (e.g. chromium, nickel, molybdenum, nitrogen copper and/or tungsten) which
result in different Pitting Resistance Equivalent Numbers (PRENs). The PREN, which is a
measure of a material’s intrinsic resistance to pitting corrosion, is determined from the
element composition (in percentage weight) of the material [5]:
PREN = Cr + 3.3 Mo + a N (1)
where a is a constant whose value ranges between 16 and 32.
Duplex stainless steel (DSS) with PREN greater than 40 are classed as super duplex
stainless steel (SDSS). As a general rule of thumb, the higher the PREN, the better the
resistance to pitting. The high PREN value of SDSS makes the alloy a candidate material to
use in corrosive service environment.
The continuing need for oil and gas exploration and production to satisfy global demand
has led to the discovery of new oil and gas fields in high pressure and high temperature
(HPHT), Ultra HPHT and Extreme HPHT environments. The pressure and temperature in
HPHT reservoirs are up to 69 MPa (10 kpsi) and 149 oC (300 oF), Ultra HPHT reservoirs are
up to 138 MPa (20 kpsi) and 204 oC (400 oF) and the Extreme HPHT well conditions are up
to 207 MPa (30 kpsi) and 260 oC (500 oF) respectively. The material used for oil and gas
production tubing in these challenging environments therefore requires high strength and
as well as excellent resistance to corrosion at elevated temperature. SDSS is the material
choice in these environments because of the resistance to corrosion due to high PREN [6].
However, the use of SDSS in HPHT environment requires an accurate prediction of the
material properties at elevated temperature to determine the appropriate load carrying
capacity and to ensure safe design.
Existing design specifications for structural application of steels at elevated temperature,
e.g. British Standard BS 5950 Part 8 [7] and European Code 3 Part 1.2 [8], focused on fire
protection characteristics of the materials and the temperature‐dependent strength

reduction factors (sometimes referred to as de‐rating factors) provided in the standards
are based on investigation of carbon steels. Further, design specifications for stainless steel
structural members, e.g. European Code 3 Part 1.4 [9], are for stainless steel structures at
room temperature. Consequently, many designs involving the use of stainless steels at
elevated temperature are based on carbon steel data with the application of a safety factor.
This use of carbon steel standards for the design of stainless steel structures at elevated
temperature, as it is the case in oil and gas industry, is too conservative and therefore not
appropriate as stainless steels exhibit better retention of strength and stiffness at elevated
temperature compare to carbon steels.
Previous studies on the elevated temperature effects on the mechanical behaviour of
stainless steels have been driven by the need to understand the fire protection
characteristics and the resistance to irradiation, for example in nuclear reactors. As a
result, majority of these studies have focused on austenitic and martensitic stainless steels
which are used more widely in civil engineering structural applications. The uniaxial stress
– strain response of various grades of austenitic stainless steels, e.g. AISI 304 and 316 over
a wide range of temperature has been reported in literature, see for example, [10‐13]. The
yield and tensile strengths for austenitic and martensitic stainless steels decrease with
increasing temperature (up to 1000 oC) with a significant reduction above 400 oC [10‐15].
However, there have been very limited studies on the effect of temperature on the uniaxial
tensile properties of duplex steels. The few studies on duplex steels, which have also been
driven by the need for fire safety, are on 22Cr DSS (i.e. SAF 2205 or EN 1.4462); 22Cr DSS
has been shown to have better strength retention than austenitic stainless steels up to 300 oC, and worst strength retention between 300 and 1000 oC [14, 16]. The requirements for
fire resistant structures where the temperature could be as high as 1000 oC and for a very
short duration are different from those of long service industrial applications where the
temperature are much lower (less than 300 oC) and for much longer duration. Surprisingly,
most of the previous studies on elevated temperature effects on 25Cr DSS have been on the
precipitation of secondary phases during material processing and welding, see, for
example, [17, 18]. The long service industrial application of SDSS, in particular the 25Cr
SDSS, requires detailed understanding of the in‐service effect of elevated temperature on

the mechanical properties to enable a better utilization of this grade of stainless steel in
challenging environments typical of high pressure‐high temperature oil and gas wells.
The material properties of a 25Cr SDSS, such as the 0.2% proof stress, Young’s modulus
and ultimate tensile stress, at room and elevated service temperature are determined in
this paper. The experimental results are used to assess the implications of the strength and
stiffness reduction for the design of downhole production tubulars used in HPHT oil and
gas wells and in subsea pipelines.
2 EXPERIMENTAL PROCEDURES
2.1 Material and specimen preparation
The material considered in this study was a cold‐worked Grade 125 super duplex stainless
steel (SDSS). This was obtained in tubular form with 7” (177.8 mm) outside diameter and
14 mm wall thickness. The material has a chemical composition primarily based on 25 wt%
chromium, 7 wt% nickel and 3 wt% molybdenum, i.e. Group 2, Category 25‐7‐3 per ISO
13680 standard [19] for corrosion resistant alloy (CRA) tubing. The full details of the
chemical composition are provided in Table 1. The element composition gives a PREN in
the range 40 to 42 (see eqn (1)), which is consistent with the minimum PREN for SDSS.
The main tests carried out were: hardness test and uniaxial tensile test at elevated
temperature.
Metallography and Hardness Specimens
A number of specimens with cross sectional dimensions of 5 mm by 4 mm were machined
from the SDSS tubing in the transverse – radial plane (referred to as T–R) and longitudinal
– radial plane (referred to as L–R) for metallographic examination and hardness
measurements, as shown in Figure 1. The longitudinal direction is parallel to the rolling
direction. The metallographic examination and hardness measurements were carried out
at different locations across the wall thickness of the pipe following a 3 x 3 grid pattern.

The location of the metallographic and hardness examination are referred to by IL, IM, IR
for the path nearer the inner surface, by ML, MM, MR for the path at mid thickness and OL,
OM, OR to the path near the outer surface of the pipe (see Figure 1). Three specimens were
examined for each of the T and L planes; these specimens are identified as T1, T2, T3 and
L1, L2, L3.
The metallographic specimens were embedded in phenolic powder and closed die
compacted at 150 oC for 5 minutes. The surface of the specimen was then, abraded to 240
grit, using a grinding wheel, polished with 6 and 0.05 μm diamond pastes and cleaned in
deionised water and acetone. Thereafter the specimens were chemically etched in 90 ml
distilled water and 10 ml HCl at 70 oC for 5 minutes. The hardness specimens were
prepared in the same manner as those used for metallographic examination.
The microstructure and phase composition were analysed with optical microscope and scanning
electron microscope (SEM) using the back scattered electron signal (BSE) analysis. Further
quantitative metallographic studies were also performed with optical microscope using Omnimet
Advantage Image Analysis toolbox (supplied by Buehler) to quantify the volume fraction of
ferrite and austenite in the microstructure. The determination of the volume fraction in this
manner is consistent with the automatic point counting method of ASTM E1245‐03 [20].
Uniaxial Tensile Specimens
Uniaxial tensile specimens were machined from the transverse and longitudinal directions
of the SDSS tubular to assess the level of anisotropy in the material’s tensile properties. The
specimens were solid circular cylinder, with a gauge length of 33 mm and 5 mm diameter
(see Figure 2). The ends of specimens were threaded for ease of connection to the loading
fixtures. Coolant was used for all cutting and machining processes to minimise the effect of
the heat associated with the machining on the mechanical properties and microstructure.

2.2 Testing Procedure
2.2.1 Hardness
The hardness was measured using Vicker’s microhardness tester, in the T‐R and L‐R planes
following the 3 x 3 grid pattern shown in Figure 1. The hardness was measured at mid
thickness and at 2 mm from the inner and outer surfaces of the pipe; and at locations
spaced at 4 mm along longitudinal and transverse direction (Figure 1). Three specimens
were examined for each of the T‐R and L‐R planes; these specimens are identified as TR1,
TR2, TR3 and LR1, LR2, LR3. The hardness measurements were subsequently converted to
Rockwell C (HRC) equivalent values using the standard Vicker’s conversion table for easy
comparison with the designation used in a number of design standards e.g. ISO 15156 [6].
2.2.2 Uniaxial tension
Two high temperature strain gauges, type QFLA‐52, suitable for temperatures up to 200 oC
were positioned diametrically opposite each other and set up so as to eliminate bending
strains from the measured axial strain. Dummy gauges were used to counteract
temperature effects on the measured axial strain. Tensile tests were carried out in
displacement control and at a different crosshead speed of 0.5 mm/min using screw‐driven
Instron testing machine. The crosshead speed is equivalent to a nominal strain rate of 41052 −×. s−1. The load and the strains were continuously recorded using a computerised
data logger. The tensile tests were performed at room temperature and at elevated
temperatures: 90, 110 and 160 and 200 oC. An environmental chamber mounted on the
testing machine was used to heat up the samples to the required temperature as indicated
on the chamber‘s digital temperature display. A thermocouple (T type connected to a
handheld digital thermometer MM2030 temperature range –200 to 400 oC) was also
attached to the surface of the specimen to ensure it was at the required temperature during
the test. Load was applied after the required temperature was achieved. At least two
specimens were tested at each of the temperatures considered.
2 Manufactured by Tokyo Sokki Kenkyujo Co. Ltd

3 Results and Discussion
3.1 Phase balance and microstructure.
A metallographic examination of a number of samples showed that the SDSS contained a
duplex ferrite and austenite microstructure after chemical etching. A typical micrograph is
shown in Figure 3. As expected, the ferrites are elongated in the cold‐worked direction (i.e.
the longitudinal direction). No deleterious phases, e.g. sigma (σ) and chi (χ), were detected
but some dark spots were observed randomly in the microstructure mainly in the austenite
phase and at the grain boundaries. This dark spots though suspected to be chromium
nitride (Cr2N) were not investigated as it is beyond the scope of the current study. It is
important to note that nine metallographic examinations were conducted at different
locations within each of the three nominally identical samples in the transverse and
longitudinal directions; see Table 2. The structure and distribution of the ferrite and
austenite in the micrographs shown in Figure 3 are typical of all the examinations.
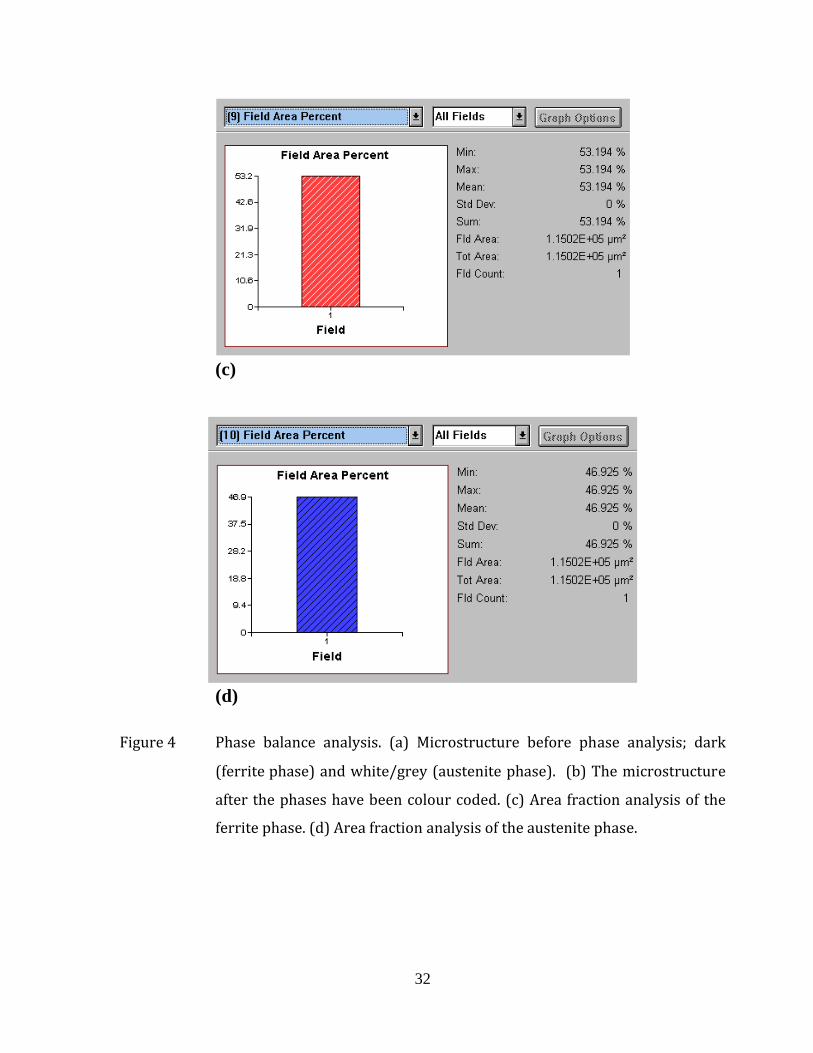
The volume fraction of the two phases was determined using the image analysis software.
Individual phases in the micrographs are colour coded and the surface area fraction (which
is approximately equal to the volume fraction) of each phase is then determined in
accordance with ASTM E1245 [20]. The typical result shown in Figure 4 suggests 47%
volume fraction of the ferrite and 53% for the austenite. A summary of the phase
composition for all the specimens tested is given in Table 2: the volume fraction of the
ferrite ranged from 40 to 54% while that of the austenite ranged from 44 to 55%. The
average volume fraction was found to be 49% for the ferrite and 51% for austenite. The
average values are not dependent on the direction (transverse or longitudinal), see Table 2.
Cold‐worked duplex stainless steels used as downhole tubulars in oil and gas industry
usually have a ferrite content volume fraction of between 35% and 65% [6]. Prouheze et
al. [21] found the optimum mechanical and corrosion resistance properties are obtained
for a phase proportion of 1:1 for cold‐worked and solution annealed DSS, as found in the
SDDS grade considered in the current investigation. However, Hagen and Keller [22]

found austenitic content ranging between 40 and 60% to be most favourable for the
corrosion chemical properties of DSS tubes.
3.2 Hardness
The hardness measured near the inner and outer surfaces and at mid‐wall thickness of the
parent pipe are summarised in Table 3. The change in hardness is very small for each of
the samples in the transverse and longitudinal planes. The measured hardness in the
transverse and longitudinal planes was in the range of 32 to 35HRC. The measured value of
the hardness is within the maximum value of 36HRC recommended by NACE [6] in order to
minimise the susceptibility of the material to environment assisted cracking.
3.3 Uniaxial tensile stress strain response
The stress ‐ strain response at room temperature is shown in Figure 5 for three nominally
identical specimens in the longitudinal and transverse directions. The repeatability and
consistency of the tests is demonstrated by the relatively small difference between the
stress‐strain responses for three nominally identical specimens. The stress – strain curve
follows a typical linear, non‐linear response for a cold worked‐steel where the nonlinearity
is quantified by the degree of strain hardening.
The Young’s modulus, yield strength (defined here as the stress at which the stress‐strain
response changes from linear to nonlinear), the 0.2% proof stress, and the tensile strength
determined from the experimental data are summarised in Table 4. There is insignificant
difference in the measured values of these properties in the longitudinal and transverse
directions, i.e. no noticeable anisotropy. This is consistent with the results of the hardness
measurement presented in Table 3. The measured values of the material uniaxial
properties are in agreement with those recommended for cold worked SDSS grade 125 per
the ISO standard for corrosion resistant alloy (CRA) tubing [19]. However, various
researchers [23 – 26] have highlighted that all cold worked duplex stainless steel have a
degree of anisotropy in their strength properties. The cold work process induces residual
strain in the material that may result in unequal magnitude of yield stress in the transverse
and longitudinal directions. This is due to the varying structural configurations of the

individual manufacturing conditions [22]. The degree of anisotropy depends on the
processing route, i.e., the sequence of cold work and annealing as well as the deformation
methodology. It has been shown that the anisotropy developed during cold work is usually
negligible so long as the total cold work strain is not too large, for example less than 30 per
cent rolling [27]. The authors have no information regarding the cold work strain of the
parent pipe. The lack of or negligible level of anisotropy in the uniaxial tensile properties
and hardness determined for this material would suggest the cold work strain is less than
30%.
The uniaxial test was also carried out at 90, 110 and 160 and 200 oC in the longitudinal and
transverse directions. The effect of temperature on the stress – strain response is shown in
Figure 6. The stress – strain response at elevated temperature is qualitatively similar to
that at room temperature. The measured values of the uniaxial tensile properties are
however dependent on the temperature. The effect of temperature on the tensile strength
and the 0.2% proof stress is shown in Figure 7; and the temperature dependency of all the
measured tensile properties are summarised in Table 5. It is noted that the strength of the
material decreased as the temperature increased. Similarly like in the room temperature
tests, there was no significant anisotropy at elevated temperature. The strength in the
transverse direction was slightly lower at the same test temperature, compared to
longitudinal direction, as the temperature increased. The measured property in the
transverse direction at a given temperature differ by a maximum of about 2% of the
corresponding value in the longitudinal direction, with the maximum difference occurring
at higher temperature (≥ 160 oC). The Young’s modulus decreased from a value of 207 GPa
at room temperature to 191 GPa at 200 oC; a 8% reduction.
The cold‐worked state is a condition of higher internal energy. Residual stresses arise due
to plastic deformation which may not be uniform throughout the entire cross section of the
part been deformed. Cold work results in an increase in strength and decrease in ductility
that is achieved with intermediate annealing operations and a final cold working step to the
required strain to achieve the specified strength. This may be followed by stress relief to
reduce residual stresses generated by non uniform plastic deformation from the

manufacturing operation. Residual stresses are usually alleviated by heating to a specified
temperature that does not result in a change in microstructure and mechanical properties.
There should be no observable change in the physical properties and microstructure of the
cold‐worked SDSS subject to heating at less than 300 oC. At higher temperatures, phases
which affect the corrosion resistance, for example α’ (also known as 475 oC embrittlement)
and secondary austenite i.e. γ2 (600 – 700 oC), can form [17, 18]. The properties that are
most affected by temperature are those which are sensitive to point defects that is
responsible for nearly all aspects of plastic deformation. Thus the strength properties
which are controlled by dislocation are usually affected by increase in temperature. As
temperature increases, thermal activation assists in the formation of vacancies thus the
required stress to cause slip during plastic deformation decreases. As the strength of the
material comes from cold working, increasing the temperature relaxes the material,
resulting in reduced mechanical properties, as observed in the current study.
The observed reduction in the tensile strength of the SDSS material between ambient
temperature (22 oC) and 90 oC in the longitudinal direction was 115 MPa and a decrease of
55 MPa was observed between 90 and 250 oC. Similarly the 0.2% proof stress decreased by
89 MPa between ambient temperature and 90 oC and by 73 MPa between 90 oC and 200 oC.
These results are consistent with those of Prouheze et al. [21] who found a decrease of
around 100 MPa at 100 oC and 150 MPa at 300 oC in the 0.2% proof stress for the VS22
(22Cr) grade of cold worked SDSS, which is different from the 25Cr SDSS considered in the
current study.
The effect of temperature on the 0.2% proof stress is more pronounced than the effect on
tensile strength. From the results shown in Figure 7, the temperature dependence of the
tensile strength (UTS) and the 0.2% proof stress ( )2.0σ can be fitted, within the
temperature range of 22 – 200 oC, to the following equations:
UTS = 0.0048(T2) – 2.014(T) + 1099.3 (2)

2.0σ = 0.004(T2) – 1.7745(T) + 1003.3 (3)
where T is the temperature in oC; and both UTS and 2.0σ are in MPa.
4. IMPLICATIONS FOR THE DESIGN OF SUBSEA PIPELINES AND OIL AND GAS
PRODUCTION TUBULARS
It is common in casing, tubing and pipeline design in the oil and gas industry to assume the
Young’s modulus is not temperature dependent. The experimental results presented above
suggest a reduction of up to 8% in the modulus at an elevated temperature of 200 oC. If this
is not adequately accounted for in the design of oil well casing, tubing and subsea pipelines
made from Grade 125 SDSS, it could result in over estimation of elastic collapse pressure
for the pipe; a major design consideration in pipeline design in deep water applications.
Designers routinely use room‐temperature mechanical properties with a safety factor to
account for temperature effects, or alternatively use the strength value at the operating
temperature. The latter is usually referred to in many pipeline design codes (e.g. DNV [28],
API [29]) as the stress de‐rating factor, defined as the ratio between the strength at the
operating temperature and the corresponding strength at room temperature. Existing
design standard for stainless steels [9] only covers ambient temperature applications. The
stress de‐rating factor for the SDSS grade considered in this study is shown in Figure 8,
based on the average measured strengths. The stress de‐rating increased with increasing
temperature. There is a reduction of about 16% in both the UTS and the 0.2% proof stress
at 200 oC. Recall that the upper temperature limit for ultra high pressure and high
temperature oil and gas well is about 204 oC. The results presented in this chapter will
enable the appropriate design safety factor to be determined for this grade of material in
both HPHT and ultra HPHT applications.
The 0.2% proof stress de‐rating factor for 22Cr DSS and for austenitic stainless steel AISI
304 [14] are compared with the results obtained in the current study in Figure 8. The de‐

rating factor for the 22Cr is comparable to that of the 25Cr DSS considered in this paper.
However, the 25Cr DSS retain more strength than the austenitic stainless steel; this
therefore makes the 25Cr DSS more suitable for HPHT applications.
In order to allow some level of non‐linear plastic deformation while avoiding the onset of
instability (i.e. necking), subsea pipelines and casing design codes usually specify that the
ratio between the 0.2% proof stress and the tensile strength must be in the range,
95.075.0 2.0 ≤≤UTSσ (4)
This is used as one of the criteria for material selection for oil casing, tubing and subsea
pipelines. The greater the ratio σ0.2/UTS the smaller the uniform plastic deformation the
material can sustain before the onset of instability which can subsequently lead to burst for
pipelines and tubulars subject to internal overpressure. The values of 2.0σ /UTS for the
grade of SDSS was found to vary between 0.89 to 0.93 over the range of temperature 22 oC
to 200 oC considered in this study. This is within the range recommended by design codes
[28, 29]. Therefore the SDSS (grade 125) tubing is suitable for production tubing in oil and
gas wells and subsea pipelines.
The stress – strain response at room temperature and elevated temperature can be fitted to
the power law equation
⎪⎩
⎪⎨
⎧
>
<=
E/YK
E/YE
tntp
tt
t
εε
εεσ
(5)
where tσ and tε are the true stress and true strain, E is the Young’s modulus, K is the
plastic strength coefficient, n is the strain hardening index and Y is the yield stress.

The nominal stress σ and nominal strain ε presented in Figures 5 and 6 are related to the
true stress tσ and true strain tε by
( )εσσ += 1t ; ( )εε += 1lnt (6)
The strain hardening index, n, and the coefficient K are usually determined from the slope
and intercept of the log tpε versus log tσ plot over a chosen stress range in the interval Y <
σ < UTSσ . The accuracy of the values of n and K, obtained using this approach (referred to
here as method 1) depends on the chosen stress range and choice of the line of best fit to
the experimental data. These factors could lead to significant error in the calculated values
for n and K.
By imposing the condition of constant volume during plastic deformation and that the
maximum load is attained when σ = UTSσ it can easily be shown that for a uniaxial tensile
test, the strain hardening index n and stress coefficient K are given by [30]
( )UTSn ε+= 1ln (7)
UTS
n
nK σ⎟
⎠⎞
⎜⎝⎛=
71.2 (8)
where UTSε is the nominal strain when σ = UTSσ . The use of (7) and (8) to determine n and
K is referred to here as method 2. This method gives more accurate result as it does not
involve any curve fitting. The values of the strain hardening index n and strength coefficient
K of the material under investigation at different temperature are shown in Table 6, for
both methods 1 and 2.
The strain hardening index n determined by method 1 decreased with increasing
temperature, while that determined using method 2 decreased between room temperature

and 110 oC but increased thereafter. The decrease in the strain hardening in method 1 may
be due inherent errors in curve fitting. We note that the strain hardening index
determined by method 2 is greater than that by method 1 by between 10 and 20%. The
difference in the strength coefficient by the two methods is less than 5%.
The strain hardening index results presented in Table 6 show that the index obtained by
both methods 1 and 2 only vary between about 0.016 and 0.03. The strain hardening index
n = 0 for perfectly plastic solid. Thus the SDSS used in this study could be assumed to have
a very mild strain hardening characteristics over the range of temperature considered. The
room temperature strain hardening index is normally used in the design of downhole
tubular and subsea pipelines. The results shown in Table 6 shows a slight temperature‐
dependence of the strain hardening index and it would therefore be appropriate to use the
strain hardening to characterise the deformation of the material under consideration up to
a temperature of 200 oC.
5 CONCLUSIONS
The uniaxial tensile properties have been determined for a 25Cr (Grade 125) SDSS over a
range of temperature relevant to high pressure – high temperature oil and gas wells. It is
shown that there is a significant effect of temperature on the uniaxial tensile properties,
with the properties decreasing with increasing temperature. Elevated temperature was
shown to reduce the Young’s modulus and the strain hardening index; temperature effects
on these two parameters are usually neglected in the design of subsea pipelines and oil
well tubulars and this could lead to wrong predictions of the elastic and plastic collapse
pressure. The results presented above will allow a better and safer design of oil and gas
production tubulars and subsea pipelines. Despite the cold work involved in the
manufacture of the SDSS tubular, there was insignificant anisotropy as determined from
both the hardness measurements and also the uniaxial tensile and yield strengths. This
implies the level of cold work in the pipe is very low.

Acknowledgements
The authors acknowledge the experimental assistance of Stuart Herbert, Alastair
Robertson, Derek Logan, and Jim Gall of the University of Aberdeen, School of Engineering
Central Workshop. BAL acknowledges the financial support of Shell Exploration and
Production (UK).
REFERENCES
[1] M. Holmquist, Duplex stainless steels avoid damage in hydrocarbon processing, Energy
Processing Canada, 95; 2002, p 5‐8.
[2] J. Olsson and M. Snis, Duplex ‐ A new generation of stainless steels for desalination
plants, Desalination, 205; 2007; p 104‐113.
[3] M. Veljkovic and J. Gozzi, Use of duplex stainless steel in economic design of a pressure
vessel, Trans ASME J Pres Vess Tech, 129; 2007, p 155‐161.
[4] I.N. Bastos, S.S.M. Tavares, F. Dalard, and R.P. Nogueira, Effect of microstructure on
corrosion behavior of super duplex stainless steel at critical environment conditions,
Scripta Materialia, 57; 2007, p 913‐916.
[5] H. Hanninen, J. Romu, R. Ilola, J. Tervo, and A. Laitinen, Effects of processing and
manufacturing of high nitrogen‐containing stainless steels on their mechanical,
corrosion and wear properties, J Mater Proc Tech, 117; 2001, p 424‐430.
[6] NACE MR0175/ISO 15156, Petroleum and Natural Gas Industires ‐ Materials for use in
H2S‐containing Environments in Oil and Gas Production, 2005. NACE MR0175/ISO
15156.
[7] BS 5950‐8, Structural use of steelwork in building ‐ Part 8: Code of practice for fire
resistant design. British Standard BS5950‐8, 2003.

[8] Eurocode 3, Design of steel structures ‐ Part 1.2: General ‐ Structural fire design.
Brussels: European Committee for Standardization. BS EN 1993‐1‐2.
[9] Eurocode 3. Design of steel structures ‐ Part 1.4: General ‐ Structures in stainless steels.
Brussels: European Committee for Standardization. BS EN 1993‐1‐4.
[10] J.W. Kim and T.S. Byun, Analysis of tensile deformation and failure in austenitic
stainless steels: part 1 ‐ temperature dependence, J Nuclear Mater, 396; 2010, p 1‐9.
[11] T.S. Byun, N. Hashimoto, and K. Farrell, Temperature dependence of strain hardening
and plastic instability behaviors in austenitic stainless steels, Acta Mater, 52; 2004, p
3889‐3899.
[12] C.R. Brinkman, Elevated temperature mechanical properties of an advanced type 316
stainless steel, Trans ASME J. Pres Vessel Tech, 123; 2001, p 75‐80.
[13] L. Gardner and K.T. Ng, Temperature development in structural stainless steel sections
exposed to fire, Fire Safety Journal, 41; 2006, p 182‐203.
[14] J. Chen and B. Young, Stress‐strain curves for stainless steel at elevated temperatures,
Eng Struct, 28; 2006, p 229‐239.
[15] A.K. Roy, S.R. Kukatla, B. Yarlagadda, V.N. Potluri, M. Lewis, M. Jones, and B.J. O'Toole,
Tensile properties of martensitic stainless steels at elevated temperatures, J Mater Eng
Performance, 14; 2005, p 212‐218.
[16] L. Gardner, A. Insauti, K.T. Ng, and M. Ashraf, Elevated temperature material properties
of stainless steel alloys, J Constructional Steel Res, 66; 2010, p 634‐647.
[17] M. Martins and L.C. Casteletti, Sigma phase morphologies in cast and aged super
duplex stainless steel, Mater Charact, 60; 2009, p 792‐795.
[18] D. Dyja and Z. Stradomski, Microstructural evolution in duplex cast steel after quench
ageing process, Arch Mater Sci Eng, 28; 2007, p 557‐564.

[19] ISO 13680:2000(E). Petroleum and natural gas industries ‐ Corrosion‐resistant alloy
seamless tubes for use as casing, tubing and coupling stock ‐ Technical delivery
conditions. 2000. ISO.
[20] ASTM E1245‐03. Practice for determining the inclusion or second phase constituent
content of metals by automatic image analysis. ASTM 2008.
[21] J.C. Prouheze, J.C. Vallant, G. Guntz, and Lefebvre, Production of tubing in duplex steel
VS22 ‐ Influence of cold working on mechanical properties behaviour in corrosive sour
gas and oil Environment, Duplex Stainless Steels Conference Proceedings, (St. Louis,
Missouri), 1983, p 247‐265.
[22] I.V. Hagen and M. Keller, Interrelation Between Fabrication Processes and Mechanical
Properties of AF 22 Duplex Tubes. Duplex Stainless Steels Conference Proceedings, (St.
Louis, Missouri), 1983, p 325‐353.
[23] W. Zheng and D. Hardie, Effect of structural orientation on the susceptibility of
commercial duplex steels to hydrogen embrittlement, Corrosion, 47; 1991, p 792‐799.
[24] G. Herbsleb and R.K. Poepperling, Corrosion Properties of Austenitic‐Ferritic Duplex
Steel AF 22 in Chloride and Sulfide Containing Environments, Corrosion, 36(11); 1980,
p 611‐618.
[25] M. Oberndorfer, K. Thayer, and M. Kastenbauer, Application limits of stainless steels
in the petroleum industry, Materials and Corrosion‐Werkstoffe Und Korrosion, 55;
2004, p 174‐180.
[26] J.L. Song and Bate, Plastic anisotropy in a superplastic duplex stainless steel, Acta
Materialia, 45; 1997, p 2747‐2757.
[27] J. Hill The Mathematical Theory of Plasticity, Oxford, The Clarendon Press, 1950, p
267‐269.
[28] DNV. Submarine Pipelines Systems, Offshore Standard DNV‐ OS‐F101. 2007.

[29] API . Specification for casing and tubing. API Specification 5CT. 6th ed. 1998.
[30] F.J. Klever and G. Stewart, Analytical burst strength prediction of OCTG with and
without defects, Proceeding of the SPE Applied Technology Workshop on Risk Based
Design of Well Casing and Tubing, 7‐8 May 1998, (The Woodlands, Texas, USA), SPE
48329.

LIST OF TABLES
Table 1 Chemical composition (percent by weight) of the pipe material
Table 2 Phase balance of the SDSS microstructure in the longitudinal‐radial plane
(L1, L2, and L3) and in the transverse‐radial plane (T1, T2 and T3).
Table 3 Rockwell C Hardness values in (a) Longitudinal (L) and (b) Transverse (T)
directions.
Table 4 Uniaxial tensile properties in the transverse (T) and longitudinal (L)
directions at room temperature
Table 5 Uniaxial tensile mechanical properties in the transverse (T) and longitudinal
(L) directions at elevated temperatures.
Table 6 Effect of temperature on strain hardening index n and strength coefficient K.

LIST OF FIGURES Figure 1 Location of measured hardness and metallographic examination in the
transverse – radial (T – R) and longitudinal – radial (L – R) planes. All
dimensions in millimetres.
Figure 2 (a) Orientation of the uniaxial tensile sample, and (b) Photograph of the
tensile sample.
Figure 3 Super duplex stainless steel microstructure. The dark colour is the ferrite
while the grey/white colour is the austenite.
Figure 4 Phase balance analysis. (a) Microstructure before phase analysis; dark
(ferrite) and white/grey (austenite). (b) The microstructure after the phases
have been colour coded. (c) Area fraction analysis of the ferrite phase. (d)
Area fraction analysis of the austenite phase.
Figure 5 Uniaxial stress – strain response at room temperature, ~ 22 oC.
(a) Longitudinal direction and (b) Transverse orcircumferential direction.
Figure 6 Effect of temperature on the uniaxial stress – strain response
(a) Longitudinal direction and (b) Transverse direction. Two nominally
identical specimens tested are identified by letters A and B after the test
temperature.
Figure 7 Effect of temperature on the tensile strength (UTS) and 0.2% Proof Stress
(PS) in the longitudinal (L) and transverse (T) directions.

Figure 8 Effect of temperature on the strength de‐rating factor, i.e. ratio of the
strength UTS or 0.2% PS at temperature and the value of the corresponding
strength at room temperature. The best fit to the experimental data is shown
as continuous and dash‐dash lines.

Table 1: Chemical composition of the pipe material
Chemical Composition (wt%)
C Si Mn P S Cu Ni Cr Mo W Co N0.02 0.036 0.049 0.028 < 0.015 0.49 6.83 24.5 3.27 2.61 0.11 0.32

Table 2: Phase balance of the SDSS microstructure in the longitudinal‐radial plane (L1, L2, and L3) and in the transverse‐
radial plane (T1, T2 and T3).
Sample Phase Outer surface (%) Midwall (%) Inner surface (%) Average (%) OL OM OR ML MM MR IL IM IR Ferrite Austenite
L1 Ferrite 53.2 49.5 54.1 49.4 44.9 47.4 49.4 50.5 50.8
49.3 ± 3.9 50.9 ± 3.8
Austenite 46.9 50.6 46.0 50.7 54.8 52.8 50.7 49.6 49.2
L2 Ferrite 54.9 52.0 49.0 49.7 45.4 40.1 49.7 46.4 43.6 Austenite 45.3 48.4 51.2 50.4 54.7 60.1 50.4 53.7 56.5
L3 Ferrite 47.4 54.8 50.4 50.3 53.8 45.1 45.4 47.1 56.2 Austenite 52.8 45.3 49.7 49.8 46.3 55.0 54.7 53.0 44.1
T1 Ferrite 50.3 50.3 50.1 46.9 49.5 51.3 49.6 50.5 50.8
49.4 ± 1.8 50.8 ± 1.8
Austenite 49.9 49.9 50.1 53.3 50.9 48.8 50.5 49.2 49.3
T2 Ferrite 48.5 47.6 49.7 47.7 53.5 48.7 50.2 52.1 51.1 Austenite 51.6 52.5 50.4 52.5 46.7 51.5 49.9 48.0 50.5
T3 Ferrite 45.7 46.9 49.8 47.9 48.3 49.1 49.2 46.8 51.4 Austenite 54.4 53.2 50.3 52.3 51.8 51.0 50.9 53.4 48.8

Table 3 – Rockwell C Hardness values in (a) Longitudinal (L) and (b) Transverse (T)
directions.
(a) Longitudinal (L) direction
Location Outer surface Mid wall Inner Surface Specimen OL OM OR ML M MR IL IM IR
LR1 33.8 31.6 34.3 34.3 33.3 32.5 31.6 35.3 31.6 LR2 33.3 31.6 33.3 31.6 35.2 32.5 32.5 32.0 33.3 LR3 31.6 31.6 33.3 34.3 33.3 33.3 32.5 31.6 31.6
Average 32.7 ± 1.1 33.4 ± 1.1 34.2 ± 1.2 (b) Transverse (T) direction Location Outer surface Mid wall Inner Surface Specimen OL OM OR ML M MR IL IM IR
TR1 34.3 35.3 34.3 33.3 34.3 35.3 34.3 33.1 31.6 TR2 33.3 34.3 36.3 31.6 35.2 35.2 34.3 36.1 33.3 TR3 31.6 33.3 33.0 35.2 35.2 34.3 33.3 33.3 31.6
Average 34.0 ± 1.4 34.4 ± 1.3 33.4 ± 1.2

Table 4: Uniaxial tensile properties in the transverse (T) and longitudinal (L) directions at
room temperature
Tensile Samples T1 T2 T3 L1 L2 L3
Average
T L
σY (MPa) 601.3 619.7 591.1 596.2 600.4 606.4 604 ± 14.5
601 ± 5.2
σ0.2 (MPa) 936.7 975.4 954.5 967.1 970.6 969.7 956 ± 19.4
969 ± 1.8
UTS (MPa) 1055.9 1079.2 1056.2 1060.8 1069.7 1057.7 1064 ± 13.4
1063 ± 6.3
E (GPa) 207.0 207.2 206.2 209.9 205.7 208.4 207 ± 0.5
208 ± 2.2

Table 5 – Uniaxial tensile mechanical properties in the transverse (T) and longitudinal (L) directions at elevated temperatures.
Temperature 90 oC 110 oC 160 oC 200 oC Orientation L1 L2 T1 T2 L1 L2 T1 T2 L1 L2 T1 T2 L1 T1
σY (MPa) 607.4 593.7 571.9 584.7 493.2 567.2 528.9 546.0 414.3 574.3 424.1 427.7 589.8 511.5
σ0.2 (MPa) 879.9 881.8 840.3 842.3 848.7 852.8 806.7 822.5 829.6 812.1 764.4 781.8 807.4 766.4UTS (MPa) 947.4 948.5 936.2 938.9 933.1 936.7 926.2 938.9 892.3 884.1 875.1 878.5 904.6 904.6E (GPa) 205.9 208.4 205.6 205.5 200.5 201.3 201 194.8 196.1 198.6 195.3 199.7 196.3 185.8

27
Table 6 – Effect of temperature on strain hardening index n and strength coefficient K.
Temperature (oC)
n
K (MPa)
Method 1 Method 2 Method 1 Method 2 22 0.0287 0.0270 1219.3 1204.1 90 0.0203 0.0245 1051.8 1062.7 110 0.0201 0.0218 1038.1 1037.0 160 0.0157 0.0298 974.7 1031.9

28
Figure 1: Location of measured hardness and metallographic examination in the
transverse – radial (T – R) and longitudinal – radial (L – R) planes. All dimensions in
millimetres.

29
Figure 2: (a) Orientation of the uniaxial tensile sample and (b) photograph of the tensile
sample.
(a)
(b)
33 mm OD = 5 mm

30
(a) Longitudinal orientation (b) Transverse orientation
Figure 3 Super duplex stainless steel microstructure. The dark colour is the ferrite
while the grey/white colour is the austenite.
20 20

31
(a)
(b)
20 µm
20 µm
32
(c)
(d)
Figure 4 Phase balance analysis. (a) Microstructure before phase analysis; dark
(ferrite phase) and white/grey (austenite phase). (b) The microstructure
after the phases have been colour coded. (c) Area fraction analysis of the
ferrite phase. (d) Area fraction analysis of the austenite phase.

33
Figure 5 Uniaxial stress – strain response at room temperature, ~ 22 oC.
(a) Longitudinal direction and (b) Transverse orcircumferential direction.

34
Figure 6 Effect of temperature on the uniaxial stress – strain response
(a) Longitudinal direction and (b) Transverse direction. Two nominally
identical specimens tested are identified by letters A and B after the test
temperature.

35
Figure 7: Effect of temperature on the tensile strength (UTS) and 0.2% Proof Stress (PS)
in the longitudinal (L) and transverse (T) directions.

36
Figure 8: Effect of temperature on the strength de‐rating factor, i.e. ratio of the strength
UTS or 0.2% PS at temperature and the value of the corresponding strength at room
temperature. The best fit to the experimental data is shown as continuous and dash‐dash
lines.