the mechanics and physics of thin film decohesion and its
TRANSCRIPT

INTERFACE SCIENCE 3, 169-193 (1996) �9 1996 Kluwer Academic Publishers. Manufactured in The Netherlands.
The Mechanics and Physics of Thin Film Decohesion and its Measurement
A. BAGCHI AND A.G. EVANS Division of Applied Sciences, Harvard University, Cambridge, Massachusetts 02138
Received December 1, 1995; Accepted December 1, 1995
Abstract. The intent of this review is to utilize the mechanics of thin films in order to define quantitative procedures for predicting interface decohesion motivated by residual stress. The emphasis is on the role of the interface debond energy, especially methods for measuring this parameter in an accurate and reliable manner. Experimental results for metal films on dielectric substrates are reviewed and possible mechanisms are discussed.
Keywords:
Notation T external stress U stored energy
a crack half length Wad work of adhesion ao initial crack size Y dimensionless quantity for the A section area K-calibration b Burgers vector ~ Dundurs parameter (Eq. (2.3)) c constant ~3 /~ second Dundurs parameter (Eq. (2.3)) Ci constants related to thin film decohesion y interaction angle (Eq. (2.31)) D dislocation free zone near crack ~ location of neutral axis E Young's modulus ~ strain
plane strain value of E ~ thickness ratio, h/H E* average modulus (Eq. (2.9)) 0 polar angle G strain energy release rate K curvature Gss steady-state G ;~ cracking number AGss reduced ~s caused by bending /z shear modulus h film thickness v Poisson's ratio hc critical superlayer thickness ~ loading combination (Eq. (2.38)) H substrate thickness I-I non-dimensional G~ I sectional modulus aij stress tensor K stress intensity factor aR residual stress L characteristic length a0 yield strength
prescribed length to define the mode mixity a* peak stress for the cohesive zone rupture M moment gt mode mixity angle p constant related to Dundurs parameters mode mixity defined at a prescribed
(Eq. (2.33)) length P edge force co relative loading phase r distance from crack tip F fracture energy Ro plastic zone size Fi interface fracture energy
170 Bagchi and Evans
FS Fp Fo
A E E
substrate fracture energy plastic dissipation plastic dissipation for the cohesive zone rupture normalized location of neutral axis, 3/H oscillation index (Eq. (2.5)) modulus ratio, Et /E2
1. Introduction
The number of applications for thin films and multilay- ers that take advantage of their special mechanical, ther- mal, electronic and optical characteristics has steadily increased. The associated technologies include multi- chip modules, thermal and oxidation protection coat- ings, wear and abrasion resistance coatings, etc. In general, the layers are deposited by vapor deposition (either physical or chemical). One of the problems, that has limited the more widespread use of such systems, has been the incidence either of interface decohesion or of delamination within one of the brittle constituents motivated by residual stresses [1-5]. Such stresses are inevitable in vapor deposited layers and are exacer- bated when the constituent materials have vastly dif- fering thermomechanical properties, such as polymers on metals and metals on ceramics. The stresses arise for two reasons. (1) Intrinsic stresses develop during deposition [6]. These stresses persist, unless they are relaxed by plastic deformation or annealing. (2) The mismatch in thermal expansion induces stresses when the temperature is changed [7].
Controlling the stress in order to inhibit decohesion and delamination without compromising the functional characteristics of the system is not usually an option. Instead, thermomechanical design of multilayer sys- tems to resist these failure modes is required. This goal is crucially dependent upon the attainment of an ade- quate interface debond toughness, F i. The toughness requirement is manifest in the fail-safe design solution, [1, 8]
Fi > hcr~/E)~ (1.1)
where h is the film thickness, /~ is its appropriate Young's modulus (plane strain or biaxial plane stress), err is the residual stress and X is a cracking number (of the order unity). When Eq. (1.1) is satisfied, there is insufficient energy stored in the film to permit an interface crack to propagate and the film must remain attached to the substrate.
In order to implement this fail-safe criterion, meth- ods for the accurate measurement of Fi on the actual interfaces of relevance must exist. The principal in- tent of the present review is to describe and analyze the available methods with the objective of identifying those capable of providing the quantitative information needed to apply Eq. (1.1). There have been several re- views on aspects of this topic. These include surveys of test methods, [9-12] the thermomechanical integrity of films and multilayers [13], the mechanics of crack growth along interfaces [ 14], residual stresses and their origin [15]. The present review differs from these by focusing on the quantitative aspects of thin film deco- hesion and its measurement. Most thin film adhesion tests empirically infer the adhesive strength by subject- ing the film to some external loading (like scratching, pulling or inflating) and measuring the load at which decohesion occurs. These tests are simple and effec- tive for routine ranking of bond quality. However, they do not measure Fi, because the strain energy release rate cannot be deconvoluted from the work done by the external load [12]. An ideal test should duplicate the practical situation as closely as possible and be able to modulate the available strain energy. It must also explicitly incorporate the contribution to decohesion from the residual stress. The test methods are assessed against this ideal.
2. Mechanics of Thin Film Dec0hesion
2.1. Basic Principles
Most decohesion problems of interest involve films subject to residual tension. This case is given the major emphasis in the present article. Relatively few remarks are made about the corresponding problem when the films are in compression. Films in tension are able to decohere from the substrate by relaxing the resid- ual stress in the film above the interface crack. For the simplest case of a thin, homogeneous film sub- ject to uniform residual stress on a thick substrate, the steady-state energy release rate, Gss, for an interface crack is given by the strain energy in the film. The non-dimensional form for a film is,
1-I = EGss/cr~h (2.1)
where FI is a non-dimensional quantity of the order unity. The same form arises for other problems, but its numerical magnitude differs, as elaborated below.
The Mechanics and Physics of Thin Film Decohesion and its Measurement 171
Decohesion takes place when Gss exceeds the interface debond energy, I'i,
Gss > F~ (2.2)
However, F i may be a strong function of the mode mixity, manifest in a mixity angle 7~, defined below (Eq. (2.11)) [14]. Hence, it is not sufficient to know Gss; ~/ must also be calculated. Moreover, to design against decohesion, the interfacial fracture toughness must be measured as a function of 7I. Both topics are elaborated in this article.
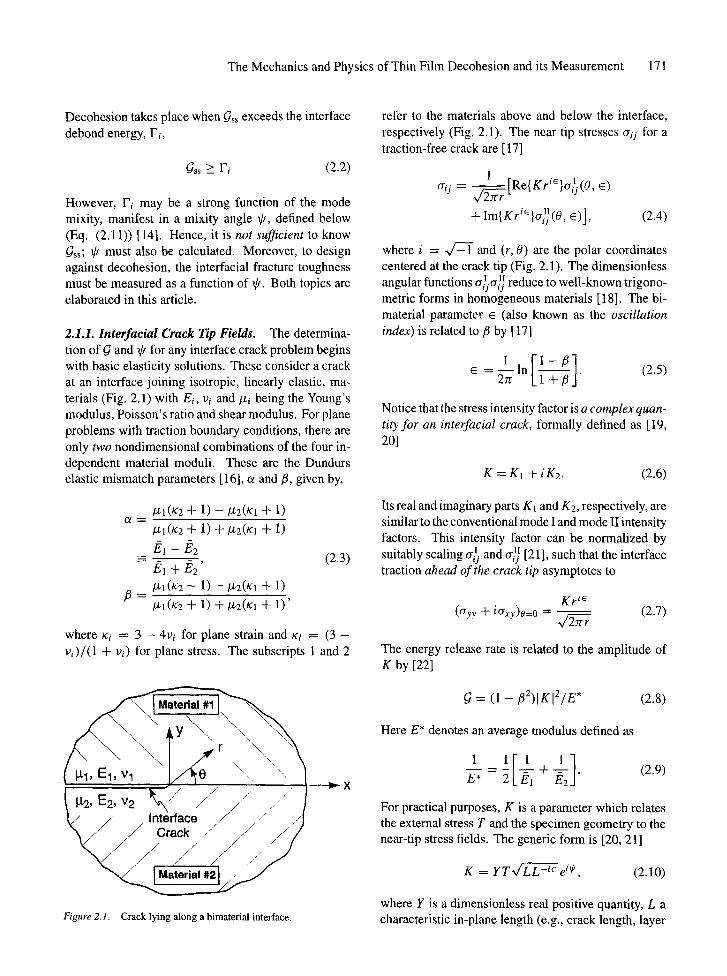
2.1.1. lnterfacial Crack Tip Fields. The determina- tion of ~ and 7~ for any interface crack problem begins with basic elasticity solutions. These consider a crack at an interface joining isotropic, linearly elastic, ma- terials (Fig. 2.1) with El, vi and/zi being the Young's modulus, Poisson's ratio and shear modulus. For plane problems with traction boundary conditions, there are only two nondimensional combinations of the four in- dependent material moduli. These are the Dundurs elastic mismatch parameters [16], ee and/3, given by,
~ I ( X Z + I ) - - N 2 ( K I + I ) ]s -~ 1) "t- s(/,2(Kl -~ 1)
/~1 - - J~2
E1 "-F /~2' /zl(~cz - 1) - /z2(K 1 "~ 1)
~I(K2-{-1)-k-/Z2(KI q - l ) '
(2.3)
where Ki = 3 - 4p i for plane strain and xi = (3 - Vi)/(1 + Vi) for plane stress. The subscripts 1 and 2
~ r " . : '< ;1
[ / / Interface / / / I
\ / / / j j /
Figure 2.1. Crack lying along a bimaterial interface.
~ X
refer to the materials above and below the interface, respectively (Fig. 2.1). The near tip stresses 17ij for a traction-free crack are [17]
17ij = 1
2~/~.7[Re{ Kri~ }~r~j(O, c)
-t- Im{Krie}~ril~(O, E)], (2.4)
where i = ~ and (r, 0) are the polar coordinates centered at the crack tip (Fig. 2.1). The dimensionless angular functions crIcr]] reduce to well-known trigono- metric forms in homogeneous materials [18]. The bi- material parameter 6 (also known as the oscillation index) is related to fl by [17]
e = ~ - l n ~ . (2.5)
Notice that the stress intensity factor is a complex quan- tity for an interfacial crack, formally defined as [19, 20]
K = K1 + iK2. (2.6)
Its real and imaginary parts K1 and K2, respectively, are similar to the conventional mode I and mode II intensity factors. This intensity factor can be normalized by suitably scaling ~r~ and cri~ [21], such that the interface traction ahead of the crack tip asymptotes to
Kr ie (~ryy -F i~rxy)O=O = ~ (2.7)
The energy release rate is related to the amplitude of K by [22]
= (1 - [~2)IKI2/E* (2.8)
Here E* denotes an average modulus defined as
E* - 2 + " (2.9)
For practical purposes, K is a parameter which relates the external stress T and the specimen geometry to the near-tip stress fields. The generic form is [20, 21]
K = Y T ~ e i~, (2.10)
where Y is a dimensionless real positive quantity, L a characteristic in-plane length (e.g., crack length, layer
172 Bagchi and Evans
thickness), and (z is the mode mixity angle
i ~/ = ln[KL-ie /IKI] (2.11)
The parameters Y and 7J can be evaluated by stress analysis. In general, they depend on the moduli, the geometry and loading details. Such calibrations have been listed elsewhere [14, 23].
The analogs of the mode I and mode II stress inten- sity factors are not constants. Instead, they are func- tions o f r and can be denoted Ki(r) and Kn(r), such that [21]
Ki(r) --- Re(Kr ie) = YTV'L'cos[lp- ~ ln(L/r)],
Kn(r) =- Im(Kr ie) = YTV~sin[Vt- e ln(L/r)].
(2.12)
Clearly, the ratio of the shear and the normal com- ponents of the interface traction is not constant. To address this complexity, a fixed length is introduced. Then, the mode mixity, ~, can be defined unambigu- ously as,
i~ = ln[KL-ie /IKI] (2.13)
For convenience,/, may be chosen to correspond to some fracture process zone size. Then, the interface tractions can be re-expressed as
errs = [Kl(2zrr)-l/2 cos[(~+ e In(r//,)],
~xy = IKl(2]rr) -1/2 sin[~/+ e In(r/L)]. (2.14)
and the mode mixity becomes
= Jim(K/`i~) tan-1 L ~ ] (2.15)
or
O'xy ~ = t a n - l I ( ~ y y ) r = L ]" (2.16)
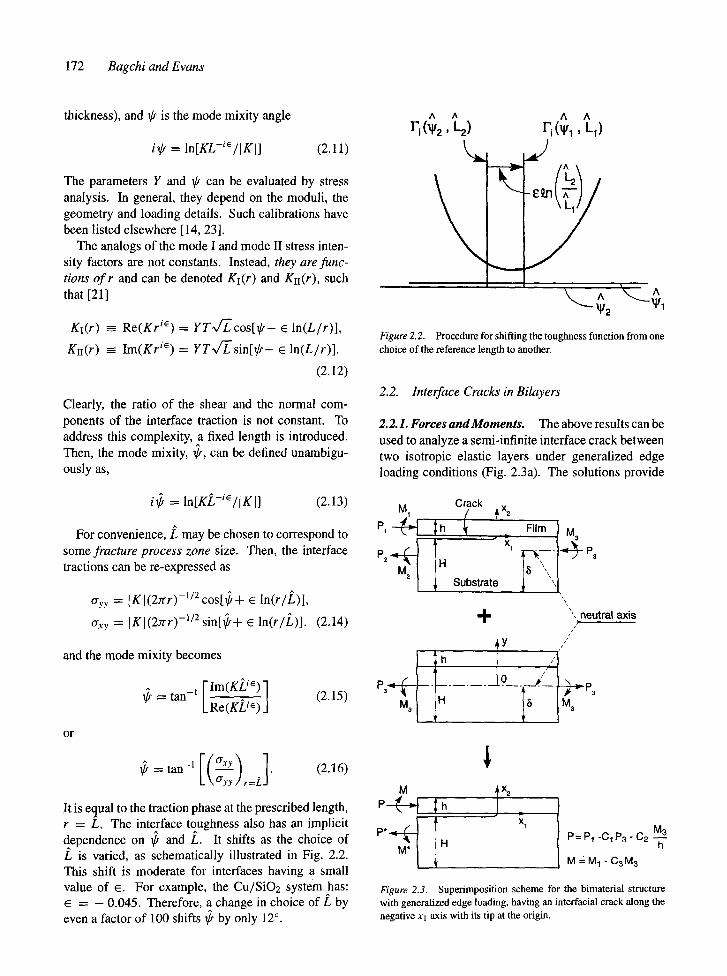
It is equal to the traction phase at the prescribed length, r = L. The interface toughness also has an implicit dependence on ~ and /`. It shifts as the choice of /` is varied, as schematically illustrated in Fig. 2.2. This shift is moderate for interfaces having a small value of e. For example, the Cu/SiO2 system has:
= - 0.045. Therefore, a change in choice of/` by even a factor of 100 shifts g/by only 12 ~
^ A A A r i ('~1/2 , L 2) r i (~1/1 , L 1)
\
I
,,= !
~2 A
Figure 2.2. Procedure for shifting the toughness function from one choice of the reference length to another.
2.2. Interface Cracks in Bilayers
2.2.1. Forces and Moments. The above results can be used to analyze a semi-infinite interface crack between two isotropic elastic layers under generalized edge loading conditions (Fig. 2.3a). The solutions provide
Crack
P~ h Film
P2 . ' ~ . I IH x 1 i
M I J 2 I ~ Substrat e ~
4" ~Y
h / ( .9__.__/" M3 H 5
M 3
neutral axis
t'P3 M 3
P-(-"EIh P* x ~ ~ M P= P1 -C1 P3 " C2 .--o h
M = M~ - C3M 3
Figure 2.3. Superimposition scheme for the bimaterial structure with generalized edge loading, having an interfacial crack along the negative Xl axis with its tip at the origin.
The Mechanics and Physics of Thin Film Decohesion and its Measurement 173
the basic methodology for calculating the mode mixity. Force P and moment M equilibria dictate that [24],
PI - P2 - ~ = 0, (2.17)
M 1 - M 2 + p , ( h + H - 3 )
/ r 1 N
3_-0
The quantity 3 is the height of the neutral axis of the bimaterial beam from the bottom surface. Only four among these six loading parameters are actually inde- pendent. These are, Pl, P3, M1 and M3. The number of independent load parameters can be further reduced to only two, through superposition (Fig. 2.3b). These parameters are P and M, given by,
M~ P = P1 - C L ~ - C 2 - ~
M = M 1 - C3M3, (2.19)
where the C's are dimensionless numbers that must be calculated in accordance with the following five steps: obtain the position of the neutral axis, evaluate the sec- tional modulus, obtain the section area, calculate the stresses, determine the C's.
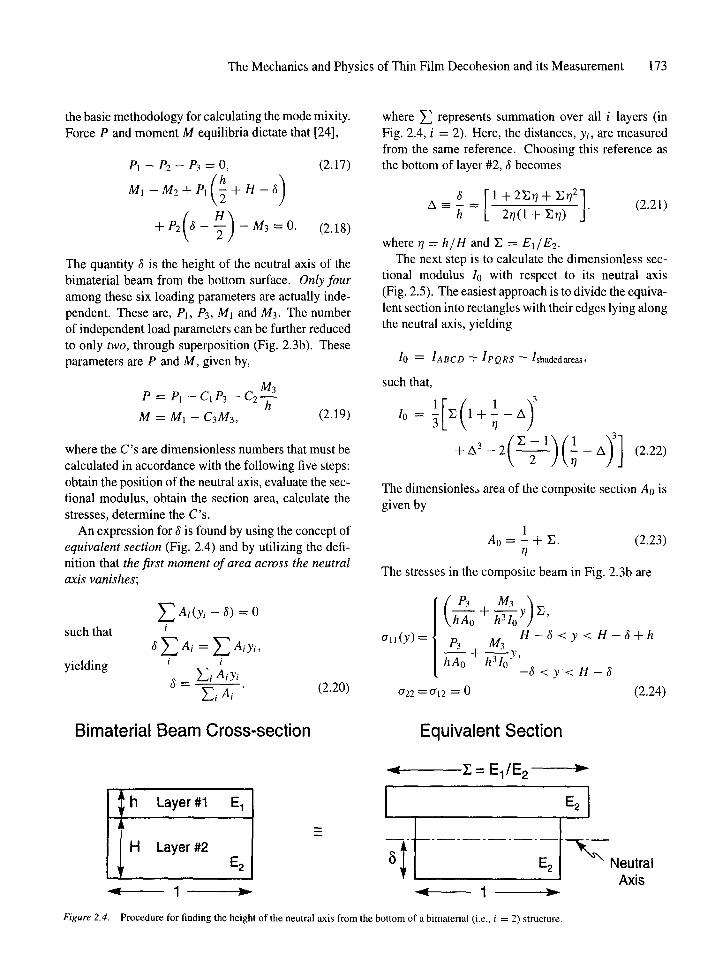
An expression for 3 is found by using the concept of equivalent section (Fig. 2.4) and by utilizing the defi- nition that the first moment of area across the neutral axis vanishes;
such that
yielding
Z Ai(Yi - 3) ~- 0
~ Z Ai = Z Ai yi, i i
= ~-~i AiYi
Y~4 Ai (2.20)
where ~ represents summation over all i layers (in Fig. 2.4, i = 2). Here, the distances, yi, are measured from the same reference. Choosing this reference as the bottom of layer #2, 6 becomes
~ [ l + 2 E r / + E 0 2 ] (2.21) A ~ ~ = 2q(1 + ~r/) "
where r /= h/H and E = El~E2. The next step is to calculate the dimensionless sec-
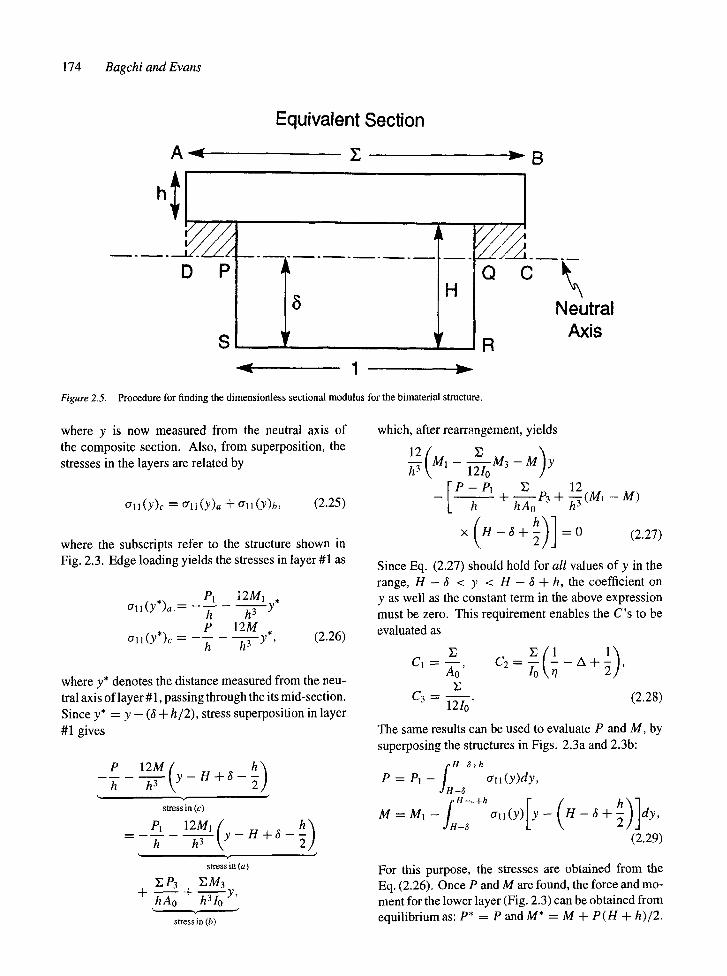
tional modulus Io with respect to its neutral axis (Fig. 2.5). The easiest approach is to divide the equiva- lent section into rectangles with their edges lying along the neutral axis, yielding
Io = IABCD "Jr- IpQRS -- Ishadedareas,
such that,
Io= :c I + - - A
-+ "A3 -- 2 ( ~ - ~ - ~ ) ( ~ -- A) 3] (2.22)
The dimensionleso area of the composite section Ao is given by
1 A0 = - + E. (2.23)
q
The stresses in the composite beam in Fig. 2.3b are
all(y) =
M3
H - 3 < y < H - 3 + h t'3
+ h-Tolo y, - ~ < y < H - 8
a22~a12 = 0 (2.24)
Bimaterial Beam Cross-section Equivalent Section
h Layer #1 E 1
H Layer #2 E2
- - " 1 y
I
~ Z = EI/E 2 r
E 2 ~ Neutral Axis
Figure 2.4. Procedure for finding the height of the neutral axis from the bottom of a bimaterial (i.e., i = 2) structure.
174 BagchiandEvans
Equivalent Section
A
. ,
D P
S
T_, r
v
\ Neutral
Axis
Figure 2.5. Procedure for finding the dimensionless sectional modulus for the bimaterial structure,
where y is now measured from the neutral axis of the composite section. Also, from superposition, the stresses in the layers are related by
al](y)c=a11(y)a-t-all(y)b, (2.25)
where the subscripts refer to the structure shown in Fig. 2.3. Edge loading yields the stresses in layer #1 as
fill(Y*)a--- P1 t 2Mly . h h 3 P 12M
r = - - ~ - - - h3 Y*, (2.26)
where y* denotes the distance measured from the neu- tral axis of layer #1, passing through the its mid-section. Since y* = y - (8 + h/2), stress superposition in layer #1 gives
P 1 2 M ( h ) -~ -~ y - H + a -
Y stress in (c)
h h3 y - H + 3 -
stress m (a)
P3 NM3
+ za-;o +h= o y'. stress in (b)
which, after rearrangement, yields
1210 M3 - M ) y
Z 12
• ( H - s + h ) ] = 0 (2.27)
Since Eq. (2.27) should hold for all values of y in the range, H - 3 < y < H - S + h, the coefficient on y as well as the constant term in the above expression must be zero. This requirement enables the C's to be evaluated as
Cl = A'--o'
C 3 - 12Io" (2.28)
The same results can be used to evaluate P and M, by superposing the structures in Figs. 2.3a and 2.3b:
f H-8+h P = P1 - cql(y)dy,
J H-6
= - al l (y) y - H - 8 + ~ ' / / y J H - ~
(2.29)
For this purpose, the stresses are obtained from the Eq. (2.26). Once P and M are found, the force and mo- ment for the lower layer (Fig. 2.3) can be obtained from equilibrium as: P* = P and M* = M + P(H + h)/2.

The Mechanics and Physics of Thin Film Decohesion and its Measurement 175
(a)
(b)
(c)
M
P'K-- M* I Substrate[
j aa
P%-- M*
I
V I j
t J I j r . L . / I j '
I . J
U c = O
Figure 2.6. Energy release rate can be found by considering the energy far ahead and far behind the crack tip, in the volume elements found by translation and superposition as illustrated above, for unit length of crack extension.
2.2.2. Energy Release Rates and Mode Mixities. The steady-state strain energy release rate can be com- puted from the difference between energy stored in the structure per unit length far ahead and far behind the crack tip (Fig. 2.6),
0 Gss = ~ ( U ~ + Ub - U~)
= 2/~1 + 12--~-
-+- 2~" 2 \ H q- 12"-~ - T ) - 0
l [ p2 M 2 = 2~71 L-~- {t + ~:,7(] + 0) ~} + 12-~-(1 + :co 3)
+ 12~--~(1 + rl)PM . (2.30a)
This can be re-expressed as
l--J--- [ P22/~1L Ah -i~M2 PM 1 Gss = + + 2 - ~ - - ~ sin 7 , (2.30b)
The quantities A, I and g are now given by
1 1 A = 1 + I3(40 + 602 + 3r/3) ' I = 12(1 + E03) '
sin g = 6Z02( 1 + 0) v/-~7- (2.31)
The corresponding stress intensity factor is [11],
[ p2 MZ 2 P M ] p2 IKj2= )-~+~-~-5-+ , /~_]h2sing-~- (2.32)
where p relates to the Dundurs parameters as
/ 1 - a P = 1 - /32 . (2.33)
To obtain the real and imaginary parts of K, linearity and dimensional considerations are exploited, leading to the following general expression
K = a - - ~ + b n , (2.34)
where a and b are dimensionless complex numbers. They depend only on the geometric parameter 0 and the Dundurs parameters, and can be found by substitution of Eq. (2.34) into Eq. (2.32), yielding
a = e i~~ b = - ie i(~~ , (2.35)
such that
2 sin y = fib -t- a/~
where co(or,/~, 0) is a real angular quantity tabulated by Suo and Hutchinson [24].
Taking the reference length = h gives
Re[Kh ie] = ~ cos co + ~ sin(co + 7)
+ ] Im[Kh i~] = ~ sin co - - - ~ cos(co + ~,) .
(2.36)
176 Bagchi and Evans
Therefore, the mode mixity, at the prescribed length r = h ahead of the crack tip, is given by
F~ sinw - cos(w+ ~,)] =tan-lL c ~ ~ ~ y 5 J' (2.37)
where ~ measures the loading combination:
= V A M ' (2.38)
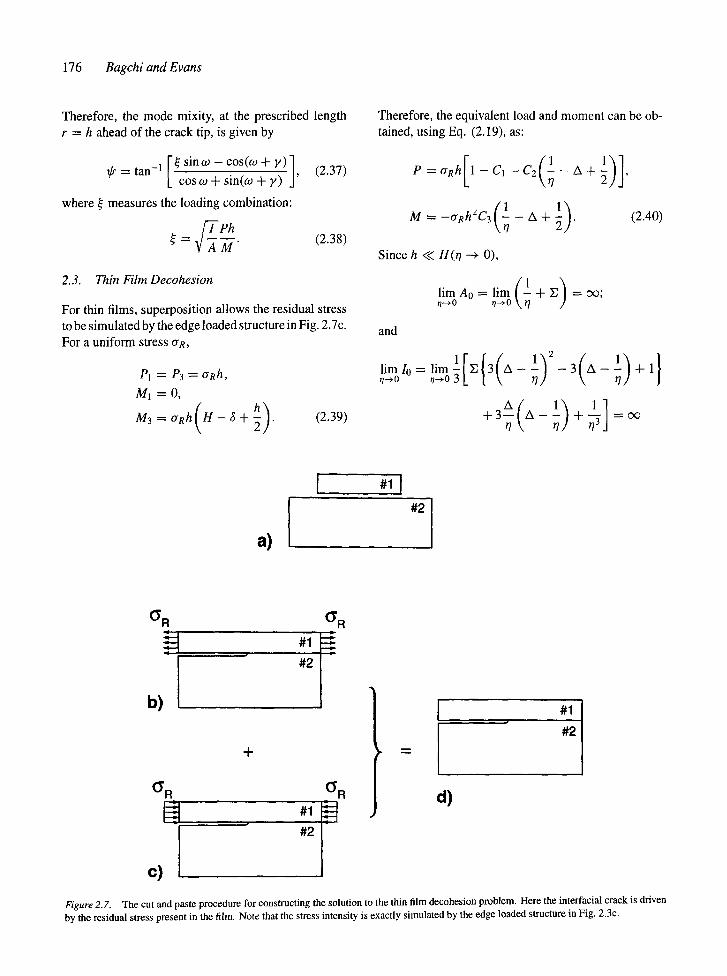
2.3. Thin Film Decohesion
For thin films, superposition allows the residual stress to be simulated by the edge loaded structure in Fig. 2.7c. For a uniform stress erR,
PI = P3 = o R h ,
M1 --0,
M3 =crRh(H- '+h) . (2.39)
Therefore, the equivalent load and moment can be ob- tained, using Eq. (2.19), as:
P = c r R h I I - C I - C 2 ( 1 - A + 2 ) ],
M = -~rRhZC3(~ - A + ~).
Since h << HOt ~ 0),
l i m A o = l i m ( l + z ) = o o ;
and
lim I0 = lim ~ [ I ] { 3 ( A - ~ ) q---~-0 rl---~ 0
+ 3 A-- + = c ~
(2.40)
a) l '21
(YR
b,L -I-
(YR
#2
O'R ~R
c) I #2
d)
#1
#2
Figure 2.7. The cut and paste procedure for constructing the solution to the thin film decohesion problem. Here the interfacial crack is driven by the residual stress present in the film. Note that the stress intensity is exactly simulated by the edge loaded structure in Fig. 2.3c.
The Mechanics and Physics of Thin Film Decohesion and its Measurement 177
therefore,
l i m C , = lim [~----~]=0; r/---~O Ao--+cc
l i m C 2 = lim - - A + = 0 ; 1/-+0 ~---'-0
l i m C 3 = lim [12-~0]=0. 0--->0 lo-+oc
Hence, Eq. (2.40) can be specialized to
P = rrRh, M = 0. (2.41)
Also, the limiting values of A, I and y are obtained as:
[ ' ] l i m A = lira = 1; ,~o ,~o 1 + Z(4i7 + 6/'12 + 3/7 3)
l i m I = l i m [ 1 ] 1 - _ , ,~0 n~0 12(1 + 3r/3) 12
lim(sin y) = ~im[6Zr/2(1 + r/)v/-A'l] = 0. 1/--->0
In this limit, G~ is given by Eq. (2.1), such that
{ h \ 112 . . Kss = aR~ ~ ) h-'%"~ (2.42)
The parameter s e takes the limiting value
lim~ = lira I,/-f-Ph ] = cx~, 0~o .-+0 LV A M_]
whence
/ = lim tan -1 = w. To- +
(2.43)
This indicates that, for thinfilm decohesion, the mode mixity ~ --+ o9 [24]. Moreover, since the film stress di- minishes as the interface decoheres, this energy release behavior is entirely controlled by elasticity, even when the film has yielded upon prior thermal processing [ 14].
2.4. Multilayer Films
Many cases exist in which decohesion may occur at an interface below the surface film. Additional con- siderations are then involved in calculating the energy release rate and the mode mixity. The key new feature recognizes that the stresses in a multilayered film above
the crack are not fully relieved, causing the energy re- lease rate to be diminished. The redistributed stresses must be determined before obtaining ~ and ~. For a generalized multilayer with non-uniform stresses, the analysis is unwieldy. Here, only the general method is described. Explicit results are given for a bilayer film on a substrate.
2.4.1. Energy Release Rate. If N layers were dis- connected, all of the residual strain energy would be available and the energy release rate G~ would be given by Eq. (2.1), summed over the layers. For a thick sub- strate,
o -
i=N
(2.44)
The actual energy release rate is lower. It is diminished by AGss, which is dependent on the stresses that remain in the layers, because they are connected,
Gss = G~ + AGss (2.45)
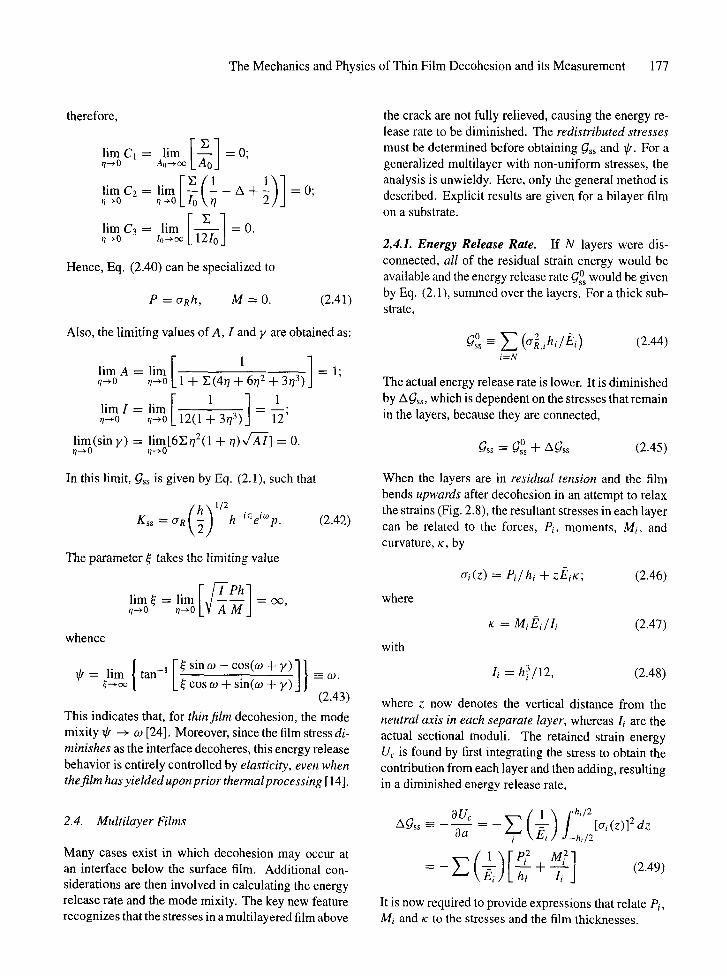
When the layers are in residual tension and the film bends upwards after decohesion in an attempt to relax the strains (Fig. 2.8), the resultant stresses in each layer can be related to the forces, Pi, moments, Mi, and curvature, x, by
where
with
~ri(z) = Pi/hi + zEix; (2.46)
x = MiEi/l i (2.47)
li = h~/12, (2.48)
where z now denotes the vertical distance from the neutral axis in each separate layer, whereas Ii are the actual sectional moduli. The retained strain energy Uc is found by first integrating the stress to obtain the contribution from each layer and then adding, resulting in a diminished energy release rate,
A~ss _ 3 U c ( 1 ) /'hi/2 - E Lhi,F '(z)fd
(')r = - ~ ~ L hi "f- li J (2.49)
It is now required to provide expressions that relate Pi, Mi and x to the stresses and the film thicknesses.
178 Bagchi and Evans
0"1 ~ . / EI 'v ' ,~ M I i lk
E2 | h211 M2 ~ L,...,...~ I (Y'2 / , ~ ~ Decohesion
5z, _ [ Substrate], ]Decohesion, I
(a) (b) Figure 2.8. A schematic showing the behavior of a bilayer film subject to residual tension as it decoheres from the substrate. The stresses al, a2 are the misfit stresses, which provide the forces Pi and the moments M i in the metal bilayer above the decohesion crack. The curvature of the decohered bilayer film is x.
For a multilayer film (i = 1, 2, 3 . . . . . n), the num- ber of unknowns is 2n + 1, because each layer has two (a force, Pi, and a moment, Mi) in addition to the cur- vature, x, of the film after decohesion. The solution requires 2n + 1 linear equations. The first two stem from equilibrium considerations
E FORCE 0; (2.50) i
o r
PI + P2 + . . . + Pn = O
and
E MOMENT = 0; (2.51) i
o r
n n-1 Fhi + hn n-I ] EM,-- E ' ,L-v- + Z i=1 i=1 x=i+l J
The remaining n - 1 equations involve strain compati- bility at the n - 1 interfaces. For rth interface, this can be expressed as (r = 1, 2 . . . . . n - l )
Pr hHc Pr+l hr+n~c 8r "1- ~ r h r "tw T = 8r+l ~r+lhr+l 2
(2.52) where the strain terms 8i should be negative for layers
in residual tension before decohesion. For a bilayer film, solutions for P and x obtained
from these results are [25]
e=[ j
and
6(hl + h 2 ) ( e l - 8 2 )
[h 2 + Eeh3/IElhl + Eih~/E2h2 + h~ + 3(h, + h2) 2]
(2.53)
with ei = Crr, i/Ei(.1 - I)i). The moments are obtained from Eq. (2.47) using tc from Eq. (2.53). The final result for the strain energy release rate is determined by using the forces and moments in Eq. (2.49) with (2.44) and (2.45).
The following numerical example illustrates this method by calculating the energy release rate for a Cu/Cr bilayer film, described in Section 4.4, having the following properties,
E1 = 93 GPa, vl = 0.21, crR,l = 1675 MPa,
el = 0.0142
E2 = 120 GPa, v2 = 0.33, OR, 2 = 50 MPa,
ez = 0.0003
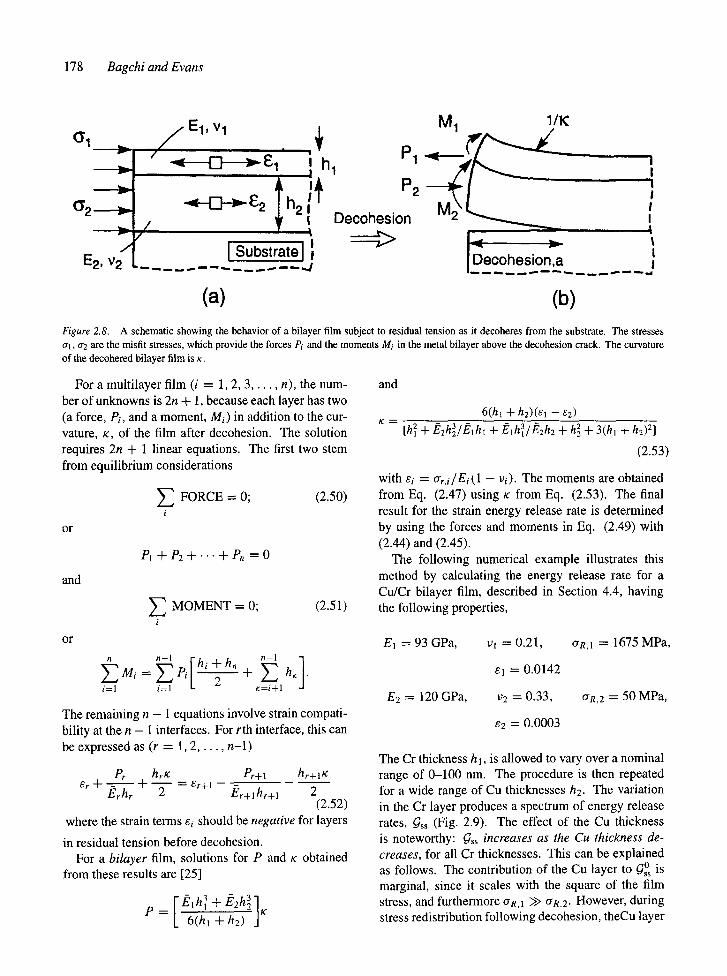
The Cr thickness hi, is allowed to vary over a nominal range of 0-100 nm. The procedure is then repeated for a wide range of Cu thicknesses h2. The variation in the Cr layer produces a spectrum of energy release rates, G~s (Fig. 2.9). The effect of the Cu thickness is noteworthy: G~s increases as the Cu thickness de- creases, for all Cr thicknesses. This can be explained as follows. The contribution of the Cu layer to ~s ~ is marginal, since it scales with the square of the film stress, and furthermore O'R, 1 >> O'R. 2. However, during stress redistribution following decohesion, theCu layer

The Mechanics and Physics of Thin Film Decohesion and its Measurement 179
2.5
1.5 n,.
~ 0.5
r- 0 U.I
0
I I I I
hcu = 2 5 n m ~ /
~ ~ ~ , , , , , , , , , ~ , , , ~ - .500 nm
t I I I
20 40 60 80 1 O0
Cr Superlayer Thickness, (nm)
Figure 2.9. Variation in the strain energy release rate with chromium superlayer thickness.
acts as a sink by storing elastic strain energy which increases the magnitude of AGss.
2.4.2. Mode Mixity. To evaluate 1//, it is necessary to determine both the real (Kl) and the imaginary (Ke) parts of K (Section 2.2). A general solution has yet to be developed. Results are presented for a bilayer in which the elastic moduli of the two films are identical, though distinct from the substrate (El -~ E2 ~ E3) [26].
Referring to the generalized loading of the bimate- rial system (Fig. 2.10) and recalling that overall equi- librium provides two constraints among the six loading parameters, there are only three independent parame- ters [24]. From the equivalence of the two systems in Fig. 2.10, the three parameters can be expressed in terms of erR. I and crR.2 as follows,
P] = P3 = crn,lh] + crR.2h2;
(2.54)
where ,~ is now the height of the neutral axis from the bottom of the substrate. Once Pi, Mt and M3 have been found, M and P are obtained from Eq. (2.19). Then
is obtained from Eqs. (2.31) and (2.38). Finally, is obtained from Eq. (2.37). Some results for Cr/Cu bilayers are shown in Fig. 2.11. The most interesting
~2 I h, Layer #1 ~/E1 'vt h 2 Layer #2 E 2 , v 2
\ Interfacial
Crack
I Substrate J E , , v s
(a)
E, = E2-- E, Vl=' V 2 - Vf
M~
/
M2
G 1
" q t - { 3 " - t ' O 2 E t , vf
I Substrate I S ~ ' V s
M /
Neutral (b ) Axis
Figure 2.10. A schematic illustrating the reduction of the bilayer film decohesion problem to the bimaterial system with an interfa- cial crack, when El ~-- E2 ~ Es. The stresses ~rl, a2 are the misfit stresses present in the bilayer, whereas the forces P ' s and the mo- ments M's stand for the generalized loading in the bimaterial system.
50
2 O')
"O
X
0
40
30
20
10
0
-10 0
, Re (Kh") �9 I h =film thi:knes I^ Kh
~ ~ Cu = 25 nm
500 nm I I I I
20 40 60 80 100
Cr Super layer Thickness , nm
Figure2.11. Variation in the phase angle with chromium superlayer thickness.
180 Bagchi and Evans
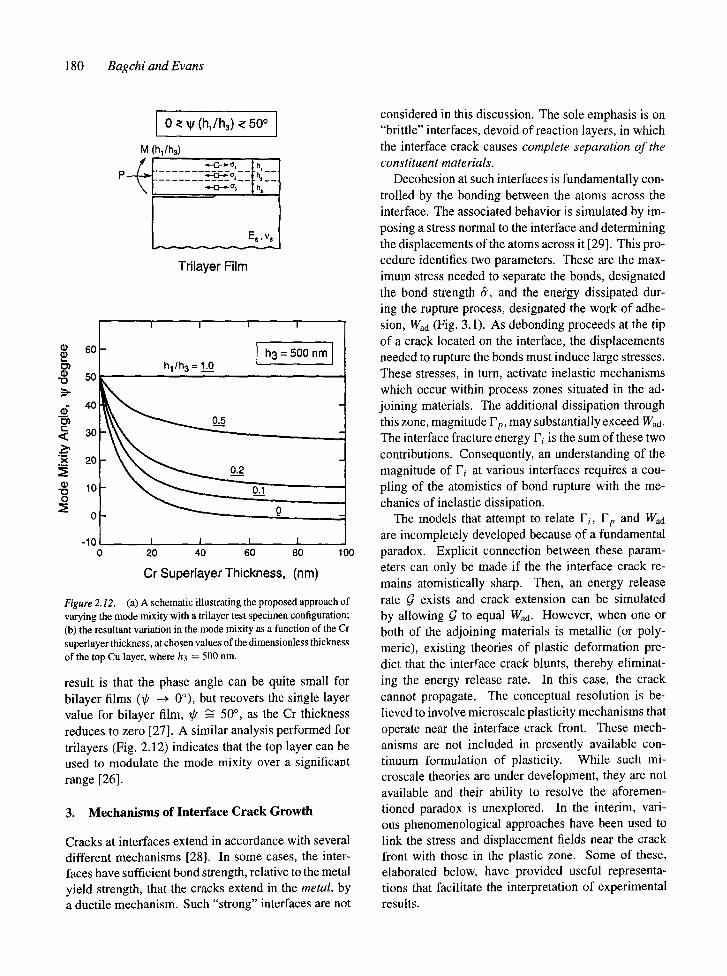
0 ~ ~/(h~/h3) ~' 500 I
M (hi/h3)
Trilayer Film
60
50 "0
40
"~ 20
0
I I
hl /h 3 = 1.0
I I
-10 0 100
0
I I I I 20 40 60 80
Cr Superlayer Thickness, (rim)
Figure 2.12. (a) A schematic illustrating the proposed approach of varying the mode mixity with a trilayer test specimen configuration; (b) the resultant variation in the mode mixity as a function of the Cr superlayer thickness, at chosen values of the dimensionless thickness of the top Cu layer, where h3 = 500 nm.
result is that the phase angle can be quite small for bilayer films 0P ~ 0~ but recovers the single layer value for bilayer film, ~p ~ 50 ~ as the Cr thickness reduces to zero [27]. A similar analysis performed for trilayers (Fig. 2.12) indicates that the top layer can be used to modulate the mode mixity over a significant range [26].
3. Mechanisms of Interface Crack Growth
Cracks at interfaces extend in accordance with several different mechanisms [28]. In some cases, the inter- faces have sufficient bond strength, relative to the metal yield strength, that the cracks extend in the metal, by a ductile mechanism. Such "strong" interfaces are not
considered in this discussion. The sole emphasis is on "brittle" interfaces, devoid of reaction layers, in which the interface crack causes complete separation of the constituent materials.
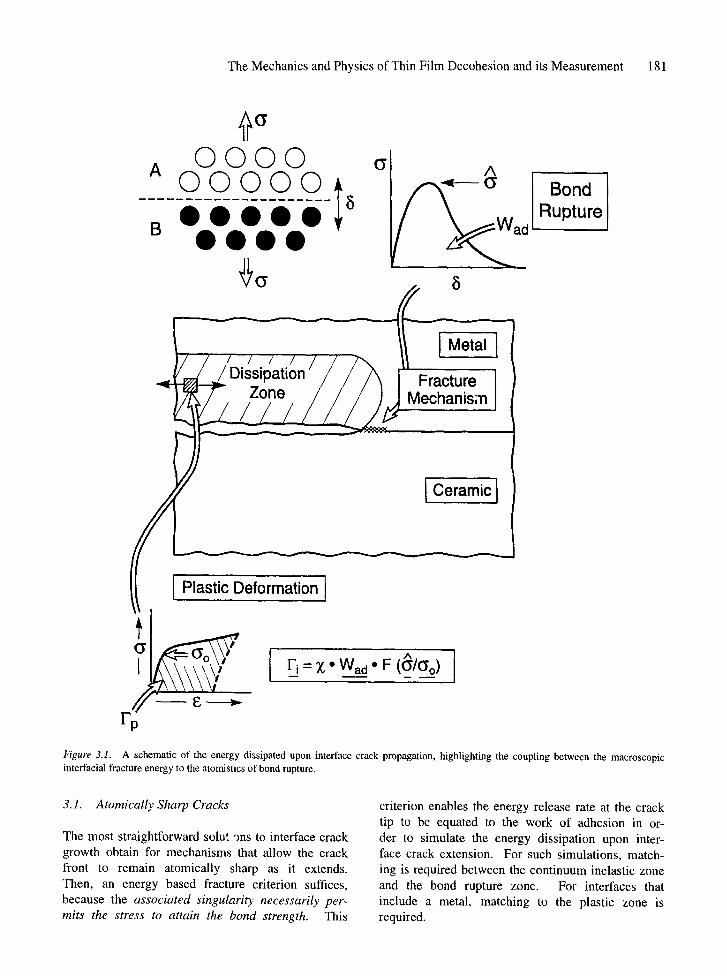
Decohesion at such interfaces is fundamentally con- trolled by the bonding between the atoms across the interface. The associated behavior is simulated by im- posing a stress normal to the interface and determining the displacements of the atoms across it [29]. This pro- cedure identifies two parameters. These are the max- imum stress needed to separate the bonds, designated the bond strength 6, and the energy dissipated dur- ing the rupture process, designated the work of adhe- sion, Wad (Fig. 3.1). As debonding proceeds at the tip of a crack located on the interface, the displacements needed to rupture the bonds must induce large stresses. These stresses, in turn, activate inelastic mechanisms which occur within process zones situated in the ad- joining materials. The additional dissipation through this zone, magnitude r'p, may substantially exceed Wad. The interface fracture energy Fi is the sum of these two contributions. Consequently, an understanding of the magnitude of I'i at various interfaces requires a cou- pling of the atomistics of bond rupture with the me- chanics of inelastic dissipation.
The models that attempt to relate Fi, F t, and Wad are incompletely developed because of a fundamental paradox. Explicit connection between these param- eters can only be made if the the interface crack re- mains atomistically sharp. Then, an energy release rate G exists and crack extension can be simulated by allowing G to equal Wad. However, when one or both of the adjoining materials is metallic (or poly- meric), existing theories of plastic deformation pre- dict that the interface crack blunts, thereby eliminat- ing the energy release rate. In this case, the crack cannot propagate. The conceptual resolution is be- lieved to involve microscale plasticity mechanisms that operate near the interface crack front. These mech- anisms are not included in presently available con- tinuum formulation of plasticity. While such mi- croscale theories are under development, they are not available and their ability to resolve the aforemen- tioned paradox is unexplored. In the interim, vari- ous phenomenological approaches have been used to link the stress and displacement fields near the crack front with those in the plastic zone. Some of these, elaborated below, have provided useful representa- tions that facilitate the interpretation of experimental results.
The Mechanics and Physics of Thin Fi lm Decohesion and its Measurement 181
A
B
0 0 0 0 0 0 0 0 0 I 0 0 0 0 0
0 0 0 0
O" A
8
Bond Rupture
Zone Fracture I Mechanis;n I
I Cer.m, ]
] Plastic Deformation I
I ^ I F i = ~, " W a d �9 F ((~/(~o)
Figure 3.1. A schematic of the energy dissipated upon interface crack propagation, highlighting the coupling between the macroscopic interfacial fracture energy to the atomistics of bond rupture.
3.1. Atomically Sharp Cracks
The most straightforward solut ")ns to interface crack growth obtain for mechanisms that allow the crack front to remain atomically sharp as it extends. Then, an energy based fracture criterion suffices, because the associated singularity necessarily per- mits the stress to attain the bond strength. This
criterion enables the energy release rate at the crack tip to be equated to the work of adhesion in or- der to simulate the energy dissipation upon inter- face crack extension. For such simulations, match- ing is required between the continuum inelastic zone and the bond rupture zone. For interfaces that include a metal, matching to the plastic zone is required.
182 Bagchi and Evans
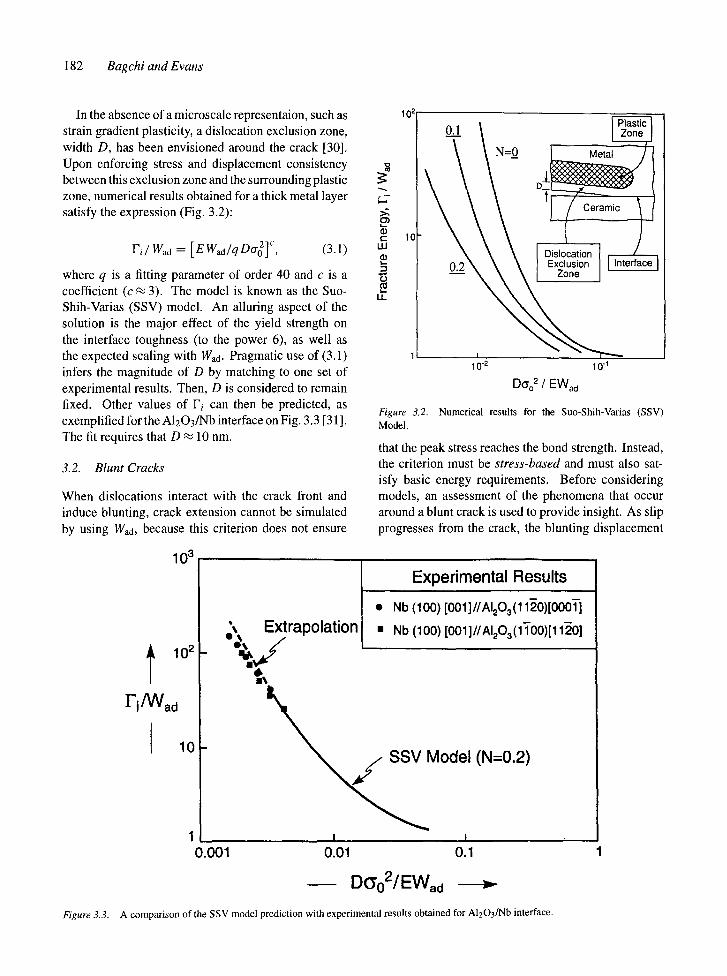
In the absence of a microscale representaion, such as strain gradient plasticity, a dislocation exclusion zone, width D, has been envisioned around the crack [30]. Upon enforcing stress and displacement consistency between this exclusion zone and the surrounding plastic zone, numerical results obtained for a thick metal layer satisfy the expression (Fig. 3.2):
Fi/Wad = [EWajqDcr2] c, (3.1)
where q is a fitting parameter of order 40 and c is a coefficient (c ~, 3). The model is known as the Suo- Shih-Varias (SSV) model. An alluring aspect of the solution is the major effect of the yield strength on the interface toughness (to the power 6), as well as the expected scaling with Wad. Pragmatic use of (3.1) infers the magnitude of D by matching to one set of experimental results. Then, D is considered to remain fixed. Other values of F i can then be predicted, as exemplified for the AI203/Nb interface on Fig. 3.3 [31]. The fit requires that D ,-~ 10 nm.
3.2. Blunt Cracks
When dislocations interact with the crack front and induce blunting, crack extension cannot be simulated by using Wad, because this criterion does not ensure
10"
"6
2
o.__, N_-o
Dislocation Exclusion I Interface
Zone I - -
10-2 10-1
0002 EWad
Figure 3.2. Numerical results for the Suo-Shih-Varias (SSV) Mode].
that the peak stress reaches the bond strength. Instead, the criterion must be stress-based and must also sat- isfy basic energy requirements. Before considering models, an assessment of the phenomena that occur around a blunt crack is used to provide insight. As slip progresses from the crack, the blunting displacement
103
l 10 2
I"i/VVad
I lo
Extrapolation
Experimental Results
�9 Nb (100)[001]//AI2Oa(1120)[000T]
�9 Nb (100)[001]//AI203(11"00)[1120]
~ + j SSV Model (N=0.2)
1. t 1 0.001 0.01 o. 1 1
D(3'02/EWad - ~
Figure 3.3. A comparison of the SSV model prediction with experimental results obtained for A1203/Nb interface.
The Mechanics and Physics of Thin Film Decohesion and its Measurement 183
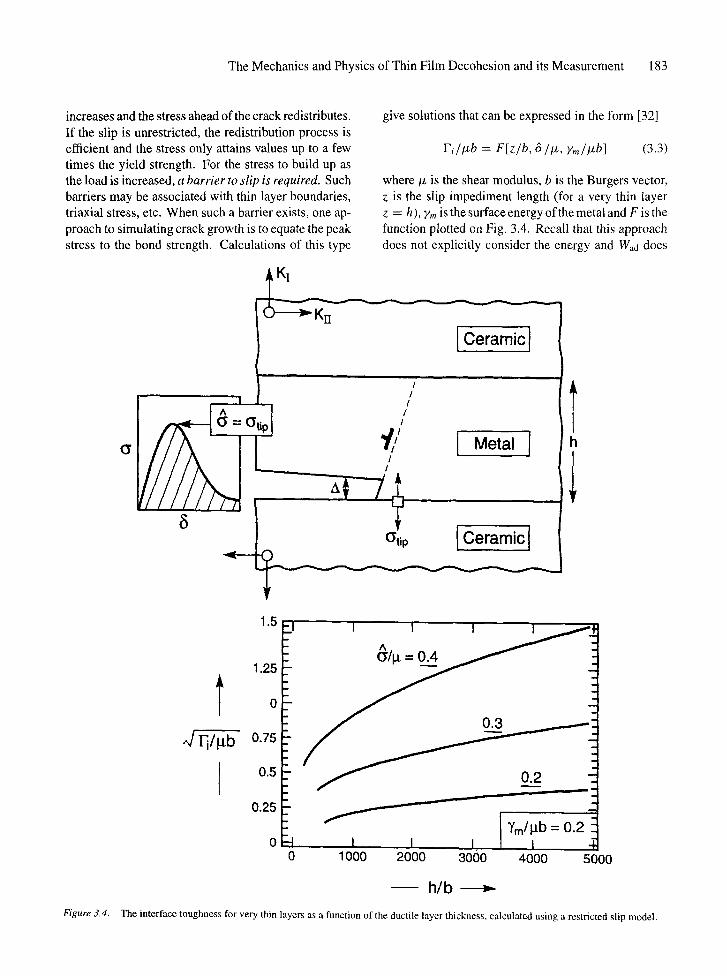
increases and the stress ahead of the crack redistributes. If the slip is unrestricted, the redistribution process is efficient and the stress only attains values up to a few times the yield strength. For the stress to build up as the load is increased, a barrier to slip is required. Such barriers may be associated with thin layer boundaries, triaxial stress, etc. When such a barrier exists, one ap- proach to simulating crack growth is to equate the peak stress to the bond strength. Calculations of this type
give solutions that can be expressed in the form [32]
r~/izb = F[z/b, ~ /~ , y.,/lzb] (3.3)
where/z is the shear modulus, b is the Burgers vector, z is the slip impediment length (for a very thin layer z = h), Ym is the surface energy ofthemetal and F is the function plotted o~ Fig. 3.4. Recall that this approach does not explicitly consider the energy and Waa does
KI
)---~ Krr [Cera,',',icl
/ /
,, 1 / ~ ~~J ~// I Metal I
. 7 1
h
1.5 i I ,, I j
o.ik 0,2 _ 0.2 ~ 0 2-
I I IYm/~ b II
0 1000 2000 3000 4000 5000
hlb
Figure 3.4. The interface toughness for very thin layers as a function of the ductile layer thickness, calculated using a restricted slip model.
184 Bagchi and Evans
not appear in the solution. But, it is implicit that the energy available to the crack appreciably exceeds that needed to break the bonds.
This approach is conceptually appealing, but has the limitation that 1-'i becomes unacceptably large for expected values of the relative bond strength, ~//z, unless the layers are very thin (i.e., few nanometers).
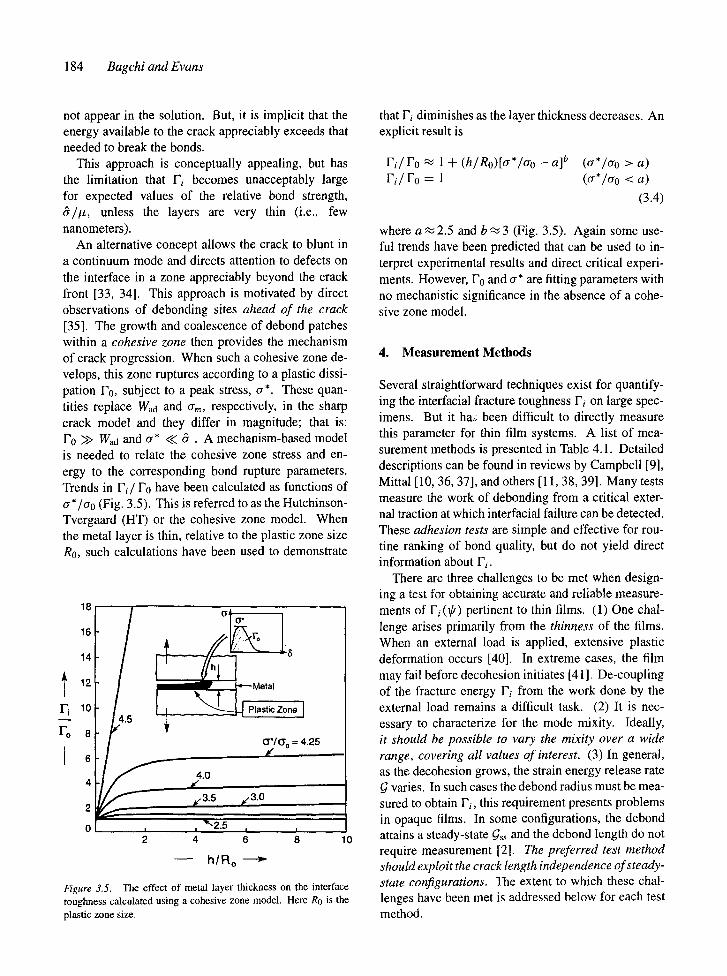
An alternative concept allows the crack to blunt in a continuum mode and directs attention to defects on the interface in a zone appreciably beyond the crack front [33, 34]. This approach is motivated by direct observations of debonding sites ahead of the crack [35]. The growth and coalescence of debond patches within a cohesive zone then provides the mechanism of crack progression. When such a cohesive zone de- velops, this zone ruptures according to a plastic dissi- pation I'0, subject to a peak stress, cr*. These quan- tities replace Wad and or, n, respectively, in the sharp crack model and they differ in magnitude; that is: F0 >> Wad and ~r* << 6 . A mechanism-based model is needed to relate the cohesive zone stress and en- ergy to the corresponding bond rupture parameters. Trends in l-'i/F0 have been calculated as functions of ~r*/% (Fig. 3.5). This is referred to as the Hutchinson- Tvergaard (HT) or the cohesive zone model, When the metal layer is thin, relative to the plastic zone size R0, such calculations have been used to demonstrate
Fi
ro
I
18
16
14
12
10
8
6
4
2
0
Zone I
0*/(30 = 4.25 g
4.0
3.5 3.0
'~2.5 2 4 6 8 10
- - h/Ro
Figure 3.5. The effect of metal layer thickness on the interface toughness calculated using a cohesive zone model. Here R0 is the plastic zone size.
t h a t l-'i diminishes as the layer thickness decreases. An explicit result is
Fi/F0 ~ 1 + (h/Ro)[a*/% - a] b
F i / F 0 = 1
(tr*/ao > a) (cr*/% < a)
(3.4)
where a ~ 2.5 and b ~ 3 (Fig. 3.5). Again some use- ful trends have been predicted that can be used to in- terpret experimental results and direct critical experi- ments. However, F0 and cr* are fitting parameters with no mechanistic significance in the absence of a cohe- sive zone model.
4. Measurement Methods
Several straightforward techniques exist for quantify- ing the interfacial fracture toughness I" i o n large spec- imens. But it haz been difficult to directly measure this parameter for thin film systems. A list of mea- surement methods is presented in Table 4. I. Detailed descriptions can be found in reviews by Campbell [9], Mittal [10, 36, 37], and others [11, 38, 39]. Many tests measure the work of debonding from a critical exter- nal traction at which interfacial failure can be detected. These adhesion tests are simple and effective for rou- tine ranking of bond quality, but do not yield direct information about F i.
There are three challenges to be met when design- ing a test for obtaining accurate and reliable measure- ments of Fi(~) pertinent to thin films. (1) One chal- lenge arises primarily from the thinness of the films. When an external load is applied, extensive plastic deformation occurs [40]. In extreme cases, the film may fail before decohesion initiates [41]. De-coupling of the fracture energy I~i from the work done by the external load remains a difficult task. (2) It is nec- essary to characterize for the mode mixity. Ideally, it should be possible to vary the mixity over a wide range, covering all values of interest. (3) In general, as the decohesion grows, the strain energy release rate G varies. In such cases the debond radius must be mea- sured to obtain I ' i , this requirement presents problems in opaque films. In some configurations, the debond attains a steady-state Gss and the debond length do not require measurement [2]. The preferred test method should exploit the crack length independence of steady- state configurations. The extent to which these chal- lenges have been met is addressed below for each test method.

The Mechanics and Physics of Thin Film Decohesion and its Measurement 185
Table 4.1. Adhesion tests.
Test Method Comments References
Microscratch A stylus load is drawn across Advantage: Simple and inexpensive; can be applied the film under gradually to thin, strongly adhering ceramic and metallic increasing until spallation films [42-45] occurs Disadvantage: Critical load at failure is influenced by
many extrinsic parameters, restricting quantification
Advantage: I" i can be measured with high fidelity over a range of ~p.
Disadvantage: Requires ductile substrates [60]
Multistrain
Peel
Strips are patterned onto the side face of a flexure beam. Bending introduces a range of strains.
A strip of film is peeled at fix- ed angle to the substrate
Blister A fluid is injected at a constant rate to the interface between the substrate and a overlayer film to create a blister
Superlayer A metal superlayer is deposited which induces debonding by residual strain
Advantage: In the absence of plastic deformation, the steady-state peel force is a direct measure it Fi [46-51]
Disadvantage: Plastic dissipation becomes predominant with decreasing film thickness, preventing application to thin films
Advantage: A sensitive test that can yield high fidelity r i data [52-57]
Disadwmtage: Sample preparation is tedious and appli- cations are limited to compliant films that do not yield
Advantage: Fi can be measured with high-fidelity over a range of ap
Disadvantage: Sample preparation is tedious [26, 59]
4.1. Microscratch Tests
The Microscratch test has been applied to a wide assort- ment of metallic and ceramic films [42]. Its primary advantage includes quickness, reproducibility and ease in implementation. However, the critical load is influ- enced by many factors. Deconvolution to evaluate I'i and ~ from the load is impeded by the complex nature of the deformation fields, which arise through interac- tions between the film and the probing indenter. The models developed to estimate Fi have been approxi- mate [43--45]. They use a point contact to approximate film stresses around the indenter using the elastic field. The elastic strain energy contained in the film above the delamination is obtained from the stress. This energy is considered to be available for interface decohesion, plus a contribution from the substrate assumed to be equal to that from the film. Residual stresses present in the film are difficult to take into account because the sign of the stress relative to that from the point force varies spatially around the scratch. Practical imple- mentation requires measurement of the delamination geometry from scanning electron microscopy observa- tions of the scratch track.
4.2. Peel Tests
Peel tests have been applied primarily to flexible thick films (typical thicknesses ~10 /zm to 1 mm). It was
originally developed by the aerospace industry as a quality control measure for laminated structural com- ponents [46]. More recently, the test has been em- braced by the electronics industry to assess the adhe- sion of metallic and polymeric thick films, deposited on various dielectric substrates [47, 48]. The test has the attribute that the peeling force is measured in steady- state, when the shape of the strip remains invariant. This force is used as an interfacial quality measure.
A detailed analysis of the test has been devel- oped [49-51]. The principal result may be expressed through the parameter,
)7' = 6EP/%2h, (4.1)
where P denotes the applied force per unit width of the strip and ao is the yield strength of the film. When q' < 1, the film deforms elastically and the peel force P becomes a direct measure o f the interfacialfracture resistance Fi :
Pi = P. (4.2)
However, elastic behavior is atypical. The minimum film thickness h* for elastic peeling, obtained from Eq. (4.1) by equating 0' to unity, is
h* = 6EFi /a~ (4.3)
186 Bagchi and Evans
1.0
O.B [ 0.6
P I 0.4
0.2
, i , I , i , , I , t , f I , i , , I I l 5 10 15 20
I ! 25
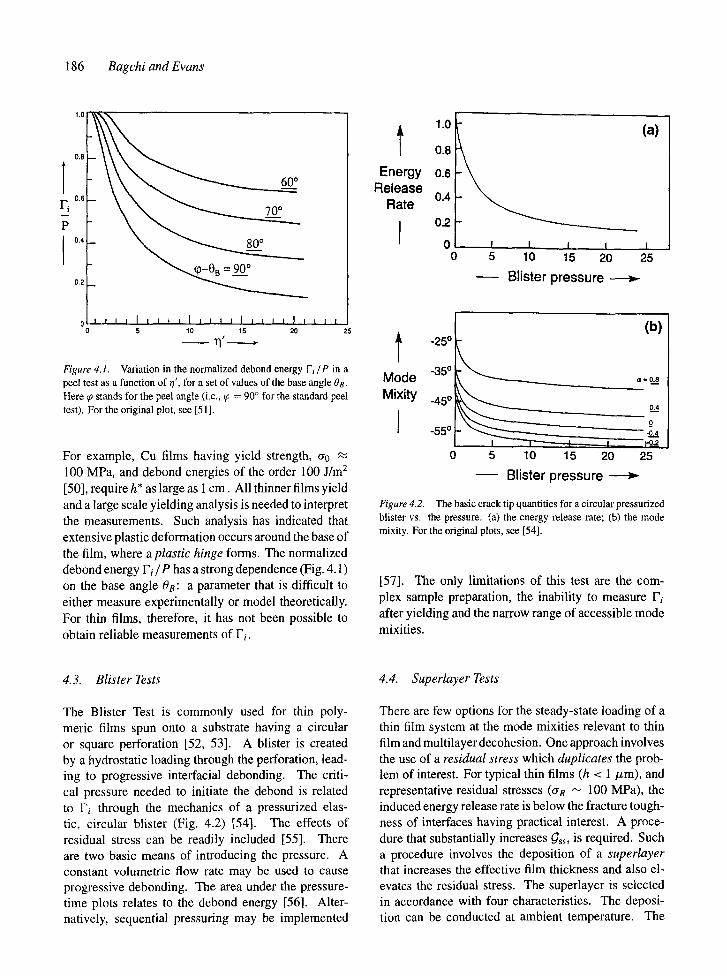
Figure 4.1. Variation in the normalized debond energy Fi/P in a peel test as a function of r/', for a set of values of the base angle 08. Here ~p stands for the peel angle (i.e., ~0 = 90 ~ for the standard peel test), For the original plot, see [51].
For example, Cu films having yield strength, cr 0 100 MPa, and debond energies of the order 100 J/m 2 [50], require h* as large as 1 cm. All thinner films yield and a large scale yielding analysis is needed to interpret the measurements. Such analysis has indicated that extensive plastic deformation occurs around the base of the film, where aplastic hinge forms. The normalized debond energy F i /P has a strong dependence (Fig. 4.1) on the base angle 08: a parameter that is difficult to either measure experimentally or model theoretically. For thin films, therefore, it has not been possible to obtain reliable measurements of Fi.
Energy Release
Rate
1.0
0.8
0.6
0.4
0.2
0 0
(a)
I I I I 5 10 15 20
Blister pressure
I 25
l .25o
Mode -35~ i
Mixity _45 ~
I .55o
0
(b)
_o -o...~4
' I i-o.2
5 10 15 20 25
- - Blister pressure
Figure 4.2. The basic crack tip quantities for a circular pressurized blister vs, the pressure: (a) the energy release rate; (b) the mode mixity. For the original plots, see [54].
[57]. The only limitations of this test are the com- plex sample preparation, the inability to measure Fi after yielding and the narrow range of accessible mode mixities.
4.3. Blister Tests
The Blister Test is commonly used for thin poly- meric films spun onto a substrate having a circular or square perforation [52, 53]. A blister is created by a hydrostatic loading through the perforation, lead- ing to progressive interfacial debonding. The criti- cal pressure needed to initiate the debond is related tO F i through the mechanics of a pressurized elas- tic, circular blister (Fig. 4.2) [54]. The effects of residual stress can be readily included [55]. There are two basic means of introducing the pressure. A constant volumetric flow rate may be used to cause progressive debonding. The area under the pressure- time plots relates to the debond energy [56]. Alter- natively, sequential pressuring may be implemented
4.4. Superlayer Tests
There are few options for the steady-state loading of a thin film system at the mode mixities relevant to thin film and multilayer decohesion. One approach involves the use of a residual stress which duplicates the prob- lem of interest. For typical thin films (h < 1/zm), and representative residual stresses ((rR ~ 100 MPa), the induced energy release rate is below the fracture tough- ness of interfaces having practical interest. A proce- dure that substantially increases Gss, is required. Such a procedure involves the deposition of a superlayer that increases the effective film thickness and also el- evates the residual stress. The superlayer is selected in accordance with four characteristics. The deposi- tion can be conducted at ambient temperature. The
The Mechanics and Physics of Thin Film Decohesion and its Measurement 187
Release Layer Deposition
Metal Layer & Supedayer
Bi-Layer Cut c~
Case I: without superlayer h superlayer
qss < re qss > r I
Figure 4.3. Micromachining steps for the superlayer test specimen.
layer should not react with the existing film. It should have good adhesion and be subject to a large resid- ual tension upon deposition. Cr or Ni films, deposited by electron beam evaporation, meet all four criteria [58].
The implementation of this test requires several key micromachining steps (Fig. 4.3) achieved by using con- ventional photolithography. (i) A thin strip of either C or Au is first used to create a decohesion precrack having length several times the film thickness. This release layer is thermally evaporated and patterned by using a bilayer photolithography technique. In more recent studies, it has been found that this release layer is not essential. Usually, a film through cut in- troduced by etching (step iii) suffices as a precrack site. (ii) The metal film is deposited and thereafter, the superstructure is electron beam evaporated. An in situ quartz monitor is used to control the deposition rate and the film thickness. Subsequent lift-off de- fines the metal line geometry. The film is patterned to form narrow strips. (iii) A through cut is made in
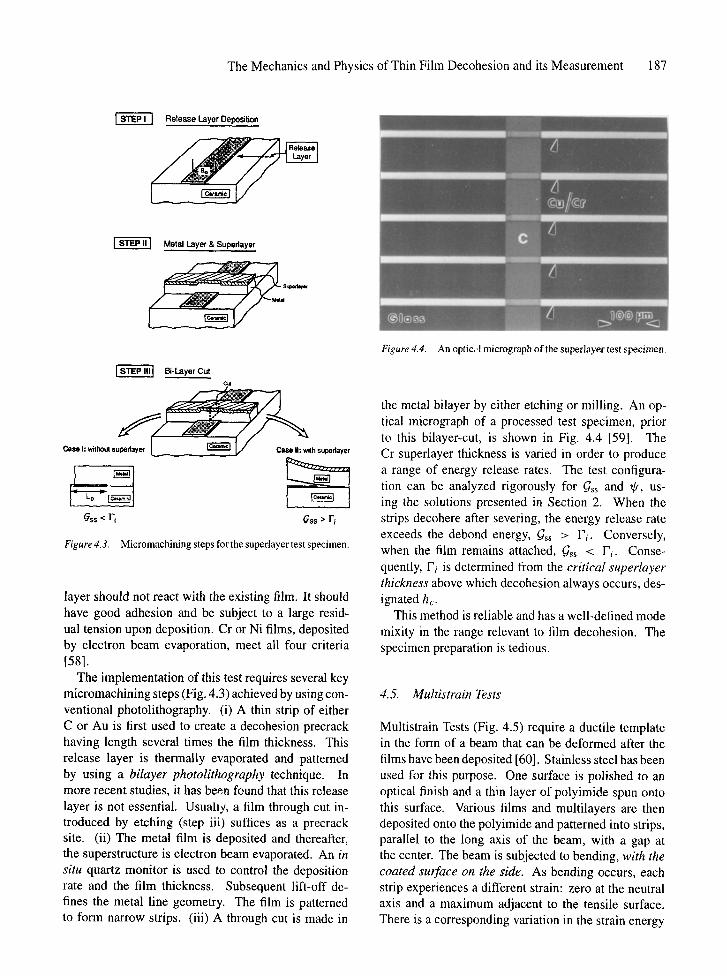
Figure 4.4. An optic,,! micrograph of the superlayer test specimen.
the metal bilayer by either etching or milling. An op- tical micrograph of a processed test specimen, prior to this bilayer-cut, is shown in Fig. 4.4 [59]. The Cr superlayer thickness is varied in order to produce a range of energy release rates. The test configura- tion can be analyzed rigorously for Gss and ~, us- ing the solutions presented in Section 2. When the strips decohere after severing, the energy release rate exceeds the debond energy, Gss > Fi. Conversely, when the film remains attached, Gss < Fi . Conse- quently, Fi is determined from the critical superlayer thickness above which decohesion always occurs, des- ignated ho
This method is reliable and has a well-defined mode mixity in the range relevant to film decohesion. The specimen preparation is tedious.
4.5. Multistrain Tests
Multistrain Tests (Fig. 4.5) require a ductile template in the form of a beam that can be deformed after the films have been deposited [60]. Stainless steel has been used for this purpose. One surface is polished to an optical finish and a thin layer of polyimide spun onto this surface. Various films and multilayers are then deposited onto the polyimide and patterned into strips, parallel to the long axis of the beam, with a gap at the center. The beam is subjected to bending, with the coated surface on the side. As bending occurs, each strip experiences a different strain: zero at the neutral axis and a maximum adjacent to the tensile surface. There is a corresponding variation in the strain energy
188 Bagchi and Evans
' , , ~ - - ~ r - ~ ~ Metal
- = - " - -~ern iconductor "~ - = ~ I ~ Oxide :
-Z
Figure 4.5. A schematic describing the multistrain test structure.
70
6O
E so
u 7
�9 12
u. 6
4
2
0
ral 0 0 IAI2031Au _ 0 0 0 0 0 0 g 0 @@ 0 0 0
o . �9
I l I + I ' ' I I I I I I I I I I I I I I ' I
4 5 6 7 Crack Extension, ,Sa (ram)
release rate at interface cracks that originate at the gaps along each strip.
The obvious advantage of the test is the ability to obtain a wide range of energy release rates on a sin- gle specimen. Upon testing, those strips located near the tensile surface decohere, but the others remain at- tached, enabling a critical strain at which decohesion occurs to be identified, designated Sc. Then, if the film behaves elastically and its Young's modulus is known, the steady-state energy release rate can be obtained using the results from Section 2. The critical energy release rate is equated to F i.
When the film yields before it decoheres, the method only provides approximate estimates of the debond energy. However, it is possible to combine this test with the Superlayer test, by depositing a superlayer before conducting the bending. This hybrid method has the advantage that ec is reduced and facilitates decohesion at strains below the yield strain. An im- portant limitation of this test is that it cannot be used with brittle substrates that crack before decohesion commences.
5 . E x p e r i m e n t a l R e s u l t s
5.1. High-Temperature Bonds
The decohesion energy between metal and non-metal interfaces depends upon a variety of factors. One particularly important factor is the temperature expe- rienced by the interface relative to the melting tem- perature of the constituents. Interfaces made at high relative temperature T~ Tm (where Tm is the melting temperature) typically differ in their decohesion prop- erties from those made at low temperature. Some
70
60
so
40
30 �84
20
_ b~ ' ' ' ' ' ' ' i ' JAI20#Ni]
I
I
" t L 1
- |ee o ~ . I "
t" ,...,, .'.."..'i +';+'%�9 " " �9 " ' ~ " . % . . I : t
I " i I , I , 1 +l I , 0 2 4 6 8 10
Crack Extension, Aa (ram)
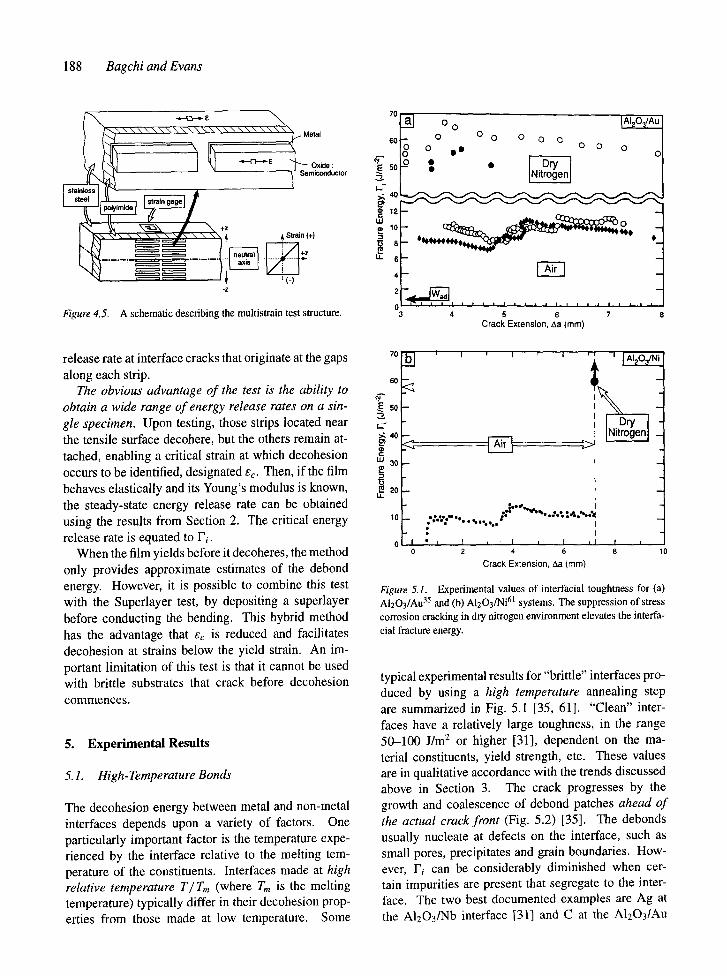
Figure 5.1. Experimental values of interracial toughtness for (a) Al2Oa/Au 35 and (b) A12Oa/Ni 61 systems. The suppression of stress corrosion cracking in dry nitrogen environment elevates the interfa- cial fracture energy.
typical experimental results for "brittle" interfaces pro- duced by using a high temperature annealing step are summarized in Fig. 5.1 [35, 61]. "Clean" inter- faces have a relatively large toughness, in the range 50-100 J/m 2 or higher [31], dependent on the ma- terial constituents, yield strength, etc. These values are in qualitative accordance with the trends discussed above in Section 3. The crack progresses by the growth and coalescence of debond patches ahead of the actual crack front (Fig. 5.2) [35]. The debonds usually nucleate at defects on the interface, such as small pores, precipitates and grain boundaries. How- ever, 1-' i c a n be considerably diminished when cer- tain impurities are present that segregate to the inter- face. The two best documented examples are Ag at the AI203/Nb interface [31] and C at the A1203/Au

The Mechanics and Physics of Thin Film Decohesion and its Measurement 189
Figure 5.2. Optical micrographs illustrating the progressive debonding at the A1203/Au interface, by coalescence of debond patches ahead of the crack front, under dry nitrogen ambient,
interface [62]. The general trends appear to be in ac- cordance with the SSV model (Fig. 3.2). In particu- lar, the major effect on r i of a small change in Wad is explicable. This happens because the toughening ratio is in the range where there is a substantial lever- aging effect of the tip toughness on the plastic zone size.
5.2. Low Temperature Bonds
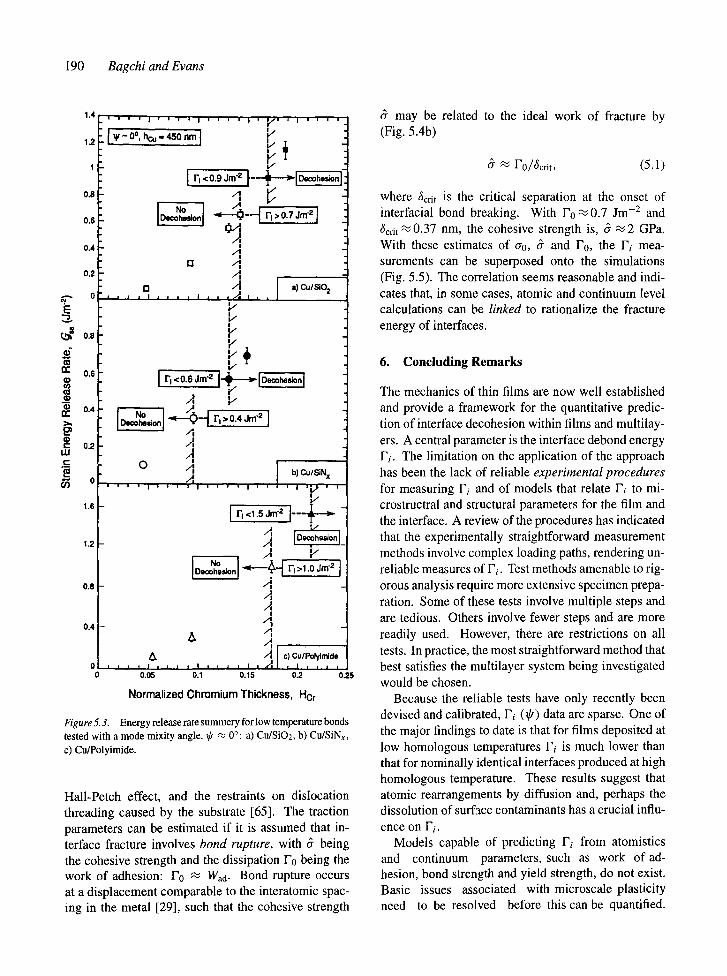
There have been few reliable measurements of r i made on interfaces formed at low temperature. All of the re- sults obtained for Cu (Fig. 5.3), either as a thin film deposited onto dielectric/semiconductor substrates or as a substrate layer in contact with a polymer film. There are two substantial differences from the behav- ior found for bonds formed at elevated temperature. (1) The r i are quite small and of the same order as Wad. (2) There is a large elevation of F i caused by a thin interlayer (5 nm) of either Cr or Ti. These re- sults can be qualitatively interpreted as follows. A
negligibly small plastic dissipation, consistent with l"i :=~ Wad, arise because of the high yield strength of the thin film [63]. That is, thin films require high 6" to promote plastic dissipation. Hence, adhesion promoters (Cr or Ti), which increase 6-, results in h igher r i .
These trends may be further rationalized by com- bining the present results with others [64] and relating to simulations of crack extension along metal/ceramic interfaces [33, 34]. These simulations relate r i to the yield strength of the metal, Cro, and two other pa- rameters that represent the traction separation law for interface rupture. These parameters are the cohesive strength of the interface, 6-, and the ideal work offrac- ture, F0, as sketched on Fig. 5.4.
An estimate of these parameters is needed in or- der to relate the present measurements to the simu- lations. First, the yield strengths of Cu have been measured as a function of layer thickness (Fig. 5.5) [63]. The increase in cr 0 with decrease in thick- ness reflects the diminished grain size, through the
190 Bagchi and Evans
1.4
1,2
1
O.B
0.6
0.4
0.2
A 0
E
~ 0.8
d
I X 0.6 1/) r
'~ 0.4 n"
t-- 0.2 t,U .~_
~ o
1.6
1.2
0.8
0.4
' = ' r = I ' = = = I = = ' , | i ~ / ' = = I ' = = =
4
!
d
d [] .4, I alC~l~o t
* | i i I 1 i | i I i i 1 ~ I i I I
k k"
I/
2, p
d A
o d
b) CulSiN x
i i | ' I i i = i I ' ' ' i I ' ' t I l i ~ i i
V
I F'<l"5jm2 1 - "~ ' -~
A k
d A A
I
"I,
,'I, , ,*
J J = ~ I I I I I , , ~ i I = X~= | I I I I I
0.05 0.1 0.15 0.2 0.25
Normalized Chromium Thickness, Her
Figure 5. 3. Energy release rate summery for low temperature bonds tested with a mode mixity angle, ~9 ~ 0~ a) Cu/SiO2, b) Cu/SiNx, c) Cu/Polyimide.
Hall-Petch effect, and the restraints on dislocation threading caused by the substrate [65]. The traction parameters can be estimated if it is assumed that in- terface fracture involves bond rupture, with ~ being the cohesive strength and the dissipation F0 being the work of adhesion: F0 ~ Wad. Bond rupture occurs at a displacement comparable to the interatomic spac- ing in the metal [29], such that the cohesive strength
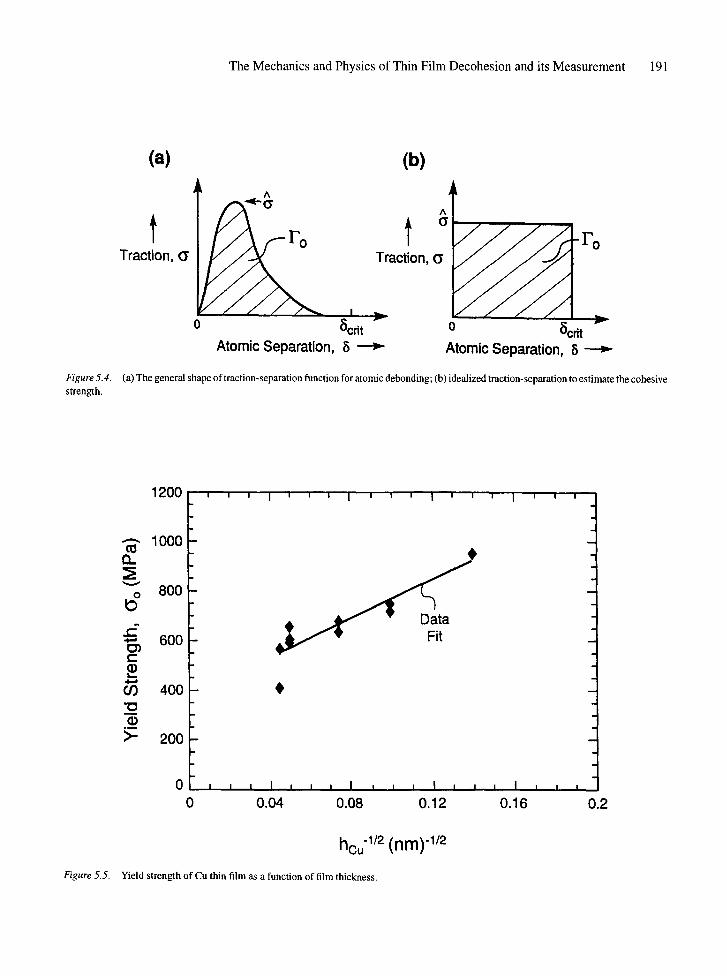
may be related to the ideal work of fracture by (Fig. 5.4b)
~ I"0/~crit, (5.1)
where 3crit is the critical separation at the onset of interfacial bond breaking. With 1% ~ 0.7 Jm -2 and 3crit ~0.37 nm, the cohesive strength is, ~ ~ 2 GPa. With these estimates of ~ro, ~ and 1-'0, the I'i mea- surements can be superposed onto the simulations (Fig. 5.5). The correlation seems reasonable and indi- cates that, in some cases, atomic and continuum level calculations can be linked to rationalize the fracture energy of interfaces.
6. Concluding Remarks
The mechanics of thin films are now well established and provide a framework for the quantitative predic- tion of interface decohesion within films and multilay- ers. A central parameter is the interface debond energy 1-" i . The limitation on the application of the approach has been the lack of reliable experimental procedures for measuring F'i and of models that relate I'i to mi- crostructral and structural parameters for the film and the interface. A review of the procedures has indicated that the experimentally straightforward measurement methods involve complex loading paths, rendering un- reliable measures of Fi. Test methods amenable to rig- orous analysis require more extensive specimen prepa- ration. Some of these tests involve multiple steps and are tedious. Others involve fewer steps and are more readily used. However, there are restrictions on all tests. In practice, the most straightforward method that best satisfies the multilayer system being investigated would be chosen.
Because the reliable tests have only recently been devised and calibrated, Y'i (1It) data are sparse. One of the major findings to date is that for films deposited at low homologous temperatures Fi is much lower than that for nominally identical interfaces produced at high homologous temperature. These results suggest that atomic rearrangements by diffusion and, perhaps the dissolution of surface contaminants has a crucial influ- ence on 1-'i.
Models capable of predicting ~i from atomistics and continuum parameters, such as work of ad- hesion, bond strength and yield strength, do not exist. Basic issues associated with microscale plasticity need to be resolved before this can be quantified.
The Mechanics and Physics of Thin Film Decohesion and its Measurement 191
(a)
Traction, G
(b)
A
Traction, (~
(~cdt 0 (~cdt Atomic Separation, 5 - - -~ Atomic Separation, ~
Figure 5.4. (a) The general shape of traction-separation function for atomic debonding; (b) idealized traction-separation to estimate the cohesive strength.
1200
--'- 1000 13.
o 800
.=- "~ 600
03 400 "10
>" 200
' ' ' I ' ' ' I ' ' ' I ' ' ' I ' ' '
Data
0 , I i I , , , I , , , I , , , I , , I
0 0.04 0.08 O. 12 O. 16 0.2
hcu "1/2 (nm) -lm
Figure 5.5. Yield strength of Cu thin film as a function of film thickness.

192 Bagchi and Evans
8
t ~ ['i/To 4'
0 0
�9 - - Simulations = , N = O . 2
�9 Exper iment I , "%"
N=0.1 1 /
" -%' z / /~ ,1' / , /
. . % ~ . - = / " " / }
I I I I I
1 2 3 4 5
~/~o - - ~
Figure 5.6. A schematic comparing the experimentally obtained fracture energy values for low temperature bonded Cu/SiO2 interface with simulations following the cohesive zone model.
In the interim, two models (SSV and HT) provide insights and facilitate interpretation of experimental work.
References
1. M.D. Drory, M.D. Thouless, and A.G. Evans, On the decohesion of residually stressed thin films, Acta Metall. Mater. 36, 2019- 28 (1988).
2. A.G. Evans, M.D. Drory, and M.S. Hu, The cracking and deco- hesion of thin films, J. Mater. Res. 3, 1043-49 (1988).
3. M.D. Thouless, Cracking and delamination of coatings, J. Vac. Sci. Tech. A9, 2510-15 (1991).
4. P.S. Ho, Chemistry and adhesion of metal/polymer interfaces, Appl. Surf. Sci. 41/42, 559-66 (1989).
5. W.R. La Fontaine, B. Yost, and C.Y. Li, Effect of residual stress and adhesion on the hardness of copper films deposited on sili- con, J. Mater. Res. 5, 776-83 (1990).
6. R.W. Hoffman, The mechanical properties of thin consolidated films, Phys. Thin Films 3, 211 (1966).
7. S. Suresh, A.G. Giannakopoulos, and M. Olsson, Elastoplas- tic analysis of thermal cycling: Layered materials with sharp interfaces, J. Mech. Phys. Solids 42, 979-1018 (1994).
8. Z. Suo, Cracking and debonding of microlaminates, J. Vac. Sci. Technol. A l l , 1367-72 (1993).
9. D.S. Campbell, Mechanical properties of thin films, in Handbook of Thin Film Technology, edited by L.I. Maissel and R. Glang (McGraw-Hill, New York, Chapter 12, 1970), pp. 12.3-12.50.
10. K.L. Mittal, Adhesion measurement of thin films, Electrocom. Sci. Technol. 3, 21-42 (1976).
11. P.A. Steinmann and H.I. Hintermann, A review ofthe mechanical tests for assessment of thin-film adhesion, J. Vac. Sci. Tech. A7, 2267-72 (1989).
12. J.-A. Schweitz, Mechanical characterization of thin films by micromechanical techniques, MRS Bulletin 17, 34-45 (1992).
13. A.G. Evans and J.W. Hutchinson, The thermomechanical in- tegrity of thin films and multilayers, Acta Metall. Mater. 43, 2507-30 (1995).
14. J.W. Hutchinson and Z. Suo, Mixed mode cracking in layered materials, Adv. Appl. Mech. 29, 63-191 (1992).
15. M.E Doerner and W.D. Nix, Stresses and deformation processes in thin films on substrates, CRC Crit. Rev. Solid States Mater. Sci. 14, 224-68 (1988).
16. J. Dundurs, Edge-bombed dissimilar orthogonal elastic wedges, J. Appl. Mech. 36, 650-52 (1969).
17. M.L. Williams, The stress around a fault or crack in a dissimilar media, Bull. Seismol. Soc. Am. 49, 199-204 (1959).
18. M.F. Kanninen and C.H. Popelar, Advanced Fracture Mechanics (Oxford University Press, New York, 1985), p. 145.
19. J.W. Hutchinson, M.E. Mear, and J.R. Rice, Crack paralleling an interface between dissimilar materials, J. Appl. Mech. 54, 828-32 (1987).
20. J.R. Rice, Elastic fracture concepts for interfacial cracks, J. Appl. Mech. 55, 98-103 (1988).
21. J.R. Rice, Z. Suo, and J.-S. Wang, Mechanics and thermo- dynamics of brittle interfacial failure in bimaterial system, in Metal- Ceramic In; e.rfaces, edited by M. Riihle, A.G. Evans, M.E Ashby, and J.P. Hirth (Pergamon Press, New York, 1990), pp. 269-94.
22. B.M. Malyshev and R.L. Salganik, The strength of adhesive joints using the theory of cracks, Int. J. Frac. Mech. 5, 114-28 (1965).
23. N.P. O'Dowd, C.E Shih, and M.G. Stout, Test geometries for measuring interfacial fracture toughness, Int. J. Solids Struct. 29, 471-89 (1992).
24. Z. Suo and J.W. Hutchinson, Interface crack between two elastic layers, Int. J. Frac. 43, 1-18 (1990).
25. S. Timoshenko, Analysis of bi-metal thermostats, J. Opt. Soc. Am. 11,233-55 (1925).
26. A. Bagchi and A.G. Evans, Measurements of the debond energy for thin metallization lines on dielectrics, submitted to Thin Solid Films.
27. O.L. Bower, Methods of Analysis and Solutions of Crack Prob- lems, edited by G.C. Sih (Hoordhoff, Holland, 1973).
28. A.G. Evans and B.J. Dalgleish, The fracture resistance of metal- ceramic interfaces, Acta Metall. Mater. 40 (Suppl.), $295-306 (1992).
29. J.R. Smith, H. Tao, and DJ. Srolovitz, Metal-ceramic adhesion and the Harris functional, Physi. Rev. Lett. 72, 4021-24 (I 994).
30. Z. Suo, C.E Shih, and A.G. Varias, A theory of cleavage cracking in the presence of plastic flow, Acta Metall. Mater. 41, 1551-57 (1993).
31. G. Elssner, D. Korn, and M. Rtthle, The influence of interface impurities on fracture energy of UHV diffusion bonded metal- ceramic bicrystals, Scripta Metall. Mater. 31, 1037-42 (1994).
32. K.J. Hsia, Z. Suo, and W. Yang, Cleavage due to dislocation confinement in layered materials, J. Mech. Phys. Solids 42, 877- 96 (1994).
33. V. Tvergaard and J.W. Hutchinson, The influence of plasticity on mixed mode interface toughness, J. Mech. Phys. Solids 41, 1119-35 (1993).
34. V. Tvergaard and J.W. Hutchinson, "Toughness of an interface along a thin ductile layer joining elastic solids, Phil. Mag. A70, 641-56 (1994).
35. M.R. Turner and A.G. Evans, Technical Report MECH-250, Division of Applied Sciences, Harvard University (1995).
36. K.L. Mittal, A critical appraisal of the methods for measur- ing adhesion of electrodeposited coatings, in Properties of
The Mechanics and Physics of Thin Film Decohesion and its Measurement 193
Electrodeposits, edited by R. Sard, H. Leidheiser, Jr., and F. Ogburn (The Electrochemical Society, New Jersey, Chapter 17, 1975), pp. 273-306.
37. K.L. Mittal, Adhesion measurement: Recent progress, unsolved problems, and prospects, in Adhesion Measurement ~f" Thin Films, Thick Films, and Bulk Coatings, ASTM STP 640, edited by K.L. Mittal (American Society for Testing and Materials, 1978), pp. 5-17.
38. J. Valli, A review of adhesion test methods for thin hard coatings, J. Vac. Sci. Tech. A4, 3007-14 (1986).
39. ER. Chalker, S.J. Bull, and D.S. Rickerby, A review of the meth- ods for the evaluation of coating-substrate adhesion, Mat, Sci. Eng. A140, 385-92 (1991).
40. K.-S. Kim and N. Aravas, Elastoplastic analysis of the peel test, Int. J. Solids Struct. 24, 417-35 (1988).
41. K.-S. Kim and J. Kim, Elasto-plastic analysis of the peel test for thin film adhesion, J. Eng. Mat. Tech. 110, 266-73 (1988).
42. T.W. Wu, Microscratch and load relaxation tests for ultrathin films, J. Mater. Res. 6, 407-26 (1991).
43. S.K. Venkatraman, D.L. Kohlstedt, and W.W. Gerberich, Mi- croscratch analysis of the work of adhesion for Pt thin films on NiO, J. Mater. Res. 7, 1126-32 (1992).
44. S.K. Venkatraman, D.L. Kohlstedt, and W.W. Gerberich, Metal-ceramic interfacial fracture resistance using the contin- uous microscratch technique, Thin Solid Films 223, 269-75 (1993).
45. S.K. Venkatraman, W.W. Gerberichm, and D.L. Kohlstedt, Ad- hesion in metal-ceramic systems, in Thin Fihns: Stresses and Mechanical Properties IV, edited by P.H. Townsend, T.P. Weihs, J.E. Sanchez, Jr., and P. B0rgesen (Materials Research Society Symposium Proceedings, Pittsburgh, 1993), Vol. 308, pp. 621- 26.
46. G.J. Spies, The peeling test on redux-bonded joints, J. Aircraft Engr. 25, 64-70 (1953).
47. W.T. Chen and T.F. Flavin, Mechanics of film adhesion: Elastic and elastic-plastic behavior, IBM J. Res. Develop. 116, 203-13 (1972).
48. S. Kim, The roleofplasticpackageadhesionin ICperformance, in 1991 Proceedings: 41 st Electronic Components and Technol- ogy Conference, IEEE, New York, 1991, pp. 750-58.
49. K.-S. Kim and N. Aravas, Elastoplastic analysis of the peel test, Int. J. Solids Struct. 24, 417-35 (1988).
50. K.-S. Kim, Mechanics of peel test for thin film adhesion, in Adhesion in Solids, edited by D.M. Mattox, J.E.E. Baglin,
R.J. Gottschall, and C.D. Batich (Materials Research So- ciety Symposium Proceedings, Pittsburgh, 1988), Vol. 119, pp. 31-41.
51." N. Aravas, K.-S. Kim, and M.J. Loukis, On the mechanics of adhesion testing of flexible films, Mat. Sci. Eng. A107, 159-68 (1989).
52. M.G. Allen and S.D. Senturia, Analysis of critical debonding pressures of stressed thin fihns in the blister test, J. Adhesion 25, 303-15 (1988).
53. M.G. Allen and S.D. Senturia, Application of the island blister test for thin film adhesion measurement, J. Adhesion 29, 219- 31 (1989).
54. H.M. Jensen, The blister test for interface toughness measure- ment, Engr. Frac. Mech. 40,475-86 (1991).
55. HM. Jensen and M.D. Thouless, Effect of residual stresses in the blister test, Int. J. Solids Struct. 30,779-95 (1993).
56. H.-S. Jeong and R.C. White, Variational principle of thin film adhesion, J. Vac. Sci. Tech. A l l , 1373-76 (1993).
57. Y.Z. Chu, H.-S. Jeong, R.C. White, and C.J. Durning, Charac- terization of adhesion in thin-film materials by the blister test, in Smart Materials l'abrication and Materials for Micro-Electro- Mechanical Systems, edited by A.E Jardine, G.C. Johnson, A. Crowson, and M. Allen (Materials Research Society Symposium Proceedings, Pittsburgh, 1992), Vol. 276, pp. 209-20.
58. A.G. Evans and M.S. Hu, The cracking and decohesion of thin films on ductile substrates, Acta Metall. Mater. 37, 917-25 (1989).
59. A. Bagchi, G.E. Lucas, Z. Suo, and A.G. Evans, A new procedure for measuring the decohesion energy of thin ductile films on substrates, J. Mater. Res. 9, 1734--41 (1994).
60. D.K. Leung, M.Y. He, and A.G. Evans, The cracking resistance of nanoscale layers and films, J. Mater. Res. 10, 1693-99 (1995).
61. J.S. Stolken, University of California, Santa Barbara (private communication).
62. D. Lipkin and D.R. Clarke, University of California, Santa Bar- bara (private communication).
63. A Bagchi' P h D Thesis' University ~ Calif~ Santa Barbara (1994).
64. R.M. Cannon, R.M. Fisher, and A.G. Evans, in Thin Films--lnterJaces and Phenomena, edited by R.J. Nemanich, P.S. Ho, and S.S. Lau (Materials Research Society Symposium Proceedings, 1986), Vol. 54, pp. 799-804.
65. W.D. Nix, Mechanical properties of thin films, Met. Trans. 20A, 2217-45 (1989).