the megacity state: the world’s biggest cities shaping our ... · megacity solutions megacities...
TRANSCRIPT
Allianz Risk Pulse
November 2015
The megacity state: The world’s biggest cities shaping our future
2
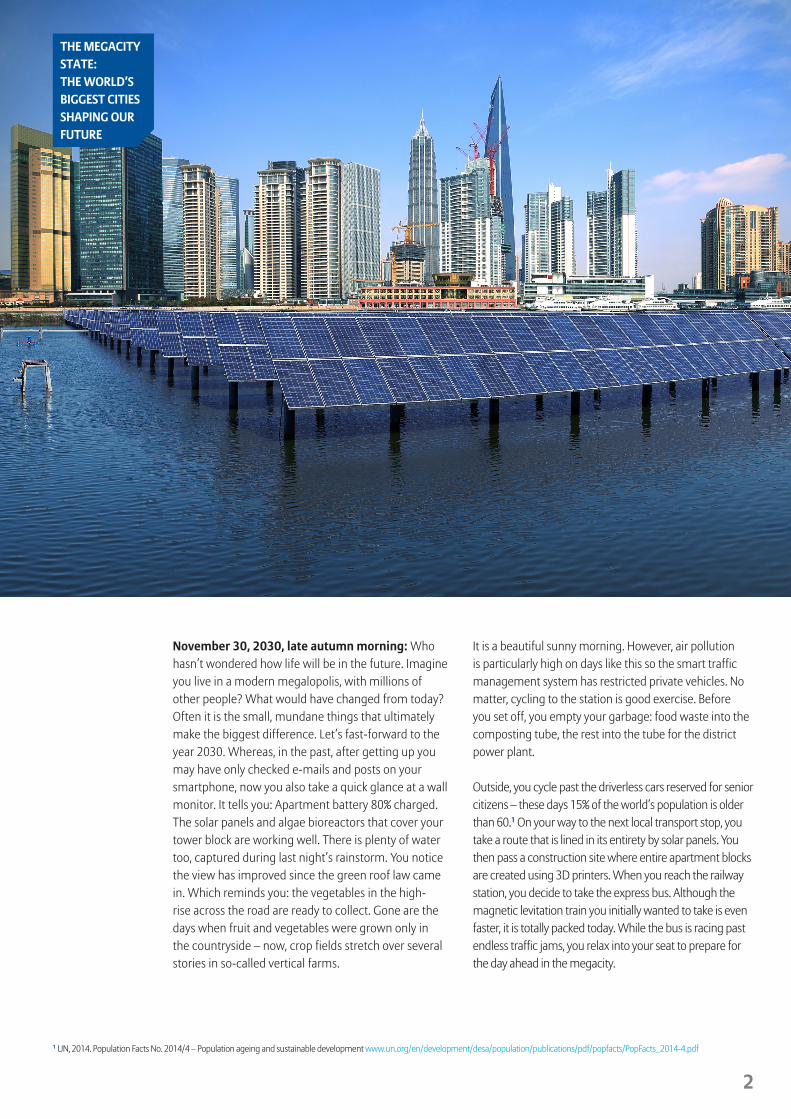
November 30, 2030, late autumn morning: Who hasn’t wondered how life will be in the future. Imagine you live in a modern megalopolis, with millions of other people? What would have changed from today? Often it is the small, mundane things that ultimately make the biggest difference. Let’s fast-forward to the year 2030. Whereas, in the past, after getting up you may have only checked e-mails and posts on your smartphone, now you also take a quick glance at a wall monitor. It tells you: Apartment battery 80% charged. The solar panels and algae bioreactors that cover your tower block are working well. There is plenty of water too, captured during last night’s rainstorm. You notice the view has improved since the green roof law came in. Which reminds you: the vegetables in the high-rise across the road are ready to collect. Gone are the days when fruit and vegetables were grown only in the countryside – now, crop fields stretch over several stories in so-called vertical farms.
1 UN, 2014. Population Facts No. 2014/4 – Population ageing and sustainable development www.un.org/en/development/desa/population/publications/pdf/popfacts/PopFacts_2014-4.pdf
THE MEGACITY STATE: THE WORLD’S BIGGEST CITIES SHAPING OUR FUTURE
It is a beautiful sunny morning. However, air pollution is particularly high on days like this so the smart traffic management system has restricted private vehicles. No matter, cycling to the station is good exercise. Before you set off, you empty your garbage: food waste into the composting tube, the rest into the tube for the district power plant.
Outside, you cycle past the driverless cars reserved for senior citizens – these days 15% of the world’s population is older than 60.1 On your way to the next local transport stop, you take a route that is lined in its entirety by solar panels. You then pass a construction site where entire apartment blocks are created using 3D printers. When you reach the railway station, you decide to take the express bus. Although the magnetic levitation train you initially wanted to take is even faster, it is totally packed today. While the bus is racing past endless traffic jams, you relax into your seat to prepare for the day ahead in the megacity.
3
THE MEGACITY STATE: THE WORLD’S BIGGEST CITIES SHAPING OUR FUTURE
From cities to megacities to gigacities
More than half of the world’s population already lives in cities today.2 And the urbanization trend continues: in 2030, it will be two-thirds. Most of these urban areas will be located in the developed countries of Northern America (82 % of total population), Latin America and the Caribbean (80 %) as well as Europe (73 %). While vast parts of Africa and Asia are still mostly rural, their cities are among the fastest growing in the world.
An increasing number of urban areas are exceeding 10 million inhabitants. We call them megacities. Urbanisation is progressing ever faster. A new category of urban agglomeration has emerged: gigacities. These would be supercities of more than 50 million inhabitants, an almost unimaginable number. And yet gigacities may soon become reality in China. The Chinese government is reportedly planning to connect multiple cities in five integrated urban conurbations which would together be
home to half a billion people by 2020.3 If these ambitious plans are realized, there will be four urban areas in China each with more inhabitants than the whole of Germany. Greater Shanghai could in theory contain more than 170 million inhabitants by 2020.
This extreme concentration of people is causing big challenges, particularly in the area of sustainable development.4 According to the UN, the world’s cities only cover 2 % of global land area, but they account for 70 % of greenhouse-gas emissions.5 How do we find the right balance between growth, quality of life and climate protection? What does a city of the future have to look like in order to make life worth living in it? There’s not a one-size-fits-all answer to it, but many smart ideas and approaches to the most pressing challenges in the field of demography and mobility. This ‘Allianz Risk Pulse’ is taking a closer look at them.
“The course of how we will live in the future is being set in these megalopolises. This is where tomorrow’s trends are emerging,” predicts Allianz SE Board Member Axel Theis. “The megalopolises show where urban development is headed – and how transport, energy, culture, and economies can be organized. Allianz will play a key role in urban development as we accompany our customers in the megacities. Their changing living conditions will create new needs which we as an insurer will have to be able to serve. With knowledge comes the responsibility to act, especially when it comes to managing risks such as natural catastrophes or climate change, and protecting and investing in critical infrastructure.”
Why megacities matter
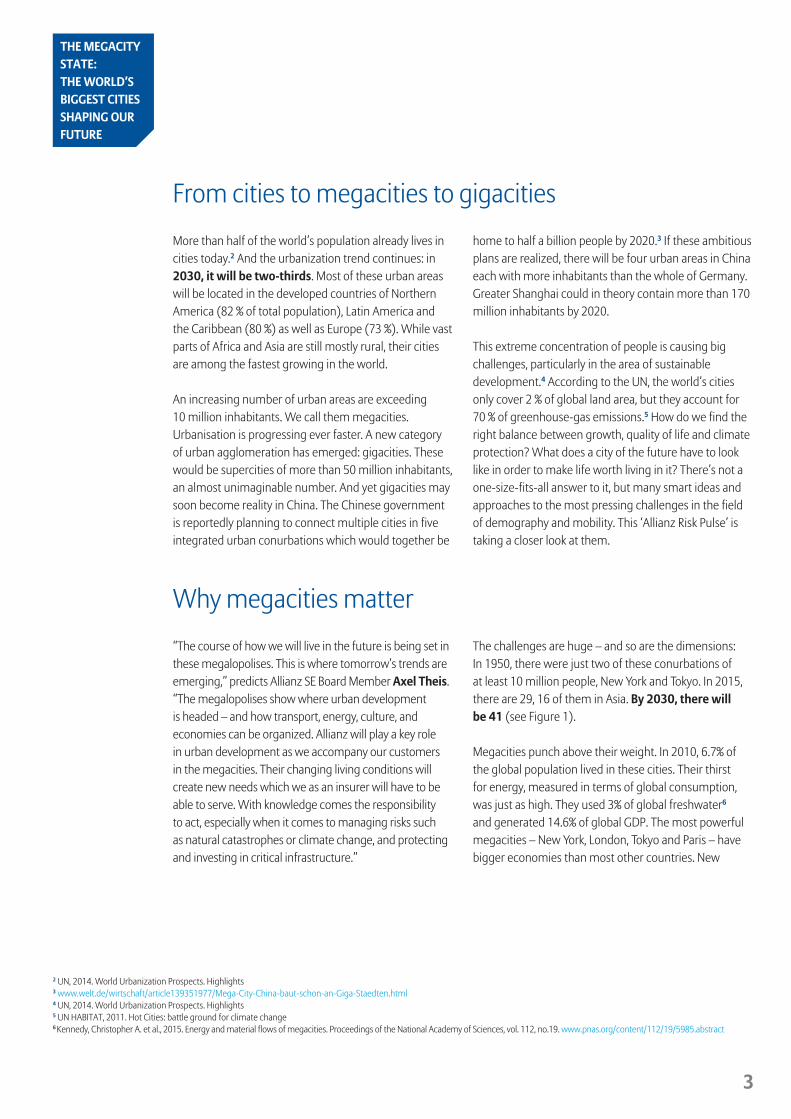
The challenges are huge – and so are the dimensions: In 1950, there were just two of these conurbations of at least 10 million people, New York and Tokyo. In 2015, there are 29, 16 of them in Asia. By 2030, there will be 41 (see Figure 1).
Megacities punch above their weight. In 2010, 6.7% of the global population lived in these cities. Their thirst for energy, measured in terms of global consumption, was just as high. They used 3% of global freshwater6 and generated 14.6% of global GDP. The most powerful megacities – New York, London, Tokyo and Paris – have bigger economies than most other countries. New
2 UN, 2014. World Urbanization Prospects. Highlights 3 www.welt.de/wirtschaft/article139351977/Mega-City-China-baut-schon-an-Giga-Staedten.html 4 UN, 2014. World Urbanization Prospects. Highlights 5 UN HABITAT, 2011. Hot Cities: battle ground for climate change6 Kennedy, Christopher A. et al., 2015. Energy and material flows of megacities. Proceedings of the National Academy of Sciences, vol. 112, no.19. www.pnas.org/content/112/19/5985.abstract
4
Current megacities
Mumbai, India21m 27.8m
2015 population
2030 populationJakarta, Indonesia
10.3m 13.8m
Kinshasa, Congo11.5m 20m
KEY
2015 population
2030 population
Figure 1 Selected current and future megacities 2015 to 2030
Source: World Urbanization Prospects: The 2014 Revision
London, UK10.3m 11.4m
Paris, France10.8m 11.8m
Lagos, Nigeria13.1m 24.2m
Moscow, Russia12.1m 12.2m
Tokyo, Japan38m 37.1m
Shanghai, China23.7m 30.7m
Beijing, China20.3m 27.7m
Sao Paulo, Brazil21m 23.4m
Cairo, Egypt18.7m 24.5m
Karachi, Pakistan16.6m 24.8m
Manila, Philippines12.9m 16.7m
Rio de Janeiro, Brazil12.9m 14.1m
Buenos Aires, Argentina15.1m 16.9m
Mexico City, Mexico21m 23.8m
Chongqing, China13.3m 17.3mDehli, India
25.7m 36mNew York, US18.5m 19.8mLos Angeles, US
12.3m 13.2m
Lahore, Pakistan8.7m 13m
Luanda, Angola5.5m 10.4m
Hyderabad, India8.9m 12.7m
Ahmedabad, India7.3m 10.5m
Ho Chi Minh City, Vietnam7.3m 10.2m
Bangkok, Thailand9.2m 11.5m
Bogotá, Colombia9.7m 11.9m
Johannesburg, South Africa9.7m 11.9m
Future megacities
Chengdu, China7.6m 10.1m
7 Citylab.com, 2015. Sorry, London: New York Is the World’s Most Economically Powerful City www.citylab.com/work/2015/03/sorry-london-new-york-is-the-worlds-most-economically-powerful-city/386315/8 OECD, 2015. The Metropolitan Century: Understanding Urbanisation and its Consequences www.oecd.org/regional/regional-policy/the-metropolitan-century-9789264228733-en.htm
THE MEGACITY STATE: THE WORLD’S BIGGEST CITIES SHAPING OUR FUTURE
York generates $1.4 trillion in total economic output, London $836 billion.7 According to the OECD, it is only a matter of time before the economic strength of numerous urban agglomerations is greater than that of most OECD countries.8 Megacities concentrate opportunities, talent and investment. A large portion of the estimated $100 trillion assets under management by 2020 is likely to be traded in the growth regions. “We expect further asset growth to particularly take place in Asia,” says Jay Ralph, Member of the Board of Management of Allianz SE. “By the end of 2014, 11% of our overall third party assets came from clients in this region. We already benefit from an increasing demand by a growing number of wealthy clients. Estimates by the OECD indicate that 1.75 billion people in Asia will be
defined as ‘middle-class’ by 2020, today it is 500 million. An increasing demand for retirement products will be another growth trigger as Asian societies are aging fast.”
Apart from the opportunities, megacities also concentrate risks. “Development of these cities will not only require huge investments in infrastructures,” notes Axel Theis. “The value concentration in megacities also results in accumulation risks which tend to be heavily interdependent, especially when you think of business interruption scenarios. This poses a major challenge for insurers, particularly in natural catastrophe-prone areas.” Most megacities are indeed low-lying coastal settlements vulnerable to extreme weather and climate change impacts (see Box Megacities exposed to flood risks, p.10).
5
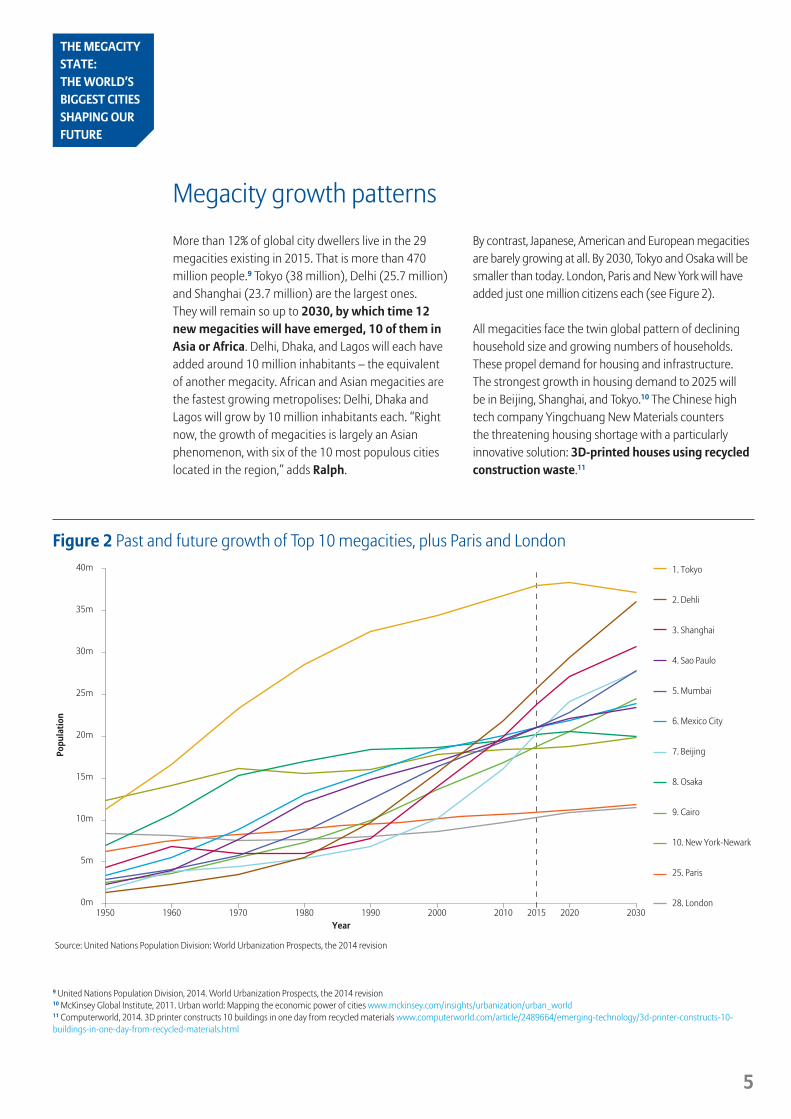
More than 12% of global city dwellers live in the 29 megacities existing in 2015. That is more than 470 million people.9 Tokyo (38 million), Delhi (25.7 million) and Shanghai (23.7 million) are the largest ones. They will remain so up to 2030, by which time 12 new megacities will have emerged, 10 of them in Asia or Africa. Delhi, Dhaka, and Lagos will each have added around 10 million inhabitants – the equivalent of another megacity. African and Asian megacities are the fastest growing metropolises: Delhi, Dhaka and Lagos will grow by 10 million inhabitants each. “Right now, the growth of megacities is largely an Asian phenomenon, with six of the 10 most populous cities located in the region,” adds Ralph.
Megacity growth patterns
Figure 2 Past and future growth of Top 10 megacities, plus Paris and London
Source: United Nations Population Division: World Urbanization Prospects, the 2014 revision
1. Tokyo
2. Dehli
3. Shanghai
4. Sao Paulo
5. Mumbai
6. Mexico City
7. Beijing
8. Osaka
9. Cairo
10. New York-Newark
25. Paris
28. London0m
5m
10m
15m
20m
Popu
lati
on
Year
25m
30m
35m
40m
1950 1960 1970 1980 1990 2000 2010 20202015 2030
By contrast, Japanese, American and European megacities are barely growing at all. By 2030, Tokyo and Osaka will be smaller than today. London, Paris and New York will have added just one million citizens each (see Figure 2).
All megacities face the twin global pattern of declining household size and growing numbers of households. These propel demand for housing and infrastructure. The strongest growth in housing demand to 2025 will be in Beijing, Shanghai, and Tokyo.10 The Chinese high tech company Yingchuang New Materials counters the threatening housing shortage with a particularly innovative solution: 3D-printed houses using recycled construction waste.11
9 United Nations Population Division, 2014. World Urbanization Prospects, the 2014 revision 10 McKinsey Global Institute, 2011. Urban world: Mapping the economic power of cities www.mckinsey.com/insights/urbanization/urban_world 11 Computerworld, 2014. 3D printer constructs 10 buildings in one day from recycled materials www.computerworld.com/article/2489664/emerging-technology/3d-printer-constructs-10-buildings-in-one-day-from-recycled-materials.html
THE MEGACITY STATE: THE WORLD’S BIGGEST CITIES SHAPING OUR FUTURE
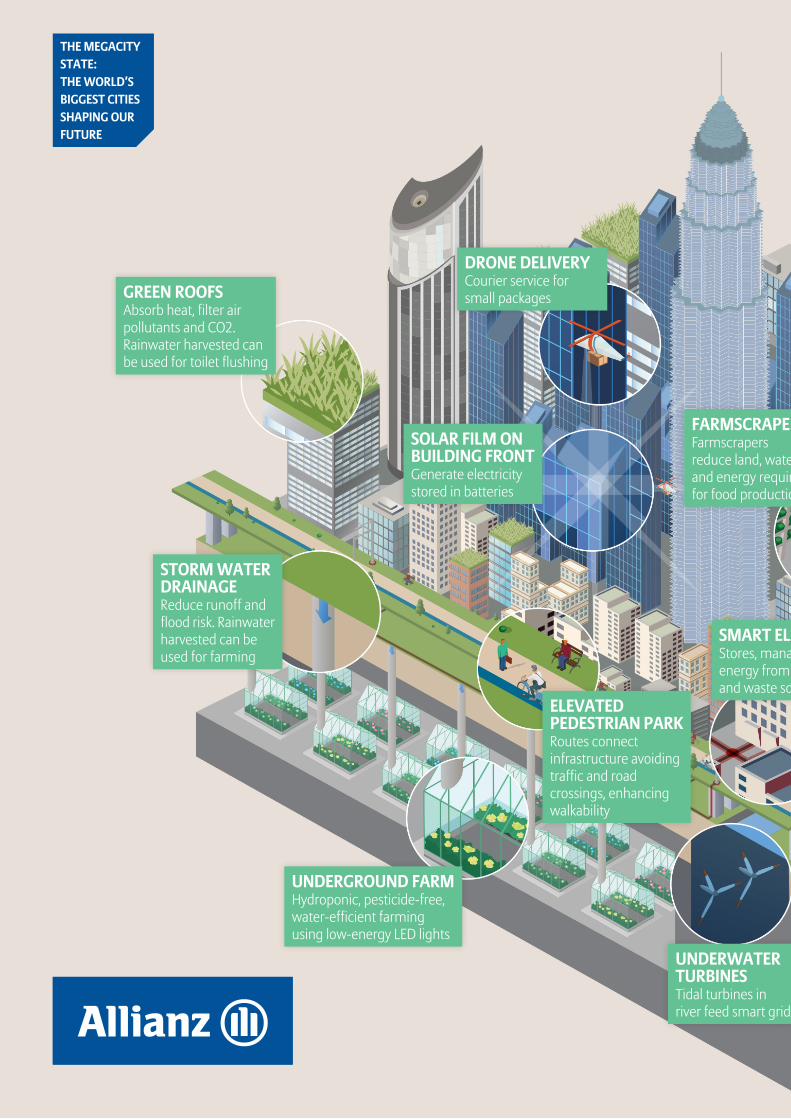
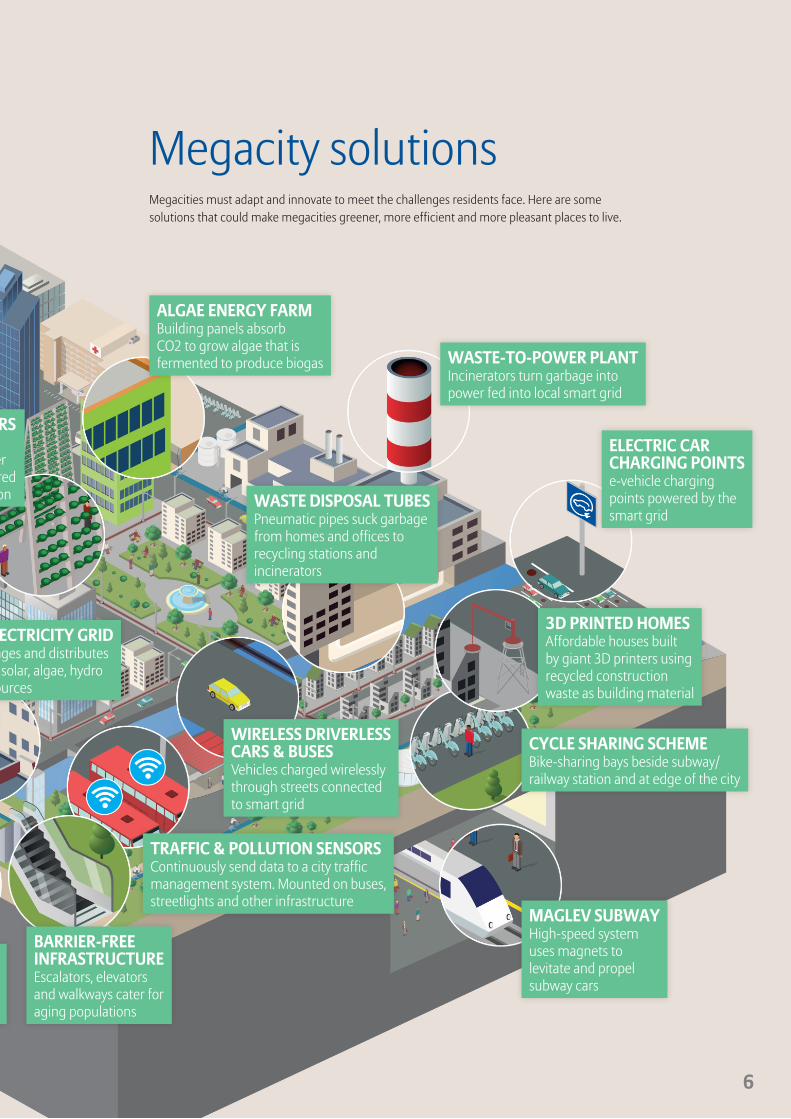
Megacity solutionsMegacities must adapt and innovate to meet the challenges residents face. Here are some solutions that could make megacities greener, more efficient and more pleasant places to live.
ALGAE ENERGY FARMBuilding panels absorb CO2 to grow algae that is fermented to produce biogas
FARMSCRAPERSFarmscrapers reduce land, water and energy required for food production
ELEVATED PEDESTRIAN PARKRoutes connect infrastructure avoiding traffic and road crossings, enhancing walkability
UNDERGROUND FARMHydroponic, pesticide-free, water-efficient farming using low-energy LED lights
STORM WATER DRAINAGEReduce runoff and flood risk. Rainwater harvested can be used for farming
GREEN ROOFSAbsorb heat, filter air pollutants and CO2. Rainwater harvested can be used for toilet flushing WASTE-TO-POWER PLANT
Incinerators turn garbage into power fed into local smart grid
WASTE DISPOSAL TUBESPneumatic pipes suck garbage from homes and offices to recycling stations andincinerators
SMART ELECTRICITY GRIDStores, manages and distributes energy from solar, algae, hydro and waste sources
SOLAR FILM ON BUILDING FRONTGenerate electricity stored in batteries
UNDERWATER TURBINESTidal turbines in river feed smart grid
ELECTRIC CAR CHARGING POINTSe-vehicle charging points powered by the smart grid
3D PRINTED HOMESAffordable houses built by giant 3D printers using recycled construction waste as building material
CYCLE SHARING SCHEMEBike-sharing bays beside subway/railway station and at edge of the city
MAGLEV SUBWAYHigh-speed system uses magnets to levitate and propel subway cars
WIRELESS DRIVERLESS CARS & BUSESVehicles charged wirelessly through streets connected to smart grid
DRONE DELIVERYCourier service for small packages
BARRIER-FREE INFRASTRUCTUREEscalators, elevators and walkways cater for aging populations
TRAFFIC & POLLUTION SENSORSContinuously send data to a city traffic management system. Mounted on buses, streetlights and other infrastructure
6
THE MEGACITY STATE: THE WORLD’S BIGGEST CITIES SHAPING OUR FUTURE
7
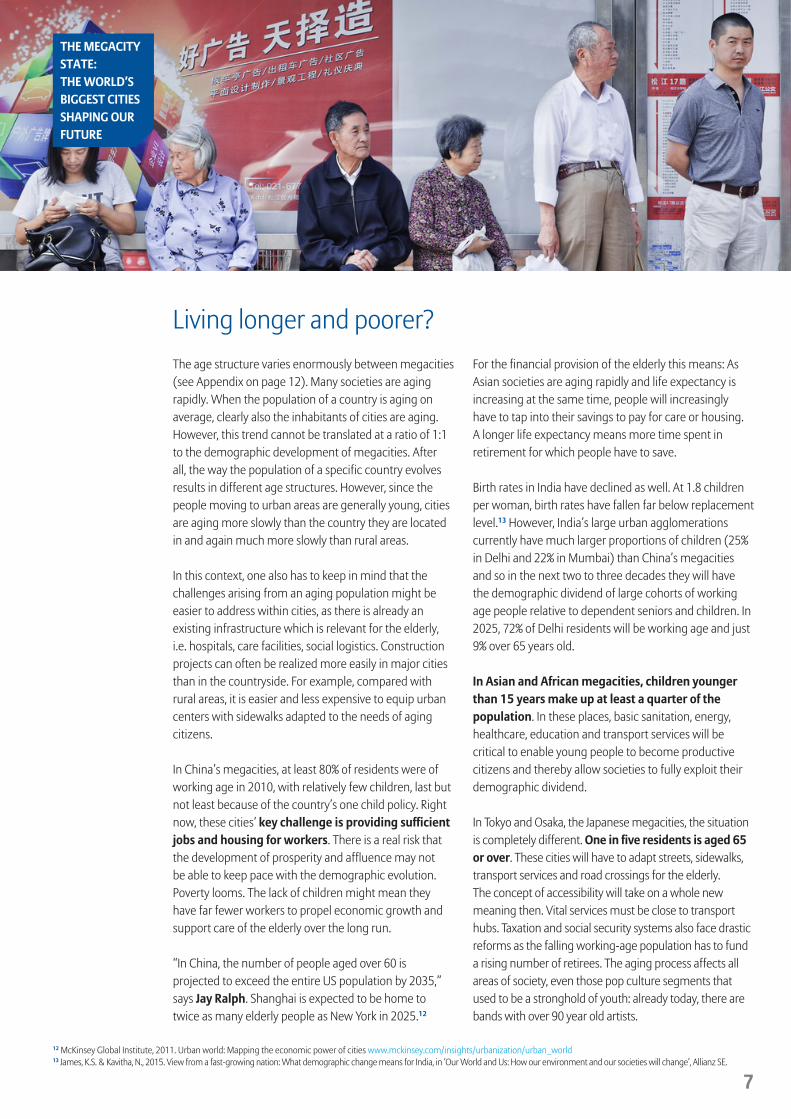
Living longer and poorer?
The age structure varies enormously between megacities (see Appendix on page 12). Many societies are aging rapidly. When the population of a country is aging on average, clearly also the inhabitants of cities are aging. However, this trend cannot be translated at a ratio of 1:1 to the demographic development of megacities. After all, the way the population of a specific country evolves results in different age structures. However, since the people moving to urban areas are generally young, cities are aging more slowly than the country they are located in and again much more slowly than rural areas.
In this context, one also has to keep in mind that the challenges arising from an aging population might be easier to address within cities, as there is already an existing infrastructure which is relevant for the elderly, i.e. hospitals, care facilities, social logistics. Construction projects can often be realized more easily in major cities than in the countryside. For example, compared with rural areas, it is easier and less expensive to equip urban centers with sidewalks adapted to the needs of aging citizens.
In China’s megacities, at least 80% of residents were of working age in 2010, with relatively few children, last but not least because of the country’s one child policy. Right now, these cities’ key challenge is providing sufficient jobs and housing for workers. There is a real risk that the development of prosperity and affluence may not be able to keep pace with the demographic evolution. Poverty looms. The lack of children might mean they have far fewer workers to propel economic growth and support care of the elderly over the long run.
“In China, the number of people aged over 60 is projected to exceed the entire US population by 2035,” says Jay Ralph. Shanghai is expected to be home to twice as many elderly people as New York in 2025.12
For the financial provision of the elderly this means: As Asian societies are aging rapidly and life expectancy is increasing at the same time, people will increasingly have to tap into their savings to pay for care or housing. A longer life expectancy means more time spent in retirement for which people have to save.
Birth rates in India have declined as well. At 1.8 children per woman, birth rates have fallen far below replacement level.13 However, India’s large urban agglomerations currently have much larger proportions of children (25% in Delhi and 22% in Mumbai) than China’s megacities and so in the next two to three decades they will have the demographic dividend of large cohorts of working age people relative to dependent seniors and children. In 2025, 72% of Delhi residents will be working age and just 9% over 65 years old.
In Asian and African megacities, children younger than 15 years make up at least a quarter of the population. In these places, basic sanitation, energy, healthcare, education and transport services will be critical to enable young people to become productive citizens and thereby allow societies to fully exploit their demographic dividend.
In Tokyo and Osaka, the Japanese megacities, the situation is completely different. One in five residents is aged 65 or over. These cities will have to adapt streets, sidewalks, transport services and road crossings for the elderly. The concept of accessibility will take on a whole new meaning then. Vital services must be close to transport hubs. Taxation and social security systems also face drastic reforms as the falling working-age population has to fund a rising number of retirees. The aging process affects all areas of society, even those pop culture segments that used to be a stronghold of youth: already today, there are bands with over 90 year old artists.
12 McKinsey Global Institute, 2011. Urban world: Mapping the economic power of cities www.mckinsey.com/insights/urbanization/urban_world13 James, K.S. & Kavitha, N., 2015. View from a fast-growing nation: What demographic change means for India, in ‘Our World and Us: How our environment and our societies will change’, Allianz SE.
THE MEGACITY STATE: THE WORLD’S BIGGEST CITIES SHAPING OUR FUTURE
8
Three development stages of megacities
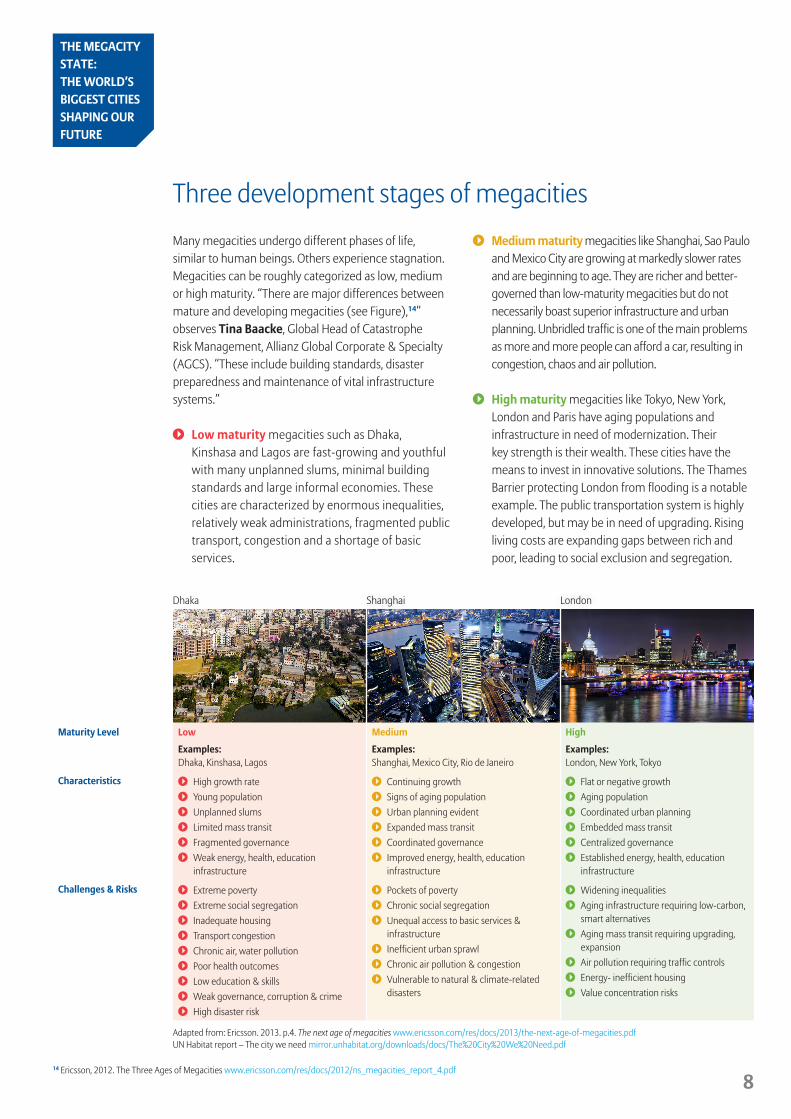
Many megacities undergo different phases of life, similar to human beings. Others experience stagnation. Megacities can be roughly categorized as low, medium or high maturity. “There are major differences between mature and developing megacities (see Figure),14” observes Tina Baacke, Global Head of Catastrophe Risk Management, Allianz Global Corporate & Specialty (AGCS). “These include building standards, disaster preparedness and maintenance of vital infrastructure systems.”
Low maturity megacities such as Dhaka, Kinshasa and Lagos are fast-growing and youthful with many unplanned slums, minimal building standards and large informal economies. These cities are characterized by enormous inequalities, relatively weak administrations, fragmented public transport, congestion and a shortage of basic services.
Maturity Level Low
Examples: Dhaka, Kinshasa, Lagos
Medium
Examples: Shanghai, Mexico City, Rio de Janeiro
High
Examples: London, New York, Tokyo
Characteristics High growth rate
Young population
Unplanned slums
Limited mass transit
Fragmented governance
Weak energy, health, education infrastructure
Continuing growth
Signs of aging population
Urban planning evident
Expanded mass transit
Coordinated governance
Improved energy, health, education infrastructure
Flat or negative growth
Aging population
Coordinated urban planning
Embedded mass transit
Centralized governance
Established energy, health, education infrastructure
Challenges & Risks Extreme poverty
Extreme social segregation
Inadequate housing
Transport congestion
Chronic air, water pollution
Poor health outcomes
Low education & skills
Weak governance, corruption & crime
High disaster risk
Pockets of poverty
Chronic social segregation
Unequal access to basic services & infrastructure
Inefficient urban sprawl
Chronic air pollution & congestion
Vulnerable to natural & climate-related disasters
Widening inequalities
Aging infrastructure requiring low-carbon, smart alternatives
Aging mass transit requiring upgrading, expansion
Air pollution requiring traffic controls
Energy- inefficient housing
Value concentration risks
Dhaka Shanghai London
Medium maturity megacities like Shanghai, Sao Paulo and Mexico City are growing at markedly slower rates and are beginning to age. They are richer and better-governed than low-maturity megacities but do not necessarily boast superior infrastructure and urban planning. Unbridled traffic is one of the main problems as more and more people can afford a car, resulting in congestion, chaos and air pollution.
High maturity megacities like Tokyo, New York, London and Paris have aging populations and infrastructure in need of modernization. Their key strength is their wealth. These cities have the means to invest in innovative solutions. The Thames Barrier protecting London from flooding is a notable example. The public transportation system is highly developed, but may be in need of upgrading. Rising living costs are expanding gaps between rich and poor, leading to social exclusion and segregation.
Adapted from: Ericsson. 2013. p.4. The next age of megacities www.ericsson.com/res/docs/2013/the-next-age-of-megacities.pdf UN Habitat report – The city we need mirror.unhabitat.org/downloads/docs/The%20City%20We%20Need.pdf
14 Ericsson, 2012. The Three Ages of Megacities www.ericsson.com/res/docs/2012/ns_megacities_report_4.pdf
THE MEGACITY STATE: THE WORLD’S BIGGEST CITIES SHAPING OUR FUTURE
9
Mobility in megacities: short distances are the key
Due to the urbanization of the world’s population, which in some cases is occurring at rapid speed, politicians, city planners and transport developers are facing unknown challenges.
For many academics, the key for the city of the future lies in its compactness. They likewise warn against de-urbanization. This term is used by experts to refer to vast settlements without links to public transport, the conventional suburbs in Western countries, or totally vacant pockets of land in China’s new towns.
“Building better connected, more compact cities based on mass public transport can save over $3 trillion in investment costs over the next 15 years. These measures will improve economic performance and reduce emissions, raising the quality of life.” This was the conclusion reached by the authors of the latest New Climate Economy Report.15
“The ideal city is one that consists of multiple self-contained centers,” says climate expert Thomas Liesch from Allianz Climate Solutions. He is a fan of short distances. His idea is that “in the city of the future, people would work and live in their respective districts, thus saving a great deal of time and energy, and reducing traffic density. Fewer cars would mean more space for pedestrians, while a network of green spaces would connect the individual neighborhoods. Not only would this
improve the climate, but it would also allow more space for leisure activities and food production.”
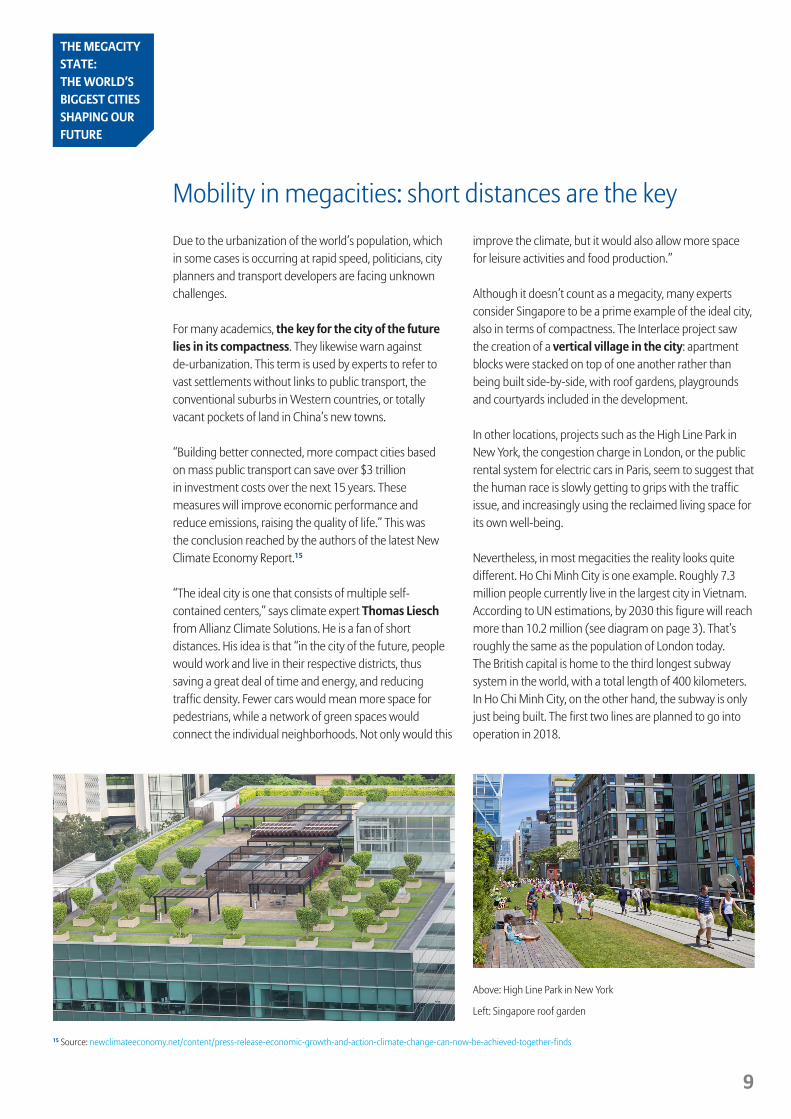
Although it doesn’t count as a megacity, many experts consider Singapore to be a prime example of the ideal city, also in terms of compactness. The Interlace project saw the creation of a vertical village in the city: apartment blocks were stacked on top of one another rather than being built side-by-side, with roof gardens, playgrounds and courtyards included in the development.
In other locations, projects such as the High Line Park in New York, the congestion charge in London, or the public rental system for electric cars in Paris, seem to suggest that the human race is slowly getting to grips with the traffic issue, and increasingly using the reclaimed living space for its own well-being.
Nevertheless, in most megacities the reality looks quite different. Ho Chi Minh City is one example. Roughly 7.3 million people currently live in the largest city in Vietnam. According to UN estimations, by 2030 this figure will reach more than 10.2 million (see diagram on page 3). That’s roughly the same as the population of London today. The British capital is home to the third longest subway system in the world, with a total length of 400 kilometers. In Ho Chi Minh City, on the other hand, the subway is only just being built. The first two lines are planned to go into operation in 2018.
Above: High Line Park in New York
Left: Singapore roof garden
15 Source: newclimateeconomy.net/content/press-release-economic-growth-and-action-climate-change-can-now-be-achieved-together-finds
THE MEGACITY STATE: THE WORLD’S BIGGEST CITIES SHAPING OUR FUTURE
10
The lack of public transport is particularly striking in emerging megacities. The consequence: total gridlock and smog alert. In 2014, the lowest pollution load in New Delhi was higher than the highest level in Beijing – a city notorious for smog as it is.16 The main source of the particulates is cars. The health hazard is enormous: according to King’s College London, nearly 9,500 people died in London alone in 2010 as a consequence of air pollution – despite all of the city’s efforts to curb traffic density.17
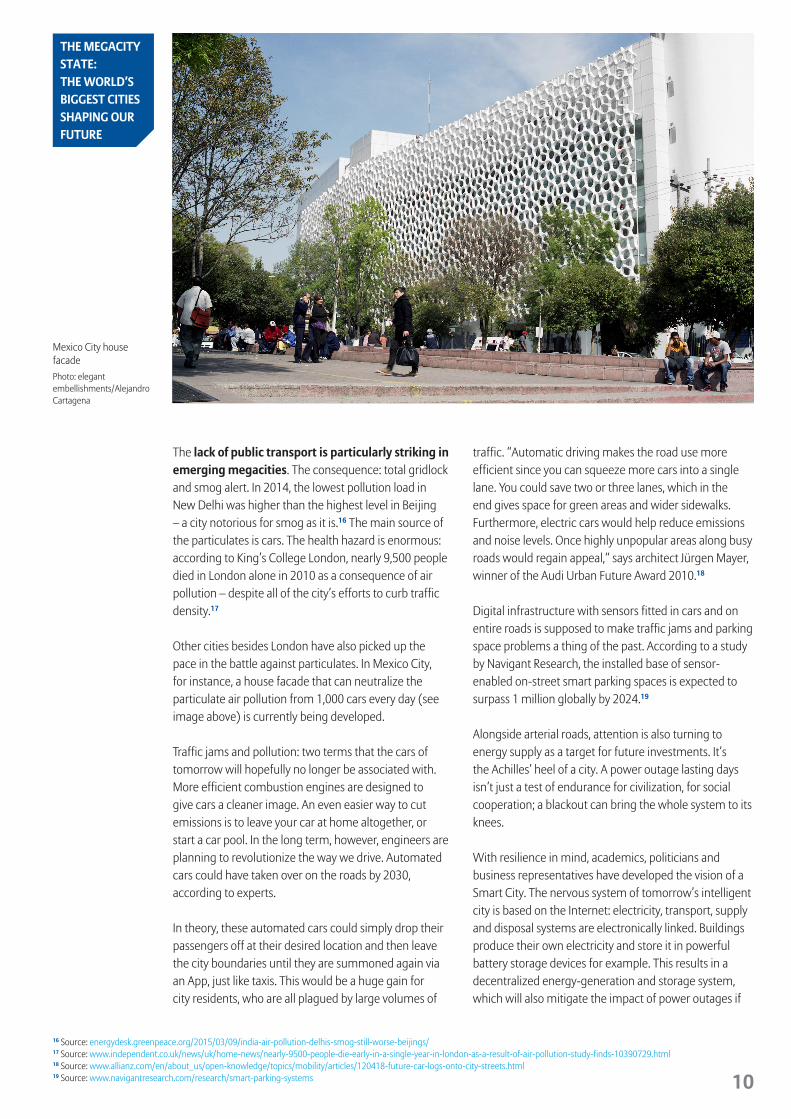
Other cities besides London have also picked up the pace in the battle against particulates. In Mexico City, for instance, a house facade that can neutralize the particulate air pollution from 1,000 cars every day (see image above) is currently being developed.
Traffic jams and pollution: two terms that the cars of tomorrow will hopefully no longer be associated with. More efficient combustion engines are designed to give cars a cleaner image. An even easier way to cut emissions is to leave your car at home altogether, or start a car pool. In the long term, however, engineers are planning to revolutionize the way we drive. Automated cars could have taken over on the roads by 2030, according to experts.
In theory, these automated cars could simply drop their passengers off at their desired location and then leave the city boundaries until they are summoned again via an App, just like taxis. This would be a huge gain for city residents, who are all plagued by large volumes of
traffic. “Automatic driving makes the road use more efficient since you can squeeze more cars into a single lane. You could save two or three lanes, which in the end gives space for green areas and wider sidewalks. Furthermore, electric cars would help reduce emissions and noise levels. Once highly unpopular areas along busy roads would regain appeal,“ says architect Jürgen Mayer, winner of the Audi Urban Future Award 2010.18
Digital infrastructure with sensors fitted in cars and on entire roads is supposed to make traffic jams and parking space problems a thing of the past. According to a study by Navigant Research, the installed base of sensor-enabled on-street smart parking spaces is expected to surpass 1 million globally by 2024.19
Alongside arterial roads, attention is also turning to energy supply as a target for future investments. It’s the Achilles’ heel of a city. A power outage lasting days isn’t just a test of endurance for civilization, for social cooperation; a blackout can bring the whole system to its knees.
With resilience in mind, academics, politicians and business representatives have developed the vision of a Smart City. The nervous system of tomorrow’s intelligent city is based on the Internet: electricity, transport, supply and disposal systems are electronically linked. Buildings produce their own electricity and store it in powerful battery storage devices for example. This results in a decentralized energy-generation and storage system, which will also mitigate the impact of power outages if
Mexico City house facadePhoto: elegant embellishments/Alejandro Cartagena
16 Source: energydesk.greenpeace.org/2015/03/09/india-air-pollution-delhis-smog-still-worse-beijings/ 17 Source: www.independent.co.uk/news/uk/home-news/nearly-9500-people-die-early-in-a-single-year-in-london-as-a-result-of-air-pollution-study-finds-10390729.html 18 Source: www.allianz.com/en/about_us/open-knowledge/topics/mobility/articles/120418-future-car-logs-onto-city-streets.html19 Source: www.navigantresearch.com/research/smart-parking-systems
THE MEGACITY STATE: THE WORLD’S BIGGEST CITIES SHAPING OUR FUTURE

11
According to a study by World Bank and OECD, climate change, rapid urbanization and subsiding land are putting the world’s coastal cities at increasing risk of dangerous and costly flooding. The study found that the average global flood losses could rise from $6 billion in 2005 to $1 trillion per year in 2050 if cities don’t take steps to adapt.20 At particular risk are coastal megacities in Southeast Asia and the eastern US. In its Revision of the World Urbanization Prospect, which is published every two years, the UN (2011) revealed that a total of approximately 890 million city residents are currently exposed to natural disasters.21
Axel Theis explains that a completely new risk landscape has developed for the insurance industry: “The frequency and intensity of climatological events has increased on a global scale over the last 50 years – and with it the concentration of insured assets. At the same time infrastructure expansion cannot keep pace with the increasing needs of the population. This imbalance makes cities extremely vulnerable to natural disasters, especially in Asia.” Already today, cities like Beijing, Delhi, Jakarta, Manila, Mumbai, Shanghai and Taipei are all at risk from flooding and/or typhoons.
In comparison to the United States, Asia is 62 times more vulnerable to flooding, and 40 times more vulnerable to tropical cyclones. Asia stands to lose much more in natural disasters. At the same time, there is still a serious insurance protection gap for natural catastrophe risks.
Catastrophes such as the flood in Bangkok in 2011 costing $45 billion demonstrate the accumulation of risks is rising exponentially with ‘hidden risks’ such as contingent business interruption increasingly prevalent.
Climate change is set to further exacerbate the situation in Asia. Unless managed appropriately – for example, through such measures as insurance solutions as well as adaptation and
mitigation strategies –, the potential extent of damage and the repercussions on the population would therefore be significant in Asia’s urban centers. And while insurance density continues to grow thanks to greater prosperity, so do the uncertainties in the insurance industry due to paucity of risk assessment data.
“In order to keep up with the rapid changes in risk concentration, we’re using the most modern technology and models,” says Theis. “For instance, by utilizing satellite technology and 3D imaging we can assess risks precisely – down to the level of individual buildings. But the most sophisticated mathematical model in the world can only work if the data used is correct and the risk is clearly identifiable. The Thailand flood was a mega-occurrence of this kind that couldn’t be modeled beforehand. Many company premises were submerged, which led to supply chain interruptions across the world. To be able to even better assess risks in the future, technological advances such as geocoding but also an ongoing direct dialogue with the customer are fundamental.”
Megacities exposed to flood risks
push comes to shove. Traffic control systems respond to real-time data, reduce traffic and redirect it. The workplace and the home merge. Supply chains are optimized.
The necessary infrastructure requires secure support. The insurance industry’s role is to protect people,
Bangkok flood in 2011Photo: Voice of America, via Wikimedia Commons
20 Source: www.worldbank.org/en/news/feature/2013/08/19/coastal-cities-at-highest-risk-floods 21 Source: www.un.org/en/development/desa/publications/world-urbanization-prospects-the-2011-revision.html
property and systems alike – regardless of their complexity and size. By pushing the boundaries of insurability, the (re)insurance business can make an effective contribution to the development of megacities. In this way, the insurance industry is a powerful tool to strengthen the resilience of local and national economies and societies at large.
THE MEGACITY STATE: THE WORLD’S BIGGEST CITIES SHAPING OUR FUTURE
12
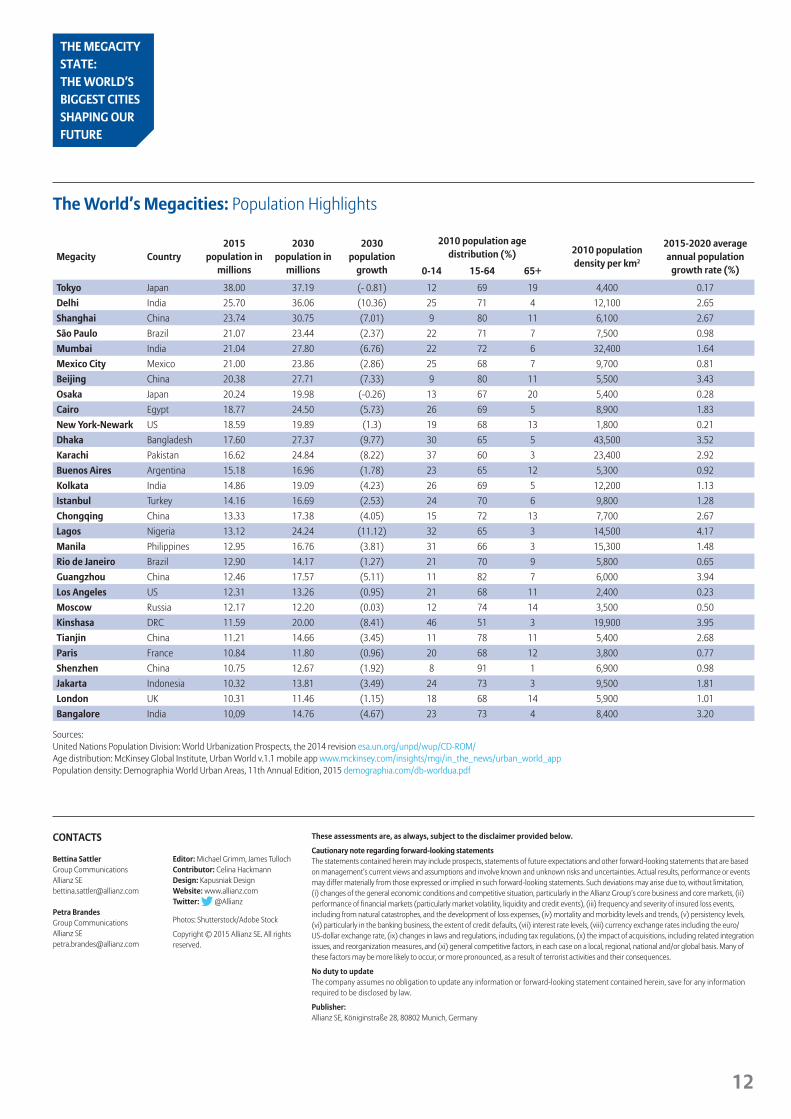
The World’s Megacities: Population Highlights
Megacity Country2015
population in millions
2030 population in
millions
2030 population
growth
2010 population age distribution (%) 2010 population
density per km2
2015-2020 average annual population
growth rate (%) 0-14 15-64 65+
Tokyo Japan 38.00 37.19 (- 0.81) 12 69 19 4,400 0.17
Delhi India 25.70 36.06 (10.36) 25 71 4 12,100 2.65
Shanghai China 23.74 30.75 (7.01) 9 80 11 6,100 2.67
São Paulo Brazil 21.07 23.44 (2.37) 22 71 7 7,500 0.98
Mumbai India 21.04 27.80 (6.76) 22 72 6 32,400 1.64
Mexico City Mexico 21.00 23.86 (2.86) 25 68 7 9,700 0.81
Beijing China 20.38 27.71 (7.33) 9 80 11 5,500 3.43
Osaka Japan 20.24 19.98 (-0.26) 13 67 20 5,400 0.28
Cairo Egypt 18.77 24.50 (5.73) 26 69 5 8,900 1.83
New York-Newark US 18.59 19.89 (1.3) 19 68 13 1,800 0.21
Dhaka Bangladesh 17.60 27.37 (9.77) 30 65 5 43,500 3.52
Karachi Pakistan 16.62 24.84 (8.22) 37 60 3 23,400 2.92
Buenos Aires Argentina 15.18 16.96 (1.78) 23 65 12 5,300 0.92
Kolkata India 14.86 19.09 (4.23) 26 69 5 12,200 1.13
Istanbul Turkey 14.16 16.69 (2.53) 24 70 6 9,800 1.28
Chongqing China 13.33 17.38 (4.05) 15 72 13 7,700 2.67
Lagos Nigeria 13.12 24.24 (11.12) 32 65 3 14,500 4.17
Manila Philippines 12.95 16.76 (3.81) 31 66 3 15,300 1.48
Rio de Janeiro Brazil 12.90 14.17 (1.27) 21 70 9 5,800 0.65
Guangzhou China 12.46 17.57 (5.11) 11 82 7 6,000 3.94
Los Angeles US 12.31 13.26 (0.95) 21 68 11 2,400 0.23
Moscow Russia 12.17 12.20 (0.03) 12 74 14 3,500 0.50
Kinshasa DRC 11.59 20.00 (8.41) 46 51 3 19,900 3.95
Tianjin China 11.21 14.66 (3.45) 11 78 11 5,400 2.68
Paris France 10.84 11.80 (0.96) 20 68 12 3,800 0.77
Shenzhen China 10.75 12.67 (1.92) 8 91 1 6,900 0.98
Jakarta Indonesia 10.32 13.81 (3.49) 24 73 3 9,500 1.81
London UK 10.31 11.46 (1.15) 18 68 14 5,900 1.01
Bangalore India 10,09 14.76 (4.67) 23 73 4 8,400 3.20
Sources:United Nations Population Division: World Urbanization Prospects, the 2014 revision esa.un.org/unpd/wup/CD-ROM/Age distribution: McKinsey Global Institute, Urban World v.1.1 mobile app www.mckinsey.com/insights/mgi/in_the_news/urban_world_appPopulation density: Demographia World Urban Areas, 11th Annual Edition, 2015 demographia.com/db-worldua.pdf
Bettina SattlerGroup CommunicationsAllianz [email protected]
Petra BrandesGroup CommunicationsAllianz [email protected]
Editor: Michael Grimm, James TullochContributor: Celina HackmannDesign: Kapusniak DesignWebsite: www.allianz.comTwitter: @Allianz
Photos: Shutterstock/Adobe Stock
Copyright © 2015 Allianz SE. All rights reserved.
These assessments are, as always, subject to the disclaimer provided below.
Cautionary note regarding forward-looking statements The statements contained herein may include prospects, statements of future expectations and other forward-looking statements that are based on management‘s current views and assumptions and involve known and unknown risks and uncertainties. Actual results, performance or events may differ materially from those expressed or implied in such forward-looking statements. Such deviations may arise due to, without limitation, (i) changes of the general economic conditions and competitive situation, particularly in the Allianz Group‘s core business and core markets, (ii) performance of financial markets (particularly market volatility, liquidity and credit events), (iii) frequency and severity of insured loss events, including from natural catastrophes, and the development of loss expenses, (iv) mortality and morbidity levels and trends, (v) persistency levels, (vi) particularly in the banking business, the extent of credit defaults, (vii) interest rate levels, (viii) currency exchange rates including the euro/US-dollar exchange rate, (ix) changes in laws and regulations, including tax regulations, (x) the impact of acquisitions, including related integration issues, and reorganization measures, and (xi) general competitive factors, in each case on a local, regional, national and/or global basis. Many of these factors may be more likely to occur, or more pronounced, as a result of terrorist activities and their consequences.
No duty to update The company assumes no obligation to update any information or forward-looking statement contained herein, save for any information required to be disclosed by law.
Publisher: Allianz SE, Königinstraße 28, 80802 Munich, Germany
THE MEGACITY STATE: THE WORLD’S BIGGEST CITIES SHAPING OUR FUTURE
CONTACTS