the merchants trust plc - theaic.co.uk · 16 2 -p-it \ st the merchants trust ... term pricing...
TRANSCRIPT

The Merchants
Trust PLC
13 October 2016
A challenging time for income
investors
AIC Adviser Seminar, Harrogate
Simon Gergel
For professional investors only

2 16
-18
26
P-I
T\M
erc
ha
nts
Tru
st
The Merchants Trust
Past performance is not a reliable indicator of future results.
Source: Thomson Reuters Datastream, as at 31 August 2016.
Some perspective:
A challenging time for income investors
British American Tobacco vs FTSE 100 rebased
2000 2002 2004 2006 2008 2010 2012 2014 2016 50 60 70 80 90 100
200
300
400
500
600 700 800 900 1000
50 60 70 80 90
100
200
300
400
500
600 700 800 900
1000
Rebase BRITISH AMERICAN TOBACCO to 100 Rebase FTSE 100 to 100
BATS has been one of the best performing stocks this
century
It has outperformed the FTSE 100 index 10-fold
British American Tobacco Dividend Yield vs FTSE 100 Yield
However, the dividend yield started 4-5 x higher than FTSE
100
BATS now yields less than the market
2000 2002 2004 2006 2008 2010 2012 2014 2016
2
3
4
5
6
7
8
9
10
2
3
4
5
6
7
8
9
10
BRITISH AMERICAN TOBACCO - DY FTSE 100 - DY

3 16
-18
26
P-I
T\M
erc
ha
nts
Tru
st
The Merchants Trust
Past performance is not a reliable indicator of future results.
Source: Thomson Reuters Datastream, as at 31 August 2016.
Some perspective (cont’d):
A challenging time for income investors
Yield divergence within UK market
A similar situation is seen at other traditional
income stocks; e.g. Unilever
Many traditional income stocks are unlikely to
provide high future returns
However, there are still high yield
opportunities; e.g. Shell, GSK
Investors need to be selective
2011 2012 2013 2014 2015 2016
3
4
5
6
7
8
9
3
4
5
6
7
8
9
BRITISH AMERICAN TOBACCO - DY ROYAL DUTCH SHELL B - DY
FTSE 100 - DY GLAXOSMITHKLINE - DY UNILEVER (UK) - DY

4 16
-18
26
P-I
T\M
erc
ha
nts
Tru
st
The Merchants Trust
Dividend yield 5.6%*, one of the highest in its sector
34 years of dividend growth, strong reserves position
Actively managed, high conviction portfolio, delivering strong performance
Geared exposure to UK equity market, NAV will benefit from “pull to par”
Low management fee: 0.35%
Past performance is not a reliable indicator of future results.
*Source: AllianzGI, as at 22 September 2016.
The Merchants Trust
Objective: “To provide an above
average level of income and
income growth, together with
long term growth of capital,
through a policy of investing
mainly in higher yielding UK
FTSE 100 Companies.”

5 16
-18
26
P-I
T\M
erc
ha
nts
Tru
st
The Merchants Trust
* As at 30 June 2016. Source: Allianz Global Investors. Any differences in totals are due to rounding. ** Includes money market. *** Managed in respective region.
Assets under management: EUR 469 billion*
AllianzGI – Substantial resources and broad expertise
Leveraging the expertise and insights gained through our significant presence in institutional and
retail markets
AuM by asset class AuM by region*** AuM by retail / institutional business
Europe
EUR 363 bn
(77%)
US
EUR 76 bn
(16%)
Asia Pacific
EUR 29 bn
(6%) Equity
EUR 135 bn
(29%)
Fixed Income**
EUR 204 bn
(44%)
Multi Asset
EUR 116 bn
(25%)
Alternatives
EUR 14 bn (3%) Retail
EUR 144 bn
(31%)
Institutional
EUR 325 bn
(69%)

6 16
-18
26
P-I
T\M
erc
ha
nts
Tru
st
The Merchants Trust
Investment philosophy
Understand Act
A high conviction portfolio to deliver long-term
outperformance The stock market is not efficient
Fundamental research, conducted and disseminated
globally provides an information advantage
Companies and industries are complex and
dynamic
Focus on underlying cash-flow for a true picture of
performance and potential dividend payments
Companies portray misleading and flattering
view of reality
Maintain long-term focus to take advantage of short
term pricing anomalies
Investors and markets are increasingly short-
term
Active portfolio management with strong valuation
emphasis in Buy and Sell discipline
Share price returns are related to the purchase
price
7 16
-18
26
P-I
T\M
erc
ha
nts
Tru
st
The Merchants Trust
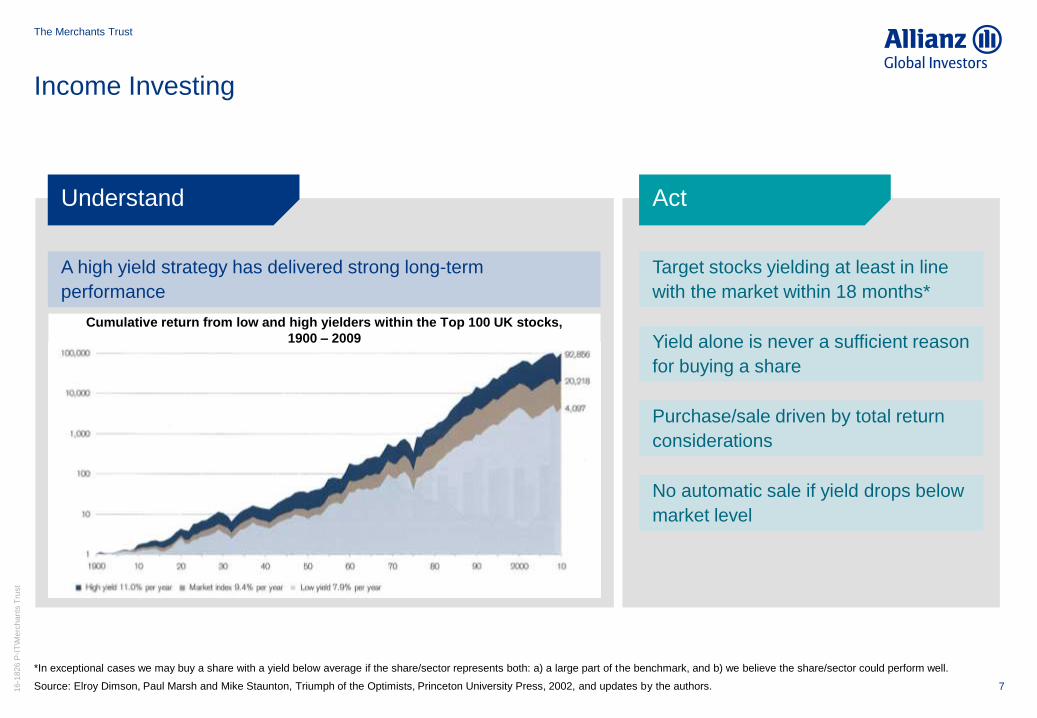
Income Investing
*In exceptional cases we may buy a share with a yield below average if the share/sector represents both: a) a large part of the benchmark, and b) we believe the share/sector could perform well.
Source: Elroy Dimson, Paul Marsh and Mike Staunton, Triumph of the Optimists, Princeton University Press, 2002, and updates by the authors.
Understand Act
Target stocks yielding at least in line
with the market within 18 months*
A high yield strategy has delivered strong long-term
performance
Yield alone is never a sufficient reason
for buying a share
Purchase/sale driven by total return
considerations
No automatic sale if yield drops below
market level
Cumulative return from low and high yielders within the Top 100 UK stocks,
1900 – 2009
8 16
-18
26
P-I
T\M
erc
ha
nts
Tru
st
The Merchants Trust
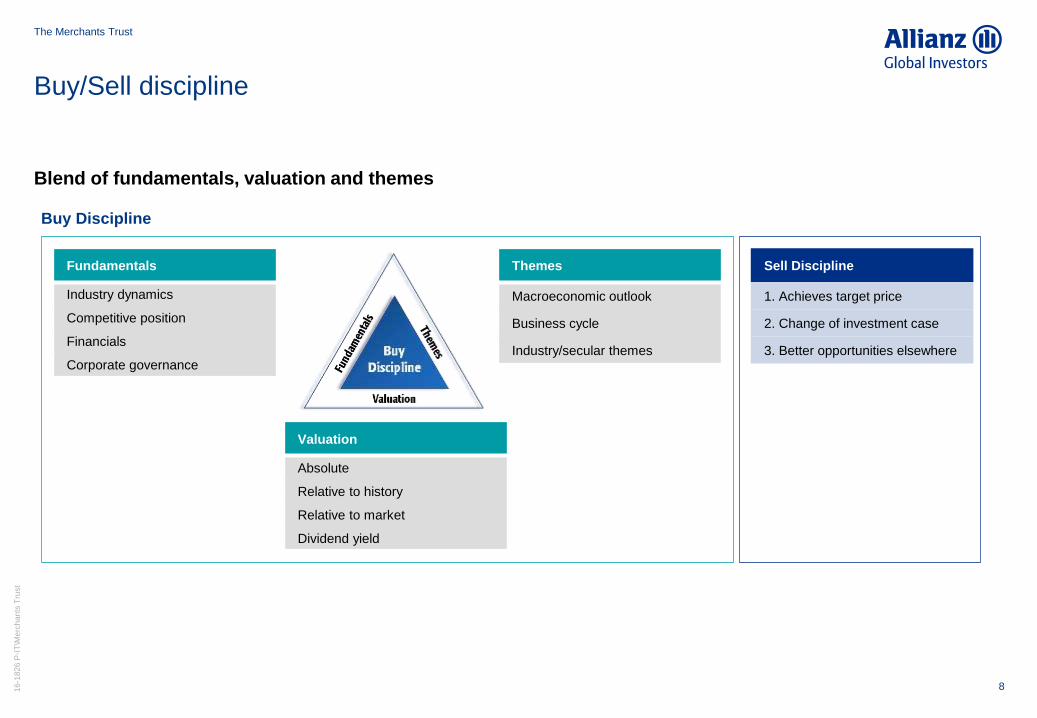
Buy/Sell discipline
Blend of fundamentals, valuation and themes
Fundamentals
Industry dynamics
Competitive position
Financials
Corporate governance
Buy Discipline
Themes
Macroeconomic outlook
Business cycle
Industry/secular themes
Valuation
Absolute
Relative to history
Relative to market
Dividend yield
Sell Discipline
1. Achieves target price
2. Change of investment case
3. Better opportunities elsewhere

9 16
-18
26
P-I
T\M
erc
ha
nts
Tru
st
The Merchants Trust
Source: Bloomberg, as at 26 September 2016.
Strong fundamentals, attractive valuation and supportive themes
Stock example – GlaxoSmithkline
Fundamentals
Global leader in consumer
health – Sensodyne, Panadol,
Voltaren etc.
Leading vaccine producer
Scale player in pharmaceuticals
Robust balance sheet,
improving cash flow
Intellectual property, brands,
technology and distribution
assets
Source: Thomson Reuters Datastream
Glaxo share price vs FSTE 100 over 1 year Themes
Restructuring: Improving mix of
business, margin potential
Favourable demographics –
ageing population
EM exposure – vaccines /
consumer health
Growth – Vaccines, consumer,
HIV
Risk: Advair generics – Offset by
new products
Valuation
Valuation reflects historic issues not future
prospects
Modestly priced compared to consumer staples
5% Yield
p/e 16x (2017)
Oct Nov Dec Jan Feb Mar Apr May Jun Jul Aug Sep
2015 2016
100
110
120
130
100
110
120
130
GlaxoSmithKline (rebased)
FTSE 100 (rebased)

10 16
-18
26
P-I
T\M
erc
ha
nts
Tru
st
The Merchants Trust
Key features and objectives
Source: AllianzGI/JP Morgan Cazenove, as at 22 September 2016.
Objective: “To provide an above
average level of income and
income growth, together with
long term growth of capital,
through a policy of investing
mainly in higher yielding UK
FTSE 100 Companies.”
Total Assets £651m
Debt Long Term Debentures (Historic) £111m
Net Assets £540m
Gearing 17%
Debt – Average Duration 7 years
First Debenture Repayment Jan 2018
Structure:
Share Price 431p
Yield 5.6%
Market Cap £468m
NAV (Debt at market) 465p
(Discount)/Premium (Debt at market) (7.5%)
Valuation:

11 16
-18
26
P-I
T\M
erc
ha
nts
Tru
st
The Merchants Trust
2.1 2.3 2.43.0
3.84.5
5.46.6
8.09.0
10.010.6 11.0
11.5
12.313.7
14.3
15.6
16.0
16.4 16.8
17.2
17.618.0
18.920.0
21.622.3
22.5 22.8 23.0 23.2
23.6
23.8
24.00.5
0p
2p
4p
6p
8p
10p
12p
14p
16p
18p
20p
22p
24p
26p
28p
1982 1983 1984 1985 1986 1987 1988 1989 1990 1991 1992 1993 1994 1995 1996 1997 1998 1999 2000 2001 2002 2003 2004 2005 2006 2007 2008 2009 2010 2011 2012 2013 2014 2015 2016
Net
Div
iden
d pe
r Sha
re
Past performance is not a reliable indicator of future results.
Source: AllianzGI, as at 22 September 2016.
34 years of rising dividends
1st objective: High income and dividend growth
5.6% yield, fully covered by earnings in FY 2016
Significant yield premium over sector and wider market
Reserves built up in good years to offset pressures in difficult years
Revenue reserves of 22.6p available = 94% of full year dividend
Special
Dividend
Reserve accumulation Reserve depletion

12 16
-18
26
P-I
T\M
erc
ha
nts
Tru
st
The Merchants Trust
UK Equity Income Trusts
Source: JP Morgan Cazenove/FTSE as at 31 August 2016.
Dividend yields
Merchants has one of the highest yields in the sector
The yield is well above the FTSE 100 yield of 3.7%
10.3
5.7 5.4 4.6 4.4 4.2 4.0 4.0 3.9 3.8 3.7 3.7 3.7 3.6 3.6 3.6 3.4 3.4 3.3 3.2 3.1 3.1
1.9
0
2
4
6
8
10
12
Bri
tish &
Am
eri
ca
n
Me
rcha
nts
Tru
st
Sh
ire
s In
co
me
Dun
ed
in I
nco
me
Gro
wth
Mu
rra
y I
nco
me
Tru
st
Va
lue
& In
com
e
Schro
der
Inco
me
Gro
wth
Che
lvert
on
Sm
all
Co
mp
anie
sD
ivid
en
d
City o
f L
on
do
n
JP
Mo
rga
n E
lect M
an
ag
ed
Inc
F&
C C
apita
l &
In
co
me
JP
Mo
rga
n C
laverh
ouse
Sta
nd
ard
Life
Eq
uity I
nco
me
Inve
sco I
nco
me G
row
th
UK
Eq
uity In
co
me W
ghtd
Avg
Te
mp
le B
ar
Ed
inb
urg
h I
nve
stm
en
t
Pe
rpe
tual In
co
me
& G
row
th
Low
lan
d
Bla
ckR
ock I
nco
me
and
Gro
wth
Tro
y I
nco
me
& G
row
th
Div
ers
e I
nco
me
Tru
st
Fin
sbu
ry G
row
th &
Inco
me
Div
ide
nd
Yie
ld %

13 16
-18
26
P-I
T\M
erc
ha
nts
Tru
st
The Merchants Trust
Past performance is not a reliable indicator of future results.
Source: AllianzGI/Merchants Trust, as at 31 January 2016.
The Merchants Trust
Disciplined process to pick high yielding cheap stocks
High conviction, actively managed portfolio
Good long term performance, challenging year
Total Return
Periods to 31 January 2016 %
1 Year 3 Years p.a. 5 Years p.a. 10 Years p.a. Financial Year
to 31 August
Merchants’ Portfolio (excludes gearing) -3.8 5.5 7.5 5.5 10.5
FTSE 100 Index -6.5 2.6 4.5 4.3 15.0
Difference +2.8 +2.9 +3.0 +1.2 -4.2

14 16
-18
26
P-I
T\M
erc
ha
nts
Tru
st
The Merchants Trust
Total Return: NAV Performance
Past performance is not a reliable indicator of future results.
Source: Thomson Reuters Datastream, Total return portfolio performance 31/01/16-31/08/16 = +10.52% v +14.98% (FTSE 100 TR) .
Gearing amplifies performance of NAV level
Falling bond yields, rising values, have held back NAV
Pull to par will reduce debt value in future
Merchants Trust NAV vs FTSE 100: 5 years to August 2016
2011 2012 2013 2014 2015 2016
80
100
120
140
160
180
80
100
120
140
160
180
MERCHANTS TRUST - NAV (Debt at Fair Value) Total Return FTSE 100 Total Return

15 16
-18
26
P-I
T\M
erc
ha
nts
Tru
st
The Merchants Trust
Active portfolio management
Active stock selection, driven by opportunities
6 additions, 7 disposals within 43 stock portfolio
Purchases focused on:
- Undervalued growth
- Cyclical recovery
- New IPO’s – Strong business franchises, attractive
valuations
Sales driven by:
- Full valuation/bond proxies
- Change of view, deteriorating trading
Financial year to 31 January 2016
New Additions Disposals
Lloyds Unilever
Barclays Hammerson
Prudential Cineworld
Antofagasta Premier Farnell
Equiniti Amec Foster Wheeler
Hostelworld Britvic
Smiths
Current Financial year
New Additions Disposals
Senior Segro
Sirius Real Estate Barclays

16 16
-18
26
P-I
T\M
erc
ha
nts
Tru
st
The Merchants Trust
Growth will be restrained by high debt burden, financial repression
Corporates generally in good shape, balance sheets repaired
Large companies geographically diversified
Yield to remain an important factor
Best value in Mega Caps and recovery situations
Safe defensive stocks and bond proxies expensive
Economic and market outlook – Long term themes

17 16
-18
26
P-I
T\M
erc
ha
nts
Tru
st
The Merchants Trust
Key portfolio themes
This is no recommendation or solicitation to buy or sell any particular security. A stock mentioned as example above will not necessarily be comprised in the portfolio by the time this document
is disclosed or at any other subsequent date.
Investment Themes
Inflation “tail risk”: Real assets, inflation-linked revenues attractive
Earnings growth is hard to achieve: Favour growth stocks on
reasonable valuations Turnaround situations
Exposure to emerging market consumer spending growth Financials: exposure to rising interest rates/volatility
Large core holdings in well financed global, “mega” caps with strong
franchises and good yields
Cyclical Recovery situations: Industries recovering, companies on
modest valuations
GlaxoSmithKline Shell | BP HSBC
Ashmore Inmarsat
GlaxoSmithKline UBM Mothercare
Mothercare Marks & Spencer First Ladbrokes
Greene King Pennon Sainsburys
Balfour Beatty SThree Carnival Hansteen
Hostelworld
ICAP | IG Group HSBC/Lloyds Equiniti Prudential

18 16
-18
26
P-I
T\M
erc
ha
nts
Tru
st
The Merchants Trust
Different to other UK equity income funds
This is no recommendation or solicitation to buy or sell any particular security.
Source: AllianzGI, as at 31 August 2016.
Strong valuation discipline
Opportunities in recovery situations:
- Financial services
- Construction and materials
- Travel and leisure
Limited exposure to expensive defensives
Sector View
Stock Views
Underweight
Tobacco
Household Goods
Pharmaceuticals
Beverages
Personal Goods
Pharmaceuticals
Overweight
Financial Services
Construction & Materials
Gas, Water & Multi Utilities
Travel & Leisure
Aerospace & Defence
Underweight
British American Tobacco
Astra Zeneca
Vodafone
Reckitt Benckiser
Unilever
Overweight
UBM
Inmarsat
Centrica
Tate & Lyle
GlaxoSmithKline
Merchants Trust
2.8
3.2
3.4
5.0
5.2
-2.8
-3.5
-3.6
-3.7
-6.5
-8.0 -4.0 0.0 4.0 8.0
2.5
3.0
3.0
3.1
4.5
-2.4
-2.6
-3.5
-3.5
-4.3
-8.0 -4.0 0.0 4.0 8.0
Merchants Trust
% position relative to FTSE 100 Index

19 16
-18
26
P-I
T\M
erc
ha
nts
Tru
st
The Merchants Trust
Good performance track record
Active, value driven, stock selection approach
34 years of dividend growth
High yield supported by significant reserves
Merchants is well positioned for the future
Low management fee
Why The Merchants Trust
For further information:
www.merchantstrust.co.uk
Blog: www.unconstrainedthinking.com
MELISSA GALLAGHER: 020 3246 7539
SIMON GERGEL: 020 3246 7431

20 16
-18
26
P-I
T\M
erc
ha
nts
Tru
st
The Merchants Trust
A Appendices

21 16
-18
26
P-I
T\M
erc
ha
nts
Tru
st
The Merchants Trust
UK Equity investment team
Source: AllianzGI. As at 31 March 2016. GrassrootsSM Research is a division within the Allianz Global Investors group of companies that commissions investigative research for
asset-management professionals. Research data used to generate GrassrootsSM Research reports are received from reporters and field force investigators who work as independent, third
party research providers, supplying research that is paid for by commissions generated by trades executed on behalf of clients.
25-35 stock portfolio
Simon Gergel
CIO UK Equities Income
28 years experience
Matthew Tillett
Unconstrained/Income
10 years experience
Andrew Neville
Mid Cap
19 years experience
Matthew Hall
Mid Cap
7 years experience
European Research Platform Analysts
Healthcare 3
Financials 4
Telecom/Media 2
Industrials & Services 5
Materials 7
Technology 2
Consumer 4
ESG Research 6
GrassrootsSM Research 2
Portfolio Management Team
Europe Equity 41
Macro Research
Global Policy Council 16
GrassrootsSM Research
Help identify key stock
drivers
In-house staff of 10
62 reporters
Over 300+ field force
investigators
Conduct over 400
company/industry studies
per year
50,000 industry contacts

22 16
-18
26
P-I
T\M
erc
ha
nts
Tru
st
The Merchants Trust
Dividend sustainability: Yield profile of UK Equity portfolio
1 As at 22 August 2016, historic yields.
Source: Allianz Global Investors.
Portfolio diversified across yield spectrum
Two thirds of portfolio has historic yields <5%
19% of portfolio yields <3% - should contribute more income in future
Sample
Companies
First Group
Balfour Beatty
Ladbrokes
Antofagasta
Carnival
Prudential
UBM
Greene King
Glaxo
Kier
M&S
Centrica
Legal &
General
Man
Shell
HSBC
Po
rtfo
lio
Weig
ht
(%)
1.5%
5.5%
12.2% 14.5%
28.0%
16.0%
2.9%
19.1%
0%
5%
10%
15%
20%
25%
30%
35%
0 <2% 2.0% to 3.0% 3.0% to 4.0% 4.0% to 5.0% 5.0% to 6.0% 6.0% to 7.0% 7.0% to 8.0%
Yield Bucket

23 16
-18
26
P-I
T\M
erc
ha
nts
Tru
st
The Merchants Trust
Debt structure
Source: AllianzGI, as at 31 January 2016.
Long dated debt permits long term investment horizon
Gearing amplifies portfolio returns, partially offset by low beta
As debt approaches maturity the debt value will approach par
Debt Average
Coupon
Rate
Maturity
Date
Amount
Repayable
on
Maturity
£m
Clean Market
Value Average “pull to par” p.a.
31/01/16
£m £m
% NAV
(market) Years
First Debenture Finance 11.125% 2018 34.0 39.2 2.6 0.5 2.0
Fin Trust 9.25% 2023 42.0 57.0 2.1 0.4 7.2
Secured Bonds 5.875% 2029 30.0 35.4 0.4 0.1 13.8
4% Perpetual Debenture Stock 4.0% N/A 1.4 1.0 - - -
3.65% Cumulative Preference Shares 3.65% N/A 1.2 0.9 - - -
Total 108.6 133.8 5.1 1.0 N/A

24 16
-18
26
P-I
T\M
erc
ha
nts
Tru
st
The Merchants Trust
Income investing in the UK
We believe that:
The UK has a large variety of high yielding companies
A culture that encourages consistent dividend payments
A strong legal and corporate governance framework
The takeover panel – ensures “fair play”
The UK is one of the best places for income investors % Market Cap with Yield >4% by MSCI Region
80
70
60
50
40
30
20
10
0
% o
f m
ark
et
ca
p w
ith
DY
= X
%
Dec 0
4
Ju
n 0
5
Dec 0
5
Ju
n 0
6
Dec 0
6
Ju
n 0
7
Dec 0
7
Ju
n 0
8
Dec 0
8
Ju
n 0
9
Dec 0
9
Ju
n 1
0
Dec 1
0
Ju
n 1
1
Dec 1
1
Ju
n 1
2
Dec 1
2
Ju
n 1
3
UK Japan US Asia ex Japan Europe ex UK
Performance across the yield spectrum (UK) Performance of UK Dividend stocks (Quintiles Q1 – Q5)
Source: SG Cross Assrt Research, MSCI, as at 1 November 2014.
0
50
100
150
200
250
300
19
94
19
95
19
96
19
97
19
98
19
99
20
00
20
01
20
02
20
03
20
04
20
05
20
06
20
07
20
08
20
09
20
10
20
11
20
12
20
13
Quintile 4 Quintile 1 Quintile 2 Quintile 3 Quintile 5
Source: HSBC, December 1994 - September 2014. Past performance is not a reliable indicator of
future results.
Performance and yield are related
Highest yielders have been best performers
Despite including the tech bubble
TMT Bubble
Perf
orm
an
ce %
Years

25 16
-18
26
P-I
T\M
erc
ha
nts
Tru
st
The Merchants Trust
Disclaimer
This is no recommendation or solicitation to buy or sell any particular security. Any security mentioned above will not necessarily be comprised in the portfolio by the time this
document is disclosed or at any other subsequent date.
Investing involves risk. The value of an investment and the income from it may fall as well as rise and investors may not get back the full amount invested. The views and opinions
expressed herein, which are subject to change without notice, are those of the issuer and/or its affiliated companies at the time of publication. The data used is derived from various
sources, and assumed to be correct and reliable, but it has not been independently verified; its accuracy or completeness is not guaranteed and no liability is assumed for any direct or
consequential losses arising from its use, unless caused by gross negligence or wilful misconduct. The conditions of any underlying offer or contract that may have been, or will be,
made or concluded, shall prevail.
Investment trusts are quoted companies listed on the London Stock Exchange. Their share prices are determined by factors including the balance of supply and demand in the
market, which means that the shares may trade below (at a discount to) or above (at a premium to) the underlying net asset value.
A trust’s Net Asset Value (NAV) is calculated as available shareholders’ funds divided by the number of shares in issue, with shareholders’ funds taken to be the net value of all the
company’s assets after deducting liabilities. In line with current industry best practice NAVs are now shown that take into account the ‘fair value’ of debt. This means NAVs are
calculated after allowing for the valuation of debt at fair value or current market price, rather than at final repayment value. NAVs with debt at market value provide a more realistic
impact of the cost of debt, and thus a more realistic discount. It is the capital NAV that is shown, which excludes any income.
Past performance is not a reliable indicator of future returns. You should not make any assumptions on the future on the basis of performance information. The value of an investment
and the income from it can fall as well as rise as a result of market fluctuations and you may not get back the amount originally invested. This investment trust charges 65% of its
annual management fee to the capital account and 35% to revenue. This could lead to a higher level of income but capital growth will be constrained as a result.
Merchants seeks to enhance returns for its shareholders through gearing in the form of long-term debentures. Gearing can boost the Trust’s returns when investments perform well,
though losses can be magnified when investments lose value. You should be aware that this Trust may be subject to sudden and large falls in value and you could suffer substantial
capital loss. Derivatives are used to manage the trust efficiently. Covered call options are written to supplement the income generation of the portfolio. This may lead to an opportunity
cost if options are exercised.
All data source Allianz Global Investors as at 31 August 2016 unless otherwise stated. This is a marketing communication issued by Allianz Global Investors GmbH, an investment
company with limited liability, incorporated in Germany, with its registered office at Bockenheimer Landstrasse 42-44, D-60323 Frankfurt/M, registered with the local court Frankfurt/M
under HRB 9340, authorised by Bundesanstalt für Finanzdienstleistungsaufsicht (www.bafin.de). Allianz Global Investors GmbH has established a branch in the United Kingdom,
Allianz Global Investors GmbH, UK branch, 199 Bishopsgate, London EC2M 3TY, which is subject to limited regulation by the Financial Conduct Authority (www.fca.org.uk). Details
about the extent of our regulation by the Financial Conduct Authority are available from us on request.
Web site: www.merchantstrust.co.uk
