the merger of wal-mart and massmart: economic...
TRANSCRIPT

The Merger of Wal-Mart and Massmart:
Economic Issues
RBB Economics, 03 May 2011

PRIVILEGED & CONFIDENTIAL
RBB Economics Page 2
1. Introduction
This report has been prepared by RBB Economics at the request of Webber Wentzel, acting on
behalf of Wal-Mart Stores Inc. (Wal-Mart), and Edward Nathan Sonnenbergs, acting on behalf
of Massmart Holdings Ltd. (Massmart). The purpose of the report is to respond to allegations
made by various complainants about the impact of the proposed acquisition by Wal-Mart of a
51% stake in Massmart.
Section 2 describes the complaints that have been made about the proposed transaction (sub-
section 2.2) and the conditions that are sought by the complainants should the merger be
allowed to proceed (sub-section 2.3).
Section 3 considers the pre-existing state of competition in the wholesale (sub-section 3.2) and
retail markets (sub-section 3.3) in which Massmart is active in South Africa and the position of
Massmart within them. It then analyses the impact which the merger will have on competition in
those markets (sub-section 3.4) and the extent of the benefits which the merger is likely to bring
to consumers (sub-section 3.6).
Section 4 discusses the counterfactual to the transaction, to provide the behavioural benchmark
against which the conduct of the merged business must be compared and the operational
benchmark against which the post-merger state of the markets in which it is involved must be
judged. This counterfactual analysis is undertaken for procurement patterns (sub-section 4.2)
and retail market operations (sub-section 4.3).
Section 5 considers what impact the transaction will have on the degree of buyer power enjoyed
by Massmart and how that might be expected to affect its international and domestic suppliers.
First, the theoretical determinants of buyer power are considered as are the manner in which
they may be changed by the merger, noting the considerable advantages that exist in relation to
domestic procurement in many circumstances (sub-section 5.2).
Section 5 then explores the extent to which procurement patterns may be expected to change in
light of the preference for domestic procurement and the robustness of those South African
producers that have continued to operate profitably in a liberalised trade environment.
Evidence on the point is provided by the experience of Chilean suppliers following the
acquisition of the retailer D&S by Wal-Mart in January 2009 and the stability of Massmart’s
procurement patterns over time (sub-section 5.3).
Finally, Section 5 examines how the transaction might affect suppliers’ margins and the prices
at which they sell to Massmart, given potential changes in bargaining power and the established
strategy of Wal-Mart of working closely with its suppliers to reduce the costs of those suppliers
and increase their sales (sub-section 5.4). Evidence on the point is once again drawn from the
Chilean experience.
Section 6 examines the impact of the transaction on South African retailers, distinguishing
between its impact on small and informal retail businesses (sub-section 6.2) and its impact on
formal retail competitors (sub-section 6.3), including possible “waterbed effects”.

PRIVILEGED & CONFIDENTIAL
RBB Economics Page 3
The final substantive section looks at the distortionary impact on competition of the proposed
conditions (sub-section 7.1) and discusses the interface between competition policy and
industrial policy and the merits of seeking to achieve industrial policy goals through the
imposition of asymmetric behavioural restrictions in otherwise competitive markets (sub-section
7.2). Finally, Section 8 concludes.

PRIVILEGED & CONFIDENTIAL
RBB Economics Page 4
2. Complaints
2.1. Overview
Complaints have been lodged against the proposed transaction in the form of more than a
dozen different statements and witness statements. These contain numerous complaints
regarding the conduct of Wal-Mart in the countries in which it operates and numerous
allegations about the likely conduct of Massmart in South Africa after the merger. These
complaints are almost all entirely unsubstantiated. Furthermore, the economic logic
underpinning many is flawed and, in some cases, the complaints appear to be mutually
inconsistent.
The subsequent sections of the report will not attempt to deal with all of the specific allegations
made against Wal-Mart, nor will it seek to set out and critically review the reasoning underlying
every formulation of the complaints. The approach that is taken in the remainder of the report is
to show that the small number of implicit assumptions on which the complainants implicitly or
explicitly rely in building the majority of their theories of competition and public interest harm are
not valid.
These assumptions are that:
• merely by virtue of its relationship with Wal-Mart, Massmart will acquire the power to de-
list domestic suppliers in favour of international suppliers or force them to match the
lower prices available to Massmart in international markets;
• Wal-Mart is only able to offer customers the low prices that it can because it is willing
and able to drive down supplier margins to levels that are inconsistent with acceptable
working conditions and investment and innovation amongst suppliers;
• any benefit customers may get from lower prices will necessarily be transitory, as
competitors will be unable to compete with Massmart, will ultimately be marginalised
within their markets, leaving Wal-Mart to raise prices to the detriment of consumers.
The remainder of this section describes the allegations in more detail, showing where and to
what extent they rely on these key assumptions. The conditions that the complainants are
seeking to have imposed on the transaction are dealt with at the end of this section.
2.2. Complaints
The concerns relate to both competition and public interest considerations and have been
categorised as concerns relating to competition in the retail market in South Africa, concerns
regarding the impact on domestic suppliers, and concerns regarding the impact on employment.

PRIVILEGED & CONFIDENTIAL
RBB Economics Page 5
2.2.1. The impact on the domestic retail market
A number of concerns relate to the point that the entry of Wal-Mart into South Africa is likely, as
has been evidenced in other countries, to result in the removal of effective competitors which
would lead to a general increase in the concentration of the retail market, the likely outcome of
which would be lower levels of innovation and consumer choice.
Additionally, the large size of Wal-Mart would act as a significant barrier to entry as new firms
would find it exceptionally difficult to match the economies of scale that Wal-Mart is able to
achieve. This is particularly pertinent as it is likely to hamper the entry of SMMEs and/or HDI
owned firms.
Finally it is alleged that Wal-Mart has a history of anti-competitive practices in several of the
jurisdictions in which it operates and that Wal-Mart is likely to continue such practices in the
domestic market.
2.2.2. The impact on domestic suppliers
The opposing statements suggest that Wal-Mart’s strategy to reduce costs in the supply chain
will result in domestic suppliers being substituted for imported products, resulting in the
foreclosure of domestic suppliers. The statements further claim that, in order to remain
competitive, competitor retailers may have to switch to a similar procurement strategy, thus
causing additional domestic suppliers to foreclose.
A particular concern is raised is in regard to the possibility that Wal-Mart will import food, which
could result in domestic food security in South Africa being exposed to the fluctuations in
international supply and demand. A heavy reliance on imports is claimed also to be likely to
result in the de-industrialization of the manufacturing and processing sectors in South Africa.
The opposing statements also allege that a customer the size and scale of Wal-Mart will
inevitably have a substantial degree of countervailing power in dealing with suppliers. This,
allegedly, will provide it with almost de facto control over even the largest suppliers and enable
Wal-Mart to extract all rents from the supply chain, leaving domestic suppliers with unfair
conditions of trade and unable to maintain any margins. Following from this is the concern that
these profits would be sent offshore. One statement expresses the view that the only way in
which firms can continue to operate and supply Wal-Mart is by ignoring basic labour laws.
The opposing statements claim that the firms which would be most affected by Wal-Mart’s entry
are SMMEs and firms owned by HDIs, combined with the notion that a foreign based firm is
unlikely to have the same incentives as a domestic firm when considering BEE commitments,
makes these points even more concerning in the context of South Africa.
2.2.3. The impact on employment
A major and recurring concern is that of potential job losses within the domestic economy. Such
job losses would follow the foreclosure of retailers and suppliers as the market consolidated and
PRIVILEGED & CONFIDENTIAL
RBB Economics Page 6
retailers moved to sourcing imports. Additionally, there would be job losses as suppliers are
forced to reduce their workforce in an effort to cut costs in order to remain in business.
The notion put forward by the merging parties that the merger will result in the creation of new
jobs, has been met with the concern that any new jobs created by Wal-Mart are likely to be
displaced jobs rather than new jobs. In addition, some concerns mention that even if new jobs
were to be formed, the negative effects of these low paying jobs in the economy are likely to far
outweigh any possible short-term benefits, as these low paying jobs do not drive economic
development.
Wal-Mart’s alleged history of labour law violation has given rise to the concern that a similar
trend might be seen following the acquisition in South Africa. Additionally, there may be a
similar deterioration of terms of employment at competitor retailers as they are forced to adjust
business plans to compete with Wal-Mart. These poor conditions are then seen to result in
greater burdens on public welfare systems.
Additional concerns not noted above include the allegation that Massmart, for several years,
has been ‘grooming’ its business to be more attractive to a takeover by Wal-Mart. Such efforts
include the recent series of retrenchments and the worsening relationship with unions combined
with a deterioration in working conditions.
2.2.4. Summary
In summary the concerns relating to the retail market relate to the effect Wal-Mart will have on
the competition in the industry; through removing competitors and consolidation, through
increasing barriers to entry and by using anti-competitive practices.
Supplier concerns relate to the effect that Wal-Mart’s perceived strategy will have on the
domestic economy as it uses its large size and global procurement network to force suppliers to
either cut costs or go out of business. These concerns are prioritised as they are likely to be
seen to have an effect on SMMEs and firms owned by HDIs.
Employment concerns relate largely to the potential job losses that may occur following the
merger, whether through foreclosure or cost cutting. Additionally, a concern is that those jobs
that do remain, both at the merged entity and its competitors, are likely to see a deterioration of
terms of employment as firms look to become more competitive. This is intensified by the stance
Wal-Mart is seen to take in regards to worker unions.
2.3. Conditions
Many of the opposing statements have also suggested potential remedies in the form of
conditions to be placed on the merger.
The conditions listed by the various parties are extensive and varied. Although some broadly
similar conditions have emerged, one of the most common is a condition that serves to remedy
the concern regarding Wal-Mart’s perceived strategy to source a significant amount of

PRIVILEGED & CONFIDENTIAL
RBB Economics Page 7
procurement through imports, by placing a condition on the merged entity that commits it to a
minimum specified level of procurement of domestically produced and manufactured goods.
Other conditions include:
• A commitment by Wal-Mart to honour current union relations as well as refrain from
preventing or dissuading workers from forming any new such relations and collective
bargaining;
• Those relating to the limitation of the extent of foreign ownership or the form of foreign
ownership of South African firms;
• Requiring foreign firms that do invest in South Africa to have a positive global
reputation;
• Commitments to the quality of goods supplied (referred to as “consumer protection
mechanisms”);
• That the merger does not result in job losses or failed firms;
• That there be no downward variation in terms of employment;
• The requirement that Massmart pay an equivalent or better wage relative to the industry
average;
• A commitment to procure a certain percentage of goods from SMMEs and HDI owned
firms;
• A commitment to create new jobs;
• Restricting new stores to city outskirts;
• Limiting the scope of expansion, by region, size or acquisition;
• That Massmart provide favourable terms to suppliers;
• Requiring Massmart to ensure overseas suppliers comply with labour laws;
• Preventing the merger for a period of time so that South Africans can have a fully
informed debate;
• Limiting the products Massmart can sell;
• Limiting market shares for specific goods and categories of goods;
• Applying something similar to the UK Supermarkets Code of Practice and an
ombudsman to oversee the implementation;
• Prohibiting retailers from direct dealings with producers;

PRIVILEGED & CONFIDENTIAL
RBB Economics Page 8
• Prohibiting of below-cost selling;
• A requirement that the merged firm accept ”joint–liability” with its suppliers for
compliance with labour laws “where the cost of the contract would not allow wages and
benefits sufficient to comply” with labour law;
• A commitment by Wal-Mart to the “four core conventions of the ILO”, namely prohibition
of child labour, prohibition of forced labour, non-discrimination and freedom of
association;
• The suspension of the new performance management systems until there has been an
informed and agreed upon discussion, and;
• A requirement that the merged firm develop programs to allow local suppliers to export
through Wal-Mart’s global distribution network.
Finally, a common condition suggested relates to regular monitoring and enforcement
mechanisms, such as requiring Wal-Mart to report to the Competition Commission on a
scheduled basis, providing it with all relevant data, supplier locations, breakdowns of domestic
procurement etc.

PRIVILEGED & CONFIDENTIAL
RBB Economics Page 9
3. Competition
3.1. Overview
As well as claiming that the transaction will have adverse effects on the public interest, the
complainants have additionally alleged that there will be various adverse effects on competition.
However, all mainstream competition concerns arising from mergers rely either on the merger
creating market power where none previously existed or, as a minimum, on one or other of the
merging parties enjoying pre-existing market power in one or more of the relevant markets in
which they operate.
In this section a standard competition assessment is undertaken to establish that Massmart
does not enjoy a position of market power in any of the wholesale markets in which it operates,
nor in any of the retail markets in which it operates. It further explains that the lack of any
overlap in the activities of the parties within South Africa means that the transaction is incapable
of creating market power where none previously existed.
A number of the alleged competition concerns raised by the complainants are non-standard
competition concerns which do not rely on the pre-existence or creation of market power. In
essence, these concerns all rest on the claim that the transaction will give Massmart an
overwhelming efficiency advantage over its wholesale and retail rivals in the procurement of
goods in international markets. These non-standard competition concerns and the efficiencies
that lie at the heart of them are discussed in Section 6.
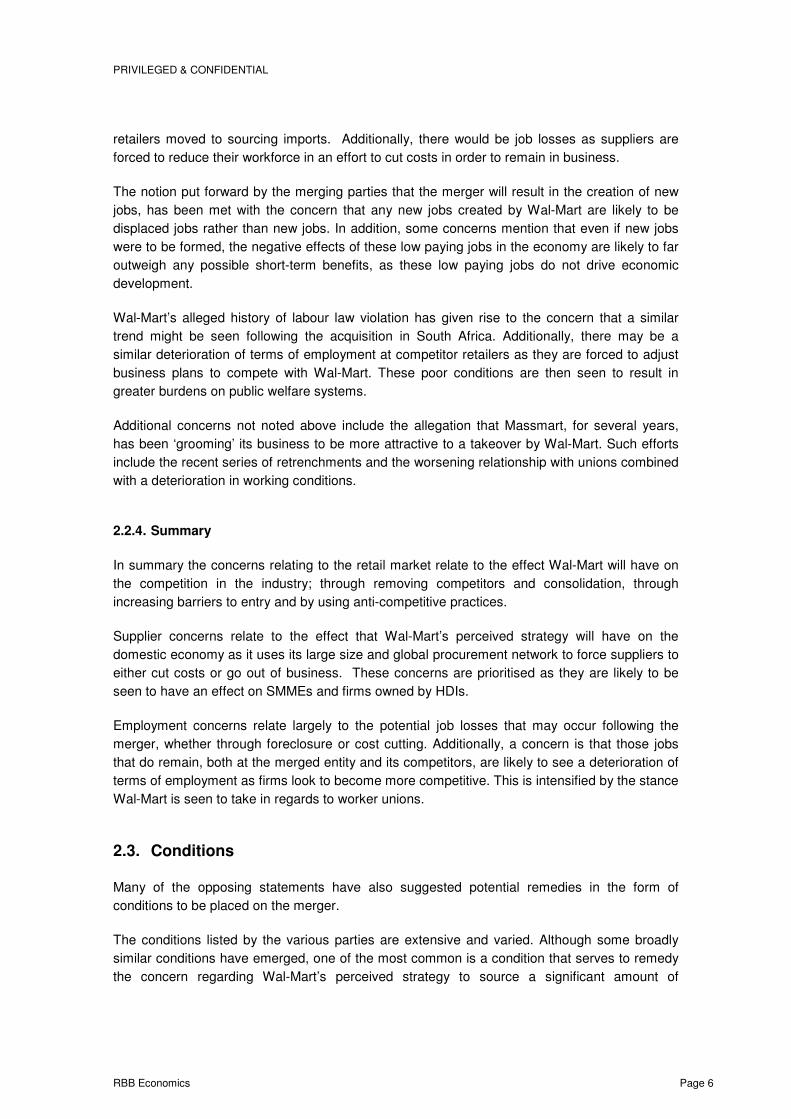
3.2. Wholesale Competition
Even if the many small independent wholesalers are excluded from the wholesale food market,
Massmart has a national share of just 22.4%, making it the second largest wholesaler after
Metcash.1 Massmart also faces competition from three other sizeable wholesale chains in the
form of IBC, Elite Star, and ICC (see Table 1). On the basis of these shares it would be difficult
to argue that Massmart enjoyed market power in the wholesale supply of food.
1 The Massmart share of 22.4% is comprised of the Masscash food wholesale share of 14.0% and the Makro food wholesale share of
8.4%.
PRIVILEGED & CONFIDENTIAL
RBB Economics Page 10
Table 1: Food wholesale shares in South Africa, 2009
Company Sales (in R billions) Share
Metcash 17.0 23.8%
Massmart 16.0 22.4%
IBC 13.0 18.2%
Elite Star 12.0 16.8%
ICC 10.0 14.0%
Africa 3.5 4.9%
Total 71.5 100.0%
Source: Massmart estimates and BMI Nielsen data
3.3. Retail Competition
At a retail level, Massmart is active in a number of categories, notably food, general
merchandise, liquor, and home improvement and building products. Its position in each of
these markets is set out in Table 2 to Table 5 below.
Table 2: Formal food retail shares in South Africa, 2009
Company Sales (in R billions) Share
Shoprite 45.7 33.3%
Pick ‘n Pay 43.0 31.3%
Spar 30.9 22.5%
Woolworths 14.8 10.8%
Massmart 3.0 2.1%
Total 137.4 100.0%
Source: Massmart estimates and Nielsen data
As can be seen from Table 2, even if confined to the main formal retail chains, and small and
informal food retailers are excluded, Massmart currently enjoys a national share of just 2.1%.2
Clearly this is insufficient to confer market power.
2 The Massmart share of 2.1% is comprised of the Masscash food retail share of 1.2% and the MDD food retail share of 0.9%.

PRIVILEGED & CONFIDENTIAL
RBB Economics Page 11
Table 3: General merchandise shares in South Africa, 2009
Company Sales (in R billions) Share
Massmart 7.8 17.5%
Shoprite 5.3 12.0%
Pick ‘n Pay 4.9 11.0%
Hi- Fi Corporation 1.8 4.1%
Incredible Connection 1.3 3.0%
Stax 0.2 0.4%
Other 23.2 52.0%
Total 44.6 100%
Source: Massmart estimates and GfK Retail and Technology data
In general merchandise, a core area of its operations, as shown in Table 3, Massmart is the
market leader, but with a national share of just 17.5%.3 In this category it faces competition
from two similarly sized and widely present rivals in Shoprite and Pick ’n Pay, with 12.0% and
11.0%, respectively, as well as a huge number of independent retailers. Even in this core area
of its operations, the Massmart share is well below the level normally seen as conferring
significant market power.
3 The Massmart share of 16.5% is comprised of the Game share of 12.0%, the Makro share of 4.0%, and the Dion Wired share of 0.4%.

PRIVILEGED & CONFIDENTIAL
RBB Economics Page 12
Table 4: Liquor shares in South Africa, 2009
Company Sales (in R billions) Share
Massmart 4.4 16.5%
Spar Tops 4.0 15.0%
Pick ‘n Pay 1.4 5.3%
Ultra 1.3 4.9%
Metcash 1.2 4.5%
Picardi Rebel 0.8 3.1%
Shoprite 0.7 2.6%
Other 12.8 48.1%
Total 26.7 100%
Source: Massmart estimates and Nielsen data
In the supply of liquor, Massmart is the largest supplier, with a national share of 16.5%.4 In this
area of its operations it faces competition from a similarly sized rival in SPAR, with a share of
15.0%, an array of other national retailers, such as Pick ‘n Pay and Shoprite, and a large
number of independents. As in its other areas, the Massmart share is below the level normal
seen as conferring significant market power.
4 The Massmart share of 16.5% is comprised of the CBW share of 8.6% and the Makro share of 7.9%.

PRIVILEGED & CONFIDENTIAL
RBB Economics Page 13
Table 5: Home improvement shares in South Africa, 2009
Company Sales (in R billions) Share
Massmart 6.9 16.5%
Cashbuild 5.0 12.0%
Illiad 3.9 9.4%
Italtile 2.6 6.2%
Build it 2.4 5.8%
Essential 1.7 4.1%
PG Bison 1.5 3.6%
Mica 1.4 3.4%
Chamberlains 0.8 2.0%
Norcross 0.5 1.2%
Jacks Paint 0.4 0.9%
Hardware Warehouse 0.3 0.8%
DIY Depot 0.3 0.7%
Other 14.0 33.6%
Total 41.7 100%
Source: Massmart estimates and Massbuild Strategy Document 2010
Finally, in home improvement and building supplies, Massmart is once more the leading
supplier with 16.5%, but faces similarly-sized competition in the form of Cashbuild, with 12.0%,
more than half a dozen competitors with shares between 2.0% and 10.0%, and a long tail of
smaller chains and independents.
3.4. Provincial Competition
It might be argued that whilst its national shares do not confer market power, this may mask
pockets of localised market power in areas where its share is significantly higher than its
national share. However, with national shares in the range of 2.1% to 22.4%, it is evident that in
the vast majority of areas its regional shares will be substantially less than the levels at which
concerns arise regarding the degree of market power held. Consequently, if any areas were to
exist in which Massmart enjoyed localised market power, they are likely to be extremely few in
number.

PRIVILEGED & CONFIDENTIAL
RBB Economics Page 14
With a national formal food retail share of just 2.1% it is self-evident that Massmart is extremely
unlikely to have a significant market share in any province. Moreover, estimates of its provincial
shares in each of the other product categories indicate that there are no product categories and
provinces in which Massmart holds a provincial share in excess of 35.0% (see Table 6).5
Table 6: Massmart shares by province, 2009 to 2010
Province Wholesale food
General
merchandise Liquor Home improvement
Eastern Cape 32.8% 10.8% 23.2% 15.2%
Free State 34.7% 11.1% 18.1% 13.0%
Gauteng 25.0% 24.4% 17.6% 20.3%
Kwa-Zulu Natal 24.8% 17.3% 23.6% 12.6%
Limpopo 9.2% 8.5% 6.5% 11.6%
Mpumalanga 13.2% 12.2% 10.9% 8.0%
Northern Cape 20.8% 12.1% 8.8% 10.5%
North West 15.2% 12.5% 17.6% 10.6%
Western Cape 16.9% 17.6% 9.5% 21.5%
Total 22.4% 17.5% 16.5% 16.5%
Source: RBB calculations from Massmart share estimates
3.5. Absence of Overlap
On the basis of these data, it is clear that Massmart does not currently enjoy significant market
power in any category of products either at the wholesale level or at the retail level, and that this
conclusion is valid whether the markets are considered at a national level or at a provincial
level. Nevertheless it is possible that a merger involving Massmart could create market power
where none previously existed if there was a material overlap between the activities of
Massmart and those of its merger partner.
However, aside from the presence of a small fruit-buying business, operated by Asda, the UK
subsidiary of Wal-Mart, which is purchasing exclusively for export, Wal-Mart has no presence in
South Africa. The transaction will therefore not result in any horizontal or vertical overlap in the
5 The wholesale food shares were estimated by taking the Massmart estimate of its provincial shares of total food sales and assuming
the same ratio of its total food sales share to its wholesale food sales share in each province as is seen when comparing its national
total food sales share (6.1%) to its national wholesale food sales share (22.4%). For example, its total food sales share in the Eastern
Cape is 8.9%. Applying the 6:22 ratio between wholesale food share and total food share seen at a national level to its Eastern Cape
total food shares indicates a wholesale food share in the province of 33%.
PRIVILEGED & CONFIDENTIAL
RBB Economics Page 15
parties’ activities within South Africa and therefore cannot result in any augmentation of the
market shares enjoyed by Massmart, nor any increase in the extent of its market power.
3.6. Consumer Welfare
A standard merger analysis has as its focus the effect of the transaction on consumers, most
notably its impact on the prices that they may be expected to pay for goods and services after
the merger. Even if, as a policy matter, one were to regard its impact on total welfare as the
standard by which a merger should be judged, including its impact on shareholders, suppliers,
and workers, impacts on consumers would still remain an important, and generally substantial,
part of that total welfare calculation.
The opposing statements are focussed almost exclusively on the transaction’s alleged impact
on suppliers and workers, with only a cursory treatment of its effect on consumers.
Nevertheless, even if the transaction was to give rise to some element of the claimed harm to
producer groups (i.e. suppliers and workers), it would be necessary for those adverse effects to
be weighed against the consumer benefits arising from the merger.
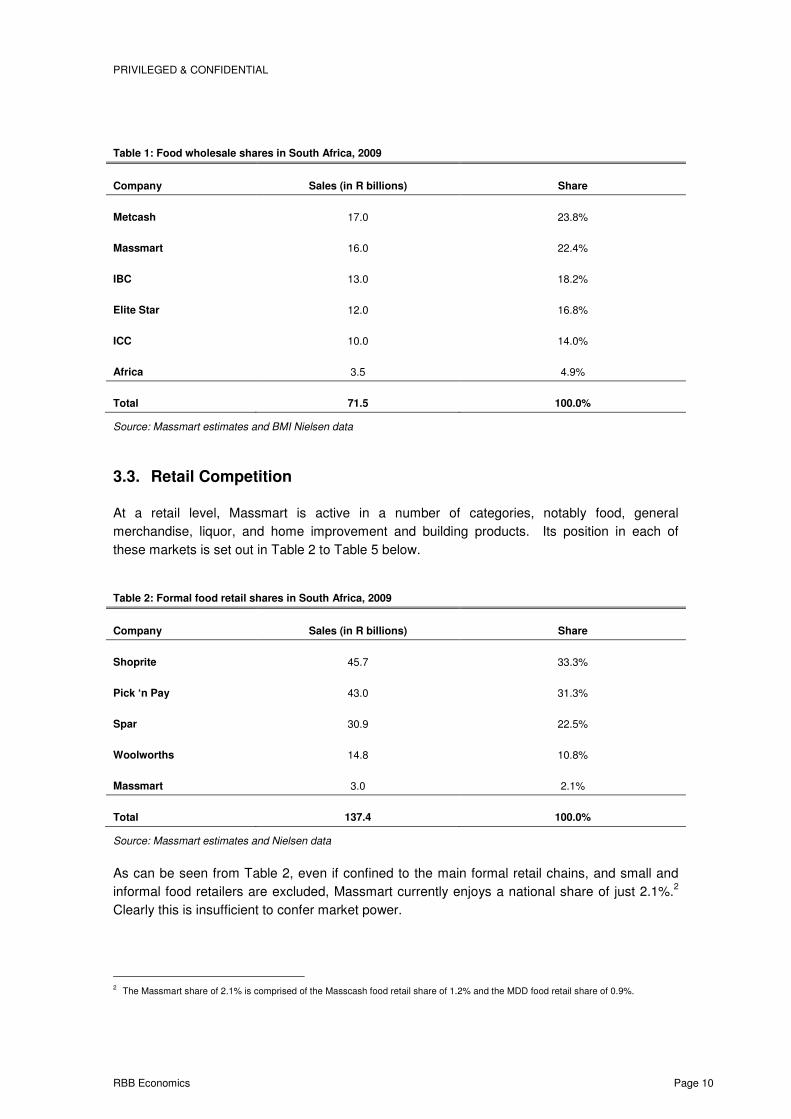
Evidence from Wal-Mart’s operations elsewhere supports the view that the entry of Wal-Mart
into a market results in lower prices for consumers. In Chile, the pricing team at Wal-Mart
analyses the prices of 2,000 items each week, using third-party pricing information obtained
from Nielsen. At the time of acquisition in January 2009, prices in the acquired stores were
around 1% lower than the market average. They are currently 5% lower than the market, with
plans to increase that differential to 8% by 2014.6 The evolution of the price index used by Wal-
Mart to track its pricing performance is shown in Figure 1.
6 The phenomenon of Wal-Mart stores pricing at levels significantly lower than the market is widespread. For example, prior to its
acquisition by Wal-Mart in 2004, prices at the Brazilian retailer Bompreço were 3% higher than the market for a basket of 3,000 top-
selling items. However, an equivalent basket of items in Bompreço is now 3.1% lower than the market average. Similarly, prior to its
acquisition by Wal-Mart in 2005, prices at Brazilian retailer Sonae were around 3% lower than the market average, but are now around
3.45% lower. Furthermore, price gaps have reached 8.8% for Bompreço and 6.5% for Sonae in April 2009 and July 2009,
respectively, and we understand that the price gaps in January 2011 were lower than those that have typically prevailed since Wal-
Mart’s entry (i.e. in the region of 5-10% below the market average). Indeed, as at March 2011, the price gaps at Bompreço and Sonae
had returned to 6.0% and 4.6%, respectively. Another example is Mexico where prices at Wal-Mart stores are currently 8% lower than
the market, with the impact which Wal-Mart has had on pricing in Mexico recognised in a 2007 Wall Street Journal article, “Southern
Hospitality: In Mexico, Wal-Mart Is Defying Its Critics – Low Prices boost Its Sales and Popularity in Developing Markets”.

PRIVILEGED & CONFIDENTIAL
RBB Economics Page 16
Figure 1: Price index evolution in Chile, 2008-2010
91
92
93
94
95
96
97
98
99
100
Jan Feb Mar Apr May Jun Jul Aug Sep Oct Nov Dec
2008 2009 2010
Source: Wal-Mart
By way of illustration of the pricing of its goods within a specific category, the evolution of the
prices of dry grocery and consumable products in Wal-Mart stores in Chile and that of the prices
of its main rivals are shown in Figure 2, which is drawn from a pricing presentation prepared for
Wal-Mart Chile by Nielsen for use in the ordinary course of business. The two Wal-Mart formats
included in the price comparison are its hypermarket format, Cuidades Lider, and its
supermarket format, Lider Express, shown in blue and light blue, respectively. Formats of four
of its major rivals are shown in black, red, light green and dark green.

PRIVILEGED & CONFIDENTIAL
RBB Economics Page 17
Figure 2: The evolution of dry grocery and consumables pricing in Chile following the entry of Wal-Mart
Source: Nielsen Chile
As can be seen, at the time of the acquisition of D&S by Wal-Mart, Cuidades Lider and Lider
Express were pricing at the bottom of the range of prices for the group, but broadly in line with
their main rivals. However, towards the end of 2009 prices at the Wal-Mart formats began to fall
at a faster rate than their competitors. The price gap that opened up has been maintained.
Wal-Mart Chile has also actively sought to expand the range of private-label products available.
These products are particularly popular with lower income consumers as they are typically
cheaper than their branded equivalents, but enjoy the same quality assurance because of their
association with trusted retailers. The price competitiveness of Wal-Mart stores in Chile has
also been highlighted in the press, with local newspapers recently comparing the prices of a
basket of “back-to-school” goods across a range of retailers, and finding that the complete set of
goods was $4 cheaper at Wal-Mart than elsewhere.
Moreover, when consumers themselves have been permitted to express a view, there has been
found to be a high level of popular support for Wal-Mart and the low prices which it is able to
offer to consumers. For example, although Wal-Mart had obtained all of the necessary
municipal permissions required to open a new store in the Argentinean town of Bariloche, its
application was rejected by the city council. However, in January 2008, in a subsequent
community referendum, over 85% of voters on a turnout of 40% voted in favour of a Wal-Mart
store.
In South Africa, the Competition Commission has expressly recognised the significant
contribution which lower prices for food and basic commodities can have on the welfare of the
poorest consumers. For example, in discussing its choice of agro-processing as one of four
priority areas for investigation, the Competition Commission noted that:

PRIVILEGED & CONFIDENTIAL
RBB Economics Page 18
“...[t]hese industries are particularly important because of the value adding activities
and employment involved as well as the fact that they produce essential products
bought by all consumers, including the poor”.7
Moreover, in highlighting the importance of addressing anti-competitive conduct in the supply of
food stuffs, as part of its 10 year review of the current competition regime, the Competition
Commission stated that:
“...[t]he importance of affordable food to poor consumers and the high levels of poverty
in South Africa mean this has had a particularly negative impact on welfare”.8
The substantial consumer welfare benefits from greater access to lower cost food stuffs and
basic commodities, as recognised in the quotations from the Competition Commission, is well
summarised by the mayor of the Mexican town of Los Cobos, whom the Wall Street Journal
cited as saying:
“I can understand that some businesses might be hurt by Wal-Mart, but the fact is that
the people here want it. It increases the purchasing power of people with very little
money.”
The evidence supporting Wal-Mart’s view that the merger will be to the substantial benefit of
consumers is overwhelming. In line with this, the Commission, in its recommendation, found
that “it is generally accepted (even by those opposition [sic] the transaction) that Wal-Mart’s
entry to South Africa will enhance competition and result in consumer benefit. Wal-Mart ...
prices very competitively”9. The Commission later concluded that the “merger will result in
responsible competition which will likely lead to the benefit of consumers in general”.10
Even in the opposing affidavits filed in these proceedings, the existence of those consumer
benefits is accepted. Indeed, it is a fundamental premise of most of the propositions put
forward in the opposing statements that Wal-Mart will secure lower prices for its inputs than its
smaller South African competitors can achieve and that this cost advantage will be used to
charge lower prices to customers, with which those same South African competitors will be
unable to compete.
The significant consumer welfare benefits associated with the merger must be properly
assessed against any potential adverse effects of the transaction, and should not be dismissed
lightly, particularly where the potential effects identified are so speculative in nature.
3.7. Conclusion
In summary, Massmart has a pre-existing position in a number of wholesale and retail markets
across a range of product categories. However, in none of those markets does it hold a position
of significant market power and in most cases its market shares are well below the levels at
7 See http://www.compcom.co.za/food-agro-processing-and-forestry.
8 See Unleashing Rivalry: ten years of enforcement by the South African competition authorities.
9 Commission’s recommendation, p. 22
10 Commission’s recommendation, p. 23
PRIVILEGED & CONFIDENTIAL
RBB Economics Page 19
which such concerns may arise. In addition, the transaction will not result in any horizontal or
vertical overlap in the parties’ activities within South Africa and therefore cannot result in any
addition to the market shares currently enjoyed by Massmart or any increase in the extent of its
market power in those markets. As such, no standard competition concerns can arise from the
transaction.
Furthermore, although the primary mechanism by which much of the alleged harm that the
opposing statements suggest will arise from the transaction is the result of Wal-Mart charging
significantly lower prices for food and household consumables, almost no weight is given to the
considerable welfare benefits which those lower prices will bring to consumers. It is clear that
any consideration of the transaction must consider the benefits which those price reductions will
bring, especially to poorer consumers, in light of the benefits which Wal-Mart’s entry has
brought to similar consumers in other countries. Moreover, near-certain benefits must logically
be accorded greater weight than speculative harm.

PRIVILEGED & CONFIDENTIAL
RBB Economics Page 20
4. Counterfactual Conduct
4.1. Overview
All mergers must be assessed against the situation that would have prevailed in the absence of
the merger. This means forecasting the post-merger conduct of the merged entity and
comparing it to the forecast conduct of the merging firms in the event that the merger were not
to proceed (i.e. the counterfactual). A comparison of the forecast post-merger situation with the
forecast counterfactual allows one to isolate the incremental impact of the merger. It is based
on this comparison that a view must be taken as to the merger’s competition or public interest
merits.
In some cases the relevant counterfactual will be the continuation of the existing state of affairs,
but in others it will not. In this case, whilst in some areas, such as procurement, the current
position is likely to constitute a reasonable counterfactual to the merger, in other areas, such as
food retailing, the current position is likely to constitute a poor counterfactual. This is because
Massmart has well developed plans for the future that will involve significant changes to the
nature and scope of its current food retail operations, regardless of whether or not the
transaction takes place. In addition, there are trends at work in the market which will continue
with or without the merger.
The remainder of this section discusses the likely future conduct of Massmart in the absence of
the transaction, so as to establish the relevant counterfactual against which the impact of the
merger may be assessed. This is important as many of the complaints levelled against the
merger are actually complaints about future changes to the Massmart business model and
trends in the market that will occur regardless of the merger, and which are therefore irrelevant
to the assessment of it.11
4.2. Procurement
One of the key issues raised in the opposing statements is the impact which the acquisition by
Wal-Mart will have on Massmart’s procurement patterns. The determinants of current
procurement patterns and how these might be changed by the merger are discussed in Section
5. However, as background to that discussion, this section describes Massmart’s current
procurement patterns, so as to establish the relevant counterfactual to its post-merger conduct.
4.2.1. Local and international procurement
In order to calculate the proportion of products which are locally procured and those which are
directly imported, Massmart has been through its entire supplier list and identified each supplier
as either local or non-local. Local suppliers may be either those supplying locally produced
goods or those acting as agents or subsidiaries of international suppliers. Non-local suppliers
11
Insert references to non-merger-specific complaints.

PRIVILEGED & CONFIDENTIAL
RBB Economics Page 21
are international suppliers from whom Massmart imports directly. Drawing on the results of this
analysis, Table 7 shows the proportion of Massmart’s grocery purchases that is locally procured
and the proportion that is imported directly, broken down by product category.
Table 7: Massmart procurement of grocery, in Rand, July 2009 to June 2010
Category Total value Locally Procured Local % Direct Imports Import %
Food products 9,362,204,558 9,359,058,231 99.97% 3,146,327 0.03%
Beverages 6,160,093,897 6,152,020,827 99.87% 8,073,070 0.13%
Packed food & meat 2,495,528,717 2,495,528,717 100.00% 0 0.00%
Tobacco 1,473,256,159 1,464,133,627 99.38% 9,122,532 0.62%
Non-edible grocery 1,726,335,852 1,726,335,852 100.00% 0 0.00%
Personal products 2,013,467,381 2,013,467,381 100.00% 0 0.00%
TOTAL 23,230,886,565 23,210,544,635 99.91% 20,341,930 0.09%
Source: Massmart
As can be seen, virtually all (99.91%) of Massmart’s groceries are procured locally. The grocery
category with the highest level of direct imports is tobacco, and even in this category direct
imports account for less than 1% of all purchases.
Similarly, Table 8 shows the proportion of Massmart’s general merchandise purchases that is
locally procured and the proportion that is imported directly, broken down by product category.

PRIVILEGED & CONFIDENTIAL
RBB Economics Page 22
Table 8: Massmart procurement of general merchandise, in Rand, July 2009 to June 2010
Category Total value Locally Procured Local % Direct Imports Import %
Household 2,954,663,764 2,795,784,381 94.62% 158,879,383 5.38%
Electronics 4,183,095,032 4,124,412,052 98.60% 58,682,979 1.40%
Photographic 346,207,051 346,207,051 100.00% 0 0.00%
Furnishing 76,802,666 58,165,566 75.73% 18,637,101 24.27%
Homebuilding 5,918,048,093 5,500,525,882 92.94% 417,522,211 7.06%
House wares 3,214,546,594 3,093,050,726 96.22% 121,495,868 3.78%
Leisure 2,031,558,062 1,414,726,737 69.64% 616,831,325 30.36%
Apparel/Luxury 228,798,278 225,652,525 98.63% 3,145,753 1.37%
Footwear 34,125,152 34,125,152 100.00% 0 0.00%
TOTAL 18,987,844,692 17,592,650,072 92.65% 1,395,194,620 7.35%
Source: Massmart
It can be seen from the above table that over 90% of general merchandise is procured in South
Africa, with less than 10% directly imported. The only sub-categories for which direct imports
account for more than 10% of purchases are leisure goods (30.36%) and home furnishing
(24.27%).
These data indicate that where the underlying economics of direct importation are favourable
compared to domestic procurement, Massmart is willing and able to import directly into South
Africa, as it currently does with around one-third of its leisure goods and with over R1.4bn of
goods in total. However, they further show that in most cases the underlying economics of
direct importation are not favourable as compared to procurement from domestic suppliers.
4.2.2. Local and international content
In many cases, while the supplier of the product is based locally, the products themselves have
significant import content. In other words, the local supplier acts as an assembler of imported
components or a stock-holder and distributor of imported items wholly manufactured abroad
(i.e. as intermediaries). Although it is not possible to calculate the import content of all of
Massmart’s purchases from local suppliers, Massmart has estimated the import content of its
purchases from its largest local suppliers of general merchandise, liquor, and food. The
suppliers covered account for 40.5% of all local general merchandise purchases, 91.2% of all
local liquor purchases, and 58.5% of all local food purchases.
A domestically procured item has been classified as imported where the Massmart merchant
believes that more than half the value of the product derives from components that have been
wholly or largely imported. On the other hand, where the Massmart merchant believes that

PRIVILEGED & CONFIDENTIAL
RBB Economics Page 23
more than half the value of the product derives from local value added activities, such as
assembly, sorting, blending or packing, then the item is classified as of local origin. Local value-
added services in the form of distribution, sales and marketing, and after-sales service are not
included, so as to identify as locally produced only those goods to which local businesses have
contributed more than half of the value of the production process. Table 9 presents the results
of the exercise carried out.
Table 9: Estimated import content of products supplied by largest local suppliers, July 2009 to June 2010
Value (R) Local Content (R) % Local Import Content (R) % Import
Top 20 GM 7,152,669,212 2,489,971,650 34.8% 4,662,697,563 65.2%
Top 7 Liquor 3,683,234,086 2,740,070,143 74.4% 943,163,943 25.6%
Top 20 Food 10,610,856,970 10,072,396,320 94.9% 538,460,650 5.1%
Group Total 21,446,760,268 15,302,438,113 71.4% 6,144,322,155 28.6%
Source: Massmart
It is estimated that the top 20 suppliers of general merchandise have a relatively large
proportion of import content at 65.2% of value, compared with a much smaller proportions of
25.6% of value when looking at the import content of the top 7 suppliers of liquor and of 5.1% of
value when considering the top 20 suppliers of food. Therefore, while direct imports are small,
Massmart currently sources products locally that have a relatively substantial proportion of
imported content, especially in general merchandise and, to a lesser degree, liquor. In contrast,
locally procured food, which is virtually all of the food procured by Massmart, has only a small
import component.
It is evident from these data that, while Massmart can import, it strongly favours domestic
procurement, largely for the sound economic reasons set out in sub-section 5.2.3. Equally, the
data show that the import content of goods sold by Massmart is high in certain categories of
goods. Consequently, South African producers are therefore already exposed to international
competition. However, the international competition faced by local firms does not arise in
relation to direct supply to wholesale and retail businesses, for which they are generally in
competition with other local firms, but for the supply of components and goods to the South
African manufacturers and intermediaries that supply those businesses.
Only if the acquisition by Wal-Mart were to change the underlying economics of importation or
procurement from domestic suppliers, would the merger result in patterns of procurement that
were different from those seen in the counterfactual situation set out above. Whether, and to
what extent, the Wal-Mart acquisition will change any of the underlying economics of
procurement is discussed in Section 5.

PRIVILEGED & CONFIDENTIAL
RBB Economics Page 24
4.3. Retail Operations
4.3.1. Market-wide trends
Traditionally, low income areas within South Africa have been largely served by small and
informal retailers who have principally obtained their goods from cash and carry wholesalers.
However, with the exception of Woolworths, all of the major grocery chains active in South
Africa have started extending their store networks into areas previously primarily served by
independents, spazas, and hawkers, using both their pre-existing store brands and formats (e.g.
Shoprite/Checkers) and sub-brands and formats targeted specifically at lower income
consumers (e.g. the Boxer brand used by Pick & Pay).
The impact of this expansion by the formal retail chains can be seen clearly in the Neilsen and
Bureau of Market Research (BMR) data. This data can be used to track the share of national
food retail sales made to customers by different types of retailer and by LSM. Notably, the share
of sales made to LSM 1 to 4 (i.e. the poorest consumers) by branded retailers rose from 33.9%
in 2007 to 42.8% by the end of 2008, while over the same period the share of sales to this
group made by independents fell from 64.1% to 54.0%.12
In addition, the share of sales made
by branded retailers to customers in LSM 5 to 6 rose from 60.0% in 2007 to 63.4% by the end of
2008, while the equivalent share of sales made by independents fell from 36.9% to 32.9%. By
contrast, shares of sales made by branded retailers and independents to consumers in LSM 7
to 8 and LSM 9 to 10 were virtually unchanged over this period.13
The decline of the small and informal retail sector is therefore well established. It is a pre-
merger phenomenon. Moreover, it is a trend which has occurred independently of Massmart,
driven largely by the store expansion programmes of the established formal retail chains in
response to the commercial opportunities presented by the normalisation of the trading
environment and rising incomes in the areas previously served primarily by informal retail.
As shown in Figure 3, a reduction in the overall share of economic activity undertaken within the
informal sector – of which informal retail is a major component - is an inherent feature of
economic development, with the share of activity undertaken in the informal sector falling as
income levels rise.
12
These are RBB calculations based on data from Nielsen and BMR. The balance of sales was made by wholesalers, who accounted
for between 3% and 5% of retail food sales to all LSM groups in all periods. 13
The share of sales made to consumers in LSM 7 and 8 by branded retailers changed only marginally from 73.6% to 74.4%, as did that
by independents, falling from 21.8% to 21.5%. In LSM 9 and 10 the equivalent share changes were equally trivial rising from 80.9% to
81.3% for branded retailers and rising from 14.0% to 14.4% for independents.

PRIVILEGED & CONFIDENTIAL
RBB Economics Page 25
Figure 3: The relationship between informal sector employment and per capita GDP
HTI
IND
HND
BOL
IDN
GTM
ECU
PER
DOM
EGY
SLV
PRY
COL
THA
CRI
VEN
BRAMEX
CHL
ARG
RUS
0
10
20
30
40
50
60
70
80
90
100
500 2000 3500 5000 6500 8000 9500 11000
Pa
rtic
ipa
tio
n o
f th
e in
form
al
em
plo
ym
en
t in
th
e t
ota
l em
plo
ym
en
t
Real GDP per capita in US dollars with Power Purchase Parity (PPP)
Source: OECD 2009
Consequently, the decline in informal retailing is a phenomenon which one would expect to see
continue as the South African economy continues to grow and incomes rise.
4.3.2. Massmart strategy
Notwithstanding the expansion programmes of most of the organised retail chains, Massmart
believes that it has identified a commercial opportunity to expand its own retail network in low
income areas. Specifically, whereas the major retail chains have an 80% share of the grocery
purchases of consumers in LSM categories 7 to 10, they have a share of only 60% of the
purchases of consumers in LSM categories 1 to 6. With 40% of this segment served by
independent and informal retail, Massmart believes that there is an opportunity to consolidate
many of these independent retailers into a new retail chain focussed on serving the needs of
consumers in LSM categories 2 to 6.
It is envisaged that this new retail chain will operate under the Cambridge brand, with sub-
brands for different store formats. It is planned that the network will comprise stores located
close to major transport nodes to facilitate their use by commuters and those without their own
transport. It is further intended that the stores will be able to cater to a range of shopping

PRIVILEGED & CONFIDENTIAL
RBB Economics Page 26
missions, including the purchase of ready-meals, top-up shopping trips, weekly or monthly
shops, as well as the replenishment of stocks by hawkers and spazas.14
Massmart will seek to position its stores as consistently low-priced. This will involve the use of
an EDLP (everyday low price) strategy, which minimises the use of costly promotions and
avoids the volatile pricing patterns that result from promotions-based pricing. Its price
proposition will be underpinned by offering the lowest prices on known value items (KVIs),
notably cooking oil, mealie meal, flour, rice and frozen chicken. It is hoped that the exceptional
value offered by the pricing of KVIs will drive traffic into the stores, which will translate into
additional sales of higher margin products such as perishables and those items sold within high-
value added service departments, such as the butchery, bakery, deli, and greengrocery.
The presence of these service departments will also improve the nature of the offer available to
low income customers and differentiate the Cambridge stores from the equivalent stores of the
major retail chains, who have packaged groceries at the core of their offer. The aggressive
promotion of own-label products alongside their branded equivalents will also help to
differentiate the stores, as well as providing a higher margin stream of sales for the business
and acting as a source of countervailing power to the branded suppliers.
Private-label will also provide an enhanced opportunity for smaller suppliers to grow on the back
of Massmart private-label volumes, without having to invest substantial amounts to develop,
build and promote brands of their own, and without having to secure their own distribution
networks. Deliveries to the stores will take place via small and frequent deliveries from regional
delivery centres rather than relying on direct deliveries from suppliers, which are not well suited
to the size and locations of the planned stores.
Massmart is aiming to secure a turnover of R10bn by June 2015. On the basis of BMR
estimates, the total food market in South Africa, including liquor and tobacco, but excluding
VAT, is around R227bn. Of this, it is estimated that consumers in LSM categories 1 to 6
account for half of this revenue, or an estimated R114bn. Of this, major retailers are currently
estimated to account for R62.7bn (55%) and independents for R51.3bn (45%).15
The Massmart
target of R10bn would therefore require it to win an 8.8% share of food sales to its target
demographic (i.e. LSM 1 to 6).
If all of this were won at the expense of the major retailers it would result in their share of sales
to LSM 1 to 6 falling from 55% to 46.2%. Conversely, if it were all won at the expense of
independents, it would result in their share of sales to LSM 1 to 6 falling from 45% to 36.2%. If,
as Massmart currently assumes, half is won from majors and half from independents, their
shares of sales to LSM 1 to 6 would fall to 50.6% and 40.6%, respectively.
14
Massmart sees spazas and hawkers as customers rather than competitors, even for its retail businesses, as spazas and hawkers are
serving a market in which convenience is the primary driver and are therefore making sales which Massmart outlets would be unlikely
to be able to make and from which it would not benefit if it were not supplying the hawkers or spazas serving those markets. 15
The share of LSM 1-6 spend accounted for by major and independent retailers has been estimated from their respective shares of
LSM 2-6 spend as data specifically relating to LSM 1-6 was not available. However, based on information that is available, the share
of spend of LSMs 1 to 6 accounted for by major retailers would have to lie somewhere between 42.8% (the share of spend of LSMs 1
to 4 accounted for by the major retailers) and 63.4% (the share of spend of LSMs 5 and 6 accounted for by major retailers).
Accordingly, an estimate of 55% is unlikely to be far from the true value.

PRIVILEGED & CONFIDENTIAL
RBB Economics Page 27
4.4. Conclusion
The existing procurement patterns of Massmart indicate that where the underlying economics of
direct importation are favourable, Massmart is willing and able to import directly into South
Africa, as it does with significant amounts of leisure goods. However, for a range of reasons,
which are explored more fully in sub-section 5.2.3, in most cases Massmart chooses to source
its goods from the domestic suppliers. Whether those domestic suppliers are supplying
domestically produced goods or goods which have been largely or wholly imported is
determined by a range of factors, which vary from one product category to another. Notably,
food is almost wholly sourced from domestic producers, whereas general merchandise is
sourced from domestic suppliers who are largely obtaining their components or finished goods
from non-domestic sources.
As regards food retailing, low income areas within South Africa that have been traditionally
served by small and informal retailers are seeing increasing penetration by the formal retail
chains and this is set to continue. This has consequently led to a decline in informal retailing,
most notably amongst consumers in LSM 1 to 4 and LSM 5 to 6. Notwithstanding the
expansion of the main formal retail chains, Massmart intends to continue to expand its own
retail network in low income areas, and would do so with or without its merger with Wal-Mart.

PRIVILEGED & CONFIDENTIAL
RBB Economics Page 28
5. Suppliers and Buyer Power
5.1. Overview
Many of the allegations made in the opposing statements rest on the assertion that the
transaction will result in a significant increase in the buying power enjoyed by Massmart by
virtue of it joining a business group making purchases on a scale far greater than Massmart and
far greater than any other South African wholesaler or retailer.
It is further asserted that this enhanced buyer power will allow Massmart to access goods in
international markets at lower prices than it, or any other South African retailer or wholesaler,
currently obtains. The alleged consequence of this is that many South African suppliers to
Massmart will be displaced by international suppliers whose prices they cannot match, that
many other South African suppliers will be forced to reduce their margins to match the prices
available to Massmart internationally, and that other South African wholesale and retail
businesses will have to switch to cheaper international suppliers or obtain lower prices from
their South African suppliers in order to compete with Massmart.
These broad brush allegations make a number of very strong assumptions about the
determinants of buyer power, the way in which these will be changed by the transaction and
about the range of suppliers affected by any such changes in buyer power. It makes further
assumptions about the impact of these changes on other retailers and their responses to them.
In many cases the implied assumptions and economic reasoning deployed is flawed and in
some cases contradicts the implied assumptions and economic reasoning underlying other
aspects of the complaints. Nowhere do the claimants provide systematic or empirical evidence
in support of their claims.
This section attempts to unpack the theoretical allegations made in the opposing statement in
this regard. This is done by setting out at a theoretical level the determinants of buyer power
and how those determinants may be changed by the merger, taking into account the innate
advantages of domestic suppliers and distinguishing between the likely impact on international
suppliers and the impact on domestic suppliers. Empirical evidence on the extent to which the
anticipated changes in buyer power may be expected to give rise to changes in procurement
patterns is analysed by looking at the impact on procurement patterns of the Wal-Mart
acquisition of D&S in Chile and the degree of stability in the procurement patterns of Massmart
over time.
In addition, the section considers how Wal-Mart might be expected to impact on the sales and
profitability of South African suppliers. It considers, in this regard, Wal-Mart’s policy of working
closely with its suppliers to reduce their costs of dealing with Wal-Mart and increase their sales.
The potential benefits that this may bring by way of increased export opportunities are also
discussed. Empirical evidence on the degree to which the sales and profits of domestic
suppliers may be affected by the transaction is explored by considering how Wal-Mart has
impacted on the sales and profitability of its Chilean suppliers subsequent to its acquisition of

PRIVILEGED & CONFIDENTIAL
RBB Economics Page 29
D&S. Additional evidence on its relationship with its suppliers in Chile is provided by an
independent supplier survey conducted by Advantage with Chilean suppliers.
Impacts on wholesale and retail competitors and their responses to the enhanced competition
that Wal-Mart will bring to the market and any other consequences that it may have for
wholesale and retail competitors, such as the alleged impact of the “waterbed effect”, are
discussed in Section 6.
5.2. Determinants of Buyer Power
5.2.1. Conceptual framework
The opposing statements make much of the buyer power that Wal-Mart has and that Massmart
will acquire by virtue of the transaction, but there is almost no discussion of what is meant by
buyer power or of the extent to which it will change, and, to the extent that it will, which suppliers
will be affected.
In fact, buyer power is merely the strength of the bargaining position of a buyer in its bilateral
negotiations with a supplier. Moreover, as in any bargain, the bargaining position of the two
parties will depend on the extent of the benefits to be gained from agreement and the costs to
each party of failing to agree. Those costs will in turn be a function of the outside options that
each party has available to them in the event that they fail to agree a trade with each other.
In simple terms, the outside option of the buyer will be the price at which the goods it seeks can
be obtained from a third-party seller, net of any difference in the costs of dealing with the two
suppliers. The outside option of the seller will be the margin it can earn from selling those
goods to a third-party buyer, net of any differences in the costs of dealing with the two buyers.
Typically, these prices and costs will be influenced by a range of factors.
The volumes involved are often the most important of these factors when there are economies
of scale in the supply of the goods concerned. This is because failure to secure the order will
mean that the supplier will have higher unit costs than it would otherwise have had (i.e. it will
have to spread fixed costs over a smaller base of sales resulting in lower overall profits).
Conversely, the outside option of the seller is likely to be better than it would otherwise have
been because other suppliers are likely to be willing to offer the buyer prices which reflect the
additional economies of scale they can achieve if they secure the order (i.e. they will be able to
spread their fixed costs over a larger base of sales resulting in higher overall profits).
The merging of the Massmart business into the Wal-Mart business will only enhance the buyer
power of Massmart against its suppliers to the extent that the acquisition changes the outside
options available to Massmart or its supplier, whether by virtue of the volumes Massmart is able
to offer to buy from them, or otherwise. This analysis will be specific to each supplier. The
extent of the impact will depend on any change in the prices at which Massmart can procure its
current volumes from elsewhere and the importance of economies of scale to the supplier
concerned, amongst other factors. Moreover, these factors might be expected to differ
materially as between international suppliers and domestic suppliers.

PRIVILEGED & CONFIDENTIAL
RBB Economics Page 30
5.2.2. Changes in buyer power
In order to assess which types of supplier will be affected by any change in the buyer power
enjoyed by Massmart, it is necessary to identify why that buyer power may change.
Specifically, will it change because the costs and benefits to South African suppliers from
dealing with Massmart will change or will it change because the outside options available to
Massmart will improve by virtue of having access to the Wal-Mart supplier network?
Wal-Mart currently makes only a very small volume of purchases in South Africa. Therefore,
initially at least, the aggregation of the procurement volumes of the two businesses in South
Africa will result in Massmart having no greater volume of goods to buy from domestic suppliers
than it would have had in the absence of the merger. Hence it will give its suppliers no greater
scope for the exploitation of economies of scale than they would have had in the absence of the
merger. In other words, the costs and benefits to the supplier of dealing with Massmart will be
unchanged.
The merger could theoretically change the buyer power of Massmart vis-a-vis its suppliers is by
improving its outside option, as a result of it gaining access to the goods of international
suppliers on the terms currently enjoyed by Wal-Mart. If those terms are, by virtue of the
volumes Wal-Mart places with those suppliers, better than the terms that Massmart could
otherwise have achieved in the international market, then its buyer power will be enhanced. In
consequence, this may allow it to secure lower prices from its current supplier or, if lower prices
are not forthcoming, switch supplier.
However, it does not follow that merely because Massmart can procure goods more cheaply in
the international market than it could before the merger that this will necessarily improve its
bargaining position versus its domestic suppliers. This is best illustrated by way of a simple
numerical example. Suppose that Massmart can currently buy plastic buckets in China at R20
each, with a R20 cost of transporting them to South Africa. Further suppose that it can buy the
same bucket in South Africa for R30. On this basis it would buy the South African bucket for a
delivered price of R30 against a delivered price of R40 for the Chinese bucket.
Now suppose that following the merger Massmart could obtain buckets in China at R15 instead
of R20 (i.e. 25% cheaper). Even though it can now get buckets in China 25% cheaper than it
could before, it still makes sense to buy South African buckets for a delivered price of R30
against R35. In this case, it is competition between domestic South African bucket suppliers
than determines the price Massmart pays its South African suppliers and not competition from
international suppliers. Consequently, even though Massmart may gain the ability to buy more
cheaply on the international market, its buyer power versus its South African suppliers will not
change.
Whether access to the Wal-Mart international supply network will improve Massmart’s buyer
power against domestic suppliers therefore depends on the extent to which Wal-Mart can
access international goods more cheaply than Massmart and on the extent to which the prices
which Massmart currently secures from its domestic suppliers are currently determined by
domestic competition and to what extent they are determined by actual or potential competition
from internationals suppliers. If the terms on which Wal-Mart can buy a particular product in
international markets are not materially better than those at which Massmart can buy it or if

PRIVILEGED & CONFIDENTIAL
RBB Economics Page 31
Massmart’s current prices are primarily determined by competition between domestic suppliers
of that product, then the merger will have no impact on the degree of buyer power enjoyed by
Massmart against suppliers of that particular product.
5.2.3. Domestic supplier advantages
Indeed, as Massmart’s current patterns of procurement demonstrate, a very high proportion of
the goods sold by Massmart are procured from South African suppliers and a high proportion of
those are goods are domestically produced. Generally, this is because, in many cases,
domestic procurement has significant advantages over international procurement. Moreover,
the advantages enjoyed by domestic procurement mean that for very many South African
suppliers to Massmart, the relevant competition comes not from international suppliers, but from
other South African suppliers.
Where this is the case, unless there were very substantial changes in the terms on which
Massmart could procure internationally as a result of the merger (sufficient fully to offset the
innate advantages of domestic procurement) the merger would have no impact on the extent of
the buyer power which Massmart is able to exert against its domestic suppliers. In the sub-
sections below, the main advantages enjoyed by domestic suppliers are listed, along with
specific examples drawn from Massmart’s current procurement.
South African comparative advantage
First, there are products for which South Africa has amongst the lowest cost production in the
world, is a globally important source of supply, and is consequently a significant exporter of the
products concerned. In such cases, the large scale substitution of imports for domestic
production is highly unlikely under any circumstances. For example, toothpaste is a product
where South African production costs are internationally competitive. Another example of
intrinsic advantages to South African production is in the supply of fruit. In this case, the
climactic conditions in South Africa are particularly well suited to production, making it a major
exporter of the products and rendering large scale importation implausible. In sum, for those
products for which South Africa is a major exporter one would not expect to see Massmart
switching to the importation of those products post-merger, nor credibly threatening to do so.
Specific brand and product preferences
In other cases, there may be products or brands for which demand arises wholly or largely in
South Africa. In these scenarios, unless other locations have strong counter-claims as centres
of production it will be natural for production to occur in South Africa.16
Once more, in such
cases one would expect Massmart to continue to procure such products domestically after the
merger. For example, strong domestic preference for white maize results in Massmart sourcing
all of its maize locally, partly because most of the rest of the world has a preference for yellow
maize. It is therefore difficult to find non-South African sources of white maize. Another product
16
Such counter-claims to production would only arise if those alternative locations were close to a supply of relevant inputs or if there
were overwhelming economies of scale or scope in having South African products produced alongside the production of goods serving
other markets.

PRIVILEGED & CONFIDENTIAL
RBB Economics Page 32
for which demand arises almost entirely within South Africa is Afrikaans and local music, which
comprises around 25% of the music category.
In respect of brands rather than products, an example of strong domestic preferences shaping
procurement patterns arises in the supply of beer. In this case, the extensive marketing of
locally produced brands by the local brewers and the consequent strength of those brands in
South Africa requires Massmart to carry them in preference to imported brands. It is partly for
this reason that around 90% of the beer purchased by Massmart is domestically produced.
Moreover, a similar set of factors prevail in respect of wine purchases, where the extensive
marketing of South African wines creates strong demand for the local product which Massmart
must meet. In part consequence, around 95% of all wine purchased by Massmart is locally
produced.
However, the strength of local brands is not confined to food and drink. For example, within the
category of office supplies, there is significant brand loyalty to local brands, such as the Typek
brand of A4 paper, with local suppliers using extensive in-store marketing and promotion to help
build and maintain their brands. This results in the purchase of domestically produced A4 paper
in almost all cases. Similarly, in the building products category, cement accounts for around
R600m of sales and is entirely domestically purchased, in part due to the strong local
preference for domestic brands, such as PPC and Afrisam.
Legal, regulatory, and, technical requirements
In other cases, product preference is dictated by legal, regulatory or technical requirements.
For example, around 55 % of spirits are obtained from domestic sources, in part because South
African legislation specifies the alcoholic content and bottle sizes in which spirits can be sold,
with 750ml bottles of 43% ABV the most popular. However, most of the rest of the world sells
spirits of 40% ABV in 700ml bottles, which are illegal in South Africa. Consequently it is difficult
to find imported product that meets South African legal criteria. In addition, all liquor in South
Africa must carry a health warning in a specified format, further complicating importation.
Although general merchandise is generally more amenable to importation, there are
nevertheless many products which cannot realistically be imported for regulatory or technical
reasons. For example, all telephones sold by Massmart are domestically procured, partly due
to the need to be compliant with specific ICASA regulations. An example of technical
compatibility driving preferences is found in the supply of DSTV decoders and installation
vouchers, which must necessarily be compatible with local DSTV technology. Electrical
products are another category where technical compatibility is a key driver of procurement. As
the South African system is built to a 220 volt standard, imported electrical products would
require re-engineering which would make the landed cost more expensive than domestic
supply.
Transport and logistics costs
In other cases, while production may be fundamentally cheaper in some other areas of the
world, and the foreign products are suitable for meeting South African demand, sourcing
products from those locations for sale within South Africa may be relatively expensive compared
to domestically produced equivalents after transport costs are included. For example, this will

PRIVILEGED & CONFIDENTIAL
RBB Economics Page 33
tend to be true for products that are heavy or bulky, whilst at the same time of relatively low
value.
Examples of products of this type include basic plastic tables and chairs, which are around 25%
to 30% cheaper domestically than their imported equivalents, primarily due to the transport and
associated costs of importation. Another example is cooler boxes, with domestically sourced
boxes costing around 20% less than imported equivalents, as are hose pipes, for which
domestic sources are likewise 20% cheaper than imports.
In addition to the branding issues discussed above, the R600m of cement which Massmart buys
locally could not realistically be imported, even if customers were happy to buy non-South
African brands, because cement is extremely expensive to transport as compared to the
underlying value of the product. Another example of building products which cannot easily be
imported is bricks, which are the most expensive commodity to transport, and account for
around R100m of sales.
Quality degradation in transit and perishability
A further key driver of domestic procurement is the unavoidable quality degradation that occurs
with the transportation of many products and the perishability of products which prevents
Massmart from storing them in the large quantities necessary to make importation viable.
One example of a product that degrades in transit is pilchards, all of which are sourced locally.17
This is because imported pilchards need to be frozen to enable them to be transported, which in
turn reduces the quality of the product, rendering even high quality imported pilchards inferior to
their fresh domestic equivalents. Issues of this type affect many foodstuffs, partly explaining
why 92% of food products are obtained from domestic sources. However, product degradation
issues can arise in respect of non-food products as well. For example, 90% of the office desk
range carried by Massmart is locally sourced. This is partly due to the risk of the wood swelling
in transit and the damage that can occur to the product in loading and unloading.
In addition, even products which are robust to transportation, but which have a sell-by or expiry
date, cannot easily be imported. This is for two reasons. First, the time taken to import the
product reduces the effective time left to sell the product before the expiry of the sell-by date.
For example, domestically brewed beers are fresher and reach the shelves with longer to run
until their sell-by-dates than imported beers. Second, the minimum order quantities which
importation demands often mean that more of the product must be imported than can be sold in
the time available before the expiry of the sell-by date. A non-grocery example would be gel
pens and glue, which cannot be directly imported as the products have a limited shelf life
making it impossible to order in the large minimum order quantities required and hold the stock
for the extended period required to sell it.
17
South African canners only import pilchards in exceptional circumstances.
PRIVILEGED & CONFIDENTIAL
RBB Economics Page 34
Security of supply, stockholding costs, and exchange rate risk
Moreover, even for products that have an unlimited shelf-life, there are costs to stockholding
that favour the use of domestic suppliers. The need to hold significant stocks of directly
imported goods arises from two sources.
First, in order to be able to offer customers consistency of range, with only minimal risk that an
item will be out-of-stock, it is necessary to hold stocks of directly imported goods to ensure
continuity of supply to customers even if there is a disruption to the supply chain used to import
the goods concerned (e.g. industrial action at the port of origin or destination). Second, security
of supply issues aside, in order to be economically viable, imports can often only be made in
large minimum order quantities. Often these minimum order quantities will constitute many
weeks worth of sales, necessitating the bulk of the stock to be stored for an extended period.
The costs of holding stock come in several forms. First, there is the direct cost of owning or
leasing the warehouse space required to physically hold the stock. Naturally, this cost
increases the longer the stock needs to be held. Second, there is the financing cost of having
working capital tied-up in warehoused stock. Third, there is the risk that for goods purchased in
foreign currency, there will be adverse movements in the exchange rate during the period for
which the goods are stored which will erode the margin that can be made on the sale. Whilst
exchange rate risk can be hedged against, it is costly to do so.
Beer and wine provide examples of products for which stockholding costs make direct
importation difficult. In contrast to imported beer and wine, which must be imported in large
quantities and is bulky and expensive to store, domestic beer and wine can be efficiently bought
direct from the local breweries and vineyards and held in smaller quantities. By way of
illustration, Massmart is able to buy Peroni Nastro Azzuro 330mlx24, which is locally brewed
under licence, 30% more cheaply than Stella Artois 330mlx24, which is imported.
Printer paper is another product which is bought locally, not because of any inherent cost
advantage in South African production, but because the volume and weight of the product
means that it is far easier for a retailer to handle small frequent deliveries from a local supplier
than the large and infrequent deliveries necessitated by direct imports. Moreover, even where
Massmart does buy imported general merchandise, stockholding issues frequently mean that
there are compelling reasons to buy through local agents or subsidiaries rather than to deal
direct with the overseas supplier.
For example, 80% of office chairs are bought from local agents representing international
producers. This use of South African intermediaries is done to reduce the cost of holding stocks
of bulky items, enabling Massmart to draw only what it requires in each period. Another area
where imported products are bought largely through South African agents or local subsidiaries
is office supplies. Notably, Massmart buys products from suppliers such as Pilot, Rexel, and
Pentel through local agents or subsidiaries, because minimum order quantities make it
uneconomic to deal direct with the international suppliers of these products.

PRIVILEGED & CONFIDENTIAL
RBB Economics Page 35
Provision of guarantees and after-sales service
The final main reason for using domestic suppliers rather that direct imports is to avoid having
legal liability for the goods and carrying the obligation to provide warranties and after-sales
service, which is costly to provide and in which Massmart is unlikely to have the necessary
product or brand specific expertise.
In the supply of office furniture it is necessary to use local agents and subsidiaries due to the
inability of international suppliers to offer installation and back-up services, or to be able to
customise orders for customers. In the area of office consumables, local agents are able to
provide marketing and in-store support for the products, which international suppliers could not
provide.
Another category where products are exclusively purchased through local agents or
subsidiaries is hi-tech equipment and accessories. Examples of suppliers in this category are
Sony South Africa (Pty) Ltd, Canon South Africa (Pty) Ltd, and Philips SA (Pty) Ltd, amongst
many others. Intermediaries are used in this category as the local agents are then responsible
for warranty and after-sales service. Finally, all machinery ranges sold through Massbuild
require a local agent to provide repair and servicing, and whose role it is to maintain and
support the guarantees and warranties. These businesses provide product specific expertise,
which it would be very difficult for Massmart to replicate.
Benefits of using BBBEE suppliers
In South Africa, the use of domestic suppliers is further incentivised by BBBEE. Massmart is
the industry leader in BBBEE, achieving an Empowerdex rating of AA. This rating relies to an
extent on its procurement from BBBEE suppliers. Moreover, there are good reasons to expect
the existing level of procurement from BBBEE suppliers to be maintained after the Wal-Mart
acquisition.
First, in many cases BBBEE suppliers to Massmart provide it with local services, which by their
nature cannot be replaced by international suppliers. In other cases, where the BBBEE supplier
is supplying Massmart with goods for resale, the products concerned are primarily targeted at
black consumers, and BBBEE suppliers are competitively well-placed to meet their demand. An
example of one such set of products would be black health and beauty products. Moreover, to
the extent that Massmart increases its sales of such products with the expansion of its retail
network into lower LSM markets, and to the extent that the Wal-Mart acquisition quickens the
pace of that expansion or ultimately results in a larger retail network than otherwise,
opportunities for BBBEE suppliers will be increased by the merger.
Second, a strong BBBEE scorecard delivers tangible commercial benefits which will continue to
influence the procurement and commercial practices of Massmart after the acquisition by Wal-
Mart, as it has hitherto. These benefits arise from the enhanced opportunities which a strong
BBBEE scorecard provides for supplying public bodies, as well as in making Massmart an
attractive source of supply for other commercial firms, whose own BBBEE scorecards benefit
from association with the Massmart scorecard. For example, SAB required that Builders
Warehouse demonstrate strong BBBEE credentials as a pre-requisite for supplying certain of its
sites with basic site maintenance materials. Similarly, Vodacom required that Massmart provide

PRIVILEGED & CONFIDENTIAL
RBB Economics Page 36
a written undertaking of its intention to achieve a level 4 BBBEE status before they sought to
procure site maintenance materials from Builders Warehouse. In addition, Builders Warehouse
was required to produce its BBBEE scorecard in order to participate in an ironmongery tender
for the lead contractor working at La Mercy airport.
Another area in which BBBEE credentials are important is in supply to feeding schemes. For
example, the Department of Social Development required scorecards from Makro before
procuring food from it for feeding schemes. Similarly, local government offices in
Pietermaritzburg have recently requested the Makro scorecard. Masscash has similarly been
required to produce its scorecard when responding directly to government feeding scheme
tenders. A further key area in which BBBEE credentials may prove decisive is in relation to
liquor licensing. Specifically, an amendment to the Liquor Licensing Act now permits licensing
authorities to require evidence of progress toward BBBEE as a criterion in awarding liquor
licences. This naturally has a strong impact on the procurement patterns of licensed
businesses, who will wish to deal with suppliers whose own BBBEE credentials are strong.
5.3. Changes in Procurement Patterns
5.3.1. Impacts on domestic suppliers
As discussed, the split of procurement between domestic suppliers and importers, are
determined by economic fundamentals of which the price at which goods can be bought at the
factory gate in international markets is just one, and not even the most significant in most cases.
It is not therefore the procurement policies of retailers that determine from where goods are
sourced, as retailers will overwhelmingly favour procuring their goods domestically for the
reasons set out in sub-section 5.2.3 above. Furthermore, the pre-merger procurement patterns
of Massmart and the pre and post-acquisition procurement patterns of D&S in Chile, as
described in sub-sections 5.3.3 and 5.4.2 show that, in fact, it is largely the procurement policies
of the domestic suppliers from whom retailers source their products that will determine the
extent of the imported content in the goods supplied to retailers.
Furthermore, those domestic suppliers, faced with the buyer power of the major wholesale and
retail chains, and the competition from their domestic rivals, will already have sought out the
best sources of supply for the goods concerned. Where this is a South African producer,
domestic products will be sourced, where it is an international producer, imported products will
be sourced. Moreover, as the trade regime has been relaxed, so it will have become
increasingly easy for South African suppliers to source the goods they supply to their retail
customers internationally, all else being equal. Via this mechanism, local producers are already
exposed to international competition and have been for some time. As such, those South
African producers that remain do so because they are internationally competitive, or are
otherwise protected by fundamentals. These suppliers are likely to remain robust post-merger.
In fact, it seems likely that domestic suppliers will stand potentially to benefit from the
transaction, for two reasons. First, as seen in the Massmart procurement data, the supply of
food is generally an area where local suppliers have considerable advantages over imports. As

PRIVILEGED & CONFIDENTIAL
RBB Economics Page 37
the transaction may be expected to allow Massmart to accelerate the development of its retail
offer, including expanding the provision of perishable foodstuffs and private-label, one might
expect the merger to offer more opportunities for small domestic suppliers of foodstuffs to
expand their businesses, including as private-label suppliers, and to do so earlier than might
otherwise have been the case. Second, to the extent that international trade in the goods
concerned is feasible, it is a two-way street. Consequently, one would expect the best of the
small South African suppliers to have opportunities to export goods via the Wal-Mart network of
stores elsewhere in the world.
5.3.2. Impacts on international suppliers
International suppliers supplying goods to Massmart directly may find that as part of the Wal-
Mart group Massmart is able to obtain those same goods more cheaply via the Wal-Mart
network, which may cause those suppliers to be de-listed by Massmart or otherwise find that
their margins come under pressure as Massmart credibly threatens to switch to another
international supplier. However, these are overseas businesses, whose profitability will be of no
consequence to South African suppliers, workers or customers. Indeed, to the extent that lower
prices are secured this would be to the unambiguous advantage of South African customers.
International suppliers supplying goods to Massmart via local intermediaries are unlikely to be
displaced or see their margins eroded by a threat of Massmart dealing direct with a Wal-Mart
supplier as the existence of a domestic intermediary probably means that domestic
intermediation is required for one or more of the reasons set out in 5.2.3. These domestic
intermediaries may be encouraged to seek out lower cost supplies, but if there is a fundamental
requirement for domestic intermediation then some entity within South Africa will be required to
perform that role, earn a margin for doing so, and employ staff to do it.
Domestic subsidiaries or agents in multinational branded goods suppliers are unlikely to be
materially affected as most such multinationals insist on dealing with their retail customers on a
national basis and do not base their prices or discounts to domestic intermediaries or their
underlying customers on the basis of the global volumes traded with that customer. However,
the global relationship between Wal-Mart and a multinational may be relevant in resolving
disagreements or disputes between the local representative of a multinational and the local
Wal-Mart retail business. However, the acquisition of Massmart by Wal-Mart is unlikely to
materially change the nature of the relationship or supply prices agreed between Massmart and
the intermediary of a multinational such as Coca-Cola South Africa.
5.3.3. The impact of Wal-Mart in Chile
Wal-Mart entered Chile in 2009 with the acquisition of the leading Chilean retail chain D&S. In
line with its general policy to continue to operate acquired stores under their existing brands,
Wal-Mart now operates 279 stores in four different store formats under the Lider Hiper, Lider
Express, Acuenta, Econo, Revive, and El Buen Corte brands.18
18
In Chile Wal-Mart currently operates 68 Lider Hiper stores, 53 Lider Express stores, 78 Acuenta stores, 118 Econo stores, one Revive
store, and one El Buen Corte store.

PRIVILEGED & CONFIDENTIAL
RBB Economics Page 38
The impact of the acquisition of D&S potentially provides a rich source of evidence on the
impact of the acquisition of Massmart by Wal-Mart on suppliers. This is so for a number of
theoretical and practical reasons. At a theoretical level, incomes in both Chile and South Africa
are in the middle of the range of incomes of countries in which Wal-Mart is present (plus South
Africa), which runs from $2,800 per head in Nicaragua to $38,100 per head in Canada, with
Chile having an average income of $14,700 per head (5th highest out of 16) and South Africa
having an average income of $10,300 per head (9th highest out of 16).
19 In addition, whilst the
level of income inequality in South Africa is the highest of the listed countries, with a GINI co-
efficient of 65.0, Chile is amongst the highest of the others, with a GINI co-efficient of 54.9 (4th
highest out of 16).
At a practical level, in several of the countries in which Wal-Mart is active its entry has either
been organic or has occurred through the piecemeal acquisition of several small chains. In
some, its presence remains limited, while in others its entry was so long ago that good data are
not available to test how its entry impacted the market. However, its entry into Chile was the
result of a single, large acquisition, similar in nature to that contemplated in South Africa, and,
whilst it took place long enough ago for it to have made an impact on the market, it was
sufficiently recent for pre-acquisition data to be available to permit the nature and extent of that
impact to be measured.
Moreover, as with the proposed acquisition of Massmart, prior to its acquisition of D&S,
numerous allegations were made and fears expressed in Chile about the consequences of the
transaction. Much as in South Africa, these were focused on the adverse impact which Wal-
Mart would have on suppliers and employees, its resistance to unionisation, its alleged
complicity in human rights abuses, and its infringement of the economic freedom of Chileans. A
translation of a selection of the press coverage published prior to the acquisition is set out in
Annex A.3. As discussed in this report and in the affidavit of Debra Layton, subsequent events
have shown those concerns to be unfounded.
In order to test the extent of the churn in the supply base following the acquisition of D&S by
Wal-Mart, a full list of firms supplying D&S in 2008 and the sales they made was compared to a
full list of firms supplying Wal-Mart/D&S in 2010. These years were chosen because 2008 was
the last full year of independent operation of D&S, whilst 2010 was its first full year as part of the
Wal-Mart group. Nevertheless, Wal-Mart would still have had most of 2009 to implement
changes to its supplier base if it wished to do so, having acquired D&S in January 2009.
This comparison shows that of those suppliers supplying D&S in 2008, suppliers accounting for
99.8% of D&S 2008 sales were still supplying D&S in 2010. Moreover, the aggregate sales
made by these suppliers rose from CLP 1,209bn in 2008 to CLP 1,401bn in 2010, an increase
of 16%. However, whilst retaining virtually the entire existing supply base, Wal-Mart introduced
a number of new local suppliers into the supply network. Specifically, of those suppliers
supplying D&S in 2010, suppliers accounting for 4% of D&S 2010 sales had not been supplying
D&S in 2008.
19
A full list of key statistics for each of the countries in which Wal-Mart is present (excluding the US) and South Africa is contained in
Annex A.1.

PRIVILEGED & CONFIDENTIAL
RBB Economics Page 39
Furthermore, as can be seen in Table 10, not only did imported goods accounted for only 6.3%
of D&S sales in both 2009 and 2010, to the extent that there was any difference in the growth in
imported and domestic goods after the acquisition, the procurement of domestic goods rose
faster than that of imports.20
Table 10: Growth of imported and domestic Goods, 2009-2010
Imported Domestic Total
Sales (USD at cost) Share of Total Sales(USD at cost) Share of Total Sales(USD at cost)
2009 199.5 6.3% 2,951.2 93.7% 3,150.7
2010 226.0 6.3% 3,373.3 93.7% 3,599.3
Growth 13.3% 14.3% 14.2%
Source: Wal-Mart
Finally, it cannot be claimed that the failure of Wal-Mart to de-list large numbers of existing local
suppliers to D&S in favour of international suppliers is the result of Chilean protectionism. Chile
is one of the most open economies in the world, with a better free trade record than South
Africa on most metrics.21
Consequently, the continued reliance of Wal-Mart on domestic
suppliers is not an aberrant function of an inability to import; rather it is a function of the
fundamental advantages of domestic procurement, which are as relevant to an analysis of the
situation in South Africa as they are to Chile.
This evidence is clearly inconsistent with claims that the entry of Wal-Mart into a country results
in the large scale displacement of local suppliers, or substantial reductions in the purchases
made from them, and their replacement by international suppliers.
5.3.4. Stability in Massmart procurement
Stability in the patterns of procurement within Massmart provide further evidence in support the
contention that procurement patterns are primarily determined by fundamental economic
determinants. As such, commercial strategy and modest changes in the relative
competitiveness of domestic and international production of the kind that might occur when
Massmart has access to Wal-Mart’s global supplier base are highly unlikely to result in
significant swings in procurement patterns.
First, as shown in Table 11, notwithstanding trade liberalisation measures and exchange rate
fluctuations over the period, the proportion of direct imports undertaken by Massmart has
remained remarkably constant overtime, generally remaining within a range of 2% to 5%.
20
In compiling these figures, a constant exchange rate of 478 CLP/USD has been used in both years. 21
See Annex A.2 for further details of the trade policies of Chile and South Africa.

PRIVILEGED & CONFIDENTIAL
RBB Economics Page 40
Table 11: Evolution of direct imports as a percentage of total purchases
Food Liquor GM Cellular Total
2000 0.18% 0.85% 5.33% 0.00% 2.93%
2001 0.17% 0.31% 4.66% 0.00% 2.39%
2002 0.29% 1.43% 7.57% 0.00% 4.35%
2003 0.16% 0.71% 9.31% 0.00% 3.88%
2004 0.13% 0.72% 11.03% 0.44% 4.69%
2005 0.35% 0.64% 10.09% 0.33% 4.79%
2006 0.12% 0.71% 9.65% 0.38% 4.54%
2007 0.12% 0.47% 10.55% 0.54% 4.79%
2008 0.13% 0.45% 10.27% 0.50% 4.58%
2009 0.14% 0.49% 8.30% 0.13% 3.60%
2010 0.07% 0.30% 7.87% 0.00% 3.46%
Source: Massmart
Second, as shown in Table 12, over the same period, the import content of Massmart’s
purchases has been low and stable in liquor and food, even at the level of the individual
categories, tobacco excluded.

PRIVILEGED & CONFIDENTIAL
RBB Economics Page 41
Table 12: Massmart estimates of import content by category, 2000 to 2010
2000 2005 2010
Household 63% 75% 82%
Consumer electronics 76% 77% 81%
Photographic 100% 100% 95%
Home furnishing 60% 60% 60%
Homebuilding 39% 40% 41%
House ware and specialties 51% 53% 54%
Leisure 65% 70% 74%
Apparel, access and luxury goods 31% 31% 39%
Footwear 52% 52% 52%
Total General Merchandise 58% 61% 64%
Food products 8% 8% 7%
Beverages (including liquor) 14% 15% 15%
Packed foods and meats 5% 5% 5%
Tobacco 1% 6% 10%
Non-edible groceries 7% 8% 8%
Personal products 12% 12% 12%
TOTAL Food (including liquor) 9% 10% 10%
TOTAL Food (excluding liquor) 7% 7% 7%
TOTAL Liquor 19% 21% 21%
TOTAL 32% 33% 35%
Source: Massmart
Within general merchandise there has been a gradual shift towards increased import content,
which has been more marked in some categories than others. Generally, the scale and pace of
those shifts have been at a level which has allowed domestic manufacturers to adjust, with
some exceptions, such as textiles. However, it should be noted that to the extent that domestic
manufacturers have been subjected to increased international competition it is not the result of
South African wholesalers or retailers switching to direct importation, but rather South African

PRIVILEGED & CONFIDENTIAL
RBB Economics Page 42
manufacturers and distributors increasing the import content of the products which local
wholesalers and retailers then buy from them.
5.3.5. Evidence from the 2008 UK grocery investigation
In its 2008 grocery market enquiry, the UK Competition Commission spent a great deal of time
examining the terms on which UK retailers of different sizes were able to procure from suppliers.
If the claims that Wal-Mart will necessarily secures better prices than domestic retail competitors
by virtue of its global scale were true, then one would have expected to see Asda (the UK
subsidiary of Wal-Mart) getting the best prices. In fact, the UK Competition Commission found
Tesco to enjoy procurement terms which were better than those of Asda, by virtue of its greater
domestic scale; notwithstanding that Asda is part of Wal-Mart, with its far greater global scale
than Tesco.22
This evidence strongly supports the view that it is domestic scale and the power
that gives relative to domestic suppliers which is the most significant factor in determining
procurement terms and not global scale, as averred by the complainants.
5.4. Changes in Supplier Performance
5.4.1. Improved supplier performance
In respect of the financial performance of suppliers, Wal-Mart does not seek to squeeze margin
from local businesses to reduce the prices which it pays for its goods. Rather, the evidence
indicates that when suppliers work with Wal-Mart their costs of dealing with Wal-Mart fall and
the volume of sales they make rises, allowing them to offer Wal-Mart lower prices, better
products and increased sales, whilst at the same time enjoying higher sales and higher profits
themselves.
Supplier businesses may be further improved where active supply chain management of the
kind practised by Wal-Mart improves stock coverage. Massmart currently achieves stock
coverage (i.e. the proportion of products that are in stock) of around 90%. Across the Wal-Mart
group the equivalent figure is believed to be 98%. Improving stock coverage will most obviously
reduce the number of times a customer is unable to buy a product they want because it is out of
stock, so benefitting the customer as well as sales of the supplier.
5.4.2. The impact of Wal-Mart in Chile
In Chile, Wal-Mart sought to improve the productiveness of its supply relationships by
introducing a supplier programme known as the Joint Business Plan (JBP). In 2009, 19
suppliers, accounting for around 46% of the D&S business were invited to join the plan. In
2010, this was extended to 44 suppliers accounting for 58% of its sales, and in 2011 it will be
further extended to cover 54 suppliers making 63% of sales. The impact of the JBP on the
sales of those suppliers included in the programme can be seen in Figure 4.
22
See “The supply of groceries in the UK market investigation”, UK Competition Commission final report, 2008, (“UK grocery report”),
Appendix 5.3.

PRIVILEGED & CONFIDENTIAL
RBB Economics Page 43
Figure 4: Comparable Sales Growth for Non-JBP and JBP Suppliers, 2010
0%
5%
10%
15%
20%
25%
30%
Jan Feb Mar Apr May Jun Jul Aug Sep Oct Nov Dec
JBP Non-JBP Non-JBP Average JBP Average
Source: Wal-Mart
Figure 4 shows that in all but one month of 2010, suppliers within the JBP programme saw their
sales rise at a faster rate than those of non-JBP suppliers, even though non-JBP suppliers saw
their sales grow on a like-for-like basis in each month. The impact of the JBP on the profits of
those suppliers included in the programme can be seen in Figure 5.

PRIVILEGED & CONFIDENTIAL
RBB Economics Page 44
Figure 5: Sales and Profit Growth for Local and Multinational JBP Suppliers and Non-JBP Suppliers, 2009-2010
0%
5%
10%
15%
20%
25%
JBP Total JBP Local JBP Multinational Non-JBP
Sales Growth Profit Growth
Source: Wal-Mart
As can be seen, the profits of suppliers included within the JBP grew at a faster rate than the
profits of those suppliers that were not part of the scheme. Moreover, by splitting the JBP
suppliers into those supplying on behalf of multinationals and those supplying locally produced
goods, it becomes evident that local suppliers benefitted to an even greater degree than did the
local representatives of the multinationals in their profit growth.
Moreover, by the very nature of the JBP process, it is not possible to bring all of its Chilean
suppliers into the scheme. However, Wal-Mart has other programmes for assisting small
enterprises. For example, Wal-Mart has collaborated with INDAP (Institute for the Development
of Agriculture) to form strategic alliances with small farmers. In 2010, it allied with a group of
small farmers in central Chile and it is rolling out the programme to a similar group of farmers in
the under-developed province of Magallanes in 2011. The aim is to establish strategic alliances
with small suppliers, focussing on specific products and the timing of the harvesting of those
products.
Benefits of the programme include community development, lower logistic costs and increased
product freshness, as well as the creation of sustainable agriculture through improved water
and water treatment systems.

PRIVILEGED & CONFIDENTIAL
RBB Economics Page 45
5.4.3. Supplier relations in Chile
Further evidence of the close and mutually beneficial nature of the relationship that exists
between Wal-Mart and its suppliers in Chile is provided by a 2010 supplier survey
independently undertaken by Advantage (the Advantage Mirror Report). This survey was
conducted to allow retailers to benchmark their performance against other retailers in respect of
their dealings with suppliers. Lider (Wal-Mart) was one of the retail businesses considered in
the report.23
In total, 17 suppliers were asked to complete an evaluation of 12 retailers. The suppliers
chosen included multinationals, such as Unilever and Nestle, as well as local suppliers, such as
Tucapel and Evercrisp. In addition to Lider, the survey considered the Jumbo and Tottus
hypermarket chains, as well as a range of other supermarkets and pharmacies.
The suppliers were asked to rate each retailer on 26 factors within 5 key performance areas,
using a 1 to 5 scale.24
These key areas covered were “business relationship”, “personal and
organisation”, “category management and business development”, “branch performance”, and
“supply chain management process and personnel”. In addition, the suppliers were asked to
rate the importance of each of the factors considered from “unimportant” to “critical”.
In most cases the survey was completed by a Commercial Director, Sales Manager or Key
Account Manager of the supplier concerned. The results of these evaluations were then used
to give each retailer a score for each individual factor, each of the five key areas, and their
performance overall. The result was obtained by calculating the percentage of favourable
responses (1 or 2) less the percentage of unfavourable responses (4 or 5). The scores were
then used to rank the retailers, as well as to compare the scores of each retailer to the average.
Finally, the factors considered most important to suppliers were identified.
In the results of the survey, Wal-Mart was ranked top overall, with a score 56 points higher than
the average. Moreover, it was ranked top in all five of the five key areas, with a score at least
42 points higher than the average in every area.25
In addition, Wal-Mart was ranked top in 23 of
the 26 performance categories. Even in the three categories where it was not top, it came 2nd
,
3rd
and 5th, scoring significantly above average for the category in every case.
Of the 10 factors identified by suppliers as most important to them, Wal-Mart was ranked top in
eight of them, including the three most important factors, for which no suppliers responded
unfavourably in respect of Wal-Mart’s performance. Indeed, Wal-Mart received no unfavourable
responses in response to:
• “the company is good to work with”;
• “the company is focused on strategy when engaged in business”;
23
The full results of the Advantage Mirror Report are contained in Annex A.5, including a full list of the suppliers surveyed, the retailers
reviewed and the factors considered. 24
The marking scheme used asked each supplier to rate each retailer on a 1 to 5 scale, as “one of the best companies” (1), “better than
most companies” (2), “similar to most companies” (3), “worse than most companies” (4) or “one of the worst companies” (5). Each
supplier had the option to not answer where it felt that it had insufficient information to form a view on the performance of a particular
retailer in a particular performance category. 25
Advantage indicate that a score 5 points greater than the average is significant.

PRIVILEGED & CONFIDENTIAL
RBB Economics Page 46
• “using the assigned planograms, branches quickly identify and rectify when product is
not in place”;
• “use modern technologies and processes of supply chain management”;
• “collaborate to achieve logistic efficiencies”; and
• “effective and efficient supply chain management”.
These results are fully consistent with the view that Wal-Mart works closely with its suppliers to
improve the efficiency of the supply chain and increase sales, to allow the price paid by Wal-
Mart to fall, whilst at the same time enabling the profitability of suppliers to rise. The results are
wholly inconsistent with the portrayal in the opposing statements of Wal-Mart as a buyer who
simply squeezes the margins of its suppliers, with little or no regard for their long term viability or
development.
5.5. Conclusions
A number of claims are made in the opposing statements based on the assumption that
Massmart will have more buyer power after the transaction and that this will have various
deleterious consequences. However, nowhere do the statements explain what is meant by
buyer power or how it is envisaged that it will change as a result of the merger. Nor do they
provide any evidence in support of their claims.
In fact, the merger of Massmart and Wal-Mart will only enhance the buyer power of Massmart
against its suppliers to the extent that the acquisition changes the outside options available to
Massmart or its supplier, whether by virtue of the volumes Massmart is able to offer to buy from
them, or otherwise. If the current price achieved by Massmart is primarily determined by
competition between domestic suppliers of that product, then the merger will have no impact on
the degree of buyer power enjoyed by Massmart against those suppliers.
As current procurement patterns demonstrate, a very high proportion of the goods sold by
Massmart are procured from South African suppliers and a high proportion of those goods are
domestically produced. Generally, this is because domestic procurement has many advantages
over international procurement in most cases. Moreover, the advantages which flow from
domestic procurement mean that for very many South African suppliers to Massmart, relevant
competition comes from other South African suppliers.
South African producers are already exposed to international competition as South African
intermediaries supplying South African wholesalers and retailers seek out the best source for
their products or the components of them. South African producers that have remained viable
during the trade liberalisation process undertaken in South Africa over the last decade or more
are likely either to be internationally competitive or protected by fundamentals that strongly
favour domestic production. On the other hand, the acquisition may present local producers
with new opportunities to expand their businesses, particularly in the supply of food, which will
be a primary growth area for Massmart and where fundamentals strongly favour domestic
producers.

PRIVILEGED & CONFIDENTIAL
RBB Economics Page 47
International suppliers supplying direct to Massmart may be subject to increased price pressure,
but those supplying via local intermediaries are likely to be protected to some degree by the
need for local intermediation, as are the intermediaries themselves. Moreover, there is unlikely
to be a material change in the relationship between Massmart and the South African
representatives of multinational suppliers because the multinational suppliers tend to require all
retailers to deal with their local representatives and set prices accordingly.
The evidence suggests that there is likely to be only modest churn in the supply base following
the acquisition, based both on the experience in Chile, where a very high percentage of pre-
existing suppliers were retained following the entry of Wal-Mart, and on the basis of the stability
in procurement patterns within Massmart over an extended period of time. In addition, the
evidence further suggests that Wal-Mart works closely with its suppliers to lower their cost base
and boost their sales for the mutual benefit of Wal-Mart and the supplier concerned. The
Chilean experience shows sales and profits rising amongst suppliers generally, but rising most
amongst those enrolled in Wal-Mart’s JBP.
The beneficial nature of the Wal-Mart supply relationship is further supported by independent
survey evidence showing Wal-Mart to be the top rated retailer amongst Chilean suppliers of all
types, across a wide range of measures.

PRIVILEGED & CONFIDENTIAL
RBB Economics Page 48
6. Retailers and Efficiency
6.1. Overview
As discussed, Massmart is in the process of expanding its food retailing business, notably in
areas which have historically been largely served by small and informal retailers. Moreover, it is
anticipated that the expertise which Wal-Mart will bring to Massmart will enable this expansion
potentially to occur more quickly and with a greater prospect of success in executing those
elements of the plan in which Wal-Mart has greater experience than Massmart, such as the
retailing of perishable produce. However, a concern may be expressed that this retail
expansion will come at the expense of small and informal retailers, with adverse public interest
consequences for employment amongst workers in the sector.
The concern may be heightened where those small and informal retailers currently rely on
Massmart for the wholesale supply of their goods. In such cases, it could be argued that those
retailers may be subject to margin squeeze-based foreclosure by Massmart, as it raises the
wholesale prices charged to such customers so as to make them less competitive with
Massmart’s own retail business.
This section considers the merits of such potential arguments. First, it considers the argument
that post-merger expansion by Massmart will come at the expense of small and informal
retailers. Second, it considers the prospects for post-merger foreclosure, taking into account
the ability and incentive of Massmart to engage in such a strategy in light of the extent of the
competition it faces in both the wholesaling and retailing of grocery products.
In respect of retail operations, the experience of Wal-Mart of retail expansion by acquisition and
organic growth, as well as access to its extensive financial and management resources may be
expected to accelerate the development of the Massmart grocery retail offer, potentially
increasing the rate at which stores are rolled-out. In addition, the experience of Wal-Mart in
managing cold-chain distribution and the retailing of perishable produce will assist Massmart in
making fresh produce a core part of its grocery retail offer, despite this currently forming only a
small part of it operations. Wal-Mart’s experience of the development and management of
private-label grocery products within a broader portfolio of branded products, including within
retail formats targeted at lower income customer groups, will also assist Massmart in this aspect
of its retail offer.
Ultimately, these developments can be expected to deliver lower prices and better service to a
wider array of consumers in South Africa, most notably low income customers who are the
target of Massmart’s planned grocery retail expansion. As such, the transaction is consistent
not only with the broad objectives of the South African Competition Act, but contributes to the
specific priorities of the Competition Commission in seeking to reduce the cost of basic
foodstuffs for poorer consumers and increasing the range of fresh produce available to them.

PRIVILEGED & CONFIDENTIAL
RBB Economics Page 49
6.2. Impact on Informal Retail
In respect of the concerns expressed about the impact of the deal on small and informal
retailers, a key issue is disentangling merger-specific impacts from trends already at work in the
market and that are likely to continue to play out regardless of the transaction.
Notably, the competitive decline of independents relative to branded retailers is a well-
established trend, in which Massmart has hitherto played only a minor role. The expansion of
organised retail into areas traditionally served by small and informal retailers has been primarily
driven by the established grocery retail chains; notably Shoprite/Checkers, Pick & Pay, and
Spar. Consequently, even if Massmart were not to seek to expand its retail offer in the way it
envisages, the existing major retail chains would continue to do so. As a consequence, the
trend decline in the independent sector would continue, but with the established grocery chains
facing less retail competition in those areas than they would otherwise do. As such, any public
interest concerns arising from the trend decline in the independent sector are largely unrelated
to Massmart’s involvement and are necessarily therefore irrelevant to the consideration of its
merger with Wal-Mart.
In addition, not only is the competitive decline of independents a phenomenon which would
occur without Massmart, but the participation of Massmart in the process of bringing organised
retail to currently underserved areas is a phenomenon that does not rely on the acquisition of
Massmart by Wal-Mart. As noted, Massmart has a well-developed retail strategy involving the
roll-out of stores targeted at those customers traditionally served by small and informal retailers
and had embarked on the execution of that strategy before the merger with Wal-Mart was
agreed. As such, any public interest concerns arising from Massmart’s involvement in grocery
retailing to customers in LSM 2 to 6 and its consequential impact on independent retailers are
unrelated to the proposed merger and are therefore largely irrelevant to its consideration.
Even were the merger to lead to a faster or greater role out of Massmart stores, the impact of
that role out on informal retailing can be overstated. For example, it is anticipated that the
success of the Massmart retail strategy will come partly at the expense of other organised
retailers. Specifically, Massmart has identified a number of issues with the competitive offerings
of its branded retail rivals. For example, it has identified perishable and service departments as
areas where it believes that it can do better than some of its branded retail rivals. Another
example of potential weaknesses in the ability of rival retail chains to compete with it for the
custom of LSM 2 to 6 consumers is in the range of products offered, which Massmart believes is
not well targeted at lower income households. Therefore, Massmart believes that a significant
proportion of the business its stores will win will be at the expense of other organised retail on
account of its better tailored offer. This is reflected in its own modelling of its expansion which
considers several scenarios, including one in which 50% of its growth is drawn from branded
retail.
Furthermore, the net employment consequences of any decline in small and informal retail are
likely to be limited by several factors. Specifically, where Massmart acquires a store, the same
numbers of staff will likely be required to operate the stores under Massmart’s control as
previously. In addition, in those situations where Massmart opens new stores, managers and

PRIVILEGED & CONFIDENTIAL
RBB Economics Page 50
staff will be required to operate those stores, mitigating, and potentially off-setting, any
employment losses amongst small and informal retailers affected by the store opening.
Moreover, the growth in organised retail chains in areas traditionally served by small and
informal retailers will not inevitably lead to the complete disappearance of independent retailers.
Notably, the small scale and flexibility of small and informal retailers means that they can
continue to offer benefits which organised retail cannot easily match. Such examples might
include the offering of flexible or extended opening hours and the convenience of location within
the communities in which their customers live. In addition, the flexibility and mobility of many
informal retailers allows them to exploit small or transitory opportunities, such as the ability to
serve workers at temporary locations, such as building sites. Moreover, the potential for
suitably configured independent retailers to survive in competition with organised retail chains is
demonstrated by the scale of sales made by independents to customers in LSM categories 9
and 10. Independents enjoy a 14% share of the food retailing spend of these high end
customers, even though the vast majority of such customers have ready access to the outlets of
the organised retailers.
Finally, should any concerns be raised that Massmart may use its position as a wholesale
supplier to independent retailers to advantage its retail businesses in competition with those
independent retailers, two key issues must be considered. Specifically, in order to have the
ability to foreclose small and informal retailers, Massmart would need to have market power in
the wholesale supply of grocery products to such retailers. As established in sub-section 3.2,
Massmart does not have market power in wholesaling, but rather faces effective competition
from other wholesalers, both at a provincial and national level. In such circumstances, any
attempt to foreclose small and informal retailers by raising the wholesale prices which Massmart
charges them will simply result in a loss of business to other wholesalers. This would reduce the
profits of Massmart’s wholesale business and also secure no advantage for its retail business.
Furthermore, notwithstanding the presence of other wholesalers to whom its customers could
turn, should it be successful in forcing informal retailers out of the market, the established
presence in the same areas of other organised retailers would mean that the bulk of the benefit
of the exit of those informal retailers would be felt by retail chains other than Massmart. For this
reason too, it is implausible to believe that Massmart would credibly have the ability or incentive
to foreclose informal retailers.
Moreover, evidence from other countries suggests that even where the informal retail sector has
continued to decline, it remains a significant part of the overall grocery retail market. For
example, in Brazil the three major retailers account for only 40% of grocery sales, while in
Argentina the top four grocery retailers account for 66% of the market.26
The resilience of the
informal sector in the face of the growth of formal retailing in these countries comes from that
sector’s ability to offer convenience (e.g. a location very close to customers homes), flexibility
(e.g. the ability to sell in small quantities, such as a single scoop of pet food), service (e.g.
knowing customers by name) and, in some cases, credit to those who are only able to pay at
the end of the month (which is a particularly prevalent phenomenon in Argentina).
26
Source: ABRAS and AC Nielsen respectively.
PRIVILEGED & CONFIDENTIAL
RBB Economics Page 51
6.3. Impact on Formal Retail
6.3.1. Increased imports
One of the alleged impacts on formal retailers from the merger is that they will engage in large
scale switching to international suppliers or otherwise place pressure on their existing domestic
suppliers to match the prices they could have achieved from international suppliers. It is argued
that they will have to switch or threaten to switch in order to remain competitive with Massmart.
Notwithstanding that it is unlikely that Massmart itself will engage in large scale switching after
the merger, there is a fundamental illogicality in the reasoning underlying this claim.
Specifically, nothing about the merger will change the supply options available to Shoprite, Pick
n’ Pay, Metcash, or any other of the existing competitors to Massmart. Consequently, were
cheaper international alternatives to be available to those firms after the merger, they must have
been available to them prior to the merger. This then begs the question as to why those firms
were choosing not to use those international supply options either directly, or as a means of
obtaining comparable prices from its suppliers, prior to the deal, when it would have been
profitable to do so. The illogicality of this reasoning is more generally illustrative of the lack of a
coherent economic framework underpinning the complaints.
6.3.2. The “efficiency offence”
It is further claimed that the efficiency advantages enjoyed by Massmart after the merger will be
so overwhelming that it will eventually marginalise or destroy all domestic competitors, leaving it
with a monopoly position which it can use to exploit customers through higher prices. There are
two difficulties with this theory. Firstly, the evidence from other countries in which Wal-Mart is
active does not show its major retail competitors to be in terminal decline. Secondly, the
theoretical basis of this argument has an extremely weak pedigree.
In essence, whenever “efficiency offence” arguments are used, the competition authorities are
asked to penalise a firm because it is too efficient. This requires the authorities to move against
the very conduct which in all other situations it seeks to encourage, namely the identification
and attainment of efficiencies. Moreover, the authorities are asked to disregard the immediate
and certain benefits of lower prices in contemplation of the possibility of higher prices in the
future. This runs counter to the general presumption that immediate and certain phenomena
should be accorded more weight in competition authority assessments than remote and
uncertain ones. “Efficiency offence” advocates are rarely able to cite compelling examples of
mergers that have created the catastrophic levels of efficiencies forecast or mergers that have
been blocked on that basis, and this is similarly true in the present case.
As discussed, the reasoning in the opposing statements pre-supposes that Massmart will
necessarily obtain better prices solely by virtue of its relationship with Wal-Mart (rather than as a
result of any collaborative programmes to lower suppliers’ costs). There is no reason to
suppose that this will generally be true. Indeed, for many products this is not likely to be so. In
addition, the arguments in the opposing statements disregard a wide variety of advantages
enjoyed by the existing South African wholesalers and retailers, notably the latter. These

PRIVILEGED & CONFIDENTIAL
RBB Economics Page 52
advantages would include having established brands, such as Shoprite and Pick ‘n Pay, to
which local consumers have considerable loyalty, as well as enjoying considerable first mover
advantages in terms of the retail sites they currently occupy, with prime sites held on long term
leases. These advantages no doubt go some way to explaining why local retailers in several
countries have proven themselves to be enduringly robust to the entry of Wal-Mart (see sub-
section 6.3.4).
6.3.3. Waterbed effects
A further theoretical possibility raised in the opposing statements is that a significant increase in
the buying power of Massmart may give rise to “waterbed effects”, whereby reductions in input
prices paid by Massmart result in its rivals paying higher prices for their inputs, when purchasing
from the same supplier, as that supplier seeks to recoup the margin it has lost to Massmart. In
this context, the waterbed effect would require Massmart to secure lower prices from suppliers
currently supplying its competitors, such as Shoprite and Pick ‘n Pay. However, to the extent
that the allegation is that Massmart will get better prices than its domestic rivals by virtue of
having access to international suppliers with which those competitors are not dealing, the
waterbed effect falls at the first hurdle.
Moreover, even if the allegation that Massmart will get lower prices from its existing domestic
suppliers, by virtue of its credible threat to switch to international Wal-Mart suppliers, were true,
there remain a number of theoretical challenges for the complainants to overcome. Not least,
since firms are generally assumed to maximise their profits, if a supplier could profitably charge
higher prices to certain of its downstream customers it would have already done so, and would
not wait until it had conceded lower prices to Massmart before it did so. Indeed, the prevailing
consensus amongst economists, as seen in the relevant academic literature, is that waterbed
effects can only arise under very specific theoretical circumstances, which are unlikely to be
seen in practice.
Moreover, even the theoretical models which demonstrate how a waterbed effect may arise
typically disregard all dynamic responses by rivals, such as the formation of a joint buying group
or other cost reduction programmes. The literature further makes clear that even in the
theoretical circumstances in which waterbed effects arise, their overall effect on welfare will be
ambiguous, by virtue of the lower prices paid by customers. For example, this is the conclusion
reached by recent academic papers on waterbed effects by Inderst (2006), and Inderst and
Valletti (2006).27
In its 2008 grocery market enquiry, the UK Competition Commission devoted considerable effort
to analysing the possibility of waterbed effects, producing an 11 page appendix.28
Specifcially,
they critically evaluated a complex waterbed model developed by advisers to the Association of
Convenience Stores (ACS), which had been developed for the express purpose of seeking to
show that a waterbed effect could arise in the UK grocery market. Nevertheless, the
Competition Commission found that in order to generate a waterbed effect ultimately capable of
27
See Inderst, R. (2007), ‘Leveraging Buyer Power’, International Journal of Industrial Organisation and Inderst, R. and T. Valletti
(2009), ‘Price Discrimination in Input Markets’, Rand Journal of Economics. 28
See Appendix 5.4 of the UK grocery report.

PRIVILEGED & CONFIDENTIAL
RBB Economics Page 53
giving rise to a reduction in competition, the ACS had relied upon a number of highly unrealistic
assumptions, including the absence of wholesalers or buying groups, buyer power relying solely
on firm size, buyer power rising without limit as firm size grew, and an absence of competition
between the large retailers.
At a practical level, the applicability of the theory was tested by looking at the actual prices paid
for goods by different types of retailer. In particular the UK Competition Commission noted that
smaller downstream grocery retailers possessed a range of alternatives from which to source
their groceries and in many cases were able to secure their inputs at very competitive prices.
On the basis of the numerous theoretical and empirical problems with the theory, the UK
Competition Commission found that the market was unlikely to be conducive to waterbed
effects.
6.3.4. Evidence
The “efficiency offence” arguments advanced by the complainants assume that the advantages
enjoyed by Wal-Mart in the procurement of internationally traded products will eventually result
in the marginalisation or exit of its competitors, leaving it with a monopoly which it can use to
raise prices to consumers. However, if this were the inevitable result of the entry of Wal-Mart,
one might expect to have seen it happen in one of the other markets in which it has been active
for some time.
In fact, although Wal-Mart has typically increased the number stores in operation and the
number of employees in all of the countries in which it is active since its entry, it has not swept
away all competitors before it in an inexorable march to dominance as would appear to be
prophesised by the complainants. For example, Wal-Mart entered Argentina in 1995, but more
than 15 years later it remains only the fourth largest retailer, with a grocery market share of
approximately 9.2%.29
Similarly, Wal-Mart entered Brazil in 1995, yet it remains only the third
largest retailer (behind Carrefour and Pão de Aҫύcar), with an estimated retail share 11%.30
In Chile, it is the leading retailer having acquired a firm with a market share of 31.8% and has
since grown this to 36%. This growth has been achieved by growing faster than its rivals, with
Wal-Mart last year growing at around 12%, while its rivals grew at around 4.7%. In addition, in
the UK, which Wal-Mart entered in 1999, its subsidiary, Asda, remains substantially smaller than
Tesco.
6.4. Conclusion
In summary, the claim that the entry of Wal-Mart will result in the decline of informal retailing is
to confuse existing trends with merger-specific consequences. Informal retailing has declined,
and continues to decline, on the back of expansion by the existing formal retail chains.
Massmart has played only a minor role in driving this trend. It is a trend that will continue
29
Nielsen. 30
Derived from Brazilian Supermarket Association (ABRAS) data, which gives Wal-Mart a 29% share of the sales of the top three
retailers, who together account for 39% of retail as a whole.

PRIVILEGED & CONFIDENTIAL
RBB Economics Page 54
without Massmart and it is a trend in which Massmart would participate without Wal-Mart. As
such, it has almost nothing to do with the merger. Moreover, it is inevitable that the economy
will formalise as the economy grows and incomes rise. It is also to the benefit of some of the
country’s poorest consumers that they have access to a wider variety of cheaper goods, sold in
clean and pleasant environments. Equally, to the extent that informal retail adapts to its
strengths of convenience and flexibility, there is likely to be a role for small and informal retail,
as there is in all economies.
Formal retailers will face additional competition and may have to work to secure efficiencies to
maintain their position. However, they have numerous intrinsic advantages arising from their
brands and locations. Moreover, since the extent of the procurement cost advantages that
Massmart will gain as part of Wal-Mart are vastly overstated by the complainants, for the
reasons discussed, those benefits are likely to be sufficient to enable them to continue to
operate profitably. If Massmart is to secure further advantages by working with local suppliers
to reduce logistics costs and drive increased sales in their stores then these are efficiencies that
other formal retails can in principle replicate. The claim that waterbed effects will arise is refuted
by the latest academic work and the most recent findings of the UK Competition Commission.
Finally, the claim that competitors to Wal-Mart inevitably wither as the full might of Wal-Mart is
brought to bear in their market, is simply not supported by the evidence from the markets in
which Wal-Mart operates. Even in markets in which Wal-Mart has been active for over a
decade, whilst it has generally grown, its rivals have survived and in many cases flourished,
notwithstanding their need to compete with Wal-Mart’s supposedly irresistible competitive
advantages and ruthlessness.

PRIVILEGED & CONFIDENTIAL
RBB Economics Page 55
7. Anti-Competitive Conditions and Industrial Policy
7.1. Anti-Competitive Conditions
As noted, the complainants have asked for an array of conditions to be imposed on the merged
business as a condition of its clearance. If these conditions were to be imposed on the merged
business it would represent a hugely intrusive intervention into the day-to-day business of a
non-dominant firm, whose management discretion over key operational variables would be
seriously circumscribed. Moreover, it would constitute a degree of proscriptive regulation rarely
seen in the policing of dominant firm conduct and that of regulated utilities, less still, that of non-
dominant firms.
In addition, many of the conditions would be hopelessly impractical to monitor, such as
requirements to procure a particular proportion of locally produced goods. For example, how
would local production be defined? How would value added activities other than those
associated with physical production be considered (e.g. blending and packing)? How would
Massmart know if a particular South African supplier had switched from using a South African
component in its products to using an imported component? How would the Competition
Commission be able to police it?
Moreover, in addition to drawing the South African competition authorities into an
unprecedented and burdensome process of regulatory oversight, the imposition of such
conditions would be highly anti-competitive in its impact. For example, within its food retail
operations, Massmart would be unable freely to adjust its employment levels, terms of
employment, mix of employees, management processes, mix of suppliers within each category
of product, procurement of imported goods, and prices, amongst others. Under such
circumstances, how could Massmart, with a share of food retailing of just 2%, provide effective
competition to larger unconstrained rivals, such as Shoprite and Pick ‘n Pay?
Retailing is a dynamic market. This is particularly true in South Africa, with retailers currently in
the process of expanding or modifying their operations and changing the mix of goods offered.
Similarly, supply opportunities are continually changing as domestic and international suppliers
open and close facilities, multinational suppliers enter new markets or change the mix of
products offered, and the extent of barriers to trade are changed. In such an environment,
neither competition nor South African consumers would be well-served by the imposition of
“command-and-control” style quotas on how retail business should be conducted and what
products must be offered to customers.
7.2. Industrial Policy
Of course, there are legitimate debates to be had about the extent to which domestic production
should be protected from international competition and consumers should be allowed to benefit
from low-priced imports produced in countries in which employment, safety and environmental
standards are regarded by many as unacceptably low. However, these debates raise complex

PRIVILEGED & CONFIDENTIAL
RBB Economics Page 56
issues, not least involving highly subjective judgements about what is in the best interests of
suppliers, workers and customers in different countries, and how the welfare of those different
groups should be weighed.
Arguably, these are debates which the Competition Tribunal is not best placed to resolve. They
are political, social and economic debates which occur within government, take place bilaterally
between governments, and are discussed within multilateral bodies whose explicit mandate is to
debate and resolve such issues in a consistent and coherent way. Moreover, to the extent that
it is appropriate for South Africa unilaterally to seek to address these issues, these are evidently
matters of industrial policy, which the government has the power to determine independently of
competition law enforcement.
The essence of competition is that it permits and encourages firms to minimise costs and to
provide consumers with the products they want at the best possible prices. In the day-to-day
enforcement of competition law, it is this objective which the Competition Commission and
Competition Tribunal seek to promote. To impose asymmetric regulation on a single, non-
dominant, firm, whilst trusting in all other market participants not to engage in the allegedly
harmful conduct, though they remain free to do so, is to introduce a gross distortion of
competition, prejudice the attainment of the efficiencies from which consumers might otherwise
benefit, and create a precedent which may deter inward investment and engender protectionist
sentiment against South African exporters.

PRIVILEGED & CONFIDENTIAL
RBB Economics Page 57
8. Conclusions
Massmart has a pre-existing position in a number of markets, but in none of those markets does
it hold a position of market power, nor will market power be created by the transaction due to
the lack of overlap in the activities of the parties. Consequently, no standard competition
concerns can arise from the transaction. Furthermore, the allegations in the opposing
statements give no weight to the considerable welfare benefits of providing poor consumers
with lower priced food and basic household items. Instead they focus on highly speculative
theories of harm for which they provide almost no evidential support.
The acquisition by Wal-Mart will change procurement patterns solely to the extent that it
changes the fundamental economic considerations currently determining the procurement of
Massmart. Whilst access to international suppliers on the terms currently achieved by Wal-Mart
may change those economic considerations to some extent, the other factors determining
current procurement choices will remain largely unchanged. These factors will in many cases
be decisive, meaning that Massmart is unlikely to see a material improvement in its relative
procurement position post-merger.
South African producers are already exposed to international competition as South African
manufacturers and distributors seeking to supply South African wholesalers and retailers look to
source their products or components in the most economic way. South African producers that
have remained viable during liberalisation are likely either to be internationally competitive or
protected by fundamentals that favour domestic production. Conversely, the merger may
present local producers with new opportunities, particularly in the supply of food, including
private-label, which will be a growth area for Massmart, and where the evidence shows that
fundamentals strongly favour domestic producers.
The claims that informal and formal retailing will be detrimentally affected by the transaction are
misleading. Informal retailing has been in decline for some time as a result of expansion by the
existing formal retail chains. Whilst the trend will continue with or without Massmart, the
involvement of Massmart will bring further competition for the established chains and ensure
that the poorest South African consumers gain the greatest benefit from the formalisation of
retailing in their communities. On the other hand, formal retailers will undoubtedly face
additional competition and may have to secure efficiencies to maintain their current positions,
but they enjoy intrinsic advantages as incumbents and have every opportunity to replicate most
of the efficiencies Wal-Mart will bring to Massmart.
The evidence suggests that there is likely to be only modest churn in the supply base following
the acquisition, based both on the experience of the entry of Wal-Mart into Chile, where a very
high percentage of pre-existing suppliers were retained and on the basis of the stability in
procurement patterns seen within Massmart. The evidence further suggests that Wal-Mart
works closely with its suppliers to lower their costs, boost their sales, and increase their profits.
The Chilean experience shows the Wal-Mart supply relationship to be greatly valued by
suppliers, with Wal-Mart the top rated retailer amongst Chilean suppliers of all types.
Undoubtedly, complex industrial and social policy issues face South Africa. The government
has the power to formulate policy to deal with any adverse consequences that it perceives to

PRIVILEGED & CONFIDENTIAL
RBB Economics Page 58
flow from the competitive operation of domestic markets and to liaise bilateral or multilaterally
with other governments on international trade policy. However, to seek to address perceived
weaknesses in the South African manufacturing base or failings in the enforcement of labour
law elsewhere in the world, by imposing onerous and asymmetric obligations on a non-
dominant retail business, is not only poorly suited to achieving those objectives, but will
introduce major distortions into the operation of an otherwise competitive market, potentially
disadvantaging many of the groups whom the complainants seek to help.

PRIVILEGED & CONFIDENTIAL
RBB Economics Page 59
A.1 Key Statistics: Wal-Mart Countries and South Africa
Country GDP Per Capita GINI Co-efficient Population Year of Entry Number of Stores
Canada 38,100 32.1 33m 1994 325
United Kingdom 34,200 34.0 62m 1999 385
Japan 32,600 38.1 126m 2005 414
Puerto Rico 17,100 - 4m 1992 56
Chile 14,700 54.9 16m 2009 279
Argentina 13,900 45.7 41m 1995 63
Mexico 13,200 48.2 112m 1991 1,730
Costa Rica 11,000 48.0 4m 2005 180
South Africa 10,300 65.0 49m - -
Brazil 10,100 56.7 201m 1995 479
El Salvador 7,100 52.4 6m 2005 78
China 6,700 41.5 1,330m 1996 328
Guatemala 5,100 55.1 13m 2005 175
Honduras 4,100 53.8 8m 2005 56
India31
3,200 36.8 1,173m 2009 5
Nicaragua 2,800 43.1 6m 2005 60
Source: Wal-Mart
31
There are 5 wholesale cash and carry units in a joint venture with Bharti Enterprises in which Walmart owns greater than 50% and
these stores are consolidated into Wal-Mart Stores, Inc. Wal-Mart has a separate joint venture with Bharti Retail in respect of 5 retail
outlets that are not consolidated into the Walmart group because Walmart holds less than 50% of that joint venture.

PRIVILEGED & CONFIDENTIAL
RBB Economics Page 60
A.2 Trade Policy in South Africa and Chile
Section A.2.1 below addresses the similarities and differences between Chile and South Africa
in terms of trade policy, and the resulting openness to global markets, by looking at what
regional trade agreements (RTA) have been signed by both countries, the existence of tariff and
non-tariff barriers (NTB) and finally by analysing and comparing a composite index of trade
openness.
A.2.1 Trade policy comparison
By showing that Chile’s economy is as open to international trade as South Africa’s economy, it
can be inferred that the lack of substitution by Wal-Mart of the domestic supplier base for
international imports seen in Chile is not the result of protectionism, but is driven by
fundamentals, as applicable in South Africa as Chile.
A.2.1.1 Regional trade agreements
Member countries of the World Trade Organisation (WTO) have concluded Most Favoured
Nation (MFN) reciprocal trade agreements with all other WTO member countries. This means
that they accord trade terms to other WTO member countries with no less favourable terms than
those afforded to their “most favoured nation”. However, countries are able to further reduce
barriers to trade by granting mutual, preferential, trade treatment to specific countries, whether
they are WTO members or not, through the signing of regional trade agreements (RTAs).
Of the agreements that are currently in force, as opposed to agreements that are still in the
process of being negotiated, Chile is party to no less than 19 such agreements which cover
both goods and services, whereas South Africa is a signatory to only 4 such agreements. A full
list of the agreements signed by each country is contained in sub-section A.2.1.5.
Chile is considered to be one of the most preferential trading partners in the world and is
involved in negotiations to conclude several more trade agreements.32
The large number of
preferential trade agreements to which it is party, including an agreement with China, is an
indication of Chile’s willingness to remove barriers in international trade.
In Figure 6, the countries with which Chile has an RTA are shown in red. Those countries with
which it does not have an RTA, but with which it nevertheless has open trading relations via
mutual membership of the WTO are in green. Those countires with which it neither has an
RTA, nor with which it has open trading relations via WTO membership are shown in grey.
32
WTO Trade Policy Review, Report by the Secretariat, Chile 2009
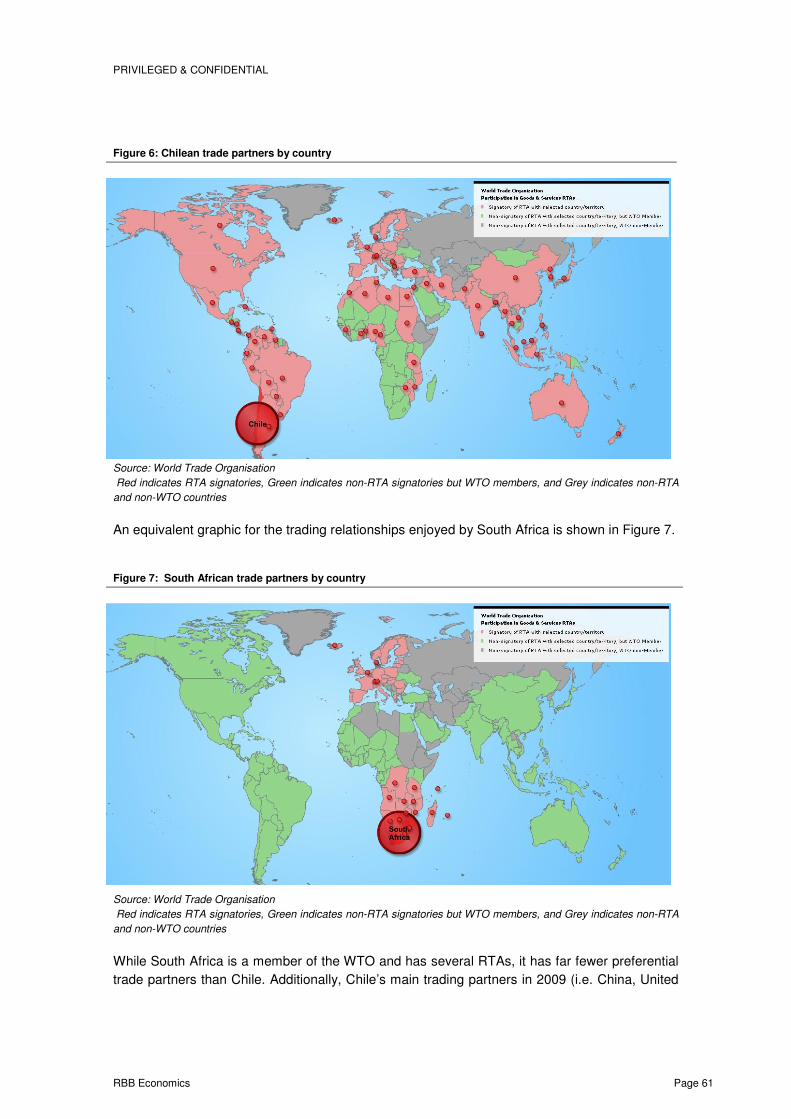
PRIVILEGED & CONFIDENTIAL
RBB Economics Page 61
Figure 6: Chilean trade partners by country
Source: World Trade Organisation
Red indicates RTA signatories, Green indicates non-RTA signatories but WTO members, and Grey indicates non-RTA
and non-WTO countries
An equivalent graphic for the trading relationships enjoyed by South Africa is shown in Figure 7.
Figure 7: South African trade partners by country
Source: World Trade Organisation
Red indicates RTA signatories, Green indicates non-RTA signatories but WTO members, and Grey indicates non-RTA
and non-WTO countries
While South Africa is a member of the WTO and has several RTAs, it has far fewer preferential
trade partners than Chile. Additionally, Chile’s main trading partners in 2009 (i.e. China, United

PRIVILEGED & CONFIDENTIAL
RBB Economics Page 62
States and Brazil) all enjoy RTAs with Chile, By contrast, of South Africa’s top trade partners
(i.e. Germany, China and the United States) only Germany receives preferential trade terms
through South Africa’s RTA with the European Union.
A.2.1.2 Tariffs and non-tariff barriers
Import tariffs are additional costs placed on goods entering a country and serve to give a price
advantage to locally produced goods over similar goods which have been produced elsewhere.
Sub-section A.2.1.6 provides an overview of imports and tariffs for both Chile and South Africa
broken down into product groups. The key points are that the shares of product groups to total
imports across the different segments are broadly similar across both countries, indicating
similar import preferences. Chile has adopted an almost uniform tariff rate for all product
segments, for both ‘bound’ tariffs (25%) as well as MFN tariffs (6%) whereas South African
tariffs vary considerably between product segments.33
In both countries, as is expected, MFN
tariffs are substantially lower than the tariffs applied to non-MFN countries.
It is prudent to analyse weighted indicators as this provides the most accurate reflection of the
actual average as simple averages could easily be skewed by a small number of outliers. The
only weighted measure of tariffs provided in these summaries is for MFN tariffs. Both Chile and
South Africa have a 6% weighted average for this category with Chile having approximately 6%
weighted tariffs for both agriculture and non-agriculture products and South Africa having
weighted tariffs of 10% and 4.7% respectively.
This is a good indication that when it comes to trade with MFN countries, trade openness, as
represented by the weighted average tariffs, is similar as between Chile and South Africa.
Non-Tariff Barriers (NTBs) refer to restrictions that result from prohibitions, conditions, or
specific market requirements that make importation or exportation of products difficult and/or
costly. NTBs also include unjustified and/or improper application of Non-Tariff Measures
(NTMs) such as sanitary measures and other technical barriers to trade.
NTBs arise from different measures taken by governments and authorities in the form of laws,
regulations, policies, conditions, restrictions or specific requirements, and from private sector
business practices, or prohibitions that protect the domestic industries from foreign competition.
The Heritage Foundation, a research and educational institution which analyses metrics such as
NTBs, found both Chile and South Africa to apply varying degrees of NTBs.34
South Africa was found to have:
“NTBs which are widespread across many goods and services and/or act to impede a
majority of potential international trade.”
33
‘Bound’ Tariffs are those tariff rates that individual member countries of the WTO commit themselves to, these rates are difficult to
increase. 34
“2011 Index of Economic Freedom” combined work by The Heritage Foundation and The Wall Street Journal, available at:
http://www.heritage.org/index/

PRIVILEGED & CONFIDENTIAL
RBB Economics Page 63
Examples cited include:
• Import and export restrictions;
• Including tariff rate quotas on agricultural and textile imports;
• Services market barriers;
• Import and export permit requirements;
• Burdensome technical standards;
• Preferential government procurement procedures;
• Burdensome regulations and inefficient bureaucracy;
• Weak enforcement of intellectual property rights;
• Inconsistent customs administration, and;
• The use of anti-dumping laws to limit imports.
On the other hand, Chile, was considered to have fewer instances of NTBs, with:
“NTBs consistent with attempts to protect certain goods and services and impede
some international trade.”
Examples of which were:
• Chile’s approval requirements and stringent sanitary regulations on imports of
agricultural products and processed food;
• An import ban on used vehicles, and;
• Export subsidies for some sectors.
NTBs are a hindrance to free trade and serve to provide local producers with similar protections
as those provided by import tariffs. Chile applying fewer instances of NTBs is an indication of an
economy that is more open to international trade.
A.2.1.3 Index of Trade Freedom
The Heritage Foundation also provides an index of Economic Freedom that ranks countries on
a scale of 1-100 based on the average score from 10 measures which evaluate openness, rule
of law and competitiveness. Chile is considered among the top 20 non-protectionist economies
ranking 11th whereas South Africa ranks only 74
th out of approximately 180 countries. Of these
10 measures the one that has the most relevance to this analysis is that of Trade Freedom.

PRIVILEGED & CONFIDENTIAL
RBB Economics Page 64
Trade Freedom is calculated from a composite measure of the absence of tariff and non-tariff
barriers in each country. Firstly, the weighted average tariff is calculated from all imports and
import tariffs, not just those tariffs applied to RTA or MFN partner countries. Secondly, negative
points are scored for the level of NTBs present in a particular country. 35
South Africa’s trade weighted average tariff rate, for all imported goods, in 2009 was calculated
to be 3.9% compared with Chile’s weighted average tariff rate of only 1% in 2008. Both
countries were penalized for the existence of non-tariff barriers with South Africa penalized 15
points and Chile penalized 10 points in accordance with the level of NTBs in each country.
Overall South Africa scored 77.2 points compared with Chile’s 88.0. Figure 8 shows the
comparison between South Africa and Chile over time, compared against a World Average.
Figure 8: Trade Freedom Comparison between Chile and South Africa
Source: The Heritage Foundation & The Wall Street Journal
While both countries are always seen to be above the World Average for the last 5 years, the
graph indicates that since 2006 Chile has consistently scored higher than South Africa in terms
of the Trade Freedom Index.
A.2.1.4 Conclusion
35
The full methodology used in compiling the Trade Freedom Index is provided in annexure A.2.1.7

PRIVILEGED & CONFIDENTIAL
RBB Economics Page 65
South Africa and Chile have made significant strides in recent years to open their borders to the
global market. When using MFN weighted tariffs as a proxy for trade openness, Chile is seen to
be South Africa’s equivalent. However when RTAs, NTBs or the composite Trade Freedom
Index is used to proxy trade openness, Chile is seen to be consistently more open than South
Africa to global trade.

PRIVILEGED & CONFIDENTIAL
RBB Economics Page 66
A.2.1.5 List of RTAs signed by Chile and South Africa
Table 13: List of RTAs signed by Chile
Coverage Type Status
Australia Goods & Services FTA & EIA In Force
Canada Goods & Services FTA & EIA In Force
China Goods & Services FTA & EIA In Force
Colombia Goods & Services FTA & EIA In Force
Costa Rica (Central America) Goods & Services FTA & EIA In Force
El Salvador (Central America) Goods & Services FTA & EIA In Force
India Goods PSA In Force
Japan Goods & Services FTA & EIA In Force
Mexico Goods & Services FTA & EIA In Force
EC Goods & Services FTA & EIA In Force
EFTA Goods & Services FTA & EIA In Force
Global System of Trade
Preferences among
Developing Countries (GSTP) Goods PSA In Force
Korea, Republic of Goods & Services FTA & EIA In Force
Latin American Integration
Association (LAIA) Goods PSA In Force
Panama Goods & Services FTA & EIA In Force
Protocol on Trade
Negotiations (PTN) Goods PSA In Force
TransPacific Strategic
Economic Partnership Goods & Services FTA & EIA In Force
Turkey Goods FTA In Force
US Goods & Services FTA & EIA In Force
Source: World Trade Organisation
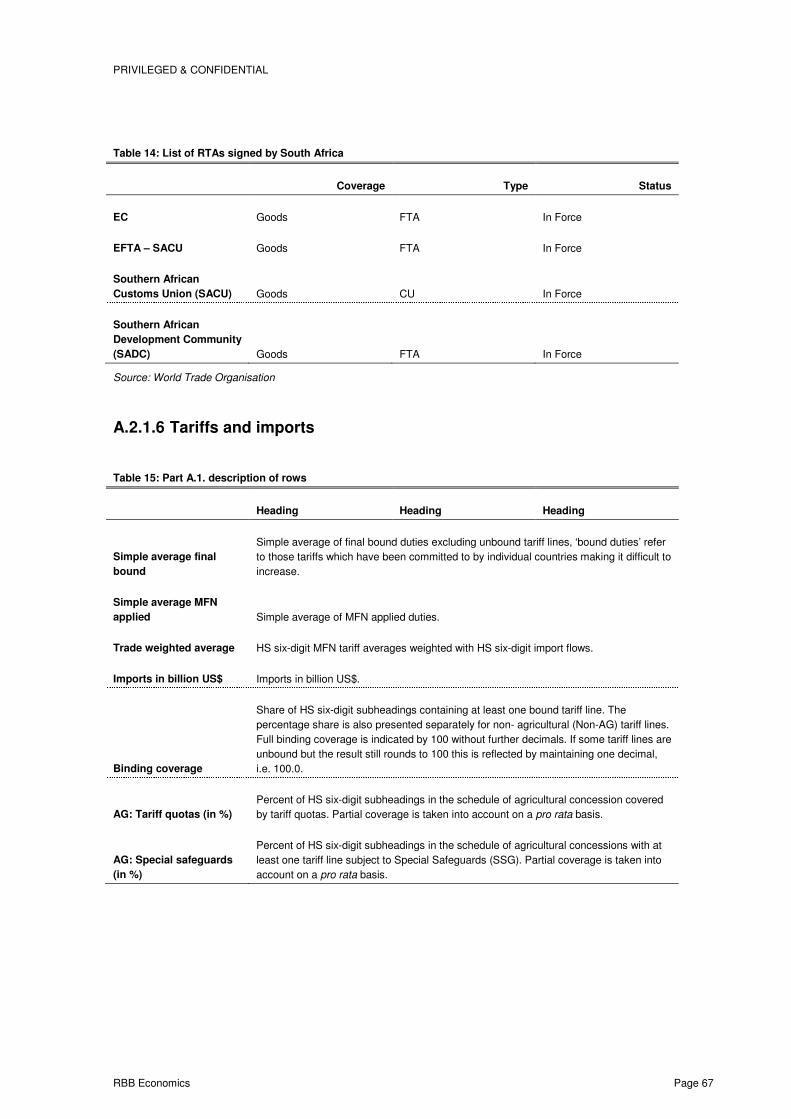
PRIVILEGED & CONFIDENTIAL
RBB Economics Page 67
Table 14: List of RTAs signed by South Africa
Coverage Type Status
EC Goods FTA In Force
EFTA – SACU Goods FTA In Force
Southern African
Customs Union (SACU) Goods CU In Force
Southern African
Development Community
(SADC) Goods FTA In Force
Source: World Trade Organisation
A.2.1.6 Tariffs and imports
Table 15: Part A.1. description of rows
Heading Heading Heading
Simple average final
bound
Simple average of final bound duties excluding unbound tariff lines, ‘bound duties’ refer
to those tariffs which have been committed to by individual countries making it difficult to
increase.
Simple average MFN
applied Simple average of MFN applied duties.
Trade weighted average HS six-digit MFN tariff averages weighted with HS six-digit import flows.
Imports in billion US$ Imports in billion US$.
Binding coverage
Share of HS six-digit subheadings containing at least one bound tariff line. The
percentage share is also presented separately for non- agricultural (Non-AG) tariff lines.
Full binding coverage is indicated by 100 without further decimals. If some tariff lines are
unbound but the result still rounds to 100 this is reflected by maintaining one decimal,
i.e. 100.0.
AG: Tariff quotas (in %)
Percent of HS six-digit subheadings in the schedule of agricultural concession covered
by tariff quotas. Partial coverage is taken into account on a pro rata basis.
AG: Special safeguards
(in %)
Percent of HS six-digit subheadings in the schedule of agricultural concessions with at
least one tariff line subject to Special Safeguards (SSG). Partial coverage is taken into
account on a pro rata basis.

PRIVILEGED & CONFIDENTIAL
RBB Economics Page 68
Table 16: Part A.2. description of rows
Heading Heading Heading
Final bound
duties
AVG
Simple average of final bound duties excluding unbound tariff lines,
‘bound duties’ refer to those tariffs which have been committed to by
individual countries making it difficult to increase.
Duty Free
Share of duty-free HS six-digit subheadings in the total number of
subheadings in the product group. Partially duty-free subheadings are
taken into account on a pro-rata basis.
Max Highest ad valorem duty or calculated AVE within the product group.
Binding in %
Share of HS six-digit subheadings containing at least one bound tariff
line. Full binding coverage is indicated by 100 without further decimals.
If some tariff lines are unbound but the result still rounds to 100 this is
reflected by maintaining one decimal, i.e. 100.0.
MFN applied
duties
AVG Simple average of MFN applied duties.
Duty Free
Share of duty-free HS six-digit subheadings in the total number of
subheadings in the product group. Partially duty-free subheadings are
taken into account on a pro-rata basis.
Max Highest ad valorem duty or calculated AVE within the product group.
Imports
Share in % Share of imports falling under product group.
Duty free in %
Share of MFN duty-free imports falling under product group in total
imports in that product group. Partially duty-free subheadings are taken
into account on a pro-rata basis if tariff line imports are not available.

PRIVILEGED & CONFIDENTIAL
RBB Economics Page 69
Figure 9: Chilean tariffs and imports
Source: World Trade Organisation, United Nations Conference on Trade and Development, the International Trade
Centre

PRIVILEGED & CONFIDENTIAL
RBB Economics Page 70
Figure 10: South African tariffs and imports
Source: World Trade Organisation, United Nations Conference on Trade and Development, the International Trade
Centre
A.2.1.7 Methodology used to calculate the measure of Trade Freedom
Trade freedom is a composite measure of the absence of tariff and non-tariff barriers that affect
imports and exports of goods and services. The trade freedom score is based on two inputs:
• The trade-weighted average tariff rate and
• Non-tariff barriers (NTBs).

PRIVILEGED & CONFIDENTIAL
RBB Economics Page 71
Different imports entering a country can, and often do, face different tariffs. The weighted
average tariff uses weights for each tariff based on the share of imports for each good.
Weighted average tariffs are a purely quantitative measure and account for the basic calculation
of the score using the following equation:
Trade Freedom i = (((Tariff max – Tariff i) / (Tariff max – Tariff min)) * 100 – NTP i
where Trade Freedomi represents the trade freedom in country i, Tariffmax and Tariffmin represent
the upper and lower bounds for tariff rates (%), and Tariffi represents the weighted average tariff
rate (%) in country i. The minimum tariff is naturally zero percent, and the upper bound was set
as 50 percent. An NTB penalty is then subtracted from the base score. The penalty of 5, 10, 15,
or 20 points is assigned according to the following scale:
• 20: NTBs are used extensively across many goods and services and/or act to
effectively impede a significant amount of international trade.
• 15: NTBs are widespread across many goods and services and/or act to impede a
majority of potential international trade.
• 10: NTBs are used to protect certain goods and services and impede some international
trade.
• 5: NTBs are uncommon, protecting few goods and services, and/or have very limited
impact on international trade.
• 0: NTBs are not used to limit international trade.
The extent of NTBs in a country’s trade policy regime is determined by using both qualitative
and quantitative information. Restrictive rules that hinder trade vary widely, and their
overlapping and shifting nature makes their complexity difficult to gauge. The categories of
NTBs considered in our penalty include:
• Quantity restrictions;
o Import quotas; export limitations; voluntary export restraints; import–export
embargoes and bans; countertrade, etc.
• Price restrictions;
o Antidumping duties; countervailing duties; border tax adjustments and variable
levies/tariff rate quotas.
• Regulatory restrictions;
o Licensing; domestic content and mixing requirements; sanitary and
phytosanitary standards (SPSs); safety and industrial standards regulations;
packaging, labelling, and trademark regulations; advertising and media
regulations.
PRIVILEGED & CONFIDENTIAL
RBB Economics Page 72
• Investment restrictions ;
o Exchange and other financial controls.
• Customs restrictions, and;
o Advance deposit requirements; customs valuation procedures; customs
classification procedures; customs clearance procedures.
• Direct government intervention;
o Subsidies and other aid; government industrial policy and regional development
measures; government-financed research and other technology policies;
national taxes and social insurance; competition policies; immigration policies;
government procurement policies; state trading, government monopolies, and
exclusive franchises.
Gathering data on tariffs to make a consistent cross-country comparison is a challenging task.
Unlike data on inflation, for instance, countries do not report their weighted average tariff rate or
simple average tariff rate every year; in some cases, the most recent year for which a country
reported its tariff data could be as far back as 1999. To preserve consistency in grading the
trade policy component, the Index uses the most recently reported weighted average tariff rate
for a country from our primary source. If another reliable source reports more updated
information on the country’s tariff rate, this fact is noted, and the grading of this component may
be reviewed if there is strong evidence that the most recently reported weighted average tariff
rate is outdated.
The World Bank produces the most comprehensive and consistent information on weighted
average applied tariff rates. When the weighted average applied tariff rate is not available,
the Index uses the country’s average applied tariff rate; and when the country’s average applied
tariff rate is not available, the weighted average or the simple average of most favoured nation
(MFN) tariff rates is used. In the very few cases where data on duties and customs revenues
are not available, data on international trade taxes or an estimated effective tariff rate are used
instead. In all cases, an effort is made to clarify the type of data used and the different sources
for those data in the corresponding write-up for the trade policy component.
Sources: Unless otherwise noted, the Index relies on the following sources to determine scores
for trade policy, in order of priority: World Bank, World Development Indicators 2010 and Data
on Trade and Import Barriers: Trends in Average Applied Tariff Rates in Developing and
Industrial Countries, 1981–2009; World Trade Organization, Trade Policy Review, 1995–2010;
Office of the U.S. Trade Representative, 2010 National Trade Estimate Report on Foreign
Trade Barriers; World Bank, Doing Business 2010 and Doing Business 2011; U.S. Department
of Commerce, Country Commercial Guide, 2008–2010; Economist Intelligence Unit, Country
Report and Country Commerce, 2008–2010; and official government publications of each
country.

PRIVILEGED & CONFIDENTIAL
RBB Economics Page 73
A.3 Chilean Press Coverage
A.3.1 Introduction
Press coverage prior to the acquisition of D&S by Wal-Mart was essentially focused on three
issues:
• Wal-Mart’s apparent resistance to the unionisation of its labour force;
• Wal-Mart’s apparent legacy of human rights abuses; and
• Wal-Mart’s alleged attempt to reduce economic freedom.
In the sections that follow, we elaborate on each of these issues.
A.3.2 Anti-union
Chile’s central trade union organisation stated that they would boycott Wal-Mart if they were to
“try to impose the policies they have in other countries”, noting Wal-Mart’s “antiunion conduct”.36
A.3.3 Abusers of human rights
President of the Lider Intercompany Labour Union indicated that “Wal-Mart’s systematic
violation of human rights and employment rights of its workers” was his greatest concern
associated with the acquisition of D&S by Wal-Mart.37
This view is primarily concerned with the
human rights of D&S workers and more specifically members of the Lider Intercompany Labour
Union. However, Wal-Mart are also said to be exploiters of human rights around the world.
A.3.4 Limiting of free competition
There was a lot of press covering the fact that Wal-Mart would not allow products from countries
such as Cuba, Venezuela, Iraq and Iran to be sold in D&S stores. This issue became seen as a
restriction of economic freedom and was investigated by the National Economic Prosecutor as
potential anti-competitive action. 38,39,40
However, the complaint was dismissed by the
Prosecutor on the basis that the conduct did not give rise to any anti-competitive effect.
36
“Chilean Workers Unions Threaten Wal-Mart ‘Boycott’”, Bloomberg Wire Service. 37
“Wal-Mart put on alert D&S workers”, La Nacion page 16. 38
“Cencosud ‘welcomes’ Wal-Mart with Aggressive Publicity Campaign”, Economia y Negocios page B6. Available:
http://www.nexchannel.cl/nexchannel/noticias/noticia_pescrita.php?nota=3206084 39
“National Economic Prosecutor to investigate D&S restrictions on foreign products following Wal-Mart purchase”, Negocios page 27.
Available: http://www.nexchannel.cl/nexchannel/noticias/noticia_pescrita.php?nota=3202281 40
“National Economic Prosecutor investigates Wal- Mart´s ‘blockade’ on Cuban products”, Economia y Negocios page B8. Available:
http://www.nexchannel.cl/nexchannel/noticias/noticia_pescrita.php?nota=3202638

PRIVILEGED & CONFIDENTIAL
RBB Economics Page 74
It was also seen as the imposition of restrictions by a foreign power.41
Therefore, the issue was
about more than the fact that there were certain goods that consumers would not be able to
purchase in D&S stores, but one of Wal-Mart’s disrespect for the local economy and its
consumers.42
41
Ibid, page B6 42
“Wal Mart”, El Diario Financiero page 2. Available: http://www.nexchannel.cl/nexchannel/noticias/noticia_pescrita.php?nota=3205547
PRIVILEGED & CONFIDENTIAL
RBB Economics Page 75
A.4 Market Share Calculation Methodology
General Merchandise
The total General Merchandise market is defined using GfK estimates, broken down by
divisions and product groups.43
This means that firm-level estimates of General Merchandise
sales need to exclude products not included in the GfK estimates to avoid an overestimation of
these market shares. Below we explain how each firm’s General Merchandise sales were
calculated:
• Game figures are based on overall Massdiscounters sales. Game accounts for 97% of
these sales and Dion Wired accounts for 3%. Therefore, 97% of Massdiscounter’s
General Merchandise sales were allocated to Game. Moreover, only certain General
Merchandise products were included to match those included in the GfK figures.44
• Makro figures are those allocated to Masswarehouse. Similarly to Game, only certain
products were included so as to match those included in the GfK figures.
• Dion Wired figures were based on the remaining 3% of Massdiscounters General
Merchandise sales. Again, only GfK products were included.
• Incredible Connection and Hi-Fi Corporation General Merchandise sales were assumed
to be 100% of total sales. Since a breakdown of Incredible Connection and Hi-Fi
Corporation’s sales is not available, an assumption had to be made to account for the
fact that many products sold by these companies would not have been included in the
GfK figures. The assumption made is that the proportion of GfK General Merchandise
products sold by Incredible Connection and Hi-Fi Corporation is the same as the
proportion sold by Dion Wired. Hence, this is estimated to be 80% by Massmart
management.
• Shoprite and Pick ‘n Pay General Merchandise figures were assumed to be 20% of total
sales. Moreover, 50% of these sales were assumed to be of GfK products. Therefore,
the figure included for Shoprite and Pick ‘n Pay sales of GfK General Merchandise
products is 10% of their total sales.
• Stax sales figures were not available, but its market share was assumed by Massmart
management to be equal to Dion Wired’s market share. Using this and the market total,
sales figures were estimated.
• Finally, to ensure that the firm’s sales added up to the market total estimated by GfK, an
entry for other firms selling General Merchandise is included.
43
These divisions and product groups are Seasonal & Small, Major Appliances, Audio and Visual, Photographic, IT/Office, Telecoms,
Sports Shoes, Paint and Power Tools. 44
Products included are appliances excluding floor care, sports clothing, Hi-Tech excluding Games and Software and Movies VHS as
well as multimedia including Gaming and Software

PRIVILEGED & CONFIDENTIAL
RBB Economics Page 76
These figures predominantly relate to retail sales of General Merchandise.
Food Retail
Nielsen data is used to estimate the size of the market. However, the Nielsen data only
includes figure for the four major retailers (Pick ‘n Pay, Shoprite, Spar and Woolworths). Hence,
the approach taken is as follows:
• Using publically released market shares for the top four food retailers and the Nielsen
data, sales figures for these four retailers are estimated.
• Massmart have information on food retail their stores, which is then added to the
Nielsen total to give an estimated market total for food retail.
• The implied sales figures of the top four retailers as well as the two Massmart retailers
are then used to estimate market shares.
Food Wholesale
BMI figures are used to estimate the size of the food wholesale market. Massmart
management have then estimated, based on experience, the market shares of each competitor.
Home Improvement
Massmart figures are based on Building and Home Improvement sales through Massbuild,
Massdiscounters and Masswholesalers. Sales figures for competing Home Improvement
retailers are obtained from the 2010 Massbuild Strategy Document and from the internal
Datawarehouse. These figures relate predominantly to retail sales of Home Improvement
products.
Liquor
Market share data for Liquor is obtained from Nielsen. These market shares contain
information for both wholesalers and retailers, meaning that there is the potential for double-
counting. This is due to the fact that many retailers labelled as “Other” may have purchased
stock from one of the wholesalers included in the market share calculations.

PRIVILEGED & CONFIDENTIAL
RBB Economics Page 77
A.5 Full Results of Advantage Supplier Survey in Chile