the metabolomic profile of gamma-irradiated human … · this remained the case until the problem...
TRANSCRIPT
The metabolomic profile of gamma-irradiated human hepatoma and musclecells reveals metabolic changes consistentwith the Warburg effect
Min Wang1,2, Adrian Keogh3, Susan Treves4, Jeffrey R. Idle2 andDiren Beyoglu2
1 Institute of Integrated TCM and West Medicine, Medical College, Lanzhou University, Lanzhou
City, Gansu Province, P.R. China2 Hepatology Research Group, Department of Clinical Research, University of Bern, Bern,
Switzerland3 Visceral and Transplantation Surgery, Department of Clinical Research, University of Bern,
Bern, Switzerland4 Departments of Anesthesia and Biomedicine, University Hospital Basel, Basel, Switzerland
ABSTRACTThe two human cell lines HepG2 from hepatoma and HMCL-7304 from striated
muscle were g-irradiated with doses between 0 and 4 Gy. Abundant gH2AX foci were
observed at 4 Gy after 4 h of culture post-irradiation. Sham-irradiated cells showed
no gH2AX foci and therefore no signs of radiation-induced double-strand DNA
breaks. Flow cytometry indicated that 41.5% of HepG2 cells were in G2/M and this
rose statistically significantly with increasing radiation dose reaching a plateau at
∼47%. Cell lysates from both cell lines were subjected to metabolomic analysis using
Gas Chromatography-Mass Spectrometry (GCMS). A total of 46 metabolites could
be identified by GCMS in HepG2 cell lysates and 29 in HMCL-7304 lysates, most of
which occurred in HepG2 cells. Principal Components Analysis (PCA) showed a
clear separation of sham, 1, 2 and 4 Gy doses. Orthogonal Projection to Latent
Structures-Discriminant Analysis (OPLS-DA) revealed elevations in intracellular
lactate, alanine, glucose, glucose 6-phosphate, fructose and 5-oxoproline, which were
found by univariate statistics to be highly statistically significantly elevated at both 2
and 4 Gy compared with sham irradiated cells. These findings suggested upregulation
of cytosolic aerobic glycolysis (theWarburg effect), with potential shunting of glucose
through aldose reductase in the polyol pathway, and consumption of reduced
Glutathione (GSH) due to g-irradiation. In HMCL-7304 myotubes, a putative
Warburg effect was also observed only at 2 Gy, albeit a lesser magnitude than in
HepG2 cells. It is anticipated that these novel metabolic perturbations following
g-irradiation of cultured cells will lead to a fuller understanding of themechanisms of
tissue damage following ionizing radiation exposure.
Subjects Biochemistry, Cell biology
Keywords Gamma-irradiation, HepG2 cells, HMCL-7304 myotubes, Metabolomics, GCMS,
Warburg effect
How to cite this article Wang et al. (2016), The metabolomic profile of gamma-irradiated human hepatoma and muscle cells reveals
metabolic changes consistent with the Warburg effect. PeerJ 4:e1624; DOI 10.7717/peerj.1624
Submitted 12 November 2015Accepted 4 January 2016Published 26 January 2016
Corresponding authorDiren Beyoglu,
Academic editorChandan Goswami
Additional Information andDeclarations can be found onpage 15
DOI 10.7717/peerj.1624
Copyright2016 Wang et al.
Distributed underCreative Commons CC-BY 4.0

INTRODUCTIONThere is an ever increasing threat from the terrorist use of nuclear isotopes. To date, the
only intentional exposure of humans to ionizing radiation from a nuclear device occurred
during the first use of the atomic bomb at Hiroshima and Nagasaki on 6 and 9 August
1945, respectively. Accidental exposures have also occurred. Ten persons were subjected to
bursts of ionizing radiation at the Los Alamos Scientific Laboratory in accidents that
occurred on 21 August 1945 and 21May 1946 (Hempelmann, Lisco & Hoffman, 1952). The
estimated median combined X-ray and g-ray dose to these subjects was 2.7 Gy (range 0.27
to 18 Gy). The two highest exposed persons died while the others made a full recovery
(Hempelmann, Lisco & Hoffman, 1952). These unfortunate accidents provided the first
opportunity to examine both blood and urine for the footprints of high-dose radiation
exposure. The blood chemistry provided no results that were either specific or of
significance. In contrast, the subjects who had received the highest doses of radiation
exhibited urinary concentrations of amino acids in the range 1 to 2 mg/ml, most notable
of which was the excretion of taurine (Hempelmann, Lisco & Hoffman, 1952). These
human findings were soon replicated rats receiving 8 to 25 Gy X-irradiation (Kay &
Entenman, 1954) and confirmed by others in the rat (Aebi et al., 1955) and in four human
subjects accidentally exposed to g-irradiation and neutrons at the Argonne National
Laboratory (Katz & Hasterlik, 1955).
A rat model of acute radiation sickness was studied in the former USSR.
Administration of 2 or 4 mCi 90Sr to rats caused a marked increase in the urinary excretion
of thymidine (Uspenskaia & Rabinkova, 1965), with 8-fold increases reported in another
study (Zharkov, Fedorova & Mikhailova, 1965). Enhanced urinary excretion of the
related nucleoside pseudouridine was observed in cancer patients receiving X-ray therapy
and in rats receiving whole-body X-irradiation. The authors believed that the spleen
contributed largely to these findings (Portmann et al., 2013). The early literature,
therefore, described the elevated urinary excretion of both amino acids and nucleosides in
humans and rats exposed to large doses of ionizing radiation.
This remained the case until the problem was readdressed using high-throughput
metabolomic technologies in the recent past. The pattern described four to five decades
earlier has essentially remained the same, but with more related metabolites added.
Interestingly, both taurine and thymidine have persisted as in vivo urinary biomarkers of
ionizing radiation exposure in the mouse, rat and rhesus monkey (Johnson et al., 2011;
Johnson et al., 2012; Tyburski et al., 2008, Tyburski et al., 2009).
There has been a recent concerted effort to discover biomarkers of ionizing radiation
exposure that could lend themselves to high-throughput minimally-invasive population
screening in the event of intentional or accidental mass exposures to radiation.
Metabolomics has been part of this effort (Johnson et al., 2011; Johnson et al., 2012; Laiakis,
Hyduke & Fornace, 2012; Laiakis et al., 2014; Lanz et al., 2009; Manna et al., 2013;
Tyburski et al., 2008, Tyburski et al., 2009). Despite the uncovering of radiation biomarkers,
little, if anything, is known about their cellular origins. Irradiation of cells in culture could
help fill this knowledge gap.
Wang et al. (2016), PeerJ, DOI 10.7717/peerj.1624 2/18
Irradiation of cultured cells has a long history, beginning with chick embryo
fibroblasts given X-ray doses of 1 to 10 Gy in an attempt to improve the efficacy of X-ray
therapy with radiosensitizers (Mitchell & Simon-Reuss, 1952). More recently, both human
fibroblast and lymphoblast cell lines have been g-irradiated to define biomarkers of
ionizing radiation that might assist with human in vivo studies (Patterson et al., 2008).
While clear metabolomic phenotypes were found for doses of between 0.5 and 8 Gy, the
only identified metabolites were those that were depleted by cellular irradiation; for
example, GSH and AMP. No positive biomarkers of ionizing irradiation were reported
(Patterson et al., 2008). In an effort to redress this deficiency and to define biomarkers of
exposure to ionizing radiation in human cells in culture, we have conducted a study of
g-irradiation of the human hepatocellular carcinoma cell line HepG2 and human skeletal
muscle cell line HMCL-7304 using gas chromatography-mass spectrometry based
metabolomics. Cell lines from liver and skeletal muscle were chosen because these tissues
represent the major stores of taurine (Awapara, 1956), the historical biomarker for
ionizing radiation (see above), and therefore perhaps are tissues that are sensitive to
ionizing radiation.
MATERIALS AND METHODSCell cultureHepG2 cells were supplied frozen by ATCC (LGC Standards GmbH, Wesel, Germany).
Cells were cultured to 90% confluence in T75 culture flasks in DMEM containing 10%
FBS and 100 U/ml penicillin/100 mg/ml streptomycin (Life Technologies, Carlsbad, CA,
USA), as described (Portmann et al., 2013), then split 3:1 and subcultured in T75 flasks.
HMCL-7304 human myotubes were derived from an immortalized myoblast cell line that
had been established from the intercostal skeletal muscle of a female donor with no
neuromuscular disorder (Rokach et al., 2013) and that had been maintained at the
University of Basel. Cells were cultured in PromoCell skeletal muscle cell growth medium
(Vitaris AG, Baar, Switzerland) in a low oxygen environment (5% O2 and 5% CO2), as
described (Rokach et al., 2013). Differentiation to myotubes was induced by culture in
PromoCell skeletal muscle differentiation medium (Vitaris) and, after 5 days,
multinucleated myotubes were visible under low magnification and referred to as
HMCL-7304 cells (Rokach et al., 2013).
Gamma-irradiation of cellsCell culture flasks containing 4 � 106 cells were g-irradiated in groups of six using a
Gammacell 40 Exactor (Best Theratronics, Ottawa, Canada). The irradiator was fitted
with two 137Cs sources (above and below) with an activity of 1800 Ci/67 TBq and
delivering 1.0 Gy/min. Nominal radiation doses of 0, 1, 2 and 4 Gy were employed. Sham
irradiation (0 Gy) was achieved by placing the culture flasks in the irradiator for 2 min
without irradiation. Immediately after irradiation, cells were cultured for a further 4 h.
One flask of HepG2 cells at each dose was used for FACS and fluorescence
immunohistochemical (IHC) analyses and five flasks were used for metabolomic analysis.
HMCL-7304 myotubes were subjected only to metabolomic analysis after irradiation.
Wang et al. (2016), PeerJ, DOI 10.7717/peerj.1624 3/18
Determination of the cellular effects of g-irradiationIt is necessary to obtain evidence that g-irradiation produced characteristic changes to the
cells at the doses employed. Therefore, HepG2 cell cultures that were submitted to
metabolomic analysis were also analyzed for evidence of radiation damage by two
methods. Firstly, flow cytometry was performed for the purposes both of cell counting
and for evaluating the cell cycle stage of all cell cultures using a FACS LSR II flow
cytometer (BD Biosciences, Allschwil, Switzerland). For cell cycle staging, propidium
iodide staining was used after RNase I treatment of combined adherent and floating cells
(Pang et al., 2013; Shabalina et al., 1999). Combined adherent and floating cells were
counted by flow cytometry (Brunck et al., 2014) using BD Trucount absolute counting
tubes (BD Biosciences). Secondly, cells were examined using IHC for gH2AX foci as
evidence of DNA double strand breaks, as previously described (Zhao et al., 2013). Neither
flow cytometry nor IHC was performed on HMCL-7304 myotubes.
Gas chromatography-mass spectrometry based metabolomicsAdherent cells were removed by gentle scraping, washed twice with ice-cold PBS, spun,
resuspended in ice-cold distilled water and briefly sonicated to liberate water-soluble
metabolites as described (Patterson et al., 2008). Briefly, aqueous supernatants were first
blown to dryness at 40 �C under a gentle stream of N2. Dry residues were derivatized first
with methoxyamine hydrochloride and then BSTFA containing 1% TMCS (N,O-bis
[trimethylsilyl]trifluoroacetamide/trimethylchlorosilane) and samples analyzed by Gas
Chromatography-Mass Spectrometry (GCMS) as described (Fahrner et al., 2012; Semmo
et al., 2015), with data collected at retention times 13 to 63 min. QC samples, prepared
from aliquots of each cell lysate, were included and analyzed as the first five samples
injected and then interspersed between every fifth analytical sample.
Two independent criteria were used for the identification of HepG2 and HMCL-7304
cellular metabolites. Firstly, the mass spectra of each peak in the chromatograms were
compared with a spectral library that contained 276,248 electron-impact mass spectra
from 242,466 compounds (NIST 14 Mass Spectral Library, MS Wil GmbH, Wil,
Switzerland). Only spectral matches of >90% were accepted for provisional identification.
Secondly, mass spectra and retention times of each peak were compared with those from
an in-house library of >100 authentic compounds that are found commonly in human
biofluids and cell lysates. Spectral comparisons and retention times matches within
±0.05 min were accepted for peak annotation. Finally, peaks that were present in solvent
and water blanks, such as glycerol monopaltimate and monostearate, which appeared
to derive from laboratory plasticware, were neither quantitated nor included in the
metabolomic analysis. Leaching of lipids molecules from laboratory plasticware has been
described (McDonald et al., 2008).
Relative concentrations of each identified peak were derived, first using AutoQuant in
the onboard Agilent software ChemStation, and then with QuantBrowser GCMS software
(Leoson BV, Middelburg, The Netherlands) using the Peak Area Ratio (PAR) to the
internal standard 4-chlorophenylacetic acid, present in each chromatogram as its
trimethylsilyl ester. The resulting spreadsheet of PARs for each annotated metabolite was
Wang et al. (2016), PeerJ, DOI 10.7717/peerj.1624 4/18
imported into SIMCA 13 (Umetrics, Malmo, Sweden) for multivariate data analysis using
unsupervised Principal Components Analysis (PCA), supervised Projection to Latent
Structures-Discriminant Analysis (PLS-DA) and Orthogonal PLS-DA (OPLS-DA), as
described (Semmo et al., 2015).
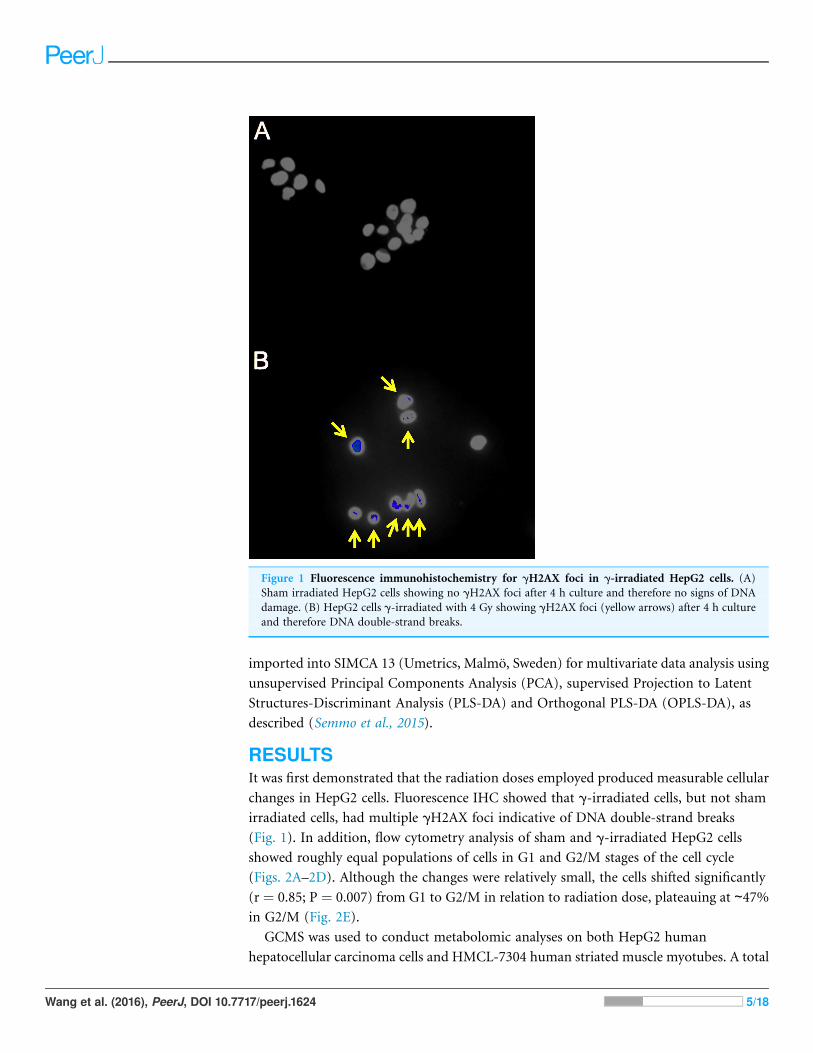
RESULTSIt was first demonstrated that the radiation doses employed produced measurable cellular
changes in HepG2 cells. Fluorescence IHC showed that g-irradiated cells, but not sham
irradiated cells, had multiple gH2AX foci indicative of DNA double-strand breaks
(Fig. 1). In addition, flow cytometry analysis of sham and g-irradiated HepG2 cells
showed roughly equal populations of cells in G1 and G2/M stages of the cell cycle
(Figs. 2A–2D). Although the changes were relatively small, the cells shifted significantly
(r ¼ 0.85; P ¼ 0.007) from G1 to G2/M in relation to radiation dose, plateauing at ∼47%in G2/M (Fig. 2E).
GCMS was used to conduct metabolomic analyses on both HepG2 human
hepatocellular carcinoma cells and HMCL-7304 human striated muscle myotubes. A total
Figure 1 Fluorescence immunohistochemistry for gH2AX foci in g-irradiated HepG2 cells. (A)
Sham irradiated HepG2 cells showing no gH2AX foci after 4 h culture and therefore no signs of DNA
damage. (B) HepG2 cells g-irradiated with 4 Gy showing gH2AX foci (yellow arrows) after 4 h culture
and therefore DNA double-strand breaks.
Wang et al. (2016), PeerJ, DOI 10.7717/peerj.1624 5/18

of 46 compounds were identified unequivocally in g-irradiated HepG2 cell lysates, using
both library spectra (>90%match) and a collection of more than 100 authentic standards.
These HepG2 cell metabolites are listed in Table 1 and the most prominent 17 are
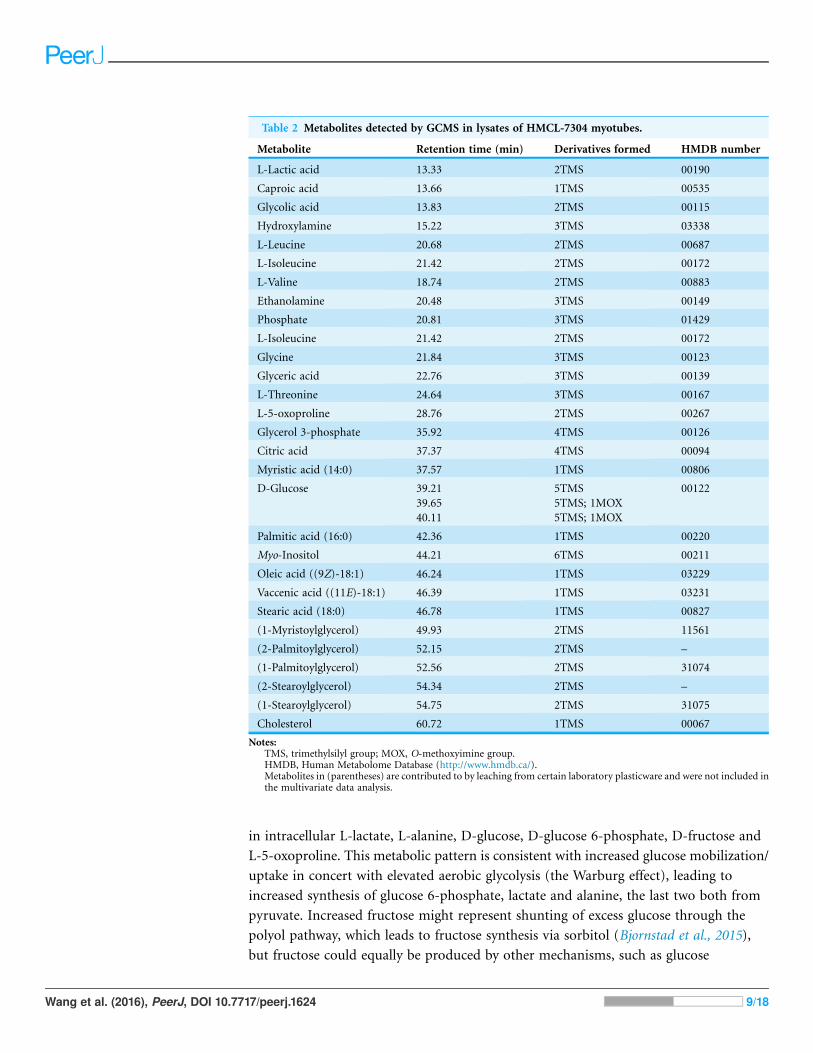
shown in Fig. 3A. In the case of g-irradiated HMCL-7304 myotubes, the resulting peaks
(Fig. 3B) were smaller and, as Table 2 shows, it was only possible to identify
29 metabolites, all of which were also present in the HepG2 cell lysates.
The GCMS data from 20 cultures of HepG2 cells and 12 cultures of HMCL-7304
myotubes were subjected to multivariate data analysis, first by PCA, which shows the
internal structure of the dataset and identifies any outliers. Figure 4A shows the PCA
scores plot for g-irradiated HepG2 cell lysates, with clustering of the sham, 1 Gy, 2 Gy and
4 Gy flasks. When a PLS-DA model was built for these data (Fig. 4B), the sham, 1 Gy, 2 Gy
and 4 Gy clusters were all resolved. In order to check that the supervised analysis had not
over-fitted the data, a leave-one-out cross-validation was performed with 100
permutations (Fig. 4C). Because the permuted correlation (R2) and predictability (Q2)
Figure 2 Cell cycle analysis of g-irradiated HepG2 cells. Flow cytometry of HepG2 cells after different
doses of g-irradiation. (A) Sham irradiated. (B) 1 Gy irradiation. (C) 2 Gy irradiated. (D) 4 Gy irra-
diated. (E) Relationship between radiation dose (Gy) and proportion of cells in G2/M. There occurs a
slight and saturable shift from G1 to G2/M with increasing dose of g-irradiation.
Wang et al. (2016), PeerJ, DOI 10.7717/peerj.1624 6/18
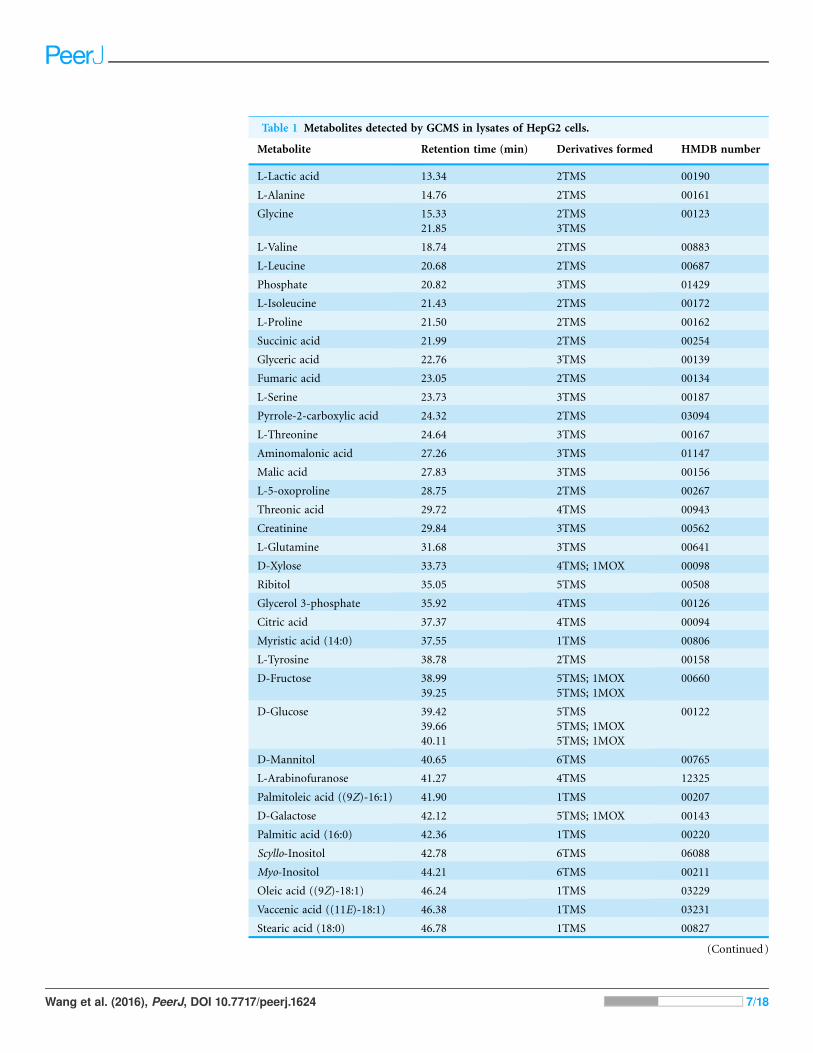
Table 1 Metabolites detected by GCMS in lysates of HepG2 cells.
Metabolite Retention time (min) Derivatives formed HMDB number
L-Lactic acid 13.34 2TMS 00190
L-Alanine 14.76 2TMS 00161
Glycine 15.33
21.85
2TMS
3TMS
00123
L-Valine 18.74 2TMS 00883
L-Leucine 20.68 2TMS 00687
Phosphate 20.82 3TMS 01429
L-Isoleucine 21.43 2TMS 00172
L-Proline 21.50 2TMS 00162
Succinic acid 21.99 2TMS 00254
Glyceric acid 22.76 3TMS 00139
Fumaric acid 23.05 2TMS 00134
L-Serine 23.73 3TMS 00187
Pyrrole-2-carboxylic acid 24.32 2TMS 03094
L-Threonine 24.64 3TMS 00167
Aminomalonic acid 27.26 3TMS 01147
Malic acid 27.83 3TMS 00156
L-5-oxoproline 28.75 2TMS 00267
Threonic acid 29.72 4TMS 00943
Creatinine 29.84 3TMS 00562
L-Glutamine 31.68 3TMS 00641
D-Xylose 33.73 4TMS; 1MOX 00098
Ribitol 35.05 5TMS 00508
Glycerol 3-phosphate 35.92 4TMS 00126
Citric acid 37.37 4TMS 00094
Myristic acid (14:0) 37.55 1TMS 00806
L-Tyrosine 38.78 2TMS 00158
D-Fructose 38.99
39.25
5TMS; 1MOX
5TMS; 1MOX
00660
D-Glucose 39.42
39.66
40.11
5TMS
5TMS; 1MOX
5TMS; 1MOX
00122
D-Mannitol 40.65 6TMS 00765
L-Arabinofuranose 41.27 4TMS 12325
Palmitoleic acid ((9Z)-16:1) 41.90 1TMS 00207
D-Galactose 42.12 5TMS; 1MOX 00143
Palmitic acid (16:0) 42.36 1TMS 00220
Scyllo-Inositol 42.78 6TMS 06088
Myo-Inositol 44.21 6TMS 00211
Oleic acid ((9Z)-18:1) 46.24 1TMS 03229
Vaccenic acid ((11E)-18:1) 46.38 1TMS 03231
Stearic acid (18:0) 46.78 1TMS 00827
(Continued)
Wang et al. (2016), PeerJ, DOI 10.7717/peerj.1624 7/18

fell below 0.3 and 0, respectively, the data were not over-fitted and the PLS-DA model was
therefore valid. An OPLS-DA loadings S-plot was then employed to detect the upregulated
metabolites in HepG2 cell lysates after 2 Gy g-irradiation (Fig. 4D). D-Glucose (1),
L-lactate (2), L-5-oxoproline (3), L-alanine (4), D-fructose (5), D-glucose 6-phosphate
(6) and succinate (7) were all considered as candidates for upregulated metabolites and,
together with citrate, were subjected to univariate statistics. Figure 5 shows that 2 Gy
g-irradiation of HepG2 cells led to a highly statistically significant (P < 0.001) increase
Table 1 (continued).
Metabolite Retention time (min) Derivatives formed HMDB number
Mannitol 1-phosphate 49.13 7TMS 01530
D-Glucose-6-phosphate 49.35 6TMS 01401
(1-Myristoylglycerol) 49.92 2TMS 11561
Uridine 50.96 3TMS 00296
(1-Palmitoylglycerol) 52.56 2TMS 31074
(2-Stearoylglycerol) 54.33 2TMS –
(1-Stearoylglycerol) 54.74 2TMS 31075
Cholesterol 60.71 1TMS 00067
Notes:TMS, trimethylsilyl group; MOX, O-methoxyimine group.HMDB, Human Metabolome Database (http://www.hmdb.ca/).Metabolites in (parentheses) are contributed to by leaching from certain laboratory plasticware and were not included inthe multivariate data analysis.
Figure 3 GCMS chromatograms for irradiated HepG2 hepatocellular carcinoma cells and HMCL-
7304 myotubes. Cell lysates after g-irradiation were derivatized with BSTFA/TMCS and MOX (see
text). (A) HepG2 cell chromatogram. (B) HMCL-7304 myotube chromatogram. I.S. means internal
standard (4-chlorophenylacetic acid). 1 ¼ lactic acid; 2 ¼ L-alanine; 3 ¼ ethanolamine; 4 ¼ phosphate;
5 ¼ glyceric acid; 6 ¼ L-threonine; 7 ¼ L-5-oxoproline; 8 ¼ glycerol 3-phosphate; 9 ¼ citric acid;
10 ¼ D-fructose; 11 ¼ D-glucose; 12 ¼ palmitic acid; 13 ¼ myo-inositol; 14 ¼ oleic acid; 15 ¼ vaccenic
acid; 16 ¼ stearic acid; 17 ¼ cholesterol; X ¼ background contaminating peaks from reagents and
laboratory plasticware.
Wang et al. (2016), PeerJ, DOI 10.7717/peerj.1624 8/18
in intracellular L-lactate, L-alanine, D-glucose, D-glucose 6-phosphate, D-fructose and
L-5-oxoproline. This metabolic pattern is consistent with increased glucose mobilization/
uptake in concert with elevated aerobic glycolysis (the Warburg effect), leading to
increased synthesis of glucose 6-phosphate, lactate and alanine, the last two both from
pyruvate. Increased fructose might represent shunting of excess glucose through the
polyol pathway, which leads to fructose synthesis via sorbitol (Bjornstad et al., 2015),
but fructose could equally be produced by other mechanisms, such as glucose
Table 2 Metabolites detected by GCMS in lysates of HMCL-7304 myotubes.
Metabolite Retention time (min) Derivatives formed HMDB number
L-Lactic acid 13.33 2TMS 00190
Caproic acid 13.66 1TMS 00535
Glycolic acid 13.83 2TMS 00115
Hydroxylamine 15.22 3TMS 03338
L-Leucine 20.68 2TMS 00687
L-Isoleucine 21.42 2TMS 00172
L-Valine 18.74 2TMS 00883
Ethanolamine 20.48 3TMS 00149
Phosphate 20.81 3TMS 01429
L-Isoleucine 21.42 2TMS 00172
Glycine 21.84 3TMS 00123
Glyceric acid 22.76 3TMS 00139
L-Threonine 24.64 3TMS 00167
L-5-oxoproline 28.76 2TMS 00267
Glycerol 3-phosphate 35.92 4TMS 00126
Citric acid 37.37 4TMS 00094
Myristic acid (14:0) 37.57 1TMS 00806
D-Glucose 39.21
39.65
40.11
5TMS
5TMS; 1MOX
5TMS; 1MOX
00122
Palmitic acid (16:0) 42.36 1TMS 00220
Myo-Inositol 44.21 6TMS 00211
Oleic acid ((9Z)-18:1) 46.24 1TMS 03229
Vaccenic acid ((11E)-18:1) 46.39 1TMS 03231
Stearic acid (18:0) 46.78 1TMS 00827
(1-Myristoylglycerol) 49.93 2TMS 11561
(2-Palmitoylglycerol) 52.15 2TMS –
(1-Palmitoylglycerol) 52.56 2TMS 31074
(2-Stearoylglycerol) 54.34 2TMS –
(1-Stearoylglycerol) 54.75 2TMS 31075
Cholesterol 60.72 1TMS 00067
Notes:TMS, trimethylsilyl group; MOX, O-methoxyimine group.HMDB, Human Metabolome Database (http://www.hmdb.ca/).Metabolites in (parentheses) are contributed to by leaching from certain laboratory plasticware and were not included inthe multivariate data analysis.
Wang et al. (2016), PeerJ, DOI 10.7717/peerj.1624 9/18
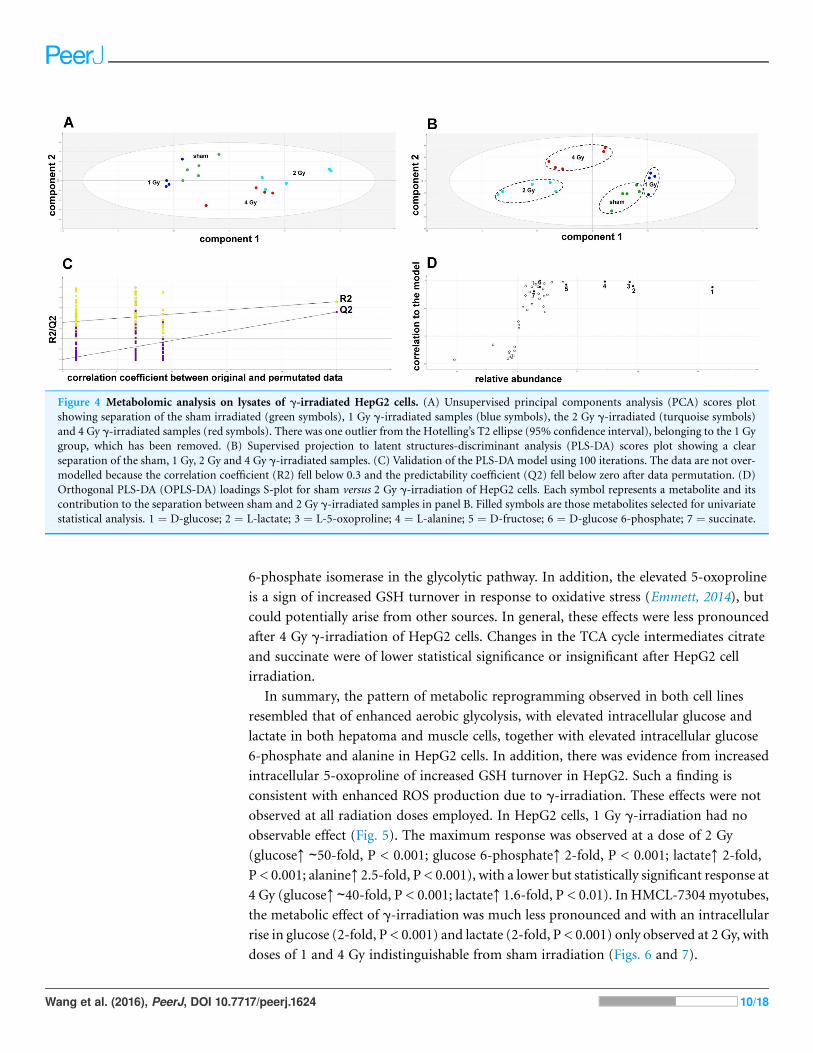
6-phosphate isomerase in the glycolytic pathway. In addition, the elevated 5-oxoproline
is a sign of increased GSH turnover in response to oxidative stress (Emmett, 2014), but
could potentially arise from other sources. In general, these effects were less pronounced
after 4 Gy g-irradiation of HepG2 cells. Changes in the TCA cycle intermediates citrate
and succinate were of lower statistical significance or insignificant after HepG2 cell
irradiation.
In summary, the pattern of metabolic reprogramming observed in both cell lines
resembled that of enhanced aerobic glycolysis, with elevated intracellular glucose and
lactate in both hepatoma and muscle cells, together with elevated intracellular glucose
6-phosphate and alanine in HepG2 cells. In addition, there was evidence from increased
intracellular 5-oxoproline of increased GSH turnover in HepG2. Such a finding is
consistent with enhanced ROS production due to g-irradiation. These effects were not
observed at all radiation doses employed. In HepG2 cells, 1 Gy g-irradiation had no
observable effect (Fig. 5). The maximum response was observed at a dose of 2 Gy
(glucoseC ∼50-fold, P < 0.001; glucose 6-phosphateC 2-fold, P < 0.001; lactateC 2-fold,
P < 0.001; alanineC 2.5-fold, P < 0.001), with a lower but statistically significant response at
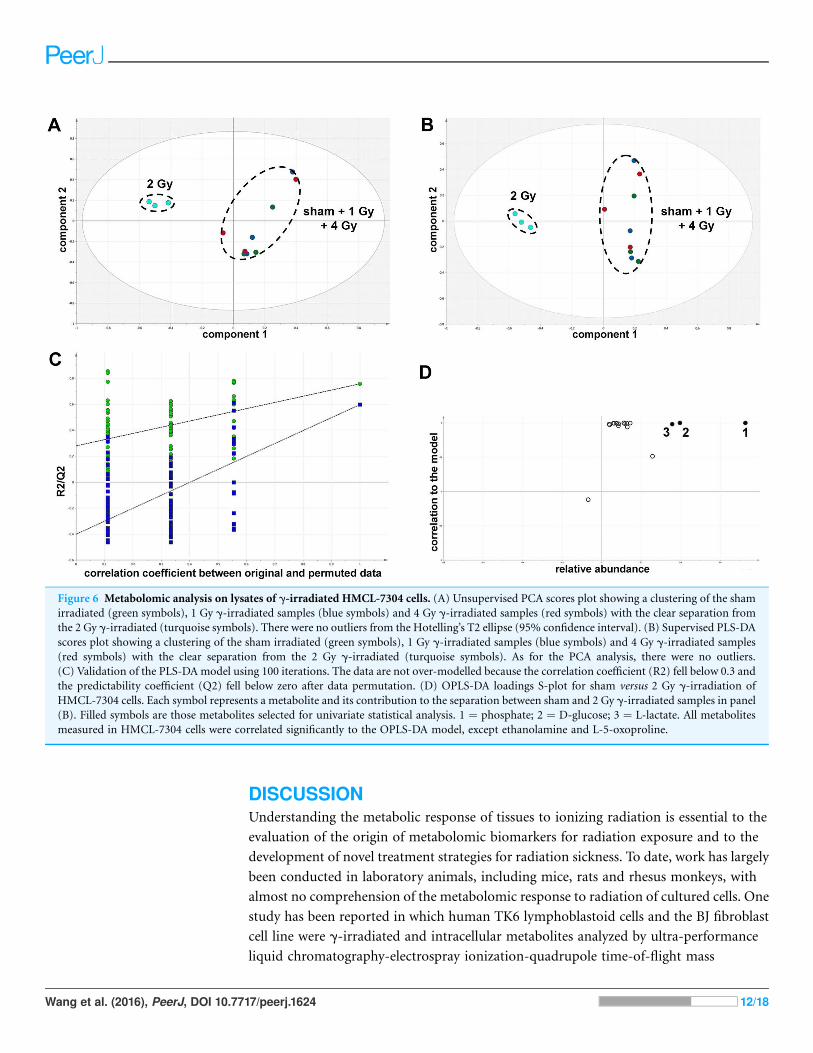
4 Gy (glucoseC ∼40-fold, P < 0.001; lactateC 1.6-fold, P < 0.01). In HMCL-7304 myotubes,
the metabolic effect of g-irradiation was much less pronounced and with an intracellular
rise in glucose (2-fold, P < 0.001) and lactate (2-fold, P < 0.001) only observed at 2 Gy, with
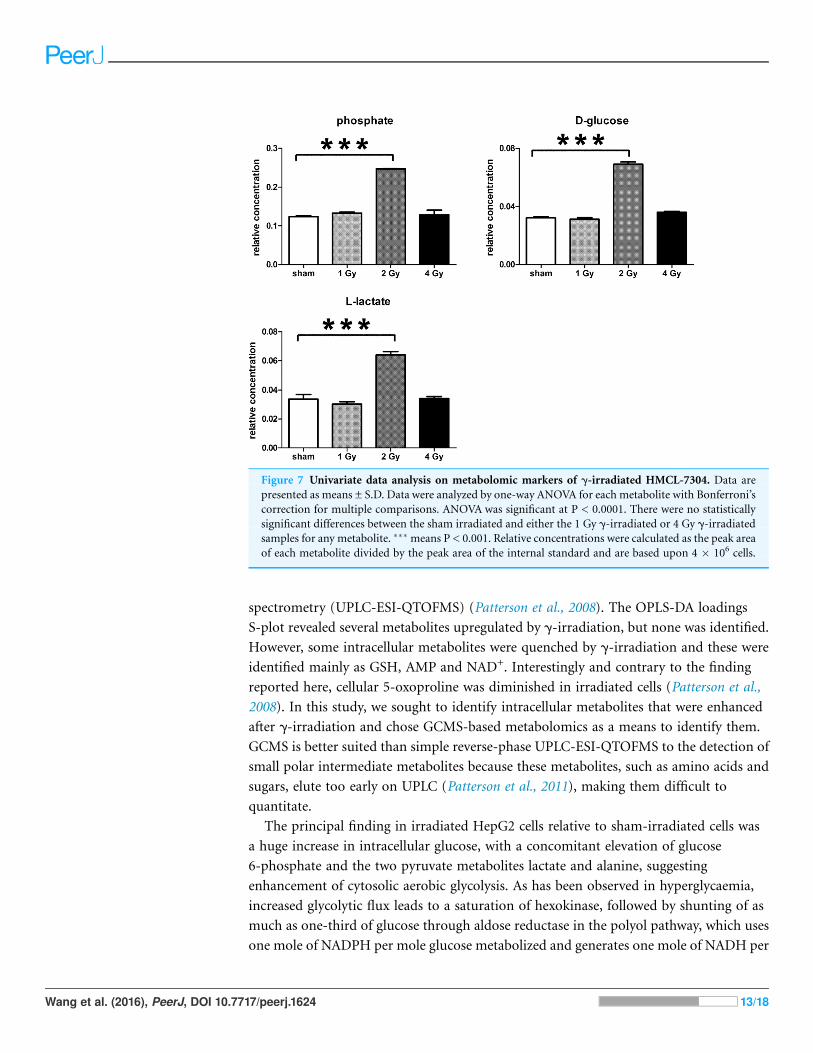
doses of 1 and 4 Gy indistinguishable from sham irradiation (Figs. 6 and 7).
Figure 4 Metabolomic analysis on lysates of g-irradiated HepG2 cells. (A) Unsupervised principal components analysis (PCA) scores plot
showing separation of the sham irradiated (green symbols), 1 Gy g-irradiated samples (blue symbols), the 2 Gy g-irradiated (turquoise symbols)
and 4 Gy g-irradiated samples (red symbols). There was one outlier from the Hotelling’s T2 ellipse (95% confidence interval), belonging to the 1 Gy
group, which has been removed. (B) Supervised projection to latent structures-discriminant analysis (PLS-DA) scores plot showing a clear
separation of the sham, 1 Gy, 2 Gy and 4 Gy g-irradiated samples. (C) Validation of the PLS-DA model using 100 iterations. The data are not over-
modelled because the correlation coefficient (R2) fell below 0.3 and the predictability coefficient (Q2) fell below zero after data permutation. (D)
Orthogonal PLS-DA (OPLS-DA) loadings S-plot for sham versus 2 Gy g-irradiation of HepG2 cells. Each symbol represents a metabolite and its
contribution to the separation between sham and 2 Gy g-irradiated samples in panel B. Filled symbols are those metabolites selected for univariate
statistical analysis. 1 ¼ D-glucose; 2 ¼ L-lactate; 3 ¼ L-5-oxoproline; 4 ¼ L-alanine; 5 ¼ D-fructose; 6 ¼ D-glucose 6-phosphate; 7 ¼ succinate.
Wang et al. (2016), PeerJ, DOI 10.7717/peerj.1624 10/18

Figure 5 Univariate data analysis on metabolomic markers of g-irradiated HepG2 cells.Data are presented asmeans ± standard deviation (S.D.).
Data were analyzed by one-way ANOVA for each metabolite with Bonferroni’s correction for multiple comparisons. ANOVA was significant at
P < 0.0001. There were no statistically significant differences between the sham irradiated and 1 Gy g-irradiated samples for any metabolite. � means
P < 0.05; �� means P < 0.01; ��� means P < 0.001; n.s. means not statistically significant. Relative concentrations were calculated as the peak area of
each metabolite divided by the peak area of the internal standard and are based upon 4 � 106 cells.
Wang et al. (2016), PeerJ, DOI 10.7717/peerj.1624 11/18
DISCUSSIONUnderstanding the metabolic response of tissues to ionizing radiation is essential to the
evaluation of the origin of metabolomic biomarkers for radiation exposure and to the
development of novel treatment strategies for radiation sickness. To date, work has largely
been conducted in laboratory animals, including mice, rats and rhesus monkeys, with
almost no comprehension of the metabolomic response to radiation of cultured cells. One
study has been reported in which human TK6 lymphoblastoid cells and the BJ fibroblast
cell line were g-irradiated and intracellular metabolites analyzed by ultra-performance
liquid chromatography-electrospray ionization-quadrupole time-of-flight mass
Figure 6 Metabolomic analysis on lysates of g-irradiated HMCL-7304 cells. (A) Unsupervised PCA scores plot showing a clustering of the sham
irradiated (green symbols), 1 Gy g-irradiated samples (blue symbols) and 4 Gy g-irradiated samples (red symbols) with the clear separation from
the 2 Gy g-irradiated (turquoise symbols). There were no outliers from the Hotelling’s T2 ellipse (95% confidence interval). (B) Supervised PLS-DA
scores plot showing a clustering of the sham irradiated (green symbols), 1 Gy g-irradiated samples (blue symbols) and 4 Gy g-irradiated samples
(red symbols) with the clear separation from the 2 Gy g-irradiated (turquoise symbols). As for the PCA analysis, there were no outliers.
(C) Validation of the PLS-DAmodel using 100 iterations. The data are not over-modelled because the correlation coefficient (R2) fell below 0.3 and
the predictability coefficient (Q2) fell below zero after data permutation. (D) OPLS-DA loadings S-plot for sham versus 2 Gy g-irradiation of
HMCL-7304 cells. Each symbol represents a metabolite and its contribution to the separation between sham and 2 Gy g-irradiated samples in panel
(B). Filled symbols are those metabolites selected for univariate statistical analysis. 1 ¼ phosphate; 2 ¼ D-glucose; 3 ¼ L-lactate. All metabolites
measured in HMCL-7304 cells were correlated significantly to the OPLS-DA model, except ethanolamine and L-5-oxoproline.
Wang et al. (2016), PeerJ, DOI 10.7717/peerj.1624 12/18
spectrometry (UPLC-ESI-QTOFMS) (Patterson et al., 2008). The OPLS-DA loadings
S-plot revealed several metabolites upregulated by g-irradiation, but none was identified.
However, some intracellular metabolites were quenched by g-irradiation and these were
identified mainly as GSH, AMP and NAD+. Interestingly and contrary to the finding
reported here, cellular 5-oxoproline was diminished in irradiated cells (Patterson et al.,
2008). In this study, we sought to identify intracellular metabolites that were enhanced
after g-irradiation and chose GCMS-based metabolomics as a means to identify them.
GCMS is better suited than simple reverse-phase UPLC-ESI-QTOFMS to the detection of
small polar intermediate metabolites because these metabolites, such as amino acids and
sugars, elute too early on UPLC (Patterson et al., 2011), making them difficult to
quantitate.
The principal finding in irradiated HepG2 cells relative to sham-irradiated cells was
a huge increase in intracellular glucose, with a concomitant elevation of glucose
6-phosphate and the two pyruvate metabolites lactate and alanine, suggesting
enhancement of cytosolic aerobic glycolysis. As has been observed in hyperglycaemia,
increased glycolytic flux leads to a saturation of hexokinase, followed by shunting of as
much as one-third of glucose through aldose reductase in the polyol pathway, which uses
one mole of NADPH per mole glucose metabolized and generates one mole of NADH per
Figure 7 Univariate data analysis on metabolomic markers of g-irradiated HMCL-7304. Data are
presented as means ± S.D. Data were analyzed by one-way ANOVA for each metabolite with Bonferroni’s
correction for multiple comparisons. ANOVA was significant at P < 0.0001. There were no statistically
significant differences between the sham irradiated and either the 1 Gy g-irradiated or 4 Gy g-irradiatedsamples for any metabolite. ��� means P < 0.001. Relative concentrations were calculated as the peak area
of each metabolite divided by the peak area of the internal standard and are based upon 4 � 106 cells.
Wang et al. (2016), PeerJ, DOI 10.7717/peerj.1624 13/18

mole of fructose produced from the intermediate sorbitol (Yabe-Nishimura, 1998). GSH is
a principal defense against oxidative stress in the liver and recycling of oxidized glutathione
toGSH is carried out by glutathione reductase, for whichNADPH is an obligatory cofactor.
The reciprocal relationship between GSH and ROS has been demonstrated in HepG2 cells
(Kim et al., 2010). In addition, when a transgenic mouse with a disrupted polyol pathway
(Ho et al., 2000) was rendered short-term diabetic with streptozotocin-induced superoxide
formation, GSH depletion and subsequent DNA damage, as seen in similarly treated
wild-type mice, was not observed (Ho et al., 2006). Therefore, there is a clear relationship
between shunting of excess glucose through the polyol pathway, GSH depletion and DNA
damage. However, we have no evidence that the polyol pathway was activated in our
irradiated cells, simply the conjecture that the excess glucose load makes it possible that
some additional glucose is handled by aldose reductase and the polyol pathway.
In g-irradiated HMCL-7304 myotubes, a simpler but similar metabolic pattern was
observed, with elevated intracellular glucose and lactate. Unlike HepG2, this cell line was
not derived from cancer cells, but rather from skeletal muscle of a 19 year-old healthy
donor and a cell line developed by retroviral knock-in of the TERT and CDK4 genes
(Rokach et al., 2013). These cells are therefore not expected to display significant aerobic
glycolysis. However, after g-irradiation, HMCL-7304 myotubes plainly demonstrated the
metabolic fingerprint of upregulated aerobic glycolysis, with increased intracellular
glucose and enhanced lactate production.
The potential augmentation of the Warburg effect was not observed at all radiation
doses. In both cell lines, there was no statistically significant difference between the sham-
irradiated and the 1 Gy dose, indicating a clear threshold for putative upregulation of
aerobic glycolysis by g-irradiation. For HepG2 cells, both 2 Gy and 4 Gy stimulated large
and highly statistically significant increases in intracellular glucose, but the increases in
both lactate and alanine were more pronounced at 2 Gy compared to 4 Gy. In contrast,
only 2 Gy g-irradiation stimulated assumed aerobic glycolysis in HMCL-7304 myotubes.
Therefore, it would appear that the highest radiation dose reduced the magnitude of the
metabolic reprogramming. This may be due to increased genotoxicity at the 4 Gy dose,
since g-irradiation of FL5.12 cells with a dose of 20 Gy, resulted in decreases in both
glucose uptake and glycolysis 24 h after irradiation (Zhou, Vander Heiden & Rudin, 2002).
We also observed a high proportion of cells (∼47%) in G2/M at the highest radiation dose.
It has recently been reported that human cervical carcinoma SiHa cells, both wild-type
and a sub-clone with impaired mitochondrial respiration, moved from 21–31% to
46–47% in G2/M 24 h after a dose of 5 Gy g-irradiation (Bol et al., 2015). Our findings,
both of the dose-response relationship with respect to a possible Warburg effect, together
with cell cycle behaviour, are consistent with the reports of others.
Our contention that g-irradiation augmented cytosolic aerobic glycolysis in two cell
lines derived from liver and muscle may have implications for the prevention or
amelioration of tissue toxicity after exposure to ionizing radiation. This would be
especially pertinent in cases where vast numbers of persons were exposed to varying doses,
for example, in the case of a terrorist incident involving either a radiation or a nuclear
device. Ionizing radiation generates hydroxyl radicals through radiolysis of intracellular
Wang et al. (2016), PeerJ, DOI 10.7717/peerj.1624 14/18

water and these highly-reactive and short-lived species lead to a state of oxidative stress
that has been estimated to be responsible for 70% of the tissue damage that results from
ionizing radiation (Anuranjani & Bala, 2014). The metabolic reprogramming we observed
in HepG2 cells caused a huge rise in intracellular glucose. It is likely that this may result in
a flux of glucose through aldose reductase and the polyol pathway, with a resulting
decrement of NADPH and thus depleted glutathione reductase activity. This will also
compromise GSH production and the defense against oxidative stress, leading to
enhanced tissue damage. If confirmed, these findings provide clues to new potential
therapeutic and preventative interventions for radiation sickness.
CONCLUSIONSIt is concluded from metabolomic profiles that g-irradiation of human cell lines derived
from liver and striated muscle causes a metabolic reprogramming consistent with
amplified cytosolic aerobic glycolysis. Further investigation of this putative radiation-
induced Warburg effect may lead to novel prevention and treatment strategies for
radiation-induced tissue damage.
ACKNOWLEDGEMENTSWe would like to thank Kjetil Johnsen of Johnsen Consulting and Services, Geneva for
GCMS instrument maintenance and training.
ADDITIONAL INFORMATION AND DECLARATIONS
FundingThis work was funded by the Imperial Tobacco Limited, UK (JRI, DB) and in part by
NIH/NIAID grant U19 AI067773-10 (JRI). Min Wang was in receipt of a scholarship
from China Scholarship Council, Ministry of Education, PR China. The funders had no
role in study design, data collection and analysis, decision to publish, or preparation of the
manuscript.
Grant DisclosuresThe following grant information was disclosed by the authors:
NIH/NIAID: U19 AI067773-10.
Competing InterestsThe authors declare that they have no competing interests.
Author Contributions� Min Wang performed the experiments, analyzed the data, reviewed drafts of the paper.
� Adrian Keogh conceived and designed the experiments, performed the experiments,
contributed reagents/materials/analysis tools, reviewed drafts of the paper.
� Susan Treves conceived and designed the experiments, contributed reagents/materials/
analysis tools, reviewed drafts of the paper.
Wang et al. (2016), PeerJ, DOI 10.7717/peerj.1624 15/18

� Jeffrey R. Idle conceived and designed the experiments, contributed reagents/materials/
analysis tools, wrote the paper, prepared figures and/or tables, reviewed drafts of the
paper.
� Diren Beyoglu conceived and designed the experiments, analyzed the data, contributed
reagents/materials/analysis tools, wrote the paper, prepared figures and/or tables,
reviewed drafts of the paper.
Data DepositionThe following information was supplied regarding data availability:
http://dx.doi.org/10.6084/m9.figshare.1529823
http://dx.doi.org/10.6084/m9.figshare.1529824
Supplemental InformationSupplemental information for this article can be found online at http://dx.doi.org/
10.7717/peerj.1624#supplemental-information.
REFERENCESAebi H, Bernays L, Fluckiger H, Schmidli B, Zuppinger A. 1955. Taurine excretion in roentgen
and betatron-irradiated rats. Helvetica Physiol Pharmacol Acta 13:C49–C51.
Anuranjani, Bala M. 2014. Concerted action of Nrf2-ARE pathway, MRN complex, HMGB1 and
inflammatory cytokines–implication in modification of radiation damage. Radox Biology
2(1):832–846 DOI 10.1016/j.redox.2014.02.008.
Awapara J. 1956. The taurine concentration of organs from fed and fasted rats. Journal of Biological
Chemistry 218:571–576.
Bjornstad P, Lanaspa MA, Ishimoto T, Kosugi T, Kume S, Jalal D, Maahs DM, Snell-Bergeon JK,
Johnson RJ, Nakagawa T. 2015. Fructose and uric acid in diabetic nephropathy. Diabetologia
58(9):1993–2002 DOI 10.1007/s00125-015-3650-4.
BolV,BolA,BouzinC,LabarD,Lee JA, JanssensG,PorporatoPE, SonveauxP, FeronO,GregoireV.
2015. Reprogramming of tumor metabolism by targeting mitochondria improves tumor response
to irradiation. Acta Oncologica 54(2):266–274 DOI 10.3109/0284186X.2014.932006.
Brunck ME, Andersen SB, Timmins NE, Osborne GW, Nielsen LK. 2014. Absolute counting of
neutrophils in whole blood using flow cytometry. Cytometry Part A 85(12):1057–1064
DOI 10.1002/cyto.a.22503.
Emmett M. 2014. Acetaminophen toxicity and 5-oxoproline (pyroglutamic acid): a tale of two
cycles, one an ATP-depleting futile cycle and the other a useful cycle. Clinical Journal of the
American Society of Nephrology 9(1):191–200 DOI 10.2215/CJN.07730713.
Fahrner R, Beyoglu D, Beldi G, Idle JR. 2012. Metabolomic markers for intestinal ischemia in a
mouse model. Journal of Surgical Research 178(2):879–887 DOI 10.1016/j.jss.2012.08.011.
Hempelmann LH, Lisco H, Hoffman JG. 1952. The acute radiation syndrome: a study of nine
cases and a review of the problem. Annals of Internal Medicine 36:279–510.
Ho EC, Lam KS, Chen YS, Yip JC, Arvindakshan M, Yamagishi S, Yagihashi S, Oates PJ, Ellery
CA, Chung SS, Chung SK. 2006. Aldose reductase-deficient mice are protected from delayed
motor nerve conduction velocity, increased c-Jun NH2-terminal kinase activation, depletion of
reduced glutathione, increased superoxide accumulation, and DNA damage. Diabetes
55(7):1946–1953 DOI 10.2337/db05-1497.
Wang et al. (2016), PeerJ, DOI 10.7717/peerj.1624 16/18
Ho HT, Chung SK, Law JW, Ko BC, Tam SC, Brooks HL, Knepper MA, Chung SS. 2000. Aldose
reductase-deficient mice develop nephrogenic diabetes insipidus.Molecular and Cellular Biology
20:5840–5846.
Johnson CH, Patterson AD, Krausz KW, Lanz C, Kang DW, Luecke H, Gonzalez FJ, Idle JR.
2011. Radiation metabolomics. 4. UPLC-ESI-QTOFMS-Based metabolomics for urinary
biomarker discovery in gamma-irradiated rats. Radiation Research 175(4):473–484
DOI 10.1667/RR2437.1.
Johnson CH, Patterson AD, Krausz KW, Kalinich JF, Tyburski JB, Kang DW, Luecke H,
Gonzalez FJ, Blakely WF, Idle JR. 2012. Radiation metabolomics. 5. Identification of urinary
biomarkers of ionizing radiation exposure in nonhuman primates by mass spectrometry-based
metabolomics. Radiation Research 178:328–340.
Katz EJ, Hasterlik RJ. 1955. Aminoaciduria following total-body irradiation in the human. Journal
of the National Cancer Institute 15:1085–1107.
Kay RE, Entenman C. 1954. Free amino acids in the tissues and urine of the X-irradiated rat.
Federation Proceedings 13:520–521.
Kim SJ, Jung HJ, Hyun DH, Park EH, Kim YM, Lim CJ. 2010. Glutathione reductase plays an
anti-apoptotic role against oxidative stress in human hepatoma cells. Biochimie 92(8):927–932
DOI 10.1016/j.biochi.2010.03.007.
Laiakis EC, Hyduke DR, Fornace AJ. 2012. Comparison of mouse urinary metabolic profiles after
exposure to the inflammatory stressors gamma radiation and lipopolysaccharide. Radiation
Research 177:187–199.
Laiakis EC, Mak TD, Anizan S, Amundson SA, Barker CA, Wolden SL, Brenner DJ,
Fornace AJ Jr. 2014. Development of a metabolomic radiation signature in urine from patients
undergoing total body irradiation. Radiation Research 181(4):350–361 DOI 10.1667/RR13567.1.
Lanz C, Patterson AD, Slavik J, Krausz KW, LedermannM, Gonzalez FJ, Idle JR. 2009. Radiation
metabolomics. 3. Biomarker discovery in the urine of gamma-irradiated rats using a simplified
metabolomics protocol of gas chromatography-mass spectrometry combined with random
forests machine learning algorithm. Radiation Research 172(2):198–212 DOI 10.1667/RR1796.1.
Manna SK, Krausz KW, Bonzo JA, Idle JR, Gonzalez FJ. 2013. Metabolomics reveals aging-
associated attenuation of noninvasive radiation biomarkers in mice: potential role of polyamine
catabolism and incoherent DNA damage-repair. Journal of Proteome Research 12(5):2269–2281
DOI 10.1021/pr400161k.
McDonald GR, Hudson AL, Dunn SM, You H, Baker GB, Whittal RM, Martin JW, Jha A,
Edmondson DE, Holt A. 2008. Bioactive contaminants leach from disposable laboratory
plasticware. Science 322(5903):917 DOI 10.1126/science.1162395.
Mitchell JS, Simon-Reuss I. 1952. Experiments on the mechanism of action of tetra-sodium
2-methyl-1: 4. naphthohydroquinone diphosphate as a mitotic inhibitor and radiosensitiser,
using the technique of tissue culture. Experimental methods and quantitative results. British
Journal of Cancer 6:305–316.
Pang XL, He G, Liu YB, Wang Y, Zhang B. 2013. Endoplasmic reticulum stress sensitizes human
esophageal cancer cell to radiation. World Journal of Gastroenterology 19(11):1736–1748
DOI 10.3748/wjg.v19.i11.1736.
Patterson AD, Li H, Eichler GS, Krausz KW, Weinstein JN, Fornace AJ Jr., Gonzalez FJ, Idle JR.
2008. UPLC-ESI-TOFMS-based metabolomics and gene expression dynamics inspector
self-organizing metabolomic maps as tools for understanding the cellular response to ionizing
radiation. Analytical Chemistry 80(3):665–674 DOI 10.1021/ac701807v.
Wang et al. (2016), PeerJ, DOI 10.7717/peerj.1624 17/18
Patterson AD, Bonzo JA, Li F, Krausz KW, Eichler GS, Aslam S, Tigno X, Weinstein JN, Hansen
BC, Idle JR, Gonzalez FJ. 2011. Metabolomics reveals attenuation of the SLC6A20 kidney
transporter in nonhuman primate and mouse models of type 2 diabetes mellitus. Journal of
Biological Chemistry 286:19511–19522 DOI 10.1074/jbc.M111.221739.
Portmann S, Fahrner R, Lechleiter A, Keogh A, Overney S, Laemmle A, Mikami K, Montani M,
Tschan MP, Candinas D, Stroka D. 2013. Antitumor effect of SIRT1 inhibition in human HCC
tumor models in vitro and in vivo. Molecular Cancer Therapeutics 12:499–508
DOI 10.1158/1535-7163.MCT-12-0700.
Rokach O, Ullrich ND, Rausch M, Mouly V, Zhou H, Muntoni F, Zorzato F, Treves S. 2013.
Establishment of a human skeletal muscle-derived cell line: biochemical, cellular and
electrophysiological characterization. Biochemical Journal 455(2):169–177
DOI 10.1042/BJ20130698.
Semmo N, Weber T, Idle JR, Beyoglu D. 2015.Metabolomics reveals that aldose reductase activity
due to AKR1B10 is upregulated in hepatitis C virus infection. Journal of Viral Hepatitis
22:617–624 DOI 10.1111/jvh.12376.
Shabalina IG, Panaretakis T, Bergstrand A, DePierre JW. 1999. Effects of the rodent peroxisome
proliferator and hepatocarcinogen, perfluorooctanoic acid, on apoptosis in human hepatoma
HepG2 cells. Carcinogenesis 20:2237–2246.
Tyburski JB, Patterson AD, Krausz KW, Slavik J, Fornace AJ Jr., Gonzalez FJ, Idle JR. 2008.
Radiation metabolomics. 1. Identification of minimally invasive urine biomarkers for gamma-
radiation exposure in mice. Radiation Research 170(1):1–14 DOI 10.1667/RR1265.1.
Tyburski JB, Patterson AD, Krausz KW, Slavik J, Fornace AJ Jr., Gonzalez FJ, Idle JR. 2009.
Radiation metabolomics. 2. Dose- and time-dependent urinary excretion of deaminated
purines and pyrimidines after sublethal gamma-radiation exposure in mice. Radiation Research
172(1):42–57 DOI 10.1667/RR1703.1.
Uspenskaia MS, Rabinkova EV. 1965. The excretion of thymidine in the urine in Sr90-injured rats.
Meditsinskaia Radiologiia 10:19–22.
Yabe-Nishimura C. 1998. Aldose reductase in glucose toxicity: a potential target for the prevention
of diabetic complications. Pharmacological Reviews 50:21–33.
Zhao J, Guo Z, Zhang H, Wang Z, Song L, Ma J, Pei S, Wang C. 2013. The potential value of the
neutral comet assay and gammaH2AX foci assay in assessing the radiosensitivity of carbon
beam in human tumor cell lines. Radiology and Oncology 47(3):247–257
DOI 10.2478/raon-2013-0045.
Zharkov IA, Fedorova TA, Mikhailova LF. 1965. The excretion of thymidine in the urine of rats
after total body x-ray irradiation in various doses. Radiobiologiia 5:675–680.
Zhou R, Vander Heiden MG, Rudin CM. 2002. Genotoxic exposure is associated with alterations
in glucose uptake and metabolism. Cancer Research 62(12):3515–3520.
Wang et al. (2016), PeerJ, DOI 10.7717/peerj.1624 18/18