the michigan context and performance report card
TRANSCRIPT

By Ben DeGrow and Ronald Klingler
THE MICHIGAN CONTEXT AND PERFORMANCE REPORT CARD
PUBL IC ELEMENTARY AND M IDDLE SCHOOLS , 2017
See where your school ranks!
mackinac.org/CAP2017

The Mackinac Center for Public Policy is a nonpartisan research and educational institute dedicated to improving the quality
of life for all Michigan residents by promoting sound solutions to state and local policy questions. The Mackinac Center assists
policymakers, scholars, businesspeople, the media and the public by providing objective analysis of Michigan issues. The goal
of all Center reports, commentaries and educational programs is to equip Michigan residents and other decision makers to better
evaluate policy options. The Mackinac Center for Public Policy is broadening the debate on issues that have for many years
been dominated by the belief that government intervention should be the standard solution. Center publications and programs,
in contrast, offer an integrated and comprehensive approach that considers:
All Institutions. The Center examines the important role of voluntary associations,
communities, businesses and families, as well as government.
All People. Mackinac Center research recognizes the diversity of Michigan residents and treats
them as individuals with unique backgrounds, circumstances and goals.
All Disciplines. Center research incorporates the best understanding of economics, science, law,
psychology, history and morality, moving beyond mechanical cost-benefit analysis.
All Times. Center research evaluates long-term consequences, not simply short-term impact.
Committed to its independence, the Mackinac Center for Public Policy neither seeks nor accepts any government funding. The
Center enjoys the support of foundations, individuals and businesses that share a concern for Michigan’s future and recognize the
important role of sound ideas. The Center is a nonprofit, tax-exempt organization under Section 501(c)(3) of the Internal Revenue
Code. For more information on programs and publications of the Mackinac Center for Public Policy, please contact:
Mackinac Center for Public Policy 140 West Main Street P.O. Box 568 Midland, Michigan 48640
989-631-0900 Fax: 989-631-0964 Mackinac.org [email protected]
© 2018 by the Mackinac Center for Public Policy, Midland, Michigan
ISBN: 978-1-942502-23-4 | S2018-03 | Mackinac.org/s2018-03
140 West Main Street P.O. Box 568 Midland, Michigan 48640
989-631-0900 Fax 989-631-0964 Mackinac.org [email protected]

The Mackinac Center for Public Policy
The Michigan Context and Performance Report Card: Public Elementary and
Middle Schools, 2017 By Ben DeGrow and Ronald Klingler
©2018 by the Mackinac Center for Public Policy Midland, Michigan
Guarantee of Quality Scholarship
The Mackinac Center for Public Policy is committed to delivering the highest quality and most reliable research on Michigan issues. The Center guarantees that all original factual data are true and correct and that information attributed to other sources is accurately represented.
The Center encourages rigorous critique of its research. If the accuracy of any material fact or reference to an independent source is questioned and brought to the Center’s attention with supporting evidence, the Center will respond in writing. If an error exists, it will be noted in a correction that will accompany all subsequent distribution of the publication. This constitutes the complete and final remedy under this guarantee.


The Michigan Context and Performance Report Card: Public Elementary and Middle Schools, 2017 i
Mackinac Center for Public Policy
Contents
Contents ............................................................................................................................................................................... i
Introduction ....................................................................................................................................................................... 1
Data and Methods ............................................................................................................................................................. 2
Test Score Data ........................................................................................................................................................................ 3
Classifying Schools .................................................................................................................................................................. 3
2017 Selected Results ....................................................................................................................................................... 5
The Top 100 Public Elementary and Middle Schools ...................................................................................................... 5
The Bottom 100 Public Elementary and Middle Schools ............................................................................................... 7
Long-Term Trends in CAP Scores ............................................................................................................................. 10
Most Improved and Largest Declines ................................................................................................................................ 10
100 Most Improved Public Elementary and Middle Schools ....................................................................................... 11
100 Largest Declines Among Public Elementary and Middle Schools ....................................................................... 13
Sustained Performance ......................................................................................................................................................... 15
Sustained High Performance: Top 100 Public Elementary and Middle Schools ...................................................... 15
Sustained Low Performance: Bottom 100 Public Elementary and Middle Schools ................................................. 18
About the Authors .......................................................................................................................................................... 21
Appendix A: Calculating CAP Scores and Letter Grades ..................................................................................... 22
Calculating CAP Scores........................................................................................................................................................ 22
Appendix B: Locale Codes ............................................................................................................................................ 24


The Michigan Context and Performance Report Card: Public Elementary and Middle Schools, 2017 1
Mackinac Center for Public Policy
Introduction
This report represents the third in a series designed to measure the academic performance of Michigan elementary and middle schools, and the first of the series to use results from the M-STEP assessment. Similar report cards were published in 2013 and 2015, based on different but overlapping years of scores on the defunct Michigan Educational Assessment Program.
The Context and Performance Report Card stands apart from standard measures of academic performance. It controls for the differences in students’ socioeconomic status at each school. This provides a more accurate appraisal of a school’s performance, since higher rates of student poverty are strongly correlated with lower academic subject test scores. Without this needed adjustment, school report cards could overrate the effectiveness of schools with relatively affluent student populations or underrate the effectiveness of schools with less affluent students.
The CAP report card also does not rely on creating a benchmark for “good” school performance. Rather, a school’s score on the report card is based entirely on how well that school performs compared only to other schools. A high “CAP Score” means only that a school performs well compared to its peers.
As with prior editions, the report card uses multiple years of student achievement data so as not to allow one year’s results to unduly influence a school’s ratings. In this case, three years of M-STEP data for third through eighth grade subject tests are incorporated into determining a school’s CAP Score.

The Michigan Context and Performance Report Card: Public Elementary and Middle Schools, 2017 2
Mackinac Center for Public Policy
Data and Methods
The research methodology used for this report card is based on a 2006 University of Arkansas study and previously published Mackinac Center report cards (see Appendix A for more detail). It uses regression analysis to predict how well each school would perform given the socioeconomic makeup of their students and given the average test scores of other schools. Schools are then ranked by how well they performed on state standardized tests relative to their predicted performance.
Student socioeconomic status is measured using data collected for the federal National School Lunch Program. The percentage of students who qualify to receive lunch assistance due to family income, as reported by the Michigan Department of Education, informs the analysis that generates each CAP Score. For the 2016-17 school year, the last year of testing data surveyed in this report, a student from a family of four with an annual household income of $31,590 or less would qualify for a federally subsidized free lunch. * As with previous editions, the portion of students eligible for a partially subsidized lunch was not included in the regression analysis. Prior research found that the share of reduced-priced lunch students did not have a strong statistical relationship with academic performance and so was not included in the statistical analysis in the interest of keeping the model as simple as possible.
This report uses grade-level data on free lunch status to generate an expected score for each M-STEP subject test at each grade level. As an example, a school’s average scale score in fourth-grade science was regressed against the share of free lunch students counted in the school’s fourth-grade student population.
A small note of caution is in order regarding the family poverty indicator. Some education policy experts have pointed out the limitations of using federal lunch subsidy eligibility as an identifier of student poverty. † Expanded criteria for eligibility has boosted the share of free and reduced-price lunch students nationally to almost 50 percent. The larger the portion of students who qualify for this program in the aggregate the less statistical meaningful this variable would likely become as a proxy for students’ socioeconomic status.
While that represents a legitimate concern for the continued use of the indicator in many contexts, the impact on the generation of CAP Scores is mostly small. This analysis provides comparisons in terms of relative performance and relative poverty. Overall, these rates remain the best available proxy for identifying student socioeconomic status.
* Federal Register, Vol. 81, No. 56, Pg. 15503, https://perma.cc/WFX9-7YWN.
† Michael J. Petrilli, “No, Half of American Schoolchildren Are Not ‘Low-Income,’” Education Next, Oct. 6, 2017, https://perma.cc/QX39-SRRA.

The Michigan Context and Performance Report Card: Public Elementary and Middle Schools, 2017 3
Mackinac Center for Public Policy
Test Score Data In 2014, Michigan discarded the MEAP test in favor of the new Michigan Student Test of Educational Progress, or M-STEP. The first three years of M-STEP data — 2014 through 2016 — were used to generate the CAP Scores in this report. A school’s total CAP Score is an average of the CAP Scores for each year. Each grade level was equally weighted to determine a yearly CAP Score, regardless of the different number of tests administered at certain grade levels.
Results from as many as 16 different individual tests could factor into each year’s CAP Score, and up to 48 tests for the overall CAP Score. Students in grades three through eight are assessed in both mathematics and English language arts. Over the same grade span, two different groups of students also take tests in science (fourth and seventh grade) and social studies (fifth and eighth grade).
Most schools do not serve students in all grades three through eight; therefore, most schools received their CAP Score based on fewer than 48 test results. Schools without reported average M-STEP scale scores from at least one grade level in each of the 2016 and 2017 testing years were excluded from the grading. Also excluded were schools designated to primarily and exclusively serve students with special needs, as were schools designated as “alternative education” schools.
To generate a score, M-STEP subject tests were first normalized for each grade and subject test in each year. The CAP Score for each individual test in a given year then was averaged to determine a year-specific CAP Score. For most schools, the three-year scores were averaged together to generate the overall CAP Score. Some schools generated an overall CAP Score based on only two years of available data — mostly due to opening or first serving students in tested grades during the 2015-16 school year.
A CAP Score of 100 indicates that a school performed exactly as expected, given the socioeconomic status of its student population. A score greater than 100 means a school exceeded expectations, while a score lower than 100 means a school achieved below expectations. CAP Scores on this edition of the report card ranged from a low of 64.2 to a high of 138.8.
More details about how the scores were calculated can be found in "Appendix A: Calculating CAP Scores and Letter Grades."
Classifying Schools Overall CAP Scores were issued for a total of 2,261 Michigan public elementary and middle schools. The results can be broken down by type of school. As in previous years, most are conventional schools operated by one of the state’s 540 geographically based school districts. These schools are the default assignments for students who enroll in public school based on where they reside.
Roughly 12 percent of the sample are public charter schools that operate independently through a contract with a public authorizing agency and are often operated by private management companies. Like conventional schools, charters must serve all students who apply, but students must actively enroll to fill available slots. The list of 2,261 schools is rounded out by a handful of district-operated selective schools with policies that require students to demonstrate a certain level of academic performance in order to enroll.

The Michigan Context and Performance Report Card: Public Elementary and Middle Schools, 2017 4
Mackinac Center for Public Policy
Graphic 1: Types of Public Elementary and Middle Schools, 2015-2017
School Type Number of Schools
Percentage of Schools
Conventional 1,983 87.70%
Charter 267 11.81%
Selective 11 0.49%
Total 2,261 100%
Source: Authors' calculations based on analysis of MDE data.
As in previous editions, schools that receive CAP Scores have been broken down by geographic “locale codes.” These codes indicate whether a school is located in an urban, suburban, town or rural area, as assigned by the federal National Center for Education Statistics. Specific descriptions of each locale category can be found in “Appendix B: Locale Codes.”
Nearly 64 percent of the graded Michigan schools are located in urban or suburban settings. The share of suburban schools has increased to 39 percent from 35 percent in the 2013 CAP report card. Meanwhile, the share of rural schools in the analysis has declined from 29 percent in 2013 to 24 percent today. The number of schools located in towns has inched up from previous editions.
Graphic 2: Public Elementary and Middle Schools by Locale, 2015-2017
Locale Number of schools
Percentage of Total
City: Large 140 6.19%
City: Midsize 151 6.68%
City: Small 271 11.99%
City: Total 562 24.86%
Suburb: Large 690 30.52%
Suburb: Midsize 103 4.56%
Suburb: Small 87 3.85%
Suburb: Total 880 38.92%
Town: Fringe 100 4.42%
Town: Distant 95 4.20%
Town: Remote 90 3.98%
Town: Total 285 12.61%
Rural: Fringe 180 7.96%
Rural: Distant 246 10.88%
Rural: Remote 108 4.78%
Rural: Total 534 23.62%
Source: Authors' calculations using NCES and MDE data.

The Michigan Context and Performance Report Card: Public Elementary and Middle Schools, 2017 5
Mackinac Center for Public Policy
2017 Selected Results
The following tables show selected results from this report card, including the top- and bottom-scoring 100 public elementary and middle schools. It is not feasible to list all 2,261 ranked schools in this publication; however, interested readers can find an online database of all schools at www.mackinac.org/CAP2017.
The Top 100 Public Elementary and Middle Schools The highest-ranked school in the latest version of the report card is Hamtramck Academy, a Detroit-area charter school that also finished in the top 1 percent of the rankings in the first two editions. In all, charters made up eight of the top 20 and 23 of the top 100 on this list. That showing represents almost twice the expected number, given that just under 12 percent of the schools in the total sample are charter schools.
Perhaps most remarkable, five of the top 10 schools on the newest report card belong to Dearborn Public Schools. More than half of the district’s graded schools (16 of 29) finished in the top 100. Three smaller conventional districts also had notable appearances in the top 100: Cadillac (3 out of 6 schools), Covert (2 of 2) and Godwin Heights (2 of 3). Districts representing several large urban areas each only had one conventional school in the top 100: Detroit, Kalamazoo, Lansing and Grand Rapids. Meanwhile, 11 charter schools in Detroit cracked the top 100.
For the first time, some selective schools (three of the 11) did not finish in the top 100. On the previous two elementary and middle school report cards, no selective school had finished lower than 38th. Still, the handful of selective admission public schools surpassed the expected CAP Score mark by a significant margin.
As in previous editions, schools located in cities appear among the highest performers in disproportionate numbers: 53 of the top 100 schools operate in city environments. Of that number, 37 are conventional or selective district schools and 16 are charters. Schools located in towns average the highest CAP score of the four geographic locales. However, schools in towns and suburban settings are most underrepresented in the top 100 as shares of the overall sample.
In the larger city and suburban settings, charter schools as a whole tend to outperform their conventional district counterparts. However, more district schools edge charters in the less populated rural and town settings.
Top 100 Public Elementary and Middle Schools
Table Rank School Name School Type District or
Municipality Locale # of Scores
Overall CAP Values
Score Percent Rank Grade
1 Hamtramck Academy Charter Hamtramck Suburb: Large 48 138.83 100.00% A 2 Iris Becker Elementary School Conventional Dearborn City: Small 24 134.45 99.96% A 3 Maples Elementary School Conventional Dearborn City: Small 24 132.16 99.91% A 4 New Paradigm College Prep Charter Detroit City: Large 7 130.76 99.87% A 5 Dearborn 6/7 STEM School Conventional Dearborn City: Small 15 130.08 99.82% A 6 Crestwood Accelerated Program Selective Crestwood Suburb: Large 15 129.32 99.78% A 7 Lowrey Middle School Conventional Dearborn City: Small 24 126.31 99.73% A 8 Middle School Math Science Tech Ctr. Selective Warren City: Midsize 12 123.56 99.69% A 9 Lowrey Elementary School Conventional Dearborn City: Small 24 122.97 99.65% A
10 Center for Economicology Selective Grand Rapids City: Midsize 6 122.78 99.60% A

The Michigan Context and Performance Report Card: Public Elementary and Middle Schools, 2017 6
Mackinac Center for Public Policy
Top 100 Public Elementary and Middle Schools
Table Rank School Name School Type District or
Municipality Locale # of Scores
Overall CAP Values
Score Percent Rank Grade
11 Star International Academy Charter Dearborn Heights Suburb: Large 48 122.41 99.56% A 12 Martin Luther King, Jr. Education Center Charter Detroit City: Large 48 121.95 99.51% A 13 Handley School Selective Saginaw City: Small 24 121.83 99.47% A 14 William Ford Elementary School Conventional Dearborn City: Small 24 121.79 99.43% A 15 West Godwin Elementary School Conventional Godwin Heights City: Small 15 121.21 99.38% A 16 Detroit Edison Public School Academy Charter Detroit City: Large 48 121.16 99.34% A 17 Miller Elementary School Conventional Dearborn City: Small 24 121.14 99.29% A 18 The Dearborn Academy Charter Dearborn City: Small 48 121.11 99.25% A 19 Bridge Academy East Charter Hamtramck Suburb: Large 24 120.75 99.20% A 20 Bridge Academy West Charter Detroit Suburb: Large 24 120.70 99.16% A 21 Brown Elementary School Conventional Byron Center Rural: Fringe 15 120.57 99.12% A 22 Akron-Fairgrove Elem. School Conventional Akron-Fairgrove Rural: Distant 24 120.34 99.07% A 23 Lake Hills Elementary School Conventional Grand Haven Suburb: Midsize 15 120.24 99.03% A 24 Reo School Conventional Lansing City: Midsize 6 119.48 98.98% A 25 John Ball Park Zoo School Selective Grand Rapids City: Midsize 6 119.46 98.94% A 26 Beach Elementary School Conventional Fruitport Suburb: Midsize 24 119.38 98.89% A 27 Webster Elementary School Conventional Livonia City: Small 30 119.31 98.85% A 28 Kenwood Elementary School Conventional Cadillac Town: Remote 15 119.12 98.81% A 29 Hope of Detroit Academy Charter Detroit City: Large 37 118.83 98.76% A 30 Dickinson East Elementary School Conventional Hamtramck Suburb: Large 30 118.74 98.72% A 31 Hanley International Academy Charter Hamtramck Suburb: Large 48 118.69 98.67% A 32 Woodworth Middle School Conventional Dearborn City: Small 24 118.69 98.63% A 33 New Paradigm Glazer Academy Charter Detroit City: Large 42 118.16 98.58% A 34 North Godwin Elementary School Conventional Godwin Heights City: Small 15 117.96 98.54% A 35 Geer Park Elementary Conventional Dearborn City: Small 24 117.85 98.50% A 36 Grandville Central Elementary School Conventional Grandville Suburb: Large 30 117.83 98.45% A 37 Henry Ford Elementary School Conventional Dearborn City: Small 24 117.56 98.41% A 38 Oakman Elementary School Conventional Dearborn City: Small 24 117.49 98.36% A 39 Blandford Nature Center Selective Grand Rapids City: Midsize 6 117.47 98.32% A 40 Southwood Elementary Conventional Kentwood Suburb: Large 24 116.85 98.28% A 41 Highview Elementary School Conventional Crestwood Suburb: Large 15 116.77 98.23% A 42 Covert Elementary School Conventional Covert Rural: Distant 24 116.76 98.19% A 43 Saginaw Arts and Sciences Academy Selective Saginaw City: Small 24 116.49 98.14% A 44 Central Academy Charter Ann Arbor City: Midsize 48 116.41 98.10% A 45 City Middle/High School Selective Grand Rapids City: Midsize 18 116.34 98.05% A 46 Salina Elementary P-3 Conventional Dearborn City: Small 6 116.22 98.01% A 47 Glenwood Elementary Conventional Kentwood Suburb: Large 24 115.98 97.97% A 48 Lybrook Elementary School Conventional Eau Claire Rural: Fringe 24 115.94 97.92% A 49 Unis Middle School Conventional Dearborn City: Small 24 115.73 97.88% A 50 Washtenaw International Middle Acad. Conventional Ypsilanti Suburb: Large 27 115.70 97.83% A 51 Cesar Chavez Academy Intermediate Charter Detroit City: Large 24 115.61 97.79% A 52 Rankin Elementary School Conventional Carman-Ainsworth Suburb: Large 24 115.54 97.74% A 53 Northridge Academy Charter Flint City: Midsize 48 115.46 97.70% A 54 Angell School Conventional Ann Arbor City: Midsize 24 115.42 97.66% A 55 Gallimore Elementary School Conventional Plymouth-Canton Suburb: Large 24 115.27 97.61% A 56 C.K. Schickler Elementary School Conventional Lapeer Town: Fringe 24 115.05 97.57% A 57 Forest View Elementary School Conventional Cadillac Town: Remote 15 114.95 97.52% A 58 Detroit Enterprise Academy Charter Detroit City: Large 48 114.68 97.48% A 59 Riverside Academy Charter Dearborn City: Small 24 114.68 97.43% A 60 Franklin Elementary School Conventional Cadillac Town: Remote 15 114.60 97.39% A 61 Lawrence Elementary School Conventional Lawrence Rural: Distant 30 114.51 97.35% A 62 Detroit Merit Charter Academy Charter Detroit City: Large 48 114.46 97.30% A 63 Baldwin Elementary School Conventional Baldwin Rural: Remote 30 114.41 97.26% A 64 Salina Intermediate 4-8 Conventional Dearborn City: Small 42 114.39 97.21% A

The Michigan Context and Performance Report Card: Public Elementary and Middle Schools, 2017 7
Mackinac Center for Public Policy
Top 100 Public Elementary and Middle Schools
Table Rank School Name School Type District or
Municipality Locale # of Scores
Overall CAP Values
Score Percent Rank Grade
65 Glencairn School Conventional East Lansing City: Small 24 114.33 97.17% A 66 Greenwood Elementary School Conventional Kalamazoo City: Small 6 114.08 97.13% A 67 Cesar Chavez Academy Elem. East Charter Detroit City: Large 22 114.04 97.08% A 68 Rose City School Conventional West Branch-Rose City Rural: Remote 30 113.86 97.04% A 69 New Paradigm Loving Academy Charter Detroit City: Large 41 113.83 96.99% A 70 North Holland Elementary School Conventional West Ottawa Suburb: Small 24 113.82 96.95% A 71 Eagle Crest Charter Academy Charter Holland Suburb: Small 48 113.76 96.90% A 72 Lee Middle School Conventional Godfrey-Lee City: Small 24 113.70 96.86% A 73 Burr Elementary School Conventional Utica Suburb: Large 29 113.60 96.82% A 74 Lakeshore Elementary School Conventional West Ottawa Suburb: Small 24 113.58 96.77% A 75 Frankfort Elementary School Conventional Frankfort-Elberta Rural: Remote 30 113.56 96.73% A 76 Griffin Elementary School Conventional Grand Haven Suburb: Midsize 15 113.48 96.68% A 77 Stout Middle School Conventional Dearborn City: Small 24 113.36 96.64% A 78 Andrews Elementary School Conventional Three Rivers Town: Fringe 24 113.32 96.59% A 79 Great Oaks Academy Charter Warren City: Midsize 48 113.04 96.55% A 80 Whittemore-Prescott Area Elementary Conventional Whittemore-Prescott Rural: Remote 30 113.00 96.51% A 81 Jamestown Elementary School Conventional Hudsonville Suburb: Large 24 112.97 96.46% A 82 Eastlawn School Conventional Midland City: Small 24 112.96 96.42% A 83 Sanborn School Conventional Alpena Town: Remote 24 112.80 96.37% A 84 Berrien Springs Middle School Conventional Berrien Springs Town: Fringe 24 112.73 96.33% A 85 Stocking Elementary Conventional Grand Rapids City: Midsize 24 112.67 96.28% A 86 Clara B. Bolen Elementary School Conventional Tawas Rural: Fringe 15 112.66 96.24% A 87 STEM Academy Conventional Comstock Suburb: Midsize 42 112.64 96.20% A 88 Onaway Elementary School Conventional Onaway Rural: Remote 24 112.57 96.15% A 89 McCollough Elementary School Conventional Dearborn City: Small 24 112.48 96.11% A 90 South Arbor Charter Academy Charter Ypsilanti Rural: Fringe 48 112.47 96.06% A 91 Marion Elementary School Conventional Marion Rural: Remote 24 112.45 96.02% A 92 Clague Middle School Conventional Ann Arbor City: Midsize 24 112.41 95.98% A 93 Davison Elementary-Middle School Conventional Detroit City: Large 48 112.29 95.93% A 94 Meadowlawn Elementary Conventional Kentwood Suburb: Large 24 112.28 95.89% A 95 Martin Luther King Elem. School Conventional Ann Arbor City: Midsize 24 112.04 95.84% A 96 Covert Middle School Conventional Covert Rural: Distant 24 111.99 95.80% A 97 Arbor Academy Charter Battle Creek City: Small 30 111.96 95.75% A 98 Sterling Elementary School Conventional Standish-Sterling Rural: Distant 24 111.92 95.71% A 99 Boulan Park Middle School Conventional Troy City: Small 24 111.79 95.67% A 100 Leonidas School Conventional Colon Rural: Distant 5 111.76 95.62% A
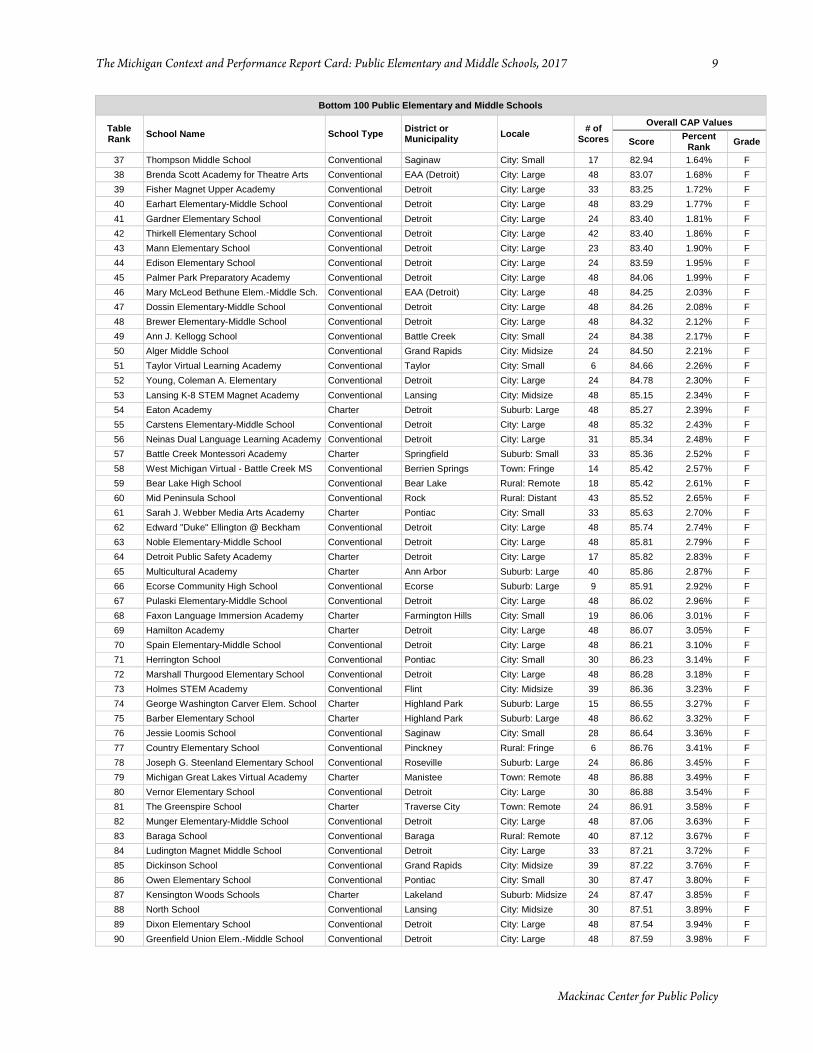
The Bottom 100 Public Elementary and Middle Schools Consistent with prior releases of the elementary and middle school report card, most of the lowest-rated schools are located in the city of Detroit. This reflects poor performance even after adjusting for the poverty levels of students who were tested. Thirteen of the 16 lowest performers and 41 of the bottom 100 schools were run by Detroit Public Schools or the Detroit Public Schools Community District, as the district is now known.
Only one of the bottom 10 and four of the bottom 50 were part of the Education Achievement Authority. This represents an improvement for the EAA, which had six of the seven lowest-performing schools on the previous report card. Formed in 2012, the EAA was a “school turnaround” district that was tasked with running Detroit’s worst-performing schools. As part of a package of 2016 legislative reforms, the EAA was

The Michigan Context and Performance Report Card: Public Elementary and Middle Schools, 2017 8
Mackinac Center for Public Policy
closed down at the end of the 2016-17 school year, and its schools restored to the control of the newly constituted Detroit Public Schools Community District. *
The same number of charter schools finished in the bottom 100 as in the top 100: 23. Interestingly, the lowest performers are comprised of a significantly newer set of schools. More than half of the lowest-performing charter schools were opened in 2012 or later, and one was closed down due to financial troubles in 2017. On the other hand, all but two of the charters in the top 100 were opened before 2012.
Nearly three-fourths of the bottom 100 schools were located in cities, a rate far higher than expected given their proportionate representation in the sample. Only seven rural and three town schools finished among the lowest performers.
Bottom 100 Public Elementary and Middle Schools
Table Rank School Name School Type District or
Municipality Locale # of Scores
Overall CAP Values
Score Percent Rank Grade
1 Turning Point Academy Conventional Detroit City: Large 8 64.20 0.04% F 2 Douglass Academy for Young Men Conventional Detroit City: Large 12 74.44 0.09% F 3 Marquette Elementary-Middle School Conventional Detroit City: Large 48 75.65 0.13% F 4 John R. King Academic & Performing Arts Conventional Detroit City: Large 48 75.92 0.18% F 5 Henderson Academy Conventional Detroit City: Large 48 76.15 0.22% F 6 Burns Elementary-Middle School Conventional EAA (Detroit) City: Large 48 76.50 0.27% F 7 STEAM Academy at MLK Conventional Benton Harbor City: Small 40 76.52 0.31% F 8 Eastside Detroit Lions Academy Conventional Detroit City: Large 24 77.22 0.35% F 9 Academy of The Americas Conventional Detroit City: Large 48 77.41 0.40% F
10 J.E. Clark Preparatory Academy Conventional Detroit City: Large 48 78.78 0.44% F 11 Law Elementary School Conventional EAA (Detroit) City: Large 48 79.33 0.49% F 12 Mason Elementary School Conventional Detroit City: Large 48 79.60 0.53% F 13 Sampson Academy Conventional Detroit City: Large 47 79.78 0.57% F 14 Bow Elementary-Middle School Conventional Detroit City: Large 48 79.78 0.62% F 15 Blackwell Institute Conventional Detroit City: Large 48 79.79 0.66% F 16 Mackenzie Elementary-Middle School Conventional Detroit City: Large 48 80.22 0.71% F 17 Branch Line School Charter Livonia City: Small 20 80.38 0.75% F 18 Macomb Montessori Academy Charter Warren City: Midsize 28 80.40 0.80% F 19 J.W. Sexton High School Conventional Lansing City: Midsize 18 80.51 0.84% F 20 Durfee Elementary-Middle School Conventional Detroit City: Large 48 80.61 0.88% F 21 Northwestern Middle School Conventional Battle Creek City: Small 24 80.98 0.93% F 22 Fourth Street Learning Center Conventional Jackson City: Small 16 80.99 0.97% F 23 Flat River Academy Middle/High School Charter Greenville Rural: Fringe 18 81.08 1.02% F 24 Keys Grace Academy Charter Madison Heights Suburb: Large 32 81.22 1.06% F 25 Bagley Elementary School Conventional Detroit City: Large 30 81.34 1.11% F 26 Insight School of Michigan Charter Lansing Suburb: Large 24 81.47 1.15% F 27 Ann Arbor Trail Magnet School Conventional Detroit City: Large 48 81.52 1.19% F 28 Leelanau Montessori PSA Charter Suttons Bay Rural: Distant 16 81.53 1.24% F 29 Schulze Elementary-Middle School Conventional Detroit City: Large 30 81.60 1.28% F 30 Frederick Douglass International Academy Charter Madison Heights Suburb: Large 16 82.00 1.33% F 31 Kelly Middle School Conventional East Detroit Suburb: Large 24 82.23 1.37% F 32 Muskegon Heights Academy Charter Muskegon Suburb: Midsize 18 82.25 1.42% F 33 Priest Elementary-Middle School Conventional Detroit City: Large 48 82.29 1.46% F 34 Taylor International Academy Charter Southfield City: Small 48 82.79 1.50% F 35 Arts & Comm. Academy at Fair Plain Conventional Benton Harbor City: Small 40 82.83 1.55% F 36 Gardner Academy Conventional Lansing City: Midsize 46 82.84 1.59% F
* For the testing years included in this analysis, all conventional Detroit schools either were part of the Detroit Public Schools (2015 and 2016) and Detroit Public Schools Community District (2017) or belonged to the Education Achievement Authority for all three years.
The Michigan Context and Performance Report Card: Public Elementary and Middle Schools, 2017 9
Mackinac Center for Public Policy
Bottom 100 Public Elementary and Middle Schools
Table Rank School Name School Type District or
Municipality Locale # of Scores
Overall CAP Values
Score Percent Rank Grade
37 Thompson Middle School Conventional Saginaw City: Small 17 82.94 1.64% F 38 Brenda Scott Academy for Theatre Arts Conventional EAA (Detroit) City: Large 48 83.07 1.68% F 39 Fisher Magnet Upper Academy Conventional Detroit City: Large 33 83.25 1.72% F 40 Earhart Elementary-Middle School Conventional Detroit City: Large 48 83.29 1.77% F 41 Gardner Elementary School Conventional Detroit City: Large 24 83.40 1.81% F 42 Thirkell Elementary School Conventional Detroit City: Large 42 83.40 1.86% F 43 Mann Elementary School Conventional Detroit City: Large 23 83.40 1.90% F 44 Edison Elementary School Conventional Detroit City: Large 24 83.59 1.95% F 45 Palmer Park Preparatory Academy Conventional Detroit City: Large 48 84.06 1.99% F 46 Mary McLeod Bethune Elem.-Middle Sch. Conventional EAA (Detroit) City: Large 48 84.25 2.03% F 47 Dossin Elementary-Middle School Conventional Detroit City: Large 48 84.26 2.08% F 48 Brewer Elementary-Middle School Conventional Detroit City: Large 48 84.32 2.12% F 49 Ann J. Kellogg School Conventional Battle Creek City: Small 24 84.38 2.17% F 50 Alger Middle School Conventional Grand Rapids City: Midsize 24 84.50 2.21% F 51 Taylor Virtual Learning Academy Conventional Taylor City: Small 6 84.66 2.26% F 52 Young, Coleman A. Elementary Conventional Detroit City: Large 24 84.78 2.30% F 53 Lansing K-8 STEM Magnet Academy Conventional Lansing City: Midsize 48 85.15 2.34% F 54 Eaton Academy Charter Detroit Suburb: Large 48 85.27 2.39% F 55 Carstens Elementary-Middle School Conventional Detroit City: Large 48 85.32 2.43% F 56 Neinas Dual Language Learning Academy Conventional Detroit City: Large 31 85.34 2.48% F 57 Battle Creek Montessori Academy Charter Springfield Suburb: Small 33 85.36 2.52% F 58 West Michigan Virtual - Battle Creek MS Conventional Berrien Springs Town: Fringe 14 85.42 2.57% F 59 Bear Lake High School Conventional Bear Lake Rural: Remote 18 85.42 2.61% F 60 Mid Peninsula School Conventional Rock Rural: Distant 43 85.52 2.65% F 61 Sarah J. Webber Media Arts Academy Charter Pontiac City: Small 33 85.63 2.70% F 62 Edward "Duke" Ellington @ Beckham Conventional Detroit City: Large 48 85.74 2.74% F 63 Noble Elementary-Middle School Conventional Detroit City: Large 48 85.81 2.79% F 64 Detroit Public Safety Academy Charter Detroit City: Large 17 85.82 2.83% F 65 Multicultural Academy Charter Ann Arbor Suburb: Large 40 85.86 2.87% F 66 Ecorse Community High School Conventional Ecorse Suburb: Large 9 85.91 2.92% F 67 Pulaski Elementary-Middle School Conventional Detroit City: Large 48 86.02 2.96% F 68 Faxon Language Immersion Academy Charter Farmington Hills City: Small 19 86.06 3.01% F 69 Hamilton Academy Charter Detroit City: Large 48 86.07 3.05% F 70 Spain Elementary-Middle School Conventional Detroit City: Large 48 86.21 3.10% F 71 Herrington School Conventional Pontiac City: Small 30 86.23 3.14% F 72 Marshall Thurgood Elementary School Conventional Detroit City: Large 48 86.28 3.18% F 73 Holmes STEM Academy Conventional Flint City: Midsize 39 86.36 3.23% F 74 George Washington Carver Elem. School Charter Highland Park Suburb: Large 15 86.55 3.27% F 75 Barber Elementary School Charter Highland Park Suburb: Large 48 86.62 3.32% F 76 Jessie Loomis School Conventional Saginaw City: Small 28 86.64 3.36% F 77 Country Elementary School Conventional Pinckney Rural: Fringe 6 86.76 3.41% F 78 Joseph G. Steenland Elementary School Conventional Roseville Suburb: Large 24 86.86 3.45% F 79 Michigan Great Lakes Virtual Academy Charter Manistee Town: Remote 48 86.88 3.49% F 80 Vernor Elementary School Conventional Detroit City: Large 30 86.88 3.54% F 81 The Greenspire School Charter Traverse City Town: Remote 24 86.91 3.58% F 82 Munger Elementary-Middle School Conventional Detroit City: Large 48 87.06 3.63% F 83 Baraga School Conventional Baraga Rural: Remote 40 87.12 3.67% F 84 Ludington Magnet Middle School Conventional Detroit City: Large 33 87.21 3.72% F 85 Dickinson School Conventional Grand Rapids City: Midsize 39 87.22 3.76% F 86 Owen Elementary School Conventional Pontiac City: Small 30 87.47 3.80% F 87 Kensington Woods Schools Charter Lakeland Suburb: Midsize 24 87.47 3.85% F 88 North School Conventional Lansing City: Midsize 30 87.51 3.89% F 89 Dixon Elementary School Conventional Detroit City: Large 48 87.54 3.94% F 90 Greenfield Union Elem.-Middle School Conventional Detroit City: Large 48 87.59 3.98% F

The Michigan Context and Performance Report Card: Public Elementary and Middle Schools, 2017 10
Mackinac Center for Public Policy
Bottom 100 Public Elementary and Middle Schools
Table Rank School Name School Type District or
Municipality Locale # of Scores
Overall CAP Values
Score Percent Rank Grade
91 Paul Robeson Malcolm X Academy Conventional Detroit City: Large 48 87.75 4.02% F 92 Attwood School Conventional Lansing City: Midsize 24 87.78 4.07% F 93 Eastern High School Conventional Lansing City: Midsize 18 87.92 4.11% F 94 Mohawk Elementary School Conventional Chippewa Valley Suburb: Large 24 88.01 4.16% F 95 Crescent Academy Middle School Charter Southfield City: Small 30 88.20 4.20% F 96 Roseville Middle School Conventional Roseville Suburb: Large 24 88.22 4.25% F 97 Brick Elementary School Conventional Lincoln Rural: Fringe 24 88.25 4.29% F 98 New Bedford Academy Charter Lambertville Suburb: Large 36 88.27 4.33% F 99 Lincoln Elementary School Conventional Van Dyke City: Midsize 24 88.34 4.38% F 100 Randolph Elementary School Conventional Livonia City: Small 15 88.37 4.42% F
Long-Term Trends in CAP Scores
This third edition of the Elementary and Middle School Context and Report Card allows for the first examination of longer-term achievement trends. A comparison with the data used to compile CAP Scores for the previous editions of this report card can help provide evidence of schools that have made significant improvement or decline in their relative academic performance in recent years. It can also help to highlight schools that have sustained high or low levels of academic performance over a longer period of time. *
Most Improved and Largest Declines Schools that appear in the current edition of the Elementary and Middle School Report Card and generate at least six unique yearly CAP Scores between 2009 and 2016 were included in this long-term comparative analysis. Due to the processes of consolidation and grade reconfiguration that occurred in some locations, only scores from schools with a consistent building code number from the Michigan Department of Education were used. That includes schools with consistent building codes but two different district codes – notably, the Detroit schools that operated under the Education Achievement Authority. In all, these criteria provided a sample of 2,093 schools to analyze.
To identify changes in school performance over time, the difference is measured between a school’s new overall CAP Score and an average of the calculated yearly CAP Scores between 2009-10 and 2013-14.† For example, Lakeshore Elementary School in Ottawa County received a 113.58 CAP Score in this edition of the report card. The average of its annual CAP Scores from 2009-10 to 2013-14 is 113.33. Therefore, Lakeshore Elementary registered a 0.25 point improvement (113.58 – 113.33 = 0.25).
* In smaller schools, with fewer students taking the test, we can expect the average of that test to fluctuate more from year to year. This plays out, as we identified a negative correlation (-0.1051) between school size and absolute value of change in CAP Scores as measured in this analysis. That means smaller schools are more likely to appear among those with the largest identified CAP Score changes. Sixty-one of the 100 most improved schools, and 62 of the schools with the largest declines, had smaller student enrollments than the sample's median enrollment size for the 2016-17 school year.
† A comparison of an average based on five different time points with an average based on three different time points proves valid for two reasons. First, there are very strong correlations between the five-year average (CAP Scores 2009-2013) and an alternate three-year average (CAP Scores 2011-2013): 97 percent in levels and 95 percent in change measures. Second, the five-year average and alternate three-year average yield highly similar standard deviations: 6.407 and 6.580, respectively.

The Michigan Context and Performance Report Card: Public Elementary and Middle Schools, 2017 11
Mackinac Center for Public Policy
It is important to observe that each year's individual tested CAP Scores are normalized to the sample of all test results for that grade and subject available in the sample. This addresses concerns that measurable improvements or declines might be biased by a change in tests from the earlier five-year sample of MEAP tests to the newer three-year sample of M-STEP assessments.
100 Most Improved Public Elementary and Middle Schools Nearly 80 schools, roughly 4 percent of the total sample, registered an average CAP Score increase of 10 points or greater. At the top of the list are two campuses of the New Paradigm Glazer-Loving Academy, formerly Detroit Public Schools conventional schools that reopened as charters authorized by DPSCD. A total of seven Detroit charter schools qualified for the 25 most improved, and 15 of the top 100. Six of the 15 highly improved Detroit charters, including the two New Paradigm schools, were previously managed by DPS but converted to charters during the period examined. In all, 30 of the 100 most improved are charter schools, despite these schools comprising only 10 percent of the sample.
The most improved district school is rural Akron-Fairgrove Elementary, located east of the Saginaw-Bay City area. As in the latest overall CAP Scores, the Dearborn School District was well represented with six in the top 100 list. City schools as a whole are overrepresented, claiming 37 of the top 100 most improved schools.
100 Most Improved Public Elementary and Middle Schools
Table Rank School Name School Type District or Municipality Locale
CAP Scores 2009-2013
2014-2016 Change
1 New Paradigm Glazer Academy Charter* Detroit City: Large 92.92 118.16 25.24 2 New Paradigm Loving Academy Charter* Detroit City: Large 93.13 113.83 20.69 3 Akron-Fairgrove Elem. School Conventional Akron-Fairgrove Rural: Distant 101.78 120.34 18.56 4 Beach Elementary School Conventional Fruitport Suburb: Midsize 100.86 119.38 18.52 5 Detroit Community Schools-Elementary Charter Detroit City: Large 87.80 104.99 17.19 6 The Dearborn Academy Charter Dearborn City: Small 104.54 121.11 16.57 7 Rutherford Winans Academy Charter* Detroit City: Large 91.89 108.13 16.24 8 Barth Elementary School Conventional Romulus Suburb: Large 94.73 110.82 16.09 9 Maples Elementary School Conventional Dearborn City: Small 116.09 132.16 16.07
10 Hanley International Academy Charter Hamtramck Suburb: Large 103.67 118.69 15.02 11 Gallimore Elementary School Conventional Plymouth-Canton Suburb: Large 100.60 115.27 14.68 12 Hope of Detroit Academy Charter Detroit City: Large 104.27 118.83 14.55 13 Whitmer Human Resource Center Conventional Pontiac City: Small 73.94 88.46 14.52 14 Litchfield High School Conventional Litchfield Rural: Distant 86.46 100.93 14.48 15 Hamtramck Academy Charter Hamtramck Suburb: Large 124.64 138.83 14.20 16 Emerald Elementary School Conventional Manistique Town: Remote 97.62 111.70 14.08 17 Haas Elementary School Conventional Genesee Suburb: Large 96.48 110.26 13.78 18 Douglas Elementary 3-4 Campus Conventional Garden City Suburb: Large 90.74 104.46 13.71 19 Lakeview Elementary School Conventional Lakeview (Montcalm) Rural: Distant 92.01 105.53 13.52 20 Holton Elementary School Conventional Holton Rural: Distant 94.65 108.11 13.46 21 Litchfield Elementary School Conventional Litchfield Rural: Distant 90.32 103.63 13.31 22 Trix Performance Academy Charter* Detroit City: Large 79.91 93.21 13.30 23 Detroit Edison Public School Academy Charter Detroit City: Large 107.88 121.16 13.28 24 C.K. Schickler Elementary School Conventional Lapeer Town: Fringe 101.82 115.05 13.24 25 William Ford Elementary School Conventional Dearborn City: Small 108.69 121.79 13.10 26 Cooley Elementary School Conventional Waterford Suburb: Large 95.37 108.35 12.98 27 Global Heights Academy Charter Dearborn Heights Suburb: Large 92.42 105.29 12.86 28 Farmington 5-6 Campus Conventional Garden City Suburb: Large 87.68 100.35 12.67 29 Arbor Academy Charter Battle Creek City: Small 99.30 111.96 12.67 30 Northridge Academy Charter Flint City: Midsize 102.92 115.46 12.54

The Michigan Context and Performance Report Card: Public Elementary and Middle Schools, 2017 12
Mackinac Center for Public Policy
100 Most Improved Public Elementary and Middle Schools
Table Rank School Name School Type District or Municipality Locale
CAP Scores 2009-2013
2014-2016 Change
31 Sanborn School Conventional Alpena Town: Remote 100.28 112.80 12.53 32 Detroit Academy of Arts & Sciences M.S. Charter Detroit City: Large 90.47 102.98 12.51 33 Miller Elementary School Conventional Dearborn City: Small 108.79 121.14 12.35 34 Hoover Middle School Conventional Taylor City: Small 94.78 107.05 12.27 35 Ashley Elementary School Conventional Ashley Rural: Distant 99.08 111.34 12.26 36 Henry Ford Academy: Sch. for Creative Std. Charter Detroit City: Large 90.08 102.33 12.25 37 Regent Park Scholars Charter Academy Charter Detroit City: Large 92.81 105.02 12.20 38 Lake Hills Elementary School Conventional Grand Haven Suburb: Midsize 108.05 120.24 12.19 39 Pine River Elementary School Conventional Bullock Creek Rural: Fringe 98.89 110.79 11.90 40 Hillsdale Preparatory School Charter Hillsdale Town: Distant 95.73 107.53 11.79 41 Nah Tah Wahsh Public School Academy Charter Wilson Rural: Remote 96.01 107.73 11.72 42 Detroit Enterprise Academy Charter Detroit City: Large 102.99 114.68 11.69 43 Hillcrest Elementary School Conventional Crestwood Suburb: Large 99.80 111.14 11.34 44 Mackinaw City K-12 School Conventional Mackinaw City Rural: Distant 94.84 106.15 11.30 45 Henry Ford Elementary School Conventional Dearborn City: Small 106.33 117.56 11.23 46 Springport Elementary School Conventional Springport Rural: Distant 99.45 110.63 11.18 47 Dundee Elementary School Conventional Dundee Town: Fringe 90.75 101.85 11.11 48 Wolverine Elementary School Conventional Wolverine Rural: Remote 99.37 110.41 11.04 49 Greenwood Elementary School Conventional Kalamazoo City: Small 103.05 114.08 11.02 50 River Oaks Elementary School Conventional Dearborn City: Small 98.77 109.78 11.01 51 Lawrence Elementary School Conventional Lawrence Rural: Distant 103.52 114.51 10.99 52 Parchment Northwood Elem. School Conventional Parchment Suburb: Midsize 97.39 108.28 10.89 53 Kenwood Elementary School Conventional Cadillac Town: Remote 108.26 119.12 10.86 54 North Holland Elementary School Conventional West Ottawa Suburb: Small 102.96 113.82 10.86 55 Legacy Charter Academy Charter Detroit City: Large 96.31 107.13 10.81 56 Schuchard Elementary School Conventional Utica Suburb: Large 98.92 109.73 10.81 57 Nolan Elementary-Middle School Conventional Detroit/EAA City: Large 81.66 92.41 10.76 58 Bridge Academy West Charter Detroit Suburb: Large 110.04 120.70 10.66 59 Posen Elementary School Conventional Posen Rural: Remote 96.45 107.09 10.64 60 Gudith Elementary School Conventional Woodhaven-Brownstown Suburb: Large 91.54 102.17 10.63 61 Wagar 7/8 Middle School Conventional Airport Rural: Fringe 91.24 101.82 10.58 62 Swan Valley Middle School Conventional Swan Valley Suburb: Midsize 94.47 104.97 10.50 63 Camden-Frontier K-8 School Conventional Camden-Frontier Rural: Distant 95.11 105.61 10.50 64 North Dickinson School Conventional North Dickinson Rural: Remote 89.91 100.37 10.46 65 Robert J. West Middle School Conventional Taylor City: Small 100.31 110.75 10.44 66 Timberland Academy Charter Muskegon Suburb: Midsize 97.34 107.75 10.41 67 Buchanan High School Conventional Buchanan Suburb: Large 99.95 110.35 10.40 68 Rogers City Elementary School Conventional Rogers City Town: Remote 93.37 103.76 10.39 69 Michigan Math. and Science Academy Charter Center Line Suburb: Large 96.66 107.03 10.38 70 Green Meadow Elementary School Conventional Comstock Suburb: Midsize 100.27 110.52 10.25 71 Jenison International Academy Conventional Jenison Suburb: Large 89.74 99.99 10.25 72 Angus Elementary School Conventional Warren City: Midsize 96.43 106.62 10.19 73 Potterville Elementary School Conventional Potterville Rural: Fringe 86.00 96.19 10.19 74 Northglade Montessori School Conventional Kalamazoo City: Small 96.39 106.57 10.18 75 Ralph J. Bunche Academy Conventional Ecorse Suburb: Large 96.24 106.39 10.15 76 Quest Charter Academy Charter Taylor City: Small 94.71 104.86 10.15 77 Akron-Fairgrove Jr/Sr High School Conventional Akron-Fairgrove Rural: Distant 97.40 107.49 10.09 78 Lincoln Community School Conventional Alpena Town: Remote 99.34 109.41 10.07 79 Hamilton Academy Charter* Detroit City: Large 76.04 86.07 10.02 80 Fairview School Conventional Lansing City: Midsize 100.12 110.08 9.96 81 Lee Middle School Conventional Godfrey-Lee City: Small 103.75 113.70 9.95 82 Murphy Performance Academy Charter* Detroit City: Large 84.50 94.38 9.88 83 Parchment Middle School Conventional Parchment Suburb: Midsize 100.91 110.71 9.80 84 West Godwin Elementary School Conventional Godwin Heights City: Small 111.43 121.21 9.77

The Michigan Context and Performance Report Card: Public Elementary and Middle Schools, 2017 13
Mackinac Center for Public Policy
100 Most Improved Public Elementary and Middle Schools
Table Rank School Name School Type District or Municipality Locale
CAP Scores 2009-2013
2014-2016 Change
85 Bridge Academy East Charter Hamtramck Suburb: Large 110.99 120.75 9.76 86 Lansing Charter Academy Charter Lansing City: Midsize 93.04 102.67 9.63 87 McKinley Elementary School Conventional Van Dyke City: Midsize 94.63 104.19 9.57 88 Elmwood Elementary School Conventional Waverly Suburb: Large 100.81 110.37 9.56 89 Bark River-Harris Elementary School Conventional Bark River-Harris Rural: Remote 96.32 105.85 9.53 90 Landmark Academy Charter Kimball Suburb: Small 91.19 100.70 9.50 91 Kate Dowdall Elementary School Conventional Kearsley Suburb: Large 97.69 107.11 9.42 92 Laingsburg Elementary School Conventional Laingsburg Rural: Distant 90.16 99.54 9.39 93 Morrice Area Elementary School Conventional Morrice Rural: Fringe 89.01 98.32 9.32 94 Trillium Academy Charter Taylor City: Small 92.90 102.09 9.19 95 Dryden High School Conventional Dryden Rural: Distant 87.79 96.92 9.13 96 McCollough Elementary School Conventional Dearborn City: Small 103.45 112.48 9.03 97 Hanover-Horton Elementary School Conventional Hanover-Horton Rural: Distant 93.82 102.84 9.02 98 Oakwood Intermediate Conventional Allendale Suburb: Large 97.60 106.60 9.01 99 Engadine Schools Conventional Engadine Rural: Remote 92.35 101.35 9.00 100 Woodworth Elementary School Conventional Leslie Rural: Fringe 92.85 101.83 8.98
* Denotes schools that changed from district to charter management, 2009-2016
100 Largest Declines Among Public Elementary and Middle Schools Schools experiencing the largest declines were top performers on previous editions of this report card. Thirkell Elementary, a Detroit conventional school, finished first in the 2013 edition of the report card. Ross-Hill Academy, a DPS-authorized charter that closed in 2017, ranked second statewide on the 2015 report card. Respectively, these two schools experienced the largest measurable CAP Score declines.
In all, 14 of the 20 biggest declines, and 35 of the top 100, came from Detroit. All but four are run by DPSCD. While 60 of the 100 biggest drops occurred in city schools, the Charles C. McGlinnen School in suburban Clintondale stands out as the only noncity school in the bottom 15. Half as many charters placed in the bottom 100 as were among the 100 most improved, though they were overrepresented on both lists.
100 Largest Declines Among Public Elementary and Middle Schools
Table Rank School Name School Type District or Municipality Locale
CAP Scores 2009-2013
2014-2016 Change
1 Thirkell Elementary School Conventional Detroit City: Large 132.36 83.40 (48.96) 2 Ross-Hill Academy - Elementary Charter Detroit City: Large 128.61 88.61 (40.01) 3 Charles C. McGlinnen School Conventional Clintondale Suburb: Large 113.28 89.33 (23.95) 4 Ronald Brown Academy Conventional Detroit City: Large 111.85 88.42 (23.43) 5 Arts & Comm. Academy at Fair Plain Conventional Benton Harbor City: Small 105.49 82.83 (22.66) 6 Kendon School Conventional Lansing City: Midsize 113.19 91.41 (21.79) 7 Dixon Elementary School Conventional Detroit City: Large 109.07 87.54 (21.53) 8 Ann Arbor Trail Magnet School Conventional Detroit City: Large 101.90 81.52 (20.38) 9 Thurgood Marshall Elementary School Conventional Detroit City: Large 105.93 86.28 (19.65)
10 Edison Elementary School Conventional Detroit City: Large 103.20 83.59 (19.60) 11 Academy of The Americas Conventional Detroit City: Large 96.93 77.41 (19.52) 12 Mann Elementary School Conventional Detroit City: Large 102.28 83.40 (18.88) 13 Coit Arts Academy Conventional Grand Rapids City: Midsize 115.99 97.46 (18.54) 14 Vernor Elementary School Conventional Detroit City: Large 104.86 86.88 (17.98) 15 Chrysler Elementary School Conventional Detroit City: Large 111.68 94.73 (16.96) 16 Detroit Service Learning Academy Campus Charter Detroit City: Large 113.25 96.30 (16.95) 17 Arenac Eastern Elementary/Middle School Conventional Arenac Rural: Remote 108.38 91.55 (16.83) 18 Douglass Academy for Young Men Conventional Detroit City: Large 91.24 74.44 (16.80)

The Michigan Context and Performance Report Card: Public Elementary and Middle Schools, 2017 14
Mackinac Center for Public Policy
100 Largest Declines Among Public Elementary and Middle Schools
Table Rank School Name School Type District or Municipality Locale
CAP Scores 2009-2013
2014-2016 Change
19 Bow Elementary-Middle School Conventional Detroit City: Large 96.14 79.78 (16.36) 20 Robbie Hall Parker School Conventional Clintondale Suburb: Large 120.09 104.15 (15.94) 21 Bear Lake High School Conventional Bear Lake Rural: Remote 101.31 85.42 (15.89) 22 East Leonard School Conventional Grand Rapids City: Midsize 109.37 93.50 (15.87) 23 Schulze Elementary-Middle School Conventional Detroit City: Large 97.40 81.60 (15.80) 24 Lucile S. Patton Elem. School Conventional Roseville Suburb: Large 110.87 95.27 (15.60) 25 North Ohio Elementary School Conventional Gaylord Rural: Fringe 113.54 98.16 (15.38) 26 Thompson Middle School Conventional Saginaw City: Small 98.27 82.94 (15.34) 27 Mecosta Elementary School Conventional Chippewa Hills Rural: Remote 113.25 97.92 (15.33) 28 Bagley Elementary School Conventional Detroit City: Large 96.15 81.34 (14.81) 29 Gardner Elementary School Conventional Detroit City: Large 98.03 83.40 (14.63) 30 Ludington Magnet Middle School Conventional Detroit City: Large 101.74 87.21 (14.53) 31 Seminole Academy Conventional Mt. Clemens Suburb: Large 106.84 92.32 (14.52) 32 Priest Elementary-Middle School Conventional Detroit City: Large 96.80 82.29 (14.51) 33 Hope Academy Charter Detroit City: Large 102.96 88.51 (14.45) 34 Jessie Rouse School Conventional Saginaw City: Small 104.23 90.01 (14.22) 35 Spain Elementary-Middle School Conventional Detroit City: Large 100.29 86.21 (14.08) 36 Baraga School Conventional Baraga Rural: Remote 100.96 87.12 (13.84) 37 Miller Elementary School Conventional Plymouth-Canton Suburb: Large 111.98 98.30 (13.68) 38 Gompers Elementary-Middle School Conventional Detroit City: Large 105.93 92.26 (13.67) 39 Davison Elementary-Middle School Conventional Detroit City: Large 125.77 112.29 (13.48) 40 Michigan Technical Academy Middle School Charter Redford City: Large 102.44 89.21 (13.22) 41 Academy for Business & Technology Elem. Charter Dearborn Suburb: Large 112.02 99.15 (12.87) 42 Traverse Heights Elem. School Conventional Traverse City Town: Remote 111.56 98.73 (12.83) 43 John R. King Academic & Performing Arts Conventional Detroit City: Large 88.54 75.92 (12.62) 44 Hoover Elementary School Conventional Wayne-Westland Suburb: Large 105.16 92.86 (12.30) 45 El-Hajj Malik El-Shabazz Academy Charter Lansing City: Midsize 112.05 99.83 (12.22) 46 Crystal Lake Elementary School Conventional Benzie County Rural: Remote 112.37 100.22 (12.15) 47 The Greenspire School Charter Traverse City Town: Remote 99.03 86.91 (12.12) 48 Gordon Elementary School Conventional Marshall Town: Fringe 109.57 97.53 (12.04) 49 Arts and Technology Academy of Pontiac Charter Pontiac City: Small 100.44 88.43 (12.01) 50 Vandenberg Elementary School Conventional Southfield City: Small 109.69 97.82 (11.87) 51 Huron Park Elementary School Conventional Roseville Suburb: Large 100.87 89.13 (11.75) 52 Cooke Elementary School Conventional Detroit City: Large 100.08 88.41 (11.67) 53 Nichols Elementary-Middle School Conventional Detroit City: Large 101.57 90.02 (11.55) 54 Saginaw Preparatory Academy Charter Saginaw Suburb: Midsize 112.81 101.32 (11.49) 55 Crescent Academy Middle School Charter Southfield City: Small 99.68 88.20 (11.48) 56 Roseville Middle School Conventional Roseville Suburb: Large 99.51 88.22 (11.29) 57 Ann J. Kellogg School Conventional Battle Creek City: Small 95.50 84.38 (11.12) 58 Carpenter School Conventional Ann Arbor City: Midsize 106.16 95.09 (11.08) 59 Clippert Academy Selective Detroit City: Large 115.51 104.54 (10.97) 60 Central School Conventional Owosso Town: Distant 104.74 93.89 (10.85) 61 International Academy of Flint (K-12) Charter Flint City: Midsize 111.84 101.00 (10.84) 62 Joseph G. Steenland Elementary School Conventional Roseville Suburb: Large 97.67 86.86 (10.80) 63 Pasteur Elementary School Conventional Detroit City: Large 111.30 100.50 (10.80) 64 Harrington Elementary School Conventional Marshall (Albion) Town: Fringe 112.63 102.04 (10.59) 65 Hayes Elementary School Conventional Livonia City: Small 103.15 92.59 (10.55) 66 East Oakview Elementary School Conventional Northview Suburb: Large 102.22 91.68 (10.54) 67 Northwestern Middle School Conventional Battle Creek City: Small 91.52 80.98 (10.54) 68 Fountain Elementary School Conventional Roseville Suburb: Large 104.10 93.61 (10.49) 69 Horizon Elementary School Conventional Holt Suburb: Large 106.47 95.99 (10.48) 70 United Oaks Elementary School Conventional Hazel Park Suburb: Large 100.66 90.19 (10.47) 71 Blair Elementary School Conventional Traverse City Town: Remote 103.41 93.02 (10.39) 72 Frank E. Bartlett School Conventional South Lyon Suburb: Midsize 110.49 100.16 (10.33)

The Michigan Context and Performance Report Card: Public Elementary and Middle Schools, 2017 15
Mackinac Center for Public Policy
100 Largest Declines Among Public Elementary and Middle Schools
Table Rank School Name School Type District or Municipality Locale
CAP Scores 2009-2013
2014-2016 Change
73 Lansing K-8 STEM Magnet Academy Conventional Lansing City: Midsize 95.47 85.15 (10.31) 74 Eaton Academy Charter Detroit Suburb: Large 95.55 85.27 (10.28) 75 Botsford Elementary School Conventional Clarenceville City: Small 100.08 89.81 (10.27) 76 Benton Harbor Charter School Academy Charter Benton Harbor City: Small 111.37 101.30 (10.07) 77 Highmeadow Common Campus School Conventional Farmington City: Small 106.65 96.62 (10.03) 78 Midland Academy of Adv. & Creative Studies Charter Midland City: Small 102.31 92.42 (9.89) 79 Clark, J.E. Preparatory Academy Conventional Detroit City: Large 88.61 78.78 (9.82) 80 Burns Park Elementary School Conventional Ann Arbor City: Midsize 115.28 105.47 (9.81) 81 K.I. Sawyer Elementary School Conventional Gwinn Rural: Remote 112.30 102.68 (9.63) 82 Lincoln Elementary School Conventional Van Dyke City: Midsize 97.92 88.34 (9.58) 83 Edward "Duke" Ellington @ Beckham Conventional Detroit City: Large 95.26 85.74 (9.53) 84 KND Elementary Conventional Kaleva Rural: Remote 106.15 96.75 (9.40) 85 Owendale-Gagetown Jr/Sr High School Conventional Owendale-Gagetown Rural: Remote 102.94 93.61 (9.33) 86 Thorne Elementary School Conventional Westwood Suburb: Large 101.01 91.90 (9.11) 87 Webster Elementary School Conventional Livonia City: Small 128.41 119.31 (9.11) 88 Uriah H. Lawton School Conventional Ann Arbor City: Midsize 112.53 103.45 (9.09) 89 Sampson Academy Conventional Detroit City: Large 88.79 79.78 (9.01) 90 Manton Consolidated Middle School Conventional Manton Rural: Distant 108.65 99.66 (8.99) 91 Turrill Elementary School Conventional Lapeer Town: Fringe 102.62 93.71 (8.91) 92 Randolph Elementary School Conventional Livonia City: Small 97.28 88.37 (8.91) 93 Marion High School Conventional Marion Rural: Remote 104.76 95.87 (8.89) 94 Detroit Int. Academy for Young Women Conventional Detroit City: Large 100.08 91.20 (8.88) 95 Blackwell Institute Conventional Detroit City: Large 88.63 79.79 (8.85) 96 Greenfield Union Elementary-Middle School Conventional Detroit City: Large 96.42 87.59 (8.84) 97 Sharon J. Hardy Elementary School Conventional South Lyon Suburb: Midsize 107.76 98.93 (8.82) 98 Bad Axe High School Conventional Bad Axe Town: Remote 104.89 96.08 (8.81) 99 Country Elementary School Conventional Pinckney Rural: Fringe 95.57 86.76 (8.81) 100 Lake Ann Elementary School Conventional Benzie County Rural: Remote 107.96 99.28 (8.68)
Sustained Performance To measure sustained performance over a longer period of time, a simple method was used to pare down the list of eligible schools. Included were schools in the new report card with consistent building codes that yielded at least five unique yearly CAP Scores between 2009 and 2016. A total of 2,136 schools were eligible to be assessed for long-term performance. In order to determine the long-term CAP Score, each school’s yearly CAP Scores were averaged together to generate an eight-year average score.
Sustained High Performance: Top 100 Public Elementary and Middle Schools Iris Becker Elementary School, a district school in Dearborn, yielded the highest long-term performance rating. Two charter schools that have received the overall top CAP Score on different editions of this report card — Hamtramck Academy (2017) and Martin Luther King, Jr. Education Center Academy (2015) — both earned spots in the top five for sustained success. In all, 64 of the 100 schools with the highest levels of long-term performance also finished among the top 100 overall for the current report card. These schools appear in bold. Interestingly, DPSCD's Davison Elementary-Middle School ranked in the top 100 for both the current report card and for long-term performance, but also experienced the 39th largest CAP Score decline.
More than half of those recording the top 100 scores for long-term performance are schools located in cities. Suburban schools were more likely to appear in the top 100 for sustained performance (27) than

The Michigan Context and Performance Report Card: Public Elementary and Middle Schools, 2017 16
Mackinac Center for Public Policy
appeared in the top 100 on the current report card (24). Meanwhile, 17 charter schools made an appearance in the top 100. Fourteen of the 17 charters were opened between 1995 and 2005, highlighting some successful established alternatives to the traditional district-run system. All nine selective-admission schools in the sample appear on the top 100 list.
Sustained High Performance: Top 100 Public Elementary and Middle Schools
Table Rank School Name School Type District or
Municipality Locale Long-Term Average
Percent Rank Grade
1 Iris Becker Elementary School Conventional Dearborn City: Small 133.008 100.00% A 2 Crestwood Accelerated Program Selective Crestwood Suburb: Large 130.588 99.95% A 3 Hamtramck Academy Charter Hamtramck Suburb: Large 129.962 99.91% A 4 Lowrey Middle School Conventional Dearborn City: Small 127.958 99.86% A 5 Martin Luther King, Jr. Ed. Ct. Acad. Charter Detroit City: Large 125.124 99.81% A 6 Webster Elementary School Conventional Livonia City: Small 124.998 99.77% A 7 Center for Economicology Selective Grand Rapids City: Midsize 124.616 99.72% A 8 Lowrey Elementary School Conventional Dearborn City: Small 123.367 99.67% A 9 North Godwin Elementary School Conventional Godwin Heights City: Small 122.616 99.63% A
10 Maples Elementary School Conventional Dearborn City: Small 122.116 99.58% A 11 Saginaw Arts and Sciences Academy Selective Saginaw City: Small 121.672 99.53% A 12 Glenwood Elementary Conventional Kentwood Suburb: Large 120.851 99.49% A 13 City Middle/High School Selective Grand Rapids City: Midsize 120.761 99.44% A 14 Davison Elementary-Middle School Conventional Detroit City: Large 120.716 99.39% A 15 Blandford Nature Center Selective Grand Rapids City: Midsize 120.497 99.34% A 16 Handley School Selective Saginaw City: Small 119.472 99.30% A 17 Geer Park Elementary Conventional Dearborn City: Small 118.480 99.25% A 18 Brown Elementary School Conventional Byron Center Rural: Fringe 118.355 99.20% A 19 Star International Academy Charter Dearborn Heights Suburb: Large 117.693 99.16% A 20 John Ball Park Zoo School Selective Grand Rapids City: Midsize 117.582 99.11% A 21 Angell School Conventional Ann Arbor City: Midsize 117.424 99.06% A 22 Reo School Conventional Lansing City: Midsize 116.733 99.02% A 23 Woodworth Middle School Conventional Dearborn City: Small 116.479 98.97% A 24 Martin Luther King Elem. School Conventional Ann Arbor City: Midsize 116.318 98.92% A 25 Southwood Elementary Conventional Kentwood Suburb: Large 115.776 98.88% A 26 Detroit Merit Charter Academy Charter Detroit City: Large 115.544 98.83% A 27 Bridge Academy West Charter Detroit Suburb: Large 115.373 98.78% A 28 West Godwin Elementary School Conventional Godwin Heights City: Small 115.099 98.74% A 29 Jamestown Elementary School Conventional Hudsonville Suburb: Large 114.913 98.69% A 30 Clague Middle School Conventional Ann Arbor City: Midsize 114.769 98.64% A 31 Bridge Academy East Charter Hamtramck Suburb: Large 114.648 98.60% A 32 Hemmeter Elementary School Selective Saginaw Twp. Suburb: Midsize 114.293 98.55% A 33 Franklin Elementary School Conventional Cadillac Town: Remote 114.257 98.50% A 34 Robbie Hall Parker School Conventional Clintondale Suburb: Large 114.111 98.46% A 35 Thirkell Elementary School Conventional Detroit City: Large 114.000 98.41% A 36 Salina Elementary P-3 Conventional Dearborn City: Small 113.886 98.36% A 37 Dickinson East Elementary School Conventional Hamtramck Suburb: Large 113.713 98.31% A 38 Rose City School Conventional West Branch-Rose Rural: Remote 113.696 98.27% A 39 William Ford Elementary School Conventional Dearborn City: Small 113.600 98.22% A 40 Bemis Elementary School Conventional Troy City: Small 113.451 98.17% A 41 Rankin Elementary School Conventional Carman-Ainsworth Suburb: Large 113.426 98.13% A 42 Lakeshore Elementary School Conventional West Ottawa Suburb: Small 113.422 98.08% A 43 Miller Elementary School Conventional Dearborn City: Small 113.421 98.03% A 44 Wright, Charles School Conventional Detroit City: Large 113.336 97.99% A 45 Oakman Elementary School Conventional Dearborn City: Small 113.311 97.94% A 46 Onaway Elementary School Conventional Onaway Rural: Remote 113.194 97.89% A 47 Detroit Edison PSA Charter Detroit City: Large 112.857 97.85% A 48 Grandville Central Elementary School Conventional Grandville Suburb: Large 112.828 97.80% A

The Michigan Context and Performance Report Card: Public Elementary and Middle Schools, 2017 17
Mackinac Center for Public Policy
Sustained High Performance: Top 100 Public Elementary and Middle Schools
Table Rank School Name School Type District or
Municipality Locale Long-Term Average
Percent Rank Grade
49 Berrien Springs Middle School Conventional Berrien Springs Town: Fringe 112.818 97.75% A 50 Riverside Academy Charter Dearborn City: Small 112.802 97.71% A 51 Discovery Elementary Conventional Kentwood Suburb: Large 112.666 97.66% A 52 Townline Elementary Conventional Kentwood Suburb: Large 112.664 97.61% A 53 Lake Hills Elementary School Conventional Grand Haven Suburb: Midsize 112.624 97.57% A 54 Covert Middle School Conventional Covert Rural: Distant 112.459 97.52% A 55 Boulan Park Middle School Conventional Troy City: Small 112.432 97.47% A 56 Kenwood Elementary School Conventional Cadillac Town: Remote 112.334 97.43% A 57 Lybrook Elementary School Conventional Eau Claire Rural: Fringe 112.111 97.38% A 58 Frankfort Elementary School Conventional Frankfort-Elberta Rural: Remote 112.055 97.33% A 59 Harms Elementary School Conventional Detroit City: Large 112.036 97.28% A 60 Pine Creek Elementary School Conventional West Ottawa Suburb: Small 111.878 97.24% A 61 Grayling Middle School Conventional Crawford Ausable Town: Remote 111.871 97.19% A 62 Kinloch Elementary School Conventional Crestwood Suburb: Large 111.858 97.14% A 63 Whittemore-Prescott Area Elementary Conventional Whittemore-Prescott Rural: Remote 111.802 97.10% A 64 John Allen School Conventional Ann Arbor City: Midsize 111.791 97.05% A 65 Brookwood Elementary Conventional Kentwood Suburb: Large 111.782 97.00% A 66 Unis Middle School Conventional Dearborn City: Small 111.713 96.96% A 67 Covert Elementary School Conventional Covert Rural: Distant 111.707 96.91% A 68 Weidman Elementary School Conventional Chippewa Hills Rural: Remote 111.618 96.86% A 69 Burns Park Elementary School Conventional Ann Arbor City: Midsize 111.601 96.82% A 70 Pullman Elementary School Conventional Bloomingdale Rural: Distant 111.600 96.77% A 71 Tappan Middle School Conventional Ann Arbor City: Midsize 111.560 96.72% A 72 Central Academy Charter Ann Arbor City: Midsize 111.531 96.68% A 73 Madison Middle School Conventional Madison (Lenawee) Town: Distant 111.497 96.63% A 74 Ross-Hill Academy - Elementary Charter Detroit City: Large 111.468 96.58% A 75 Clippert Academy Selective Detroit City: Large 111.400 96.54% A 76 Godwin Heights Middle School Conventional Godwin Heights City: Small 111.352 96.49% A 77 Eagle Crest Charter Academy Charter Holland Suburb: Small 111.201 96.44% A 78 Highview Elementary School Conventional Crestwood Suburb: Large 111.187 96.40% A 79 Andrews Elementary School Conventional Three Rivers Town: Fringe 111.118 96.35% A 80 Sister Lakes Elementary School Conventional Dowagiac Union Town: Fringe 111.110 96.30% A 81 Houghton Lake Middle School Conventional Houghton Lake Rural: Fringe 111.056 96.25% A 82 Chippewa Middle School Conventional Okemos Suburb: Large 111.054 96.21% A 83 Riverside Academy - West Campus Charter Dearborn City: Small 110.961 96.16% A 84 Fairview School Conventional Fairview Rural: Remote 110.919 96.11% A 85 The Dearborn Academy Charter Dearborn City: Small 110.758 96.07% A 86 Stout Middle School Conventional Dearborn City: Small 110.753 96.02% A 87 Three Oaks Public School Academy Charter Muskegon City: Small 110.706 95.97% A 88 Forest View Elementary School Conventional Cadillac Town: Remote 110.680 95.93% A 89 Musson Elementary School Conventional Rochester Suburb: Large 110.644 95.88% A 90 Eberwhite School Conventional Ann Arbor City: Midsize 110.599 95.83% A 91 Salina Intermediate 4-8 Conventional Dearborn City: Small 110.585 95.79% A 92 Universal Learning Academy Charter Westland Suburb: Large 110.585 95.74% A 93 McDonald Elementary School Conventional Dearborn City: Small 110.578 95.69% A 94 University Hills Elem. School Conventional Rochester Suburb: Large 110.544 95.65% A 95 Henry Ford Elementary School Conventional Dearborn City: Small 110.541 95.60% A 96 Deckerville Elementary School Conventional Deckerville Rural: Distant 110.410 95.55% A 97 Cesar Chavez Academy Intermediate Charter Detroit City: Large 110.392 95.51% A 98 Slauson Middle School Conventional Ann Arbor City: Midsize 110.352 95.46% A 99 City School Conventional Grand Blanc Suburb: Large 110.232 95.41% A 100 Cesar Chavez Middle School Charter Detroit City: Large 110.180 95.37% A

The Michigan Context and Performance Report Card: Public Elementary and Middle Schools, 2017 18
Mackinac Center for Public Policy
Sustained Low Performance: Bottom 100 Public Elementary and Middle Schools Highlighting the state’s ongoing struggles in urban education, 64 of the 100 lowest long-term performers are located in cities. Thirty-seven of the lowest 100 and 12 of the lowest 20 are specifically run by the Detroit Public Schools Community District, including four schools that used to be managed by the Education Achievement Authority. A pair of rural charter schools can be found in the bottom 20 as well.
Altogether, one in eight city schools in the long-term sample finished in the bottom 100, compared to roughly one in 40 rural and suburban schools, and less than 1 percent of town schools. Notably, charter schools in urban areas are less likely to struggle than their rural, suburban and town-based peers. Of the 20 charter schools among the 100 lowest sustained performance list, only 40 percent were located in cities. Fifty-five percent of charters in the total sample are located in an urban setting.
Similar to the top 100 list, 57 of the bottom 100 in long-term performance recur from the latest overall bottom 100. These schools appear in bold.
Sustained Low Performance: Bottom 100 Public Elementary and Middle Schools
Table Rank School Name School Type District or
Municipality Locale Long-Term Average
Percent Rank Grade
1 Whitmer Human Resource Center Conventional Pontiac City: Small 79.385 0.05% F 2 Marquette Elementary-Middle School Conventional Detroit City: Large 79.678 0.09% F 3 Henderson Academy Conventional Detroit City: Large 79.800 0.14% F 4 Burns Elementary-Middle School Conventional Detroit / EAA City: Large 80.293 0.19% F 5 Hamilton Academy Charter* Detroit City: Large 80.338 0.23% F 6 Brenda Scott Acad. for Theatre Arts Conventional Detroit / EAA City: Large 80.625 0.28% F 7 STEAM Academy at MLK Conventional Benton Harbor City: Small 81.463 0.33% F 8 Mackenzie Elementary-Middle School Conventional Detroit City: Large 81.622 0.37% F 9 Mary McLeod Bethune Elem.-Middle Conventional Detroit / EAA City: Large 81.748 0.42% F
10 J.W. Sexton High School Conventional Lansing City: Midsize 81.961 0.47% F 11 Law Elementary School Conventional Detroit / EAA City: Large 82.185 0.51% F 12 Mason Elementary School Conventional Detroit City: Large 82.528 0.56% F 13 Durfee Elementary-Middle School Conventional Detroit City: Large 83.005 0.61% F 14 Leelanau Montessori PSA Charter Suttons Bay Rural: Distant 83.061 0.66% F 15 Flat River Academy-Mid./High School Charter Greenville Rural: Fringe 83.171 0.70% F 16 Noble Elementary-Middle School Conventional Detroit City: Large 83.545 0.75% F 17 John R. King Acad. & Performing Arts Conventional Detroit City: Large 83.806 0.80% F 18 Gardner Academy Conventional Lansing City: Midsize 84.426 0.84% F 19 Taylor International Academy Charter Southfield City: Small 84.580 0.89% F 20 Clark, J.E. Preparatory Academy Conventional Detroit City: Large 84.923 0.94% F 21 Fisher Magnet Upper Academy Conventional Detroit City: Large 85.073 0.98% F 22 Young, Coleman A. Elementary Conventional Detroit City: Large 85.080 1.03% F 23 Blackwell Institute Conventional Detroit City: Large 85.315 1.08% F 24 Sampson Academy Conventional Detroit City: Large 85.408 1.12% F 25 Trix Performance Academy Charter* Detroit City: Large 85.608 1.17% F 26 Douglass Academy for Young Men Conventional Detroit City: Large 85.643 1.22% F 27 Nolan Elementary-Middle School Conventional Detroit / EAA City: Large 85.692 1.26% F 28 Dossin Elementary-Middle School Conventional Detroit City: Large 86.482 1.31% F 29 Earhart Elementary-Middle School Conventional Detroit City: Large 86.546 1.36% F 30 Faxon Language Immersion Academy Charter Farmington Hills City: Small 86.611 1.40% F 31 Kensington Woods Schools Charter Lakeland Suburb: Midsize 86.765 1.45% F 32 Mid Peninsula School Conventional Mid Peninsula Rural: Distant 87.029 1.50% F 33 Kelly Middle School Conventional East Detroit Suburb: Large 87.347 1.54% F 34 Barber Elementary School Charter* Highland Park Suburb: Large 87.437 1.59% F 35 Flat River Academy - Elementary Charter Greenville Rural: Fringe 87.468 1.64% F 36 Northwestern Middle School Conventional Battle Creek City: Small 87.565 1.69% F

The Michigan Context and Performance Report Card: Public Elementary and Middle Schools, 2017 19
Mackinac Center for Public Policy
Sustained Low Performance: Bottom 100 Public Elementary and Middle Schools
Table Rank School Name School Type District or
Municipality Locale Long-Term Average
Percent Rank Grade
37 Brewer Elementary-Middle School Conventional Detroit City: Large 87.803 1.73% F 38 Pontiac Middle School Conventional Pontiac City: Small 87.848 1.78% F 39 Herrington School Conventional Pontiac City: Small 87.854 1.83% F 40 Holmes, A.L. Elementary-Middle School Conventional Detroit City: Large 88.008 1.87% F 41 Owen Elementary School Conventional Pontiac City: Small 88.646 1.92% F 42 Neinas Dual Language Learning Acad. Conventional Detroit City: Large 88.707 1.97% F 43 Gros Cap School Conventional Moran Twp. Rural: Distant 88.730 2.01% F 44 Murphy Performance Academy Charter* Detroit City: Large 88.733 2.06% F 45 Eastern High School Conventional Lansing City: Midsize 88.771 2.11% F 46 Glenn W. Levey Middle School Conventional Southfield City: Small 88.842 2.15% F 47 Carleton Elementary School Conventional Detroit City: Large 88.850 2.20% F 48 George Long Elementary School Conventional Grass Lake Rural: Fringe 88.954 2.25% F 49 Mohawk Elementary School Conventional Chippewa Valley Suburb: Large 88.971 2.29% F 50 Erie Elementary School Conventional Chippewa Valley Suburb: Large 89.003 2.34% F 51 Palmer Park Preparatory Academy Conventional Detroit City: Large 89.015 2.39% F 52 Pittsford Area Elem. School Conventional Pittsford Rural: Distant 89.063 2.43% F 53 Multicultural Academy Charter Ann Arbor Suburb: Large 89.131 2.48% F 54 Ecorse Community High School Conventional Ecorse Suburb: Large 89.383 2.53% F 55 Will L. Lee School Conventional Richmond Town: Fringe 89.390 2.57% F 56 Carstens Elementary-Middle School Conventional Detroit City: Large 89.474 2.62% F 57 American International Academy Charter Westland Suburb: Large 89.533 2.67% F 58 Academy of The Americas Conventional Detroit City: Large 89.608 2.72% F 59 Carver Elementary-Middle School Conventional Detroit City: Large 89.628 2.76% F 60 Potterville Elementary School Conventional Potterville Rural: Fringe 89.819 2.81% F 61 Garden City Middle School Conventional Garden City Suburb: Large 89.935 2.86% F 62 Bow Elementary-Middle School Conventional Detroit City: Large 90.004 2.90% F 63 Dickinson School Conventional Grand Rapids City: Midsize 90.043 2.95% F 64 Will Carleton Charter School Academy† Charter Hillsdale Rural: Fringe 90.161 3.00% F 65 Stewart Performance Academy Charter* Detroit City: Large 90.162 3.04% F 66 Lansing K-8 STEM Magnet Academy Conventional Lansing City: Midsize 90.311 3.09% F 67 Munger Elementary-Middle School Conventional Detroit City: Large 90.321 3.14% F 68 Creative Technologies Academy Charter Cedar Springs Town: Fringe 90.354 3.18% F 69 Robeson Malcolm X Academy Conventional Detroit City: Large 90.422 3.23% F 70 Attwood School Conventional Lansing City: Midsize 90.451 3.28% F 71 American Montessori Acad. Upper Elem. Charter Redford City: Small 90.570 3.32% F 72 Bagley Elementary School Conventional Detroit City: Large 90.598 3.37% F 73 Oak Park Preparatory Academy Conventional Oak Park Suburb: Large 90.633 3.42% F
74 Patrick Henry Middle School Conventional Woodhaven-Brownstown Suburb: Large 90.687 3.46% F
75 Alice M. Birney K-8 School Conventional Southfield City: Small 90.836 3.51% F 76 Daly School Conventional Westwood Suburb: Large 90.840 3.56% F 77 Ann Visger K-5 Preparatory Academy Conventional River Rouge Suburb: Large 90.923 3.60% F 78 New Bedford Academy Charter Lambertville Suburb: Large 91.033 3.65% F 79 Pulaski Elementary-Middle School Conventional Detroit City: Large 91.043 3.70% F 80 Pleasantview Elementary School Conventional East Detroit Suburb: Large 91.127 3.75% F 81 Beech Elementary Conventional Redford Suburb: Large 91.157 3.79% F 82 Pittsford Area High School Conventional Pittsford Rural: Distant 91.194 3.84% F 83 Woodland School Charter Traverse City Rural: Distant 91.199 3.89% F 84 Dryden High School Conventional Dryden Rural: Distant 91.210 3.93% F 85 University Yes Academy Charter Detroit City: Large 91.239 3.98% F 86 Ann J. Kellogg School Conventional Battle Creek City: Small 91.329 4.03% F 87 Priest Elementary-Middle School Conventional Detroit City: Large 91.362 4.07% F 88 Hutchinson Elementary-Middle School Conventional Detroit City: Large 91.366 4.12% F 89 Schulze Elementary-Middle School Conventional Detroit City: Large 91.476 4.17% F 90 Edgemont Elementary School Conventional Van Buren Suburb: Large 91.558 4.21% F

The Michigan Context and Performance Report Card: Public Elementary and Middle Schools, 2017 20
Mackinac Center for Public Policy
Sustained Low Performance: Bottom 100 Public Elementary and Middle Schools
Table Rank School Name School Type District or
Municipality Locale Long-Term Average
Percent Rank Grade
91 Jessie Loomis School Conventional Saginaw City: Small 91.629 4.26% F 92 Edward "Duke" Ellington @ Beckham Conventional Detroit City: Large 91.692 4.31% F 93 Eaton Academy Charter Detroit Suburb: Large 91.694 4.35% F 94 Owen Intermediate School Conventional Van Buren Suburb: Large 91.733 4.40% F 95 Westwood Middle School Conventional Grand Rapids City: Midsize 91.794 4.45% F 96 Wilkerson Elementary School Conventional Warren City: Midsize 91.810 4.49% F 97 Thomas Jefferson Elem. School Conventional South Redford Suburb: Large 91.826 4.54% F 98 Litchfield High School Conventional Litchfield Rural: Distant 91.884 4.59% F 99 Wood Creek Elementary School Conventional Farmington City: Small 91.928 4.63% F 100 Lindemann Elementary School Conventional Allen Park Suburb: Large 91.941 4.68% F
* Denotes schools that changed from district to charter management, 2009-2016 † Will Carleton Charter School Academy reports that it does not participate in the National School Lunch Program and the number of students it reports to the state who are eligible for a free lunch based on their household income may not be an accurate depiction of the socioeconomic status of its student body. This would lower the school’s CAP Score as a result.

The Michigan Context and Performance Report Card: Public Elementary and Middle Schools, 2017 21
Mackinac Center for Public Policy
About the Authors
Ben DeGrow is the Mackinac Center’s education policy director. DeGrow joined the Center in 2015 after a long stint at Colorado’s Independence Institute, where he provided expert analysis on school choice, school finance, collective bargaining and education employment policies. He authored numerous policy reports and op-eds for various newspapers and other publications, and regularly appeared on radio and television and before legislative committees.
DeGrow graduated summa cum laude with a bachelor’s degree in history from Hillsdale College, and went on to receive a master’s degree in history from the Pennsylvania State University. Ben’s experiences in the classroom include service as a university graduate assistant and as a substitute teacher in Michigan public schools. He also spent nearly a year on the editorial staff of the Hillsdale Daily News.
Ronald Klingler is a data science and information technology consultant. He graduated cum laude in 2015 with a bachelor's degree in mathematics and economics and completed his master’s degree in economics in 2016, both at Central Michigan University.

The Michigan Context and Performance Report Card: Public Elementary and Middle Schools, 2017 22
Mackinac Center for Public Policy
Appendix A: Calculating CAP Scores and Letter Grades *
Calculating CAP Scores
The idea behind CAP Scores is to rate a school’s performance on standardized tests while controlling for the economic status of students. The data come from the new M-STEP tests, administered in school years 2014, 2015 and 2016.
The first step in deriving the scores was to create an adjusted performance score for each test, by grade, subject and year. To do this, the scale scores of each test were standardized to have a statewide average of 100, and a variance of 15. The scores for each administered test were then averaged together to create an adjusted performance score for each grade:
𝐴𝐴𝐴𝐴𝐴𝐴𝐴𝐴𝐴𝐴𝐴𝐴𝐴𝐴𝐴𝐴𝐴𝐴𝐴𝐴𝐴𝐴𝐴𝐴𝐴𝐴𝐴𝐴𝐴𝐴𝐴𝐴𝐴𝐴𝐴𝐴𝐴𝐴 = 100 + 15 �(𝑇𝑇𝐴𝐴𝐴𝐴𝐴𝐴𝐴𝐴𝑇𝑇𝑇𝑇.−𝑆𝑆𝐴𝐴𝐴𝐴𝐴𝐴𝐴𝐴𝐴𝐴𝑇𝑇𝑇𝑇. )
𝑆𝑆.𝐷𝐷. 𝐴𝐴𝐴𝐴𝑆𝑆𝐴𝐴𝐴𝐴𝐴𝐴𝐴𝐴𝐴𝐴𝑇𝑇𝑇𝑇.�
The adjusted performance scores for each test are then compared to a predicted performance. The predicted performance is the score one would expect given the economic status of the students taking the tests. To get this predicted performance, the adjusted performance score for each year is modeled against the percentage of students being tested which qualify for free lunch, and then the regression equation is used to generate the predicted performance. The regression equation is as follows:
𝐴𝐴𝐴𝐴𝐴𝐴𝑃𝑃𝑃𝑃𝑃𝑃𝑃𝑃𝑖𝑖 = 𝛽𝛽0 + 𝛽𝛽1(𝐹𝐹𝐹𝐹𝐹𝐹𝐹𝐹)𝑖𝑖 + 𝜇𝜇𝑖𝑖
where 𝐴𝐴𝐴𝐴𝐴𝐴𝑃𝑃𝑃𝑃𝑃𝑃𝑃𝑃𝑖𝑖 is the average test score at school i;
β0 is a constant and is the predicted score of a school without any students eligible for a free lunch;
β1 is the estimated impact of the student population’s free lunch eligibility rate on a school’s average score;
FREEi is the number of students eligible for free lunch divided by the total student population;
and µi is the error term.
A unique equation is generated for each test, and that equation produces a predicted performance for each test, school and year. The ratio of the actual and predicted score, multiplied by 100, produces the final CAP Score for that test.
For example, the 2016 M-STEP third-grade English language arts scale score for Gallimore Elementary School in the Plymouth-Canton School District was 1333.9. The state average for that test is 1293.612, with a standard deviation of 13.004. Using the above formula, we get 100+15(1333.9-1293.612)/13.004 = 146.472 as an adjusted score.
* Some of the language in this section is copied verbatim from text previously published by the Mackinac Center.

The Michigan Context and Performance Report Card: Public Elementary and Middle Schools, 2017 23
Mackinac Center for Public Policy
Gallimore’s free lunch percentage is 1.67 percent. The regression equation for the 2016 third-grade ELA is Adj = 120.1059 – 42.9781(Free Lunch), yielding a predicted performance score of 119.39. The predicted CAP Score for a school with no free lunch students is 120.1059, while 42.981 represents the factor associated with a declining score due to an increasing free lunch student population. Multiplying 100 by the ratio of the adjusted score and the predicted (146.472/119.39) yields a CAP Score of 122.684 for Gallimore’s 2016 ELA test.
All subject scores for each grade are averaged together, and then all these average grade-level scores are averaged to produce the CAP Score for a given school in a given year. The overall CAP Score for a school is the average yearly score from 2014 to 2016. Averaging together these scores over multiple years provides a general picture of how well the school is performing and works to smooth out year-to-year variation.
Letter grades based on CAP Scores are issued on a curve. The top 10 percent of schools received an A, the next 20 percent a B, the middle 40 percent a C, the next 20 percent a D and the bottom 10 percent an F. This distribution is consistent with all prior editions of the Context and Performance Report Card.
The pre-2014 yearly CAP Score data used to generate information on improvements and declines, as well as long-term performance trends, was determined by CAP Scores created in prior reports. The same process of averaging by subject test and grade and then by school was used. The exception to this is the 2013 data, which were recalculated from the ground up using raw MEAP test results and free lunch data.

The Michigan Context and Performance Report Card: Public Elementary and Middle Schools, 2017 24
Mackinac Center for Public Policy
Appendix B: Locale Codes*
The locale codes used in this paper come directly from the National Center for Education Statistics. Locale codes represent how far away a particular school is from an urbanized area, and are based on a school’s physical street address. † According to the NCES, the geographic information used to create locale codes is updated for about one-third of communities every year.
Definitions of each locale code category are below, taken directly from the NCES: ‡
Locale Code Definition
City: Large Territory inside an urbanized area and inside a principal city with population of 250,000 or more.
City: Midsize Territory inside an urbanized area and inside a principal city with population less than 250,000 and greater than or equal to 100,000
City: Small Territory inside an urbanized area and inside a principal city with population less than 100,000.
Suburb: Large Territory outside a principal city and inside an urbanized area with population of 250,000 or more.
Suburb: Midsize Territory outside a principal city and inside an urbanized area with population less than 250,000 and greater than or equal to 100,000.
Suburb: Small Territory outside a principal city and inside an urbanized area with population less than 100,000.
Town: Fringe Territory inside an urban cluster that is less than or equal to 10 miles from an urbanized area.
Town: Distant Territory inside an urban cluster that is more than 10 miles and less than or equal to 35 miles from an urbanized area.
Town: Remote Territory inside an urban cluster that is more than 35 miles from an urbanized area.
Rural: Fringe Census-defined rural territory that is less than or equal to 5 miles from an urbanized area, as well as rural territory that is less than or equal to 2.5 miles from an urban cluster.
Rural: Distant Census-defined rural territory that is more than 5 miles but less than or equal to 25 miles from an urbanized area, as well as rural territory that is more than 2.5 miles but less than or equal to 10 miles from an urban cluster
Rural: Remote Census-defined rural territory that is more than 25 miles from an urbanized area and is also more than 10 miles from an urban cluster.
* Some of the language used in this section is verbatim to text in previously published Mackinac Center studies.
† “Identification of Rural Locales” (U.S. Department of Education), http://perma.cc/DS9B-6D98.
‡ Ibid.

BOARD OF DIRECTORS BOARD OF SCHOLARSHon. Clifford W. Taylor, Chairman Retired Chief Justice
Michigan Supreme Court
Joseph G. Lehman President Mackinac Center for Public Policy
Jim Barrett Retired President and CEO Michigan Chamber of Commerce
Daniel J. Graf Chief Investment Officer Amerisure Mutual Holdings, Inc.
Dulce M. Fuller Owner Woodward and Maple
Richard G. Haworth Chairman Emeritus Haworth, Inc.
Kent B. Herrick President and CEO Thermogy
J.C. Huizenga President Westwater Group
Edward C. Levy Jr. President Edw. C. Levy Co.
Rodney M. Lockwood Jr. President Lockwood Construction Co., Inc.
Joseph P. Maguire President and CEO Wolverine Development Corp.
Richard D. McLellan Attorney McLellan Law Offices
D. Joseph Olson Retired Senior Vice President and General Counsel Amerisure Companies
Dr. Donald Alexander Western Michigan University
Dr. Thomas Bertonneau SUNY-Oswego
Dr. Brad Birzer Hillsdale College
Dr. Peter Boettke George Mason University
Dr. Theodore Bolema The Free State Foundation
Dr. Michael Clark Hillsdale College
Matthew Coffey Central Michigan University
Dr. Dan Crane University of Michigan Law School
Shikha Dalmia Reason Foundation
Dr. Chris Douglas University of Michigan-Flint
Dr. Jefferson Edgens University of Wyoming
Dr. Ross Emmett Arizona State University
Dr. Sarah Estelle Hope College
Dr. Hugo Eyzaguirre Northern Michigan University
Dr. Tawni Ferrarini Northern Michigan University
Dr. Burton Folsom Hillsdale College (ret.)
John Grether Northwood University
Dr. Michael Heberling Baker College
Dr. David Hebert Aquinas College
Dr. Michael Hicks Ball State University
Dr. Ormand Hook Mecosta-Osceola ISD
Robert Hunter Mackinac Center for Public Policy
Prof. Harry Hutchison George Mason University School of Law
Dr. David Janda Institute for Preventative Sports Medicine
Annette Kirk Russell Kirk Center
David Littmann Mackinac Center for Public Policy
Dr. Dale Matcheck Northwood University
Charles Meiser Lake Superior State University (ret.)
Dr. Glenn Moots Northwood University
Dr. George Nastas III Marketing Consultants
Dr. Todd Nesbit Ball State University
Dr. John Pafford Northwood University (ret.)
Dr. Mark Perry University of Michigan-Flint
Lawrence W. Reed Foundation for Economic Education
Gregory Rehmke Economic Thinking
Dr. Steve Safranek Wiss, Janney, Elstner Associates, Inc.
Dr. Howard Schwartz Oakland University
Dr. Martha Seger Federal Reserve Board (ret.)
James Sheehan SunTrust Robinson Humphrey
Rev. Robert Sirico Acton Institute
Dr. Bradley Smith Capital University Law School
Dr. Chris Surprenant University of New Orleans
Dr. Jason Taylor Central Michigan University
Dr. John Taylor Wayne State University
Dr. Richard K. Vedder Ohio University
Prof. Harry Veryser Jr. University of Detroit Mercy
John Walter Jr. Dow Corning Corporation (ret.)
Mike Winther Institute for Principle Studies
Dr. Gary Wolfram Hillsdale College

© 2018 Mackinac Center for Public Policy, Midland, Michigan
ISBN: 978-1-942502-23-4 | S2018-03 | Mackinac.org/s2018-03
140 West Main Street P.O. Box 568 Midland, Michigan 48640
989-631-0900 Fax 989-631-0964 Mackinac.org [email protected]
The Mackinac Center for Public Policy is dedicated to improving the understanding of economic and political principles among citizens, public officials, policymakers and opinion leaders. The Center has emerged as one of the largest and most prolific of the more than 50 state-based free-market “think tanks” in America. Additional information about the Mackinac Center and its publications can be found at www.mackinac.org.
Additional copies of this report are available for order from the Mackinac Center.
For more information, call 989-631-0900, or see our website, www.mackinac.org.
Ben DeGrow is the Mackinac Center’s education policy director. DeGrow joined the Center in 2015 after a long stint at Colorado’s Independence Institute, where he provided expert analysis on school choice, school finance, collective bargaining and education employment policies. He authored numerous policy reports and opinion-editorials for various newspapers and other publications, and regularly appeared on radio and television and before legislative committees.
Ronald Klingler is a data science and information technology consultant. He graduated cum laude in 2015 with a bachelor's degree in mathematics and economics and completed his master’s degree in economics in 2016, both at Central Michigan University.