the microbase value-added product: a baseline retrieval of
TRANSCRIPT

DOE/SC-ARM/TR-095
The Microbase Value-Added Product: A Baseline Retrieval of Cloud Microphysical Properties M Dunn K Johnson M Jensen May 2011

DISCLAIMER
This report was prepared as an account of work sponsored by the U.S. Government. Neither the United States nor any agency thereof, nor any of their employees, makes any warranty, express or implied, or assumes any legal liability or responsibility for the accuracy, completeness, or usefulness of any information, apparatus, product, or process disclosed, or represents that its use would not infringe privately owned rights. Reference herein to any specific commercial product, process, or service by trade name, trademark, manufacturer, or otherwise, does not necessarily constitute or imply its endorsement, recommendation, or favoring by the U.S. Government or any agency thereof. The views and opinions of authors expressed herein do not necessarily state or reflect those of the U.S. Government or any agency thereof.

DOE/SC-ARM/TR-095
The Microbase Value-Added Product: A Baseline Retrieval of Cloud Microphysical Properties M Dunn K Johnson M Jensen May 2011 Work supported by the U.S. Department of Energy, Office of Science, Office of Biological and Environmental Research

M Dunn, et al., May 2011, DOE/SC-ARM/TR-095
iii
Abstract
This report describes the Atmospheric Radiation Measurement (ARM) Climate Research Facility baseline cloud microphysical properties (MICROBASE) value-added product (VAP). MICROBASE uses a combination of millimeter-wavelength cloud radar, microwave radiometer, and radiosonde observations to estimate the vertical profiles of the primary microphysical parameters of clouds including the liquid/ice water content and liquid/ice cloud particle effective radius. MICROBASE is a baseline algorithm designed to apply to most conditions and locations using a single set of parameterizations and a simple determination of water phase based on temperature.
This document provides the user of this product with guidelines to assist in determining the accuracy of the product under certain conditions. Quality control flags are designed to identify outliers and indicate instances where the retrieval assumptions may not be met. The overall methodology is described in this report through a detailed description of the input variables, algorithms, and output products.

M Dunn, et al., May 2011, DOE/SC-ARM/TR-095
iv
Contents
Abstract ........................................................................................................................................................ iii 1.0 Introduction .......................................................................................................................................... 1
1.1 Background .................................................................................................................................. 1 1.2 General Product Description ........................................................................................................ 1
2.0 Input Data ............................................................................................................................................. 2 2.1 Required Instruments ................................................................................................................... 2 2.2 Input Products .............................................................................................................................. 2
2.2.1 MWRRET ......................................................................................................................... 2 2.2.2 ARSCL .............................................................................................................................. 2 2.2.3 Merged Sounding .............................................................................................................. 3
2.3 Table of Input Files ...................................................................................................................... 3 3.0 Algorithm and Methodology ................................................................................................................ 4
3.1 Process Flow Diagram ................................................................................................................. 4 3.2 Algorithm Description.................................................................................................................. 4
3.2.1 Cloud Water Phase Determination .................................................................................... 4 3.2.2 Determining Ice Water Content and Ice Effective Radius ................................................ 5 3.2.3 Plots of IWC and iceRe ..................................................................................................... 5 3.2.4 Determining Liquid Water Content and Liquid Effective Radius ..................................... 6 3.2.5 Scaling Liquid Water Content to MWR Observations ...................................................... 7 3.2.6 Plots of LWC and Liquid Re ............................................................................................. 8
4.0 Output Data .......................................................................................................................................... 9 4.1 Description of Output ................................................................................................................... 9 4.2 Microbasepi2 Output Fields ......................................................................................................... 9 4.3 Microbasepiavg Output Fields ................................................................................................... 11
5.0 Data Quality Assessment .................................................................................................................... 12 5.1 Determining Minimum and Maximum Allowable Values ......................................................... 12 5.2 Quality Assessment of the 10-Second Data Fields .................................................................... 13
5.2.1 Quality control Flag descriptions .................................................................................... 13 5.3 Quality Assessment of Averaged Fields .................................................................................... 15
6.0 VAP Status ......................................................................................................................................... 16 7.0 VAP Version History .......................................................................................................................... 16 8.0 Time Periods Processed ...................................................................................................................... 16 9.0 Data Access ........................................................................................................................................ 18 10.0 Summary ............................................................................................................................................. 18 11.0 References .......................................................................................................................................... 18 12.0 Contacts .............................................................................................................................................. 19 Appendix A Microbasepi Algorithm Flow Diagram ................................................................................ A.1 Appendix B NetCDF Output Sample Header Information from microbasepi2 Datastream ......................B.1 Appendix C NetCDF Output Sample Header Information from 20-Minute Averaged Data ....................C.1

M Dunn, et al., May 2011, DOE/SC-ARM/TR-095
v
Figures
1 Data flow diagram for the MICROBASE VAP .................................................................................... 4
2 Examples of the MICROBASE quick look plots produced daily from the 20-minute files. ................ 6
3 Examples of the quick look plots produced daily ................................................................................. 8
Tables
1 List of input files and the variables contained within the file that serve as input to MICROBASE. ...................................................................................................................................... 3
2 Micropbasepi2 Output variables. ........................................................................................................ 10
3 Microbaseavg Output variables. ......................................................................................................... 11
4 Table of calculated minimum and maximum allowable values for primary variables. ...................... 12
5 Listing of the complete history of microbasepi2/microbasepi version changes. ................................ 16

M Dunn, et al., May 2011, DOE/SC-ARM/TR-095
1
1.0 Introduction
This technical report describes the Continuous Baseline Microphysical Retrieval (MICROBASE) value-added product (VAP) produced operationally by the Atmospheric Radiation Measurement (ARM) Climate Research Facility. MICROBASE provides a continuous estimate of cloud microphysical properties at all ARM fixed sites. It is designed to run operationally and provide data to the ARM Data Archive for scientific distribution. The purpose of this technical report is present an overview of the product and to serve as a resource for data users.
1.1 Background
Clouds play a critical role in the Earth's energy budget through direct interactions with electromagnetic radiation and as a component of the hydrological cycle. It is through these interactions that clouds provide an important feedback to the climate system, which we must be able to define if we are to accurately predict future climate states. Clouds may transmit, reflect, or absorb radiant energy impinging upon them. For a given cloud, the effects of these processes depend on both cloud macrophysical properties (cloud height, cloud fraction, cloud thickness) and microphysical properties (water phase, size, and number density of cloud droplets). Therefore, in order to perform accurate calculations of the transfer of electromagnetic radiation through the atmosphere and to quantify the role clouds play in the Earth's climate and climate change, vertical profiles of liquid and ice water contents, and the number and sizes of the cloud particles that contribute to this total water are required.
1.2 General Product Description
The MICROBASE VAP was originally developed at Brookhaven National Laboratory in 2002 (Miller et al. 2003). The primary purpose of producing this VAP was, and continues to be, to provide the required microphysical values for input to the Broadband Heating Rate Profile (BBHRP) and Radiatively Important Parameters Best Estimate (RIPBE) VAPs in order to generate estimates of atmospheric radiative heating rates. MICROBASE produces cloud microphysical properties based on cloud radar measurements taken at ARM sites. To accomplish this task, combinations of accepted algorithms are employed. The algorithms interpret radar reflectivity profiles and microwave brightness temperatures in the context of the underlying cloud microphysical structure. Many of the algorithms are empirical in nature, and assumptions must be made in order to convert information gathered from the remote and passive sensors into geophysically meaningful quantities. Reasonable assumptions for location, particle distribution, and cloud type have been developed to produce a continuous time series of the microphysical profiles. The product of this analysis, originally called MICROBASEPI, provides instantaneous vertical profiles of liquid water content (LWC), ice water content (IWC), liquid cloud particle effective radius (LiqRe), ice cloud particle effective radius (IceRe), and cloud fraction. MICROBASEPI output is produced in two different formats: (1) at 10-second time intervals and 45-meter height intervals consisting of 512 vertical levels and (2) at 20-minute time intervals with over 230 vertical levels. The latter format includes profiles of cloud fraction as well.

M Dunn, et al., May 2011, DOE/SC-ARM/TR-095
2
2.0 Input Data
2.1 Required Instruments
The MICROBASE product uses a combination of observations from the following meteorological instruments: the 35-GHz millimeter wavelength cloud radar (MMCR), the ceilometer, the micropulse lidar (MPL), the microwave radiometer (MWR), and balloon-borne radiosonde soundings. The instruments reside at the ARM fixed sites in close proximity to each other.
The data collected by these instruments are first processed into more useable, value-added products (VAPs). As a consequence, the MICROBASE VAP is dependent solely upon other VAPs for input information.
2.2 Input Products
The information required by MICROBASE is contained within three ARM VAPs: Active Remote Sensing of Clouds (ARSCL), Microwave Radiometer Retrievals (MWRRET), and Merged Sounding (MERGESONDE). All three input VAPs are routinely produced on a daily schedule. These daily files must be in the standard ARM netCDF file format. MICROBASE inputs the daily file of each VAP, selects the vital input variables, and then regrids the data to conform to the ARSCL ten-second timescale and 45-meter height grid. Microphysical quantities are calculated on this time-height grid. The MICROBASE retrieval will not calculate microphysical quantities at any time step for which the ARSCL or MERGESONDE data are missing and will not calculate liquid variables if the MWRRET data are missing.
2.2.1 MWRRET
The MWRRET VAP (Turner et al. 2007) uses an advanced retrieval algorithm to derive cloud liquid water path (LWP) and column precipitable water from the microwave radiometer measurements. The stat2 retrieval is a statistical approach whereby the thermodynamic atmospheric state influences the prediction equations and retrieval coefficients generated by a radiative transfer (monoRTM) model (Liljegren et al. 2001). The MWRRET values of vertical column LWP are primarily used to scale reflectivity based calculations of LWC in MICROBASE. Some data quality flags generated within this VAP are utilized and transferred to MICROBASE.
2.2.2 ARSCL
The ARSCL VAP (Clothiaux et al. 2000) provides a time series of vertical distributions of hydrometeors by combining measurements from the millimeter wavelength cloud radar, laser ceilometer, microwave radiometer, and micropulse lidar. Vertical cloud boundaries (i.e., cloud top, cloud base) are determined in ARSCL by assessing MMCR, lidar, and ceilometer data. MICROBASE uses ARSCL cloud boundary information; however, ARSCL’s best-estimate radar reflectivity factor is the primary data field utilized in MICROBASE.

M Dunn, et al., May 2011, DOE/SC-ARM/TR-095
3
2.2.3 Merged Sounding
The MERGESONDE VAP merges observations from radiosonde soundings with information from the microwave radiometer (MWR), surface meteorological instruments, and European Centre for Medium-Range Weather Forecasts (ECMWF) model output using a sophisticated scaling/interpolation/smoothing scheme in order to define profiles of the atmospheric thermodynamic state. The temperature profile from Merged Sounding is used to define the phase of the cloud water and in the parameterization of ice particle effective radius.
2.3 Table of Input Files
In order to properly run this VAP, the following daily input files are needed:
Table 1. List of input files and the variables contained within the file that serve as input to MICROBASE.
INSTRUMENT VAP
NAME VARAIBLE UNITS VARIABLE LONG NAME INPUT FILE NAME: SGPMWRRET1LILJCLOUC1.C1.YYYYMMDD.HHMMSS.CDF
MWR MWRRET stat2_lwp g/m2
Cloud liquid water path retrieved using predicted mean radiating temperatures and retrieval coefficients
MWR MWRRET stat2_tliq_flag (previously called stat2_qcflag) unitless Status flag associated with
stat2 retrievals
MWR MWRRET qc_stat2_lwp unitless
Quality check results on field stat2_lwp. Description: This field contains bit-packed values which should be interpreted as listed. No bits set (zero) represents good data.
INPUT FILE NAME: SGPARSCL1CLOTHC1.C1.YYYYMMDD.HHMMSS.CDF
MMCR ARSCL Heights mAGL Height of measured value
MMCR ARSCL ReflectivityBestEstimate dBZ(x100) MMCR best estimate of hydrometeor reflectivity
MMCR ARSCL qc_ReflectivityClutterFlag unitless MMCR reflectivity clutter flag
lidar ARSCL CloudBaseBestEstimate mAGL LASER cloud base height best estimate
INPUT FILE NAME: SGPMERGESONDE1MACEC1.C1.YYYYMMDD.HHMMSS.CDF
Sounding Merged Sounding height km above
MSL Height
Sounding Merged Sounding temp Deg C Temperature

M Dunn, et al., May 2011, DOE/SC-ARM/TR-095
4
3.0 Algorithm and Methodology
The MICROBASE VAP incorporates the data listed in the previous section. The algorithm is primarily coded in C computer language; however, the quick look plots are generated by an IDL script, and a post-processing MATLAB script is run to make netCDF output files compliant with ARM standards. Contained within the algorithm code are a number of parameterizations that are applied to the data in order to retrieve vertical profiles of LWC, IWC, LiqRe, and IceRe at ten-second intervals and then average over a 20-minute time period.
3.1 Process Flow Diagram
Figure 1. Data flow diagram for the MICROBASE VAP. The algorithm process is depicted as well as
the input (yellow) and output (green) data flow. Underlying algorithm assumptions are noted.
3.2 Algorithm Description
This is a radar reflectivity (Z) based algorithm that is designed to retrieve cloud microphysical quantities contained within vertical atmospheric profiles. Algorithm flow is described in Appendix A.
3.2.1 Cloud Water Phase Determination
MICROBASE’s algorithm separates the contribution that liquid hydrometeors make to the total radar reflectivity versus the contributions from ice by examining the ambient temperature. If the sonde-measured air temperature is greater than 0°C, all of the reflectivity measured in a specific time and height

M Dunn, et al., May 2011, DOE/SC-ARM/TR-095
5
bin is considered to be from liquid water. Likewise, if the ambient temperature is less than -16°C, all of the reflectivity is assumed to be from ice water particles. The reflectivity is partitioned in the following manner, where T is the interpolated sounding temperature in a particular time-height bin and Ztotal is the total measured radar reflectivity factor in units of (mm6m-3):
For T <= -16°C, assume all ice therefore Zice =Ztotal
For T >= 0°C, assume all liquid therefore Zliquid =Ztotal
At temperatures between -16 °C and 0°C , Ztotal is partitioned between water and ice using the following mixed-mode fractionating scheme, where Zliquid and Zice are also in units of (mm6m-3):
where -16 < T < 0 C,
ice fraction = - T / 16, and therefore Zice= ice fraction * Ztotal
liquid fraction = (1-ice fraction), and therefore Zliquid = liquid fraction*Ztotal.
3.2.2 Determining Ice Water Content and Ice Effective Radius
Once the reflectivity signal is partitioned into the portion from liquid and that from ice cloud, hydrometeors, water contents, and effective radii can be determined. For ice cloud layers, the water content contained within the ice is determined using the empirical Z-IWC relationship from Liu and Illingworth (2000), where IWC is given in grams per cubic meter.
59.0097.0 iceZIWC = , (1)
This relationship is applicable to reflectivity from a 35-GHz radar signal. A number of assumptions about the size, shape, and density of the target ice particles are implicit in the relationship. For example, they are assumed to be unaggregated crystals of the same relative size-to-density as those found in midlatitude cirrus clouds. Errors are introduced when the assumptions are not met.
The ice cloud particle effective radius ( eir ) is determined as a function of temperature. It is based on the empirical relationship of Ivanova et al. (2001)
( )2
5895.03.75 Trei+
= , (2)
where T is temperature in degrees Celsius. Here we assume a constant mass-dimension relationship for all hydrometeors as well as a bimodal ice particle size distribution, typical of midlatitude cirrus clouds.
3.2.3 Plots of IWC and iceRe
Quick look plots of averaged IWC and iceRe data are available at http://www.dmf.arm.gov/ql.php

M Dunn, et al., May 2011, DOE/SC-ARM/TR-095
6
Figure 2. Examples of the MICROBASE quick look plots produced daily from the 20-minute files.
The top plot is of ice water content; bottom plot is of ice effective radius for one day.
3.2.4 Determining Liquid Water Content and Liquid Effective Radius
Determinations of LWC are made based on the radar reflectivity best estimate from the ARSCL VAP. Once the portion of the radar reflectivity derived solely from liquid hydrometeors has been determined, we use the following relationship derived by Liao and Sassen (1994),
8.1/10
6.3
= liquidZN
LWC, (3)
where:
N0 = Reference Cloud particle Number Concentration (cm-3)
to produce the initial estimate of LWC at each height bin. N0 is not measured, so it is assumed to be equal to 100 cm-3.

M Dunn, et al., May 2011, DOE/SC-ARM/TR-095
7
The accuracy of the reflectivity-based estimate of LWC is evaluated by comparing it to an independent measurement of cloud liquid water. First, at each 10-second time point, the reflectivity-derived LWC amount is vertically integrated through all cloud layers (cloud base to cloud top) to provide an estimate of liquid water path (LWP). The vertical layers are integrated in time by applying the trapezoid rule to each height bin interval within the clouds as follows:
Integrated LWC = dz/2 (lwc [0] + 2*lwc [1] + 2*lwc [2] + ... +2*lwc [nh-2] + lwc [nh] )
where nh is the total number of height bins within all cloud layers. This estimate is compared with the value of LWP measured by the MWR.
3.2.5 Scaling Liquid Water Content to MWR Observations
The algorithm incorporates MWR liquid water path information interpolated to the MICROBASE 10-second time scale, as an additional constraint on total column LWC. If the MWR reports a greater LWP than the integrated radar reflectivity derived estimate, the latter are scaled to agree. A measure of the degree of scaling is reported as the variable “Mwr Scaling Factor,” which is calculated as the ratio of the MWR-retrieved LWP to the estimated LWP. A scaled LWC value is then calculated at each height by multiplying LWC by that scaling factor to ensure that the total column LWP matches that retrieved from the MWR. So, at each height:
LWCscaled = LWC * scaleFactor
If the MWR reports a greater amount of cloud liquid water, the MWR constraint is applied to the reflectivity-derived values through the application of the scaling factor. The MWR LWP value is derived from the nearest-in-time positive stat2_lwp value to within a 5-minute window of the MICROBASE profile time. If no stat2_lwp value falls within the 5-minute time period, the scale factor is set to MISSING and LWCscaled is set to MISSING for all heights.
If the reflectivity-derived LWP is greater than zero but the MWR does not see any liquid, the initial phase fractionation procedure (described Section 3.2.1) is reevaluated. In this case, the radiosonde-derived dry air temperature is examined. If the temperature is <-10°C the ice_fraction is set to 1.0, all of the reflectivity is deemed to be from ice, and LWCscaled is set to 0. If the temperature is greater than or equal to -10°C, the nearest positive stat2_lwp value is used instead. In the case where no nearby value is found within 5 minutes but the temperature is >= 0, LWCscaled is set to 0. If the temperature is between 0 and -10°C, LWCscaled is set to 0 and the initial calculation of ice fraction is reset to 1.0, thereby allocating all of the reflectivity to ice instead of liquid. If, on the other hand, the MWR sees liquid but the radar does not, the radar reflectivity-derived LWC is neither scaled nor modified.
Liquid cloud particle effective radii are computed assuming a log-normal droplet distribution with a width of σ = 0.35 and a mode radius given by the formula:

M Dunn, et al., May 2011, DOE/SC-ARM/TR-095
8
( )
31
2mod
29exp4
3
=σπρ dw
e
N
LWCr
(4)
where Nd is the cloud particle number concentration, now assumed to be 200 cm-3, and ρw is the density of water (Frisch et al. 1995). This mode radius is converted to the cloud particle effective radius assuming a log-normal size distribution, such that
me rr 358.1= (5)
3.2.6 Plots of LWC and Liquid Re
Quick look plots of the averaged LWC and liquid Re data are available at http://www.dmf.arm.gov/ql.php
Figure 3. Examples of the quick look plots produced daily. Top plot is of liquid water content; bottom
plot is of liquid effective radius for one day.

M Dunn, et al., May 2011, DOE/SC-ARM/TR-095
9
4.0 Output Data
MICROBASE output is produced in two different formats: (1) at 10-second time intervals and 45-meter height intervals consisting of 512 vertical levels and (2) at 20-minute time intervals with over 230 vertical levels. The 10-second files have the datastream name microbasepi2 (older versions use microbasepi), while the datastream name for the 20-minute files is microbasepiavg.
The microbasepi2 datastream is produced by post-processing the earlier version (microbasepi) files, adding QC flags, and then applying additional formatting.
The 20-minute data are an average of the original 10-second data; hence, they were generated with the exact same set of parameterizations. The data are first averaged in time and then in height. The averaged format includes profiles of cloud fraction as well.
4.1 Description of Output
The MICROBASE VAP produces two output file types with the following datastream names:
SSSmicrobasepi2CC.ll.YYYYMMDD.hhmmss
SSSmicrobasepiavgCC.ll.YYYYMMDD.hhmmss
where:
SSS–the site of the instrument (e.g., sgp)
CC–facility (e.g., C1, C3)
ll–data field level (e.g., c1)
YYYYMMDD.hhmmss – YYYY = year, MM = month of the year, DD = day of the month,
hh = hour of the day, mm = minute of the hour, ss = second of the minute of data start time
Note: earlier versions of MICROBASE produced the datastream SSSmicrobasepiCC.c1.YYYYMMDD.hhmmss as a 10-second file.
4.2 Microbasepi2 Output Fields
Table 2 lists the MICROBASE netCDF 10-second microbasepi2 raw output file fields.

M Dunn, et al., May 2011, DOE/SC-ARM/TR-095
10
Table 2. Micropbasepi2 output variables.
Fieldname Description Units
base_time Base Time in Epoch seconds since 1970/01/01 00:00:00
time_offset Time offset from base_time seconds since base_time
time Time offset from midnight seconds since midnight
height Height of computed value M AGL
Mwr_scale_factor Ratio of MWR liq to integrated LWC unitless
liquid_water_content Retrieved Liquid Water Content g m-3
aqc_liquid_water_content Quality check results on field: liquid_water_content
unitless
ice_water_content Retrieved Ice Water Content g m-3
aqc_ice_water_content Quality check results on field: ice_water_content
unitless
liq_effective_radius Liquid Effective Radius micron
aqc_liq_effective_radius Quality check results on field:liq_effective_radius
unitless
ice_effective_radius Ice Effective Radius micron
aqc_ice_effective_radius Quality check results on field: ice_effective_radius data
unitless
aqc_retrieval Flag indicating availability and reliability of cloud retrievals
unitless
aqc_clear_cloud Clear/Cloudy flag based on ceilometer, MPL, and radar
unitless
aqc_stat2_lwp Check on input stat2_lwp - MWRRET Cloud liquid water path
unitless
lat north latitude degrees
lin east longitude degrees
alt Altitude meters above Mean Sea Level

M Dunn, et al., May 2011, DOE/SC-ARM/TR-095
11
4.3 Microbasepiavg Output Fields
Table 3 lists the MICROBASE netCDF 20-minute, averaged microbasepiavg output file fields.
Table 3. Microbaseavg output variables.
Fieldname Description Units
base_time Base time in epoch seconds since 1970/01/01 00:00:00
time_offset Time offset from base_time seconds since ‘base_time’
Heights Height of computed value m ASL
Avg_Retrieved_LWC Retrieved, MWR-scaled, liquid water concentration in-cloud averaged over 1200 seconds
g m-3
Avg_Retrieved_IWC Retrieved ice water concentration in-cloud averaged over 1200 seconds
mg m-3
Avg_LiqEffectiveRadius Liquid effective radius in-cloud averaged over 1200 seconds
micron
Avg_IceEffectiveRadius Ice effective radius in-cloud averaged over 1200 seconds
micron
Avg_CloudFraction Cloud fraction averaged over 1200 seconds unitless
Missing_Liquid_Percentage Percentage of points where presence of liquid could not be determined in averaged height bins during 1200 seconds
unitless
Missing_Ice_Percentage Percentage of points where presence of ice could not be determined in averaged height bins during 1200 seconds
unitless
MWR_Missing_Percentage Percentage of profiles with liquid for which MWR data were unavailable during 1200 seconds
unitless
Integrated_CloudFraction Maximum of column cloud fraction averaged over 1200 seconds
unitless
aqc_CloudFraction Fraction of averaging period time profiles that contain cloud (at any height level), based on any of ceilometer, MPL, and radar
unitless
aqc_CloudMissing Fraction of averaging period time profiles for which clear/cloudy status cannot be determined
unitless
lat North latitude degree_N
lon East longitude degree_E
alt Altitude above mean sea level Meters above mean sea level

M Dunn, et al., May 2011, DOE/SC-ARM/TR-095
12
5.0 Data Quality Assessment
Data quality is assessed through the use of quality control (QC) flags. There are two types of QC flags available to use within the 10-second data file. Some are created de novo and are unique to this VAP, while others are based on the QC flags of the ascendant VAPs. These QC flags are applied to the data through a post-processing script.
5.1 Determining Minimum and Maximum Allowable Values A combination statistical-technical method is used to determine the minimum and maximum values for the MICROBASE QC flags. These values are then evaluated to determine if they are scientifically reasonable. For example, an effective radius of 0.02um is not scientifically valid, although it is a possible calculation from the retrieval. The technical portion relies on the known limitations of the instrument. For instance, we cannot detect LWC down to zero gm-3, but we know this to be a reasonable value, so it is included. When deciding on the 2-sigma (95%) or 3-sigma cutoff, a historical search of the literature relevant to a similar instrument and retrieval is appropriate. It is important to note that retrievals based upon empirical algorithms may not be valid outside of the conditions under which they were derived; all calculated quality flags should be used as guides in this respect.
Table 4. Table of calculated minimum and maximum allowable values for primary variables.
Product Variable name Estimated Minimum Value Estimated Maximum Value
Liquid water content 0.0018 g/m3 (set to 0.0 g/m3) 2.5 g/m3
Liquid effective radius 1.46 um 16.0 um
Ice water content 1.55e-05 g/m3 (set to 0.0 g/m3) 1.0 g/m3
Ice effective radius 14.0 um 38.0 um
Minimum liquid water content is the minimum detectable LWC at any height. Since the instrument sensitivity changes with height, this value is calculated based on the minimum detectable reflectivity for this instrument at the lowest height bin. Minimum detectable reflectivity was determined, specifically for the MMCR instrument. This value may be set to zero.
Maximum LWC is a valid data cutoff, estimated based on the average range of observed LWC values at ARM’s Southern Great Plains (SGP) site. LWC maximum value is based on the selection of a maximum valid effective radius of 16 microns. Using a simple volume calculation and assuming a single size distribution and a droplet radius of 16 microns, we estimate maximum LWC at 2.5 g/m3. Larger values, up to 25 g/m3 are measured, but usually attributed to drizzle.
Minimum LiqRe is estimated using the parameterizations of Liao and Sassen (1994) and Frisch et al. (1995) based on a calculated minimum LWC of 0.0018 g/m3.
Maximum LiqRe is estimated from a roughly 95% or 2 standard deviations from the mean effective radius distribution of SGP data. A mean value of 4 microns is determined. A maximum radius of 16.27um is appropriate if 2.5 g/m3 is the maximum attainable LWC value, according to Liao and Sassen (1994) and Frisch et al. (1995).
M Dunn, et al., May 2011, DOE/SC-ARM/TR-095
13
Minimum IWC is estimated based on the minimum detectable reflectivity at the lowest height. A single value is given as an estimate of the minimal detectable IWC at all heights, although this actually varies as a function of height. This value may be set to zero.
Maximum IWC is determined from a statistical analysis of multi-year SGP data, which reveals a maximum value at about 1 g/m3.
Minimum IceRe is calculated based on the lowest temperature measured of -80°C. Ice Radius is strictly temperature based as per Ivanova (2001).
Maximum IceRe is calculated from the maximum MICROBASE-assumed temperature for ice. MICROBASE reflectivity-base ice fractionation assumes any reflectivity derived from a bin where the temperature is greater than 0°C is not ice. Statistical analysis at SGP reveals a maximum ice radius of about 37.65 microns. A vast range of physical values for maximum cloud ice particle sizes exists in the literature.
5.2 Quality Assessment of the 10-Second Data Fields
Data quality fields are documented in the netCDF headers of the daily microbasepi2 datastream files. QC flags are available for all primary variables in the 10-second raw data format. The QC flags divide the primary data into three groups: good, indeterminate, and bad data quality. Good data will always have the QC flag set to zero. A two-digit QC flag value from 10–19 is set whenever the data quality is questionable or quality-indeterminate. Bad or physically impossible data contained within the primary variable are flagged in the QC field with values between 20 and 29. Bad data are always replaced with the value -9999.0 in the primary measurement data field. The reasons for the flag are given in the QC field comments within the netCDF file header. Occasionally data will be flagged as indeterminate whenever the values fall outside of a valid range of minimum or maximum accepted values. QC flags will be labeled as AQC flags when the flags are not contained in a true bit-packed format within the netCDF file.
5.2.1 Quality Control Flag Descriptions
5.2.1.1 aqc_retrieval
This flag provides information, at every time and height bin, on the performance of the retrieval algorithm. When no cloud is detected, the value of the aqc_retrieval flag is set to “0: No cloud detected.” When both the radar and MWR see cloud, the value is set to “1: Significant, problem-free data.” Occasionally the ARSCL qc_ReflectivityClutterFlag will identify reflectivity that may be derived from signal scatterers other than cloud hydrometeors. In that case, this value is set to “2: Cloud and possible clutter contribution.” A value of “3: MWR not available for LWC scaling” is given if the MWR data are missing or unavailable but the radar detects a cloud or possible clutter. When the radar return signal does not exist, either due to a malfunction or a location out of the instrument range, the flag value is set to “10: No Reflectivity Data Available.”

M Dunn, et al., May 2011, DOE/SC-ARM/TR-095
14
5.2.1.2 aqc_clear_cloud
Cloud presence is determined by assessing the information collected by the lidar and ceilometer. The information is contained in the CloudBaseBestEstimate (CBBE) variable of the ARSCL VAP data. If both the micropulse lidar and the ceilometer detect a cloud, the ARSCL CBBE flag is set to a value equal to or greater than zero. MICROBASE uses this information to set this aqc_clear_cloud flag to one, indicating that a cloud exists.
5.2.1.3 aqc_stat2_lwp
The MWRRET VAP reports QC information in a bit-packed format for the stat2_lwp variable. Although MICROBASE uses MWRRET data in the retrieval parameterizations only when the integer value of the MWRRET stat2_tliq_flag is less than or equal to one, the integer value of the qc_stat2_lwp flag is also used to flag poor or bad quality MWRRET data. For this reason a modified version of the MWRRET flag is included within the MICROBASE VAP as the aqc_stat2_lwp flag. The MICROBASE version of this flag is obtained by selecting the MWRRET qc_stat2_lwp integer value closest in time to within one minute of the 10-second Microbase time.
All of the QC fields that apply to the primary variables (liquid_water_content, ice_water_content, liquid_effective_radius, ice_effective_radius) have similar settings and justifications to those shown in the example given below:
EXAMPLE:
aqc_ liquid_water_content
long_name = 'Quality check results on field: ice_water_content'
units = ‘unitless’
comment = 'value_0 is good data flag, value_10–19 is indeterminate data flag, value_20–29 is bad data flag; use aqc_Retrieval flag 0/1 for clear/cloudy’;
Value_0 = good data and passed all QC tests.
Flag 0 setting information: Represents good data.
Value_10= indeterminate quality due to radar signal out of detection range.
Flag 10 setting information: Represents possibly good data but beyond or at the limit of radar detection.
Value_11 = indeterminate quality due to possible clutter.
Flag 11 setting information: Occasionally, the radar signal is contaminated by reflectivity from insects or other objects. We refer to this as clutter and flag instances of its occurrence. Clutter times are originally identified in the ARSCL files.
Value_12 = indeterminate quality data where value is > 0 but failed min or max test.

M Dunn, et al., May 2011, DOE/SC-ARM/TR-095
15
Flag 12 setting information: The minimum and maximum values represent a range of valid values. Values of LWC outside of this range are considered suspect and should be reconsidered. For instance, the user may choose to accept values of LWC below the minimum detectable value if they are above zero, since sensitivity can vary.
Value_13 = indeterminate quality due to MWR failed aqc_Stat2_lwp, likely precipitation.
Flag 13 setting information: The Liao and Sassen (1994) LWC parameterization is not appropriate during drizzle. The MWR stat2 retrieval does not operate optimally during drizzle either. The qc_stat2_lwp flag is used to identify these times which are flagged as questionable quality data.
Value_21 = bad data due to missing radar data; data replaced with -9999.
Flag 21 setting information: Data may be missing due to a variety of reasons. Data quality reports (DQRs) are reported within the ARM data system and indicate when the radar is not functioning properly. If the DQR reports “bad” data, they are flagged here and labeled as “missing”.
Value_22 = bad data due to MWR not available for scaling; data replaced with -9999.
Flag 22 setting information: When the MWR information is missing, the MICROBASE retrieval is unable to vertically distribute liquid water accurately. If this occurs, the retrieval is not performed and, all LWC in that profile is marked as ‘Missing”. Not appropriate for use with IWC data.
5.3 Quality Assessment of Averaged Fields
Integrated cloud fraction amounts are calculated using information collected by the lidar and ceilometer which is contained in the CloudBaseBestEstimate variable of the ARSCL VAP data. Within the MICROBASE 10-second raw data, the aqc_retrieval flag is assigned a value of “0” if no cloud is detected by either of these instruments in that 10-second vertical bin or a value of “1” if there is any cloud detected in the beam. Other possible values (2, 3, and 10) are ignored in this case. Similarly, the MICROBASE 20-minute (1200 second) average reports cloud fraction amounts in the avg_cloud variable. Here the number of times that the radar indicated a cloud was present and calculated LWC or IWC, regardless of the MWR, is divided by the total number of time points for an estimate of cloud fraction.
The aqc_cloudFraction variable is the fraction of the averaging period time profiles that contain cloud (at any height level), based on any of the ceilometer, MPL, or radar. Therefore, cloud fraction is the number of 1s in the 20-minute interval divided by 120, the total possible reflectivity bins. Information on cloud fraction is given in the 20-minute average output files only.
The number of number of times that a cloud was missing is indicated by the aqc cloud missing flag. This flag indicates the number of times within a 20-minute interval where the presence of a cloud could not be determined, divided by the total number of possible bins to average.

M Dunn, et al., May 2011, DOE/SC-ARM/TR-095
16
6.0 VAP Status
This VAP is currently running operationally at all fixed ARM sites and is processed whenever input data become available.
7.0 VAP Version History
Initially developed in 2002 at Brookhaven National Laboratory, MICROBASE has remained a stalwart of microphysical cloud property retrievals. While there are more sophisticated microphysical retrieval schemes that work under specific cloud conditions, referred to as “conditional” retrievals, MICROBASE is a workhorse for appropriate cloud microphysical estimates for those periods in which a conditional retrieval technique is unavailable.
MICROBASE has continued to evolve, as the Version history table indicates. The basic parameterizations remain fixed although significant version changes have occurred. They are listed in Table 5:
Table 5. Listing of the complete history of microbasepi2/microbasepi version changes.
Microbasepi Version Number
Date Initiated Modification Description
V 1.0 07/2002 Original version
V1.2 11/2007 Use MERGESONDE VAP instead of individual sondes
V1.5 12/2008 Include Tropical Western Pacific (TWP) C2 and C3 sites
V1.5.5 04/2010 To accommodate MWRRET format changes
V2.0 08/2010 Included RIPBE-specific quality control variables and flags
V 2.1 10/2010 Included ARM-standard data object design (DOD) compliance
Microbasepi2 V 1.0 02/2011 Production version at Data Management Facility (DMF)
There are currently no plans for future algorithm modifications. The current QC flags will be in true bit-packed format in future versions.
8.0 Time Periods Processed
Data are available for the following time periods at the listed locations:
nsamicrobasepiavgC1.c1: (Averaged) Microbase Profiles for the North Slope of Alaska, Barrow site (C1) - January 2002 to December 2007

M Dunn, et al., May 2011, DOE/SC-ARM/TR-095
17
nsamicrobasepiC1.c1: (Raw) Microbase Profiles for the North Slope of Alaska, Barrow site (C1) - January 2002 to December 2007
sgpmicrobasepiavgC1.c1: (Averaged) Microbase Profiles for the Southern Great Plains, Lamont site (C1) - March 1998 to December 2009
sgpmicrobasepiC1.c1: (Raw) Microbase Profiles for the Southern Great Plains, Lamont site(C1) - March 1998 to December 2008
**sgpmicrobasepi2C1.c1: (Raw) Microbase Profiles for the Southern Great Plains, Lamont site(C1) – Jan 2009 to December 2009
twpmicrobasepiavgC1.c1: (Averaged) Microbase Profiles for the Tropical Western Pacific, Manus site – April 2000 to October 2006
twpmicrobasepiC1.c1: (Raw) Microbase Profiles for the Tropical Western Pacific, Manus site - April 2000 to October 2006
**twpmicrobasepi2C1.c1 (Raw) Microbase Profiles for the Tropical Western Pacific, Manus site – In Progress
twpmicrobasepiavgC2.c1: (Averaged) Microbase Profiles for the Tropical Western Pacific, Nauru site - January 2002 to December 2004
twpmicrobasepiC2.c1: (Raw) Microbase Profiles for the Tropical Western Pacific, Nauru site - January 2002 to December 2004
**twpmicrobasepi2C2.c1: (Raw) Microbase Profiles for the Tropical Western Pacific, Nauru site – In Progress
twpmicrobasepiavgC3.c1: (Averaged) Microbase Profiles for the Tropical Western Pacific, Darwin site - January 2003, November-December 2005, 2007
twpmicrobasepiC3.c1: (Raw) Microbase Profiles for the Tropical Western Pacific, Darwin site - January 2003, November-December 2005, 2007.
**twpmicrobasepi2C3.c1: (Raw) Microbase Profiles for the Tropical Western Pacific, Darwin site – In Progress
** microbasepi2 data will be produced instead of microbasepi beginning 2009.

M Dunn, et al., May 2011, DOE/SC-ARM/TR-095
18
9.0 Data Access
The microbasepi2 data sets files can be retrieved from the ARM Data Archive. There is no charge for access to the ARM Data Archive. However, in the interests of communicating data quality concerns and in order to fulfill obligations as a National User Facility, ARM requires users to register prior to having access to the ARM Archive. If you are not a registered ARM Archive User, please first proceed to the automatic online registration form before ordering data. Information relating to finding ARM data on the web is located at: http://www.archive.arm.gov/docs/finding/
The 20-minute averaged data microbasepiavg may be retrieved from the PI products section of the ARM IOP Data Archive located at:http://iop.archive.arm.gov/arm-iop/0eval-data/jensen/microbase-pi.
10.0 Summary
MICROBASE provides a continuous baseline of cloud microphysical quantities. It is a mature product that has been evaluated extensively. Although there have been changes to this product throughout the years, the fundamental algorithm has remained consistent.
This research was supported by the Office of Biological and Environmental Research of the U.S. Department of Energy as part of the Atmospheric Radiation Measurement Climate Research Facility.
11.0 References
Clothiaux, EE, TP Ackerman, GG Mace, KP Moran, RT Marchand, MA Miller, and BE Martner. 2000. “Objective determination of cloud heights and radar reflectivities using a combination of active remote sensors at the ARM CART sites.” Journal of Applied Meteorology 39:645–665.
Frisch, AS, CW Fairall, and JB Snider. 1995. “Measurement of stratus cloud and drizzle parameters in ASTEX with a Kα-band Doppler radar and a microwave radiometer.” Journal of Atmospheric Science 52:2788–2799.
Ivanova, DD, L Mitchell, WP Arnott, and M Poellot. 2001. “A GCM parameterization for bimodal size spectra and ice mass removal rates in mid-latitude cirrus clouds.” Atmospheric Research 59–60:89–113.
Liao, L, and K Sassen. 1994. “Investigation of relationships between Ka-band radar reflectivity and ice and liquid water contents.” Atmospheric Research 34:231–248.
Liljegren, JC, and coauthors. 2001. “A new retrieval for cloud liquid water path using a ground-based microwave radiometer and measurements of cloud temperature.” Journal of Geophysical Research 106:14,485–14,500.
Liu, CL, and AJ Illingworth. 2000. “Toward more accurate retrievals of ice water content from radar measurements of clouds.” Journal of Applied Meteorology 39:1130–1146.

M Dunn, et al., May 2011, DOE/SC-ARM/TR-095
19
Miller, MA, KL Johnson, DT Troyan, EE Clothiaux, EJ Mlawer, and GG Mace. 2003. “ARM value-added cloud products: Description and status.” In Proceedings of the Thirteenth ARM Science Team Meeting, U.S. Department of Energy. Richland, Washington. http://www.arm.gov/publications/proceedings/conf13/extended_abs/miller-ma.pdf
Turner, DD, SA Clough, JC Liljegren, EE Clothiaux, K Cady-Pereira, and KL Gaustad. 2007. “Retrieving liquid water path and precipitable water vapor from Atmospheric Radiation Measurement (ARM) microwave radiometers.” IEEE Transactions on Geoscience and Remote Sensing 45, 3680–3690, doi:10.1109/TGRS.2007.903703.
12.0 Contacts
Developer: Maureen Dunn Phone: (631) 344-5427 [email protected]
Translator: Mike Jensen Phone: (631) 344-7021 Fax: (631) 344-2060 [email protected]

M Dunn, et al., May 2011, DOE/SC-ARM/TR-095
A.1
Appendix A
Microbasepi Algorithm Flow Diagram

M Dunn, et al., May 2011, DOE/SC-ARM/TR-095
B.1
Appendix B
NetCDF Output Sample Header Information from microbasepi2 Datastream
netcdf sgpmicrobasepi2C1.c1.20090313.000000 { dimensions: const = 1 ; time = UNLIMITED ; // (8640 currently) nheights = 512 ; variables: int base_time(const) ; base_time:string = "20090313" ; base_time:long_name = "Base time in Epoch" ; base_time:units = "seconds since 1970-1-1 0:00:00 0:00" ; double time_offset(time) ; time_offset:long_name = "Time offset from base_time" ; time_offset:units = "seconds since base_time" ; double time(time) ; time:long_name = "Time offset from midnight" ; time:units = "seconds since base_time" ; float height(nheights) ; height:long_name = "Height of computed value" ; height:units = "m AGL" ; float mwr_scale_factor(time) ; mwr_scale_factor:long_name = "Ratio of MWR liq to integrated LWC" ; mwr_scale_factor:units = "unitless" ; mwr_scale_factor:comment = "Amount of scaling applied to integrated radar derived lwp to equal radiometer measured lwp" ; mwr_scale_factor:missing_value = -9999.f ; float liquid_water_content(time, nheights) ; liquid_water_content:long_name = "Retrieved Liquid Water Content" ; liquid_water_content:units = "g m-3" ; liquid_water_content:comment = "Reflectivity based Parameterization from Liao & Sassen(1994),Atmos.Res. Vol.34" ; liquid_water_content:missing_value = -9999.f ; liquid_water_content:valid_min = 0.f ; liquid_water_content:valid_max = 2.5f ; int aqc_liquid_water_content(time, nheights) ; aqc_liquid_water_content:long_name = "Quality check results on field: liquid_water_content" ; aqc_liquid_water_content:units = "unitless" ; aqc_liquid_water_content:comment = "value_0 is good data flag, value_10-19 is indeterminate data flag, value_20-29 is Bad data flag; use aqc_Retrieval flag 0/1 for clear/cloudy" ; aqc_liquid_water_content:value_0 = "0.good data and passd all qc tests" ; aqc_liquid_water_content:value_10 = "10.indeterminate quality due to radar signal out of detection range" ; aqc_liquid_water_content:value_11 = "11.indeterminate quality due to possible clutter" ;

M Dunn, et al., May 2011, DOE/SC-ARM/TR-095
B.2
aqc_liquid_water_content:value_12 = "12.indeterminate quality data where value is > 0 but failed min or max test" ; aqc_liquid_water_content:value_13 = "13.indeterminate quality due to mwr failed aqc_Stat2_lwp, likely precipitation" ; aqc_liquid_water_content:value_21 = "21.bad data due to missing radar data; data replaced with -9999" ; aqc_liquid_water_content:value_22 = "22. bad data due to MWR not available for scaling; data replaced with -9999" ; float ice_water_content(time, nheights) ; ice_water_content:long_name = "Retrieved Ice Water Content" ; ice_water_content:units = "g m-3" ; ice_water_content:comment = "Reflectivity based Parameterization from Liu & Illingworth(2000), J.Appl.Meteor.,Vol.39" ; ice_water_content:missing_value = -9999.f ; ice_water_content:valid_min = 0.f ; ice_water_content:valid_max = 1.f ; int aqc_ice_water_content(time, nheights) ; aqc_ice_water_content:long_name = "Quality check results on field: ice_water_content" ; aqc_ice_water_content:units = "unitless" ; aqc_ice_water_content:comment = "value_0 is good data flag, value_10-19 is indeterminate data flag, value_20-29 is Bad data flag; use aqc_Retrieval flag 0/1 for clear/cloudy" ; aqc_ice_water_content:value_0 = "0.good data and passed all qc tests" ; aqc_ice_water_content:value_10 = "10.indeterminate quality due to radar signal out of detection range" ; aqc_ice_water_content:value_11 = "11.indeterminate quality due to possible clutter" ; aqc_ice_water_content:value_12 = "12.indeterminate quality data where value is > 0 but failed min or max test" ; aqc_ice_water_content:value_13 = "13.indeterminate quality due to mwr failed aqc_Stat2_lwp, likely precipitation" ; aqc_ice_water_content:value_21 = "21.bad data due to missing radar data; data replaced with -9999" ; aqc_ice_water_content:value_22 = "22. bad data due to MWR not available for scaling; data replaced with -9999" ; float liq_effective_radius(time, nheights) ; liq_effective_radius:long_name = "Liquid Effective Radius" ; liq_effective_radius:units = "micron" ; liq_effective_radius:comment = "For a log-normal distribution, the relation between liquid mode radius(Rm) and effective radius(Re) is Re=Rm*[exp(5/2*sigma^2)]. For sigma=0.35,Re=1.358*Rm." ; liq_effective_radius:missing_value = -9999.f ; liq_effective_radius:valid_min = 1.46f ; liq_effective_radius:valid_max = 16.f ; int aqc_liq_effective_radius(time, nheights) ; aqc_liq_effective_radius:long_name = "Quality check results on field:liq_effective_radius" ; aqc_liq_effective_radius:units = "unitless" ; aqc_liq_effective_radius:comment = "value_0 is good data flag, value_10-19 is indeterminate data flag, value_20-29 is Bad data flag; use aqc_Retrieval flag 0/1 for clear/cloudy" ; aqc_liq_effective_radius:value_0 = "0.good data and passed all qc tests" ; aqc_liq_effective_radius:value_10 = "10.indeterminate quality due to radar signal out of detection range" ; aqc_liq_effective_radius:value_11 = "11.indeterminate quality due to possible clutter" ;

M Dunn, et al., May 2011, DOE/SC-ARM/TR-095
B.3
aqc_liq_effective_radius:value_12 = "12.indeterminate quality data where value is > 0 but failed min or max test" ; aqc_liq_effective_radius:value_13 = "13.indeterminate quality due to mwr failed aqc_Stat2_lwp, likely precipitation" ; aqc_liq_effective_radius:value_21 = "21.bad data due to missing radar data; data replaced with -9999" ; aqc_liq_effective_radius:value_22 = "22. bad data due to MWR not available for scaling; data replaced with -9999" ; float ice_effective_radius(time, nheights) ; ice_effective_radius:long_name = "Ice Effective Radius" ; ice_effective_radius:units = "micron" ; ice_effective_radius:comment = "Computed following Ivanova et al. (2001)Atmos.Res.,Vol.59-60." ; ice_effective_radius:missing_value = -9999.f ; ice_effective_radius:valid_min = 14.f ; ice_effective_radius:valid_max = 38.f ; int aqc_ice_effective_radius(time, nheights) ; aqc_ice_effective_radius:long_name = "Quality check results on field: ice_effective_radius data" ; aqc_ice_effective_radius:units = "unitless" ; aqc_ice_effective_radius:comment = "value_0 is good data flag, value_10-19 is indeterminate data flag, value_20-29 is Bad data flag; use aqc_Retrieval flag 0/1 for clear/cloudy" ; aqc_ice_effective_radius:value_0 = "0.good data and passed all qc tests" ; aqc_ice_effective_radius:value_10 = "10.indeterminate quality due to radar signal out of detection range" ; aqc_ice_effective_radius:value_11 = "11.indeterminate quality due to possible clutter" ; aqc_ice_effective_radius:value_12 = "12.indeterminate quality data where value is > 0 but failed min or max test" ; aqc_ice_effective_radius:value_13 = "13.indeterminate quality due to mwr failed aqc_Stat2_lwp, likely precipitation" ; aqc_ice_effective_radius:value_21 = "21.bad data due to missing radar data; data replaced with -9999" ; aqc_ice_effective_radius:value_22 = "22. bad data due to MWR not available for scaling; data replaced with -9999" ; int aqc_retrieval(time, nheights) ; aqc_retrieval:long_name = "Flag indicating availability and reliability of cloud retrievals" ; aqc_retrieval:units = "unitless" ; aqc_retrieval:comment = "0: No cloud detected, 1: Significant, problem-free data, 2: Possible Cloud and clutter contribution, 3: MWR not available for LWC scaling, 10: No Reflectivity Data Available." ; int aqc_clear_cloud(time) ; aqc_clear_cloud:long_name = "Clear/Cloudy flag based on ceilometer, mpl and radar" ; aqc_clear_cloud:units = "unitless" ; aqc_clear_cloud:comment = "0: Clear according to both ARSCL ReflectivityBestEstimate and CloudBaseBestEstimate (or either, if one field missing); 1: Cloudy according to either measure; -9999: Both ARSCL fields unavailable\\" ; aqc_clear_cloud:missing_value = -9999.f ; int aqc_stat2_lwp(time) ; aqc_stat2_lwp:long_name = "Check on input stat2_lwp - MWRRET Cloud liquid water path " ; aqc_stat2_lwp:units = "unitless" ; aqc_stat2_lwp:comment = "Nearest qc_stat2_lwp value in time\\" ;

M Dunn, et al., May 2011, DOE/SC-ARM/TR-095
B.4
float lat(const) ; lat:long_name = "north latitude" ; lat:units = "degrees" ; lat:valid_min = -90.f ; lat:valid_max = 90.f ; float lon(const) ; lon:long_name = "east longitude" ; lon:units = "degrees" ; lon:valid_min = -180.f ; lon:valid_max = 180.f ; float alt(const) ; alt:long_name = "altitude" ; alt:units = "meters above Mean Sea Level" ; // global attributes: :process_version = "$State: vap-microbasepi-1.0-0.sol5_10 $" ; :command_line = "microbasepi -d 20090313 -f sgpC1" ; :site_id = "sgp" ; :facility_id = "C1: Lamont, Oklahoma" ; :input_datastreams_num = 3 ; :input_datastreams_description = "A string consisting of the datastream(s), datastream version(s), and datastream date (range)." ; :input_datastreams = "sgparscl1clothC1.c1 : $State: Release_4_0 $ : 20090313.000000 ;\n", "sgpmwrret1liljclouC1.c1 : 2.200000 : 20090313.000000 ;\n", "sgpmergesonde1maceC1.c1 : $State:$ : 20090313.000000 ;" ; :qc_standards_version = "1.0" ; :zeb_platform = "sgpmicrobasepiC1.c1" ; :history = "created by user xxx on machine xxxxx at 3-Mar-2011,23:22:31, using $State: zebra-zeblib-4.21-0.sol5_10 $QC PROCESSED on:03-Mar-2011" ; }
M Dunn, et al., May 2011, DOE/SC-ARM/TR-095
C.1
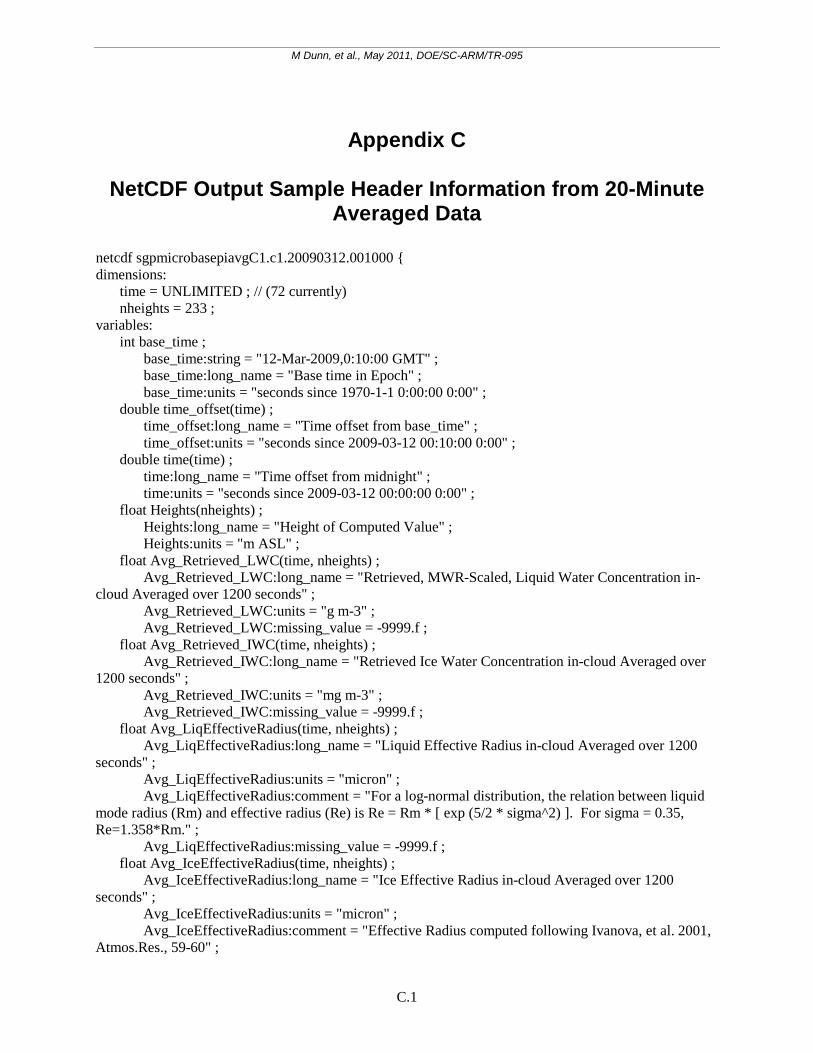
Appendix C
NetCDF Output Sample Header Information from 20-Minute Averaged Data
netcdf sgpmicrobasepiavgC1.c1.20090312.001000 { dimensions: time = UNLIMITED ; // (72 currently) nheights = 233 ; variables: int base_time ; base_time:string = "12-Mar-2009,0:10:00 GMT" ; base_time:long_name = "Base time in Epoch" ; base_time:units = "seconds since 1970-1-1 0:00:00 0:00" ; double time_offset(time) ; time_offset:long_name = "Time offset from base_time" ; time_offset:units = "seconds since 2009-03-12 00:10:00 0:00" ; double time(time) ; time:long_name = "Time offset from midnight" ; time:units = "seconds since 2009-03-12 00:00:00 0:00" ; float Heights(nheights) ; Heights:long_name = "Height of Computed Value" ; Heights:units = "m ASL" ; float Avg_Retrieved_LWC(time, nheights) ; Avg_Retrieved_LWC:long_name = "Retrieved, MWR-Scaled, Liquid Water Concentration in-cloud Averaged over 1200 seconds" ; Avg_Retrieved_LWC:units = "g m-3" ; Avg_Retrieved_LWC:missing_value = -9999.f ; float Avg_Retrieved_IWC(time, nheights) ; Avg_Retrieved_IWC:long_name = "Retrieved Ice Water Concentration in-cloud Averaged over 1200 seconds" ; Avg_Retrieved_IWC:units = "mg m-3" ; Avg_Retrieved_IWC:missing_value = -9999.f ; float Avg_LiqEffectiveRadius(time, nheights) ; Avg_LiqEffectiveRadius:long_name = "Liquid Effective Radius in-cloud Averaged over 1200 seconds" ; Avg_LiqEffectiveRadius:units = "micron" ; Avg_LiqEffectiveRadius:comment = "For a log-normal distribution, the relation between liquid mode radius (Rm) and effective radius (Re) is Re = Rm * [ exp (5/2 * sigma^2) ]. For sigma = 0.35, Re=1.358*Rm." ; Avg_LiqEffectiveRadius:missing_value = -9999.f ; float Avg_IceEffectiveRadius(time, nheights) ; Avg_IceEffectiveRadius:long_name = "Ice Effective Radius in-cloud Averaged over 1200 seconds" ; Avg_IceEffectiveRadius:units = "micron" ; Avg_IceEffectiveRadius:comment = "Effective Radius computed following Ivanova, et al. 2001, Atmos.Res., 59-60" ;

M Dunn, et al., May 2011, DOE/SC-ARM/TR-095
C.2
Avg_IceEffectiveRadius:missing_value = -9999.f ; float Avg_CloudFraction(time, nheights) ; Avg_CloudFraction:long_name = "Cloud Fraction Averaged over 1200 seconds" ; Avg_CloudFraction:units = "unitless" ; Avg_CloudFraction:missing_value = "-9999." ; float Missing_Liquid_Percentage(time, nheights) ; Missing_Liquid_Percentage:long_name = "Percentage of points where presence of liquid could not be determined in averaged height bins during 1200 seconds" ; Missing_Liquid_Percentage:units = "unitless" ; Missing_Liquid_Percentage:comment = "Includes missing/bad reflectivity and missing/bad MWR points where radar indicates liquid exists" ; Missing_Liquid_Percentage:missing_value = -9999.f ; float Missing_Ice_Percentage(time, nheights) ; Missing_Ice_Percentage:long_name = "Percentage of points where presence of ice could not be determined in averaged height bins during 1200 seconds" ; Missing_Ice_Percentage:units = "unitless" ; Missing_Ice_Percentage:comment = "Consists of missing/bad reflectivity points" ; Missing_Ice_Percentage:missing_value = -9999.f ; float MWR_Missing_Percentage(time) ; MWR_Missing_Percentage:long_name = "Percentage of profiles with liquid for which MWR data were unavailable during 1200 seconds" ; MWR_Missing_Percentage:units = "unitless" ; MWR_Missing_Percentage:comment = "Of the profiles which radar retrieval identified as containing liquid, this percentage could not have LWC computed due to lack of MWR data for scaling." ; MWR_Missing_Percentage:missing_value = -9999.f ; float Integrated_CloudFraction(time) ; Integrated_CloudFraction:long_name = "Maximum of Column Cloud Fraction Averaged over 1200 Seconds" ; Integrated_CloudFraction:units = "unitless" ; Integrated_CloudFraction:missing_value = -9999.f ; float aqc_CloudFraction(time) ; aqc_CloudFraction:long_name = "Fraction of averaging period time profiles that contain cloud (at any height level), based on any of ceilometer, mpl and radar" ; aqc_CloudFraction:units = "unitless" ; aqc_CloudFraction:comment = "Cloud is indicated by ARSCL fields CloudBaseBestEstimate (mpl, ceilometer) or ReflectivityBestEstimate. Missing_value indicates both fields are unavailable for entire period." ; aqc_CloudFraction:missing_value = -9999.f ; float aqc_CloudMissing(time) ; aqc_CloudMissing:long_name = "Fraction of averaging period time profiles for which clear/cloudy status cannot be determined" ; aqc_CloudMissing:units = "unitless" ; aqc_CloudMissing:comment = "Clear/Cloudy status cannot be determined when ARSCL fields CloudBaseBestEstimate and ReflectivityBestEstimate are both unavailable" ; float lat ; lat:long_name = "North latitude" ; lat:units = "degree_N" ; lat:valid_min = -90.f ; lat:valid_max = 90.f ; float lon ; lon:long_name = "East longitude" ;

M Dunn, et al., May 2011, DOE/SC-ARM/TR-095
C.3
lon:units = "degree_E" ; lon:valid_min = -180.f ; lon:valid_max = 180.f ; float alt ; alt:long_name = "Altitude above mean sea level" ; alt:units = "m" ; // global attributes: :process_version = "$State: vap-microbasepi-1.0-0.sol5_10 $" ; :command_line = "microbasepi -d 20090312 -f sgpC1" ; :site_id = "sgp" ; :facility_id = "C1: Lamont, Oklahoma" ; :input_datastreams_description = "A string consisting of the datastream(s), datastream version(s), and datastream date (range)." ; :input_datastreams_num = 3 ; :input_datastreams = "sgparscl1clothC1.c1 : $State: Release_4_0 $ : 20090312.000000 ;\n", "sgpmwrret1liljclouC1.c1 : 2.200000 : 20090312.000032 ;\n", "sgpmergesonde1maceC1.c1 : $State:$ : 20090312.000000 ;" ; :zeb_platform = "sgpmicrobasepiavgC1.c1" ; :history = "created by user xxx on machine xxxxx at 8-Mar-2011,19:57:47, using $State: zebra-zeblib-4.21-0.sol5_10 $" ; }
