the millennium project july, 2007. real time delphi to identify variables, “best and worst”...
TRANSCRIPT

The Millennium ProjectJuly, 2007

Real Time Delphi to identify variables, “best and worst” forecasts, and weights for SOFI.
Construction of the 2007 SOFI, using these variables, with attention to national SOFIs.
Establishing National SOFI Standards
Systematizing Excel spreadsheet approach for national SOFIs

Number of Responses
020406080
100120140160180200
0 50 100 150
Days
Total Registrants
Answ ering at least 1Qvuestion

Employment
Author , 5Consultant, 18
Private Sector, 13
Government, 11NGO, 7
University, 29
International Organization, 3
Other, 15
Region
Europe, 32.6
North America, 32
Pacific Asia, 5.7
South East Asia, 5
Sub Sahara Africa, 8.6
Latin America, 9.7
Middle East, 4.6North Africa,
1.7

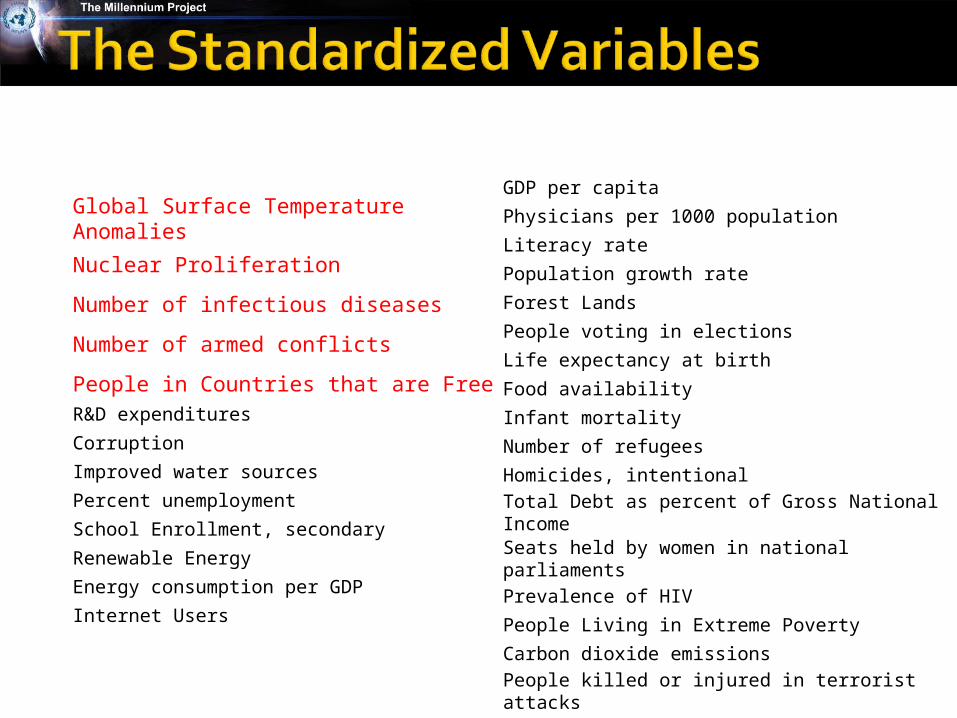
No Variable Import
1 4 Improved water source 9.08
2 8 Literacy rate, adult total 8.57
3 33 Corruption 8.54
4 18 School Enrollment, secondary 8.53
5 14 People Living in Extreme Poverty 8.51
6 20 Nuclear Proliferation 8.40
7 5 Carbon dioxide emissions 8.40
8 7 Percent unemployment 8.25
9 31 Energy consumption per GDP 8.18
10 11 Number of armed conflicts 8.18
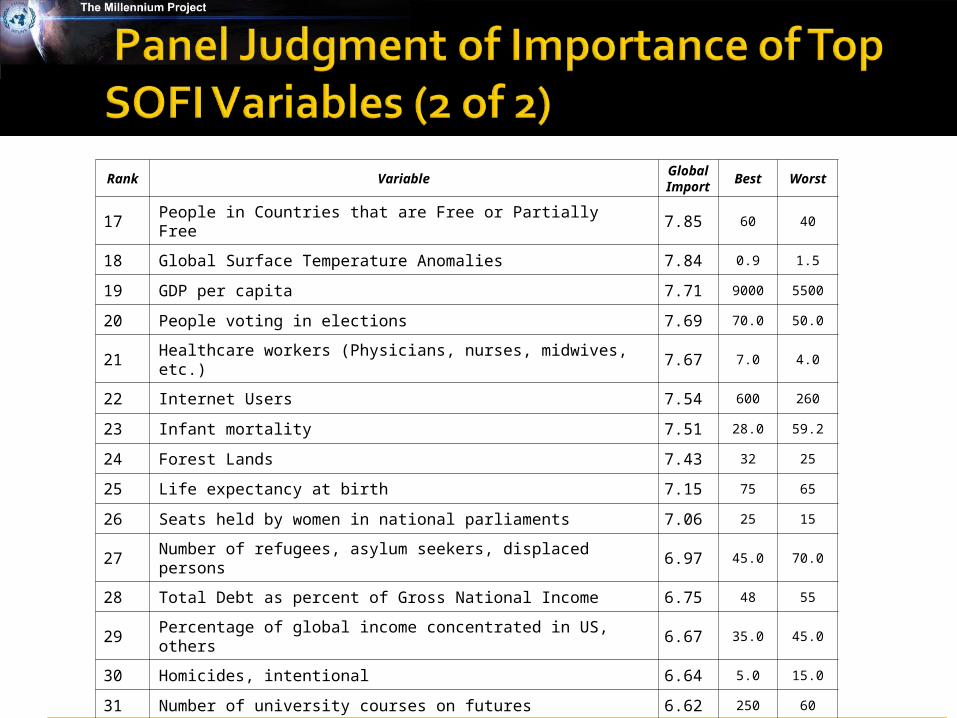
Rank VariableGlobal Import
Best Worst
17 People in Countries that are Free or Partially Free 7.85 60 40
18 Global Surface Temperature Anomalies 7.84 0.9 1.5
19 GDP per capita 7.71 9000 5500
20 People voting in elections 7.69 70.0 50.0
21 Healthcare workers (Physicians, nurses, midwives, etc.) 7.67 7.0 4.0
22 Internet Users 7.54 600 260
23 Infant mortality 7.51 28.0 59.2
24 Forest Lands 7.43 32 25
25 Life expectancy at birth 7.15 75 65
26 Seats held by women in national parliaments 7.06 25 15
27 Number of refugees, asylum seekers, displaced persons 6.97 45.0 70.0
28 Total Debt as percent of Gross National Income 6.75 48 55
29 Percentage of global income concentrated in US, others 6.67 35.0 45.0
30 Homicides, intentional 6.64 5.0 15.0
31 Number of university courses on futures 6.62 250 60
32 Prevalence of HIV 6.59 1.0 3.0
12
34
5
Quintile
0
10
20
30
40
50
Num
ber
of R
espo
nses
Water: Nat ImportPop: BestUneml: Best
Distribution of Responses


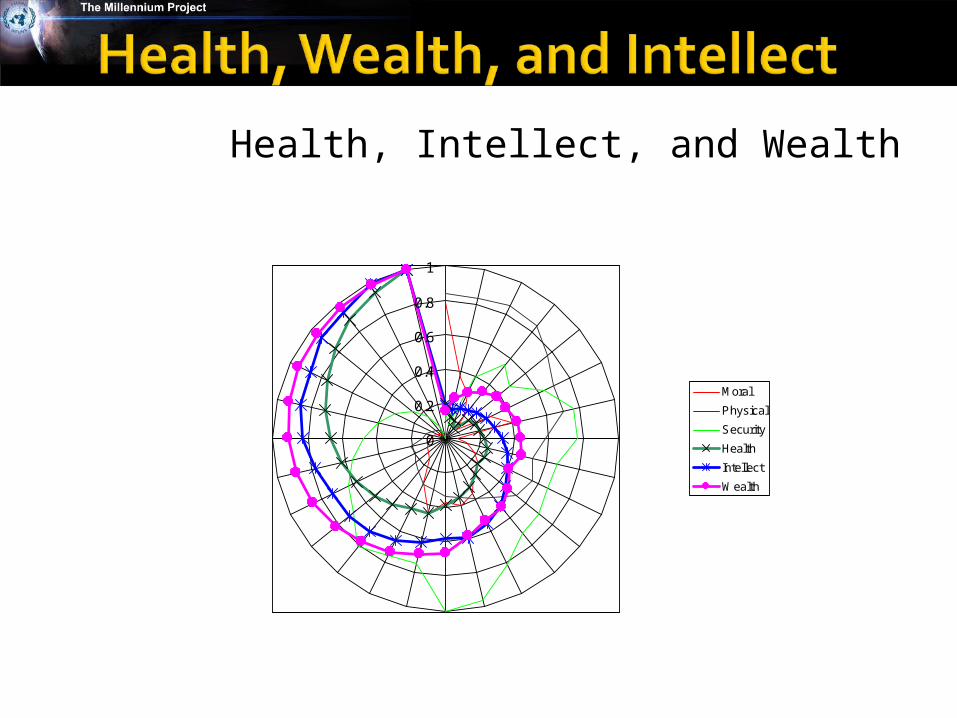
Intellectual– Literacy, enrollments, R&D, Internet
Health– Life expectancy, infant mortality, physicians, HIV, food
Wealth– GDP/cap, unemployment, poverty, debt service
Security– Terrorist attacks, nuc proliferation, refugees
Moral– Corruption, freedom, voting, women in parliaments
Physical– Water, CO2, forests, temperature, renewables


Dashboard Experiments: Getting Worse
0
0.2
0.4
0.6
0.8
1
Moral
Physical
Security
Health
Intellect
Wealth
Health, Intellect, and Wealth

0
0.2
0.4
0.6
0.8
1
Moral
Physical
Security
Health
Intellect
Wealth

5 6 7 8 9 10
National Import
4
5
6
7
8
9
10
Glo
ba
l Im
po
rt
R&D Expenditures
Internet Users
Access to Improved Water Sources
Companies that use ISO 14000
CorruptionLiteracy Rate
Food Availability
R&D expenditures
Corruption
Improved water sources
Percent unemployment
School Enrollment, secondary
Renewable Energy
Energy consumption per GDP
Internet Users
GDP per capita
Physicians per 1000 population
Literacy rate
Population growth rate
Forest Lands
People voting in elections
Life expectancy at birth
Food availability
Infant mortality
Number of refugees
Homicides, intentional
Total Debt as percent of Gross National Income
Seats held by women in national parliaments
Prevalence of HIV
People Living in Extreme Poverty
Carbon dioxide emissions
People killed or injured in terrorist attacks
Global Surface Temperature Anomalies
Nuclear Proliferation
Number of infectious diseases
Number of armed conflicts
People in Countries that are Free

Global
National Comparison
National Focus
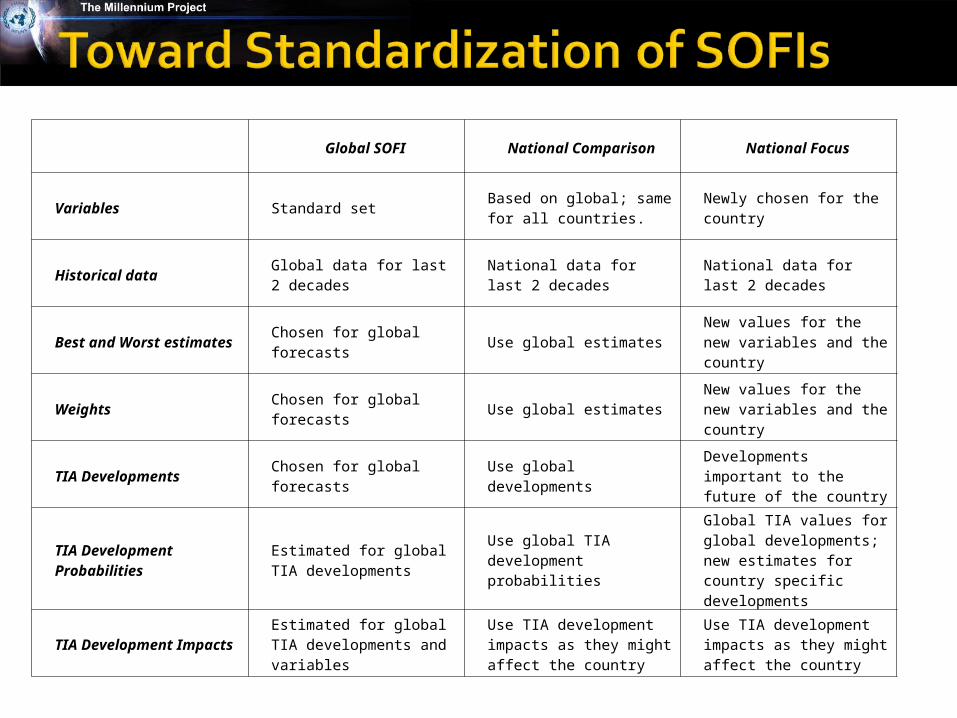
Global SOFI National Comparison National Focus
Variables Standard setBased on global; same for all countries.
Newly chosen for the country
Historical dataGlobal data for last 2 decades
National data for last 2 decades
National data for last 2 decades
Best and Worst estimates
Chosen for global forecasts
Use global estimatesNew values for the new variables and the country
WeightsChosen for global forecasts
Use global estimatesNew values for the new variables and the country
TIA DevelopmentsChosen for global forecasts
Use global developmentsDevelopments important to the future of the country
TIA Development Probabilities
Estimated for global TIA developments
Use global TIA development probabilities
Global TIA values for global developments; new estimates for country specific developments
TIA Development Impacts
Estimated for global TIA developments and variables
Use TIA development impacts as they might affect the country
Use TIA development impacts as they might affect the country

History of variables and extrapolation SOFI Baseline TIA Developments Events and Variables TIA (and macro) SOFI with TIA


Excel spreadsheets Reports
• Millennium Project Study of State of the Future Index Variables and Their Use in Country to Country Comparisons (the Real Time Delphi)
• Building the 2007 SOFI
• A Standardized Approach to Building National SOFIs

Produce robust “enterprise level” software
Review and utilize the "standard" for national SOFI's
Construct and compare national SOFI’s
Conduct an analysis designed to find whether country SOFI’s (weighted by population) add up to the global SOFI.
Experiments with other applications (e.g. corporate SOFI’s)
Consider other dimensions (e.g. a measure of national innovativeness)
Review and improve TIA judgments
Construct on line data bases of variables and events to facilitate national and other applications.