the missing manual: using national student clearinghouse...
TRANSCRIPT
The Missing Manual:
Using National Student Clearinghouse Data to Track Postsecondary Outcomes∗
Susan M. Dynarski University of Michigan
Steven W. Hemelt
University of North Carolina – Chapel Hill
Joshua M. Hyman University of Michigan
October 2013
Abstract This paper explores the promises and pitfalls of using National Student Clearinghouse (NSC) data to measure a variety of postsecondary outcomes. We first describe the history of the NSC, the basic structure of its data, and recent research interest in using NSC data. Second, using information from the Integrated Postsecondary Education Data System (IPEDS), we calculate enrollment coverage rates for NSC data over time, by state, institution type, and demographic student subgroups. We find that coverage is highest among public institutions and lowest (but growing) among for-profit colleges. Across students, enrollment coverage is lower for minorities but similar for males and females. We also explore two potentially less salient sources of non-coverage: suppressed student records due to privacy laws and matching errors due to typographic inaccuracies in student names. To illustrate how this collection of measurement errors may affect estimates of the levels and gaps in postsecondary attendance and persistence, we perform several case-study analyses using administrative transcript data from Michigan public colleges. We close with a discussion of practical issues for program evaluators using NSC data.
∗ The research reported here was supported by the Institute of Education Sciences, U.S. Department of Education, through Grants R305B110001 and R305E100008 to the University of Michigan, as well as through Grant R305C110011-11A to the Teachers College, Columbia University. The opinions expressed are those of the authors and do not represent views of the Institute of Education Sciences or the U.S. Department of Education. We are grateful for the help of our partners at the Michigan Education Department: Tom Howell, Venessa Keesler, and Joseph Martineau, as well as exceedingly helpful support from state analysts including Rod Bernosky, Melissa Bisson, and Karen Conroy. We had several very helpful conversations with Jason DeWitt and Travis Maciejewski at the National Student Clearinghouse. We also thank Hassan Enayati, Joanna Frye, Emily House, and Chris Zbrozek for providing excellent research assistance. Dynarski can be contacted at [email protected]; Hemelt at [email protected]; and Hyman at [email protected].

1. Introduction
By many measures, those who attend and complete college are better off. They have
higher earnings (Oreopoulos & Petronijevic, 2013), better health (Hout, 2011; Lleras-Muney,
2005), more robust networks, and higher job satisfaction (Oreopoulos & Salvanes, 2011).
College attendance, persistence, and completion are therefore key outcomes by which
researchers and policymakers evaluate the effectiveness of elementary and secondary schooling.
Tracking students into and through college is critical for such evaluations. Yet measures of these
outcomes have rarely been available at the levels of granularity at which elementary and
secondary education policies function: the school, the district, and the state.
The National Center for Education Statistics (NCES) proposed to address this data gap by
replacing information in the Integrated Postsecondary Education System (IPEDS) with a unit-
record system that would track individual students over time (Cunningham & Milam, 2005). In
response to concerns about student privacy, and colleges’ fears that the system would be used for
accountability,1 Congress effectively banned the creation of any national unit-record database in
the 2008 reauthorization of the Higher Education Act (Higher Education Opportunity Act of
2008, 113).
In the wake of the failure of the federal government to produce a dataset that tracks
students into and through college, states have attempted to construct their own unit-record
systems. Every state now has a longitudinal data system that tracks individual students through
elementary and secondary school (hereafter referred to as “K-12”). Some state systems also
follow students into in-state public tertiary institutions (e.g., Florida, Ohio); a few have also
1 For example, see letters and policy statements from the National Association of Independent Colleges and Universities (NAICU) directed as key policymakers that argue against the creation of such a system: http://www.naicu.edu/news_room/detail/national-association-of-independent-colleges-and-universities-views-spellings-commission-final-report-as-improved-but-still-problematic

integrated in-state private institutions into their systems (e.g., Texas). Students who enroll in out-
of-state colleges are generally lost to these systems.2
The National Student Clearinghouse (NSC), founded in 1993, has filled the void left by
Congress’ ban and the gaps in states’ systems. NSC was originally tied to the loan industry and
called the National Student Loan Clearinghouse. NSC gathered enrollment data from
participating colleges; these data were used to confirm that a borrower was enrolled and
therefore exempt from paying back (or accruing interest on) student loans. This history explains
many of the strengths and weaknesses of NSC data. The NSC primarily tracks enrollment (but
not credits or major), since that is what determines a student’s ability to defer payment. While
NSC has long recorded that a student had graduated from a given institution (often along with
the type of degree earned), only recently (as of 2012) did it start to use CIP codes3 to more
systematically record a student’s major.4
The federal government has stimulated the market for NSC’s products by both imposing
reporting requirements and funding states’ efforts to track their students into college. States
receiving federal State Fiscal Stabilization Funds (SFSF) are required to report statistics on
college enrollment and persistence rates.5 The Statewide Longitudinal Data Systems (SLDS)
grant program (which operates within the Institute of Education Sciences of the U.S. Department
of Education), funds the efforts of states to develop their data systems. SLDS has held
competitions since 2005, with 47 states receiving a total of $612 million. Early rounds
2 A recent report from the Data Quality Campaign (2012) finds that while 43 states in 2012 have been able to make some sort of link between their K-12 data and postsecondary information, “meaningful and useful P-20W data sharing is still lacking” (p. 9). DQC pointed, in particular, to the lack of data on students who enroll outside their home state. 3 Classification of Instructional Programs (CIP): http://nces.ed.gov/ipeds/cipcode/ 4 Employer demand for a centralized way to verify that college graduates applying for jobs actually earned the degrees they claimed to have earned is what drove NSC to collect more information about degrees (NSC, personal communication, August 2, 2012). 5 For more information on the SFSF, please see: http://www2.ed.gov/policy/gen/leg/recovery/factsheet/stabilization-fund.html; and http://www2.ed.gov/programs/statestabilization/guidance.pdf
2

encouraged the linking of K-12 data to college outcomes, while the later rounds required it
(Garcia and L’Orange, 2012). Many states have turned to the NSC for data to fill the gaps in
their data systems. NSC writes contracts on a state-by-state basis with local officials, with
pricing a function of student enrollment.
NSC data are relatively new to academic researchers and policymakers. A growing
number of papers make use of NSC data for research purposes (e.g., Kane, 2003; Richburg-
Hayes et al., 2009; Bettinger et al., 2012; Deming et al., 2013; Dynarski et al., 2013; Hemelt et
al. 2013; Chingos & Peterson, 2012; Hyman, 2013). These papers use NSC data to explore the
effects of various programs or policies on postsecondary attendance, persistence, and attainment.
A recent interchange between academics over the methods and data used to draw conclusions
about the postsecondary impacts of randomly offering vouchers to high school students in New
York City (Goldrick-Rab, 2012; Chingos & Peterson, 2012; Lederman, 2012) highlights the need
for a more comprehensive and relevant source of evidence about potential measurement error in
NSC data. As research using NSC data becomes even more common, researchers need to be
aware of the benefits and challenges of working with these data.
This paper examines the promises and pitfalls of NSC data for a variety of research and
evaluation purposes. We first describe the basic process of obtaining data from the NSC and the
structure of the data. Within the national context, we then quantify several sources of potential
measurement error relevant to using NSC data to construct measures of postsecondary
enrollment, persistence, and completion. To illustrate some ways in which these sources of
measurement error may affect the work of researchers and policy analysts, we use administrative
data from Michigan and perform several case-study analyses. Finally, we close with a discussion
of salient issues for analysts using NSC data.
3

2. National Student Clearinghouse (NSC) Data Basics
The NSC was founded in 1993 with roots in the student loan industry. To this day, one of
its primary services is to report on students receiving financial aid at American postsecondary
institutions to both the education finance industry and the U.S. Department of Education. The
Clearinghouse supplies these basic reporting services to colleges and universities at no charge.
Employers and high schools also use NSC’s services to verify students’ degrees and to track the
postsecondary success of students after high school graduation. Academic researchers and policy
analysts have also started using NSC data for a variety of purposes. The NSC now has a
“Research Center” that was created in 2010 and seeks to better understand how NSC data can be
used to support postsecondary research.
When researchers or policymakers obtain data form the NSC, they generally use the
service called “StudentTracker.” This service uses a proprietary algorithm to match a list of
students supplied by the researcher to the NSC’s detailed enrollment and degree information.
This algorithm matches primarily on student name and date of birth. For those students who are
found in NSC’s database, a wealth of information is returned. Colleges submit enrollment data to
the NSC several times each academic year, reporting the beginning and ending date that students
are enrolled during each term, and at what intensity they are enrolled (i.e., part-time or full-time).
Every college that reports enrollment information to the NSC is also supposed to report whether
or not a student has earned a degree, and the date the degree is earned.6 A subset of NSC
colleges also participates in another NSC service called “DegreeVerify.”7 For these colleges,
NSC data also include the college major (e.g., English) and degree type (e.g., Bachelor of Arts)
of all degrees earned by their students. Overall, the NSC provides a rich source of information on
6 In practice, it appears that some colleges do not report information on degree receipt. 7 The list of participating colleges, along with the date they began reporting degree information to the NSC can be found at: http://www.studentclearinghouse.org/verifiers/degree/schools.php
4

when and where students enroll, at what intensity, whether and when they earn a degree, and in
many cases the major and type of degree earned.
3. Quantifying Postsecondary Outcomes in a Pre-NSC World
Prior to the NSC and state longitudinal data systems, it was very challenging for
researchers and policymakers to follow students through K-12 education and into the
postsecondary realm. Researchers mainly relied on nationally representative surveys that asked
respondents to report information on educational attainment. Such survey data necessarily have a
limited capacity to follow particular groups of students over time. This restricts the ability of
researchers and policy analysts to meaningfully evaluate state programs or policies of interest
that affect a particular group or cohort of students in time, track long-term outcomes for children,
and responsively steer state-, district-, or school-level policymaking. Indeed, recent work has
employed NSC data to overcome such challenges in order to estimate the impacts of financial aid
programs on student success in college (Bettinger et al., 2012; Kane, 2003), the relationships
between school choice, vouchers, and postsecondary outcomes (Deming et al. 2013; Chingos &
Peterson, 2012), as well as the long-run impacts of childhood educational programs or policies
(Dynarski et al., 2013; Hemelt et al., 2013).
As a way to illustrate many of the challenges presented by large survey data, we perform
an exercise in which we calculate college attendance rates for recent cohorts of Michigan high
school students using such data sources. The sources for such an analysis are indeed limited,
since it requires an annual survey with large and representative samples at the state level in
which a respondent’s state of high school graduation and current education level are recorded.
The only surveys with sufficiently large state-level samples are the Current Population Survey
(CPS) and American Community Surveys (ACS). Prior to NSC, the NCES primarily used data
5

from the CPS to calculate national college enrollment rates for high school graduates.8 Yet,
neither is suitable for this type of state-level analysis, for several reasons.
First, neither the CPS nor the ACS records the state in which a person graduated from
high school. In the case of the ACS, state of birth and state of residence are provided. In the CPS,
only state of residence is provided.9 State of residence is an imperfect measure of state of high
school graduation, since young people migrate across state lines for both work and school. And,
depending on whether the migration is for work or for school, CPS will record the state of
residence as either the sending or receiving state. For a student who has migrated for college, the
CPS considers the state of residence to be the location of the parental home. For a person who
has migrated for work, the new state is the state of residence. Second, neither the CPS nor the
ACS consistently records the year in which a person earned a high school degree. The October
CPS asks the question of recent high school graduates only, which does not allow the tracking of
a given high school graduation cohort over time. Still, we can use some rules of thumb to try to
identify a sample of high school students that graduated from a given state in a given year.
3.1 Current Population Survey (CPS)
We begin with the October education supplement of the CPS from 2008 through 2010. In
each wave we are able to identify whether respondents graduated from high school in the current
year or in a prior year. We use this information, along with respondents’ ages, to proxy for
different time periods over which these classes of high school graduates could have enrolled in
college (i.e., by the first or second fall after high school graduation). So, to approximate
“immediate college enrollment,” we limit our sample to individuals ages 18-19 who identify
8 As an example, see Table 170 in the NCES Digest of Education Statistics (1990, p. 181): “Enrollment rates of 18- to 24-year-olds in institutions of higher education, by race/ethnicity.” Access: http://nces.ed.gov/pubs91/91660.pdf 9 The CPS Migration Survey, which is administered every few years in March, captures the state of residence five years earlier.
6
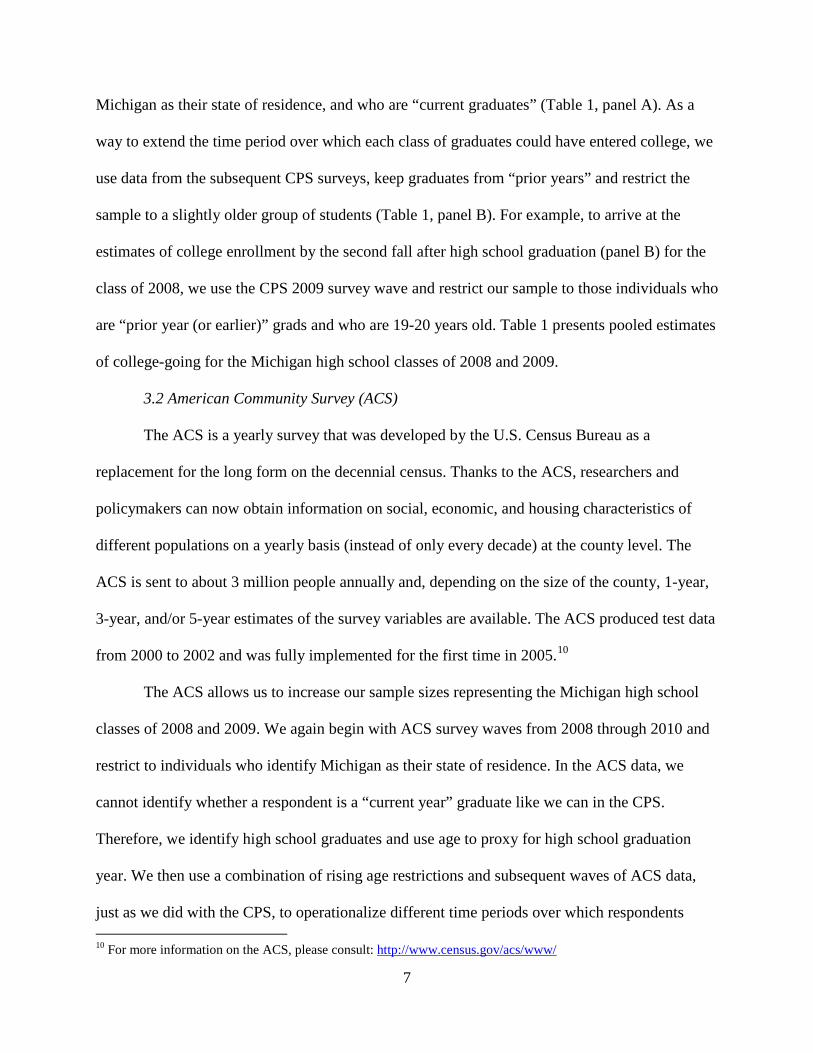
Michigan as their state of residence, and who are “current graduates” (Table 1, panel A). As a
way to extend the time period over which each class of graduates could have entered college, we
use data from the subsequent CPS surveys, keep graduates from “prior years” and restrict the
sample to a slightly older group of students (Table 1, panel B). For example, to arrive at the
estimates of college enrollment by the second fall after high school graduation (panel B) for the
class of 2008, we use the CPS 2009 survey wave and restrict our sample to those individuals who
are “prior year (or earlier)” grads and who are 19-20 years old. Table 1 presents pooled estimates
of college-going for the Michigan high school classes of 2008 and 2009.
3.2 American Community Survey (ACS)
The ACS is a yearly survey that was developed by the U.S. Census Bureau as a
replacement for the long form on the decennial census. Thanks to the ACS, researchers and
policymakers can now obtain information on social, economic, and housing characteristics of
different populations on a yearly basis (instead of only every decade) at the county level. The
ACS is sent to about 3 million people annually and, depending on the size of the county, 1-year,
3-year, and/or 5-year estimates of the survey variables are available. The ACS produced test data
from 2000 to 2002 and was fully implemented for the first time in 2005.10
The ACS allows us to increase our sample sizes representing the Michigan high school
classes of 2008 and 2009. We again begin with ACS survey waves from 2008 through 2010 and
restrict to individuals who identify Michigan as their state of residence. In the ACS data, we
cannot identify whether a respondent is a “current year” graduate like we can in the CPS.
Therefore, we identify high school graduates and use age to proxy for high school graduation
year. We then use a combination of rising age restrictions and subsequent waves of ACS data,
just as we did with the CPS, to operationalize different time periods over which respondents
10 For more information on the ACS, please consult: http://www.census.gov/acs/www/
7
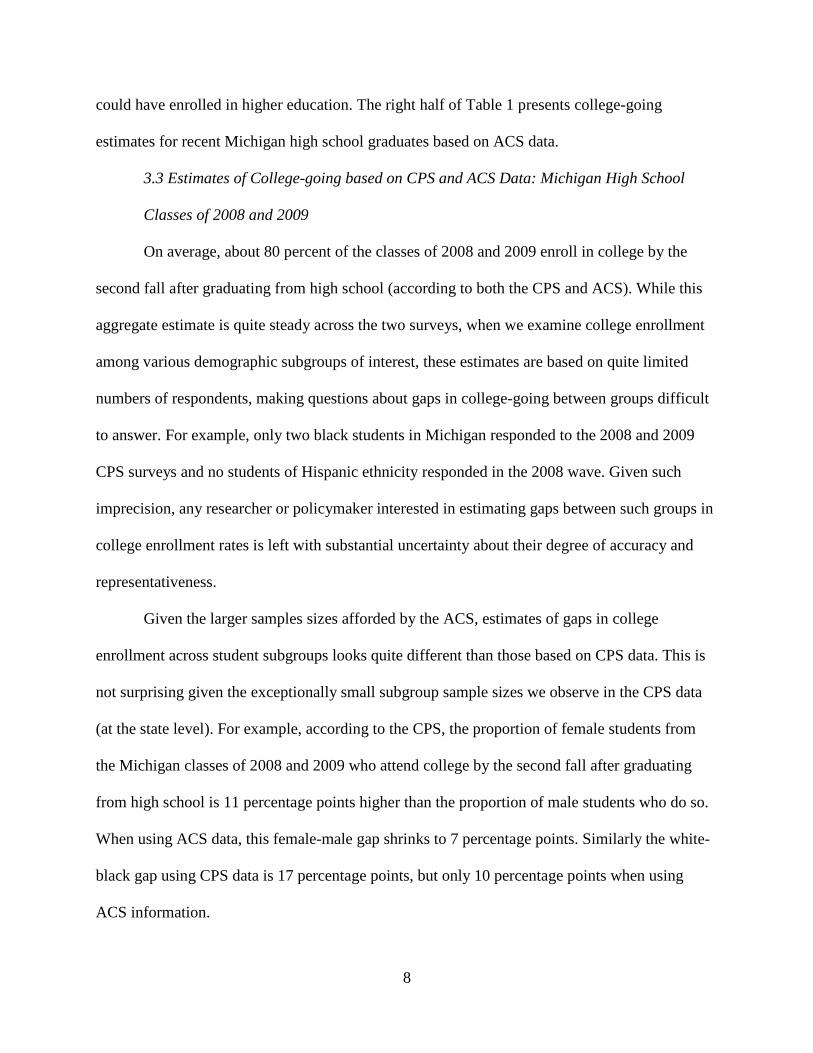
could have enrolled in higher education. The right half of Table 1 presents college-going
estimates for recent Michigan high school graduates based on ACS data.
3.3 Estimates of College-going based on CPS and ACS Data: Michigan High School
Classes of 2008 and 2009
On average, about 80 percent of the classes of 2008 and 2009 enroll in college by the
second fall after graduating from high school (according to both the CPS and ACS). While this
aggregate estimate is quite steady across the two surveys, when we examine college enrollment
among various demographic subgroups of interest, these estimates are based on quite limited
numbers of respondents, making questions about gaps in college-going between groups difficult
to answer. For example, only two black students in Michigan responded to the 2008 and 2009
CPS surveys and no students of Hispanic ethnicity responded in the 2008 wave. Given such
imprecision, any researcher or policymaker interested in estimating gaps between such groups in
college enrollment rates is left with substantial uncertainty about their degree of accuracy and
representativeness.
Given the larger samples sizes afforded by the ACS, estimates of gaps in college
enrollment across student subgroups looks quite different than those based on CPS data. This is
not surprising given the exceptionally small subgroup sample sizes we observe in the CPS data
(at the state level). For example, according to the CPS, the proportion of female students from
the Michigan classes of 2008 and 2009 who attend college by the second fall after graduating
from high school is 11 percentage points higher than the proportion of male students who do so.
When using ACS data, this female-male gap shrinks to 7 percentage points. Similarly the white-
black gap using CPS data is 17 percentage points, but only 10 percentage points when using
ACS information.
8

This exercise makes clear the challenges faced by researchers and policy analysts
interested in using frequent, detailed, and precise measures of postsecondary outcomes generated
in close intervals in order to evaluate policies and make meaningful, responsive contributions to
policymaking. The use of NSC data has the potential to overcome such challenges. Yet, no data
source is perfect. To help guide the growing use of NSC data in research and policy analysis, we
turn to an exploration of potential sources of measurement error in this new and detailed source
of comprehensive postsecondary information.
4. Potential Sources of Measurement Error in NSC Data
There are several main sources of measurement error in NSC data relevant to estimating
postsecondary outcomes for students. Each of these sources of error results in students who are
enrolled in college to not appear in the NSC. Students who do not appear in the NSC data due to
these reasons are indistinguishable from students who do not enroll in college. We describe the
main sources of error, their magnitudes, and how their magnitudes vary across time and space,
and by student and college characteristics.
4.1 Coverage Rates
4.1.1 Enrollment Coverage
The first and perhaps most salient way in which measurement error appears when using
NSC data is that not all colleges report enrollment information to the NSC. Participation in NSC
by colleges is voluntary, and has increased markedly over time. As of fall 2011, the NSC reports
that they cover 93 percent of postsecondary enrollment. We calculate and report NSC coverage
rates over time, by Census region, state, college type, and demographic subgroups of students.
We explore the sensitivity of our calculations to different definitions of college enrollment.
9

We calculate the NSC coverage rate by dividing postsecondary enrollment at NSC-
participating colleges by total enrollment at all U.S. colleges.11 In February 2012, we acquired a
list from NSC of all participating colleges along with the date each institution started submitting
data to the NSC.12 We use enrollment counts from the Integrated Postsecondary Education Data
System (IPEDS), a federally-generated database that lists every college, university, and technical
or vocational school that participates in the federal financial aid programs (over 6,000
institutions nationwide; National Center for Education Statistics, 2010). We use fall enrollment
counts from IPEDS, and include a college as in the NSC for the fall of a given year if it joins by
October 15th of that year.13
Figure 1a shows NSC coverage over time for all U.S. Title IV institutions.14 The solid
line weights the coverage rate by total undergraduate enrollment, and shows that NSC coverage
increased drastically in the mid-1990s through early 2000s from less than 20 percent to over 80
percent. Since then, the rate of coverage growth has slowed, reaching 91.6 percent in 2011.
Weighting the coverage rates by first-time (and first-year) full-time-equivalent (FTE)
undergraduate enrollment (the dashed line) slightly lowers the coverage rates.15 This suggests
that coverage is lower at colleges in which there are a higher proportion of such students. For the
11 This assumes that institutions participating in the NSC report all of their enrollment data to the NSC. Based on our conversations with the NSC, this seems to be an entirely reasonable assumption. To the extent that this is untrue, our coverage rate estimates may slightly overstate coverage. In Michigan, we find no evidence that NSC misses enrollment from participating colleges, except for a small share of dually-enrolled students (i.e., those students enrolled in college while still in high school). 12 We use the master list maintained by NSC staff. A slightly modified list is publically available at: http://www.studentclearinghouse.org/colleges/studenttracker_for_outreach/participating_schools.php 13 Our choice of October 15th follows the method used in-house by NSC to calculate their coverage rate. The rates we report are virtually identical when we use a more conservative cutoff date of August 31st. 14 In NSC-reported coverage calculations, they restrict the postsecondary institutions to those that are degree-granting. Degree-granting institutions, as defined in IPEDS, are those that award associate’s degrees or higher. So this definition excludes institutions such as trade schools that offer only certificates and similar awards or diplomas. We include these institutions because we believe most users of NSC aim to capture any and all postsecondary enrollment. Coverage rates are about two percentage points higher if we limit to degree-granting institutions. 15 FTE enrollment is calculated by adding full-time enrollment counts to down-weighted part-time enrollment counts, down weighting by college-type specific fractions provided by IPEDS.
10

remainder of this section we focus on coverage rates calculated using total non-FTE-weighted
undergraduate enrollment, since undergraduates (regardless of whether first-time and first-year)
are the population of interest for the majority of analyses (and since weighting by FTE is
inconsequential).
We first explore how NSC enrollment coverage varies across space within the United
States. It is important for researchers and policymakers to understand how coverage varies across
states and Census regions since analyses of particular programs or policies often focus on
students from a particular state or region, and since students generally tend to enroll in college
close to home.
In Figure 1b we illustrate how NSC enrollment coverage differs across Census regions.
Since the early 2000s, coverage has been similar across all regions but the South. Enrollment
coverage in the South continues to be a few percentage points lower than in other regions of the
country. When we look across states, there is substantially more variation in coverage. Table 2
reports coverage rates over time by state for all Title-IV institutions. Wyoming and Virginia are
currently the states with the highest coverage rates at 99.6 and 97.4, respectively. West Virginia
and Louisiana bottom out the list, at 64.5 and 81.9, respectively. Different states have
experienced shifts in coverage over this time period: For example, between 1997 and 2011, New
Mexico’s coverage rate catapulted from 10 to 90 percent. Yet during the same time period, North
Dakota saw a 3 percentage point decline in its overall coverage rate. For a complete set of
coverage rates by college type (2-year/4-year; public/private; non-profit/for-profit) and state for
all years 1995-2011, please consult the online set of Appendix tables (Tables A1 through A6).
NSC data also vary in the degree to which they capture enrollment at different types of
colleges. In Figure 2a we see that coverage rates are quite high for public institutions and private,
11

non-profit (4-year) institutions, but much lower among for-profit institutions of any level.
Coverage is over 99 percent in 2011 among public 4-year institutions, but only 48 percent at for-
profit schools. While enrollment in for-profit institutions represents a relatively small share of
total postsecondary enrollment, it has grown drastically over the last decade – from 3 to 9
percent of U.S. undergraduate enrollment (Ackermann et al., 2011). NSC coverage among for-
profits has more than doubled since 2000, but improving coverage in this sector remains an
ongoing challenge for the NSC. Figure 2b illustrates a persistent gap in coverage by institutional
selectivity: Coverage is consistently higher among selective institutions (i.e., those admitting half
or less of applicants).16 This finding largely mirrors the fact that coverage is highest at 4-year
institutions of all types and lowest among the largely nonselective for-profit sector.
In order to get a sense of how NSC-participating institutions, and their enrollees, compare
to postsecondary institutions in the United States more broadly, we merge IPEDS data with the
NSC participant list and present information on institutional and student body composition
across the higher education landscape in Table 3. This exercise is similar in spirit to Figure 2a
except that here we also present the student-weighted fraction of total U.S. enrollment
represented by each type of college (column 1). We confirm that while NSC coverage is low at
for-profit institutions, enrollment at such institutions accounts for a relatively small share of all
undergraduate enrollment (i.e., around 10 percent). Coverage at private non-profit 2-year
institutions is also low, but these institutions account for virtually zero percent of all
undergraduate postsecondary enrollment (and we omit this sector from the table).
Table 3 also allows us to explore, on average, how NSC enrollment coverage varies by
student characteristics. Coverage among males is about 1.5 percentage points higher than among
females. Figure 3a shows that this small sex gap in coverage has existed since the early 2000s.
16 We thank Michael Bastedo and Ozan Jaquette for sharing their compilation of Barron’s ranking data.
12

At present, postsecondary enrollment among black students is less well covered than enrollment
among white students. To a lesser extent, this is also true for Hispanic students. The coverage
rate among black students at all Title-IV institutions is 88 percent compared to 93 percent among
white students. Figure 3b shows that coverage has historically been similar for whites and
students grouped into an “other race” category,17 but lower for minority students. Since the early
2000s, this white-minority coverage gap has remained steady at between 4 and 6 percentage
points. Very recently, coverage has increased slightly among Hispanic enrollees. Since the early-
2000s, the race gap in coverage has been more pronounced than the sex gap, with white males
and females having similarly higher coverage than minority males and females.
We now take a more detailed look at gaps in enrollment coverage based on the most
recent year in our data (2011-2012) in Table 4. We report shares of white non-Hispanic (NH),
black non-Hispanic, and Hispanic students by region that attend a particular type of
postsecondary institution, alongside subgroup-region specific coverage rates for each institution
type. These estimates allow us to better contextualize the gaps in coverage we present in Table 3,
since college enrollees with different demographic characteristics are not equally distributed
across geographic regions and types of postsecondary institutions.
As an illustration, we find in Table 3 an overall white-black gap in coverage of 5.4
percentage points. We see a white-black gap of a similar magnitude (5.8 percentage points)
within the private, non-profit 4-year sector. Yet, we also see that college enrollment of black
students accounts for a much higher share of total undergraduate enrollment in for-profit
institutions (across regions) than it does for any other sector: The top rows of Table 4 show that
blacks comprise 14 percent of undergraduates at any college (column 2), but 23 percent of
17 Other race includes Asian students, students with multiple races, and students whose race is not known by the postsecondary institution.
13

students at for-profits (column 14). So, the relative concentration of black students in poorly
covered for-profit schools (especially in the South) and the relatively poor coverage of the small
share of black students at 4-year private institutions appear to account for the overall white-black
gap in coverage.
4.1.2 Degree Coverage
Colleges that participate in the NSC are supposed to report whether a student graduates
and their date of graduation for every student on whom they report enrollment information. We
have performed degree coverage rate calculations analogous to our enrollment calculations
above, simply weighting by number of degrees awarded instead of undergraduate enrollment
counts. However, unlike with enrollment, it is not necessarily reasonable to assume that NSC-
participating institutions report degree information for all of their students.18 Thus, these
calculations may provide an overestimate of the true rates of degree coverage in NSC data. For
this reason, we use state administrative data in Michigan to more carefully speak to rates of
degree coverage in NSC data.
In Table 5 we descriptively explore this concern by counting the number of
undergraduate degrees (i.e., Associate’s and Bachelor’s) awarded in our NSC data to Michigan
college-goers during the 2011-2012 academic year (column 2) and compare these counts to the
number of degrees awarded among Michigan postsecondary institutions as reported in the IPEDS
in the same year (column 1). We focus on undergraduate degrees: We exclude degrees where the
title indicates the degree is at the master’s or doctoral level as well as degrees with a missing title
earned by students who previously earned a degree from a 4-year school.19 We also exclude
18 We learned this based on our past research using degree completion information in NSC data, and from conversations with research staff at the NSC. 19 This method will mistakenly include graduate degrees that have a missing degree title and are earned by students who received their undergraduate degree in another state or at a college not in the NSC.
14

degrees with a title that indicates a certificate or diploma. Yet, in our NSC data, 16 percent of
degrees have a missing degree title. We exclude (include) all such degrees to form the lower
(upper) bound on NSC degrees. To arrive at an informed middle ground, we calculate the
fraction of total degrees that are certificates by sector in Michigan using the IPEDS data, assume
that this is the share of the degrees with missing degree titles in our NSC data by sector that are
certificates or diplomas, and exclude only that number of the degrees with missing titles.20
Columns 3, 4, and 5 report the raw degree coverage rates for our “best approximation,” lower,
and upper bound degree counts.
Since IPEDS includes degrees earned in Michigan regardless of where students attended
high school, and our sample of NSC students only includes students who attended public high
school in Michigan, the degree coverage rate will be artificially low: Students who earn a degree
in Michigan but attended a private high school in Michigan, or a high school outside of
Michigan, will be counted in the IPEDS data but not in our NSC data. Therefore, we create a
weighted degree coverage rate – weighting the raw coverage rate by the proportion of total
undergraduate enrollment in Michigan that we observe in our NSC data. The resulting weighted
degree coverage rates appear in columns 8-10, and can be interpreted as the rate of degree
coverage conditional on being observed as enrolling in the NSC data.21
On average, we observe roughly 81 percent of all degrees earned conditional on
enrollment in an NSC-participating institution. Degree coverage is highest at public colleges (82
20 The number of degrees in column 2 by sector do not sum to the total number of degrees due to the variation across sector in this share. 21 The weighted coverage rate is the unweighted rate multiplied by the inverse of the fraction of MI undergraduate enrollment that we observe in our NSC data. This “enrollment fraction” is calculated as follows: the denominator is the 12-month unduplicated undergraduate head count as reported by IPEDS for a year and sector. The numerator is the number of undergraduate NSC students in the same year and sector enrolled at a MI college (where we proxy for undergraduate by including only students who have not previously earned a degree from a 4-year college). For example, assume we observe 600 degrees in the NSC data and 1,000 degrees in the IPEDS data, yielding an unweighted coverage rate of 0.6. We observe 3,000 undergraduates in the NSC data and 4,000 in IPEDS for that year and sector for a weight of 0.75. Thus, the weighted coverage rate is 0.6 * (0.75)−1 = 0.8.
15

percent) and lowest at private, non-profit institutions (62 percent). Given the number of moving
parts in this exercise, readers should interpret these degree coverage rates with care. At
minimum, these estimates suggest that NSC-participating institutions in Michigan may not
always report degree completion for all undergraduates. Analysts using NSC data in other states
and regions to examine degree receipt should be aware of this potential drawback.
4.2 Matching Errors
A second way in which measurement error may appear when using NSC data to estimate
postsecondary outcomes for students is simply due to the matching process used by the NSC.
The NSC considers their matching algorithm proprietary; but, from communication with NSC
staff we know that this process tends to err on the side of “false negatives.” We also know that
the primary information used to match students to their postsecondary records is name and date
of birth. In our Michigan case-study below, we test the robustness of this matching algorithm to a
variety of typos or inconsistencies in student names.
4.3 Suppressed Student-level Information
A final way in which NSC data may not fully capture information on the postsecondary
experiences of a desired sample of students has to do with the Family Educational Rights and
Privacy Act (FERPA). FERPA is a federal law that protects the privacy of student education
records. The law applies to all schools that receive funds from the U.S. Department of Education.
Under FERPA, both students and schools can block their enrollment and degree information.22
So, NSC cannot release student-level information if the record is “FERPA-blocked.”
The NSC has published a report that provides state-specific statistics on the overall
number of blocked records processed by NSC in 2006-2007, 2008-2009, and 2010-2011 (NSC,
2012). Nationally, the NSC finds FERPA-blocking to be most prevalent among students at 2-
22 The overwhelming majority of “FERPA-blocked” records (nationally) are due to student-level blocking.
16
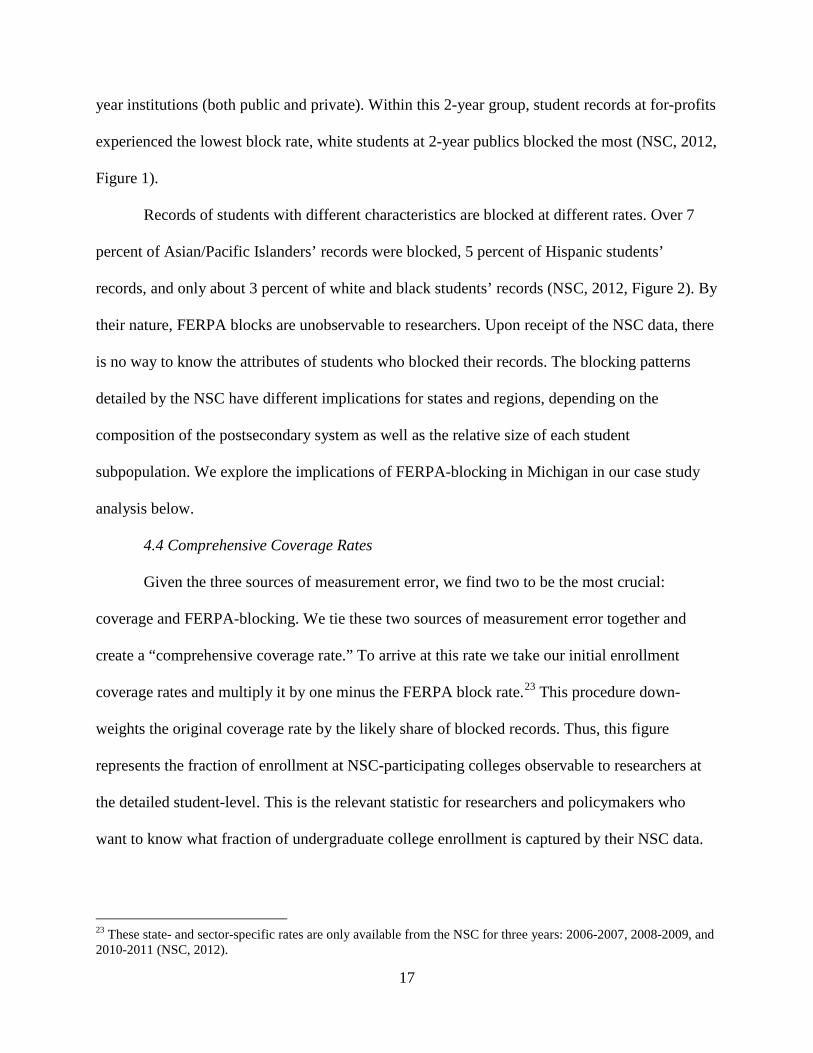
year institutions (both public and private). Within this 2-year group, student records at for-profits
experienced the lowest block rate, white students at 2-year publics blocked the most (NSC, 2012,
Figure 1).
Records of students with different characteristics are blocked at different rates. Over 7
percent of Asian/Pacific Islanders’ records were blocked, 5 percent of Hispanic students’
records, and only about 3 percent of white and black students’ records (NSC, 2012, Figure 2). By
their nature, FERPA blocks are unobservable to researchers. Upon receipt of the NSC data, there
is no way to know the attributes of students who blocked their records. The blocking patterns
detailed by the NSC have different implications for states and regions, depending on the
composition of the postsecondary system as well as the relative size of each student
subpopulation. We explore the implications of FERPA-blocking in Michigan in our case study
analysis below.
4.4 Comprehensive Coverage Rates
Given the three sources of measurement error, we find two to be the most crucial:
coverage and FERPA-blocking. We tie these two sources of measurement error together and
create a “comprehensive coverage rate.” To arrive at this rate we take our initial enrollment
coverage rates and multiply it by one minus the FERPA block rate.23 This procedure down-
weights the original coverage rate by the likely share of blocked records. Thus, this figure
represents the fraction of enrollment at NSC-participating colleges observable to researchers at
the detailed student-level. This is the relevant statistic for researchers and policymakers who
want to know what fraction of undergraduate college enrollment is captured by their NSC data.
23 These state- and sector-specific rates are only available from the NSC for three years: 2006-2007, 2008-2009, and 2010-2011 (NSC, 2012).
17

The comprehensive coverage rate increases from 82.1 percent in 2006-2007 to 86.1
percent in 2010-2011. This comprehensive coverage rate varies by sector, with for-profit
institutions experiencing the lowest coverage. Though private, non-profit 2-year institutions also
have low comprehensive coverage, recall that such institutions account for virtually zero percent
of total undergraduate enrollment (see Table 3). We provide comprehensive coverage rates by
state and sector for 2006-2007, 2008-2009, and 2010-2011 in Appendix Table A7.
5. Michigan Case-Study: Estimates of Postsecondary Outcomes Using NSC Data
As a way to illustrate how analysts and researchers can use the estimates provided in this
paper in their own work, and how these potential sources of measurement error affect estimates
of key postsecondary parameters, we turn to state administrative data on all public colleges and
universities in Michigan.
5.1 Coverage Rates in Michigan
At a first-order exploration, we present enrollment coverage rates overall and by
institutional sector for Michigan in Figures 4a and 4b. In Figure 4a, we see that enrollment
coverage in Michigan follows a similar pattern to the national trend, rising 4 percentage points
above the national average by 2011. As is the case nationally, for-profits have the poorest
coverage in Michigan (Figure 4b). Prior to 2009, a few key 4-year private colleges in Michigan
were also driving down the aggregate coverage rate, but joined the NSC in 2009. These colleges
explain the sharp uptick in coverage between the fall of 2008 and the fall of 2009.
5.2 NSC’s Matching Algorithm and Michigan Data
Even though the NSC’s matching algorithm is proprietary, it is important for researchers
to have a sense of how well this process functions. As a way to test the robustness of the NSC’s
matching algorithm to typos or inconsistencies in student names, we introduce slight variations
18
to the names of a subset of students (N = 10,000) that we previously observed matching to the
NSC database. We then re-submit these name variants to the NSC and examine which variants
match and which do not.24
From this process, we learned a few things that may improve match rates for others using
NSC data: (1) Adding a letter to a first name is much more harmful to the overall match rate than
deleting a letter; (2) The NSC matching algorithm seems to be very good at handling odd non-
alpha-numeric characters in names (e.g., “%”). Appending these types of characters to the end of
first names does little to the overall match rate; (3) Resubmitting names using popular first name
variants for students who did not initially match (e.g., “Chris” for “Christopher”) is likely to
increase the overall match rate by about 1 percentage point; (4) For students who have a suffix
that goes along with their name, it is crucial that this suffix be placed in a field separate from the
student’s first and last names. At least in our state data, suffixes often appeared as characters
appended to last names – and we found it important that these suffixes be removed and placed in
the separate field that NSC has for suffixes. Yet, students with suffixes represented a very small
portion of our random sample (0.3 percent), and therefore the improvement in the overall match
rate was minimal.
5.3 FERPA-Blocking in Michigan
To illustrate the consequences of the fact that FERPA-blocking rates are time-sensitive,
we use NSC data from Michigan over the course of several different submissions to the NSC to
estimate rates of college enrollment. These submission time points span roughly three years. In
Table 6, we estimate rates of college enrollment for the Michigan high school class of 2009 by a
24 This entire process was completed all within the same month; therefore, any changes in NSC’s interpretation of FERPA laws, algorithm processes, etc. are not likely to confound our name variant analysis – nor are changes in students’ choices about whether to block their detailed information under the Family Educational Rights and Privacy Act (FERPA).
19
constant point in time (i.e., the fall of 2010) separately based on three different pulls of NSC
data. Therefore, since the underlying group of individuals submitted to the NSC did not change
across time points and there were no changes in the stock of NSC-participating institutions, any
shifts in the estimated enrollment rates can be attributed to changes in FERPA-blocking
behavior.
Generally, our estimates of college enrollment for the class of 2009 are quite stable and
trend downward only slightly (mostly between 0 and 3 percentage points) over time. As a way to
capture all relevant student-level information, we then combine our NSC data across pulls. This
allows us to observe student-level data for those students who may have attended a school that
subsequently FERPA-blocked their information (or for students who blocked their information
during an earlier pull only to unblock it later). Naturally, this also allows us to capture updated
enrollment information for all students. In the final column of Table 6, we present pooled
estimates of the same parameters – by institution type, and by student subgroup. These pooled
estimates are of the same magnitude or larger compared to their corresponding parameters from
any individual NSC pull. This suggests that there is value added in submitting a group of
students multiple times to the NSC.
In our Michigan NSC data we also observe institution-specific patterns of FERPA-
blocking over these three time points that suggest (at least in some cases) changes in FERPA-
blocking are largely a school-level, rather than student-level, phenomenon.25 We see
exceptionally large increases in the FERPA-blocking rate at particular institutions in our sample.
For example, at one large public research institution, the FERPA-blocking rate jumped from 8.5
percent in the fall of 2010 to 24.2 percent about a year later. Yet, at another large public research
intuition, the FERPA-blocking rate barely budged over this same time period, from 0.02 to 0.09
25 NSC provides back to researchers the total number of blocked records by institution for a given submission.
20
percent. We observe similar examples in the 2-year sector: One community college in Michigan
saw its FERPA-blocking rate increase from essentially zero (0.01 percent) to nearly 31 percent
during the same period.26 Regardless of the mechanisms underlying changing patterns of
FERPA-blocking rates, researchers should be cognizant of the degree to which blocked
information for the state and time period under study may affect estimates of key college-going
parameters.
5.4 Exploring Estimates of Postsecondary Enrollment and Persistence in Michigan
With an improved understanding of how these three main sources of measurement error
are likely to show up in our Michigan NSC data, we now exploit the existence of an additional
rich data source in Michigan as a way to illustrate implications of this collection of measurement
error concerns for estimating a range of postsecondary outcomes. We first describe the student-
level administrative transcript data, and then conduct analyses in which we compare estimates of
college enrollment and persistence for a recent graduating class of Michigan high school students
based on each data source.
5.4.1 Michigan’s Student Transcript and Academic Record Repository (STARR)
STARR consists of electronic college transcripts for all students who attend public
institutions of higher education in Michigan, including community colleges. The database
contains information about each course a student takes, including course title, credits earned, and
grade. It also contains information on declared majors and minors, degrees or certificates a
student earns, and demographic information as collected by the participating colleges.
The collection of these data was mandated as a requirement for Michigan to receive State
Fiscal Stabilization Fund (SFSF) dollars under the American Recovery and Reinvestment Act
26 Perhaps this is suggestive of different institutions changing the way in which a FERPA-blocking option is presented to undergraduate students (i.e., the default).
21

(ARRA). The state has just concluded its second collection of these data. The first collection
included complete transcripts for every student who was enrolled in a Michigan public college or
university at any point between June 2009 and May 2011. The second collection includes the
same set of information for any student who attended a Michigan public college between June
2011 and May 2012. STARR data will be collected annually going forward. STARR covers all
students enrolled in Michigan public institutions, whether they attended high school in Michigan
or elsewhere, are a graduate or undergraduate, or are seeking a degree or not. Since these data are
a collection of transcripts, linking to a student once captures their full history of attachment to an
institution.
5.4.2 Enrollment
We focus on Michigan public high school graduates in the class of 2011. We use this
class of graduates because the 2011-2012 wave of public postsecondary transcript (i.e., STARR)
data is the cleanest (i.e., many bugs in the data collection process were worked out between the
first and second waves). In Table 7, we estimate the proportion of this class that enrolls in
postsecondary schooling within one academic year after high school graduation. We calculate
this same statistic for a variety of socio-demographic subgroups of students.
We see that nearly 70 percent enroll in college (anywhere) within the first year following
high school graduation and 55 percent enroll in a Michigan public college during that timeframe
(based on NSC data alone). If we instead examine the share of these high school graduates that
enrolls in a Michigan public college based on state administrative data, we arrive at the same
estimate (i.e., 55 percent). But, if we combine the NSC and state administrative data sources, this
figure climbs to 59 percent. This suggests that the two data sources are capturing slightly
different students.
22

Students who we see attending a Michigan public college in one data source but not the
other tend to cluster in a few institutions. For example, nearly 30 percent of students we see
attending college in the STARR data but not in the NSC data are at community colleges we
know recently joined the NSC. Similarly, about 25 percent of students we see attending college
according to NSC data but not STARR data are at a community college that had some trouble
uploading complete transcript data for its students. No data source is perfect. These examples
illustrate holes in coverage and how states’ own postsecondary data systems can improve and be
improved by NSC data. At least in Michigan, our estimates in Table 7 suggest small to moderate
differences in the calculated college-going rate based on NSC versus state administrative data.
5.4.3 Persistence and Progress through College
Given the incentives and demands created by SFSF funding, one of the most salient
measures of persistence that state departments of education now calculate is the proportion of
students from recent high school graduating classes who go on to obtain a year’s worth of
college credit.
The NSC records students’ college-going experience in terms of enrollment spells (i.e.,
particular dates of enrollment) rather than semesters. The federal government supplied states
with a formula to use with NSC data that calculates whether a student “earned” a year of credit
based on the total number of weeks a student was enrolled in college. This formula considers
students who meet any of the following criteria as having earned one year of college credit (24
credits): enrolled full-time for 28 weeks; enrolled half-time for 56 weeks; enrolled less-than-half-
time for 112 weeks; or any equivalent combination. This calculation requires information on the
intensity with which students were enrolled during each enrollment spell. Unfortunately, a
23
sizeable share of intensity information is missing in NSC data: For the Michigan high school
class of 2011, about 25 percent of enrollment spells are missing intensity information.27
As a first-order question, we explore the adequacy of this federal formula for translating
enrollment spells into credits earned. To investigate how well this formula approximates actual
credit accumulation among students, we limit our analytic sample to college-goers from
Michigan’s high school class of 2011 who attended a public college in Michigan and have no
missing intensity information. We then compare estimates of the number of credits earned and
the share of this subsample earning at least one year of credit based on NSC data to the same
statistics calculated using the state’s transcript data instead (i.e., the truth).
The results in Table 8 illustrate that the federal formula generally overestimates the share
of students earning at least one year of college credit by about a year after high school
graduation. Further, this overestimate is not equal for all students. The formula substantially
overestimates credit accumulation for traditionally disadvantaged groups (e.g., those eligible for
free or reduced-price meals (FARM) and minority students). For example, estimating the share
of black undergraduates who earn at least one year of college credit based on NSC data yields a
figure of 47 percent. Counting up actual credits earned by black students at Michigan public
colleges in our state administrative data instead yields a figure of only 29 percent, for a
difference of 18 percentage points.
About a quarter of the college-going sample in Table 8 has at least one missing
enrollment intensity status associated with an enrollment spell in our NSC data.28 How states
choose to handle these missing values also has implications for estimates of postsecondary
27 These missing intensity values tend to be fairly evenly distributed between 4-year and 2-year schools, but relatively more concentrated among public institutions compared to privates. 28 The share of students with missing enrollment intensity information does not vary much across demographic subgroups.
24

attainment. In Table 9, we impute missing intensity values in the NSC data as either less-than-
part-time (LTPT), part-time (PT), or full-time (FT), calculate the corresponding share of students
earning at least one year of college for each subgroup, and compare this figure to the “truth” we
observe in our state administrative data (i.e., actual credits earned). This exercise illustrates that
for FARM, black, and Hispanic students, imputing missing intensity values as LTPT gets one
closer to the “truth,” whereas for white and non-FARM students, the best imputation choice lies
between PT and FT. Still, in all cases, imputing all missing intensity values as FT only serves to
exacerbate the degree to which the federal formula overstates credit accumulation.
Taken together, our findings suggest that this formula is not reliable for the very groups
whose attainment is often of concern. It may be more conservative to simply report what we
know: the number of semesters enrolled, and be agnostic about equivalent credits.
6. Special Issues for Policy Analysts and Program Evaluators
In this paper we describe and explore the most salient sources of measurement error in
NSC data. We examine the implications of such measurement error for estimating postsecondary
outcomes of interest to policymakers and researchers. It is our hope that these analyses will serve
as a useful reference for policy analysts and researchers using NSC data to study the impacts of
various programs and policies on postsecondary attendance, persistence, and attainment.
Our findings illustrate that NSC data miss a shrinking but nontrivial portion of
undergraduate enrollment in the United States: Coverage is highest among public institutions (99
percent for 4-year; 96 percent for 2-year) and lowest (but growing) among the for-profit sector
(48 percent). There is substantial variation in coverage across states, institutional sectors, and
over time. Such variation underscores the need for researchers using NSC data to evaluate
programs or policies to understand the level of coverage NSC data provide for the state(s) and
25

time period under study. We find that the algorithm the NSC uses to match students to their
postsecondary enrollment records is quite robust to common computerized perturbations of
names. Such errors are unlikely to introduce appreciable measurement error (at least based on
our Michigan data). Finally, our work illustrates the value of submitting the same population of
students to the NSC multiple times, since FERPA-blocking rates are time-sensitive and
sometimes institution-specific, in order to capture the maximum amount of college-going
information for that population.
In this concluding section we highlight a few issues relevant for program evaluators
interested in estimating the impact of some treatment on college outcomes. We focus on a
hypothetical research question in which the outcome of interest is enrollment in college (i.e.,
binary). In general, the types of measurement error we discuss in this paper will lead researchers
to incorrectly categorize some college-attenders as not attending college. This sort of
misclassification of a dichotomous dependent variable, if uncorrelated with treatment status, will
attenuate any treatment effect toward zero (Bound et al., 2001, p. 3726). The basic intuition
behind this conclusion is that for a binary outcome, there can never be a positive “measurement
error” for someone who did indeed attend college (outcome = 1). That is, for someone who did
attend college (outcome = 1), there is no way to “positively” misclassify that person. The only
feasible misclassification is to instead say they did not attend college (outcome = 0).29 Therefore,
this implies that if non-converge in NSC data is unrelated to treatment status (as in the case of a
randomized experiment), then a simple adjustment using our reported “comprehensive” coverage
rate will scale the treatment effect (measured in percentage points) to its true magnitude.
29 Therefore, this conclusion differs importantly from a case in which the outcome is continuous and the measurement error of that outcome is not associated with treatment. In such cases, the measurement error will simply cause the treatment effect to be estimated with less precision (i.e., larger standard errors), but the coefficient itself remains unbiased (Wooldridge, 2003, pp. 302-303).
26

In non-experimental and quasi-experimental settings, there may be reason to suspect that
NSC coverage could be correlated with treatment status. States typically submit their students to
the NSC based on the grade in which they are enrolled. In fact, states most often submit classes
of graduating public high school students to the NSC. Assume one is interested in the effect of a
9th grade curriculum change on college attendance. The change is introduced in a particular year,
t, such that those in 8th grade before time t are not exposed, but those in 8th grade in year t and
forward are exposed. If the state only submits the analogous graduating classes of students, the
analyst will not observe college outcomes for dropouts and will observe college outcomes sooner
for those students (from the treatment and control cohorts) who progressed through high school
on time. The curriculum could have affected dropout and the rate at which students progress
through school. If so, such a submission plan can lead to measurement error that is correlated
with the treatment of interest. The lesson here is to submit intact cohorts of students (e.g., first-
time 9th graders by year) and to be patient about those who are progressing slowly, or redefine
your outcomes (e.g., within one year of expected on-time high school graduation).
For evaluations that exploit temporal variation in exposure to a treatment and compare
college-going rates over time, it is also important to consider whether there were changes in the
number and type of institutions participating in the NSC during the outcome time period under
study. A spike in NSC participation that occurs during the time when treated students would be
enrolling in college (but not control students) would confound increases in college enrollment
due to the treatment of interest with increases due to changes in NSC coverage. One way to
address this concern is to only count attendance at colleges that have joined NSC by the
beginning of the outcome period of interest: That is, code students who enroll in colleges that
27

join the NSC later as non-enrollees. This allows the analyst to assess the effect on college
enrollment among a common underlying population of colleges.
Finally, variation in NSC coverage by institutional sector points to a potential
interpretation concern: If a treatment or policy of interest induced students currently attending
institutions with poorer coverage rates (e.g.. for-profits) to instead attend colleges that are
comprehensively covered by the NSC (e.g., publics), then researchers may incorrectly
characterize what is really a “choice effect” (i.e., moving from one type of college to another as a
result of the treatment) as an “enrollment/attendance” effect.
Of course, all research questions are unique. We seek to provide the evidence,
framework, and key guiding principles necessary to help researchers and policy analysts
interested in higher education more carefully exploit the richness of NSC data – as well as
explore the potential impacts of the limitations inherent in using these data on their work.
28
References Ackerman, D., Cronin, J. A., Turner N., & Bershadker, A. (2011). Coordinating the American
Opportunity Tax Credit and the federal Pell Grant. Paper presented at National Tax Association Conference.
Bettinger, E. P., Long, B. T., Oreopoulos, P., & Sanbonmatsu, L. (2012). The Role of
simplification and information in college decisions: Results from the H&R Block FAFSA experiment. Quarterly Journal of Economics, 127(3), 1205-1242.
Bound, J., Brown, C., & Mathiowetz, N. (2001). Measurement Error in Survey Data, in Edward
Leamer and James J. Heckman, eds., Handbook of Econometrics, v. 5, Elsevier Science, Chapter 59, 3705-3843.
Chingos, M. M., & Peterson, P. E. (2012). The effect of school vouchers on college enrollment:
Experimental evidence from New York City. (Academic). Brookings Institution: Brown Center on Education Policy.
Cunningham, A. F., & Milam, J. (2005). Feasibility of a student unit record system within the
Integrated Postsecondary Education Data System (NCES 2005-160). U.S. Department of Education, National Center for Education Statistics. Washington, DC: U.S. Government Printing Office.
Data Quality Campaign. (2012). Data for action 2012: Focus on people to change data culture.
Washington, DC, Access: http://dataqualitycampaign.org/resources/details/1631
Deming, D. J., Hastings, J. S., Kane, T. J., & Staiger, D. O. (2013). School choice, school quality, and postsecondary attainment. American Economic Review, forthcoming.
Dynarski, S., Hyman, J., & Schanzenbach, D. W. (2013). Experimental evidence on the effect of
childhood investments on postsecondary attainment and degree completion. Journal of Policy Analysis and Management, 32(4),692-717.
Garcia, T. and L’Orange H.P. (2012). Strong Foundations: The State of State Postsecondary Data
Systems: 2012 Update on Data Sharing with K-12 and Labor. State Higher Education Officers Association.
Goldrick-Rab, S. (2012). Review of “The Effects of School Vouchers on College Enrollment.”
(Academic). National Education Policy Center, Access: http://nepc.colorado.edu/files/ttr-voucherscollege.pdf
Hemelt, S. W. Roth, K. B., & Eaton, W. W. (2013). Elementary school interventions:
Experimental evidence on postsecondary outcomes. Educational Evaluation and Policy Analysis, forthcoming.
Higher Education Opportunity Act of 2008, Pub. L. No. 110-315. (2008).
29
Hout, M. (2011). Social and economic returns to college in the United States. Annual Review of
Sociology, 38, 179-400. Hyman, J. (2013). ACT for All: The effect of mandatory college entrance exams on
postsecondary attainment and choice. Working paper, University of Michigan. Kane, T. J. (2003). A quasi-experimental estimate of the impact of financial aid on college-
going. NBER Working Paper Series, No. 9703.
Lederman, D. (2012, September 13). Higher ed scholars’ voucher war. Inside Higher Ed, Access: http://www.insidehighered.com/news/2012/09/13/researchers-argue-over-school-vouchers-impact-college-going
Lleras-Muney, A. (2005). The relationship between education and adult mortality in the United
States. Review of Economic Studies, 72, 189–221. National Center for Education Statistics, Integrated Postsecondary Education Data System
(IPEDS), U.S. Department of Education, 2010. National Student Clearinghouse. (2012). Impact of Directory Information Blocks on
StudentTracker Results, Access: http://research.studentclearinghouse.org/working_with_our_data.php
Oreopoulos, P., & Petronijevic, U. (2013). Making college worth it: A review of research on the
returns to higher education. NBER Working Paper Series, No. 19053.
Oreopoulos, P., & Salvanes, K. G. (2011). Priceless: The non-pecuniary benefits of schooling. Journal of Economic Perspectives, 25(1), 159-184.
Richburg-Hayes, et al. (2009). Rewarding persistence: Effects of a performance-based
scholarship program for low-income parents (Academic). MDRC, Access: http://www.mdrc.org/sites/default/files/Rewarding%20Persistence%20ES.pdf
Wooldridge, J. M. (2003). Introductory Econometrics (2nd ed.). South-Western, Thompson
Learning: Mason, OH.
30

Figure 1a. NSC Enrollment Coverage by Enrollment Measure
Figure 1b. NSC Enrollment Coverage by Geographic Region
0.2
.4.6
.81
Frac
tion
1995 1997 1999 2001 2003 2005 2007 2009 2011Year
Undergraduate 1st-Time FTE Undergrad
0.2
.4.6
.81
Frac
tion
1995 1997 1999 2001 2003 2005 2007 2009 2011Year
Northeast MidwestWest South
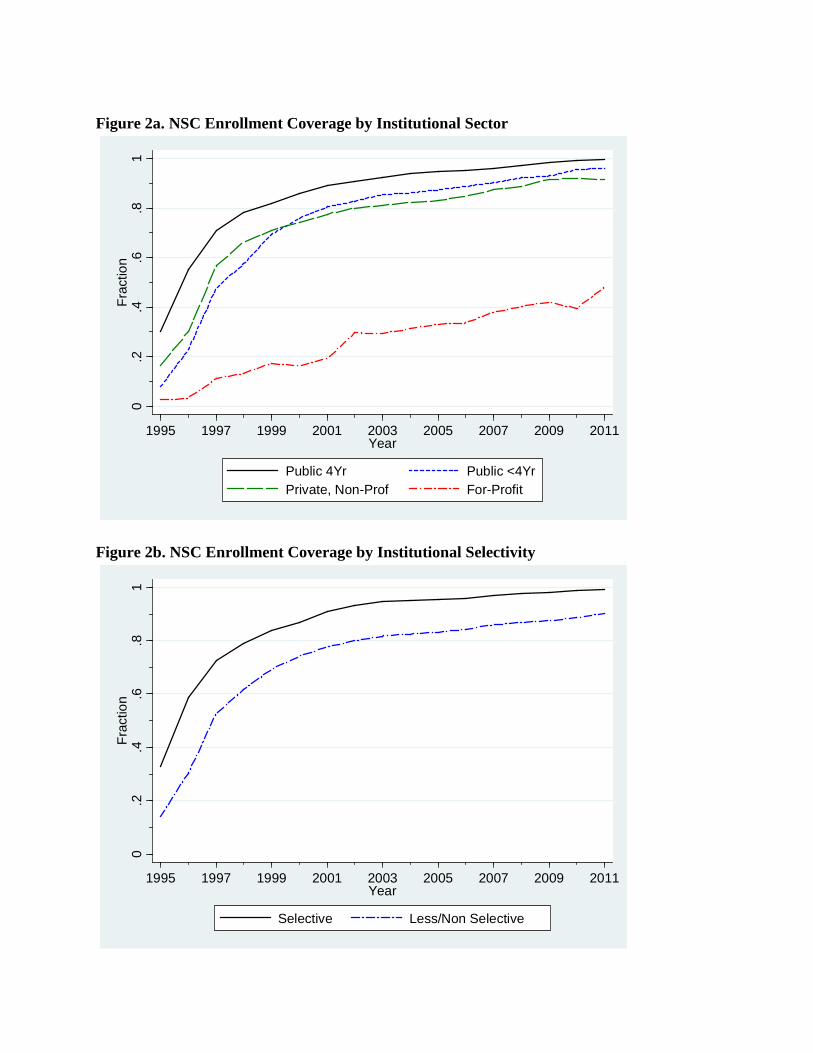
Figure 2a. NSC Enrollment Coverage by Institutional Sector
Figure 2b. NSC Enrollment Coverage by Institutional Selectivity
0.2
.4.6
.81
Frac
tion
1995 1997 1999 2001 2003 2005 2007 2009 2011Year
Public 4Yr Public <4YrPrivate, Non-Prof For-Profit
0.2
.4.6
.81
Frac
tion
1995 1997 1999 2001 2003 2005 2007 2009 2011Year
Selective Less/Non Selective

Figure 3a. NSC Enrollment Coverage by Student Sex
Figure 3b. NSC Enrollment Coverage by Student Race and Ethnicity
0.2
.4.6
.81
Frac
tion
1995 1997 1999 2001 2003 2005 2007 2009 2011Year
Male Female
0.2
.4.6
.81
Frac
tion
1995 1997 1999 2001 2003 2005 2007 2009 2011Year
White BlackHispanic Other

Figure 4a. NSC Enrollment Coverage in Michigan
Figure 4b. NSC Enrollment Coverage in Michigan by Institutional Sector
0.2
.4.6
.81
Frac
tion
1995 1997 1999 2001 2003 2005 2007 2009 2011Year
National Michigan
0.2
.4.6
.81
Frac
tion
1995 1997 1999 2001 2003 2005 2007 2009 2011Year
Public 4Yr Public <4YrPrivate, Non-Prof For-Profit

Notes: For all figures, the underlying sample is all U.S. Title-IV postsecondary institutions. Unless otherwise noted, trends are weighted by total undergraduate enrollment. Year corresponds to the fall semester. Enrollment and student characteristics are from IPEDS. An institution is counted as an NSC participant if it joins by October 15th of a given year. Information on institution selectivity comes from 2004 Barron’s ranking data: An institution is counted as a “selective” institution if it received a Barron’s ranking of “very competitive,” “highly competitive,” or “most competitive.” Collectively, this group of institutions admits about half or less of their applicants.

Table 1. College Attendance Rate of Michigan High School Classes of 2008 and 2009
Proportion N Standard Error Proportion N Standard
Error(1) (2) (3) (4) (5) (6)
A. Immediate EnrollmentOverall 0.74 54 0.06 0.79 10904 0.00Sex
Female 0.68 28 0.12 0.83 5615 0.01Male 0.81 26 0.08 0.75 5289 0.01
Race and EthnicityWhite 0.80 44 0.17 0.80 8974 0.01Black 0.25 4 0.23 0.69 1074 0.01Other 0.67 6 0.21 0.78 856 0.01Hispanic 1.00 2 - 0.62 471 0.02
B. Enrollment by 2nd Fall after HS graduationOverall 0.80 121 0.04 0.79 12805 0.00Sex
Female 0.86 57 0.07 0.82 6544 0.01Male 0.75 64 0.05 0.75 6261 0.01
Race and EthnicityWhite 0.82 96 0.10 0.80 10571 0.01Black 0.65 17 0.12 0.70 1271 0.01Other 0.86 7 0.14 0.80 963 0.01Hispanic 0.67 9 0.16 0.67 526 0.02
Notes: The sample for columns (1)-(3) and (4)-(6) is respondents from the CPS (October supplement) and ACS, respectively, whose state of residence at the time of the survey is Michigan and who we estimate to have graduated high school (HS) in 2008 or 2009. Year of HS graduation in the CPS is imputed using age, survey year, and approximate graduation year (current year vs. prior to survey). For example, panel A , cols (1)-(3) use the 2008 and 2009 waves of the CPS and restrict to those individuals who are 18-19 years old and graduated HS during the same year as the survey. Panel B uses 2009 and 2010 CPS and restricts to 19-20 year-olds who graduated HS prior to the year of the survey. The ACS does not collect year of HS graduation data, so for columns (4)-(6) we identify HS graduates using only age and survey year: Panel A restricts to high school graduates in the 2008 and 2009 ACS who are 18-19 years old. ACS uses 3-year estimates.
Current Population Survey (CPS) American Community Survey (ACS)

Table 2. NSC Postsecondary Enrollment Coverage Rates: All U.S. Title IV Institutions by State and Year
State 1995 1997 1999 2001 2003 2005 2007 2009 2011AL 0.015 0.525 0.701 0.716 0.722 0.789 0.868 0.884 0.894AK 0.000 0.000 0.930 0.929 0.953 0.949 0.936 0.915 0.910AZ 0.000 0.119 0.217 0.383 0.450 0.550 0.705 0.867 0.892AR 0.000 0.444 0.720 0.773 0.778 0.860 0.852 0.921 0.921CA 0.181 0.498 0.755 0.885 0.909 0.898 0.914 0.909 0.932CO 0.044 0.752 0.834 0.801 0.825 0.836 0.791 0.798 0.823CT 0.569 0.743 0.806 0.801 0.835 0.823 0.840 0.859 0.844DE 0.000 0.010 0.542 0.614 0.641 0.640 0.618 0.952 0.938DC 0.055 0.352 0.553 0.814 0.826 0.835 0.926 0.962 0.964FL 0.003 0.206 0.570 0.701 0.779 0.823 0.825 0.807 0.838GA 0.246 0.533 0.643 0.658 0.872 0.899 0.909 0.902 0.948HI 0.008 0.028 0.073 0.791 0.823 0.820 0.864 0.879 0.888ID 0.151 0.628 0.620 0.933 0.965 0.963 0.965 0.939 0.954IL 0.252 0.696 0.778 0.910 0.941 0.892 0.919 0.907 0.926IN 0.000 0.149 0.307 0.372 0.569 0.594 0.822 0.918 0.938IA 0.000 0.517 0.612 0.872 0.887 0.863 0.833 0.764 0.838KS 0.000 0.273 0.379 0.656 0.809 0.834 0.842 0.855 0.863KY 0.004 0.823 0.817 0.814 0.828 0.907 0.948 0.934 0.943LA 0.294 0.584 0.737 0.701 0.754 0.795 0.800 0.765 0.819ME 0.000 0.712 0.808 0.826 0.838 0.916 0.931 0.938 0.944MD 0.027 0.422 0.729 0.757 0.900 0.896 0.904 0.913 0.936MA 0.116 0.579 0.732 0.827 0.836 0.870 0.933 0.942 0.951MI 0.093 0.324 0.559 0.701 0.764 0.830 0.844 0.943 0.950MN 0.127 0.930 0.942 0.933 0.945 0.952 0.952 0.946 0.950MS 0.079 0.507 0.794 0.805 0.823 0.846 0.929 0.937 0.953MO 0.514 0.695 0.808 0.860 0.906 0.909 0.922 0.903 0.901MT 0.000 0.823 0.896 0.908 0.914 0.915 0.919 0.917 0.924NE 0.356 0.761 0.846 0.935 0.958 0.959 0.959 0.954 0.968NV 0.000 0.315 0.692 0.877 0.968 0.944 0.933 0.913 0.915NH 0.459 0.655 0.709 0.680 0.705 0.931 0.937 0.946 0.962NJ 0.017 0.509 0.724 0.807 0.840 0.852 0.862 0.878 0.926NM 0.000 0.103 0.387 0.620 0.626 0.634 0.834 0.913 0.902NY 0.250 0.784 0.851 0.865 0.862 0.869 0.892 0.902 0.933NC 0.189 0.825 0.902 0.912 0.919 0.923 0.960 0.964 0.958ND 0.000 0.956 0.947 0.957 0.936 0.919 0.915 0.902 0.924OH 0.421 0.695 0.835 0.856 0.884 0.896 0.919 0.906 0.919OK 0.081 0.331 0.554 0.646 0.639 0.640 0.646 0.742 0.838OR 0.071 0.603 0.688 0.787 0.843 0.897 0.896 0.901 0.953PA 0.345 0.792 0.874 0.880 0.895 0.902 0.907 0.903 0.920RI 0.000 0.302 0.600 0.804 0.905 0.889 0.950 0.954 0.955SC 0.124 0.803 0.886 0.929 0.950 0.947 0.955 0.955 0.956SD 0.000 0.807 0.830 0.826 0.809 0.820 0.830 0.826 0.862TN 0.281 0.828 0.844 0.878 0.873 0.858 0.850 0.850 0.858TX 0.053 0.411 0.543 0.620 0.711 0.748 0.765 0.810 0.921UT 0.504 0.757 0.785 0.938 0.935 0.928 0.913 0.919 0.907VA 0.000 0.866 0.893 0.897 0.900 0.897 0.969 0.970 0.974VT 0.481 0.741 0.891 0.913 0.926 0.933 0.953 0.950 0.959WA 0.112 0.727 0.824 0.942 0.949 0.950 0.965 0.955 0.964WV 0.000 0.288 0.599 0.688 0.710 0.697 0.693 0.722 0.645WI 0.457 0.862 0.887 0.947 0.967 0.973 0.967 0.964 0.965WY 0.000 0.622 0.958 0.942 0.931 0.916 0.951 0.958 0.996Notes: Year corresponds to the fall semester. Coverage rates are calculated by dividing the total undergraduate enrollment in postsecondary institutions participating in the NSC by the total undergraduate enrollment in all postsecondary institutions. Undergraduate enrollment counts are from IPEDS. A school is counted as in the NSC for that year if it joins by October 15th. See appendix tables for rates for all years 1995-2011 by state and college type.
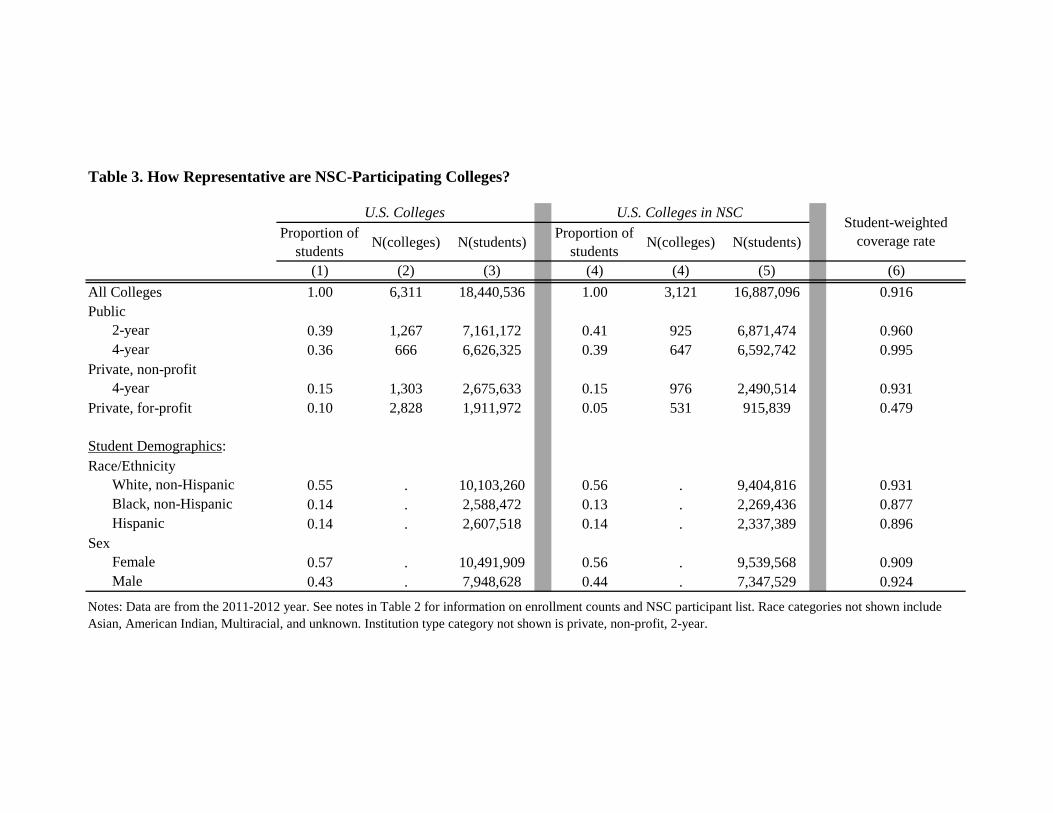
Table 3. How Representative are NSC-Participating Colleges?
Proportion of students N(colleges) N(students) Proportion of
students N(colleges) N(students)
(1) (2) (3) (4) (4) (5) (6)All Colleges 1.00 6,311 18,440,536 1.00 3,121 16,887,096 0.916Public
2-year 0.39 1,267 7,161,172 0.41 925 6,871,474 0.9604-year 0.36 666 6,626,325 0.39 647 6,592,742 0.995
Private, non-profit4-year 0.15 1,303 2,675,633 0.15 976 2,490,514 0.931
Private, for-profit 0.10 2,828 1,911,972 0.05 531 915,839 0.479
Student Demographics:Race/Ethnicity
White, non-Hispanic 0.55 . 10,103,260 0.56 . 9,404,816 0.931Black, non-Hispanic 0.14 . 2,588,472 0.13 . 2,269,436 0.877Hispanic 0.14 . 2,607,518 0.14 . 2,337,389 0.896
SexFemale 0.57 . 10,491,909 0.56 . 9,539,568 0.909Male 0.43 . 7,948,628 0.44 . 7,347,529 0.924
U.S. Colleges U.S. Colleges in NSCStudent-weighted
coverage rate
Notes: Data are from the 2011-2012 year. See notes in Table 2 for information on enrollment counts and NSC participant list. Race categories not shown include Asian, American Indian, Multiracial, and unknown. Institution type category not shown is private, non-profit, 2-year.
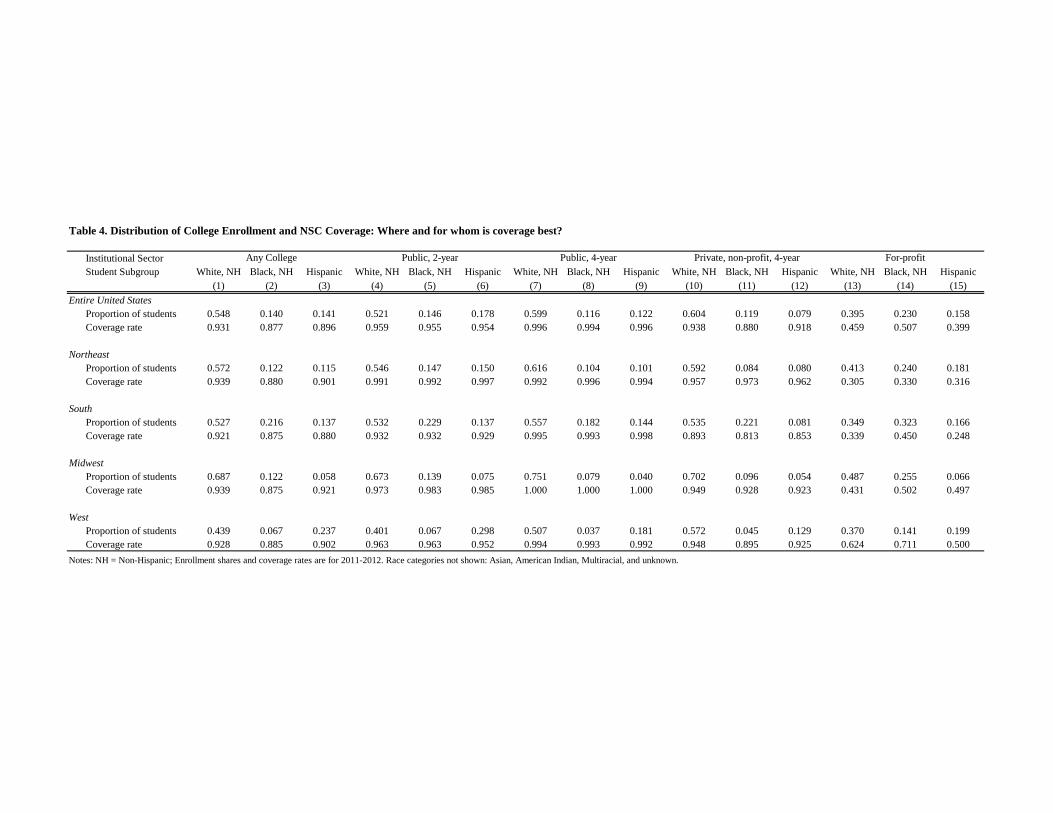
Table 4. Distribution of College Enrollment and NSC Coverage: Where and for whom is coverage best?
Institutional SectorStudent Subgroup White, NH Black, NH Hispanic White, NH Black, NH Hispanic White, NH Black, NH Hispanic White, NH Black, NH Hispanic White, NH Black, NH Hispanic
(1) (2) (3) (4) (5) (6) (7) (8) (9) (10) (11) (12) (13) (14) (15)Entire United States
Proportion of students 0.548 0.140 0.141 0.521 0.146 0.178 0.599 0.116 0.122 0.604 0.119 0.079 0.395 0.230 0.158Coverage rate 0.931 0.877 0.896 0.959 0.955 0.954 0.996 0.994 0.996 0.938 0.880 0.918 0.459 0.507 0.399
NortheastProportion of students 0.572 0.122 0.115 0.546 0.147 0.150 0.616 0.104 0.101 0.592 0.084 0.080 0.413 0.240 0.181Coverage rate 0.939 0.880 0.901 0.991 0.992 0.997 0.992 0.996 0.994 0.957 0.973 0.962 0.305 0.330 0.316
SouthProportion of students 0.527 0.216 0.137 0.532 0.229 0.137 0.557 0.182 0.144 0.535 0.221 0.081 0.349 0.323 0.166Coverage rate 0.921 0.875 0.880 0.932 0.932 0.929 0.995 0.993 0.998 0.893 0.813 0.853 0.339 0.450 0.248
MidwestProportion of students 0.687 0.122 0.058 0.673 0.139 0.075 0.751 0.079 0.040 0.702 0.096 0.054 0.487 0.255 0.066Coverage rate 0.939 0.875 0.921 0.973 0.983 0.985 1.000 1.000 1.000 0.949 0.928 0.923 0.431 0.502 0.497
WestProportion of students 0.439 0.067 0.237 0.401 0.067 0.298 0.507 0.037 0.181 0.572 0.045 0.129 0.370 0.141 0.199Coverage rate 0.928 0.885 0.902 0.963 0.963 0.952 0.994 0.993 0.992 0.948 0.895 0.925 0.624 0.711 0.500
Notes: NH = Non-Hispanic; Enrollment shares and coverage rates are for 2011-2012. Race categories not shown: Asian, American Indian, Multiracial, and unknown.
Any College Public, 2-year Public, 4-year Private, non-profit, 4-year For-profit
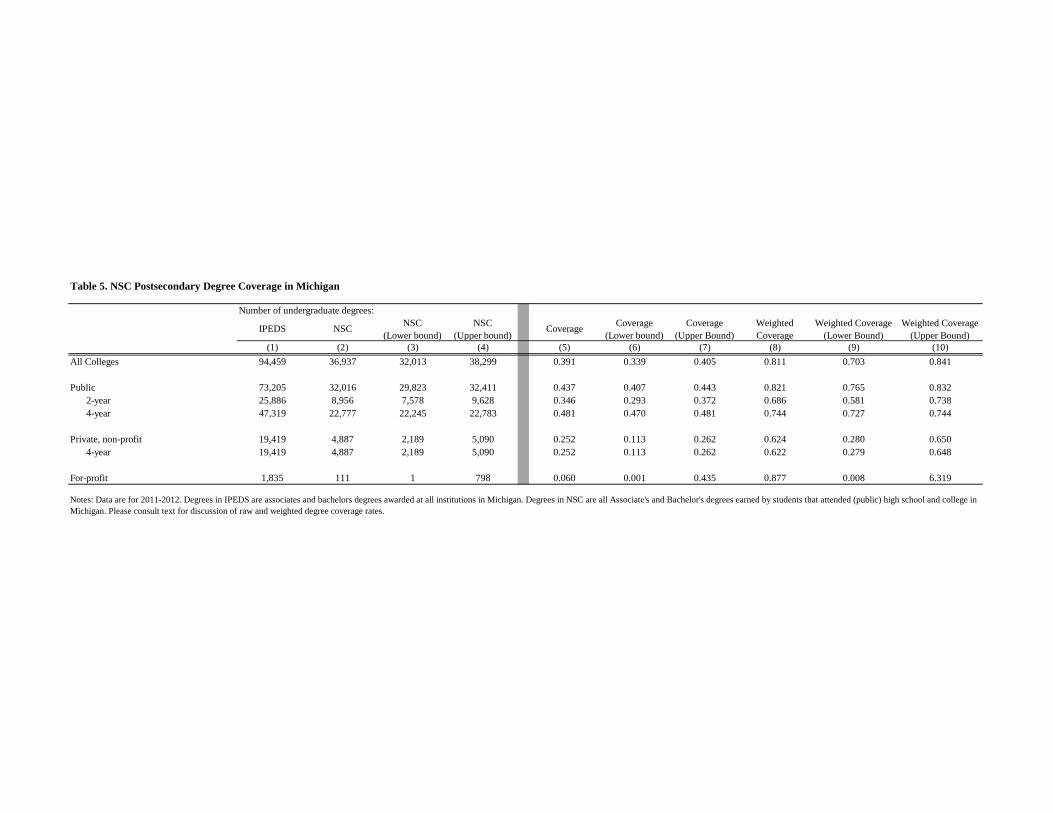
Table 5. NSC Postsecondary Degree Coverage in Michigan
IPEDS NSC NSC (Lower bound)
NSC (Upper bound)
Coverage Coverage(Lower bound)
Coverage(Upper Bound)
Weighted Coverage
Weighted Coverage(Lower Bound)
Weighted Coverage(Upper Bound)
(1) (2) (3) (4) (5) (6) (7) (8) (9) (10)All Colleges 94,459 36,937 32,013 38,299 0.391 0.339 0.405 0.811 0.703 0.841
Public 73,205 32,016 29,823 32,411 0.437 0.407 0.443 0.821 0.765 0.8322-year 25,886 8,956 7,578 9,628 0.346 0.293 0.372 0.686 0.581 0.7384-year 47,319 22,777 22,245 22,783 0.481 0.470 0.481 0.744 0.727 0.744
Private, non-profit 19,419 4,887 2,189 5,090 0.252 0.113 0.262 0.624 0.280 0.6504-year 19,419 4,887 2,189 5,090 0.252 0.113 0.262 0.622 0.279 0.648
For-profit 1,835 111 1 798 0.060 0.001 0.435 0.877 0.008 6.319
Notes: Data are for 2011-2012. Degrees in IPEDS are associates and bachelors degrees awarded at all institutions in Michigan. Degrees in NSC are all Associate's and Bachelor's degrees earned by students that attended (public) high school and college in Michigan. Please consult text for discussion of raw and weighted degree coverage rates.
Number of undergraduate degrees:

Table 6. How does Time-Sensitive FERPA-Blocking Affect College Enrollment Estimates?
College enrollment rate based on submission to NSC on…September
2010August 2011
August2012
Union of Submissions
(1) (2) (3) (4)Overall 0.66 0.64 0.64 0.67
Institution TypePublic, 2-year 0.36 0.34 0.34 0.37Public, 4-year 0.29 0.29 0.28 0.29
Private, 4-year 0.08 0.08 0.07 0.08
Student SexFemale 0.69 0.67 0.67 0.70Male 0.62 0.61 0.61 0.64
Student Race/EthnicityWhite, non-Hispanic 0.68 0.66 0.66 0.68Black, non-Hispanic 0.62 0.60 0.60 0.63Hispanic 0.48 0.44 0.43 0.49
Notes: The underlying sample submitted to the NSC is always the Michigan high school class of 2009. Each column shows the fraction enrolled in college by September 2010 (second fall after high school graduation). Private 4-year colleges include non-profit and for-profit institutions.
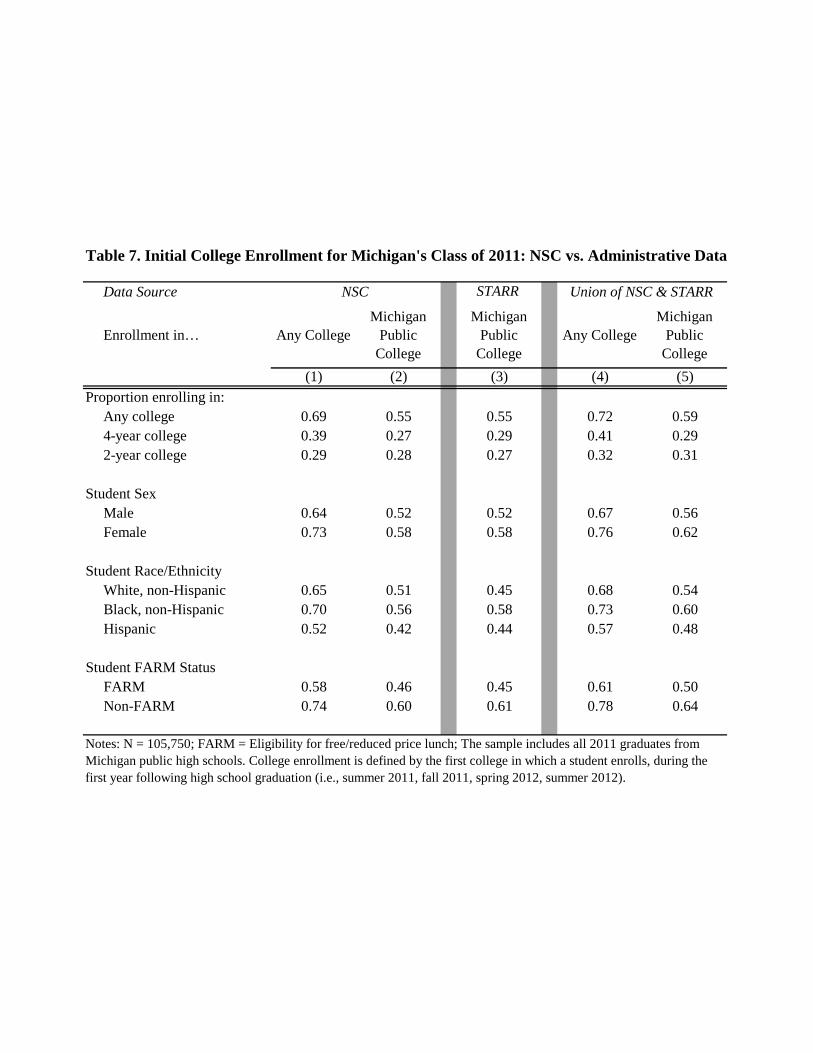
Table 7. Initial College Enrollment for Michigan's Class of 2011: NSC vs. Administrative Data
Data Source STARR
Enrollment in… Any CollegeMichigan
Public College
Michigan Public
CollegeAny College
Michigan Public
College(1) (2) (3) (4) (5)
Proportion enrolling in:Any college 0.69 0.55 0.55 0.72 0.594-year college 0.39 0.27 0.29 0.41 0.292-year college 0.29 0.28 0.27 0.32 0.31
Student SexMale 0.64 0.52 0.52 0.67 0.56Female 0.73 0.58 0.58 0.76 0.62
Student Race/EthnicityWhite, non-Hispanic 0.65 0.51 0.45 0.68 0.54Black, non-Hispanic 0.70 0.56 0.58 0.73 0.60Hispanic 0.52 0.42 0.44 0.57 0.48
Student FARM StatusFARM 0.58 0.46 0.45 0.61 0.50Non-FARM 0.74 0.60 0.61 0.78 0.64
Notes: N = 105,750; FARM = Eligibility for free/reduced price lunch; The sample includes all 2011 graduates from Michigan public high schools. College enrollment is defined by the first college in which a student enrolls, during the first year following high school graduation (i.e., summer 2011, fall 2011, spring 2012, summer 2012).
NSC Union of NSC & STARR

Number of credits
Share with > 1 year of credit
Estimated Number of
Credits
Estimated Share with > 1 year of
credit(1) (2) (3) (4)
All studentsAll credits earned 22.25 0.55 23.34 0.63Earned at 4-year 15.17 14.69Earned at 2-year 6.77 8.64
White, non-HispanicAll credits earned 23.43 0.59 23.86 0.66Earned at 4-year 16.01 15.25Earned at 2-year 7.08 8.60
Black, non-HispanicAll credits earned 15.82 0.29 20.73 0.47Earned at 4-year 10.34 11.72Earned at 2-year 5.31 9.01
HispanicAll credits earned 18.68 0.40 21.13 0.51Earned at 4-year 10.26 10.52Earned at 2-year 8.18 10.62
FARMAll credits earned 17.65 0.36 21.21 0.50Earned at 4-year 9.70 10.47Earned at 2-year 7.80 10.74
Non-FARMAll credits earned 24.02 0.62 24.15 0.68Earned at 4-year 17.27 16.32Earned at 2-year 6.37 7.84
STARR NSC
Table 8. Lost in Translation? Using the Federal NSC Formula to Approximate Credit Accumulation at Public Colleges
Notes: The sample is restricted to college-goers from the Michigan high school class of 2011 who attended public colleges in Michigan and had NO missing enrollment intensity information (N = 38,996). College enrollment is defined over the same time horizon as in Table 7.

Table 9. Improving the Translation: Effects on Credit Accumulation of Intensity-based Imputation
LTPT PT FT(1) (2) (3) (4) (5)
All students 0.25Number of credits earned 21.46 19.36 20.90 24.00Share with > 1 year college credit 0.53 0.48 0.48 0.67
White, non-Hispanic 0.25Number of credits earned 22.57 19.75 21.34 24.52Share with > 1 year college credit 0.57 0.50 0.51 0.70
Black, non-Hispanic 0.22Number of credits earned 15.09 17.34 18.66 21.28Share with > 1 year college credit 0.27 0.36 0.36 0.51
Hispanic 0.25Number of credits earned 18.04 17.26 18.76 21.76Share with > 1 year college credit 0.38 0.38 0.39 0.56
FARM 0.25Number of credits earned 16.97 17.25 18.83 21.98Share with > 1 year college credit 0.34 0.37 0.37 0.56
Non-FARM 0.24Number of credits earned 23.23 20.19 21.72 24.80Share with > 1 year college credit 0.60 0.52 0.53 0.71
Notes: The sample is restricted to college-goers from the Michigan high school class of 2011 who attended public colleges in Michigan (N = 54,170). College enrollment is defined over the same time horizon as in Table 7.
NSC: Impute missing values as…STARR
Share of students with missing
enrollment intensity

The Missing Manual: Using National Student Clearinghouse Data to Track Postsecondary Outcomes Appendix Tables Table A1 NSC Coverage Rates of Enrollments at All U.S. Title IV Postsecondary
Institutions Over Time by State and Region Table A2 NSC Coverage Rates of Enrollments at Public 2-Year U.S. Title IV
Postsecondary Institutions Over Time by State and Region Table A3 NSC Coverage Rates of Enrollments at Private, Non-Profit, 2-Year U.S. Title IV
Postsecondary Institutions Over Time by State and Region Table A4 NSC Coverage Rates of Enrollments at Public 4-Year U.S. Title IV
Postsecondary Institutions Over Time by State and Region Table A5 NSC Coverage Rates of Enrollments at Private, Non-Profit, 4-Year U.S. Title IV
Postsecondary Institutions Over Time by State and Region Table A6 NSC Coverage Rates of Enrollments at Private, For-Profit, U.S. Title IV
Postsecondary Institutions Over Time by State and Region Table A7 Comprehensive NSC Coverage Rates at All U.S. Title IV Postsecondary
Institutions Over Time by State
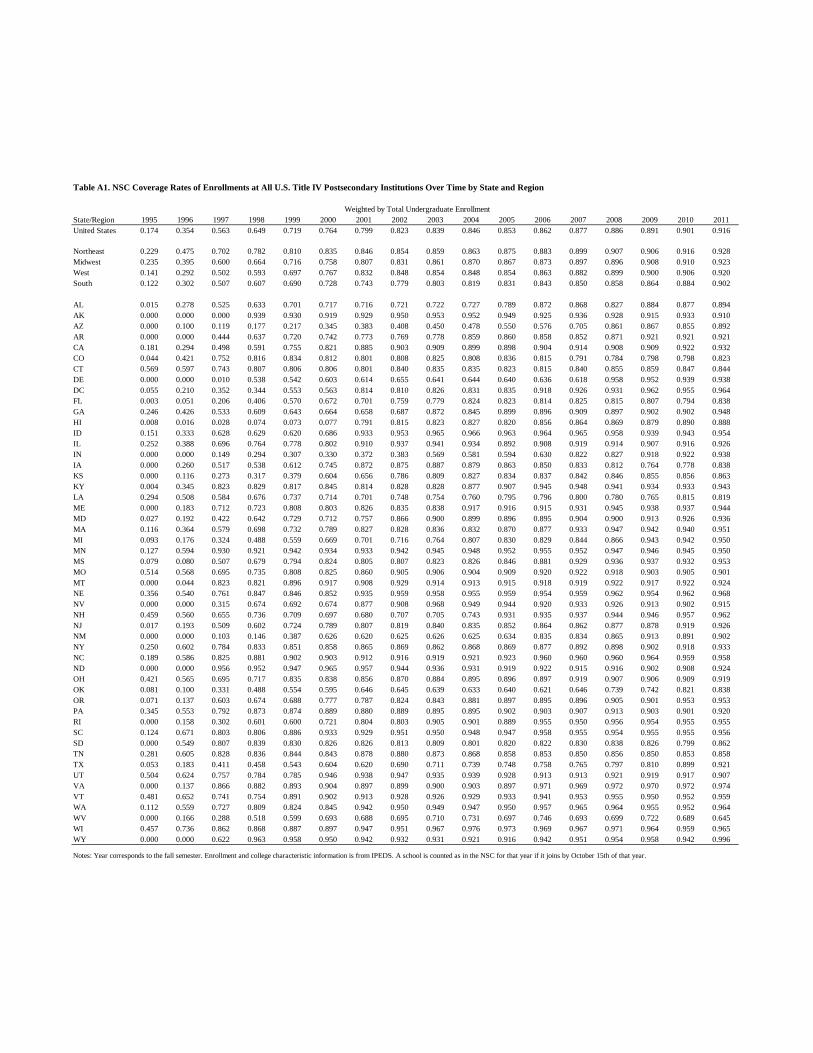
Table A1. NSC Coverage Rates of Enrollments at All U.S. Title IV Postsecondary Institutions Over Time by State and Region
State/Region 1995 1996 1997 1998 1999 2000 2001 2002 2003 2004 2005 2006 2007 2008 2009 2010 2011United States 0.174 0.354 0.563 0.649 0.719 0.764 0.799 0.823 0.839 0.846 0.853 0.862 0.877 0.886 0.891 0.901 0.916
Northeast 0.229 0.475 0.702 0.782 0.810 0.835 0.846 0.854 0.859 0.863 0.875 0.883 0.899 0.907 0.906 0.916 0.928Midwest 0.235 0.395 0.600 0.664 0.716 0.758 0.807 0.831 0.861 0.870 0.867 0.873 0.897 0.896 0.908 0.910 0.923West 0.141 0.292 0.502 0.593 0.697 0.767 0.832 0.848 0.854 0.848 0.854 0.863 0.882 0.899 0.900 0.906 0.920South 0.122 0.302 0.507 0.607 0.690 0.728 0.743 0.779 0.803 0.819 0.831 0.843 0.850 0.858 0.864 0.884 0.902
AL 0.015 0.278 0.525 0.633 0.701 0.717 0.716 0.721 0.722 0.727 0.789 0.872 0.868 0.827 0.884 0.877 0.894AK 0.000 0.000 0.000 0.939 0.930 0.919 0.929 0.950 0.953 0.952 0.949 0.925 0.936 0.928 0.915 0.933 0.910AZ 0.000 0.100 0.119 0.177 0.217 0.345 0.383 0.408 0.450 0.478 0.550 0.576 0.705 0.861 0.867 0.855 0.892AR 0.000 0.000 0.444 0.637 0.720 0.742 0.773 0.769 0.778 0.859 0.860 0.858 0.852 0.871 0.921 0.921 0.921CA 0.181 0.294 0.498 0.591 0.755 0.821 0.885 0.903 0.909 0.899 0.898 0.904 0.914 0.908 0.909 0.922 0.932CO 0.044 0.421 0.752 0.816 0.834 0.812 0.801 0.808 0.825 0.808 0.836 0.815 0.791 0.784 0.798 0.798 0.823CT 0.569 0.597 0.743 0.807 0.806 0.806 0.801 0.840 0.835 0.835 0.823 0.815 0.840 0.855 0.859 0.847 0.844DE 0.000 0.000 0.010 0.538 0.542 0.603 0.614 0.655 0.641 0.644 0.640 0.636 0.618 0.958 0.952 0.939 0.938DC 0.055 0.210 0.352 0.344 0.553 0.563 0.814 0.810 0.826 0.831 0.835 0.918 0.926 0.931 0.962 0.955 0.964FL 0.003 0.051 0.206 0.406 0.570 0.672 0.701 0.759 0.779 0.824 0.823 0.814 0.825 0.815 0.807 0.794 0.838GA 0.246 0.426 0.533 0.609 0.643 0.664 0.658 0.687 0.872 0.845 0.899 0.896 0.909 0.897 0.902 0.902 0.948HI 0.008 0.016 0.028 0.074 0.073 0.077 0.791 0.815 0.823 0.827 0.820 0.856 0.864 0.869 0.879 0.890 0.888ID 0.151 0.333 0.628 0.629 0.620 0.686 0.933 0.953 0.965 0.966 0.963 0.964 0.965 0.958 0.939 0.943 0.954IL 0.252 0.388 0.696 0.764 0.778 0.802 0.910 0.937 0.941 0.934 0.892 0.908 0.919 0.914 0.907 0.916 0.926IN 0.000 0.000 0.149 0.294 0.307 0.330 0.372 0.383 0.569 0.581 0.594 0.630 0.822 0.827 0.918 0.922 0.938IA 0.000 0.260 0.517 0.538 0.612 0.745 0.872 0.875 0.887 0.879 0.863 0.850 0.833 0.812 0.764 0.778 0.838KS 0.000 0.116 0.273 0.317 0.379 0.604 0.656 0.786 0.809 0.827 0.834 0.837 0.842 0.846 0.855 0.856 0.863KY 0.004 0.345 0.823 0.829 0.817 0.845 0.814 0.828 0.828 0.877 0.907 0.945 0.948 0.941 0.934 0.933 0.943LA 0.294 0.508 0.584 0.676 0.737 0.714 0.701 0.748 0.754 0.760 0.795 0.796 0.800 0.780 0.765 0.815 0.819ME 0.000 0.183 0.712 0.723 0.808 0.803 0.826 0.835 0.838 0.917 0.916 0.915 0.931 0.945 0.938 0.937 0.944MD 0.027 0.192 0.422 0.642 0.729 0.712 0.757 0.866 0.900 0.899 0.896 0.895 0.904 0.900 0.913 0.926 0.936MA 0.116 0.364 0.579 0.698 0.732 0.789 0.827 0.828 0.836 0.832 0.870 0.877 0.933 0.947 0.942 0.940 0.951MI 0.093 0.176 0.324 0.488 0.559 0.669 0.701 0.716 0.764 0.807 0.830 0.829 0.844 0.866 0.943 0.942 0.950MN 0.127 0.594 0.930 0.921 0.942 0.934 0.933 0.942 0.945 0.948 0.952 0.955 0.952 0.947 0.946 0.945 0.950MS 0.079 0.080 0.507 0.679 0.794 0.824 0.805 0.807 0.823 0.826 0.846 0.881 0.929 0.936 0.937 0.932 0.953MO 0.514 0.568 0.695 0.735 0.808 0.825 0.860 0.905 0.906 0.904 0.909 0.920 0.922 0.918 0.903 0.905 0.901MT 0.000 0.044 0.823 0.821 0.896 0.917 0.908 0.929 0.914 0.913 0.915 0.918 0.919 0.922 0.917 0.922 0.924NE 0.356 0.540 0.761 0.847 0.846 0.852 0.935 0.959 0.958 0.955 0.959 0.954 0.959 0.962 0.954 0.962 0.968NV 0.000 0.000 0.315 0.674 0.692 0.674 0.877 0.908 0.968 0.949 0.944 0.920 0.933 0.926 0.913 0.902 0.915NH 0.459 0.560 0.655 0.736 0.709 0.697 0.680 0.707 0.705 0.743 0.931 0.935 0.937 0.944 0.946 0.957 0.962NJ 0.017 0.193 0.509 0.602 0.724 0.789 0.807 0.819 0.840 0.835 0.852 0.864 0.862 0.877 0.878 0.919 0.926NM 0.000 0.000 0.103 0.146 0.387 0.626 0.620 0.625 0.626 0.625 0.634 0.835 0.834 0.865 0.913 0.891 0.902NY 0.250 0.602 0.784 0.833 0.851 0.858 0.865 0.869 0.862 0.868 0.869 0.877 0.892 0.898 0.902 0.918 0.933NC 0.189 0.586 0.825 0.881 0.902 0.903 0.912 0.916 0.919 0.921 0.923 0.960 0.960 0.960 0.964 0.959 0.958ND 0.000 0.000 0.956 0.952 0.947 0.965 0.957 0.944 0.936 0.931 0.919 0.922 0.915 0.916 0.902 0.908 0.924OH 0.421 0.565 0.695 0.717 0.835 0.838 0.856 0.870 0.884 0.895 0.896 0.897 0.919 0.907 0.906 0.909 0.919OK 0.081 0.100 0.331 0.488 0.554 0.595 0.646 0.645 0.639 0.633 0.640 0.621 0.646 0.739 0.742 0.821 0.838OR 0.071 0.137 0.603 0.674 0.688 0.777 0.787 0.824 0.843 0.881 0.897 0.895 0.896 0.905 0.901 0.953 0.953PA 0.345 0.553 0.792 0.873 0.874 0.889 0.880 0.889 0.895 0.895 0.902 0.903 0.907 0.913 0.903 0.901 0.920RI 0.000 0.158 0.302 0.601 0.600 0.721 0.804 0.803 0.905 0.901 0.889 0.955 0.950 0.956 0.954 0.955 0.955SC 0.124 0.671 0.803 0.806 0.886 0.933 0.929 0.951 0.950 0.948 0.947 0.958 0.955 0.954 0.955 0.955 0.956SD 0.000 0.549 0.807 0.839 0.830 0.826 0.826 0.813 0.809 0.801 0.820 0.822 0.830 0.838 0.826 0.799 0.862TN 0.281 0.605 0.828 0.836 0.844 0.843 0.878 0.880 0.873 0.868 0.858 0.853 0.850 0.856 0.850 0.853 0.858TX 0.053 0.183 0.411 0.458 0.543 0.604 0.620 0.690 0.711 0.739 0.748 0.758 0.765 0.797 0.810 0.899 0.921UT 0.504 0.624 0.757 0.784 0.785 0.946 0.938 0.947 0.935 0.939 0.928 0.913 0.913 0.921 0.919 0.917 0.907VA 0.000 0.137 0.866 0.882 0.893 0.904 0.897 0.899 0.900 0.903 0.897 0.971 0.969 0.972 0.970 0.972 0.974VT 0.481 0.652 0.741 0.754 0.891 0.902 0.913 0.928 0.926 0.929 0.933 0.941 0.953 0.955 0.950 0.952 0.959WA 0.112 0.559 0.727 0.809 0.824 0.845 0.942 0.950 0.949 0.947 0.950 0.957 0.965 0.964 0.955 0.952 0.964WV 0.000 0.166 0.288 0.518 0.599 0.693 0.688 0.695 0.710 0.731 0.697 0.746 0.693 0.699 0.722 0.689 0.645WI 0.457 0.736 0.862 0.868 0.887 0.897 0.947 0.951 0.967 0.976 0.973 0.969 0.967 0.971 0.964 0.959 0.965WY 0.000 0.000 0.622 0.963 0.958 0.950 0.942 0.932 0.931 0.921 0.916 0.942 0.951 0.954 0.958 0.942 0.996
Weighted by Total Undergraduate Enrollment
Notes: Year corresponds to the fall semester. Enrollment and college characteristic information is from IPEDS. A school is counted as in the NSC for that year if it joins by October 15th of that year.

Table A2. NSC Coverage Rates of Enrollments at Public 2-Year U.S. Title IV Postsecondary Institutions Over Time by State and Region
State/Region 1995 1996 1997 1998 1999 2000 2001 2002 2003 2004 2005 2006 2007 2008 2009 2010 2011United States 0.081 0.229 0.477 0.576 0.695 0.759 0.805 0.827 0.855 0.861 0.874 0.888 0.902 0.922 0.929 0.955 0.960
Northeast 0.213 0.446 0.766 0.880 0.876 0.914 0.933 0.935 0.934 0.944 0.979 0.980 0.989 0.992 0.992 0.993 0.993Midwest 0.112 0.282 0.569 0.650 0.750 0.793 0.871 0.904 0.943 0.949 0.954 0.956 0.966 0.970 0.974 0.975 0.976West 0.030 0.182 0.401 0.519 0.682 0.769 0.837 0.850 0.854 0.844 0.852 0.869 0.892 0.924 0.936 0.956 0.962South 0.062 0.163 0.394 0.477 0.604 0.670 0.681 0.715 0.770 0.791 0.807 0.830 0.839 0.864 0.870 0.928 0.934
AL 0.000 0.000 0.232 0.316 0.341 0.374 0.405 0.415 0.419 0.417 0.506 0.730 0.729 0.831 0.832 0.846 0.907AK 0.000 0.000 0.000 0.727 0.553 0.613 0.610 0.627 0.538 0.619 0.564 0.386 0.466 0.423 0.362 0.335 0.473AZ 0.000 0.000 0.000 0.000 0.039 0.044 0.053 0.051 0.084 0.077 0.124 0.153 0.369 0.750 0.752 0.763 0.835AR 0.000 0.000 0.239 0.479 0.494 0.549 0.635 0.634 0.671 0.742 0.747 0.746 0.735 0.789 0.925 0.924 0.925CA 0.041 0.161 0.368 0.491 0.742 0.840 0.927 0.944 0.949 0.938 0.941 0.946 0.949 0.941 0.956 0.982 0.982CO 0.000 0.167 0.757 0.910 0.909 0.872 0.836 0.838 0.896 0.911 0.927 0.938 0.924 0.943 0.960 0.957 0.953CT 1.000 1.000 1.000 1.000 1.000 1.000 1.000 1.000 1.000 1.000 1.000 1.000 1.000 1.000 1.000 0.999 0.999DE 0.000 0.000 0.000 0.000 0.000 0.000 0.000 0.000 0.000 0.000 0.000 0.000 0.000 1.000 1.000 1.000 1.000DC 0.000 0.000 0.000 0.000 0.000 0.000 0.000 0.000 0.000 0.000 0.000 0.000 0.000 0.000 0.000 0.000 0.000FL 0.000 0.000 0.161 0.317 0.543 0.689 0.729 0.832 0.877 0.899 0.900 0.886 0.875 0.886 0.842 0.785 0.712GA 0.222 0.201 0.226 0.284 0.319 0.315 0.300 0.342 0.895 0.873 0.918 0.914 0.934 0.932 0.972 0.989 0.999HI 0.000 0.000 0.000 0.000 0.000 0.000 0.952 1.000 1.000 1.000 1.000 1.000 1.000 1.000 1.000 1.000 1.000ID 0.000 0.000 0.532 0.536 0.545 0.941 0.945 0.939 1.000 1.000 1.000 1.000 1.000 1.000 1.000 1.000 1.000IL 0.093 0.233 0.622 0.712 0.730 0.761 0.958 0.987 1.000 0.999 0.999 0.999 1.000 1.000 0.999 0.999 0.999IN 0.000 0.000 0.208 0.983 0.986 0.996 0.998 0.998 0.997 0.998 0.998 0.998 0.998 0.998 0.998 0.999 0.999IA 0.000 0.345 0.674 0.684 0.843 0.927 0.926 0.932 1.000 1.000 1.000 1.000 1.000 1.000 1.000 1.000 1.000KS 0.000 0.000 0.197 0.215 0.213 0.301 0.424 0.700 0.736 0.781 0.787 0.793 0.808 0.821 0.871 0.869 0.865KY 0.000 0.000 0.752 0.730 0.676 0.719 0.662 0.697 0.697 0.830 0.902 1.000 1.000 1.000 1.000 1.000 1.000LA 0.434 0.419 0.561 0.525 0.577 0.537 0.499 0.572 0.487 0.496 0.293 0.428 0.488 0.478 0.471 0.646 0.665ME 0.000 0.000 0.722 0.702 0.697 0.696 0.691 0.695 0.704 0.890 0.898 0.891 0.973 0.978 0.977 0.967 0.972MD 0.026 0.028 0.387 0.664 0.736 0.680 0.681 0.894 0.969 0.969 0.969 0.969 0.969 0.969 1.000 1.000 1.000MA 0.000 0.211 0.439 0.734 0.731 0.884 0.911 0.912 0.911 0.905 0.995 0.996 0.997 0.998 0.998 0.998 0.998MI 0.064 0.211 0.382 0.467 0.562 0.702 0.745 0.776 0.900 0.899 0.902 0.901 0.924 0.944 0.949 0.950 0.951MN 0.000 0.271 0.976 0.974 0.977 0.967 0.966 0.974 0.976 0.990 0.992 0.998 0.998 0.998 0.998 0.998 1.000MS 0.000 0.000 0.495 0.619 0.771 0.833 0.796 0.804 0.795 0.796 0.791 0.862 0.925 0.922 0.928 0.924 0.959MO 0.421 0.503 0.640 0.693 0.867 0.916 0.910 0.934 0.933 0.937 0.950 0.985 0.986 0.985 0.986 0.987 0.987MT 0.000 0.275 0.605 0.600 0.684 0.775 0.848 0.834 0.778 0.795 0.810 0.811 0.819 0.828 0.832 0.829 0.809NE 0.007 0.387 0.703 0.935 0.936 0.930 0.933 0.993 0.990 0.990 0.997 0.997 0.998 0.998 0.997 0.996 0.997NV 0.000 0.000 0.287 0.889 0.896 0.886 0.890 0.898 1.000 1.000 1.000 1.000 1.000 1.000 1.000 1.000 1.000NH 0.000 0.000 0.000 0.000 0.000 0.000 0.000 0.000 0.000 0.172 1.000 1.000 1.000 1.000 1.000 1.000 1.000NJ 0.000 0.189 0.706 0.838 0.839 0.917 0.939 0.939 0.939 0.937 0.981 0.981 0.981 0.994 0.994 0.996 0.995NM 0.000 0.000 0.067 0.141 0.260 0.477 0.460 0.455 0.457 0.463 0.483 0.845 0.843 0.891 0.949 0.946 0.959NY 0.200 0.603 0.898 0.909 0.909 0.922 0.955 0.965 0.960 0.968 0.966 0.969 0.985 0.985 0.984 0.986 0.987NC 0.000 0.467 0.875 0.879 0.908 0.909 0.912 0.914 0.916 0.915 0.914 0.997 0.997 0.997 0.997 0.998 0.998ND 0.000 0.000 0.863 0.852 0.850 0.906 0.877 0.930 0.919 0.949 0.952 0.954 0.955 0.942 0.913 0.938 0.970OH 0.160 0.297 0.446 0.480 0.822 0.830 0.856 0.846 0.889 0.884 0.910 0.903 0.947 0.938 0.942 0.946 0.949OK 0.000 0.000 0.213 0.415 0.475 0.537 0.544 0.544 0.554 0.517 0.521 0.485 0.500 0.744 0.755 0.757 0.755OR 0.000 0.118 0.659 0.734 0.742 0.746 0.766 0.838 0.853 0.882 0.909 0.907 0.906 0.916 0.917 1.000 0.989PA 0.418 0.498 0.841 0.975 0.977 0.971 0.969 0.976 0.980 0.982 0.986 0.988 0.997 0.997 0.997 0.997 0.998RI 0.000 0.000 0.000 1.000 1.000 1.000 1.000 1.000 1.000 1.000 1.000 1.000 1.000 1.000 1.000 1.000 1.000SC 0.017 0.548 0.776 0.772 0.926 0.981 0.979 0.980 0.981 0.982 0.982 0.983 0.981 0.974 0.989 0.990 0.984SD 0.000 0.000 0.368 0.771 0.768 0.768 0.784 0.788 0.794 0.795 0.801 0.800 0.812 0.813 0.799 0.787 0.958TN 0.000 0.496 0.809 0.799 0.797 0.783 0.880 0.884 0.887 0.894 0.881 0.889 0.888 0.890 0.876 0.891 0.897TX 0.000 0.052 0.275 0.309 0.453 0.576 0.593 0.585 0.635 0.686 0.713 0.728 0.743 0.756 0.760 0.941 0.946UT 0.138 0.141 0.195 0.227 0.245 0.931 0.891 0.901 0.875 0.866 0.823 0.788 0.761 0.786 0.807 0.798 0.777VA 0.000 0.000 1.000 1.000 1.000 1.000 1.000 1.000 1.000 0.997 0.995 0.999 0.999 0.999 0.999 0.999 0.999VT 0.523 0.619 0.662 0.677 0.949 0.950 0.949 0.950 0.952 0.951 0.972 0.983 0.983 0.988 0.989 0.997 0.998WA 0.011 0.649 0.870 0.996 0.997 0.997 0.997 0.996 0.997 0.997 0.997 0.997 1.000 1.000 1.000 1.000 1.000WV 0.000 0.000 0.000 0.280 0.289 0.283 0.331 0.306 0.470 0.548 0.400 0.447 0.555 0.573 0.755 0.770 0.781WI 0.288 0.672 0.841 0.788 0.833 0.859 0.926 0.932 0.973 0.996 0.996 0.995 0.994 0.995 0.995 1.000 1.000WY 0.000 0.000 0.475 1.000 1.000 0.999 0.999 0.999 1.000 1.000 0.999 0.999 1.000 1.000 1.000 1.000 1.000
Weighted by Total Undergraduate Enrollment
Notes: Year corresponds to the fall semester. Enrollment and college characteristic information is from IPEDS. A school is counted as in the NSC for that year if it joins by October 15th of that year.
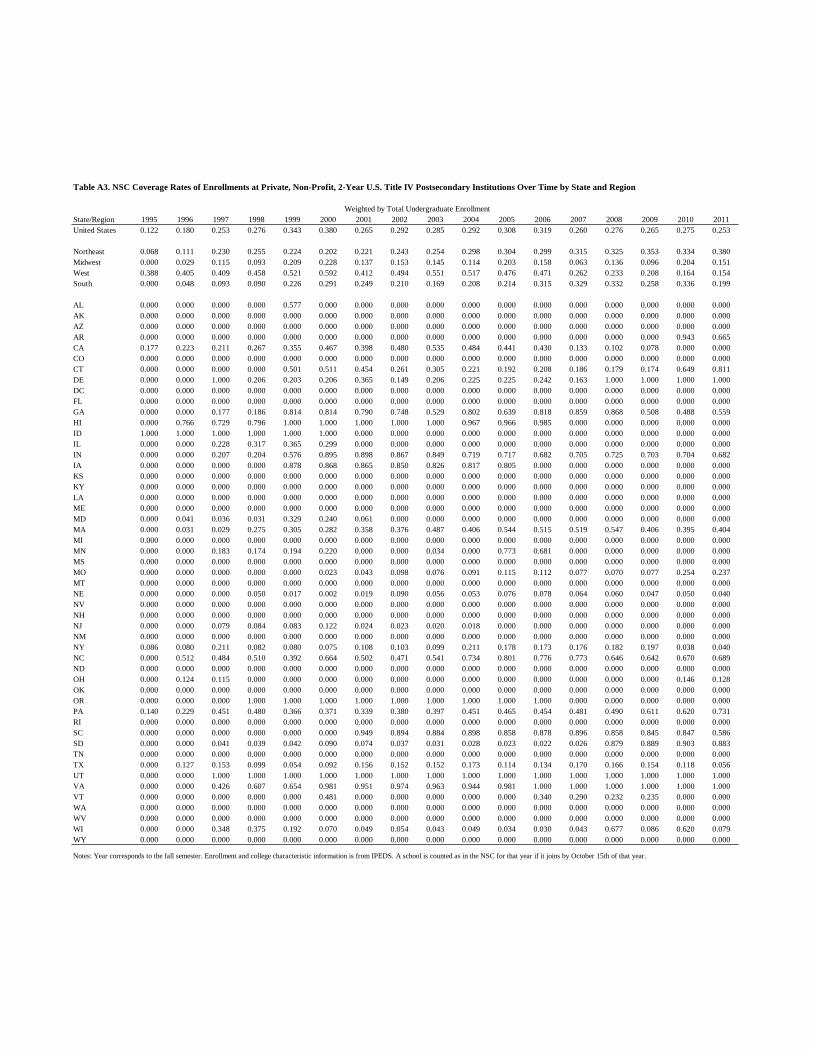
Table A3. NSC Coverage Rates of Enrollments at Private, Non-Profit, 2-Year U.S. Title IV Postsecondary Institutions Over Time by State and Region
State/Region 1995 1996 1997 1998 1999 2000 2001 2002 2003 2004 2005 2006 2007 2008 2009 2010 2011United States 0.122 0.180 0.253 0.276 0.343 0.380 0.265 0.292 0.285 0.292 0.308 0.319 0.260 0.276 0.265 0.275 0.253
Northeast 0.068 0.111 0.230 0.255 0.224 0.202 0.221 0.243 0.254 0.298 0.304 0.299 0.315 0.325 0.353 0.334 0.380Midwest 0.000 0.029 0.115 0.093 0.209 0.228 0.137 0.153 0.145 0.114 0.203 0.158 0.063 0.136 0.096 0.204 0.151West 0.388 0.405 0.409 0.458 0.521 0.592 0.412 0.494 0.551 0.517 0.476 0.471 0.262 0.233 0.208 0.164 0.154South 0.000 0.048 0.093 0.090 0.226 0.291 0.249 0.210 0.169 0.208 0.214 0.315 0.329 0.332 0.258 0.336 0.199
AL 0.000 0.000 0.000 0.000 0.577 0.000 0.000 0.000 0.000 0.000 0.000 0.000 0.000 0.000 0.000 0.000 0.000AK 0.000 0.000 0.000 0.000 0.000 0.000 0.000 0.000 0.000 0.000 0.000 0.000 0.000 0.000 0.000 0.000 0.000AZ 0.000 0.000 0.000 0.000 0.000 0.000 0.000 0.000 0.000 0.000 0.000 0.000 0.000 0.000 0.000 0.000 0.000AR 0.000 0.000 0.000 0.000 0.000 0.000 0.000 0.000 0.000 0.000 0.000 0.000 0.000 0.000 0.000 0.943 0.665CA 0.177 0.223 0.211 0.267 0.355 0.467 0.398 0.480 0.535 0.484 0.441 0.430 0.133 0.102 0.078 0.000 0.000CO 0.000 0.000 0.000 0.000 0.000 0.000 0.000 0.000 0.000 0.000 0.000 0.000 0.000 0.000 0.000 0.000 0.000CT 0.000 0.000 0.000 0.000 0.501 0.511 0.454 0.261 0.305 0.221 0.192 0.208 0.186 0.179 0.174 0.649 0.811DE 0.000 0.000 1.000 0.206 0.203 0.206 0.365 0.149 0.206 0.225 0.225 0.242 0.163 1.000 1.000 1.000 1.000DC 0.000 0.000 0.000 0.000 0.000 0.000 0.000 0.000 0.000 0.000 0.000 0.000 0.000 0.000 0.000 0.000 0.000FL 0.000 0.000 0.000 0.000 0.000 0.000 0.000 0.000 0.000 0.000 0.000 0.000 0.000 0.000 0.000 0.000 0.000GA 0.000 0.000 0.177 0.186 0.814 0.814 0.790 0.748 0.529 0.802 0.639 0.818 0.859 0.868 0.508 0.488 0.559HI 0.000 0.766 0.729 0.796 1.000 1.000 1.000 1.000 1.000 0.967 0.966 0.985 0.000 0.000 0.000 0.000 0.000ID 1.000 1.000 1.000 1.000 1.000 1.000 0.000 0.000 0.000 0.000 0.000 0.000 0.000 0.000 0.000 0.000 0.000IL 0.000 0.000 0.228 0.317 0.365 0.299 0.000 0.000 0.000 0.000 0.000 0.000 0.000 0.000 0.000 0.000 0.000IN 0.000 0.000 0.207 0.204 0.576 0.895 0.898 0.867 0.849 0.719 0.717 0.682 0.705 0.725 0.703 0.704 0.682IA 0.000 0.000 0.000 0.000 0.878 0.868 0.865 0.850 0.826 0.817 0.805 0.000 0.000 0.000 0.000 0.000 0.000KS 0.000 0.000 0.000 0.000 0.000 0.000 0.000 0.000 0.000 0.000 0.000 0.000 0.000 0.000 0.000 0.000 0.000KY 0.000 0.000 0.000 0.000 0.000 0.000 0.000 0.000 0.000 0.000 0.000 0.000 0.000 0.000 0.000 0.000 0.000LA 0.000 0.000 0.000 0.000 0.000 0.000 0.000 0.000 0.000 0.000 0.000 0.000 0.000 0.000 0.000 0.000 0.000ME 0.000 0.000 0.000 0.000 0.000 0.000 0.000 0.000 0.000 0.000 0.000 0.000 0.000 0.000 0.000 0.000 0.000MD 0.000 0.041 0.036 0.031 0.329 0.240 0.061 0.000 0.000 0.000 0.000 0.000 0.000 0.000 0.000 0.000 0.000MA 0.000 0.031 0.029 0.275 0.305 0.282 0.358 0.376 0.487 0.406 0.544 0.515 0.519 0.547 0.406 0.395 0.404MI 0.000 0.000 0.000 0.000 0.000 0.000 0.000 0.000 0.000 0.000 0.000 0.000 0.000 0.000 0.000 0.000 0.000MN 0.000 0.000 0.183 0.174 0.194 0.220 0.000 0.000 0.034 0.000 0.773 0.681 0.000 0.000 0.000 0.000 0.000MS 0.000 0.000 0.000 0.000 0.000 0.000 0.000 0.000 0.000 0.000 0.000 0.000 0.000 0.000 0.000 0.000 0.000MO 0.000 0.000 0.000 0.000 0.000 0.023 0.043 0.098 0.076 0.091 0.115 0.112 0.077 0.070 0.077 0.254 0.237MT 0.000 0.000 0.000 0.000 0.000 0.000 0.000 0.000 0.000 0.000 0.000 0.000 0.000 0.000 0.000 0.000 0.000NE 0.000 0.000 0.000 0.050 0.017 0.002 0.019 0.090 0.056 0.053 0.076 0.078 0.064 0.060 0.047 0.050 0.040NV 0.000 0.000 0.000 0.000 0.000 0.000 0.000 0.000 0.000 0.000 0.000 0.000 0.000 0.000 0.000 0.000 0.000NH 0.000 0.000 0.000 0.000 0.000 0.000 0.000 0.000 0.000 0.000 0.000 0.000 0.000 0.000 0.000 0.000 0.000NJ 0.000 0.000 0.079 0.084 0.083 0.122 0.024 0.023 0.020 0.018 0.000 0.000 0.000 0.000 0.000 0.000 0.000NM 0.000 0.000 0.000 0.000 0.000 0.000 0.000 0.000 0.000 0.000 0.000 0.000 0.000 0.000 0.000 0.000 0.000NY 0.086 0.080 0.211 0.082 0.080 0.075 0.108 0.103 0.099 0.211 0.178 0.173 0.176 0.182 0.197 0.038 0.040NC 0.000 0.512 0.484 0.510 0.392 0.664 0.502 0.471 0.541 0.734 0.801 0.776 0.773 0.646 0.642 0.670 0.689ND 0.000 0.000 0.000 0.000 0.000 0.000 0.000 0.000 0.000 0.000 0.000 0.000 0.000 0.000 0.000 0.000 0.000OH 0.000 0.124 0.115 0.000 0.000 0.000 0.000 0.000 0.000 0.000 0.000 0.000 0.000 0.000 0.000 0.146 0.128OK 0.000 0.000 0.000 0.000 0.000 0.000 0.000 0.000 0.000 0.000 0.000 0.000 0.000 0.000 0.000 0.000 0.000OR 0.000 0.000 0.000 1.000 1.000 1.000 1.000 1.000 1.000 1.000 1.000 1.000 0.000 0.000 0.000 0.000 0.000PA 0.140 0.229 0.451 0.480 0.366 0.371 0.339 0.380 0.397 0.451 0.465 0.454 0.481 0.490 0.611 0.620 0.731RI 0.000 0.000 0.000 0.000 0.000 0.000 0.000 0.000 0.000 0.000 0.000 0.000 0.000 0.000 0.000 0.000 0.000SC 0.000 0.000 0.000 0.000 0.000 0.000 0.949 0.894 0.884 0.898 0.858 0.878 0.896 0.858 0.845 0.847 0.586SD 0.000 0.000 0.041 0.039 0.042 0.090 0.074 0.037 0.031 0.028 0.023 0.022 0.026 0.879 0.889 0.903 0.883TN 0.000 0.000 0.000 0.000 0.000 0.000 0.000 0.000 0.000 0.000 0.000 0.000 0.000 0.000 0.000 0.000 0.000TX 0.000 0.127 0.153 0.099 0.054 0.092 0.156 0.152 0.152 0.173 0.114 0.134 0.170 0.166 0.154 0.118 0.056UT 0.000 0.000 1.000 1.000 1.000 1.000 1.000 1.000 1.000 1.000 1.000 1.000 1.000 1.000 1.000 1.000 1.000VA 0.000 0.000 0.426 0.607 0.654 0.981 0.951 0.974 0.963 0.944 0.981 1.000 1.000 1.000 1.000 1.000 1.000VT 0.000 0.000 0.000 0.000 0.000 0.481 0.000 0.000 0.000 0.000 0.000 0.340 0.290 0.232 0.235 0.000 0.000WA 0.000 0.000 0.000 0.000 0.000 0.000 0.000 0.000 0.000 0.000 0.000 0.000 0.000 0.000 0.000 0.000 0.000WV 0.000 0.000 0.000 0.000 0.000 0.000 0.000 0.000 0.000 0.000 0.000 0.000 0.000 0.000 0.000 0.000 0.000WI 0.000 0.000 0.348 0.375 0.192 0.070 0.049 0.054 0.043 0.049 0.034 0.030 0.043 0.677 0.086 0.620 0.079WY 0.000 0.000 0.000 0.000 0.000 0.000 0.000 0.000 0.000 0.000 0.000 0.000 0.000 0.000 0.000 0.000 0.000
Weighted by Total Undergraduate Enrollment
Notes: Year corresponds to the fall semester. Enrollment and college characteristic information is from IPEDS. A school is counted as in the NSC for that year if it joins by October 15th of that year.
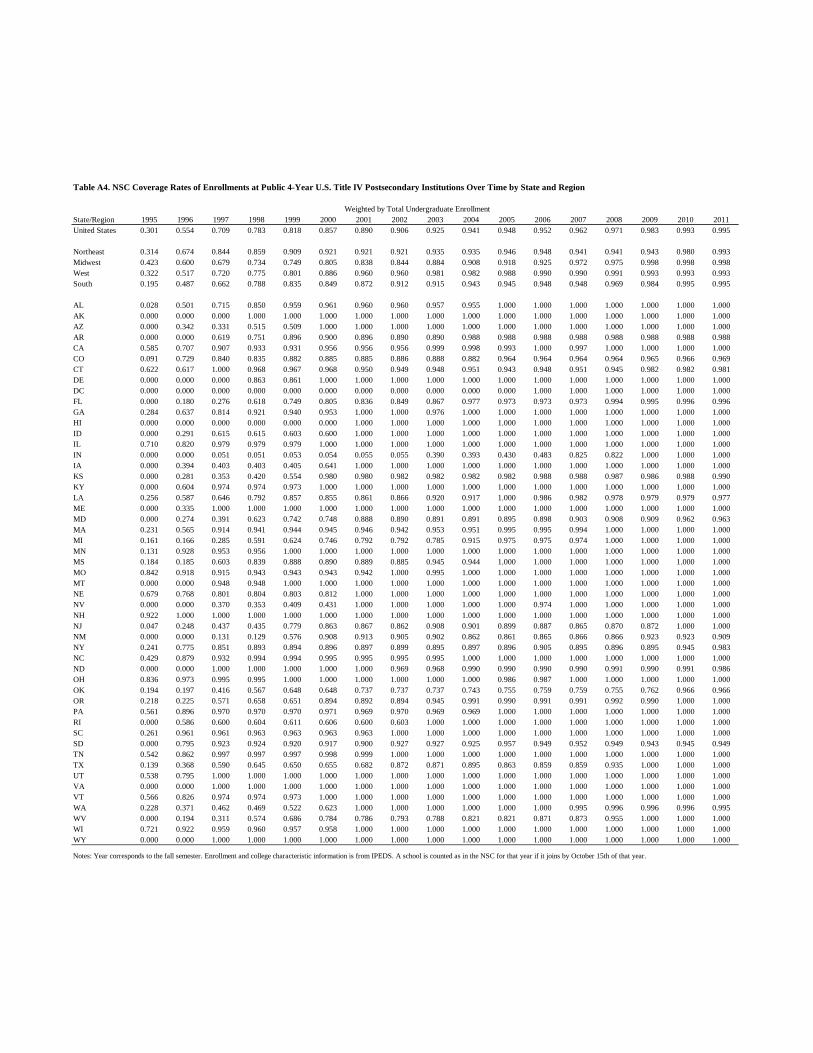
Table A4. NSC Coverage Rates of Enrollments at Public 4-Year U.S. Title IV Postsecondary Institutions Over Time by State and Region
State/Region 1995 1996 1997 1998 1999 2000 2001 2002 2003 2004 2005 2006 2007 2008 2009 2010 2011United States 0.301 0.554 0.709 0.783 0.818 0.857 0.890 0.906 0.925 0.941 0.948 0.952 0.962 0.971 0.983 0.993 0.995
Northeast 0.314 0.674 0.844 0.859 0.909 0.921 0.921 0.921 0.935 0.935 0.946 0.948 0.941 0.941 0.943 0.980 0.993Midwest 0.423 0.600 0.679 0.734 0.749 0.805 0.838 0.844 0.884 0.908 0.918 0.925 0.972 0.975 0.998 0.998 0.998West 0.322 0.517 0.720 0.775 0.801 0.886 0.960 0.960 0.981 0.982 0.988 0.990 0.990 0.991 0.993 0.993 0.993South 0.195 0.487 0.662 0.788 0.835 0.849 0.872 0.912 0.915 0.943 0.945 0.948 0.948 0.969 0.984 0.995 0.995
AL 0.028 0.501 0.715 0.850 0.959 0.961 0.960 0.960 0.957 0.955 1.000 1.000 1.000 1.000 1.000 1.000 1.000AK 0.000 0.000 0.000 1.000 1.000 1.000 1.000 1.000 1.000 1.000 1.000 1.000 1.000 1.000 1.000 1.000 1.000AZ 0.000 0.342 0.331 0.515 0.509 1.000 1.000 1.000 1.000 1.000 1.000 1.000 1.000 1.000 1.000 1.000 1.000AR 0.000 0.000 0.619 0.751 0.896 0.900 0.896 0.890 0.890 0.988 0.988 0.988 0.988 0.988 0.988 0.988 0.988CA 0.585 0.707 0.907 0.933 0.931 0.956 0.956 0.956 0.999 0.998 0.993 1.000 0.997 1.000 1.000 1.000 1.000CO 0.091 0.729 0.840 0.835 0.882 0.885 0.885 0.886 0.888 0.882 0.964 0.964 0.964 0.964 0.965 0.966 0.969CT 0.622 0.617 1.000 0.968 0.967 0.968 0.950 0.949 0.948 0.951 0.943 0.948 0.951 0.945 0.982 0.982 0.981DE 0.000 0.000 0.000 0.863 0.861 1.000 1.000 1.000 1.000 1.000 1.000 1.000 1.000 1.000 1.000 1.000 1.000DC 0.000 0.000 0.000 0.000 0.000 0.000 0.000 0.000 0.000 0.000 0.000 1.000 1.000 1.000 1.000 1.000 1.000FL 0.000 0.180 0.276 0.618 0.749 0.805 0.836 0.849 0.867 0.977 0.973 0.973 0.973 0.994 0.995 0.996 0.996GA 0.284 0.637 0.814 0.921 0.940 0.953 1.000 1.000 0.976 1.000 1.000 1.000 1.000 1.000 1.000 1.000 1.000HI 0.000 0.000 0.000 0.000 0.000 0.000 1.000 1.000 1.000 1.000 1.000 1.000 1.000 1.000 1.000 1.000 1.000ID 0.000 0.291 0.615 0.615 0.603 0.600 1.000 1.000 1.000 1.000 1.000 1.000 1.000 1.000 1.000 1.000 1.000IL 0.710 0.820 0.979 0.979 0.979 1.000 1.000 1.000 1.000 1.000 1.000 1.000 1.000 1.000 1.000 1.000 1.000IN 0.000 0.000 0.051 0.051 0.053 0.054 0.055 0.055 0.390 0.393 0.430 0.483 0.825 0.822 1.000 1.000 1.000IA 0.000 0.394 0.403 0.403 0.405 0.641 1.000 1.000 1.000 1.000 1.000 1.000 1.000 1.000 1.000 1.000 1.000KS 0.000 0.281 0.353 0.420 0.554 0.980 0.980 0.982 0.982 0.982 0.982 0.988 0.988 0.987 0.986 0.988 0.990KY 0.000 0.604 0.974 0.974 0.973 1.000 1.000 1.000 1.000 1.000 1.000 1.000 1.000 1.000 1.000 1.000 1.000LA 0.256 0.587 0.646 0.792 0.857 0.855 0.861 0.866 0.920 0.917 1.000 0.986 0.982 0.978 0.979 0.979 0.977ME 0.000 0.335 1.000 1.000 1.000 1.000 1.000 1.000 1.000 1.000 1.000 1.000 1.000 1.000 1.000 1.000 1.000MD 0.000 0.274 0.391 0.623 0.742 0.748 0.888 0.890 0.891 0.891 0.895 0.898 0.903 0.908 0.909 0.962 0.963MA 0.231 0.565 0.914 0.941 0.944 0.945 0.946 0.942 0.953 0.951 0.995 0.995 0.994 1.000 1.000 1.000 1.000MI 0.161 0.166 0.285 0.591 0.624 0.746 0.792 0.792 0.785 0.915 0.975 0.975 0.974 1.000 1.000 1.000 1.000MN 0.131 0.928 0.953 0.956 1.000 1.000 1.000 1.000 1.000 1.000 1.000 1.000 1.000 1.000 1.000 1.000 1.000MS 0.184 0.185 0.603 0.839 0.888 0.890 0.889 0.885 0.945 0.944 1.000 1.000 1.000 1.000 1.000 1.000 1.000MO 0.842 0.918 0.915 0.943 0.943 0.943 0.942 1.000 0.995 1.000 1.000 1.000 1.000 1.000 1.000 1.000 1.000MT 0.000 0.000 0.948 0.948 1.000 1.000 1.000 1.000 1.000 1.000 1.000 1.000 1.000 1.000 1.000 1.000 1.000NE 0.679 0.768 0.801 0.804 0.803 0.812 1.000 1.000 1.000 1.000 1.000 1.000 1.000 1.000 1.000 1.000 1.000NV 0.000 0.000 0.370 0.353 0.409 0.431 1.000 1.000 1.000 1.000 1.000 0.974 1.000 1.000 1.000 1.000 1.000NH 0.922 1.000 1.000 1.000 1.000 1.000 1.000 1.000 1.000 1.000 1.000 1.000 1.000 1.000 1.000 1.000 1.000NJ 0.047 0.248 0.437 0.435 0.779 0.863 0.867 0.862 0.908 0.901 0.899 0.887 0.865 0.870 0.872 1.000 1.000NM 0.000 0.000 0.131 0.129 0.576 0.908 0.913 0.905 0.902 0.862 0.861 0.865 0.866 0.866 0.923 0.923 0.909NY 0.241 0.775 0.851 0.893 0.894 0.896 0.897 0.899 0.895 0.897 0.896 0.905 0.895 0.896 0.895 0.945 0.983NC 0.429 0.879 0.932 0.994 0.994 0.995 0.995 0.995 0.995 1.000 1.000 1.000 1.000 1.000 1.000 1.000 1.000ND 0.000 0.000 1.000 1.000 1.000 1.000 1.000 0.969 0.968 0.990 0.990 0.990 0.990 0.991 0.990 0.991 0.986OH 0.836 0.973 0.995 0.995 1.000 1.000 1.000 1.000 1.000 1.000 0.986 0.987 1.000 1.000 1.000 1.000 1.000OK 0.194 0.197 0.416 0.567 0.648 0.648 0.737 0.737 0.737 0.743 0.755 0.759 0.759 0.755 0.762 0.966 0.966OR 0.218 0.225 0.571 0.658 0.651 0.894 0.892 0.894 0.945 0.991 0.990 0.991 0.991 0.992 0.990 1.000 1.000PA 0.561 0.896 0.970 0.970 0.970 0.971 0.969 0.970 0.969 0.969 1.000 1.000 1.000 1.000 1.000 1.000 1.000RI 0.000 0.586 0.600 0.604 0.611 0.606 0.600 0.603 1.000 1.000 1.000 1.000 1.000 1.000 1.000 1.000 1.000SC 0.261 0.961 0.961 0.963 0.963 0.963 0.963 1.000 1.000 1.000 1.000 1.000 1.000 1.000 1.000 1.000 1.000SD 0.000 0.795 0.923 0.924 0.920 0.917 0.900 0.927 0.927 0.925 0.957 0.949 0.952 0.949 0.943 0.945 0.949TN 0.542 0.862 0.997 0.997 0.997 0.998 0.999 1.000 1.000 1.000 1.000 1.000 1.000 1.000 1.000 1.000 1.000TX 0.139 0.368 0.590 0.645 0.650 0.655 0.682 0.872 0.871 0.895 0.863 0.859 0.859 0.935 1.000 1.000 1.000UT 0.538 0.795 1.000 1.000 1.000 1.000 1.000 1.000 1.000 1.000 1.000 1.000 1.000 1.000 1.000 1.000 1.000VA 0.000 0.000 1.000 1.000 1.000 1.000 1.000 1.000 1.000 1.000 1.000 1.000 1.000 1.000 1.000 1.000 1.000VT 0.566 0.826 0.974 0.974 0.973 1.000 1.000 1.000 1.000 1.000 1.000 1.000 1.000 1.000 1.000 1.000 1.000WA 0.228 0.371 0.462 0.469 0.522 0.623 1.000 1.000 1.000 1.000 1.000 1.000 0.995 0.996 0.996 0.996 0.995WV 0.000 0.194 0.311 0.574 0.686 0.784 0.786 0.793 0.788 0.821 0.821 0.871 0.873 0.955 1.000 1.000 1.000WI 0.721 0.922 0.959 0.960 0.957 0.958 1.000 1.000 1.000 1.000 1.000 1.000 1.000 1.000 1.000 1.000 1.000WY 0.000 0.000 1.000 1.000 1.000 1.000 1.000 1.000 1.000 1.000 1.000 1.000 1.000 1.000 1.000 1.000 1.000
Weighted by Total Undergraduate Enrollment
Notes: Year corresponds to the fall semester. Enrollment and college characteristic information is from IPEDS. A school is counted as in the NSC for that year if it joins by October 15th of that year.

Table A5. NSC Coverage Rates of Enrollments at Private, Non-Profit, 4-Year U.S. Title IV Postsecondary Institutions Over Time by State and Region
State/Region 1995 1996 1997 1998 1999 2000 2001 2002 2003 2004 2005 2006 2007 2008 2009 2010 2011United States 0.167 0.307 0.581 0.682 0.726 0.758 0.793 0.818 0.828 0.838 0.846 0.862 0.888 0.901 0.931 0.934 0.931
Northeast 0.182 0.368 0.608 0.742 0.785 0.817 0.843 0.860 0.871 0.876 0.882 0.901 0.938 0.959 0.965 0.965 0.965Midwest 0.130 0.254 0.592 0.659 0.691 0.714 0.757 0.784 0.800 0.811 0.826 0.841 0.853 0.863 0.938 0.944 0.944West 0.324 0.387 0.625 0.698 0.741 0.740 0.780 0.802 0.809 0.833 0.840 0.861 0.894 0.906 0.921 0.925 0.928South 0.115 0.239 0.512 0.612 0.673 0.730 0.769 0.806 0.809 0.819 0.821 0.835 0.858 0.862 0.883 0.888 0.876
AL 0.000 0.193 0.707 0.728 0.707 0.801 0.860 0.863 0.876 0.876 0.893 0.892 0.915 0.795 0.914 0.890 0.887AK 0.000 0.000 0.000 0.000 0.000 0.000 0.000 0.741 0.759 0.800 0.807 0.816 1.000 1.000 1.000 1.000 0.906AZ 0.000 0.000 0.008 0.320 0.701 0.904 0.902 0.865 0.660 0.600 0.619 0.670 0.865 0.844 0.837 0.830 0.790AR 0.000 0.000 0.486 0.705 0.719 0.721 0.789 0.791 0.774 0.827 0.808 0.796 0.785 0.783 0.777 0.751 0.763CA 0.272 0.376 0.639 0.712 0.745 0.744 0.790 0.796 0.821 0.838 0.842 0.850 0.901 0.920 0.934 0.938 0.943CO 0.000 0.000 0.686 0.777 0.820 0.731 0.830 0.837 0.840 0.840 0.846 0.826 0.808 0.818 0.934 0.942 0.943CT 0.142 0.252 0.333 0.585 0.572 0.574 0.574 0.711 0.715 0.710 0.732 0.728 0.812 0.917 0.918 0.863 0.858DE 0.000 0.000 0.058 0.595 0.583 0.606 0.568 0.856 0.862 0.918 0.880 0.883 0.889 0.910 0.922 0.924 0.927DC 0.076 0.279 0.439 0.442 0.632 0.643 0.914 0.902 0.903 0.905 0.907 0.902 0.908 0.912 0.946 0.982 0.989FL 0.032 0.031 0.360 0.527 0.548 0.667 0.706 0.710 0.710 0.713 0.712 0.713 0.746 0.775 0.804 0.816 0.708GA 0.255 0.408 0.485 0.552 0.592 0.811 0.810 0.868 0.861 0.889 0.910 0.920 0.931 0.933 0.938 0.938 0.934HI 0.000 0.000 0.000 0.195 0.203 0.220 0.207 0.217 0.232 0.222 0.216 0.399 0.397 0.382 0.394 0.413 0.408ID 0.000 0.000 0.000 0.000 0.000 0.000 0.823 0.924 0.930 0.933 0.936 0.940 0.938 0.934 0.933 0.930 0.941IL 0.204 0.392 0.711 0.817 0.811 0.839 0.867 0.904 0.910 0.908 0.912 0.956 0.969 0.968 0.974 0.972 0.950IN 0.000 0.000 0.411 0.507 0.529 0.546 0.588 0.682 0.686 0.704 0.757 0.761 0.803 0.829 0.884 0.905 0.939IA 0.000 0.000 0.474 0.542 0.554 0.652 0.703 0.748 0.817 0.821 0.930 0.934 0.933 0.951 0.950 0.987 0.985KS 0.000 0.000 0.382 0.451 0.478 0.485 0.491 0.487 0.566 0.566 0.606 0.582 0.578 0.612 0.600 0.669 0.715KY 0.034 0.098 0.556 0.650 0.649 0.703 0.682 0.683 0.730 0.704 0.701 0.736 0.795 0.798 0.798 0.851 0.873LA 0.347 0.359 0.384 0.436 0.520 0.520 0.548 0.735 0.741 0.740 0.585 0.876 0.930 0.940 0.993 0.993 0.996ME 0.000 0.000 0.248 0.295 0.575 0.540 0.653 0.702 0.705 0.893 0.888 0.915 0.920 1.000 1.000 1.000 1.000MD 0.144 0.462 0.752 0.801 0.819 0.814 0.780 0.867 0.870 0.894 0.891 0.906 0.913 0.910 0.893 0.892 0.906MA 0.119 0.353 0.511 0.595 0.671 0.703 0.775 0.778 0.796 0.799 0.808 0.822 0.935 0.976 0.986 0.986 0.986MI 0.000 0.122 0.301 0.308 0.435 0.447 0.433 0.432 0.464 0.437 0.432 0.424 0.442 0.477 0.978 0.970 0.960MN 0.405 0.691 0.956 0.954 0.948 0.945 0.928 0.966 0.967 0.969 0.971 0.973 0.975 0.979 0.979 0.979 0.980MS 0.000 0.000 0.136 0.282 0.554 0.554 0.569 0.608 0.601 0.599 0.629 0.626 0.879 0.889 0.885 0.908 0.912MO 0.226 0.219 0.570 0.632 0.703 0.726 0.881 0.883 0.886 0.885 0.906 0.913 0.917 0.922 0.916 0.927 0.928MT 0.000 0.000 0.502 0.505 0.721 0.735 0.616 0.721 0.732 0.730 0.729 0.720 0.734 0.732 0.717 0.739 0.754NE 0.241 0.334 0.867 0.887 0.882 0.928 0.936 0.932 0.922 0.922 0.918 0.923 0.928 0.925 0.928 0.973 0.972NV 0.000 0.000 0.000 0.000 0.000 0.000 0.000 1.000 1.000 1.000 1.000 1.000 0.733 0.713 0.724 0.702 0.663NH 0.226 0.436 0.573 0.726 0.739 0.763 0.739 0.922 0.918 0.919 0.922 0.916 0.917 0.915 0.955 0.955 0.963NJ 0.000 0.157 0.343 0.608 0.603 0.658 0.694 0.689 0.734 0.730 0.731 0.845 0.842 0.931 0.926 0.923 0.926NM 0.000 0.000 0.000 0.000 0.000 0.000 0.000 0.502 0.639 0.637 0.628 0.693 0.807 0.798 0.566 0.582 0.539NY 0.321 0.506 0.719 0.828 0.880 0.887 0.888 0.891 0.894 0.898 0.905 0.909 0.931 0.936 0.946 0.954 0.954NC 0.155 0.268 0.512 0.696 0.741 0.742 0.791 0.810 0.833 0.847 0.859 0.855 0.851 0.848 0.886 0.882 0.876ND 0.000 0.000 1.000 1.000 1.000 1.000 1.000 1.000 1.000 0.824 0.855 0.816 0.789 0.786 0.768 0.793 0.733OH 0.071 0.256 0.602 0.649 0.683 0.700 0.762 0.791 0.811 0.907 0.901 0.941 0.958 0.956 0.963 0.963 0.958OK 0.000 0.147 0.585 0.607 0.600 0.720 0.699 0.702 0.645 0.701 0.696 0.678 0.820 0.810 0.797 0.771 0.836OR 0.000 0.000 0.566 0.585 0.699 0.760 0.764 0.765 0.763 0.913 0.914 0.915 0.914 0.957 0.954 0.953 0.955PA 0.125 0.322 0.724 0.895 0.908 0.948 0.950 0.966 0.981 0.980 0.980 0.980 0.992 0.992 0.992 0.991 0.990RI 0.000 0.000 0.305 0.440 0.435 0.696 0.864 0.866 0.869 0.870 0.868 0.992 0.992 1.000 1.000 1.000 1.000SC 0.022 0.219 0.502 0.538 0.660 0.823 0.787 0.835 0.834 0.825 0.815 0.889 0.893 0.908 0.906 0.905 0.913SD 0.000 0.000 0.897 0.892 0.902 0.906 0.883 0.759 0.757 0.730 0.741 0.746 0.746 0.749 0.761 0.615 0.881TN 0.334 0.346 0.652 0.713 0.758 0.788 0.809 0.808 0.800 0.801 0.794 0.777 0.774 0.789 0.784 0.773 0.768TX 0.000 0.202 0.589 0.696 0.838 0.836 0.833 0.848 0.854 0.863 0.864 0.890 0.894 0.897 0.926 0.933 0.975UT 0.947 0.951 1.000 1.000 1.000 0.998 0.998 0.996 0.975 1.000 1.000 1.000 1.000 1.000 1.000 1.000 1.000VA 0.000 0.360 0.702 0.741 0.764 0.777 0.767 0.755 0.752 0.763 0.755 0.968 0.971 0.978 0.977 0.976 0.977VT 0.239 0.411 0.514 0.571 0.576 0.582 0.726 0.869 0.874 0.898 0.898 0.907 0.946 0.949 0.964 0.959 0.961WA 0.534 0.624 0.702 0.786 0.787 0.755 0.778 0.831 0.825 0.826 0.858 0.922 0.955 0.958 0.955 0.954 0.948WV 0.000 0.203 0.502 0.568 0.570 0.708 0.721 0.722 0.797 0.797 0.837 0.922 0.921 0.922 0.930 0.931 0.924WI 0.187 0.423 0.684 0.860 0.860 0.868 0.915 0.931 0.930 0.930 0.921 0.922 0.921 0.939 0.942 0.939 0.937WY 0.000 0.000 0.000 0.000 0.000 0.000 0.000 0.000 0.000 0.000 0.000 0.000 0.000 0.000 0.000 0.000 0.000
Weighted by Total Undergraduate Enrollment
Notes: Year corresponds to the fall semester. Enrollment and college characteristic information is from IPEDS. A school is counted as in the NSC for that year if it joins by October 15th of that year.

Table A6. NSC Coverage Rates of Enrollments at Private, For-Profit, U.S. Title IV Postsecondary Institutions Over Time by State and Region
State/Region 1995 1996 1997 1998 1999 2000 2001 2002 2003 2004 2005 2006 2007 2008 2009 2010 2011United States 0.027 0.034 0.112 0.133 0.174 0.164 0.193 0.296 0.294 0.314 0.332 0.337 0.379 0.403 0.421 0.395 0.479
Northeast 0.078 0.075 0.129 0.136 0.140 0.165 0.165 0.216 0.196 0.201 0.196 0.206 0.229 0.248 0.271 0.283 0.319Midwest 0.006 0.007 0.040 0.045 0.086 0.075 0.097 0.259 0.251 0.258 0.215 0.237 0.281 0.323 0.337 0.384 0.439West 0.004 0.000 0.187 0.236 0.254 0.210 0.283 0.407 0.413 0.451 0.492 0.487 0.547 0.593 0.609 0.569 0.644South 0.018 0.049 0.064 0.076 0.163 0.161 0.170 0.255 0.251 0.258 0.288 0.292 0.301 0.286 0.300 0.248 0.363
AL 0.000 0.000 0.000 0.000 0.000 0.000 0.000 0.067 0.070 0.099 0.111 0.120 0.113 0.238 0.466 0.427 0.381AK 0.000 0.000 0.000 0.000 0.000 0.000 0.000 0.000 0.000 0.000 0.000 0.000 0.000 0.000 0.000 0.000 0.000AZ 0.000 0.000 0.252 0.258 0.385 0.353 0.547 0.672 0.718 0.765 0.820 0.819 0.859 0.893 0.897 0.871 0.895AR 0.000 0.000 0.000 0.000 0.000 0.000 0.000 0.171 0.166 0.250 0.279 0.293 0.330 0.390 0.461 0.385 0.365CA 0.000 0.000 0.187 0.259 0.246 0.182 0.224 0.339 0.299 0.301 0.284 0.278 0.305 0.339 0.343 0.351 0.491CO 0.000 0.000 0.166 0.187 0.173 0.127 0.144 0.202 0.199 0.168 0.139 0.105 0.081 0.081 0.088 0.089 0.121CT 0.000 0.000 0.000 0.000 0.000 0.000 0.000 0.000 0.000 0.000 0.000 0.002 0.007 0.005 0.004 0.001 0.002DE 0.000 0.000 0.000 0.000 0.000 0.000 0.000 0.000 0.000 0.000 0.000 0.000 0.000 0.000 0.000 0.000 0.000DC 0.000 0.000 0.000 0.000 0.612 0.619 0.872 0.880 0.910 0.906 0.911 0.926 0.939 0.942 0.974 0.568 0.561FL 0.000 0.000 0.035 0.072 0.090 0.067 0.095 0.151 0.151 0.163 0.187 0.182 0.193 0.138 0.145 0.149 0.421GA 0.000 0.000 0.000 0.000 0.000 0.000 0.000 0.200 0.180 0.139 0.218 0.212 0.237 0.241 0.222 0.214 0.377HI 0.381 0.000 0.377 0.383 0.318 0.287 0.275 0.341 0.371 0.411 0.398 0.357 0.588 0.693 0.682 0.872 0.892ID 0.000 0.000 0.000 0.000 0.000 0.000 0.303 0.288 0.362 0.431 0.402 0.375 0.381 0.336 0.232 0.250 0.266IL 0.000 0.000 0.000 0.000 0.164 0.150 0.140 0.317 0.303 0.298 0.166 0.196 0.251 0.310 0.315 0.405 0.450IN 0.000 0.000 0.000 0.000 0.000 0.000 0.000 0.143 0.160 0.200 0.217 0.232 0.247 0.258 0.276 0.304 0.343IA 0.000 0.000 0.000 0.000 0.000 0.000 0.000 0.000 0.000 0.000 0.031 0.112 0.220 0.343 0.374 0.436 0.565KS 0.000 0.000 0.000 0.000 0.000 0.000 0.000 0.000 0.034 0.068 0.098 0.084 0.098 0.086 0.079 0.030 0.093KY 0.000 0.435 0.423 0.448 0.607 0.612 0.635 0.662 0.624 0.642 0.697 0.651 0.617 0.537 0.551 0.468 0.482LA 0.000 0.000 0.118 0.163 0.173 0.119 0.143 0.191 0.203 0.241 0.240 0.259 0.249 0.230 0.232 0.163 0.172ME 0.000 0.000 0.000 0.000 0.000 0.000 0.000 0.000 0.000 0.000 0.000 0.000 0.000 0.000 0.000 0.000 0.000MD 0.000 0.000 0.000 0.000 0.150 0.335 0.107 0.143 0.158 0.156 0.152 0.146 0.162 0.146 0.160 0.244 0.325MA 0.000 0.000 0.000 0.000 0.000 0.000 0.006 0.089 0.080 0.161 0.150 0.155 0.140 0.130 0.105 0.067 0.179MI 0.000 0.000 0.142 0.192 0.191 0.141 0.207 0.337 0.307 0.302 0.286 0.306 0.324 0.307 0.290 0.254 0.412MN 0.000 0.000 0.199 0.174 0.165 0.135 0.261 0.302 0.373 0.404 0.452 0.496 0.502 0.527 0.579 0.632 0.635MS 0.000 0.000 0.000 0.000 0.000 0.000 0.000 0.000 0.000 0.000 0.000 0.000 0.000 0.366 0.381 0.244 0.245MO 0.000 0.000 0.000 0.000 0.000 0.000 0.013 0.259 0.291 0.280 0.280 0.279 0.298 0.331 0.307 0.343 0.212MT 0.000 0.000 0.000 0.000 0.000 0.000 0.000 0.000 0.000 0.000 0.000 0.000 0.000 0.000 0.000 0.000 0.000NE 0.000 0.027 0.017 0.008 0.019 0.101 0.102 0.198 0.239 0.236 0.258 0.218 0.249 0.288 0.221 0.267 0.271NV 0.000 0.000 0.287 0.272 0.301 0.233 0.217 0.441 0.507 0.426 0.421 0.366 0.339 0.327 0.300 0.254 0.345NH 0.000 0.000 0.679 0.711 0.717 0.638 0.609 0.633 0.603 0.603 0.603 0.664 0.627 0.714 0.670 0.755 0.748NJ 0.000 0.000 0.000 0.000 0.000 0.000 0.000 0.143 0.112 0.093 0.079 0.078 0.078 0.066 0.193 0.195 0.235NM 0.000 0.000 0.522 0.535 0.520 0.512 0.533 0.651 0.630 0.687 0.646 0.607 0.558 0.593 0.574 0.378 0.457NY 0.207 0.204 0.232 0.227 0.234 0.316 0.311 0.330 0.278 0.274 0.281 0.308 0.391 0.417 0.465 0.459 0.480NC 0.000 0.000 0.000 0.000 0.000 0.000 0.000 0.000 0.011 0.077 0.146 0.186 0.216 0.262 0.281 0.269 0.272ND 0.000 0.000 0.000 0.000 0.000 0.000 0.000 0.000 0.000 0.000 0.000 0.000 0.000 0.000 0.000 0.000 0.000OH 0.026 0.028 0.028 0.028 0.024 0.022 0.030 0.283 0.260 0.258 0.237 0.227 0.261 0.247 0.252 0.260 0.305OK 0.000 0.000 0.000 0.000 0.118 0.156 0.423 0.429 0.365 0.344 0.337 0.341 0.376 0.390 0.365 0.219 0.323OR 0.000 0.000 0.000 0.110 0.151 0.140 0.153 0.222 0.201 0.201 0.221 0.201 0.206 0.198 0.201 0.260 0.318PA 0.000 0.000 0.068 0.083 0.092 0.104 0.108 0.151 0.173 0.183 0.178 0.184 0.178 0.229 0.219 0.268 0.314RI 0.000 0.000 0.000 0.000 0.000 0.000 0.000 0.000 0.000 0.000 0.000 0.000 0.000 0.000 0.000 0.000 0.000SC 0.000 0.000 0.000 0.000 0.000 0.000 0.000 0.112 0.118 0.127 0.134 0.171 0.191 0.315 0.380 0.545 0.537SD 0.000 0.000 0.026 0.041 0.039 0.039 0.046 0.040 0.039 0.038 0.044 0.050 0.066 0.053 0.125 0.128 0.100TN 0.000 0.000 0.000 0.000 0.000 0.057 0.012 0.173 0.182 0.217 0.213 0.206 0.212 0.266 0.305 0.352 0.366TX 0.000 0.000 0.000 0.000 0.000 0.000 0.012 0.190 0.186 0.177 0.187 0.192 0.179 0.175 0.154 0.162 0.253UT 0.000 0.000 0.181 0.170 0.186 0.134 0.207 0.305 0.303 0.351 0.328 0.294 0.311 0.361 0.340 0.319 0.269VA 0.000 0.000 0.386 0.411 0.432 0.347 0.383 0.383 0.000 0.000 0.000 0.000 0.000 0.000 0.000 0.000 0.000VT 0.155 0.191 0.202 0.215 0.631 0.614 0.407 0.411 0.417 0.516 0.499 0.531 0.606 0.606 0.605 0.636 0.673WA 0.000 0.000 0.000 0.054 0.092 0.089 0.103 0.257 0.267 0.294 0.275 0.268 0.254 0.216 0.184 0.199 0.408WV 0.000 0.000 0.000 0.000 0.000 0.000 0.000 0.000 0.000 0.000 0.000 0.000 0.000 0.000 0.008 0.000 0.017WI 0.000 0.000 0.000 0.000 0.000 0.000 0.018 0.355 0.410 0.458 0.452 0.387 0.441 0.442 0.424 0.366 0.383WY 0.000 0.000 0.000 0.000 0.000 0.000 0.000 0.000 0.000 0.000 0.030 0.026 0.023 0.006 0.000 0.000 0.924
Weighted by Total Undergraduate Enrollment
Notes: Year corresponds to the fall semester. Enrollment and college characteristic information is from IPEDS. A school is counted as in the NSC for that year if it joins by October 15th of that year.

Table A7. Comprehensive NSC Coverage Rates at All U.S. Title IV Postsecondary Institutions Over Time by State
State/Region 2006 2008 2010 2006 2008 2010 2006 2008 2010 2006 2008 2010 2006 2008 2010 2006 2008 2010United States 0.821 0.843 0.861 0.833 0.862 0.901 0.304 0.262 0.261 0.916 0.938 0.959 0.822 0.860 0.892 0.332 0.391 0.387
AL 0.859 0.762 0.818 0.729 0.784 0.794 0.000 0.000 0.000 0.982 0.985 0.982 0.880 0.778 0.868 0.076 0.040 0.175AK 0.843 0.900 0.926 0.386 0.423 0.335 0.000 0.000 0.000 0.910 0.969 0.993 0.812 1.000 1.000 0.000 0.000 0.000AZ 0.548 0.783 0.786 0.133 0.529 0.567 0.000 0.000 0.000 0.794 0.917 0.957 0.498 0.583 0.519 0.818 0.892 0.869AR 0.842 0.855 0.908 0.741 0.780 0.914 0.000 0.000 0.943 0.961 0.964 0.970 0.788 0.776 0.745 0.289 0.390 0.385CA 0.785 0.796 0.817 0.776 0.779 0.823 0.323 0.071 0.000 0.970 0.980 0.968 0.789 0.873 0.894 0.270 0.328 0.343CO 0.812 0.782 0.796 0.937 0.943 0.957 0.000 0.000 0.000 0.959 0.960 0.962 0.824 0.817 0.940 0.105 0.081 0.087CT 0.812 0.853 0.846 0.999 0.999 0.998 0.176 0.179 0.649 0.946 0.943 0.981 0.725 0.915 0.862 0.002 0.005 0.001DE 0.571 0.873 0.862 0.000 0.872 0.850 0.242 1.000 0.997 0.901 0.920 0.948 0.786 0.854 0.878 0.000 0.000 0.000DC 0.910 0.922 0.946 0.000 0.000 0.000 0.000 0.000 0.000 1.000 1.000 1.000 0.894 0.897 0.962 0.917 0.938 0.567FL 0.797 0.801 0.779 0.877 0.879 0.781 0.000 0.000 0.000 0.961 0.980 0.982 0.698 0.757 0.769 0.120 0.118 0.145GA 0.877 0.877 0.883 0.902 0.920 0.975 0.818 0.868 0.487 0.972 0.972 0.976 0.903 0.914 0.921 0.204 0.226 0.194HI 0.849 0.861 0.885 0.998 0.998 0.998 0.985 0.000 0.000 0.991 0.994 0.996 0.390 0.364 0.402 0.355 0.683 0.866ID 0.936 0.930 0.933 0.978 0.986 0.992 0.000 0.000 0.000 0.957 0.951 0.982 0.939 0.933 0.930 0.375 0.336 0.250IL 0.897 0.904 0.907 0.996 0.998 0.998 0.000 0.000 0.000 0.992 0.990 0.992 0.917 0.934 0.942 0.194 0.307 0.401IN 0.611 0.802 0.900 0.994 0.990 0.995 0.678 0.725 0.704 0.479 0.817 0.995 0.671 0.713 0.777 0.232 0.258 0.304IA 0.831 0.790 0.758 0.997 0.997 0.998 0.000 0.000 0.000 0.950 0.929 0.923 0.915 0.938 0.976 0.103 0.336 0.435KS 0.819 0.829 0.835 0.777 0.806 0.847 0.000 0.000 0.000 0.966 0.980 0.983 0.568 0.546 0.596 0.084 0.086 0.030KY 0.936 0.934 0.928 0.999 1.000 0.999 0.000 0.000 0.000 0.988 0.991 0.995 0.710 0.773 0.829 0.648 0.537 0.468LA 0.790 0.775 0.805 0.424 0.473 0.625 0.000 0.000 0.000 0.982 0.975 0.977 0.861 0.924 0.979 0.249 0.228 0.153ME 0.898 0.926 0.922 0.868 0.956 0.952 0.000 0.000 0.000 0.979 0.981 0.981 0.905 0.981 0.987 0.000 0.000 0.000MD 0.863 0.863 0.889 0.969 0.969 1.000 0.000 0.000 0.000 0.887 0.903 0.957 0.705 0.624 0.609 0.146 0.146 0.244MA 0.843 0.918 0.915 0.975 0.983 0.989 0.488 0.487 0.357 0.982 0.991 0.993 0.771 0.930 0.945 0.154 0.130 0.067MI 0.802 0.842 0.927 0.899 0.943 0.946 0.000 0.000 0.000 0.909 0.939 0.965 0.420 0.474 0.966 0.303 0.307 0.254MN 0.898 0.893 0.902 0.978 0.975 0.973 0.681 0.000 0.000 0.869 0.864 0.888 0.915 0.930 0.928 0.492 0.522 0.628MS 0.867 0.907 0.908 0.861 0.921 0.923 0.000 0.000 0.000 0.966 0.959 0.953 0.625 0.888 0.907 0.000 0.025 0.095MO 0.909 0.903 0.892 0.984 0.984 0.986 0.112 0.070 0.244 0.980 0.982 0.984 0.901 0.895 0.903 0.279 0.330 0.342MT 0.878 0.887 0.896 0.789 0.816 0.820 0.000 0.000 0.000 0.951 0.956 0.970 0.704 0.707 0.696 0.000 0.000 0.000NE 0.926 0.940 0.946 0.997 0.998 0.996 0.078 0.060 0.050 0.923 0.939 0.954 0.917 0.921 0.969 0.218 0.288 0.267NV 0.909 0.915 0.887 0.988 0.989 0.987 0.000 0.000 0.000 0.962 0.988 0.984 0.996 0.712 0.701 0.366 0.327 0.254NH 0.912 0.920 0.936 0.954 0.975 0.991 0.000 0.000 0.000 0.990 0.986 0.984 0.891 0.875 0.916 0.664 0.714 0.755NJ 0.749 0.764 0.799 0.981 0.994 0.996 0.000 0.000 0.000 0.572 0.570 0.674 0.839 0.922 0.914 0.075 0.066 0.193NM 0.824 0.857 0.877 0.840 0.885 0.938 0.000 0.000 0.000 0.845 0.854 0.899 0.687 0.796 0.581 0.607 0.593 0.378NY 0.851 0.872 0.893 0.968 0.984 0.986 0.141 0.148 0.031 0.898 0.890 0.939 0.848 0.875 0.893 0.278 0.390 0.434NC 0.916 0.910 0.900 0.995 0.996 0.997 0.776 0.645 0.669 0.963 0.935 0.900 0.666 0.672 0.708 0.186 0.262 0.269ND 0.880 0.867 0.845 0.950 0.941 0.938 0.000 0.000 0.000 0.986 0.988 0.990 0.409 0.350 0.256 0.000 0.000 0.000OH 0.843 0.865 0.875 0.799 0.874 0.901 0.000 0.000 0.145 0.946 0.961 0.964 0.916 0.925 0.938 0.227 0.247 0.259OK 0.602 0.719 0.800 0.484 0.742 0.755 0.000 0.000 0.000 0.725 0.719 0.927 0.660 0.789 0.750 0.340 0.390 0.219OR 0.886 0.895 0.944 0.894 0.902 0.985 1.000 0.000 0.000 0.988 0.989 0.998 0.903 0.947 0.945 0.200 0.197 0.259PA 0.892 0.902 0.892 0.987 0.996 0.996 0.432 0.464 0.609 0.994 0.991 0.991 0.954 0.972 0.977 0.184 0.229 0.262RI 0.944 0.940 0.939 1.000 1.000 1.000 0.000 0.000 0.000 0.965 0.946 0.948 0.989 0.997 0.998 0.000 0.000 0.000SC 0.937 0.930 0.930 0.978 0.966 0.986 0.877 0.858 0.847 0.986 0.988 0.986 0.793 0.827 0.833 0.171 0.212 0.350SD 0.820 0.834 0.794 0.800 0.813 0.787 0.019 0.689 0.761 0.946 0.947 0.943 0.744 0.749 0.614 0.049 0.049 0.106TN 0.831 0.829 0.828 0.887 0.887 0.889 0.000 0.000 0.000 0.986 0.987 0.989 0.699 0.702 0.685 0.206 0.234 0.310TX 0.708 0.747 0.845 0.670 0.708 0.889 0.134 0.166 0.118 0.807 0.870 0.924 0.872 0.877 0.917 0.189 0.152 0.149UT 0.894 0.905 0.902 0.761 0.757 0.765 0.996 0.997 0.997 0.977 0.984 0.986 0.999 1.000 1.000 0.274 0.343 0.312VA 0.962 0.965 0.964 0.992 0.992 0.993 1.000 1.000 1.000 0.986 0.992 0.993 0.961 0.972 0.970 0.000 0.000 0.000VT 0.932 0.948 0.938 0.980 0.985 0.996 0.336 0.230 0.000 0.991 0.993 0.992 0.896 0.939 0.933 0.531 0.606 0.636WA 0.920 0.929 0.923 0.996 0.999 0.999 0.000 0.000 0.000 0.924 0.924 0.931 0.900 0.937 0.938 0.267 0.215 0.198WV 0.731 0.686 0.672 0.447 0.573 0.738 0.000 0.000 0.000 0.847 0.930 0.975 0.921 0.922 0.931 0.000 0.000 0.000WI 0.960 0.961 0.948 0.992 0.992 0.997 0.030 0.677 0.620 0.992 0.989 0.988 0.896 0.911 0.910 0.387 0.437 0.364WY 0.759 0.826 0.848 0.677 0.783 0.836 0.000 0.000 0.000 0.993 0.996 0.997 0.000 0.000 0.000 0.026 0.006 0.000Notes: Year corresponds to the fall semester. Comprehensive coverage rate is equal to the enrollment coverage rate (at all Title IV institutions weighted by undergraduate enrollment) multiplied by 1 minus the FERPA block rate as reported in NSC Research Center (2012). For example, the comprehensive coverage rate of undergraduates at all Title IV institutions nationwide in 2010-11 equals 0.901 (the enrollment coverage rate) multiplied by 1 - 0.044 (the fraction of records not FERPA-blocked) = 0.901 x 0.956 = 0.861.
All Postsecondary Institutions Public 2-Year Institutions Private, Non-Profit 2-Year Institutions Public 4-Year Institutions Private, Non-Profit 4-Year
InstitutionsFor-Profit Institutions
(all levels)