the mission of the employees retirement system of texas is
TRANSCRIPT


The mission of the Employees Retirement System of Texas is to support thestate workforce by offering competitive benefits at a reasonable cost.
Published December 2020
ii
2020Comprehensive Annual Financial Report
Porter Wilson, Executive Director
Prepared by: Finance Division
®
A Component Unit of the State of Texas Fiscal Year Ended August 31, 2020
iii
Introductory SectionHighlights of Retirement Programs.................................................................................................................................. 3Executive Director’s Message......................................................................................................................................... 4Letter of Transmittal......................................................................................................................................................... 6Certificate of Achievement............................................................................................................................................... 10Public Pension Standards Award..................................................................................................................................... 11Organizational Chart and Data........................................................................................................................................ 12Consultants and Advisors................................................................................................................................................ 13Summary of Plan Provisions............................................................................................................................................ 15
Financial SectionIndependent Auditor’s Report............................................................................................................................................. 24Management’s Discussion and Analysis............................................................................................................................ 28Basic Financial Statements – Exhibits:
Government-Wide Financial Statements:I Statement of Net Position...................................................................................................................................... 32II Statement of Activities............................................................................................................................................ 32
Fund Financial Statements:III Balance Sheet – Governmental Funds.................................................................................................................. 34IV Statement of Revenues, Expenditures and Changes in Fund Balances – Governmental Funds......................... 35V Statement of Net Position – Proprietary Fund....................................................................................................... 36VI Statement of Revenues, Expenses and Changes in Net Position – Proprietary Fund.......................................... 37VII Statement of Cash Flows – Proprietary Fund........................................................................................................ 39VIII Statement of Fiduciary Net Position...................................................................................................................... 40IX Statement of Changes in Fiduciary Net Position................................................................................................... 42
Notes to the Basic Financial Statements............................................................................................................................ 47Required Supplementary Information:
Schedule of Changes in Net Pension Liability and Related Ratios – Defined Benefit Plans........................................ 77Schedule of Employer Contributions – Defined Benefit Plans...................................................................................... 80Schedule of Changes in Net OPEB Liability and Related Ratios.................................................................................. 81Schedule of Contributions from Employers and Non-employer Contributing Entities – Other Postemployment Benefits Plan............................................................................................................................................................... 81
Schedule of Investment Returns – Annual Money-Weighted Rate of Return, Net of Investment Expense.................. 82Notes to the Required Supplementary Information....................................................................................................... 82
Other Supplementary InformationFiduciary Funds:Supporting Schedules:
Revenues, Expenses and Changes in Statutory Account Balances (Non-GAAP Presentation):1 Employees Retirement Fund.............................................................................................................................. 852 Law Enforcement and Custodial Officer Supplemental Retirement Fund........................................................... 863 Judicial Retirement System Plan Two Fund........................................................................................................ 87
Other Supplementary Schedules4 Administrative and Investment Expenses/Expenditures – Statutory Administrative Funds and Accounts............ 885 Professional and Consulting Fees......................................................................................................................... 90
Table of Contents
iv
Investment Section Report on Investment Activity.......................................................................................................................................... 93Outline of Investment Policies.......................................................................................................................................... 99Time-Weighted Rates of Return and Asset Allocations.................................................................................................... 101Broker Commissions........................................................................................................................................................ 102Fees for Alternative Investments...................................................................................................................................... 104Investment Advisory and Service Fees............................................................................................................................ 104List of Largest Assets Held.............................................................................................................................................. 105Investment Summary at Fair Value.................................................................................................................................. 106
Actuarial SectionPension Plans:
Actuary’s Certification Letter......................................................................................................................................... 109Actuarial Balance Sheet - Employees Retirement Fund............................................................................................... 116Actuarial Balance Sheet - Law Enforcement and Custodial Officers Supplemental Retirement Fund......................... 117Actuarial Balance Sheet - Judicial Retirement System of Texas Plan Two Fund......................................................... 118Summary of Actuarial Methods and Assumptions......................................................................................................... 119Active Member Valuation Data...................................................................................................................................... 124Retirees and Beneficiaries Added to and Removed from the Annuity Payrolls............................................................. 125Schedule of Funding Progress - Defined Benefit Plans................................................................................................ 126Solvency Test................................................................................................................................................................ 127Analysis of Financial Experience.................................................................................................................................. 128Effect on Changes in Actuarial Assumptions................................................................................................................ 129
State Retiree Health Plan: Actuary’s Certification Letter......................................................................................................................................... 130Actuarial Valuation Results........................................................................................................................................... 131Summary of Actuarial Methods and Assumptions......................................................................................................... 132Active Member Valuation Data...................................................................................................................................... 135Retirees and Nominees Added to and Removed.......................................................................................................... 135Schedule of Funding Progress...................................................................................................................................... 135
Statistical Section Summary of Statistical Section........................................................................................................................................ 139Governmental Activities:
Net Position................................................................................................................................................................... 140Changes in Net Position............................................................................................................................................... 140
Governmental Funds: Fund Balances.............................................................................................................................................................. 141Changes in Fund Balances........................................................................................................................................... 141
Changes in Net Position: Proprietary Fund........................................................................................................................................................... 142Defined Benefit Plans................................................................................................................................................... 143Deferred Compensation Plans and Cafeteria Plan....................................................................................................... 145
Benefit and Refund Payments - Defined Benefit Plans................................................................................................... 146Average Benefit Payments - Employee Class................................................................................................................. 148Retired Members by Type of Benefit................................................................................................................................ 149Contribution Rates........................................................................................................................................................... 150Statistical Information:
Defined Benefit Plans................................................................................................................................................... 151Other Programs............................................................................................................................................................ 152
Listing of Participating Reporting Entities for State Retiree Health Plan.......................................................................... 153
Table of Contents (Concluded)
v

vi

INTRODUCTORY SECTION
Highlights of Retirement Programs
Executive Director’s Message
Letter of Transmittal
Certificate of Achievement
Public Pension Standards Award
Organizational Chart and Data
Consultants and Advisors
Summary of Plan Provisions
1

2 Introductory Section � 2020 Comprehensive Annual Financial Report �Employees Retirement System of Texas
ERS(Note A)
LECOS(Note A) JRS II
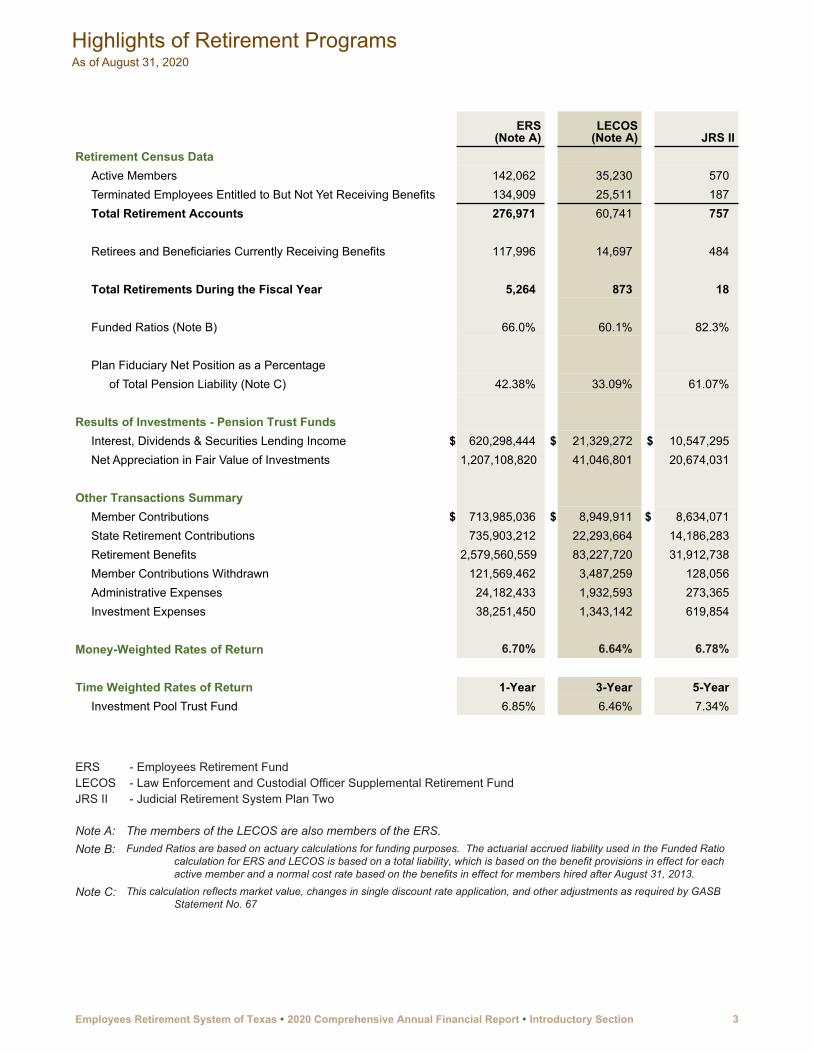
Retirement Census DataActive Members 142,062 35,230 570 Terminated Employees Entitled to But Not Yet Receiving Benefits 134,909 25,511 187 Total Retirement Accounts 276,971 60,741 757
Retirees and Beneficiaries Currently Receiving Benefits 117,996 14,697 484
Total Retirements During the Fiscal Year 5,264 873 18
Funded Ratios (Note B) 66.0 % 60.1 % 82.3 %
Plan Fiduciary Net Position as a Percentage of Total Pension Liability (Note C) 42.38 % 33.09 % 61.07 %
Results of Investments - Pension Trust FundsInterest, Dividends & Securities Lending Income $ 620,298,444 $ 21,329,272 $ 10,547,295 Net Appreciation in Fair Value of Investments 1,207,108,820 41,046,801 20,674,031
Other Transactions SummaryMember Contributions $ 713,985,036 $ 8,949,911 $ 8,634,071 State Retirement Contributions 735,903,212 22,293,664 14,186,283 Retirement Benefits 2,579,560,559 83,227,720 31,912,738 Member Contributions Withdrawn 121,569,462 3,487,259 128,056 Administrative Expenses 24,182,433 1,932,593 273,365 Investment Expenses 38,251,450 1,343,142 619,854
Money-Weighted Rates of Return 6.70 % 6.64 % 6.78 %
Time Weighted Rates of Return 1-Year 3-Year 5-YearInvestment Pool Trust Fund 6.85 % 6.46 % 7.34 %
ERS - Employees Retirement FundLECOS - Law Enforcement and Custodial Officer Supplemental Retirement FundJRS II - Judicial Retirement System Plan Two
Note A: The members of the LECOS are also members of the ERS.Note B: Funded Ratios are based on actuary calculations for funding purposes. The actuarial accrued liability used in the Funded Ratio
calculation for ERS and LECOS is based on a total liability, which is based on the benefit provisions in effect for each active member and a normal cost rate based on the benefits in effect for members hired after August 31, 2013.
Note C: This calculation reflects market value, changes in single discount rate application, and other adjustments as required by GASB Statement No. 67
Highlights of Retirement ProgramsAs of August 31, 2020
Employees Retirement System of Texas � 2020 Comprehensive Annual Financial Report � Introductory Section 3

December 18, 2020
The Honorable Greg Abbott, Governor of Texas The Honorable Glenn Hegar, Texas Comptroller Jerry McGinty, Legislative Budget BoardLisa Collier, First Assistant State AuditorThe Board of Trustees and Members of the Employee Retirement System of Texas
Ladies and Gentlemen:
I am honored to present the Employees Retirement System of Texas (ERS) Comprehensive Annual Financial Report (CAFR) for the fiscal year ended August 31, 2020. The state’s retirement benefits and health coverage administered by ERS are an investment in Texas, funded by both members and taxpayers. These benefits play an increasingly critical role in ensuring Texas has the workforce necessary to fulfill the mission of state government and provide crucial services Texans rely on daily. Benefits, including the state’s contributions toward health insurance and retirement, account for more than a third of total compensation for the average State employee.
Fiscal Year 2020 was an unprecedented year. The state workforce provided critical frontline services and adapted to new work environments to support Texans, prevent the spread of COVID-19, and ensure Texas could respond to the pandemic.
During Fiscal Year 2020, ERS held its first remote board meeting in May. Thanks to the hard work of our staff, and members of the Board and ERS’ Investment Advisory Committee, the board meetings have allowed ERS to continue its public meetings that ensure transparency to the public and our stakeholders. In its May 2020 meeting, the Board updated the assumed rate of return based upon the data from ERS’ general investment consultant, NEPC, LLC. The data was included in the experience study prepared and presented by ERS’ pension actuaries, Gabriel, Roeder, Smith & Company. This lowered the assumed rate of return from 7.5% to 7.0%.
The net position of the Fiduciary Funds administered by ERS totaled $29.51 billion as of August 31, 2020, compared with $28.83 billion as of August 31, 2019. During the COVID-19 global pandemic, ERS successfully sustained operations and investment management and closed the fiscal year with a net return of 6.82% while paying out more than $2.7 billion in annuities to more than 118,000 retirees and beneficiaries. These regular monthly payments are important not only to the annuitants, but also to the local economies where they live.
However, the current member and state contribution rate level is not actuarially sound and the financial status of the prefunded pension plans for state employees, judicial, and law enforcement and custodial officers continues to decline. All the plans are on a path to total fund depletion, with a funding gap that grows each year. At this time, none of the three pre-funded pension plans has sufficient projected assets to meet the state’s obligation to pay for benefits—benefits employees earn as they execute the mission of state government. ERS will work with leadership offices and the 87th Legislature to assist in development of a plan to address the unfunded liability.
Executive Director’s Message
4 Introductory Section � 2020 Comprehensive Annual Financial Report �Employees Retirement System of Texas

Thanks to aggressive cost management, ERS health plans remain on solid financial footing. As a result, we will not need to ask the Legislature for an increase in funding to offer the same high-quality benefits. This is remarkable in a time of rising health care cost and a global pandemic. There is some uncertainty ahead: Plan costs likely will increase as postponed medical procedures and doctor visits resume. To keep the health plan solid, we encourage our members to help improve health outcomes and control costs by adopting healthy behaviors, participating in wellness and disease management programs, and understanding how to make the best use of their benefits.
Thank you for your ongoing support. I’m proud that ERS was able to continue our operations, serve customers and keep in-office staff safe this past year. We know that similar efforts were underway by public servants throughout the state. We are honored to play a role in supporting this great state, its leadership, and its employees and retirees. We look forward to working with you to address the financial condition of the retirement programs, so they may continue to serve the State of Texas and the dedicated public servants who devote their careers to it.
Sincerely,
Porter WilsonExecutive Director
The Honorable Greg Abbott, Governor of TexasThe Honorable Glenn Hegar, Texas ComptrollerJerry McGinty, Legislative Budget BoardLisa Collier, First Assistant State AuditorThe Board of Trustees and Members of the Employees Retirement System of TexasDecember 18, 2020Page 2
Employees Retirement System of Texas � 2020 Comprehensive Annual Financial Report � Introductory Section 5
December 18, 2020
The Board of Trustees and Members of the Employees Retirement System of Texas
Ladies and Gentlemen:
I am pleased to submit the Employees Retirement System of Texas (ERS) Comprehensive Annual Financial Report (CAFR) for the fiscal year ended August 31, 2020 in compliance with Texas Government Code ANN Sec 2101.011 and in accordance with the requirements established by the Texas Comptroller of Public Accounts.
The System’s Financial Staff prepared this report in accordance with generally accepted accounting principles applied on a consistent basis as promulgated by the Government Accounting Standards Board (GASB). Its purpose is to provide information as a basis for making management decisions, to determine compliance with legal provisions, and to determine responsible stewardship over the assets contributed by the members and the state. The report has been audited by Clifton, Larson, Allen, LLP. For information regarding the scope of the audit, please see the Independent Auditor’s Report in the Financial Section.
The responsibility for the accuracy, completeness and fair presentation of the information – including all disclosures – rests with the management of the System. We believe the System’s internal accounting controls adequately safeguard assets and provide reasonable assurance of proper recording of financial transactions. Internal accounting controls are designed to provide reasonable, but not absolute, assurance regarding the safeguarding of assets and the reliability of financial records.
Please refer to the Management’s Discussion and Analysis in the Financial Section for an overview of the financial activities of the current and prior fiscal years.
SYSTEM’S STRUCTURE AND SERVICES
For financial reporting purposes, the System is considered a Retirement System of the State of Texas. The System’s financial activities will be included in the annual financial report for the State of Texas for the fiscal year ended August 31, 2020.
The Employees Retirement Plan was established in 1947 by the Texas Constitution to provide benefits for officers and employees of the state. The System administers retirement and disability annuities and death and survivor benefits for employees of the State of Texas and their beneficiaries, and proportional retirement benefits for members of the Proportionate Retirement Program.
The Law Enforcement and Custodial Officer Supplemental (LECOS) Retirement Plan was established in 1979 and is governed by Title 8, Subtitle B of the Texas Government Code. The program provides supplemental retirement benefits to certain certified peace officers and custodial officers specified in statute.
Letter of Transmittal
6 Introductory Section � 2020 Comprehensive Annual Financial Report �Employees Retirement System of Texas

The Judicial Retirement Plan I and Plan II were established to provide benefits for judges. Both Plans were created under Article XVI, Section 67 of the Texas Constitution and are governed by Title 8, Subtitle E of the Texas Government Code. Plan I was established in 1940 as a pay-as-you-go pension plan. The Judicial Retirement Plan II is governed by Section 840.103 and 840.106, Texas Government Code, and was established as a new plan of actuarially funded retirement benefits for judges becoming members of the Judicial Retirement System after August 31, 1985. Although the Texas Judicial Retirement Systems are separate legal entities, the Employees Retirement System of Texas and the Texas Judicial Retirement Systems are a single accounting entity because they are governed by the same Board of Trustees (the Board), directed by the same management, and part of the System’s goal of administering comprehensive and actuarially sound retirement programs.
Accountability for all fiscal and budgetary matters is the responsibility of the Board. Operating administrative expenses, including capital items, are budgeted annually. The Board must approve any subsequent budget increase. Budgetary control is maintained in the financial system with automated edits, and through processes and procedures for approvals, encumbrances, and reporting. The Legislature determines the level of member and state contributions and benefit structures for the pension plans.
FINANCIAL CONDITION
Investment Performance
The investment portfolio closed the fiscal year with a fair value of $29.1 billion and had a gross return of 6.85% for the year. The time weighted rate of return for three and five years were 6.46% and 7.34% respectively.
The System’s investments are highly diversified and based on an asset allocation intended to withstand market fluctuations. The System successfully sustained operations and investment management during the COVID-19 pandemic. It maintains a professional and diversified investment program optimizing the mix of internal management and external advisors. During Fiscal Year 2020, the System completed the evaluation of appropriateness, adequacy and effectiveness of the system’s investment practices and performance, as set out in SB 322 passed by the 86th Legislature. Please refer to the Investment Section for additional information in investment policies, strategies, safeguards and fees.
Funding Status
The Employees Retirement Plan actuarial value of assets to the actuarial accrued liability ratio was 66% for funding purposes as of August 31, 2020. The main goal of ERS’ retirement programs is to fully fund the long-term cost of benefits provided by statute through disciplined and timely accumulation of contributions and prudent investment of assets. The ERS Pension Funding Priorities and Guidelines document lays out a multi-level funding goal to achieve actuarial soundness: (1) fund normal costs; (2) avoid trust fund depletion; (3) meet current statutory standard of a 31-year funding period for unfunded liabilities; and (4) match funding period to the average years of service at retirement once a 31-year funding period is achieved with a closed amortization period. Contributions to the Employees Retirement Plan exceed the normal cost, but are not at the actuarially determined sound level and are not projected to be sufficient to eliminate the unfunded liability over a finite period of time.
The LECOS Retirement Plan actuarial value of assets to the actuarial accrued liability ratio was 60.1% for funding purposes as of August 31, 2020. The JRS II Retirement Plan actuarial valuation of assets to the actuarial accrued liability ratio was 82.3% as of August 31, 2020. Contributions to JRS II are less than the normal cost and no payment is available to amortize the unfunded liability. The System is committed to working with the Legislature to return the retirement plans to an actuarially sound status. Additional information on funding status is presented in the Financial and Actuarial Sections.
The Board of Trustees and Members of the Employees Retirement System of TexasDecember 18, 2020Page 2
Employees Retirement System of Texas � 2020 Comprehensive Annual Financial Report � Introductory Section 7

New Accounting Standards
The System evaluated new reporting standards issued by the Governmental Accounting Standards board to assess applicability. The System adopted GASB Statement No. 84 Fiduciary Activities on September 1, 2019. This Statement establishes criteria for identifying fiduciary activities of all state and local governments.
Based on the reporting requirements from this pronouncement, the System has reclassified the following from Agency Funds to:
• General Funds - Judicial Retirement System Plan I and Unappropriated Receipts General Revenue Fund;• Custodial Funds - USPS – Direct Deposit Return Money Fund, USPS – Overpayment to Employees
Fund, Direct Deposit Correction Account Fund, and Child Support Employee Deduction –Offset Account; and
• Internal Service Fund – Health Savings Account.
Additional information on reporting changes is presented in the Financial Section
MAJOR INITIATIVES
The System has submitted a Legislative Appropriation Request (LAR) consistent with its funding policy to the Texas Legislature on the status of the state employee, judicial and supplemental law enforcement and custodial officer plans. The LAR seeks to increase state contributions to the three pre-funded pension plans to the actuarial sound contribution level as determined by statute.
The System continues to analyze and design innovative approaches to provide a quality health care plan and other benefits at a reasonable cost. During Fiscal Year 2020, the System developed and implemented the HealthSelectShoppERS member rewards program, which seeks to reduce group benefit costs by rewarding participants for choosing in-network lower cost providers for certain elective procedures under the HealthSelect of Texas® medical plan. During Fiscal Year 2021, the System is working to develop more robust reporting specific to mental health services and utilization.
The ERS Annex, which was the original ERS building, was demolished in early 2019 to make room for a new building which will maximize the location adjacent to University of Texas and Dell Medical School, and in close proximity to the Capital. Construction of the building has continued and prospective tenants have begun touring the facility. ERS will occupy a portion of one floor of the building in response to the agency’s space planning needs.
The System continues to enhance performance and accountability by expanding the use of technological solutions. During FY 20, the System expanded its use of video conferencing tools to continue operations while working remotely. To improve efficiency and member services using current technology, it engaged a consultant to help evaluate and identify solutions to replace aging pension and insurance benefit. It anticipates issuing a request for proposals in Fiscal Year 2021.
AWARDS
Certificate of Achievement for Excellence in Financial Reporting
The Government Finance Officers Association (GFOA) of the United States and Canada awarded the Certificate of Achievement for Excellence in Financial Reporting to the System for its Comprehensive Annual Financial Report for the fiscal year ended August 31, 2018. The Certificate of Achievement is a prestigious national award recognizing excellence in the preparation of state and local government financial reports. To be awarded a
The Board of Trustees and Members of the Employees Retirement System of TexasDecember 18, 2020Page 3
8 Introductory Section � 2020 Comprehensive Annual Financial Report �Employees Retirement System of Texas

Certificate of Achievement, a government unit must publish an easily readable and efficiently organized comprehensive annual financial report whose contents meet or exceed program standards and satisfy both generally accepted accounting principles and applicable legal requirements. .A Certificate of Achievement is valid for one year. The System has received a Certificate of Achievement for each of the last 31 years. We believe the current report continues to meet the Certificate of Achievement program requirements and it is being submitted it to the GFOA for consideration again this year.
Public Pension Standards Award for Administration
The Public Pension Coordinating Council (PPCC) gave the 2020 Public Pension Standards Award for Administration to the System in recognition of meeting professional standards for plan administration as set forth in the Public Pension Standards.
ACKNOWLEDGMENTS
The preparation of this report on a timely basis was accomplished with the efficient and dedicated service of the Finance staff and other employees of the System. I would like to express my appreciation for management’s support in preparing this report and to all the employees of the System who contributed to its preparation.
Sincerely,
Machelle Pharr, CPAChief Financial Officer
The Board of Trustees and Members of the Employees Retirement System of TexasDecember 20, 2020Page 4
Employees Retirement System of Texas � 2020 Comprehensive Annual Financial Report � Introductory Section 9

10 Introductory Section � 2020 Comprehensive Annual Financial Report �Employees Retirement System of Texas

Employees Retirement System of Texas � 2020 Comprehensive Annual Financial Report � Introductory Section 11

Organizational Chart and DataAs of August 31, 2020
12 Introductory Section � 2020 Comprehensive Annual Financial Report �Employees Retirement System of Texas

Consulting Actuaries
Mitchell L. Bilbe, FSAPhilip S. Dial, FSAChristopher S. Johnson, FSARudd and Wisdom, Inc.
Ryan Falls, FSA, FCA, EA, MAAAJoseph Newton, FSA, FCA, EA, MAAADana Woolfrey, FSA, FCA, EA, MAAAGabriel, Roeder, Smith & Company
Investment Advisory Committee
Robert G. Alley, CFA, ChairGene L. Needles, Jr., Vice-ChairChairman and CEO,Resolute Investment ManagersCaroline CooleyChief Investment Officer – Diversified Funds,Crestline Investors, Inc.Laurie L. DotterJames R. Hille, CFA, CAIAChief Investment Officer,Texas Christian University EndowmentKen D. MindellSenior Vice-President and Treasurer,Rosewood Management CorporationMilton Hixson, CPA, CFPCEO,FMP Wealth Advisors
Investment Consultants
Aksia TorreyCove Partners, LLCAlbourne America, LLCCBRE Caledon Capital Management Inc.Meketa Investment GroupNEPC, LLC
External Investment Advisors
Domestic EquityBarrow, Hanley, Mewhinney & Strauss, LLCBrandywine Global Investment Management, LLC
International EquityAcadian Asset ManagementAxiom International Investors, LLCBlackRock, Inc.EAM Investors, LLCFranklin Templeton Institutional, LLCGlobal Alpha Capital Management LimitedKayne Anderson Rudnick Investment Management, LLCLazard Asset ManagementQuantitative Management Associates, LLC
Manager of Emerging ManagersLegato Capital Management, LLC
Global Custodian
BNY Mellon Asset Servicing
Group Benefits Advisory Committee
Large State Agency RepresentativesSandra WhiteDepartment of Criminal JusticeMatthew MillerDepartment of Motor Vehicles
Mid-sized State Agency RepresentativesMegan LaVoieOffice of Court AdministrationJane ThomasLottery Commission
Small State Agency RepresentativeTeresa NelsonDepartment of Savings and Mortgage Lending
Four-year Institution of Higher Education Representative
Janet BeznerTexas State University
Two-year Institution of Higher Education representativeMissy KittnerMcLennan Community College
Retiree RepresentativesJames Dobbins, GarlandGary White, Austin
Health-Related Institution RepresentativeCynthia JumperTexas Tech University Health Sciences Center
Insurance or Benefit Design Consultant Representative
Jennifer CawleyTexas Association of Life and Health Insurers
Medical Board
Ace Alsup, M.D.William Deaton, M.D.William P. Taylor, M.D.William M. Loving, M.D.
Please refer to pages 102 to 103 in the Investment Section for a schedule of fees and commission.
Consultants and AdvisorsAs of August 31, 2020
Employees Retirement System of Texas � 2020 Comprehensive Annual Financial Report � Introductory Section 13

14 Introductory Section � 2020 Comprehensive Annual Financial Report �Employees Retirement System of Texas

The Employees Retirement System of Texas was created by the Texas Legislature in 1947 and is administered in accordance with the Texas Constitution. The System provides a retirement and disability pension system for State employees, law enforcement and custodial officers, elected state officials and two classes of judges. The System administers the trust funds, with a fiduciary obligation to the members and retirees of the System who are its beneficiaries.
The retirement programs complement the Social Security and Medicare programs by providing a retirement annuity with service, disability and survivorship benefits. The Employees Retirement System of Texas Plan (ERS), the Law Enforcement and Custodial Officer Supplemental Retirement Plan (LECOS), and Judicial Retirement System of Texas Plan Two (JRS II) are single employer defined benefit pension plans. The Judicial Retirement System of Texas Plan One (JRS I) is a pay-as-you-go plan for justices assuming the bench prior to September 1, 1985.
For a complete description of the provision of the law that describes the Retirement Plans, see Vernon’s Texas Statutes and Codes Annotated (V.T.S.C.A.), Texas Government Code, Title 8. The following is a summary of the various plan provisions.
Membership:ERS Employee Class Only:
• Employees and appointed officers of every department, commission, board, agency, or institution of the State except those who are included in the coverage of Teacher Retirement System of Texas, and JRS II
Elected Class Only:• Persons who hold State offices that are normally filled by statewide election
and that are not included under the plan provisions of JRS II.• Members of the Legislature.• District and criminal district attorneys.
LECOS • Law enforcement officers recognized as commissioned law enforcement officers by the Texas Commission on Law Enforcement Officer Standards and Education and employed at an agency defined by statute.
• Custodial officers certified in accordance with the statutory requirements as having a normal job assignment that requires frequent or infrequent planned contact with inmates of that institution and employed at an agency defined by statute.
JRS II • Judges, justices and commissioners of the Supreme Court, the Court of Criminal Appeals, the Court of Appeals, District Courts, and certain commissions to a court who commenced service after August 31, 1985.
Service Retirement Eligibility without Reduced Benefits:ERS Employee Class Only:
Hire date prior to 9-1-2009:• Age 60 with at least five years of service credit, or• Rule-of-80 with at least five years of service credit, or• Age 55 with at least 10 years of service credit as a certified peace officer or
custodial officer.Hire date on or after 9-1-2009 and prior to 9-1-2013:• Age 65 with 10 years of service credit, or• Rule-of-80, with at least 10 years of service credit at age 60, or• Age 60 with at least 10 years of service credit as a certified peace officer or
custodial officer.Hire date on or after 9-1-2013: • Age 65 with 10 years of service credit, or • Rule-of-80, with at least 10 years of service credit at age 62, or• Age 62 with at least 10 years of service credit as a certified peace officer or
custodial officer.
Summary of Plan ProvisionsEffective since September 1, 2009 (Except as noted below)
Employees Retirement System of Texas � 2020 Comprehensive Annual Financial Report � Introductory Section 15
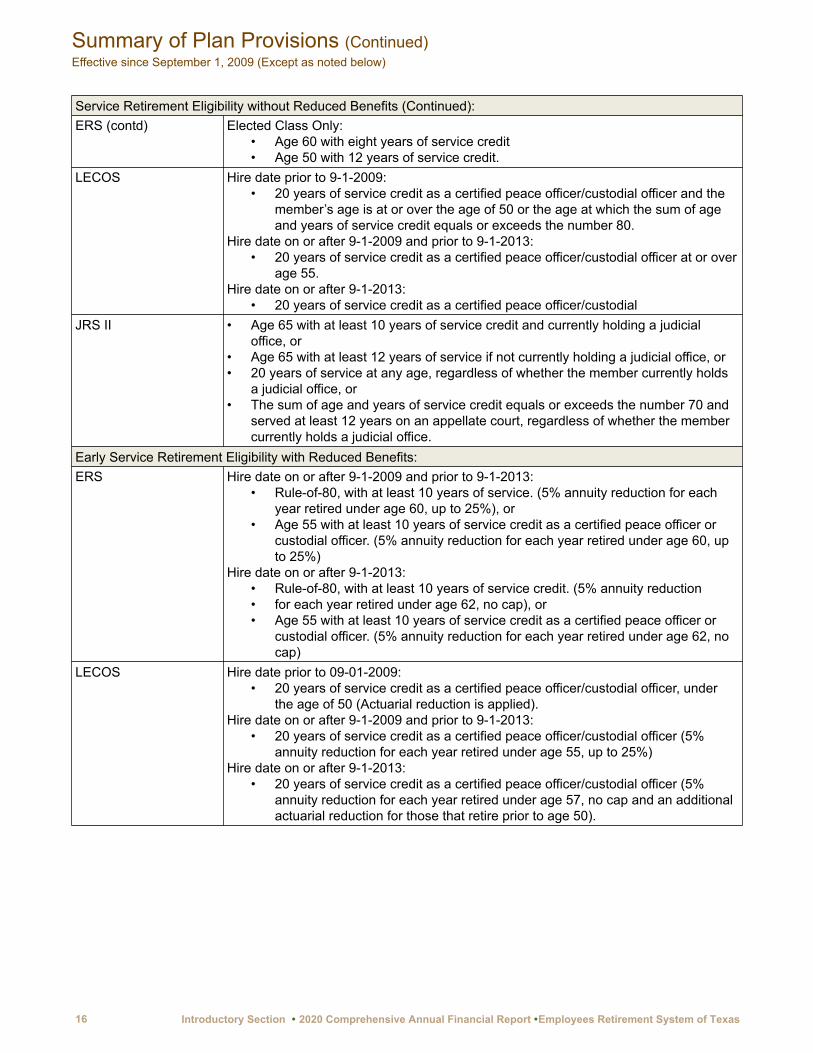
Service Retirement Eligibility without Reduced Benefits (Continued):ERS (contd) Elected Class Only:
• Age 60 with eight years of service credit• Age 50 with 12 years of service credit.
LECOS Hire date prior to 9-1-2009:• 20 years of service credit as a certified peace officer/custodial officer and the
member’s age is at or over the age of 50 or the age at which the sum of age and years of service credit equals or exceeds the number 80.
Hire date on or after 9-1-2009 and prior to 9-1-2013:• 20 years of service credit as a certified peace officer/custodial officer at or over
age 55.Hire date on or after 9-1-2013:
• 20 years of service credit as a certified peace officer/custodialJRS II • Age 65 with at least 10 years of service credit and currently holding a judicial
office, or• Age 65 with at least 12 years of service if not currently holding a judicial office, or• 20 years of service at any age, regardless of whether the member currently holds
a judicial office, or• The sum of age and years of service credit equals or exceeds the number 70 and
served at least 12 years on an appellate court, regardless of whether the member currently holds a judicial office.
Early Service Retirement Eligibility with Reduced Benefits:ERS Hire date on or after 9-1-2009 and prior to 9-1-2013:
• Rule-of-80, with at least 10 years of service. (5% annuity reduction for each year retired under age 60, up to 25%), or
• Age 55 with at least 10 years of service credit as a certified peace officer or custodial officer. (5% annuity reduction for each year retired under age 60, up to 25%)
Hire date on or after 9-1-2013:• Rule-of-80, with at least 10 years of service credit. (5% annuity reduction• for each year retired under age 62, no cap), or• Age 55 with at least 10 years of service credit as a certified peace officer or
custodial officer. (5% annuity reduction for each year retired under age 62, no cap)
LECOS Hire date prior to 09-01-2009:• 20 years of service credit as a certified peace officer/custodial officer, under
the age of 50 (Actuarial reduction is applied).Hire date on or after 9-1-2009 and prior to 9-1-2013:
• 20 years of service credit as a certified peace officer/custodial officer (5% annuity reduction for each year retired under age 55, up to 25%)
Hire date on or after 9-1-2013:• 20 years of service credit as a certified peace officer/custodial officer (5%
annuity reduction for each year retired under age 57, no cap and an additional actuarial reduction for those that retire prior to age 50).
Summary of Plan Provisions (Continued)Effective since September 1, 2009 (Except as noted below)
16 Introductory Section � 2020 Comprehensive Annual Financial Report �Employees Retirement System of Texas
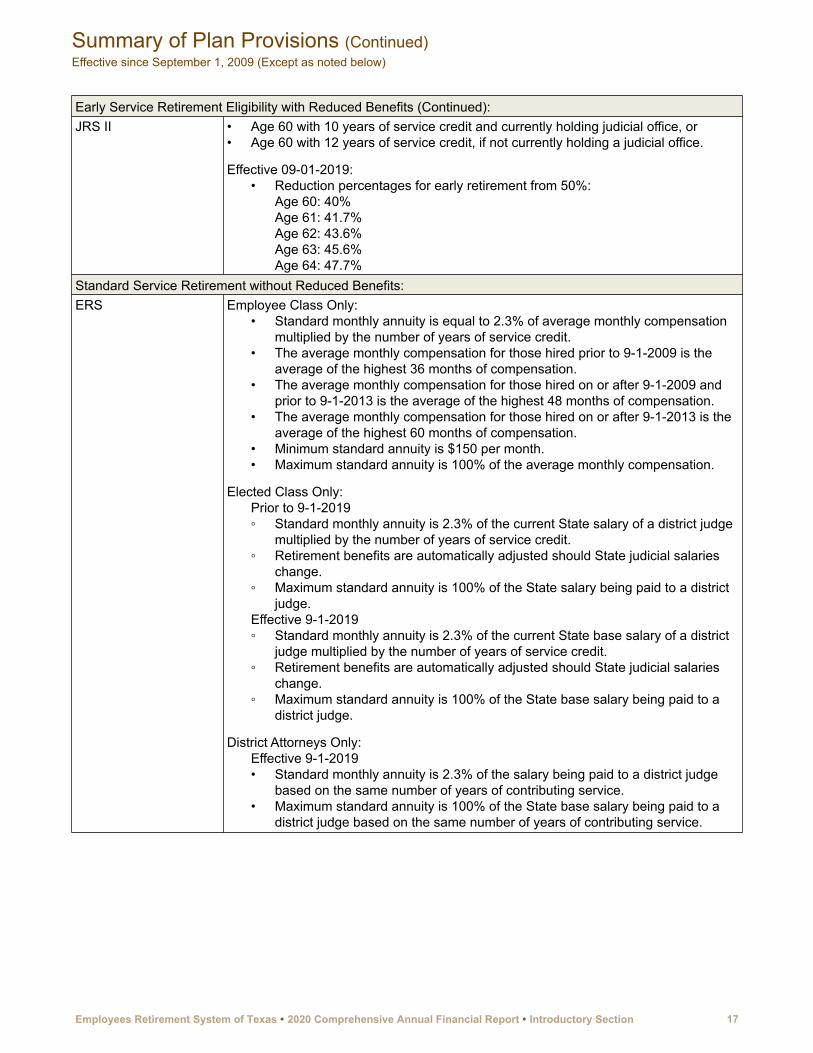
Early Service Retirement Eligibility with Reduced Benefits (Continued):JRS II • Age 60 with 10 years of service credit and currently holding judicial office, or
• Age 60 with 12 years of service credit, if not currently holding a judicial office.
Effective 09-01-2019:• Reduction percentages for early retirement from 50%:
Age 60: 40%Age 61: 41.7%Age 62: 43.6%Age 63: 45.6%Age 64: 47.7%
Standard Service Retirement without Reduced Benefits:ERS Employee Class Only:
• Standard monthly annuity is equal to 2.3% of average monthly compensation multiplied by the number of years of service credit.
• The average monthly compensation for those hired prior to 9-1-2009 is the average of the highest 36 months of compensation.
• The average monthly compensation for those hired on or after 9-1-2009 and prior to 9-1-2013 is the average of the highest 48 months of compensation.
• The average monthly compensation for those hired on or after 9-1-2013 is the average of the highest 60 months of compensation.
• Minimum standard annuity is $150 per month.• Maximum standard annuity is 100% of the average monthly compensation.
Elected Class Only:Prior to 9-1-2019◦ Standard monthly annuity is 2.3% of the current State salary of a district judge
multiplied by the number of years of service credit.◦ Retirement benefits are automatically adjusted should State judicial salaries
change.◦ Maximum standard annuity is 100% of the State salary being paid to a district
judge.Effective 9-1-2019◦ Standard monthly annuity is 2.3% of the current State base salary of a district
judge multiplied by the number of years of service credit.◦ Retirement benefits are automatically adjusted should State judicial salaries
change.◦ Maximum standard annuity is 100% of the State base salary being paid to a
district judge.
District Attorneys Only:Effective 9-1-2019• Standard monthly annuity is 2.3% of the salary being paid to a district judge
based on the same number of years of contributing service.• Maximum standard annuity is 100% of the State base salary being paid to a
district judge based on the same number of years of contributing service.
Summary of Plan Provisions (Continued)Effective since September 1, 2009 (Except as noted below)
Employees Retirement System of Texas � 2020 Comprehensive Annual Financial Report � Introductory Section 17
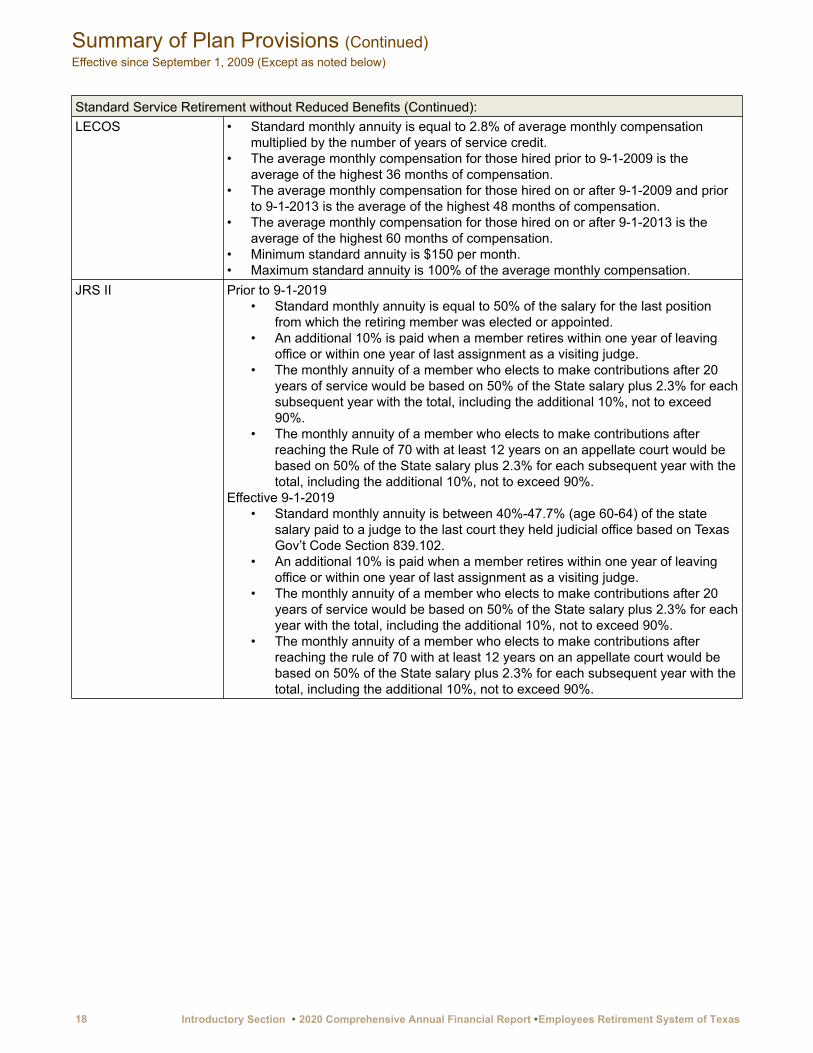
Standard Service Retirement without Reduced Benefits (Continued):LECOS • Standard monthly annuity is equal to 2.8% of average monthly compensation
multiplied by the number of years of service credit.• The average monthly compensation for those hired prior to 9-1-2009 is the
average of the highest 36 months of compensation.• The average monthly compensation for those hired on or after 9-1-2009 and prior
to 9-1-2013 is the average of the highest 48 months of compensation.• The average monthly compensation for those hired on or after 9-1-2013 is the
average of the highest 60 months of compensation.• Minimum standard annuity is $150 per month.• Maximum standard annuity is 100% of the average monthly compensation.
JRS II Prior to 9-1-2019• Standard monthly annuity is equal to 50% of the salary for the last position
from which the retiring member was elected or appointed.• An additional 10% is paid when a member retires within one year of leaving
office or within one year of last assignment as a visiting judge.• The monthly annuity of a member who elects to make contributions after 20
years of service would be based on 50% of the State salary plus 2.3% for each subsequent year with the total, including the additional 10%, not to exceed 90%.
• The monthly annuity of a member who elects to make contributions after reaching the Rule of 70 with at least 12 years on an appellate court would be based on 50% of the State salary plus 2.3% for each subsequent year with the total, including the additional 10%, not to exceed 90%.
Effective 9-1-2019• Standard monthly annuity is between 40%-47.7% (age 60-64) of the state
salary paid to a judge to the last court they held judicial office based on Texas Gov’t Code Section 839.102.
• An additional 10% is paid when a member retires within one year of leaving office or within one year of last assignment as a visiting judge.
• The monthly annuity of a member who elects to make contributions after 20 years of service would be based on 50% of the State salary plus 2.3% for each year with the total, including the additional 10%, not to exceed 90%.
• The monthly annuity of a member who elects to make contributions after reaching the rule of 70 with at least 12 years on an appellate court would be based on 50% of the State salary plus 2.3% for each subsequent year with the total, including the additional 10%, not to exceed 90%.
Summary of Plan Provisions (Continued)Effective since September 1, 2009 (Except as noted below)
18 Introductory Section � 2020 Comprehensive Annual Financial Report �Employees Retirement System of Texas
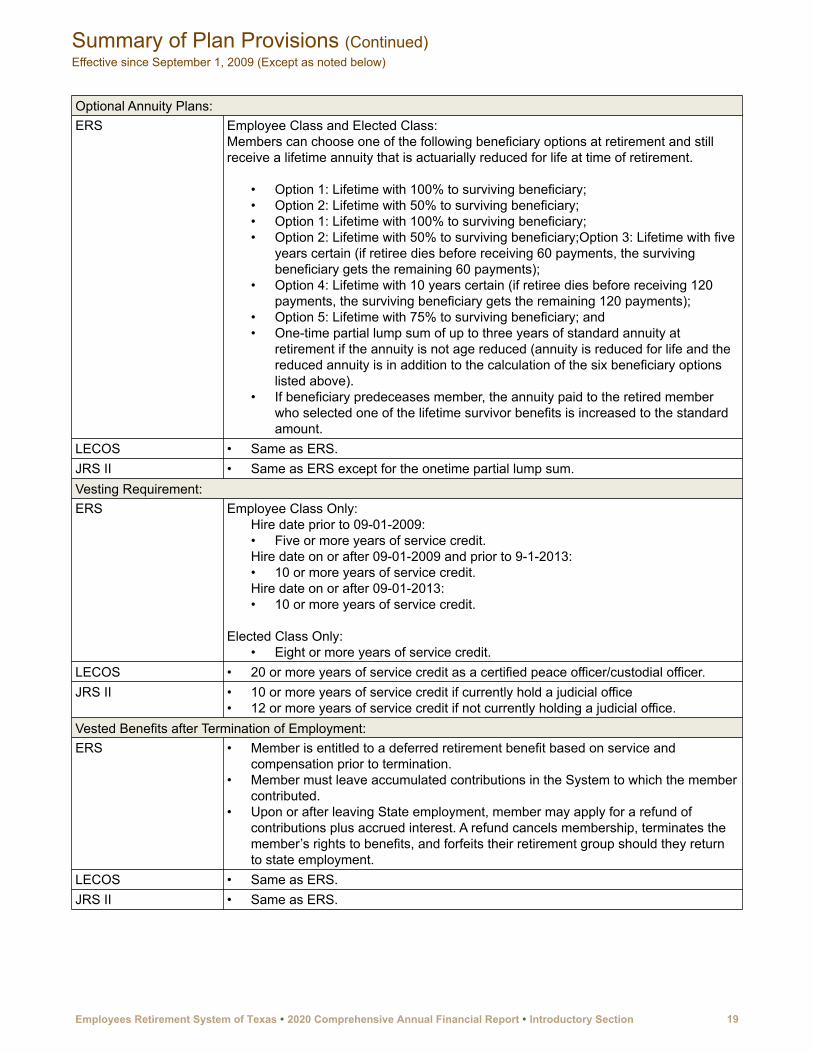
Optional Annuity Plans:ERS Employee Class and Elected Class:
Members can choose one of the following beneficiary options at retirement and still receive a lifetime annuity that is actuarially reduced for life at time of retirement.
• Option 1: Lifetime with 100% to surviving beneficiary;• Option 2: Lifetime with 50% to surviving beneficiary;• Option 1: Lifetime with 100% to surviving beneficiary;• Option 2: Lifetime with 50% to surviving beneficiary;Option 3: Lifetime with five
years certain (if retiree dies before receiving 60 payments, the surviving beneficiary gets the remaining 60 payments);
• Option 4: Lifetime with 10 years certain (if retiree dies before receiving 120 payments, the surviving beneficiary gets the remaining 120 payments);
• Option 5: Lifetime with 75% to surviving beneficiary; and• One-time partial lump sum of up to three years of standard annuity at
retirement if the annuity is not age reduced (annuity is reduced for life and the reduced annuity is in addition to the calculation of the six beneficiary options listed above).
• If beneficiary predeceases member, the annuity paid to the retired member who selected one of the lifetime survivor benefits is increased to the standard amount.
LECOS • Same as ERS.JRS II • Same as ERS except for the onetime partial lump sum.Vesting Requirement:ERS Employee Class Only:
Hire date prior to 09-01-2009:• Five or more years of service credit.Hire date on or after 09-01-2009 and prior to 9-1-2013:• 10 or more years of service credit.Hire date on or after 09-01-2013:• 10 or more years of service credit.
Elected Class Only:• Eight or more years of service credit.
LECOS • 20 or more years of service credit as a certified peace officer/custodial officer.JRS II • 10 or more years of service credit if currently hold a judicial office
• 12 or more years of service credit if not currently holding a judicial office.Vested Benefits after Termination of Employment:ERS • Member is entitled to a deferred retirement benefit based on service and
compensation prior to termination.• Member must leave accumulated contributions in the System to which the member
contributed.• Upon or after leaving State employment, member may apply for a refund of
contributions plus accrued interest. A refund cancels membership, terminates the member’s rights to benefits, and forfeits their retirement group should they return to state employment.
LECOS • Same as ERS.JRS II • Same as ERS.
Summary of Plan Provisions (Continued)Effective since September 1, 2009 (Except as noted below)
Employees Retirement System of Texas � 2020 Comprehensive Annual Financial Report � Introductory Section 19
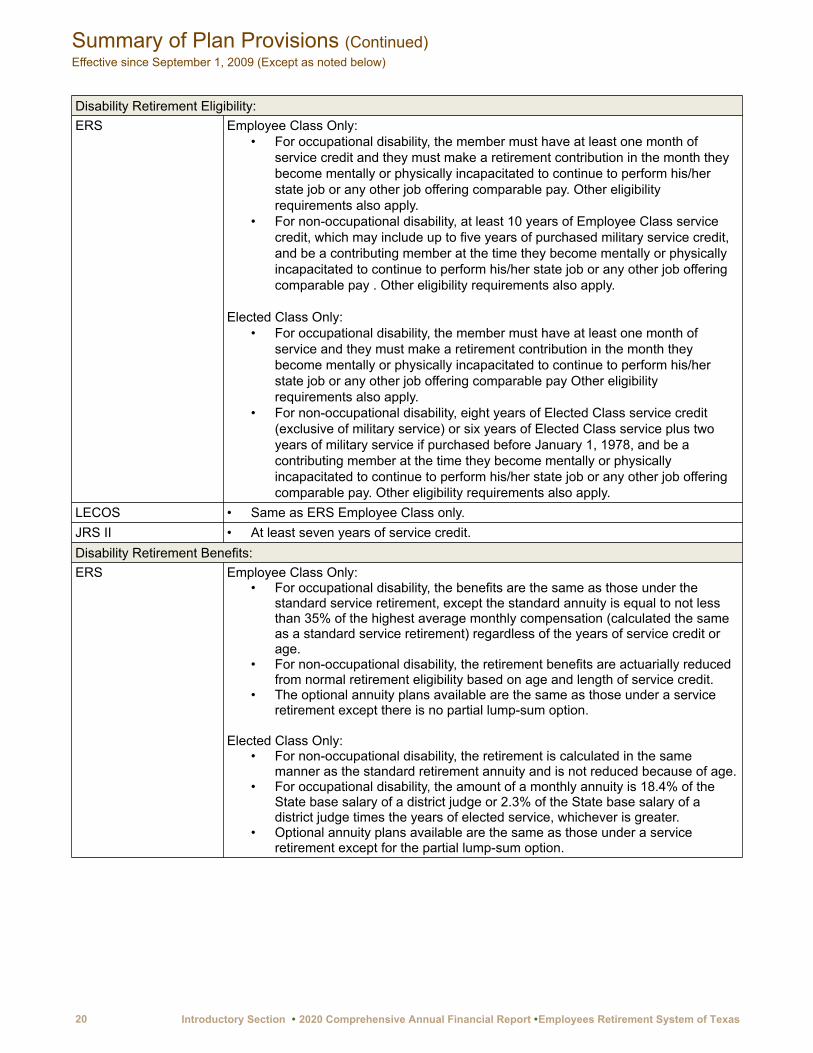
Disability Retirement Eligibility:ERS Employee Class Only:
• For occupational disability, the member must have at least one month of service credit and they must make a retirement contribution in the month they become mentally or physically incapacitated to continue to perform his/her state job or any other job offering comparable pay. Other eligibility requirements also apply.
• For non-occupational disability, at least 10 years of Employee Class service credit, which may include up to five years of purchased military service credit, and be a contributing member at the time they become mentally or physically incapacitated to continue to perform his/her state job or any other job offering comparable pay . Other eligibility requirements also apply.
Elected Class Only:• For occupational disability, the member must have at least one month of
service and they must make a retirement contribution in the month they become mentally or physically incapacitated to continue to perform his/her state job or any other job offering comparable pay Other eligibility requirements also apply.
• For non-occupational disability, eight years of Elected Class service credit (exclusive of military service) or six years of Elected Class service plus two years of military service if purchased before January 1, 1978, and be a contributing member at the time they become mentally or physically incapacitated to continue to perform his/her state job or any other job offering comparable pay. Other eligibility requirements also apply.
LECOS • Same as ERS Employee Class only.JRS II • At least seven years of service credit.Disability Retirement Benefits:ERS Employee Class Only:
• For occupational disability, the benefits are the same as those under the standard service retirement, except the standard annuity is equal to not less than 35% of the highest average monthly compensation (calculated the same as a standard service retirement) regardless of the years of service credit or age.
• For non-occupational disability, the retirement benefits are actuarially reduced from normal retirement eligibility based on age and length of service credit.
• The optional annuity plans available are the same as those under a service retirement except there is no partial lump-sum option.
Elected Class Only:• For non-occupational disability, the retirement is calculated in the same
manner as the standard retirement annuity and is not reduced because of age.• For occupational disability, the amount of a monthly annuity is 18.4% of the
State base salary of a district judge or 2.3% of the State base salary of a district judge times the years of elected service, whichever is greater.
• Optional annuity plans available are the same as those under a service retirement except for the partial lump-sum option.
Summary of Plan Provisions (Continued)Effective since September 1, 2009 (Except as noted below)
20 Introductory Section � 2020 Comprehensive Annual Financial Report �Employees Retirement System of Texas

Disability Retirement Benefits (Continued):LECOS • For occupational disability, the standard annuity is a minimum of 50% of the
highest average monthly compensation (calculated the same as a standard service retirement) regardless of the years of service credit or age.
• The standard annuity is increased to 100% of the average monthly compensation (calculated the same as a standard service retirement) if the retired member can prove that their occupational disability makes them incapable of substantial gainful activity solely because of the occupational disability and they are considered totally disabled under federal social security law due to the same condition that qualified them for occupational benefits.
• For non-occupational disability, the retirement benefits are actuarially reduced from normal retirement eligibility based on age and length of service.
• The optional annuity plans available are the same as those under a service retirement except for the partial lump-sum option.
JRS II • Same as standard JRS II service retirement benefits.Death Benefits:ERS Non-Retiree Employee Class:
• If an active state employee dies and the death is determined to be an occupational death, the surviving spouse or minor children may be eligible for a one-time death benefit equal to one year of the member’s salary. If there is not a surviving spouse or minor children, this occupational death benefit is not payable to anyone else.
A contributing member with less than 10 years of service credit:• For a contributing member that had less than 10 years of service credit, the
designated beneficiary(ies) or estate of the active account will receive a one-time refund of the member’s retirement account balance at the time of the member’s death.
A contributing member with at least 10 years of service credit:• May select a death benefit plan: a lifetime monthly payment, a 10-year
guaranteed monthly payment or a one-time refund of the retirement account balance at the time of the death. If the member was age 60 with five or more years of service credit and less than 10 years, and the beneficiary is either the spouse or a minor child, they may be eligible for a death benefit plan.
• If a one-time refund of the member’s retirement account balance is selected, the beneficiary(ies) or estate may be eligible for an Additional Death Benefit (ADB). This is an additional 5% of the member’s retirement account balance for each full year of state service. The maximum is 100% of the member’s retirement account balance.
• If a lifetime monthly payment or a 10-year guaranteed monthly payment is selected, the beneficiary(ies) or estate are eligible for a one-time partial lump sum of up to three years of monthly payment.
Retiree Employee Class:• If a member selected an optional service retirement and dies, the beneficiary
will receive a monthly payment based on the option chosen.• If a retired member selected a standard annuity and dies after retiring from the
state, the designated beneficiary(ies) or estate will receive a one-time refund of the member’s retirement account balance if there is any money left in the account.
• If the member was retired, the designated beneficiary(ies) or estate is eligible for a one-time Retiree Lump Sum Death Benefit in the amount of $5,000. If retired under the Proportionate Retirement Program with less than five years of service credit, this payment will be reduced proportionately.
Summary of Plan Provisions (Continued)Effective since September 1, 2009 (Except as noted below)
Employees Retirement System of Texas � 2020 Comprehensive Annual Financial Report � Introductory Section 21
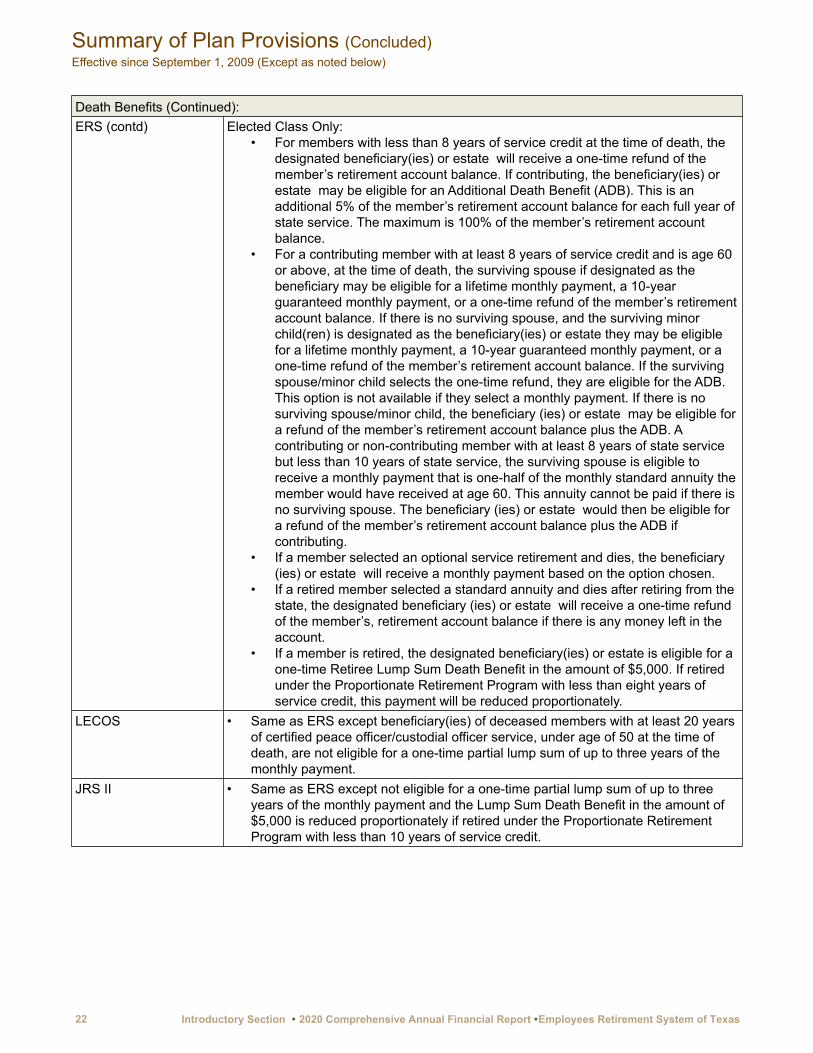
Death Benefits (Continued):ERS (contd) Elected Class Only:
• For members with less than 8 years of service credit at the time of death, the designated beneficiary(ies) or estate will receive a one-time refund of the member’s retirement account balance. If contributing, the beneficiary(ies) or estate may be eligible for an Additional Death Benefit (ADB). This is an additional 5% of the member’s retirement account balance for each full year of state service. The maximum is 100% of the member’s retirement account balance.
• For a contributing member with at least 8 years of service credit and is age 60 or above, at the time of death, the surviving spouse if designated as the beneficiary may be eligible for a lifetime monthly payment, a 10-year guaranteed monthly payment, or a one-time refund of the member’s retirement account balance. If there is no surviving spouse, and the surviving minor child(ren) is designated as the beneficiary(ies) or estate they may be eligible for a lifetime monthly payment, a 10-year guaranteed monthly payment, or a one-time refund of the member’s retirement account balance. If the surviving spouse/minor child selects the one-time refund, they are eligible for the ADB. This option is not available if they select a monthly payment. If there is no surviving spouse/minor child, the beneficiary (ies) or estate may be eligible for a refund of the member’s retirement account balance plus the ADB. A contributing or non-contributing member with at least 8 years of state service but less than 10 years of state service, the surviving spouse is eligible to receive a monthly payment that is one-half of the monthly standard annuity the member would have received at age 60. This annuity cannot be paid if there is no surviving spouse. The beneficiary (ies) or estate would then be eligible for a refund of the member’s retirement account balance plus the ADB if contributing.
• If a member selected an optional service retirement and dies, the beneficiary (ies) or estate will receive a monthly payment based on the option chosen.
• If a retired member selected a standard annuity and dies after retiring from the state, the designated beneficiary (ies) or estate will receive a one-time refund of the member’s, retirement account balance if there is any money left in the account.
• If a member is retired, the designated beneficiary(ies) or estate is eligible for a one-time Retiree Lump Sum Death Benefit in the amount of $5,000. If retired under the Proportionate Retirement Program with less than eight years of service credit, this payment will be reduced proportionately.
LECOS • Same as ERS except beneficiary(ies) of deceased members with at least 20 years of certified peace officer/custodial officer service, under age of 50 at the time of death, are not eligible for a one-time partial lump sum of up to three years of the monthly payment.
JRS II • Same as ERS except not eligible for a one-time partial lump sum of up to three years of the monthly payment and the Lump Sum Death Benefit in the amount of $5,000 is reduced proportionately if retired under the Proportionate Retirement Program with less than 10 years of service credit.
Summary of Plan Provisions (Concluded)Effective since September 1, 2009 (Except as noted below)
22 Introductory Section � 2020 Comprehensive Annual Financial Report �Employees Retirement System of Texas

FINANCIAL SECTION
Independent Auditor’s Report
Management’s Discussion and Analysis
Basic Financial Statements
Required Supplementary Information
Other Supplementary Information
23

24 Financial Section � 2020 Comprehensive Annual Financial Report � Employees Retirement System of Texas
Employees Retirement System of Texas � 2020 Comprehensive Annual Financial Report � Financial Section 25

26 Financial Section � 2020 Comprehensive Annual Financial Report � Employees Retirement System of Texas

Employees Retirement System of Texas � 2020 Comprehensive Annual Financial Report � Financial Section 27

We are pleased to provide this overview of the financial activities of the Employees Retirement System of Texas (the System) for the year ended August 31, 2020. Please read it in conjunction with the Basic Financial Statements, which begin after this discussion.
Overview of the Basic Financial StatementsThis discussion and analysis is intended to serve as an introduction to the System’s financial statements. The Financial Section includes the following exhibits in the Basic Financial Statements Section.
• Exhibits I and II are the government-wide statements of governmental net position and activities. These exhibits exclude the Fiduciary Fund activities and balances.
• Exhibits III and IV are Special Revenue Funds statements for four of the programs presented in the government-wide statements.
• Exhibits V and VI are the Statement of Net Position and the Statement of Revenues, Expenses, and Changes in Net Position for the Employees Life, Accident and Health Insurance and Benefits Fund (Group Benefits Program). Highlights are presented under the heading Financial Analysis on Government-wide Statements below.
• Exhibit VII is a required Statement of Cash Flows for the Proprietary Fund under which the Employees Life, Accident and Health Insurance and Benefits Fund (Group Benefits Program) is reported. This statement reports the transactions for the year on a cash basis. It is similar to Exhibit VI, the Statement of Revenues, Expenses, and Changes in Net Position, except that the focus of this statement is on the change to cash balances with accrued income and expense items eliminated.
• Exhibits VIII and IX, the Statement of Fiduciary Net Position and the Statement of Changes in Fiduciary Net Position, report activities of the defined benefit plans, including the retiree insurance plan. These exhibits also report the cafeteria plan and other deferred compensation plans.
Financial Analysis on Government-wide StatementsThe government-wide activities of the System arecomprised of seven programs:
• Social Security Administration,• Death Benefits for Public Safety Officers,• Compensation to Victims of Crime,• Death Benefits for Retirees, • Judicial Retirement System Plan One, • Unappropriated Receipts General Revenue, and
• Employees Life, Accident and Health Insurance and Benefits
The Employees Life, Accident and Health Insurance and Benefits in Exhibits I and II had significant changes from the prior year. Exhibits V and VI provide additional information on the Employees Life, Accident and Health Insurance and Benefits. The changes in the program are summarized in millions as follows:
2020 2019 Changes$ $ %
Net Position 2,591.96 2,033.43 27.47 Current Liabilities 713.94 708.10 0.82 Member and Employer Contributions 2,765.37 3,092.00 (10.56)
Benefit Payments 2,298.10 2,212.81 3.85
The change in Net Position is primarily due to increase in interest revenues from the fixed income investments and savings generated from third party administrator and pharmacy benefit manager contracts.
Financial Highlights – Fiduciary Funds• Net position of the Fiduciary Funds administered by
the System totaled $29.51 billion as of August 31, 2020, compared with $28.83 billion as of August 31, 2019. The investment portfolio returned 6.85% for the year. The majority of the increase resulted primarily from improvement in market conditions. The time weighted rate of return for three and five years were 6.46% and 7.34%, respectively.
• The one year money-weighted rates of return for the Fiduciary Funds are summarized as follows:
Fund Name Rate (%)%
Employees Retirement System 6.70
Law Enforcement and Custodial Officer Supplemental Retirement Fund
6.64
Judicial Retirement System of Texas Plan Two 6.78Overall 6.70
• The System’s management has confidence in the financial markets and maintains a long term approach to investing the System’s assets. The System’s investments are highly diversified and are designed to withstand market fluctuations.
Management’s Discussion and AnalysisYear Ended August 31, 2020
28 Financial Section � 2020 Comprehensive Annual Financial Report � Employees Retirement System of Texas

Asset AllocationAsset Class %Alternative Investments 30.08Directional Growth 1.41Global Credit Fixed Income Securities 12.26Global Public Equity Special Situations 1.79International Equity 16.53Large Cap Domestic Equity 17.30Small and Mid Cap Domestic Equity 2.95Other Investments 2.16Hedge Funds 4.47Rates Fixed Income Securities 11.05
For additional details, please see the Report on Investment Activity in the Investment Section.
• Changes in contributions and benefit payments in the Defined Benefit Plans are summarized in millions as follows:
2020 2019 Changes$ $ %
Contributions:Retirement & Other 1,611.71 1,564.75 3.00Insurance 897.20 510.86 75.63
Total (Exh. IX) 2,508.91 2,075.61 20.88Benefit Payments:
Retirement & Other 2,848.39 2,754.79 3.36Insurance 846.74 828.75 2.17
Total (Exh. IX) 3,695.13 3,583.54 3.09
• The increase in insurance contributions is primarily due to the increase of funding from the Group Benefits Program. The most recent actuarial valuations of the funded defined benefit plans were completed as of August 31, 2020. The funded ratios are as follows:
Plans 2020 2019% %
Employees Retirement System 66.0 70.5Law Enforcement and Custodial Officer Supplemental Retirement Fund
60.1 65.3
Judicial Retirement System of Texas Plan Two
82.3 87.5
See Exhibits VIII and IX for more information regarding each of the defined benefit plans and the deferred compensation and cafeteria plans.
Fiduciary Net PositionThe amount of changes in fiduciary net position (inmillions) were as follows:
2020 2019 Changes$ $ %
Changes in Fiduciary Net Position (Exh. IX) 672.79 (741.46) 190.74
Total Net Position 29,506.89 28,834.11 2.33
The increase in changes in Fiduciary Net Position is due primarily to conditions in the financial markets. The gross time weighted rate of return was 6.85%, which was higher than the previous year return of 3.04%.
AdditionsRetirement benefits are financed through the collection of member and State retirement contributions, investment income, legislative appropriations, and contributions transferred from the Teacher Retirement System. Additions in Fiduciary Net Position have been extracted from Exhibit IX, Statement of Changes in Fiduciary Net Position. The additions in millions were as follows:
2020 2019 Changes$ $
Member Contributions 801.21 782.95 2.33 Employer Contributions 1,520.75 1,152.90 31.91 Non-Employer Contributing Entity Contributions 37.74 20.18 87.02 Net Investment Income 1,884.31 801.77 135.02 Other Additions 226.07 195.76 15.48 Total Additions (Exh. IX) 4,470.08 2,953.56 51.35
The increase in the net investment income is due primarily to the improvement in the financial markets compared to the previous year. The increase in contribution from employer and non-employer contributing entities is primarily due to the increase of funding from the Group Benefits Program.
For the Employees Retirement Fund, member and State retirement contribution rates for fiscal year 2019 were 9.5% and 10.0% respectively. For the Law Enforcement and Custodial Officer Supplemental Retirement Fund (LECOS), both the State and member contributed 0.5% of the covered payroll. For the Judicial Retirement Plan II Fund,
Management’s Discussion and Analysis (Continued)Year Ended August 31, 2020
Employees Retirement System of Texas � 2020 Comprehensive Annual Financial Report � Financial Section 29

member and State retirement contribution rates were 9.5% and 15.663% respectively.
Net investment income is comprised of interest income, dividend income, securities lending income and related fees, and net appreciation or depreciation in fair value of investments, and is net of investment expenses.
DeductionsBenefit payments are the primary expense of a retirement system. Total deductions are comprised of benefit payments, refunds of contributions to members or beneficiaries for reasons of separation from service or death, other death benefit payments, contributions transferred to the Teacher Retirement System, and the cost of administering the System. Deductions in Net Position have been extracted from Exhibit IX, Statement of Changes in Fiduciary Net Position. Changes in deductions are summarized in millions as follows:
2020 2019 Changes$ $ %
Retirement Benefits and Refunds 3,761.05 3,654.95 2.90 Administrative Expenses 35.03 38.76 (9.62) Other Deductions 1.21 1.31 (7.63) Total Deductions(Exh. IX) 3,797.29 3,695.02 2.77
AssetsInvestments, both short-term and long-term, are the primary asset of the System’s pension and other employee benefit trust funds as shown in the following table. Asset information has been extracted from Exhibit VIII. Changes in assets are summarized in millions as follows:
2020 2019 Changes$ $ %
Cash and Cash Equivalents 128.79 110.53 16.52
Securities Lending Collateral 112.86 154.22 (26.82)
Legislative Appropriation 0.25 — 100.00
Investments 28,979.23 28,203.99 2.75 Receivables 615.44 1,450.79 (57.58) Due From Other Funds/Agencies 22.58 44.16 (48.87)
Capital Assets 43.79 14.84 195.08 Total Assets (Exh. VIII) 29,902.94 29,978.53 (0.25)
LiabilitiesThe condensed liabilities have been extracted from Exhibit VIII, Statement of Fiduciary Net Position.Changes in liabilities are summarized in millions as follows:
2020 2019 Changes$ $ %
Accounts Payable 273.04 991.4 (72.46)
Due To Other Funds/ Agencies 5.37 7.08 (24.15) Compensable Leave 4.36 3.45 26.38 Securities Lending Obligations 112.89 141.65 (20.30) Other Liabilities 0.39 0.84 (53.57) Total Liabilities (Exh. VIII) 396.05 1,144.42 (65.39)
Funding Status and ProgressCurrently, pension benefit payments exceed pension contributions. During fiscal year 2020, the Board of Trustees decreased the assumed rate of return to 7%. ERS is working with State leadership on a path to reduce the unfunded accrued actuarial liability and achieve actuarial soundness.
For funding purposes, the latest annual actuarial valuation of the System, as of August 31, 2020, (compared to the August 31, 2019 actuarial valuation) is summarized in millions as follows:
Unfunded Actuarial Accrued Liability
Plans 2020 2019 $ $
Employees Retirement System (14,715.10) (11,741.24) Law Enforcement and Custodial Officer Supplemental Retirement Fund (641.52) (514.51)
Judicial Retirement System of Texas Plan Two (104.43) (66.78)
For the Employees Retirement System Fund, the August 31, 2020 actuarial valuation shows an unfunded accrued liability of $14.72 billion. The funded ratio, the ratio of the actuarial value of assets to the actuarial accrued liability, is 66% as of August 31, 2020. The valuation shows that the total normal cost is 14.16% of payroll and total contributions are 19.5% of payroll. The total contribution rate exceeds the normal cost by 5.34% of payroll, but is not sufficient to amortize the unfunded accrued liability over a finite period of time. The total contribution to fund the normal cost plus amortize the unfunded
Management’s Discussion and Analysis (Continued)Year Ended August 31, 2020
30 Financial Section � 2020 Comprehensive Annual Financial Report � Employees Retirement System of Texas
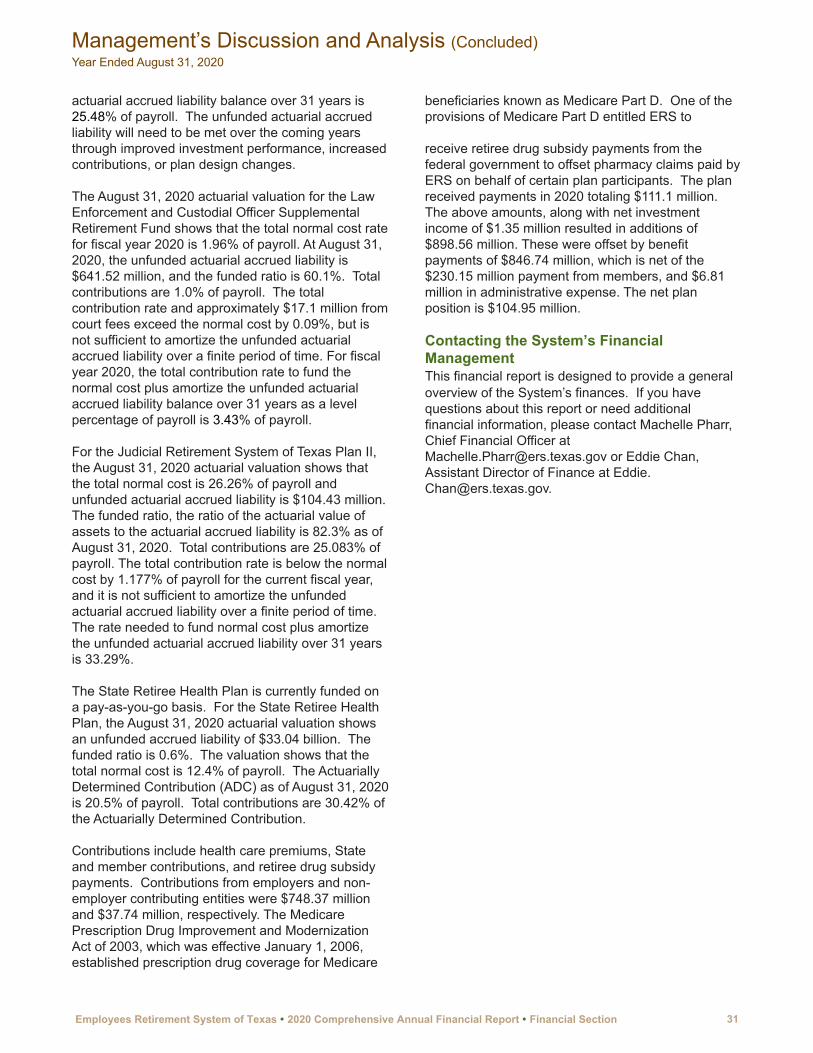
actuarial accrued liability balance over 31 years is 25.48% of payroll. The unfunded actuarial accrued liability will need to be met over the coming years through improved investment performance, increased contributions, or plan design changes.
The August 31, 2020 actuarial valuation for the Law Enforcement and Custodial Officer Supplemental Retirement Fund shows that the total normal cost rate for fiscal year 2020 is 1.96% of payroll. At August 31, 2020, the unfunded actuarial accrued liability is $641.52 million, and the funded ratio is 60.1%. Total contributions are 1.0% of payroll. The total contribution rate and approximately $17.1 million from court fees exceed the normal cost by 0.09%, but is not sufficient to amortize the unfunded actuarial accrued liability over a finite period of time. For fiscal year 2020, the total contribution rate to fund the normal cost plus amortize the unfunded actuarial accrued liability balance over 31 years as a level percentage of payroll is 3.43% of payroll.
For the Judicial Retirement System of Texas Plan II, the August 31, 2020 actuarial valuation shows that the total normal cost is 26.26% of payroll and unfunded actuarial accrued liability is $104.43 million. The funded ratio, the ratio of the actuarial value of assets to the actuarial accrued liability is 82.3% as of August 31, 2020. Total contributions are 25.083% of payroll. The total contribution rate is below the normal cost by 1.177% of payroll for the current fiscal year, and it is not sufficient to amortize the unfunded actuarial accrued liability over a finite period of time. The rate needed to fund normal cost plus amortize the unfunded actuarial accrued liability over 31 years is 33.29%.
The State Retiree Health Plan is currently funded on a pay-as-you-go basis. For the State Retiree Health Plan, the August 31, 2020 actuarial valuation shows an unfunded accrued liability of $33.04 billion. The funded ratio is 0.6%. The valuation shows that the total normal cost is 12.4% of payroll. The Actuarially Determined Contribution (ADC) as of August 31, 2020 is 20.5% of payroll. Total contributions are 30.42% of the Actuarially Determined Contribution.
Contributions include health care premiums, State and member contributions, and retiree drug subsidy payments. Contributions from employers and non-employer contributing entities were $748.37 million and $37.74 million, respectively. The Medicare Prescription Drug Improvement and Modernization Act of 2003, which was effective January 1, 2006, established prescription drug coverage for Medicare
beneficiaries known as Medicare Part D. One of the provisions of Medicare Part D entitled ERS to
receive retiree drug subsidy payments from the federal government to offset pharmacy claims paid by ERS on behalf of certain plan participants. The plan received payments in 2020 totaling $111.1 million. The above amounts, along with net investment income of $1.35 million resulted in additions of $898.56 million. These were offset by benefit payments of $846.74 million, which is net of the $230.15 million payment from members, and $6.81 million in administrative expense. The net plan position is $104.95 million.
Contacting the System’s Financial ManagementThis financial report is designed to provide a general overview of the System’s finances. If you have questions about this report or need additional financial information, please contact Machelle Pharr, Chief Financial Officer at [email protected] or Eddie Chan, Assistant Director of Finance at Eddie. [email protected].
Management’s Discussion and Analysis (Concluded)Year Ended August 31, 2020
Employees Retirement System of Texas � 2020 Comprehensive Annual Financial Report � Financial Section 31

GovernmentalActivities
AssetsCurrent Assets:Cash and Cash Equivalents:
Cash in State Treasury $93,706,877 Total Cash and Cash Equivalents 93,706,877
Securities Lending Collateral 8,166,676 Short-Term Investments 1,056,508,516 Legislative Appropriations 192,037 Receivables 273,683,187 Due from Fiduciary Funds 917,867
Total Current Assets 1,433,175,160 Non-Current Assets: Public Equities 11,453,063 Fixed Income 1,759,062,058 Alternative Investments 102,410,698
Total Non-Current Assets 1,872,925,819 Total Assets 3,306,100,979
LiabilitiesCurrent Liabilities: Payables 694,743,047 Due to Fiduciary Funds 11,270,875 Unearned Revenue 158 Obligations Under Securities Lending 8,130,431 Total Current Liabilities 714,144,511
Total Liabilities 714,144,511
Net PositionRestricted for: Employees Life, Accident and Health Insurance and Benefits 2,591,955,247
Unrestricted 1,221 Total Net Position (Exh. II & III) $2,591,956,468
The accompanying Notes to the Basic Financial Statements are an integral part of this exhibit.
Exhibit IStatement of Net PositionAugust 31, 2020
32 Financial Section � 2020 Comprehensive Annual Financial Report � Employees Retirement System of Texas

Program Revenues
Net (Expense)Revenue and
Changes in NetPosition
ExpensesChanges for
Services
OperatingGrants and
ContributionsGovernmental
Activities
Functions/Programs $ $ $ $Governmental Activities Judicial Retirement System Plan One 19,941,228 19,941,228 Social Security Administration 116,947 66,457 (50,490) Death Benefits-Peace Officers, Firemen, etc. 7,839,475 7,839,475 Compensation to Victims of Crime 3,500,000 3,500,000 Death Benefits-Retiree $5,000 Lump Sum 9,695,882 9,695,882 Employees Life, Accident and Health
Insurance and Benefits 2,315,144,687 2,765,508,158 108,162,637 558,526,108 Total Governmental Activities 2,356,238,219 2,806,551,200 108,162,637 558,475,618
General Revenues:Transfers 47,500
Total General Revenues 47,500
Change in Net Position (Exh. IV) 558,523,118 Net Position - Beginning 2,033,433,350
Net Position - Ending (Exh. I) 2,591,956,468
The accompanying Notes to the Basic Financial Statements are an integral part of this exhibit.
Exhibit IIStatement of ActivitiesYear Ended August 31, 2020
Employees Retirement System of Texas � 2020 Comprehensive Annual Financial Report � Financial Section 33
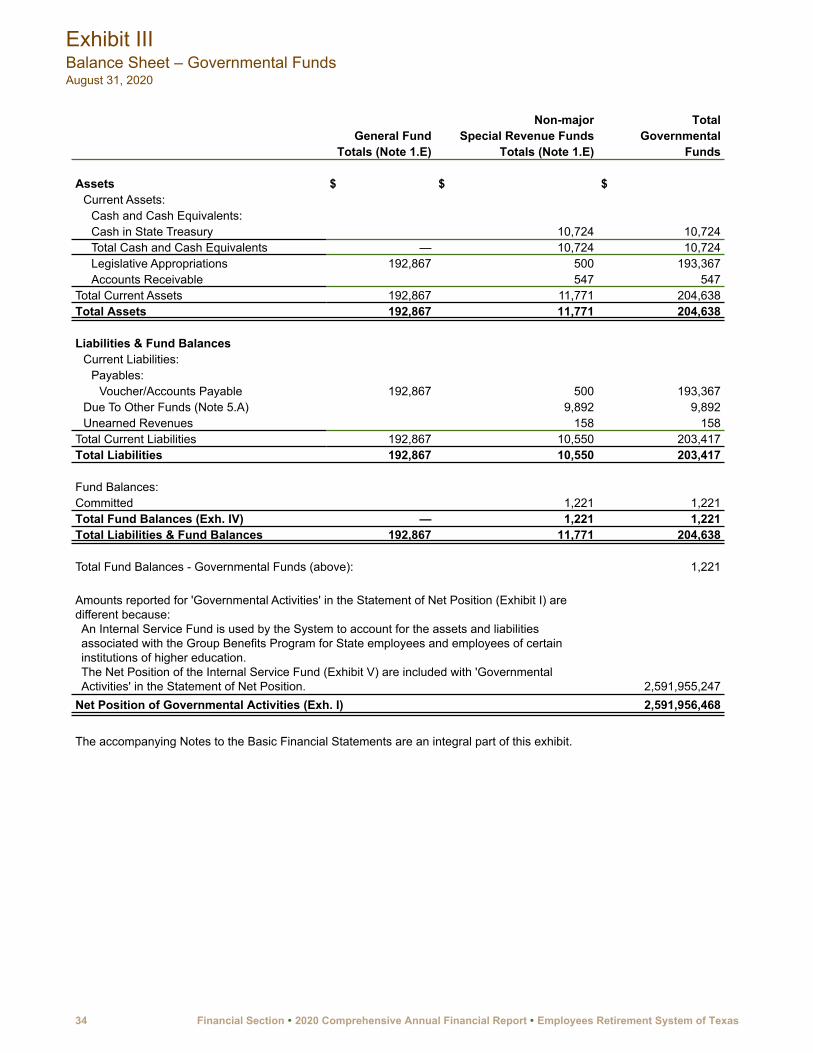
Non-major TotalGeneral Fund Special Revenue Funds Governmental
Totals (Note 1.E) Totals (Note 1.E) Funds
Assets $ $ $Current Assets:
Cash and Cash Equivalents:Cash in State Treasury 10,724 10,724Total Cash and Cash Equivalents — 10,724 10,724Legislative Appropriations 192,867 500 193,367Accounts Receivable 547 547
Total Current Assets 192,867 11,771 204,638Total Assets 192,867 11,771 204,638
Liabilities & Fund BalancesCurrent Liabilities:
Payables:Voucher/Accounts Payable 192,867 500 193,367
Due To Other Funds (Note 5.A) 9,892 9,892Unearned Revenues 158 158
Total Current Liabilities 192,867 10,550 203,417Total Liabilities 192,867 10,550 203,417
Fund Balances:Committed 1,221 1,221Total Fund Balances (Exh. IV) — 1,221 1,221Total Liabilities & Fund Balances 192,867 11,771 204,638
Total Fund Balances - Governmental Funds (above): 1,221
Amounts reported for 'Governmental Activities' in the Statement of Net Position (Exhibit I) are different because: An Internal Service Fund is used by the System to account for the assets and liabilities associated with the Group Benefits Program for State employees and employees of certain institutions of higher education. The Net Position of the Internal Service Fund (Exhibit V) are included with 'Governmental Activities' in the Statement of Net Position. 2,591,955,247
Net Position of Governmental Activities (Exh. I) 2,591,956,468
The accompanying Notes to the Basic Financial Statements are an integral part of this exhibit.
Exhibit IIIBalance Sheet – Governmental FundsAugust 31, 2020
34 Financial Section � 2020 Comprehensive Annual Financial Report � Employees Retirement System of Texas

General Fund
Non-majorSpecial Revenue
FundsTotal
GovernmentalTotals (Note 1.E) Totals (Note 1.E) Funds
Revenues $ $ $Legislative Appropriations out of the State's General Revenue Fund:Appropriation Revenue:
For Judicial Retirement System Plan One 19,941,228 19,941,228 For Death Benefits Peace Officers, etc. 7,839,475 7,839,475 For Victims of Crime (554,118) (554,118) For Death Benefits-Retirees 13,750,000 13,750,000
Total Appropriation Revenue 19,941,228 21,035,357 40,976,585 Administration Fees for Social Security Administration — 66,457 66,457
Total Revenues 19,941,228 21,101,814 41,043,042
ExpendituresCurrent:
Death Benefits 21,035,357 21,035,357 Retirement Benefits 19,941,228 19,941,228 Administrative Expenditures:
Salaries & Wages 73,212 73,212 Payroll Related Costs 24,144 24,144 Professional Fees & Services 4,879 4,879 Travel 792 792 Materials & Supplies 4,493 4,493 Communications & Utilities 1,942 1,942 Repairs & Maintenance 5,439 5,439 Rentals & Leases 940 940 Printing & Reproduction 80 80 Other Expenditures 1,026 1,026
Total Administrative Expenditures — 116,947 116,947 Total Expenditures 19,941,228 21,152,304 41,093,532
Deficiency of Revenues Under Expenditures — (50,490) (50,490) Other Financing Sources
Transfers In-Retirement Membership Fees (Note 5.B) 47,500 47,500 Net Change in Fund Balance — (2,990) (2,990)
Fund Balances - Beginning 4,211 4,211 Fund Balances - Ending (Exh. III) — 1,221 1,221
Net Change in Fund Balances - Governmental Funds: (2,990)
Amounts reported for 'Governmental Activities' in the Statement of Activities (Exhibit II) are different because: An Internal Service Fund is used by the System to account for the revenues and expenses associated with the Group Benefits Program for State employees and employees of certain institutions of higher education. The net revenue (expense) of the Internal Service Fund (Exhibit VI) is included in 'Governmental Activities' in the Statement of Activities. 558,526,108
Change in Net Position of Governmental Activities (Exh. II) 558,523,118
The accompanying Notes to the Basic Financial Statements are an integral part of this exhibit.
Exhibit IVStatement of Revenues, Expenditures and Changes in Fund Balances – Governmental FundsYear Ended August 31, 2020
Employees Retirement System of Texas � 2020 Comprehensive Annual Financial Report � Financial Section 35

Internal Service FundEmployees Life, Accident andHealth Insurance and Benefits
Fund (0973) (U/F 0973 and 4973)Assets
Current Assets: Cash and Cash Equivalents: Cash in State Treasury $93,696,153 Total Cash and Cash Equivalents 93,696,153 Securities Lending Collateral 8,166,676 Short-Term Investments 1,056,508,516 Receivables: Interest Receivable 12,062,092 Accounts Receivable 259,925,209 Unsettled Sales-Investment Receivables 1,694,009 Total Receivables 273,681,310 Due From Other Funds (Note 5.A) 917,867
Total Current Assets 1,432,970,522
Non-Current Assets:Investments: (Note 2.A)
Public Equities 11,453,063 Fixed Income 1,759,062,058 Alternative Investments 102,410,698
Total Non-Current Assets 1,872,925,819 Total Assets 3,305,896,341
LiabilitiesCurrent Liabilities:Payables:
Claims Payable: Incurred, Self-Funded 56,302,938 Incurred But Not Reported, Self-Funded 618,851,172
Total Claims Payable 675,154,110 Premiums Payable 8,333,247 Administrative and Other Fees Payable 6,061,103 Accounts and Other Payable 149,036 Unsettled Purchases-Investment Payables 4,852,184
Total Payables 694,549,680 Due To Other Funds (Note 5.A) :
Other Interfunds Payable 11,260,983 Total Due To Other Funds 11,260,983
Obligations Under Securities Lending 8,130,431 Total Current Liabilities 713,941,094
Total Liabilities 713,941,094
Net PositionRestricted For: Employee Life, Accident and Health Insurance and Benefits 2,591,955,247
Total Net Position (Exh. VI) $2,591,955,247
The accompanying Notes to the Basic Financial Statements are an integral part of this exhibit.
Exhibit VStatement of Net Position – Proprietary FundAugust 31, 2020
36 Financial Section � 2020 Comprehensive Annual Financial Report � Employees Retirement System of Texas

Internal Service FundEmployees Life, Accident and Health Insurance and Benefits
Fund (0973) (U/F 0973 and 4973)Operating Revenues
Contributions to Insurance Program:From Employers $2,219,781,558 From Members:
For Employees 538,515,397 For COBRA 7,069,636
Total Contributions from Members 545,585,033 Total Contributions to Insurance Program 2,765,366,591 Other Operating Revenues: COBRA 2% Administration Fee 141,567 Penalty Assessed to Insurance Carrier 11,161,094 Miscellaneous Operating Revenue 763,208
Total Other Operating Revenues 12,065,869 Total Operating Revenues 2,777,432,460 Operating Expenses
Employee Benefit Payments: For Employees1 2,269,292,767 For COBRA 27,664,272 For Health Savings Accounts 1,138,090
Total Employee Benefit Payments 2,298,095,129 Administrative Expenses: Salaries & Wages 8,539,911 Payroll Related Costs 2,900,337 Professional Fees & Services 1,486,765 Travel 36,064 Materials & Supplies 698,686 Communications & Utilities 475,884 Repairs & Maintenance 592,507 Rentals & Leases 206,021 Printing & Reproduction 46,721 Other Operating Expenses 2,165,509
Total Administrative Expenses 17,148,405 Total Operating Expenses 2,315,243,534 Operating Income 462,188,926 Non-Operating Revenues (Expenses) Net Increase in Fair Value of Investments 32,731,397 Interest Revenue 62,925,284 Securities Lending Activities: Loan Premium on Securities Lending 132,269 Broker Rebates 124,286 Agent Fees (25,439)
Net Securities Lending Activity 231,116 Settlement Revenue 449,385 Total Non-Operating Revenues 96,337,182 Change in Net Position 558,526,108 Net Position - Beginning 2,033,429,139 Net Position - Ending (Exh. V) $2,591,955,247
1 The benefit payments are reported net of $185,647,509 pharmacy rebates.
The accompanying Notes to the Basic Financial Statements are an integral part of this exhibit.
Exhibit VIStatement of Revenues, Expenses and Changes in Net Position – Proprietary FundYear Ended August 31, 2020
Employees Retirement System of Texas � 2020 Comprehensive Annual Financial Report � Financial Section 37

38 Financial Section � 2020 Comprehensive Annual Financial Report � Employees Retirement System of Texas

Internal Service FundEmployees Life, Accident and Health
Insurance and BenefitsFund (0973)/(U/F 0973 and 4973)
Cash Flows from Operating Activities: Cash Received from Members $507,704,954 Cash Received from Employers and Non-employer Contributing Entities 2,206,972,498 Cash Received from Pharmacy Rebates 139,041,953 Cash Payments to Insurance Carriers and Third Party Administrators (2,386,818,951) Cash Payments for Goods and Services (7,034,463) Other Cash Payments (1,685,568)
Net Cash Provided by Operating Activities 458,180,423
Cash Flows from Investing Activities: Net Purchases of Short-Term Investment Fund (506,191,344) Interest on Deposit in State Treasury 2,955,089
Net Cash Used by Investing Activities (503,236,255)
Net Decrease in Cash and Cash Equivalents (45,055,832)
Cash and Cash Equivalents: Beginning of Year 138,751,985 End of Year 93,696,153
Reconciliation of Operating Income to Net Cash Provided by Operating Activities:
Operating Income 462,188,926
Adjustments to Reconcile Operating Income to Net Cash Provided by Operating Activities:Settlement Revenue 449,385 Change in Assets and Liabilities:Increase in Accounts Receivable (22,921,373) Decrease in Due From Other Agencies 2,174,276 Decrease in Due From Other Funds 565,277 Increase in Accounts Payable 36,528,127 Decrease in Due To Other Funds (20,770,349) Decrease in Unearned Revenue (33,846)
Total Adjustments (4,008,503) Net Cash Provided by Operating Activities $458,180,423
Non-Cash Investing Activities: Net Appreciation in Fair Value of Non-Cash Equivalent Investments 32,731,397
The accompanying Notes to the Basic Financial Statements are an integral part of this exhibit.
Exhibit VIIStatement of Cash Flows – Proprietary FundYear Ended August 31, 2020
Employees Retirement System of Texas � 2020 Comprehensive Annual Financial Report � Financial Section 39
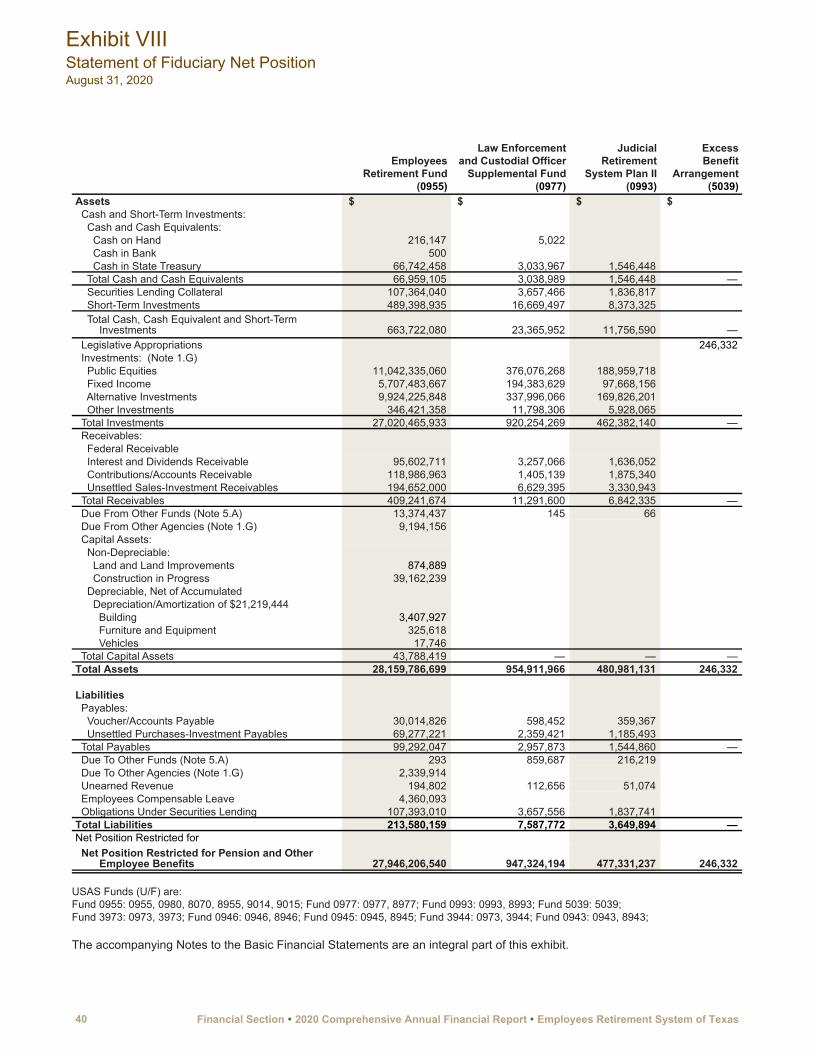
EmployeesRetirement Fund
(0955)
Law Enforcement and Custodial Officer
Supplemental Fund(0977)
JudicialRetirement
System Plan II(0993)
ExcessBenefit
Arrangement(5039)
Assets $ $ $ $ Cash and Short-Term Investments: Cash and Cash Equivalents: Cash on Hand 216,147 5,022 Cash in Bank 500 Cash in State Treasury 66,742,458 3,033,967 1,546,448 Total Cash and Cash Equivalents 66,959,105 3,038,989 1,546,448 — Securities Lending Collateral 107,364,040 3,657,466 1,836,817 Short-Term Investments 489,398,935 16,669,497 8,373,325
Total Cash, Cash Equivalent and Short-Term Investments 663,722,080 23,365,952 11,756,590 —
Legislative Appropriations 246,332 Investments: (Note 1.G) Public Equities 11,042,335,060 376,076,268 188,959,718 Fixed Income 5,707,483,667 194,383,629 97,668,156 Alternative Investments 9,924,225,848 337,996,066 169,826,201 Other Investments 346,421,358 11,798,306 5,928,065 Total Investments 27,020,465,933 920,254,269 462,382,140 — Receivables: Federal Receivable Interest and Dividends Receivable 95,602,711 3,257,066 1,636,052 Contributions/Accounts Receivable 118,986,963 1,405,139 1,875,340 Unsettled Sales-Investment Receivables 194,652,000 6,629,395 3,330,943 Total Receivables 409,241,674 11,291,600 6,842,335 — Due From Other Funds (Note 5.A) 13,374,437 145 66 Due From Other Agencies (Note 1.G) 9,194,156 Capital Assets: Non-Depreciable: Land and Land Improvements 874,889 Construction in Progress 39,162,239 Depreciable, Net of Accumulated Depreciation/Amortization of $21,219,444 Building 3,407,927 Furniture and Equipment 325,618 Vehicles 17,746 Total Capital Assets 43,788,419 — — — Total Assets 28,159,786,699 954,911,966 480,981,131 246,332
Liabilities Payables: Voucher/Accounts Payable 30,014,826 598,452 359,367 Unsettled Purchases-Investment Payables 69,277,221 2,359,421 1,185,493 Total Payables 99,292,047 2,957,873 1,544,860 — Due To Other Funds (Note 5.A) 293 859,687 216,219 Due To Other Agencies (Note 1.G) 2,339,914 Unearned Revenue 194,802 112,656 51,074 Employees Compensable Leave 4,360,093 Obligations Under Securities Lending 107,393,010 3,657,556 1,837,741 Total Liabilities 213,580,159 7,587,772 3,649,894 — Net Position Restricted for Net Position Restricted for Pension and Other
Employee Benefits 27,946,206,540 947,324,194 477,331,237 246,332
USAS Funds (U/F) are:Fund 0955: 0955, 0980, 8070, 8955, 9014, 9015; Fund 0977: 0977, 8977; Fund 0993: 0993, 8993; Fund 5039: 5039;Fund 3973: 0973, 3973; Fund 0946: 0946, 8946; Fund 0945: 0945, 8945; Fund 3944: 0973, 3944; Fund 0943: 0943, 8943;
The accompanying Notes to the Basic Financial Statements are an integral part of this exhibit.
Exhibit VIIIStatement of Fiduciary Net PositionAugust 31, 2020
40 Financial Section � 2020 Comprehensive Annual Financial Report � Employees Retirement System of Texas

State RetireeHealth Plan
(3973)
TotalDefined
Benefit Plans
Texa$aver401(k)
Trust Fund(0946)
Texa$aver457 Trust
Fund(0945)
CommuterSpendingAccount
Fund(3944)
StateEmployees
Cafeteria PlanTrust Fund
(0943)
TotalTotal Pension
and OtherEmployee
BenefitTrust Funds
$ $ $ $ $ $ $
21,145 242,314 242,314 500 401,208 129,119 530,827
46,925,167 118,248,040 2,785,836 3,681,772 482,324 2,822,583 128,020,555 46,946,312 118,490,854 3,187,044 3,810,891 482,324 2,822,583 128,793,696
112,858,323 112,858,323 38,026,345 552,468,102 68,312 23,594,214 576,130,628
84,972,657 783,817,279 3,187,044 3,810,891 550,636 26,416,797 817,782,647 246,332 246,332
11,607,371,046 11,607,371,046 5,999,535,452 5,999,535,452 10,432,048,115 10,432,048,115 364,147,729 364,147,729
— 28,403,102,342 — — — — 28,403,102,342
166,127,306 166,127,306 166,127,306 27,844 100,523,673 1,600 2,139 288 2,676 100,530,376 15,805,328 138,072,770 137,638 84,707 3,739 5,870,223 144,169,077
204,612,338 204,612,338 181,960,478 609,336,087 139,238 86,846 4,027 5,872,899 615,439,097 10,895 13,385,543 13,385,543
9,194,156 9,194,156
874,889 874,889 39,162,239 39,162,239
3,407,927 3,407,927 325,618 325,618 17,746 17,746
— 43,788,419 — — — — 43,788,419 266,944,030 29,862,870,158 3,326,282 3,897,737 554,663 32,289,696 29,902,938,536
160,266,446 191,239,091 401,208 129,119 290 8,447,664 200,217,372 72,822,135 72,822,135
160,266,446 264,061,226 401,208 129,119 290 8,447,664 273,039,507 1,708,987 2,785,186 95,979 58,981 6,100 86,289 3,032,535
2,339,914 2,339,914 21,145 379,677 5,770 385,447
4,360,093 4,360,093 112,888,307 112,888,307
161,996,578 386,814,403 497,187 193,870 6,390 8,533,953 396,045,803
104,947,452 29,476,055,755 2,829,095 3,703,867 548,273 23,755,743 29,506,892,733
Employees Retirement System of Texas � 2020 Comprehensive Annual Financial Report � Financial Section 41
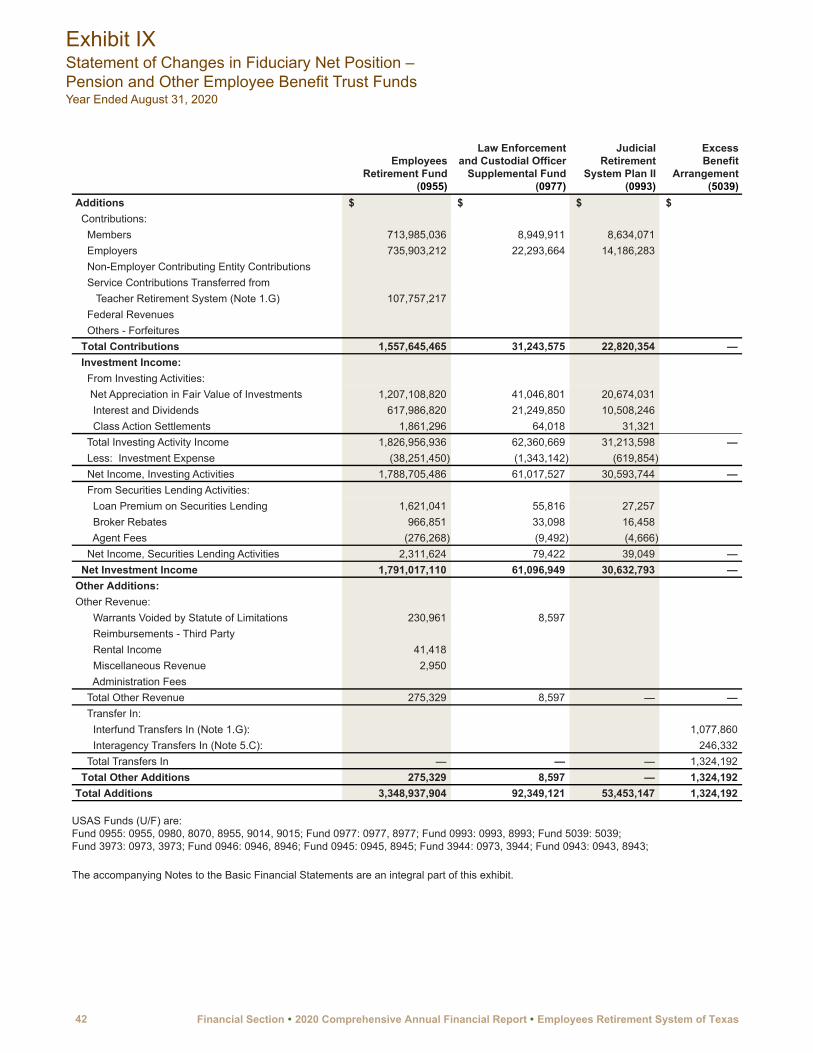
EmployeesRetirement Fund
(0955)
Law Enforcement and Custodial Officer
Supplemental Fund(0977)
JudicialRetirement
System Plan II(0993)
ExcessBenefit
Arrangement(5039)
Additions $ $ $ $ Contributions: Members 713,985,036 8,949,911 8,634,071 Employers 735,903,212 22,293,664 14,186,283 Non-Employer Contributing Entity Contributions Service Contributions Transferred from Teacher Retirement System (Note 1.G) 107,757,217 Federal Revenues Others - Forfeitures Total Contributions 1,557,645,465 31,243,575 22,820,354 — Investment Income: From Investing Activities: Net Appreciation in Fair Value of Investments 1,207,108,820 41,046,801 20,674,031 Interest and Dividends 617,986,820 21,249,850 10,508,246 Class Action Settlements 1,861,296 64,018 31,321 Total Investing Activity Income 1,826,956,936 62,360,669 31,213,598 — Less: Investment Expense (38,251,450) (1,343,142) (619,854) Net Income, Investing Activities 1,788,705,486 61,017,527 30,593,744 — From Securities Lending Activities: Loan Premium on Securities Lending 1,621,041 55,816 27,257 Broker Rebates 966,851 33,098 16,458 Agent Fees (276,268) (9,492) (4,666) Net Income, Securities Lending Activities 2,311,624 79,422 39,049 — Net Investment Income 1,791,017,110 61,096,949 30,632,793 — Other Additions:Other Revenue: Warrants Voided by Statute of Limitations 230,961 8,597 Reimbursements - Third Party Rental Income 41,418 Miscellaneous Revenue 2,950 Administration Fees Total Other Revenue 275,329 8,597 — — Transfer In: Interfund Transfers In (Note 1.G): 1,077,860 Interagency Transfers In (Note 5.C): 246,332 Total Transfers In — — — 1,324,192 Total Other Additions 275,329 8,597 — 1,324,192 Total Additions 3,348,937,904 92,349,121 53,453,147 1,324,192
USAS Funds (U/F) are:Fund 0955: 0955, 0980, 8070, 8955, 9014, 9015; Fund 0977: 0977, 8977; Fund 0993: 0993, 8993; Fund 5039: 5039;Fund 3973: 0973, 3973; Fund 0946: 0946, 8946; Fund 0945: 0945, 8945; Fund 3944: 0973, 3944; Fund 0943: 0943, 8943;
The accompanying Notes to the Basic Financial Statements are an integral part of this exhibit.
Exhibit IXStatement of Changes in Fiduciary Net Position –Pension and Other Employee Benefit Trust FundsYear Ended August 31, 2020
42 Financial Section � 2020 Comprehensive Annual Financial Report � Employees Retirement System of Texas
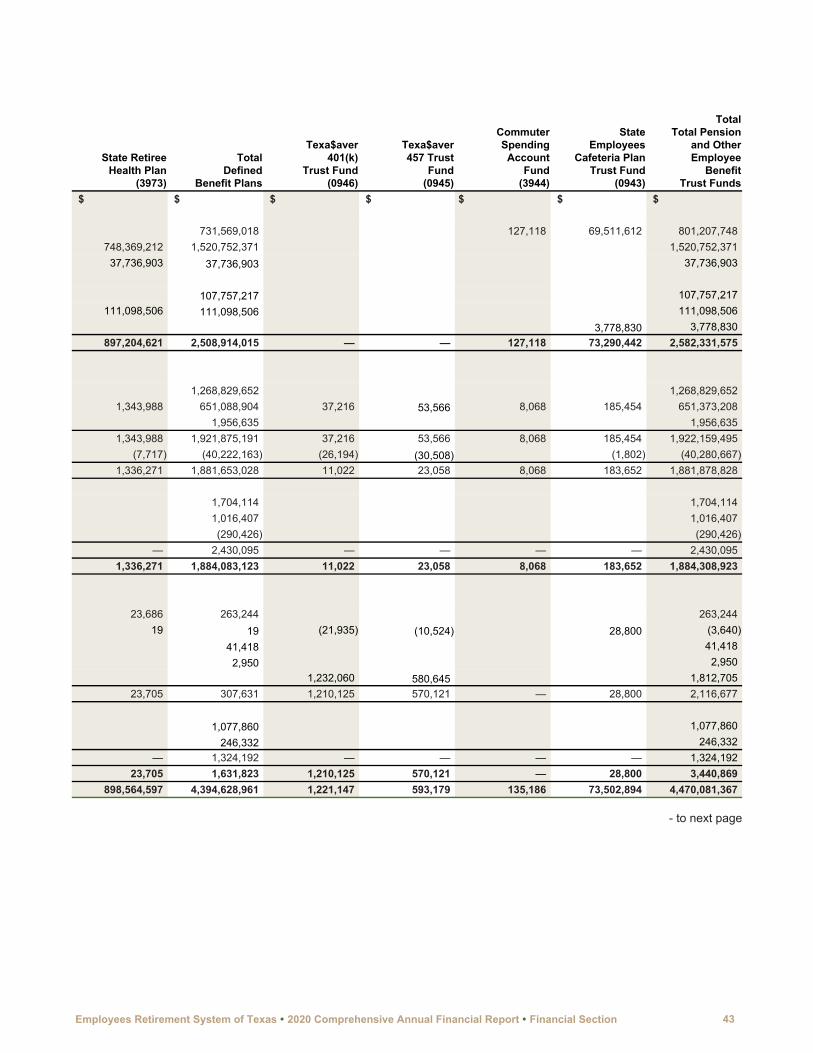
State RetireeHealth Plan
(3973)
TotalDefined
Benefit Plans
Texa$aver401(k)
Trust Fund(0946)
Texa$aver457 Trust
Fund(0945)
CommuterSpendingAccount
Fund(3944)
StateEmployees
Cafeteria PlanTrust Fund
(0943)
TotalTotal Pension
and OtherEmployee
BenefitTrust Funds
$ $ $ $ $ $ $
731,569,018 127,118 69,511,612 801,207,748 748,369,212 1,520,752,371 1,520,752,371 37,736,903 37,736,903 37,736,903
107,757,217 107,757,217 111,098,506 111,098,506 111,098,506
3,778,830 3,778,830 897,204,621 2,508,914,015 — — 127,118 73,290,442 2,582,331,575
1,268,829,652 1,268,829,652 1,343,988 651,088,904 37,216 53,566 8,068 185,454 651,373,208
1,956,635 1,956,635 1,343,988 1,921,875,191 37,216 53,566 8,068 185,454 1,922,159,495 (7,717) (40,222,163) (26,194) (30,508) (1,802) (40,280,667) 1,336,271 1,881,653,028 11,022 23,058 8,068 183,652 1,881,878,828
1,704,114 1,704,114 1,016,407 1,016,407 (290,426) (290,426)
— 2,430,095 — — — — 2,430,095 1,336,271 1,884,083,123 11,022 23,058 8,068 183,652 1,884,308,923
23,686 263,244 263,244 19 19 (21,935) (10,524) 28,800 (3,640)
41,418 41,418 2,950 2,950 1,232,060 580,645 1,812,705
23,705 307,631 1,210,125 570,121 — 28,800 2,116,677
1,077,860 1,077,860 246,332 246,332
— 1,324,192 — — — — 1,324,192 23,705 1,631,823 1,210,125 570,121 — 28,800 3,440,869 898,564,597 4,394,628,961 1,221,147 593,179 135,186 73,502,894 4,470,081,367
- to next page
Employees Retirement System of Texas � 2020 Comprehensive Annual Financial Report � Financial Section 43
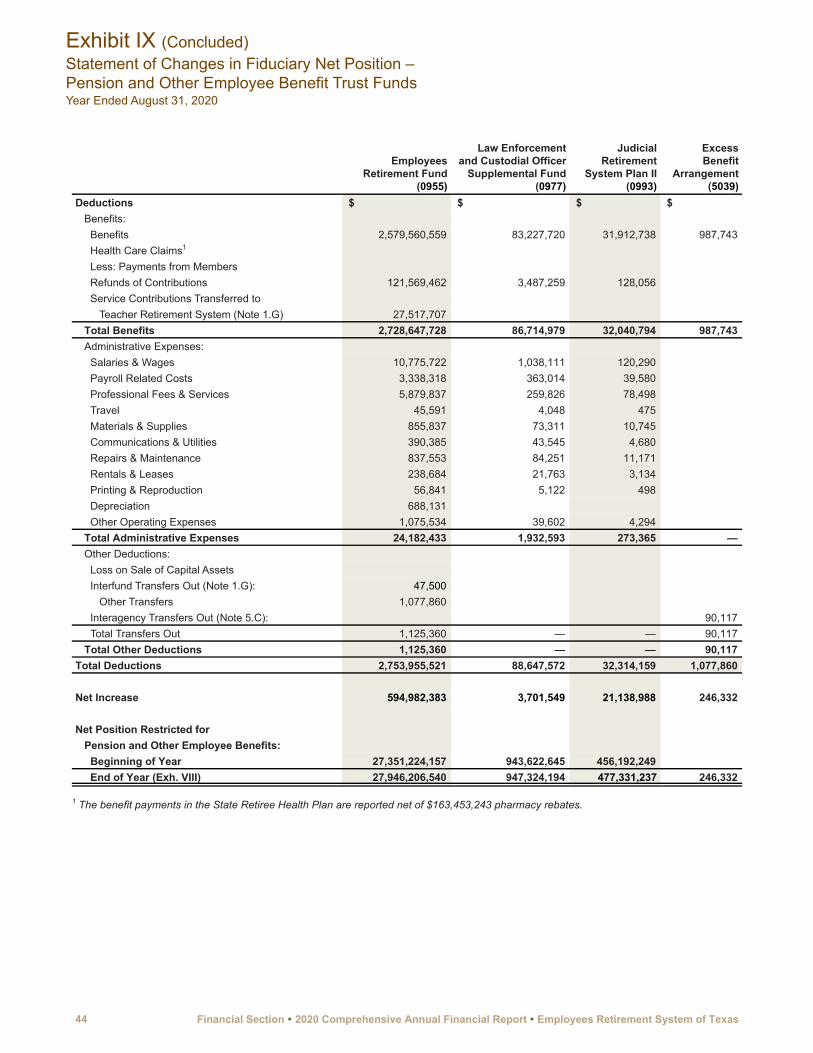
EmployeesRetirement Fund
(0955)
Law Enforcement and Custodial Officer
Supplemental Fund(0977)
JudicialRetirement
System Plan II(0993)
ExcessBenefit
Arrangement(5039)
Deductions $ $ $ $ Benefits:
Benefits 2,579,560,559 83,227,720 31,912,738 987,743 Health Care Claims1
Less: Payments from Members Refunds of Contributions 121,569,462 3,487,259 128,056 Service Contributions Transferred to
Teacher Retirement System (Note 1.G) 27,517,707 Total Benefits 2,728,647,728 86,714,979 32,040,794 987,743 Administrative Expenses:
Salaries & Wages 10,775,722 1,038,111 120,290 Payroll Related Costs 3,338,318 363,014 39,580 Professional Fees & Services 5,879,837 259,826 78,498 Travel 45,591 4,048 475 Materials & Supplies 855,837 73,311 10,745 Communications & Utilities 390,385 43,545 4,680 Repairs & Maintenance 837,553 84,251 11,171 Rentals & Leases 238,684 21,763 3,134 Printing & Reproduction 56,841 5,122 498 Depreciation 688,131 Other Operating Expenses 1,075,534 39,602 4,294
Total Administrative Expenses 24,182,433 1,932,593 273,365 — Other Deductions:
Loss on Sale of Capital AssetsInterfund Transfers Out (Note 1.G): 47,500
Other Transfers 1,077,860 Interagency Transfers Out (Note 5.C): 90,117 Total Transfers Out 1,125,360 — — 90,117
Total Other Deductions 1,125,360 — — 90,117 Total Deductions 2,753,955,521 88,647,572 32,314,159 1,077,860
Net Increase 594,982,383 3,701,549 21,138,988 246,332
Net Position Restricted forPension and Other Employee Benefits:
Beginning of Year 27,351,224,157 943,622,645 456,192,249 End of Year (Exh. VIII) 27,946,206,540 947,324,194 477,331,237 246,332
1 The benefit payments in the State Retiree Health Plan are reported net of $163,453,243 pharmacy rebates.
Exhibit IX (Concluded)Statement of Changes in Fiduciary Net Position –Pension and Other Employee Benefit Trust FundsYear Ended August 31, 2020
44 Financial Section � 2020 Comprehensive Annual Financial Report � Employees Retirement System of Texas

State RetireeHealth Plan
(3973)
TotalDefined
Benefit Plans
Texa$aver401(k)
Trust Fund(0946)
Texa$aver457 Trust
Fund(0945)
CommuterSpendingAccount
Fund(3944)
StateEmployees
Cafeteria PlanTrust Fund
(0943)
TotalTotal Pension
and OtherEmployee
BenefitTrust Funds
$ $ $ $ $ $ $
2,695,688,760 79,366 65,837,157 2,761,605,283 1,076,889,832 1,076,889,832 1,076,889,832
(230,151,101) (230,151,101) (230,151,101) 125,184,777 125,184,777
27,517,707 27,517,707 846,738,731 3,695,129,975 — — 79,366 65,837,157 3,761,046,498
3,217,766 15,151,889 162,523 110,547 8,101 141,778 15,574,838 1,081,432 4,822,344 53,007 35,640 2,675 48,100 4,961,766 701,235 6,919,396 7,024 3,192 370 16,794 6,946,776 16,122 66,236 1,171 1,010 13 606 69,036 225,163 1,165,056 6,563 4,119 294 10,646 1,186,678 174,196 612,806 3,423 2,257 140 6,999 625,625 253,674 1,186,649 8,299 4,929 396 12,704 1,212,977 72,106 335,687 2,250 1,118 86 3,208 342,349 12,758 75,219 185 162 8 220 75,794
688,131 688,131 1,060,426 2,179,856 15,585 2,066 118 1,150,276 3,347,901 6,814,878 33,203,269 260,030 165,040 12,201 1,391,331 35,031,871
47,500 47,500 1,077,860 1,077,860 90,117 90,117
— 1,215,477 — — — — 1,215,477 — 1,215,477 — — — — 1,215,477 853,553,609 3,729,548,721 260,030 165,040 91,567 67,228,488 3,797,293,846
45,010,988 665,080,240 961,117 428,139 43,619 6,274,406 672,787,521
59,936,464 28,810,975,515 1,867,978 3,275,728 504,654 17,481,337 28,834,105,212 104,947,452 29,476,055,755 2,829,095 3,703,867 548,273 23,755,743 29,506,892,733
Employees Retirement System of Texas � 2020 Comprehensive Annual Financial Report � Financial Section 45

46 Financial Section � 2020 Comprehensive Annual Financial Report � Employees Retirement System of Texas

IndexNote Page
1. Summary of Significant Accounting Policies..................................................................................... 49A. The Reporting Entity.......................................................................................................................... 49B. New Accounting Pronouncements..................................................................................................... 49C. Basic Financial Statements............................................................................................................... 49D. Measurement Focus - Basis of Accounting....................................................................................... 49E. Basis of Presentation......................................................................................................................... 50F.. Budgets.............................................................................................................................................. 52G. Assets, Liabilities, Fund Balances and Net Position.......................................................................... 53
2. Detail Disclosures on Funds................................................................................................................. 57A. Deposits, Investments, and Repurchase Agreements....................................................................... 57B. Fund Equity........................................................................................................................................ 65C. Derivative Investment........................................................................................................................ 65D. Leases............................................................................................................................................... 66
3. Defined Benefit Plans............................................................................................................................ 66A. Plan Descriptions and Contributions.................................................................................................. 66B. Net Pension Liability.......................................................................................................................... 67C. Retirement Systems Membership...................................................................................................... 69D. Reserves............................................................................................................................................ 69E. Historical Trend Information............................................................................................................... 69
4. Other Postemployment Benefits Plan.................................................................................................. 70A. Plan Descriptions and Contributions.................................................................................................. 70B. Net OPEB Liability............................................................................................................................. 71C. State Retiree Health Plan Membership............................................................................................. 73D. Reserves............................................................................................................................................ 73E. Historical Trend Information............................................................................................................... 73
5. Interfund Activity and Transactions..................................................................................................... 74A. Interfund Receivables and Payables................................................................................................. 74B. Interfund Transfers............................................................................................................................. 74C. Interagency Transfers........................................................................................................................ 74
6. Contingent Liability............................................................................................................................... 75A. Litigation............................................................................................................................................ 74B. Sick Leave......................................................................................................................................... 74C. Incentive Compensation Plan............................................................................................................ 75
7. Risk Management.................................................................................................................................. 75A. Risk Exposure.................................................................................................................................... 75B. Risk Financing................................................................................................................................... 75C. Liabilities............................................................................................................................................ 76
8. Termination Benefits............................................................................................................................. 76
Notes to the Basic Financial StatementsAugust 31, 2020
Employees Retirement System of Texas � 2020 Comprehensive Annual Financial Report � Financial Section 47

48 Financial Section � 2020 Comprehensive Annual Financial Report � Employees Retirement System of Texas

1. Summary of Significant Accounting Policies
The financial statements have been prepared in conformity with generally accepted accounting principles (GAAP) as established by the Governmental Accounting Standards Board (GASB).
1.A The Reporting Entity(In accordance with GASB Statement 14)
The Texas Constitution under Article XVI, Section 67 authorized the Texas Legislature to establish by law an Employees Retirement System of Texas (the System) to provide benefits for officers and employees of the State. The System was established in 1947 and operates primarily under Vernon’s Texas Codes Annotated (V.T.C.A. ), Texas Government Code, Title 8, Subtitle B.
The System has the powers, privileges and immunities of a corporation. The System is governed by a Board of Trustees, which is made up of six members responsible for the general administration and operations of the System. The six-member board is composed of three elected members and three members who are appointed respectively by the Governor, the Speaker of the Texas House of Representatives, and the Chief Justice of the Supreme Court of Texas. The Board appoints a person other than a member of the Board to serve at the Board’s will as Executive Director to manage a staff of approximately 400 to provide benefits to State and higher education employees, retirees, and beneficiaries. The Texas Legislature has the authority to set the contribution rates for both employee and employer retirement contributions.
Although the Employees Retirement System is a separate legal entity and by statute must prepare a separate annual financial report, it is also a retirement system of the State of Texas financial reporting entity and is included in the State’s annual financial report as a blended component unit.
1.B New Accounting Pronouncements
On September 1, 2019, the System adopted GASB Statement No. 84 Fiduciary Activities. This Statement establishes criteria for identifying fiduciary activities of all state and local governments. An exception to that requirement is provided for a business-type activity that normally expects to hold custodial assets for three months or less. Based on the reporting
requirements from this pronouncement, the System has reclassified the Judicial Retirement System Plan One Fund and Unappropriated Receipts General Revenue Fund to General Funds, USPS – Direct Deposit Return Money Fund, USPS – Overpayment to Employees Fund, Direct Deposit Correction Account Fund, and Child Support Employee Deduction – Offset Account Fund to Custodial Funds, and Health Saving Account Fund to Internal Service Fund. These funds were reported as Agency Funds in previous fiscal years.
1.C Basic Financial Statements(In accordance with GASB Statement 34)
The Basic Financial Statements consist of:
• Government-wide Financial Statements;• Fund Financial Statements and Combining
Financial Statements of the Defined Benefit Plans; and
• Notes to the Basic Financial Statements.
Government-wide financial statements report all assets, liabilities and net position of the System’s Governmental Funds and Internal Service Fund. Governmental activities are generally financed through intergovernmental revenues and other non-exchange revenues. Fiduciary activities are excluded from the government-wide financial statements.
Fund financial statements are presented immediately after the government-wide financial statements. These statements present information for Governmental Funds, the Internal Service Fund, and the Fiduciary Funds. Fund financial statements have been prepared using the measurement focus appropriate for each type of fund.
1.D Measurement Focus – Basis of Accounting(In accordance with GASB Statement 34)
Measurement focus refers to the definition of the resource flows measured. Basis of accounting refers to when revenues and expenses are recognized in the accounts and reported in the financial statements. The government-wide Statement of Net Position and Statement of Activities use the economic resources measurement focus and the accrual basis of accounting.
The government-wide Statement of Activities presents the System’s governmental activities by function and distinguishes between program
Notes to the Basic Financial StatementsAugust 31, 2020
Employees Retirement System of Texas � 2020 Comprehensive Annual Financial Report � Financial Section 49

revenues and general revenues. Program revenues are further broken down into charges for services, and operating grants and contributions.
Program revenues of the governmental activities are: appropriations from the State’s General Revenue Fund for Judicial Retirement System Plan One, law enforcement and peace officer death benefits, lump sum retiree death benefits, benefits for victims of crime, insurance premiums received by the Internal Service Fund from employees and the State of Texas, and all investment income deposited or credited to the Internal Service Fund.
Program expenses of the governmental activities are: death benefit expenses of the appropriated Special Revenue Funds, claims expenses, premium payments of the Internal Service Fund, and all administrative expenses. All other revenues and expenses of the governmental activities are considered to be general revenues/expenses.
Special Revenue Funds are accounted for under the modified accrual basis of accounting and current financial resources measurement focus. Under this combination, the financial statements focus on current assets and current liabilities and the changes in net current assets. All revenues reported are recognized based on the criteria of measurability and availability. Special Revenue Funds are considered to be available if the revenues are due at year end and collected within 60 days thereafter. Amounts are defined as measurable if they can be estimated or otherwise determined. Expenditures are recognized when the related liability is incurred. Benefit payments to participants are recorded upon distribution.
Proprietary fund distinguishes operating activities from nonoperating ones. Operating activities generally include providing services and producing or delivering goods. The majority of the operating revenues in the System’s proprietary fund are insurance premiums. Operating expenses include the costs of claims and related administrative expenses. Non-operating revenues and expenses are those items that do not meet any of the above definitions.
The System does not have a policy for eliminating internal activities in the Government-wide Statement of Activities because the funds reported in the Government- wide Statement of Activities are distinct programs and do not have activities among each other.
Pension and Other Employee Benefit Trust Funds, and Internal Service Funds are maintained on the full accrual basis of accounting and the economic resources measurement focus. All economic resources, including financial and capital assets and related liabilities, both current and long-term, and the changes therein are reported in the fund’s financial statements. Additions are recognized when earned, and deductions are recognized when the liability is incurred, regardless of the timing of related cash flows. Contributions are recognized when due, pursuant to state law. Benefits and refunds of contributions are recognized when due and payable in accordance with the terms of the plan. Capital assets are depreciated.
The preparation of financial statements in accordance with accounting principles generally accepted in the United States of America requires management to make estimates and assumptions. These estimates and assumptions affect the reported amounts of assets and liabilities, disclosure of contingent assets and liabilities at the date of the financial statements and the reported amounts of revenues and expenses/expenditures during the reporting period. Actual results could differ from those estimates.
1.E Basis of Presentation(In accordance with GASB Statement 34)
Fund StructureThe fund financial statements are organized on the basis of funds, each of which is considered to be a separate accounting entity. The operations of each fund are accounted for with a separate set of self-balancing accounts. These accounts are segregated for the purpose of carrying on specific activities or attaining certain objectives in accordance with applicable statutory guidelines or restrictions. The System’s funds fall under three fund categories: Governmental Funds, Proprietary Funds, and Fiduciary Funds. Following is a brief description of each fund category and fund type used by the System.
Governmental Fund Category Governmental Fund reporting focuses primarily on the sources, uses, and balances of current financial resources and whether current-year revenues were sufficient to pay for current-year services.
General FundThe General Fund is the principal operating fund used to account for most of the state’s general activities. It accounts for all financial resources except
Notes to the Basic Financial Statements (Continued)August 31, 2020
50 Financial Section � 2020 Comprehensive Annual Financial Report � Employees Retirement System of Texas

those accounted for in other funds. The system reports the following funds as General Fund:
• Judicial Retirement System Plan One Fund (JRS I) (General Revenue Fund) – This fund is established by V.T.C.A., Texas Government Code, Title 8, Subtitle D and is used to account for appropriations received from the State’s General Revenue Fund for annuity and refund payments to eligible judicial employees who commenced service prior to September 1, 1985.
• Unappropriated Receipts (General Revenue Fund) – This fund accounts for member contributions received from the Judicial Retirement System Plan One Fund.
For fiscal year 2020, the System continues to report the Special Revenue Funds as nonmajor funds. The reporting is based on a statement on page 58 of GASB Statement No. 34, published in June of 1999, “The provisions of this statement need not be applied to immaterial items.” The total assets, liabilities, revenues, or expenditures/ expenses of the individual governmental funds displayed in Exhibits III and IV are much less than 5% of the funds managed by the System, and the activities in these funds are not the core of the System’s business, which is pension and group benefits. Therefore, the System is reporting the governmental funds on Exhibits III and IV as nonmajor funds for fiscal year 2020.
Special Revenue FundsSpecial Revenue Funds are used to account for the proceeds from specific revenue sources that are legally restricted to expenditures for specific purposes. The System displays General Revenue Funds/Accounts of the State of Texas as Special Revenue Funds.
• Social Security Administration Fund – This fund accounts for the expenditures of administration of the Social Security Program.
• Death Benefits Program for Commissioned Peace Officers, Firemen, etc. Fund (General Revenue Fund) – This fund accounts for payments of death benefits and administrative fees, which are funded by an appropriation from the State’s General Revenue Fund. Established by V.T.C.A., Texas Government Code, Title 6, Chapter 615.
• Compensation to Victims of Crime – This fund accounts for payments of death benefits to the beneficiaries of victims of crime. It is funded by an appropriation from the Victims of Crime Fund
0469, which was established by Texas Criminal Procedure Code, Article 56.54.
• Lump Sum Retiree Death Benefit Fund (General Revenue Fund) – This fund accounts for the payments of the $5,000 lump sum benefit, which is an additional benefit provided by the System to the beneficiaries of retirees who die while still receiving a retirement annuity.
Proprietary Fund CategoryProprietary Fund reporting focuses on the determination of operating income, changes in net position, financial position, and cash flows.
Internal Service FundInternal Service Funds are used to report any activity that provides goods or services, on a cost- reimbursement basis, to other funds, departments, agencies of the reporting entity, or other governments.
• Employees Life, Accident and Health Insurance and Benefits Fund – This fund accounts for the services provided to State of Texas agencies and higher education institutions that participate in the Texas Employees Group Benefits Program. Established by Chapter 1551, Texas Insurance Code.
• Health Savings Account – This fund accounts for the employee and employer contributions to the Health Savings Account that the System has received and pending to be deposited to the bank who administers the employees’ Health Savings Account.
Fiduciary Fund CategoryThe fiduciary funds are not part of the government-wide financial statements.
Pension and Other Employee Benefit Trust FundsPension and Other Employee Benefit Trust Funds (Pension Trust Funds) report the resources that are required to be held in trust for the members and beneficiaries of defined benefit pension plans, deferred compensation plans, and other employee benefit plans.
• Employees Retirement System Fund (ERS) – This fund is established by V.T.C.A., Texas Government Code, Title 8, Subtitle B and is used to account for the accumulation of resources for pension benefit payments to qualified State employees or beneficiaries.
Notes to the Basic Financial Statements (Continued)August 31, 2020
Employees Retirement System of Texas � 2020 Comprehensive Annual Financial Report � Financial Section 51
• Law Enforcement and Custodial Officer Supplemental Retirement Fund (LECOS) – This fund is established by V.T.C.A., Texas Government Code, Title 8, Subtitle B and is used to account for the payments of benefits as provided by the Commissioned Law Enforcement and Custodial Officer Supplemental Retirement Benefit Act.
• Judicial Retirement System Plan Two Fund (JRS II) – This fund is established by V.T.C.A., Texas Government Code, Title 8, Subtitle E and is used to account for the accumulation of resources for pension benefit payments to eligible judicial employees who commenced service after August 31, 1985.
• Excess Benefit Arrangement (EBA) – This fund is established by V.T.C.A., Texas Government Code, Title 8, Subtitle B and is used to account for the payments of annuities otherwise payable from the Employees Retirement Fund that exceed the limitations on benefits imposed by Internal Revenue Code (IRC) Section 415(b).
• State Retiree Health Plan (SRHP) – The System provides postemployment health care, life and dental insurance benefits through the Group Benefits Program in accordance with Chapter 1551, Texas Insurance Code. The State Retiree Health Plan (SHRP) is a cost-sharing multiple-employer postemployment health care plan that covers retired employees of the State, and other entities as specified by the state legislature.
• Texa$aver 401(k) Trust Fund – This fund is established by V.T.C.A., Article 6252-3g and is used to account for the costs of administering the IRC Section 401(k) deferred compensation plan.
• Texa$aver 457 Trust Fund – This fund is established by V.T.C.A., Article 6252-3g and is used to account for tax-deferred portions of salaries of State employees in accordance with the provisions of IRC Section 457 and the costs of administering the program.
• Commuter Spending Account Fund – This fund is a qualified transportation benefits plan authorized under Section 132 of the Internal Revenue Code. The Commuter Benefits program offers State employees pre-tax deduction for qualified parking expenses or mass transit expenses.
• State Employees Cafeteria Plan Trust Fund (TexFlex) – This fund is established by Chapter 1551, Texas Insurance Code and is used to account for before-tax salary reduction contributions from State employees and employees of higher education institutions, reimbursements for health care and dependent care, and the costs of administering the program.
Custodial FundsCustodial Funds are used to report fiduciary activities that are not required to be reported in pension (and other employee benefit) trust funds, investmenttrust funds, or private-purpose trust funds. The system reports the following funds as Custodial Funds:
• USPS - Direct Deposit Return Money – This fund accounts for direct deposits that are processed through the Uniform Statewide Accounting Payroll System and returned by financial institutions because of death, termination, retirement, incorrect account number, or incorrect routing numbers. The System transfers the funds back to the original issuing funds.
• USPS - Overpayment to Employees – This fund is used to provide a temporary depository for money held in suspense pending final disposition. Items held in the fund are cleared to the various Special Funds or the General Revenue Fund, or refunded to the payer.
• Direct Deposit Correction Account – This fund accounts for monies which had been transmitted for direct deposit but were returned because problems prevented credit from being given to individual depositors. The System transfers the funds back to the original issuing fund.
• Child Support Employee Deductions - Offset Account – This fund accounts for monies withheld in compliance with state and federal law for child support orders. The orders received by employers require that child support payments be deducted from the paychecks of employees. Texas enacted a statute mandating electronic submittal of child support payments deducted from non-custodial parent payrolls, effective September 1, 2009. This process allows all child support payments from an agency to be paid to the State Disbursement Unit (SDU). Once received by the SDU, the payment is sent to the custodial parent in compliance with the order.
1.F Budgets
Appropriated BudgetsThe Texas Legislature appropriates monies out of the State’s General Revenue Fund for benefit payments of the Judicial Retirement System Plan One Fund and all Special Revenue Funds other than the Social Security Administration Fund on an ‘estimated to be’ basis. This type of appropriation means that the System has the authority to increase the
Notes to the Basic Financial Statements (Continued)August 31, 2020
52 Financial Section � 2020 Comprehensive Annual Financial Report � Employees Retirement System of Texas

appropriations as needed during the time period that the appropriation is allowed to remain open. For benefit payments, expenditures in excess of appropriations received are not a violation of budgetary authority. A separate budget report which demonstrates compliance at the legal level of budgetary control is available in the Reports and Studies section of the System's website.
The System is required to lapse all unencumbered appropriations by November 1 of each year.
Non-appropriated BudgetThe Texas Legislature does not appropriate monies to the System for administrative expenses. A non- appropriated budget for administrative expenses, including capital outlay, is prepared annually and approved by the System’s Board of Trustees at the line- item level. The System’s management must approve any transfers between line items, and the Board must approve any amendments to the approved budget. Administrative expenses are budgeted in and paid primarily from the Employees Retirement Fund. Expenses are allocated monthly to the other funds based on percentages determined by time sheets and resource requirements used to administer each fund within each division. Expenses are limited by a statutory provision that no expense can be made for more than the State of Texas pays for similar services. Non- appropriated budgets are not lapsed at year-end.
1.G Assets, Liabilities, Fund Balances and Net Position(In accordance with GASB Statement 34)
Cash and Short-Term InvestmentsCash and Cash Equivalents (in accordance with GASB Statement 9), as reported in the Statement of Cash Flows for the Internal Service Fund, are composed of cash on hand, cash in local banks, cash in the State Treasury, and cash equivalents. Cash in local banks is held by Fiduciary Funds. Cash balances of most state funds are pooled and invested by the Treasury Operations Division at the Comptroller’s office. Interest earned is deposited in the specified funds designated by law.
The Statement of Cash Flows for the proprietary fund shows the change in cash and cash equivalents during the fiscal year. Both Cash Equivalents and Short-Term Investments are defined as short-term, highly liquid investments that are both (a) readily convertible to known amounts of cash and (b) so near maturity they present insignificant risk of changes in
value due to changes in interest rates. Investments with an original maturity of three months or less and that are used for cash management rather than investing activities are considered cash equivalents. Restricted securities held as collateral for Securities Lending are not included as cash equivalents on the Statement of Cash Flows. The petty cash account, and the Texa$aver and State Employees Cafeteria Plan accounts (Cash in Bank) are maintained at a local commercial bank.
ValuationCash Equivalents and Short-Term Investments are reported at amortized cost.
InvestmentsInvestments of the Employees Retirement System Fund, the Law Enforcement and Custodian Officer Supplemental Retirement Fund, the Judicial Retirement System Plan Two Fund, and the long-term portion of the Employees Life, Accidental and Health Insurance and Benefits Fund are consolidated in the Investments pool Fund. See also Investment Unit Trust Accounting.
ValuationInvestments of the Pension Trust Funds and Internal Service Fund are reported at fair value in accordance with GASB Statement 72. Fair value is defined as the price that would be received to sell an asset or paid to transfer a liability in an orderly transaction between market participants at the measurement date.
Public Equities and Fixed IncomeThe fair value of investments is based on published market prices and quotations from major investment brokers at current exchange rates, as available. Many factors are considered in arriving at that value. In general, however, corporate bonds are valued based on yields currently available on comparable securities of issuers with similar credit ratings. Public real estate are listed securities (Real Estate Investment Trusts or “REITs” and Real Estate Operating Companies or “REOCs”) traded in the public exchange.
Other InvestmentsOther investments are derivative investments. Derivative investments are either executed on an exchange or in a bilateral deal in an over-the-counter (OTC) market. Options are priced at the mean and settle price and Forwards priced at the last sale price in their respective active markets. In addition, other investments include one commingled equity limited partnership priced at the net asset value per share by the general partner.
Notes to the Basic Financial Statements (Continued)August 31, 2020
Employees Retirement System of Texas � 2020 Comprehensive Annual Financial Report � Financial Section 53

Alternative InvestmentsFor alternative investments, the System has established a Valuation Committee that periodically reviews and approves the fair value of these investments. Certain foreign alternative investments in the inception year are reported at cost, which approximates fair value. Fair value at fiscal year-end is based on the fair value of net assets reported in the partnership’s most recent capital account statements from the general partner or administrator of the fund, adjusted for any cash flow and material changes in fair value, according to the Valuation Committee guidelines, between the reporting date of partnership’s most recent capital account statements and the System’s fiscal year end date. The System’s alternative investments include private equity, private real estate, private infrastructure, private fixed income and hedge funds.
The general nature of the System’s private equity funds is that distributions are received through the liquidation of the underlying assets of the funds. Private equity partnerships have an expected life of approximately seven to fifteen years and are not liquid in nature. The fair value of the net assets is estimated using recent observable information for similar investments, such as discounted cash flows earning multiples and company comparables.
The System’s private real estate investments are limited partnerships. The partnerships participate in both closed-ended and open-ended commingled funds. The System does not directly own buildings. Closed-ended funds typically have a pre-determined life of seven to twelve years (plus possible extensions) and are illiquid in nature. Open-ended funds do not have a pre-determined liquidation date and the System has the ability to sell its interests periodically. The fair value of private real estate is based on the set asset values of limited partner interests in the commingled funds. Each commingled fund is audited annually and the underlying investments may be periodically appraised by an independent third party. Valuation assumptions can be subjective and are based on market and property specific inputs.
The System’s hedge fund investments represent ownership interest in limited partnerships or limited liability companies. These types of investments consist of private commingled investment vehicles that issues securities to accredited investors or qualified purchasers. The fair values of hedge funds are based on the net assets of the limited partnerships. These funds’ valuations are appraised
by an independent administrator and reconciled annually to the audited financial statements. In general, the System’s hedge funds are categorized into the following strategies:
• Equity Long/Short hedge funds — This strategy includes long and short investments made primarily in developed market common stocks. Management of each hedge fund has the ability to shift investments from value to growth strategies, from small to large capitalization stocks, and from a net long to a net short position.
• Event-Driven hedge funds — These types of investments include hedge funds that aim to profit from a catalyst. In many instances, these catalysts can be associated with economic, political, corporate, and government-driven events. A majority of these investments are targeted at corporate actions.
• Macro hedge funds — These types of investments include hedge funds that invest in a range of strategies which are based on movements in macroeconomic variables. Management of each hedge fund can use a variety of instruments including fixed income, currency, commodity, or equity securities.
• Multi-Strategy hedge funds — These investments include hedge funds that pursue multiple strategies aimed at diversifying risks and reducing volatility. The System defines multi-strategy funds as having 50% of the funds’ exposure to event-driven strategies and the other 50% to relative value strategies.
• Opportunistic hedge funds — These include investments in hedge funds that provide niche and often uncorrelated exposures. Management of such funds can use a variety of instruments including credit, equity, and derivative securities; some of which may be less-liquid in nature.
• Relative Value hedge funds — This strategy seeks to capitalize on the mispricing of related securities or financial instruments.
Private fixed income funds are ownership in limited partnerships which consists of private investment funds that are either commingled or separate. These funds are classified as predominately “credit” instruments that may be liquid or illiquid. The System utilizes a process similar to that of private equity funds in assessing the fair value of the fund. The expected life of the funds is approximately three to ten years, with the option of two one-year extensions. The valuations are reviewed at the end of each
Notes to the Basic Financial Statements (Continued)August 31, 2020
54 Financial Section � 2020 Comprehensive Annual Financial Report � Employees Retirement System of Texas

reporting period as financial statements or cash fl information becomes available.
The System’s private infrastructure investments are in large-scale public systems, services and facilities that are necessary for economic activity. These types of relatively illiquid investments are often made in essential services with high barriers to entry and predictable cash flows and have expected life from ten to twelve years, with the option of one to three-year extension. The fair value of the net assets is estimated using a variety of approaches, which may involve using recent information from comparable companies, replacement cost analysis, and discounted cash flows. Each investment is typically audited annually and appraised periodically by an independent third party.
If the System has investments where no readily ascertainable market value exists, the System’s management, in consultation with their investment advisors and the Master Trust Custodian, will determine the fair values for those investments.
Short-Term InvestmentsThe System’s short-term investment is Short-Term Investment Fund, which is a 2a-7 like fund and is priced at the Net Asset Value per Share by the custodian bank.
Invested Securities Lending CollateralThe cash collateral from the borrowers in the securities lending program that the System reinvested are valued according to the types of those reinvestments.
Permissible InvestmentsEligible securities are as follows:
• Domestic equities, screened to eliminate against any known bankruptcy proceedings, lawsuits, or breach of corporate ethics that might jeopardize the company’s economic future or existence.
• Equities of companies domiciled in countries outside of the United States.
• Global fixed income securities, subject to a minimum credit rating of “CCC-, Caa3,” or their equivalent as rated by two Nationally Recognized Securities Rating Organizations, as included in the Barclays Capital Universal Index or successor index. Fixed income and short-term securities that downgrade to below the acceptable rating described above will be exchanged or sold within one year, but special exceptions may be permitted and reported to the Board of Trustees.
• Interests in private securities exempted from registration under federal and state securities laws, including certain limited liability securities and vehicles, such as limited partner interests in limited partnerships, trusts and limited liability corporations as deemed appropriate by the System.
• Private equity and private real estate investments must be institutional in quality and meet the parameters specified in the System’s investment policy.
• Global publicly traded real estate equities subject to the quality standards set forth in the investment policy.
• Foreign currencies transactions and foreign currency derivatives are permitted as necessary to facilitate the settlement of foreign security transactions, consistent with industry best practices. These transactions are also permitted to settle private market transactions, meet capital calls or exchange distributions back into U.S. dollars.
• Forward, futures and options, subject to the restrictions set forth in the investment policy.
Investment Asset AllocationThe System’s policy in regard to the allocation of investment assets is established and may be amended by the Board of Trustees. Plan assets are managed on a total return basis with a long-term objective of achieving and maintaining a fully funded status for the benefits provided through the pension plans (See Figure 14 in Note 3.B for the most recent target asset allocation).
Investment Unit Trust AccountingIn order to provide flexibility of asset allocation and effectively invest in a diversified manner, the Board of Trustees directed that investment unit trust accounting be implemented. The pension funds began the unit trust accounting on September 1, 2006 and the long term portion of the Employees Life, Accident and Health Insurance and Benefits Fund on January 1, 2009. Unit trust accounting involved assigning units to each fund based on the share of the funds’ investment fair value to the total fair value of the consolidated investments. The custodian bank prepares consolidated bank statements and fund statements that show the unit trust accounting activity. Investment earnings and appreciation increase the per unit value of all participating funds. Deposits and withdrawals for each fund change the number of units held by each fund. These changes are recorded at the unit value of the transaction date. Investment earnings or losses and fees for the total
Notes to the Basic Financial Statements (Continued)August 31, 2020
Employees Retirement System of Texas � 2020 Comprehensive Annual Financial Report � Financial Section 55

consolidated fund are allocated to each of the participating funds on a daily basis using the pro rata fair value share.
Unsettled Sales - Investment Receivables and Unsettled Purchases - Investment Payables The System reports Unsettled Sales - Investment Receivables to account for sales of investments that traded before fiscal year and settled after fiscal year end. Likewise, the System reports Unsettled Purchases - Investment Payables to account for purchases of investments that are traded before fiscal year end and settled after fiscal year end.
Capital AssetsPension Trust Funds are accounted for on a cost of service measurement focus. This means that all capital assets associated with the funds’ activities are included in their statements of net position. Purchases of capital assets by these funds are reported at cost. Donated capital assetsordonatedworksofartorsimilaritemsare reported at fair value on the acquisition date. If donated capital assets are received in a service concession arrangement, they are reported at acquisition value. Depreciation of all exhaustible capital assets is charged as an expense against the funds’ operations. Accumulated depreciation is reported on the statements of net position. Depreciation has been provided over the estimated useful lives, using the straight-line method. The capitalization thresholds and estimated useful lives are shown in Figure 1.
Figure 1Capitalization Thresholds and Useful Lives
Asset CategoryCapitalization
Threshold
EstimatedUseful Life(in Years)
$Land 0 N/ABuilding Improvements 100,000 10 - 20Computer Software 100,000 5 - 6Furniture and Equipment 5,000 3 - 10Motor Vehicles 5,000 7Internally Generated Computer Software 1,000,000 5 - 6
Accounts PayableAccounts Payable under the Internal Service Fund include claims incurred but not reported by the participants prior to fiscal year end and payable in future years as estimated by the System’s actuary.
Employees Compensable LeaveUnder Section 661.062 of Texas Government Code Chapter 661, a State employee is entitled to be paid for all unused vacation time accrued, in the event of the employee’s resignation, dismissal, or separation from State employment, provided the employee has had continuous employment with the State for six months.
In Fiduciary Fund types, salary costs related to employees’ rights to be compensated for vacation time are accrued as expenses of the period in which the services were rendered. Accumulated compensable leave liabilities are reported in the Statement of Fiduciary Net Position for the Employees Retirement Fund. No liability is recorded for non-vesting accumulating rights to receive sick leave benefits.
Fund Balances – Governmental Funds Fund balance is the difference between fund assets and liabilities on the governmental fund statements. Committed fund balance reports an amount that has spending limitations that are internally imposed by formal action of the government’s highest level of decision making authority (e.g., legislature). These committed fund balance amounts usually cannot be redeployed for other purposes unless the same decision makers reverse or modify the imposed restrictions by the same type of formal action that was originally used to create the restriction.
Net Position – Restricted for Pension Benefits The net position of the retirement trust funds consists of up to five reserve accounts, depending on the particular fund.
• The Employee Savings Account represents the accumulation of active and inactive member deposits plus interest.
• The State Accumulation Account represents reserves available to fund the future active member retirement, death, and survivor benefits.
• The Retirement Annuity Reserve Account represents reserves to pay retirement, death, and survivor benefits and post-retirement benefit increases for current retirees.
• The Interest Account represents the interest, dividends, securities lending income, and net appreciation or depreciation received and accrued on the invested assets of the fund. All investment income is transferred to the Employee Savings, State Accumulation, and Retirement
Notes to the Basic Financial Statements (Continued)August 31, 2020
56 Financial Section � 2020 Comprehensive Annual Financial Report � Employees Retirement System of Texas

Annuity Reserve accounts based on applicable Texas statutes.
• The Expense Account represents reserves to pay all administration and maintenance expenses of the retirement trust funds.
See Note 3.D for the balances of each funded plans’ legally required reserves.
Restricted Net Position – Proprietary Fund(In accordance with GASB Statement 34)
Chapter 1551 of the Texas Insurance Code requires that the System estimate funds needed for an average 60-day period, considering projected claims and administrative expenses for a contingency reserve fund for self-funded coverage. The System is further required to include this amount in its legislative appropriations request. Subject to adequate appropriation from the legislature, the estimated amount must be placed in the contingency reserve fund along with interest on, earnings of, and proceeds from the sale of investments of assets in the contingency reserve fund. This reserve amount is reported as ‘Restricted Net Position’ in both the government-wide and the proprietary fund Statement of Net Position.
Interfund Activity and Balances(In accordance with GASB Statement 34)
Activities between the System and agencies of the State of Texas, and activities between the System’s funds have been analyzed and classified in accordance with the following criteria.
Interfund Services Provided and UsedThis activity represents transactions that would be treated as revenues, expenditures or expenses if they involved organizations external to State government. They are accounted for as revenues by the recipient fund and as expenditures or expenses by the disbursing fund. Contributions for retirement and insurance from other funds within the State of Texas reporting entity are reported as Interfund Services Provided and Used. The accrual of Interfund Services Provided and Used is classified as Accounts Receivable and Accounts Payable on the government-wide and the fund financial statements.
Interfund ReimbursementsThis activity represents expenditures or expenses applicable to a particular fund but paid from another fund. The transactions are reported as expenditures or expenses in the reimbursing fund and a reduction
of corresponding amounts in the reimbursed fund. Administrative expenses paid by the Employees Retirement System Fund and subsequently reimbursed by the System’s other funds are reported as Interfund Reimbursements in the financial statements. The accrual of Interfund Reimbursements is reported on the government-wide Statement of Net Position as Due From External Parties or Due To External Parties and on the fund financial statements as Due From Other Funds or Due To Other Funds.
Interfund TransfersThis activity represents routine transfers of resources. Interfund transfers are reported in the Other Financing Sources (Uses) section for Governmental Funds and as Other Additions or Other Deductions in the Pension Trust Fund financial statements. The accrual of Interfund Transfers is reported on the government-wide Statement of Net Position as Due From External Parties or Due To External Parties and on the fund financial statements as Due From Other Funds or Due To Other Funds. Retirement Membership Fees received by the Employees Retirement System Fund and transferred to other funds of the System are reported as Interfund Transfers. See Note 5.B Interfund Transfers.
Interagency Activity and Balances(In accordance with GASB Statement 34)This activity represents routine transfers of funds between the System and other agencies and institutions within the State of Texas financial reporting entity.
At year end, the accrual of transfers from or to the funds of the System are reported as Due To Other Agencies or Due From Other Agencies on the Statements of Net Position. See Note 5.C Interagency Transfers.
2. Detail Disclosures on Funds(In accordance with GASB Statements 3, 28, 40, 67, and 72)
2.A Deposits, Investments, and Repurchase Agreements
DepositsThe total carrying amounts of Deposit as of August 31, 2020 are presented in Figure 2. The deposits with the custodian bank are temporary deposits related to unsettled trade or income transactions.
Notes to the Basic Financial Statements (Continued)August 31, 2020
Employees Retirement System of Texas � 2020 Comprehensive Annual Financial Report � Financial Section 57

Figure 2Deposits of Cash in Bank
DepositsCarrying
ValueBank
Balance $ $
Fiduciary Funds: Cash on Hand (Exh. VIII) 242,314 242,314Cash in Bank (Exh. VIII) 530,827 530,827Deposits with Custodian Bank 5,161,866 5,161,866
Totals 5,935,007 5,935,007
Proprietary Funds: Deposits with Custodian Bank (9,303) (9,303)
Totals (9,303) (9,303)
Custodial Credit RiskCustodial credit risk for deposits is the risk that, in the event of the failure of a depository financial institution, the System will not be able to recover deposits or will not be able to recover collateral securities that are in the possession of an outside party. The System does not have a deposit policy for custodial credit risk. The balance of deposits with custodian bank as of August 31, 2020 represents amounts held in foreign currency and cash balance not yet invested. These deposits were uninsured and uncollateralized and subject to custodial credit risk.
Investments
Policy of Asset AllocationThe System categorizes investment assets into principal components that align with investment strategies. The System’s investment strategies are domestic equities, international securities, global credit, rates, public real estate, and alternative investments. A principal component may include one or more investment asset classes, depending on the investment strategy.
The majority of the investments in the domestic equities component are equity securities that are issued in the United States. Real Estate Investment Trust (REITs), Exchange Traded Funds (ETFs), and international securities are also included in this component to provide liquidity. The International securities component invests in equity securities that are mainly issued overseas. It also includes other investments classes similar to those of the domestic equities component.
The rates component invests in domestic and international fixed income securities that have a
relatively low risk of default. The global credit component invests in securities that have high risk and long maturity. It also invests in ETFs and hedge funds to provide liquidity and absolute returns. The public real estate component invests mainly in REITs. It also includes hedge funds, domestic and international equities to provide liquidity, diversification and high returns to the component.Alternative Investments include private equity, private real estate, private infrastructure, private fixed income and hedge funds. The private equity investments are in private equity limited partnerships. The private real estate investments are in limited partnerships that specialize in real estate. Private Infrastructure investments are limited partnerships based on event-driven strategies (e.g., tender offers, mergers, and acquisitions etc.). Hedge fund investments are in hedge fund limited partnership. Private fixed income funds are limited partnerships that invest in foreign and domestic fixed income securities.
Fair Value Measurement
The System categorizes their fair value measurements within the fair value hierarchy established by generally accepted accounting principles. The hierarchy is based on the valuation inputs used to measure the fair value of the asset and gives the highest priority (Level 1) to unadjusted quoted prices in active markets for identical assets or liabilities and the lowest priority (Level 3) to unobservable inputs.
Level 1: Unadjusted quoted prices for identical instruments in active markets.
Level 2: Quoted prices for similar instruments in active markets; quoted prices for identical or similar instruments in markets that are not active; and model-derived valuations in which all significant inputs are observable.
Level 3: Valuations derived from valuation techniques in which significant inputs are unobservable. Investments that are measured at fair value using the net asset value per share (or its equivalent) as a practical expedient are not classified in the fair value hierarchy.
The System uses the following valuation techniques to measure fair value of investments:
Market Approach: Prices and other relevant information generated by market
Notes to the Basic Financial Statements (Continued)August 31, 2020
58 Financial Section � 2020 Comprehensive Annual Financial Report � Employees Retirement System of Texas
transactions involving identical or similar assets, liabilities, or group of assets and liabilities are used to measure fair value.
Cost Approach: The amount that would be required currently to replace the present service capacity of an asset is used to measure fair value.
Income Approach: Future amounts (for example, cash flows, or revenues and expenses) are converted to a single current amount to determine fair value.
U.S. treasury securities, equity securities, Real Estate Investment Trusts, and Exchange Traded Funds classified in Level 1 are valued using prices quoted in active markets for those securities. Debt and debt derivative securities classified in Level 2 are valued using either a bid evaluation or a matrix pricing technique. Bid evaluations may include market quotations, yields, maturities, call features and ratings. Matrix pricing is used to value securities based on the securities relationship to benchmark quoted prices. Index linked debt securities are valued by multiplying the external market price feed by the applicable day’s Index Ratio.
Level 2 debt securities also have non-proprietary information from multiple independent sources that were readily available to market participants who are known to be actively involved in the market. Equity and equity derivative securities classified in Level 2 are securities whose values are derived daily from associated traded securities.
Level 3 debt securities use proprietary information or single source pricing. Value of equity securities classified in Level 3 is based on last trade data that is 30 days or more before the fiscal year end. Real assets, if any, classified in Level 3 are real estate investments generally valued using the income approach by internal manager reviews or independent external appraisers.
The System’s assessment of the significance of particular inputs to these fair value measurements requires judgment and considers factors specific to each asset or liability. When inputs used to measure fair value fall into different levels in the fair value hierarchy, fair value measurements in their entirety are categorized based on the lowest level input that is significant to the valuation.
The fair values of alternative investments are measured at net asset value (NAV) per share (or its equivalent). The System’s investments are summarized in Figure 3.
Custodial Credit RiskCustodial credit risk for investments is the risk that, in the event of the failure of the counterparty, the System will not be able to recover the value of its investments or collateral securities that are in the possession of an outside party. The System’s investment policy limits holding of securities by counterparties to those involved with securities lending and those used as collateral for futures contracts. The System has contracted with The BNY Mellon Asset Servicing to serve as the custodian for the System’s investments. Investments are registered in the name of the System or in the name of the System’s custodian and are held in the name of the System by the custodian.
Foreign Currency RiskForeign currency risk for investments and deposits is the risk that changes in exchange rates will adversely affect the investments and deposits. The System does not have a policy for managing foreign currency risk. The System’s investment and deposit exposure to foreign currency risk as of August 31, 2020 is summarized in Figure 4.
Credit RiskCredit risk is the risk that an issuer or other counterparty to an investment will not fulfill its obligations. Credit risk is managed through diversification and by operating within defined parameters versus a benchmark index. Excluding those securities issued by or explicitly guaranteed by the U.S. Government, which are not considered to have credit risk, the System’s credit quality distribution for securities with credit risk exposure as of August 31, 2020 is summarized in Figure 5 on page 61. The securities were rated according to categories from Standard & Poor’s, Moody’s, or Fitch ratings, whichever is lower. A withdrawn rating signifies the removal of a rating on either an obligation or an issuer due to inadequate information, bankruptcy, reorganization, liquidation, or maturity of obligation.
Notes to the Basic Financial Statements (Continued)August 31, 2020
Employees Retirement System of Texas � 2020 Comprehensive Annual Financial Report � Financial Section 59

Figure 3Fair Value of Investments
Level 1 Level 2 Level 3 NAV TotalFiduciary Funds:Investments:
Public Equities:Domestic Equities 5,910,549,403 14,025,468 306,120 5,924,880,991 International Equities 4,485,431,034 553,803 4,485,984,837 Exchange Traded Funds (ETFs) 114,227,019 114,227,019 Real Estate Investment Trust (REITs) 1,075,653,673 4,424,513 2,200,013 1,082,278,199
Total Public Equities 11,585,861,129 18,449,981 3,059,936 — 11,607,371,046 Fixed Income:
U.S. Treasury Securities 2,603,675,808 2,603,675,808 U.S. Government Agency Obligations 485,508,899 485,508,899 Corporate Obligations 1,895,038,922 1,895,038,922 Corporate Asset and Mortgage Backed Securities 48,690,036 48,690,036 International Obligations 503,947,559 503,947,559 Exchange Traded Funds (ETFs) 400,170,487 400,170,487 Real Estate Investment Trust (REITs) 62,503,741 62,503,741
Total Fixed Income 3,003,846,295 2,995,689,157 — — 5,999,535,452 Other Investments:
Derivatives (107,425) (107,425) Commingled Funds 364,255,154 364,255,154
Total Other Investments (107,425) — — 364,255,154 364,147,729 Investments Measured at the Net Asset Value (NAV):
Equity Long/Short 600,084,716 600,084,716 Event Driven 228,114,804 228,114,804 Macro 160,485,151 160,485,151 Multi-Strategies 416,050,112 416,050,112 Opportunistic 244,829,398 244,829,398 Private Equity 4,495,728,326 4,495,728,326 Private Real Estate 2,357,722,279 2,357,722,279 Private Infrastructure 1,077,998,325 1,077,998,325 Private Fixed Income 482,699,181 482,699,181 Relative Value 368,335,823 368,335,823
Total Investments Measured at the NAV: — — — 10,432,048,115 10,432,048,115 Total Investments 14,589,599,999 3,014,139,138 3,059,936 10,796,303,269 28,403,102,342
(Exh. VIII)Securities Lending Collateral (Note A):
Government Repurchase Agreements 112,858,323 112,858,323 Total Securities Lending Collateral 112,858,323 — — — 112,858,323
(Exh. VIII)Short-Term Investments (Note A):
Money Market and Bond Funds 566,951,218 566,951,218Investment in Pool Cash 4,017,544 4,017,544Deposits 5,161,866 5,161,866
Total Short-Term Investments 9,179,410 — — 566,951,218 576,130,628 (Exh. VIII)
Proprietary Fund:Investments:
Public Equities:Domestic Equities 9,189,047 2,263,032 126 11,452,205 International Equities 858 858
Total Public Equities 9,189,047 2,263,032 984 — 11,453,063 Fixed Income:
U.S. Treasury Securities 1,066,823,847 1,066,823,847 U.S. Government Agency Obligations 198,931,245 198,931,245 Corporate Obligations 305,767,636 305,767,636 Corporate Asset and Mortgage Backed Securities 18,262,783 18,262,783 International Obligations 81,312,765 81,312,765 Exchange Traded Funds (ETFs) 77,878,701 77,878,701 Real Estate Investment Trust (REITs) 10,085,081 10,085,081
Total Fixed Income 1,144,702,548 614,359,510 — — 1,759,062,058 Investments Measured at the Net Asset Value (NAV):
Opportunistic 24,526,394 24,526,394 Private Fixed Income 77,884,304 77,884,304
Total Investments Measured at the NAV — — — 102,410,698 102,410,698 Total Investments 1,153,891,595 616,622,542 984 102,410,698 1,872,925,819
(Exh. V)
Notes to the Basic Financial Statements (Continued)August 31, 2020
60 Financial Section � 2020 Comprehensive Annual Financial Report � Employees Retirement System of Texas
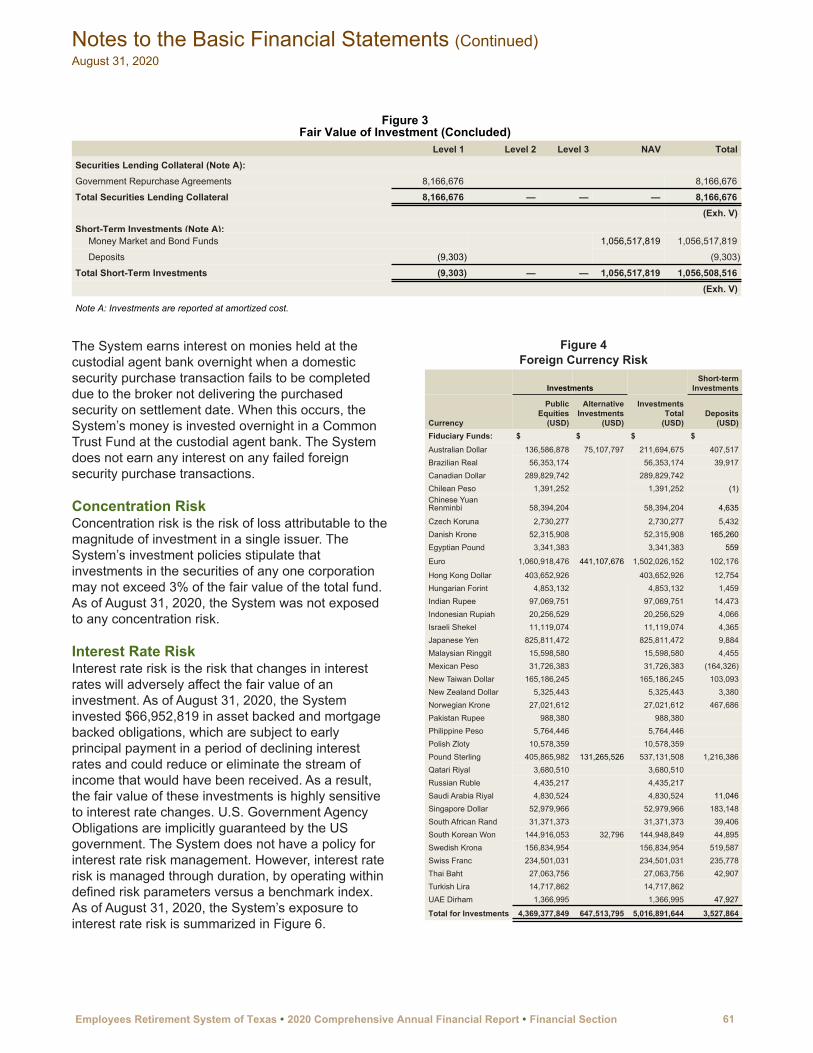
Figure 3Fair Value of Investment (Concluded)
Level 1 Level 2 Level 3 NAV TotalSecurities Lending Collateral (Note A):Government Repurchase Agreements 8,166,676 8,166,676
Total Securities Lending Collateral 8,166,676 — — — 8,166,676 (Exh. V)
Short-Term Investments (Note A): Money Market and Bond Funds 1,056,517,819 1,056,517,819
Deposits (9,303) (9,303)
Total Short-Term Investments (9,303) — — 1,056,517,819 1,056,508,516 (Exh. V)
Note A: Investments are reported at amortized cost.
The System earns interest on monies held at the custodial agent bank overnight when a domestic security purchase transaction fails to be completed due to the broker not delivering the purchased security on settlement date. When this occurs, the System’s money is invested overnight in a Common Trust Fund at the custodial agent bank. The System does not earn any interest on any failed foreign security purchase transactions.
Concentration RiskConcentration risk is the risk of loss attributable to the magnitude of investment in a single issuer. The System’s investment policies stipulate that investments in the securities of any one corporation may not exceed 3% of the fair value of the total fund. As of August 31, 2020, the System was not exposed to any concentration risk.
Interest Rate RiskInterest rate risk is the risk that changes in interest rates will adversely affect the fair value of an investment. As of August 31, 2020, the System invested $66,952,819 in asset backed and mortgage backed obligations, which are subject to early principal payment in a period of declining interest rates and could reduce or eliminate the stream of income that would have been received. As a result, the fair value of these investments is highly sensitive to interest rate changes. U.S. Government Agency Obligations are implicitly guaranteed by the US government. The System does not have a policy for interest rate risk management. However, interest rate risk is managed through duration, by operating within defined risk parameters versus a benchmark index. As of August 31, 2020, the System’s exposure to interest rate risk is summarized in Figure 6.
Figure 4Foreign Currency Risk
InvestmentsShort-term
Investments
Currency
PublicEquities
(USD)
AlternativeInvestments
(USD)
InvestmentsTotal
(USD)Deposits
(USD)Fiduciary Funds: $ $ $ $Australian Dollar 136,586,878 75,107,797 211,694,675 407,517Brazilian Real 56,353,174 56,353,174 39,917Canadian Dollar 289,829,742 289,829,742Chilean Peso 1,391,252 1,391,252 (1)Chinese Yuan Renminbi 58,394,204 58,394,204 4,635
Czech Koruna 2,730,277 2,730,277 5,432Danish Krone 52,315,908 52,315,908 165,260Egyptian Pound 3,341,383 3,341,383 559
Euro 1,060,918,476 441,107,676 1,502,026,152 102,176
Hong Kong Dollar 403,652,926 403,652,926 12,754Hungarian Forint 4,853,132 4,853,132 1,459Indian Rupee 97,069,751 97,069,751 14,473Indonesian Rupiah 20,256,529 20,256,529 4,066Israeli Shekel 11,119,074 11,119,074 4,365Japanese Yen 825,811,472 825,811,472 9,884Malaysian Ringgit 15,598,580 15,598,580 4,455Mexican Peso 31,726,383 31,726,383 (164,326)New Taiwan Dollar 165,186,245 165,186,245 103,093New Zealand Dollar 5,325,443 5,325,443 3,380Norwegian Krone 27,021,612 27,021,612 467,686Pakistan Rupee 988,380 988,380Philippine Peso 5,764,446 5,764,446Polish Zloty 10,578,359 10,578,359Pound Sterling 405,865,982 131,265,526 537,131,508 1,216,386Qatari Riyal 3,680,510 3,680,510Russian Ruble 4,435,217 4,435,217Saudi Arabia Riyal 4,830,524 4,830,524 11,046Singapore Dollar 52,979,966 52,979,966 183,148South African Rand 31,371,373 31,371,373 39,406South Korean Won 144,916,053 32,796 144,948,849 44,895Swedish Krona 156,834,954 156,834,954 519,587Swiss Franc 234,501,031 234,501,031 235,778Thai Baht 27,063,756 27,063,756 42,907Turkish Lira 14,717,862 14,717,862UAE Dirham 1,366,995 1,366,995 47,927
Total for Investments 4,369,377,849 647,513,795 5,016,891,644 3,527,864
Notes to the Basic Financial Statements (Continued)August 31, 2020
Employees Retirement System of Texas � 2020 Comprehensive Annual Financial Report � Financial Section 61

Figure 5Fixed Income Investment Credit Risk
Standard & Poors/Moody's/FitchRatings
U. S TreasurySecurities
U.S.Government
AgencyObligations
CorporateObligations
CorporateAsset andMortgage
BackedSecurities
InternationalObligations
Real EstateInvestment
Trust(REITs)
ExchangeTradedFunds(ETFs) Total
Fiduciary Funds $ $ $ $ $ $ $ $Investments:
A+/A1/A+ 131,789,541 131,789,541
AA/Aa2/AA 3,638,686 3,638,686
AA-/Aa3/AA- 442,584 268,380,946 268,823,530
AA+/Aa1/AA+ 40,788,287 485,066,315 525,854,602
AAA/Aaa/AAA 2,562,887,521 38,258,080 2,601,145,601
B/B2/B 234,817,711 91,233,600 6,958,007 333,009,318
B-/B3/B- 135,689,274 42,929,965 178,619,239
B+/B1/B+ 187,518,759 5,505,293 51,601,552 19,279,876 263,905,480
BB/Ba2/BB 397,728,428 25,283,042 16,121,297 439,132,767
BB-/Ba3/BB- 299,389,419 61,429,111 951,947 361,770,477
BB+/Ba1/BB+ 272,445,760 1,287,977 73,365,846 347,099,583
BBB/Baa2/BBB 13,645,660 2,802,820 16,448,480
BBB-/Baa3/BBB- 105,967,965 8,472,928 7,269,808 121,710,701
CCC-/Caa3/C 15,462,483 4,096,542 9,475,573 29,034,598
CCC/Caa2/CC 40,966,620 21,633,029 62,599,649
CCC+/Caa1/CCC 133,339,344 105,543,973 238,883,317
D/-/DD 180,928 5,267,869 5,448,797
Not Rated 57,886,571 10,287,282 2,447,233 70,621,086
Investments Totals 2,603,675,808 485,508,899 1,895,038,922 48,690,036 503,947,559 62,503,741 400,170,487 5,999,535,452 Proprietary Funds $ $ $ $ $ $ $Investments:
A+/A1/A+ 21,264,459 21,264,459
AA/Aa2/AA 1,490,906 1,490,906
AA-/Aa3/AA- 181,343 56,614,242 56,795,585
AA+/Aa1/AA+ 16,712,494 198,749,902 215,462,396
AAA/Aaa/AAA 1,050,111,353 15,675,773 1,065,787,126
B/B2/B 37,888,222 14,720,691 1,122,686 53,731,599
B-/B3/B- 21,893,687 6,926,820 28,820,507
B+/B1/B+ 30,256,459 888,288 8,325,995 3,110,840 42,581,582
BB/Ba2/BB 64,174,134 4,079,460 2,601,198 70,854,792
BB-/Ba3/BB- 48,306,973 9,911,688 153,598 58,372,259
BB+/Ba1/BB+ 43,959,570 207,816 11,837,699 56,005,085
BBB/Baa2/BBB 2,201,750 452,240 2,653,990
BBB-/Baa3/BBB- 17,098,105 1,367,121 1,172,995 19,638,221
CCC-/Caa3/C 2,494,897 660,984 1,528,899 4,684,780
CCC/Caa2/CC 6,610,031 3,490,525 10,100,556
CCC+/Caa1/CCC 21,514,522 17,029,693 38,544,215
D/-/DD 29,193 849,979 879,172
NR 9,340,093 1,659,870 394,865 11,394,828
Investments Totals 1,066,823,847 198,931,245 305,767,636 18,262,783 81,312,765 10,085,081 77,878,701 1,759,062,058
Notes to the Basic Financial Statements (Continued)August 31, 2020
62 Financial Section � 2020 Comprehensive Annual Financial Report � Employees Retirement System of Texas
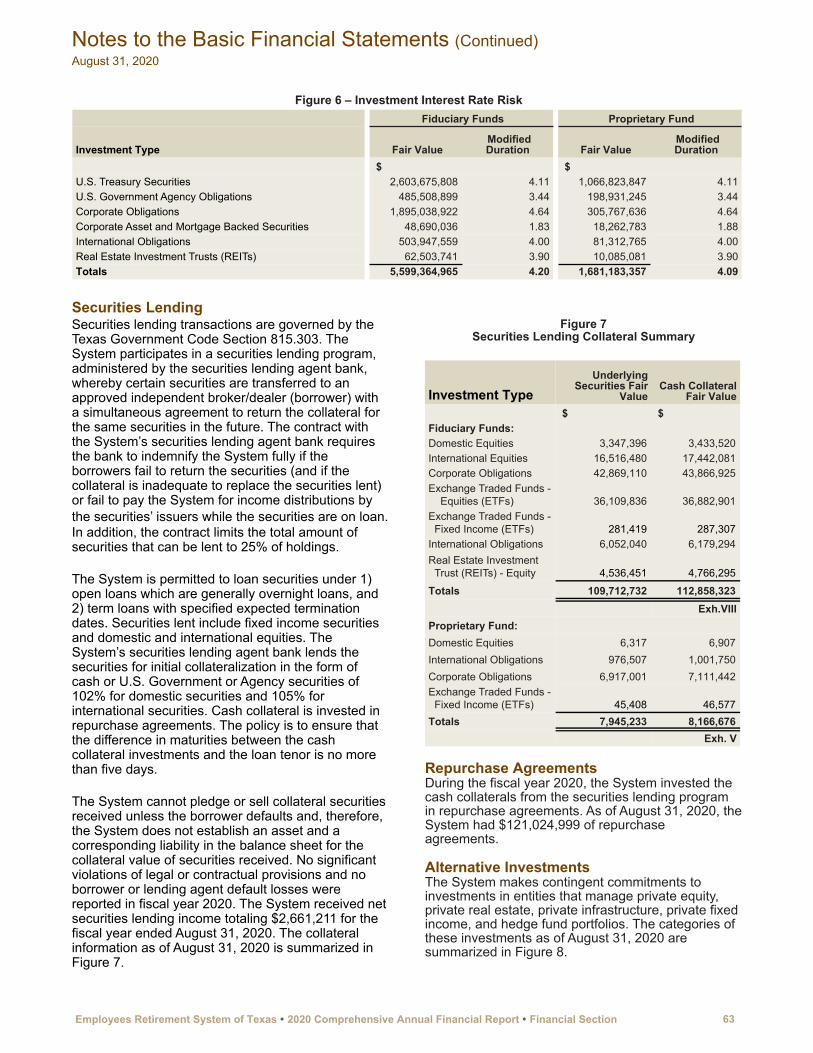
Figure 6 – Investment Interest Rate Risk Fiduciary Funds Proprietary Fund
Investment Type Fair Value Modified Duration Fair Value
Modified Duration
$ $ U.S. Treasury Securities 2,603,675,808 4.11 1,066,823,847 4.11U.S. Government Agency Obligations 485,508,899 3.44 198,931,245 3.44Corporate Obligations 1,895,038,922 4.64 305,767,636 4.64Corporate Asset and Mortgage Backed Securities 48,690,036 1.83 18,262,783 1.88International Obligations 503,947,559 4.00 81,312,765 4.00Real Estate Investment Trusts (REITs) 62,503,741 3.90 10,085,081 3.90Totals 5,599,364,965 4.20 1,681,183,357 4.09
Securities LendingSecurities lending transactions are governed by the Texas Government Code Section 815.303. The System participates in a securities lending program, administered by the securities lending agent bank, whereby certain securities are transferred to an approved independent broker/dealer (borrower) with a simultaneous agreement to return the collateral for the same securities in the future. The contract with the System’s securities lending agent bank requires the bank to indemnify the System fully if the borrowers fail to return the securities (and if the collateral is inadequate to replace the securities lent) or fail to pay the System for income distributions by the securities’ issuers while the securities are on loan. In addition, the contract limits the total amount of securities that can be lent to 25% of holdings.
The System is permitted to loan securities under 1) open loans which are generally overnight loans, and 2) term loans with specified expected termination dates. Securities lent include fixed income securities and domestic and international equities. The System’s securities lending agent bank lends the securities for initial collateralization in the form of cash or U.S. Government or Agency securities of 102% for domestic securities and 105% for international securities. Cash collateral is invested in repurchase agreements. The policy is to ensure that the difference in maturities between the cash collateral investments and the loan tenor is no more than five days.
The System cannot pledge or sell collateral securities received unless the borrower defaults and, therefore, the System does not establish an asset and a corresponding liability in the balance sheet for the collateral value of securities received. No significant violations of legal or contractual provisions and no borrower or lending agent default losses were reported in fiscal year 2020. The System received net securities lending income totaling $2,661,211 for the fiscal year ended August 31, 2020. The collateral information as of August 31, 2020 is summarized in Figure 7.
Figure 7Securities Lending Collateral Summary
Investment Type Underlying
Securities Fair Value
Cash Collateral Fair Value
$ $ Fiduciary Funds:Domestic Equities 3,347,396 3,433,520 International Equities 16,516,480 17,442,081 Corporate Obligations 42,869,110 43,866,925 Exchange Traded Funds -
Equities (ETFs) 36,109,836 36,882,901 Exchange Traded Funds -
Fixed Income (ETFs) 281,419 287,307 International Obligations 6,052,040 6,179,294 Real Estate Investment
Trust (REITs) - Equity 4,536,451 4,766,295
Totals 109,712,732 112,858,323 Exh.VIII
Proprietary Fund:Domestic Equities 6,317 6,907 International Obligations 976,507 1,001,750 Corporate Obligations 6,917,001 7,111,442 Exchange Traded Funds -
Fixed Income (ETFs) 45,408 46,577 Totals 7,945,233 8,166,676
Exh. V
Repurchase AgreementsDuring the fiscal year 2020, the System invested the cash collaterals from the securities lending program in repurchase agreements. As of August 31, 2020, the System had $121,024,999 of repurchase agreements.
Alternative InvestmentsThe System makes contingent commitments to investments in entities that manage private equity, private real estate, private infrastructure, private fixed income, and hedge fund portfolios. The categories of these investments as of August 31, 2020 are summarized in Figure 8.
Notes to the Basic Financial Statements (Continued)August 31, 2020
Employees Retirement System of Texas � 2020 Comprehensive Annual Financial Report � Financial Section 63

Figure8Alternative Investments (Note A)
CurrencyNo. of Funds Commitment
Remaining Commitment
Adjusted Funded Amount Fair Value
Redemption Frequency
Redemption Notice
Redemption Restrictions
$ $ $ $Private Equity:
US Dollar 132 7,639,171,756 2,725,674,761 4,913,496,995 4,108,381,836 N/A N/A N/AEuro Dollar 19 824,685,949 402,805,360 421,880,589 293,277,607 N/A N/A N/ABritish Pound 3 104,438,100 32,957,027 71,481,073 94,036,086 N/A N/A N/AKorean Won 1 23,991,017 0 23,991,017 32,796 N/A N/A N/A
Sub-total 155 8,592,286,822 3,161,437,148 5,430,849,674 4,495,728,326 Private Real Estate:
US Dollar 72 4,544,514,532 1,693,670,058 2,850,844,474 2,205,668,833 N/A, Monthly/Quarterly
N/A, 45-90 Days
N/A
Euro Dollar 3 228,426,450 47,517,613 180,908,837 134,674,003 N/A, Monthly/Quarterly
N/A, 45-90 Days
N/A
British Pound 1 56,667,737 11,957,481 44,710,256 17,379,442 N/A N/A N/ASub-total 76 4,829,608,719 1,753,145,152 3,076,463,567 2,357,722,279 Private Infrastructure:
US Dollar 31 1,868,600,000 778,307,209 1,090,292,791 970,144,776 N/A N/A N/AAustralian Dollar 2 75,225,443 2971451 72,253,992 74,847,485 N/A N/A N/ABritish Pound 1 9,372,650 — 9,372,650 19,849,998 N/A N/A N/AEuro Dollar 2 149,493,750 134,185,590 15,308,160 13,156,066 N/A N/A N/A
Sub-total 36 2,102,691,843 915,464,250 1,187,227,593 1,077,998,325 Private Fixed Income:
US Dollar 8 850,000,000 306,318,940 543,681,060 560,583,485 N/A N/A, 90 Days N/AHedge Funds:Equity Long/Short
US Dollar 2 310,000,000 — 310,000,000 522,496,595 Monthly 30 Days N/A
US Dollar 1 75,000,000 — 75,000,000 77,588,121 Annually 45 Days 12 Month LockupEvent Driven
US Dollar 1 109,554,176 — 109,554,176 88,494,796 Monthly 30 Days N/A
US Dollar 1 80,000,000 — 80,000,000 30,277,023 Quarterly 60 Days 12 Month Lockup
US Dollar 1 100,000,000 — 100,000,000 109,342,985 Quarterly 65 Days N/AMacro
US Dollar 1 100,000,000 — 100,000,000 75,046,140 Quarterly 30 Days N/A
US Dollar 1 105,000,000 — 105,000,000 85,439,011 Quarterly 60 Days 25% Fund Gate, 24 Month Lockup
Multi-StrategiesUS Dollar 1 120,000,000 — 120,000,000 130,886,279 Quarterly 180 Days 12.5% Fund Gate,
12 Month LockupUS Dollar 1 16,345,085 — 16,345,085 16,082,463 N/A N/A N/AUS Dollar 1 150,000,000 23,948,109 126,051,891 129,924,026 Varies Varies Varies
US Dollar 1 125,000,000 — 125,000,000 139,157,344 Rolling 9 Month
60 Days 25% Investor Gate, 9 Month
LockupOpportunistic
US Dollar 1 100,000,000 — 100,000,000 92,823,543 Annually N/A 36 Month Lockup
US Dollar 1 150,000,000 — 150,000,000 170,156,271 Quarterly 60 Days 33% Investor Gate
US Dollar 1 5,000,000 — 5,000,000 6,375,978 Quarterly 60 Days 33% Investor Gate
Relative ValueUS Dollar 1 100,000,000 — 100,000,000 82,964,734 Quarterly 45 Days N/A
US Dollar 1 100,000,000 — 100,000,000 46,953,323 Semiannually 90 Days 12.5% Investor Gate
US Dollar 1 100,000,000 — 100,000,000 121,627,536 Quarterly 60 Days 50% Investor Gate
US Dollar 1 100,000,000 — 100,000,000 116,790,231 Quarterly 45 Days 25% Investor Gate
Sub-total 19 1,945,899,261 23,948,109 1,921,951,152 2,042,426,398
Total 294 18,320,486,645 6,160,313,599 12,160,173,046 10,534,458,813
Notes to the Basic Financial Statements (Continued)August 31, 2020
64 Financial Section � 2020 Comprehensive Annual Financial Report � Employees Retirement System of Texas

2.B Fund Equity
Fiduciary Net Position Held in Trust for Pension Benefits and Other PurposesA summary of pension plan and other employee benefit fiduciary net position at August 31, 2020 is presented in Figure 9.
Figure 9Net Position - Fiduciary Fund
Fund Type Amount$
Defined Benefit Plans (Note A) 29,476,055,755 Deferred Compensation Plans and Cafeteria Plan:Administration - Deferred Compensation Plans 6,532,962 Administration - State Employees Cafeteria Plan 23,755,743 Total Deferred Compensation Plans and Cafeteria Plan 30,288,705 Commuter Spending Account Fund 548,273 Net Position Restricted for Pension and Other Benefits 29,506,892,733
Exh. VIII
Note A: See Note 3.D Reserves for details of the statutorily required reserve balances of the Defined Benefit Plans
2.C Derivative InvestmentDerivatives are generally defined as contracts or securities whose value depends on, or derives from, the value of an underlying asset, reference rate, or index.
Futures ContractsThe System purchases and sells futures contracts as a means of adjusting the portfolio mix and as a lower transaction cost substitute for transactions which would otherwise occur in the underlying portfolios.A futures contract is a contract to buy or sell units of an index or financial instrument at a specified future date at a price agreed upon when the contract is originated.Upon entering into a futures contract, the System pledges to the broker cash or U.S. government securities equal to the minimum “initial margin” requirement of the futures exchange. The System could be exposed to risk if the counterparties to the contracts are unable to meet the terms of the contracts.
The System’s investment managers seek to control this risk through counterparty credit requirements and the use of Commodity Futures Trading Commission approved futures and exchange traded options. The System anticipates that the counterparties will be able to satisfy their obligations under the contracts.
The System receives or pays a daily “variation margin,” which is an amount of cash equal to the daily
fluctuation in value of the contract. The accumulated value of the variation margin is the fair value of the futures contract. The System had no outstanding futures contracts on August 31, 2020.
OptionsAn option is a contract that gives buyers the right, but not the obligations, to buy (call) or sell (put) an asset at a specified future date at a price agreed upon when the option is originated. The option’s price is usually a small percentage of the underlying asset’s value.
As a writer of financial options, the System receives a premium at the outset of the agreement and bears the risk of an unfavorable change in the price of the financial instrument underlying the option. As a purchaser of financial options, the System pays a premium at the outset of the agreement and the counterparty bears the risk of an unfavorable change in the price of the financial instrument underlying the option. The System has option contracts as of August 31, 2020 is summarized in Figure 10.
Forward ContractsThe System enters into forward contracts to minimize the short-term impact of foreign exchange rate fluctuation on the asset and liability positions of international equities. The System had no outstanding forward contracts on August 31, 2020.
Notes to the Basic Financial Statements (Continued)August 31, 2020
Employees Retirement System of Texas � 2020 Comprehensive Annual Financial Report � Financial Section 65
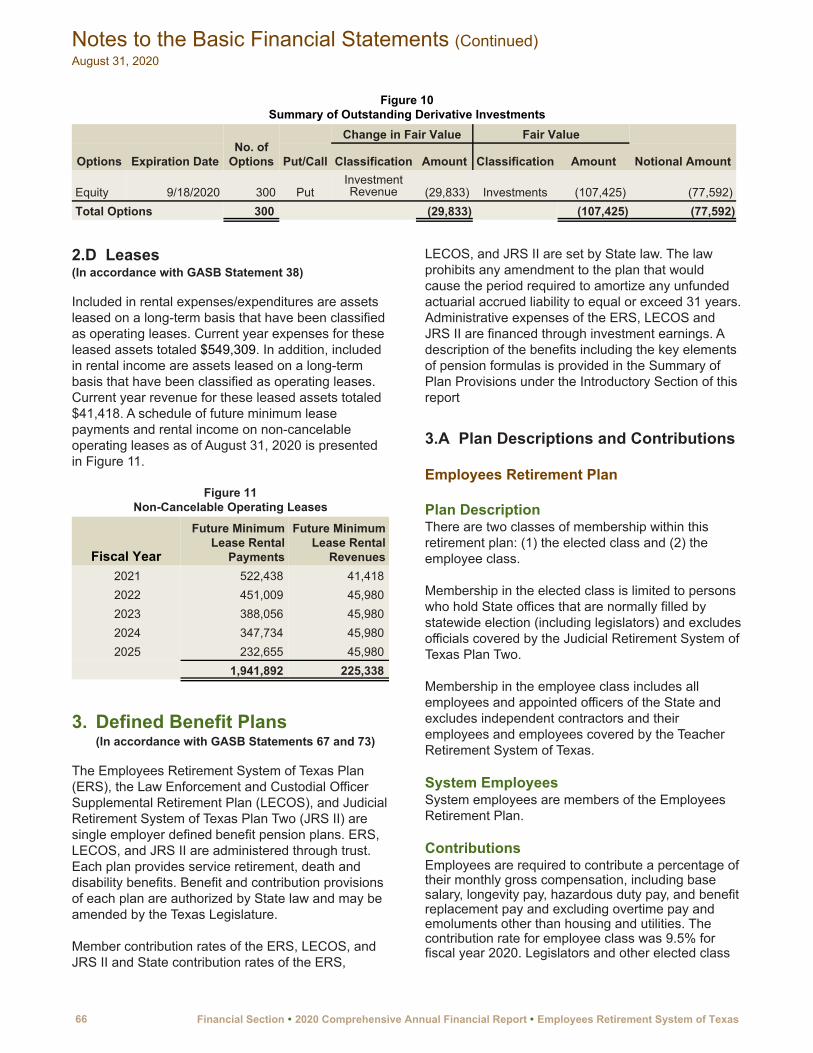
Figure 10Summary of Outstanding Derivative Investments
No. of Options
Change in Fair Value Fair Value
Options Expiration Date Put/Call Classification Amount Classification Amount Notional Amount
Equity 9/18/2020 300 PutInvestment Revenue (29,833) Investments (107,425) (77,592)
Total Options 300 (29,833) (107,425) (77,592)
2.D Leases(In accordance with GASB Statement 38)
Included in rental expenses/expenditures are assets leased on a long-term basis that have been classified as operating leases. Current year expenses for these leased assets totaled $549,309. In addition, included in rental income are assets leased on a long-term basis that have been classified as operating leases. Current year revenue for these leased assets totaled $41,418. A schedule of future minimum lease payments and rental income on non-cancelable operating leases as of August 31, 2020 is presented in Figure 11.
Figure 11Non-Cancelable Operating Leases
Fiscal Year
Future Minimum Lease Rental
Payments
Future Minimum Lease Rental
Revenues2021 522,438 41,418 2022 451,009 45,980 2023 388,056 45,980 2024 347,734 45,980 2025 232,655 45,980
1,941,892 225,338
3. Defined Benefit Plans(In accordance with GASB Statements 67 and 73)
The Employees Retirement System of Texas Plan (ERS), the Law Enforcement and Custodial Officer Supplemental Retirement Plan (LECOS), and Judicial Retirement System of Texas Plan Two (JRS II) are single employer defined benefit pension plans. ERS, LECOS, and JRS II are administered through trust. Each plan provides service retirement, death and disability benefits. Benefit and contribution provisions of each plan are authorized by State law and may be amended by the Texas Legislature.
Member contribution rates of the ERS, LECOS, and JRS II and State contribution rates of the ERS,
LECOS, and JRS II are set by State law. The law prohibits any amendment to the plan that would cause the period required to amortize any unfunded actuarial accrued liability to equal or exceed 31 years. Administrative expenses of the ERS, LECOS and JRS II are financed through investment earnings. A description of the benefits including the key elements of pension formulas is provided in the Summary of Plan Provisions under the Introductory Section of this report
3.A Plan Descriptions and Contributions
Employees Retirement Plan
Plan DescriptionThere are two classes of membership within this retirement plan: (1) the elected class and (2) the employee class.
Membership in the elected class is limited to persons who hold State offices that are normally filled by statewide election (including legislators) and excludes officials covered by the Judicial Retirement System of Texas Plan Two.
Membership in the employee class includes all employees and appointed officers of the State and excludes independent contractors and their employees and employees covered by the Teacher Retirement System of Texas.
System EmployeesSystem employees are members of the Employees Retirement Plan.
ContributionsEmployees are required to contribute a percentage of their monthly gross compensation, including base salary, longevity pay, hazardous duty pay, and benefit replacement pay and excluding overtime pay and emoluments other than housing and utilities. The contribution rate for employee class was 9.5% for fiscal year 2020. Legislators and other elected class
Notes to the Basic Financial Statements (Continued)August 31, 2020
66 Financial Section � 2020 Comprehensive Annual Financial Report � Employees Retirement System of Texas

members are required to contribute 9.5% of their compensation to the System.
For fiscal year 2020, the State contributed 10% of the payroll of members for both the employee class, legislators, and for other elected class members. See Note 3.B Funded Status and Funding Progress
Law Enforcement and Custodial Officer Supplemental Retirement Plan
Plan DescriptionThe plan covers custodial officers who are certified in accordance with the statutory requirements as having a normal job assignment that requires frequent or infrequent regularly planned contact with inmates managed by the hiring institutions. The plan also covers law enforcement officers who have been commissioned and recognized as commissioned law enforcement officers by the Texas Commission of Law Enforcement.
The monthly benefit amount payable from this fund is equal to the excess of the total benefit over the regular benefit payable to the member from the Employees Retirement System Fund.
ContributionsFor fiscal year 2020, both employee members and the State contributed 0.5% of the covered payroll for LECOS members. An additional $13,592,954 was contributed by the State from dedicated court fees. See Note 3.B Funded Status and Funding Progress.
Judicial Retirement System of Texas Plan Two
Plan DescriptionThe plan covers judges, justices and commissioners of the Supreme Court, the Court of Criminal Appeals, the Court of Appeals, District Courts and certain commissions to a court who first became members after August 31, 1985. Members of the Judicial Retirement System of Texas Plan One are excluded from this plan.
ContributionsMembers are required to contribute 9.5% of their compensation to the System during fiscal year 2020. Members who accrue 20 years of service credit in the retirement system may cease making contributions, but are considered contributing members for all other purposes; however, the State contribution continues. For the fiscal year ended August 31, 2020 the State contributed 15.663% of the payroll of members. See Note 3.B Funded Status and Funding Progress.
3.B Net Pension Liability(In accordance with GASB Statement 67)
Summary of Actuarial AssumptionsThe actuarial valuations involve estimates of the value of reported amounts and assumptions about the probability of events far into the future, and the actuarially determined amounts are subject to continual revision as actual results are compared to past expectations and new estimates are made about the future. The assumptions are presented in Figure 12.
Figure 12Actuarial Assumptions - Defined Benefit Plans
Employees Retirement Fund
Law Enforcement and Custodial Officer
Supplemental Fund Judicial Retirement System Plan II(In accordance with GASB Statement No. 67)
Valuation Date August 31, 2020Actuarial Cost Method Entry Age NormalInvestment Rate of Return 7.0%Projected Salary Increases 0.0% – 8.8% 3.75% – 8.75% 2.3% plus follows State judicial tiered
salary schedule as prescribed in Section 659.012
Inflation Rate 2.3%Last Experience Study 5-year period from September 1, 2014 to August 31, 2019Mortality Rate 2020 State Retirees of Texas (SRT) mortality table. Generational mortality improvements in accordance
with ultimate rates from the scale most recently published by Retirement Plans Experience Committee of the Society of Actuaries ("Scale U-MP") and projected from the year 2020. Rates for male LECO
members are set forward one year.
Notes to the Basic Financial Statements (Continued)August 31, 2020
Employees Retirement System of Texas � 2020 Comprehensive Annual Financial Report � Financial Section 67
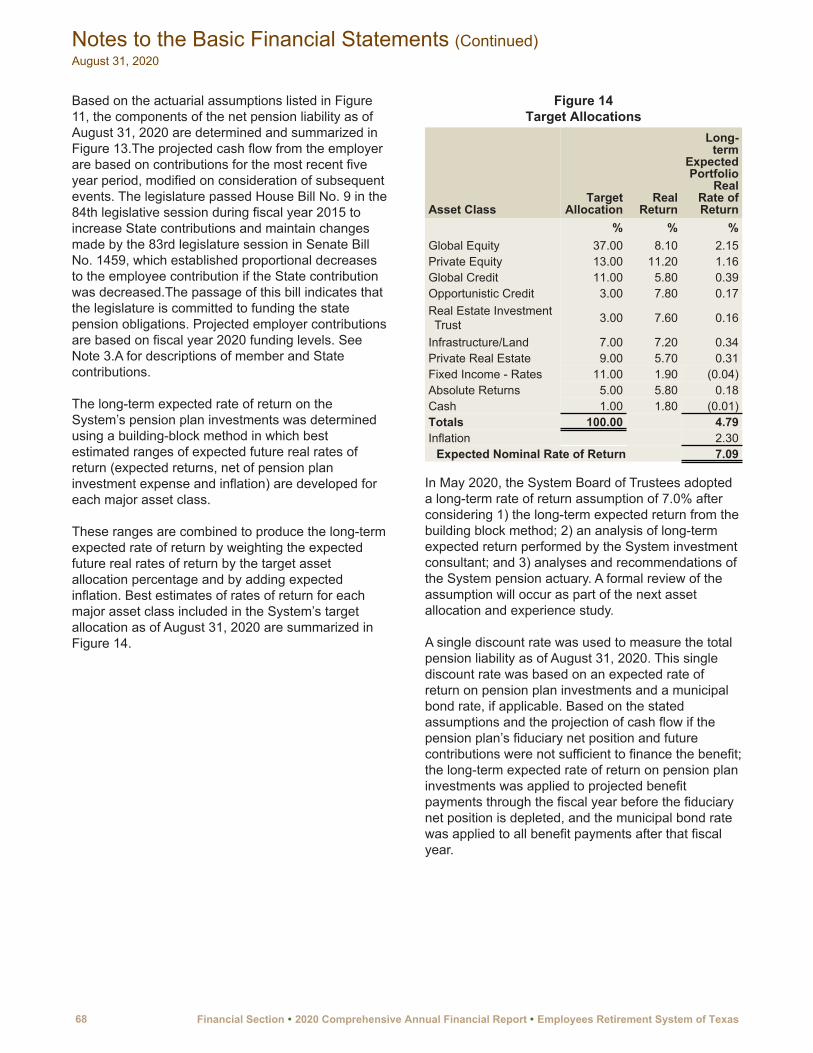
Based on the actuarial assumptions listed in Figure 11, the components of the net pension liability as of August 31, 2020 are determined and summarized in Figure 13.The projected cash flow from the employer are based on contributions for the most recent five year period, modified on consideration of subsequent events. The legislature passed House Bill No. 9 in the 84th legislative session during fiscal year 2015 to increase State contributions and maintain changes made by the 83rd legislature session in Senate Bill No. 1459, which established proportional decreases to the employee contribution if the State contribution was decreased.The passage of this bill indicates that the legislature is committed to funding the state pension obligations. Projected employer contributions are based on fiscal year 2020 funding levels. See Note 3.A for descriptions of member and State contributions.
The long-term expected rate of return on the System’s pension plan investments was determined using a building-block method in which best estimated ranges of expected future real rates of return (expected returns, net of pension plan investment expense and inflation) are developed for each major asset class.
These ranges are combined to produce the long-term expected rate of return by weighting the expected future real rates of return by the target asset allocation percentage and by adding expected inflation. Best estimates of rates of return for each major asset class included in the System’s target allocation as of August 31, 2020 are summarized in Figure 14.
Figure 14 Target Allocations
Asset ClassTarget
AllocationReal
Return
Long-term
Expected Portfolio
Real Rate of Return
% % %Global Equity 37.00 8.10 2.15Private Equity 13.00 11.20 1.16Global Credit 11.00 5.80 0.39Opportunistic Credit 3.00 7.80 0.17Real Estate Investment Trust 3.00 7.60 0.16
Infrastructure/Land 7.00 7.20 0.34Private Real Estate 9.00 5.70 0.31Fixed Income - Rates 11.00 1.90 (0.04)Absolute Returns 5.00 5.80 0.18Cash 1.00 1.80 (0.01)Totals 100.00 4.79Inflation 2.30
Expected Nominal Rate of Return 7.09
In May 2020, the System Board of Trustees adopted a long-term rate of return assumption of 7.0% after considering 1) the long-term expected return from the building block method; 2) an analysis of long-term expected return performed by the System investment consultant; and 3) analyses and recommendations of the System pension actuary. A formal review of the assumption will occur as part of the next asset allocation and experience study.
A single discount rate was used to measure the total pension liability as of August 31, 2020. This single discount rate was based on an expected rate of return on pension plan investments and a municipal bond rate, if applicable. Based on the stated assumptions and the projection of cash flow if the pension plan’s fiduciary net position and future contributions were not sufficient to finance the benefit; the long-term expected rate of return on pension plan investments was applied to projected benefit payments through the fiscal year before the fiduciary net position is depleted, and the municipal bond rate was applied to all benefit payments after that fiscal year.
Notes to the Basic Financial Statements (Continued)August 31, 2020
68 Financial Section � 2020 Comprehensive Annual Financial Report � Employees Retirement System of Texas
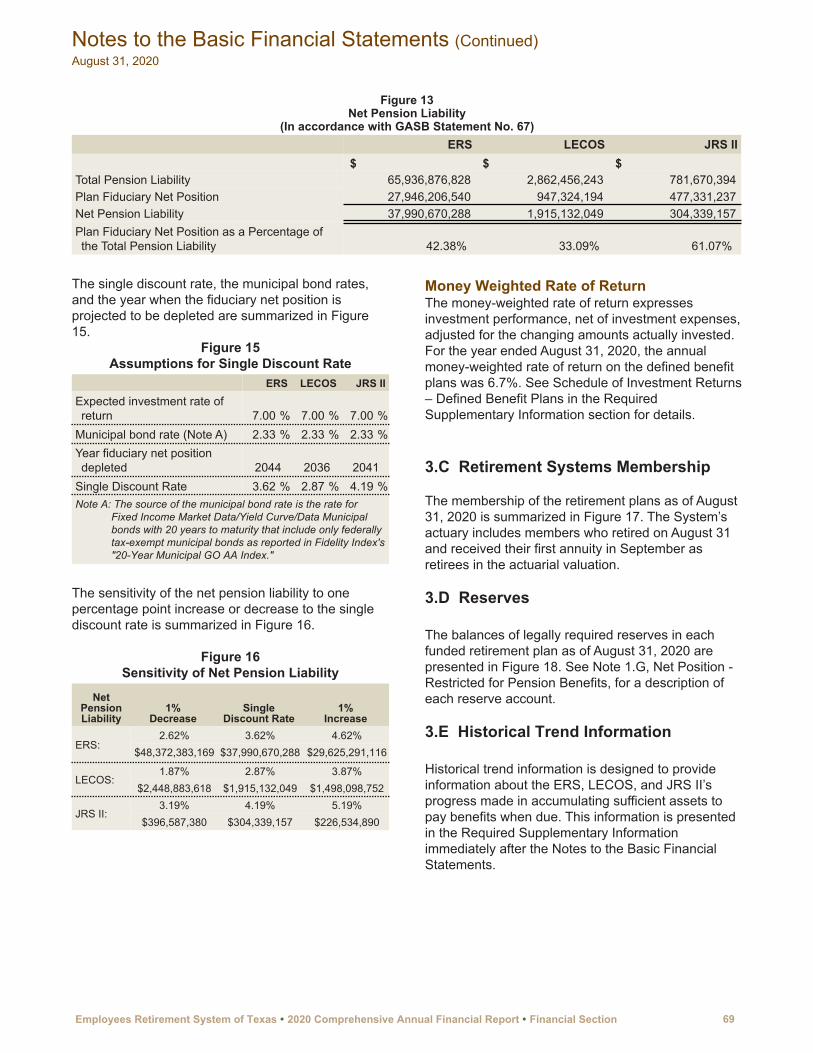
Figure 13Net Pension Liability
(In accordance with GASB Statement No. 67) ERS LECOS JRS II
$ $ $ Total Pension Liability 65,936,876,828 2,862,456,243 781,670,394 Plan Fiduciary Net Position 27,946,206,540 947,324,194 477,331,237 Net Pension Liability 37,990,670,288 1,915,132,049 304,339,157 Plan Fiduciary Net Position as a Percentage of the Total Pension Liability 42.38 % 33.09 % 61.07 %
The single discount rate, the municipal bond rates, and the year when the fiduciary net position is projected to be depleted are summarized in Figure 15.
Figure 15Assumptions for Single Discount Rate
ERS LECOS JRS IIExpected investment rate of return 7.00 % 7.00 % 7.00 %
Municipal bond rate (Note A) 2.33 % 2.33 % 2.33 %Year fiduciary net position depleted 2044 2036 2041
Single Discount Rate 3.62 % 2.87 % 4.19 %Note A: The source of the municipal bond rate is the rate for
Fixed Income Market Data/Yield Curve/Data Municipal bonds with 20 years to maturity that include only federally tax-exempt municipal bonds as reported in Fidelity Index's "20-Year Municipal GO AA Index."
The sensitivity of the net pension liability to one percentage point increase or decrease to the single discount rate is summarized in Figure 16.
Figure 16Sensitivity of Net Pension Liability
Net Pension Liability
1%Decrease
Single Discount Rate
1%Increase
ERS:2.62% 3.62% 4.62%
$48,372,383,169 $37,990,670,288 $29,625,291,116
LECOS:1.87% 2.87% 3.87%
$2,448,883,618 $1,915,132,049 $1,498,098,752
JRS II:3.19% 4.19% 5.19%
$396,587,380 $304,339,157 $226,534,890
Money Weighted Rate of ReturnThe money-weighted rate of return expresses investment performance, net of investment expenses, adjusted for the changing amounts actually invested. For the year ended August 31, 2020, the annual money-weighted rate of return on the defined benefit plans was 6.7%. See Schedule of Investment Returns – Defined Benefit Plans in the Required Supplementary Information section for details.
3.C Retirement Systems Membership
The membership of the retirement plans as of August 31, 2020 is summarized in Figure 17. The System’s actuary includes members who retired on August 31 and received their first annuity in September as retirees in the actuarial valuation.
3.D Reserves
The balances of legally required reserves in each funded retirement plan as of August 31, 2020 are presented in Figure 18. See Note 1.G, Net Position - Restricted for Pension Benefits, for a description of each reserve account.
3.E Historical Trend Information
Historical trend information is designed to provide information about the ERS, LECOS, and JRS II’s progress made in accumulating sufficient assets to pay benefits when due. This information is presented in the Required Supplementary Information immediately after the Notes to the Basic Financial Statements.
Notes to the Basic Financial Statements (Continued)August 31, 2020
Employees Retirement System of Texas � 2020 Comprehensive Annual Financial Report � Financial Section 69
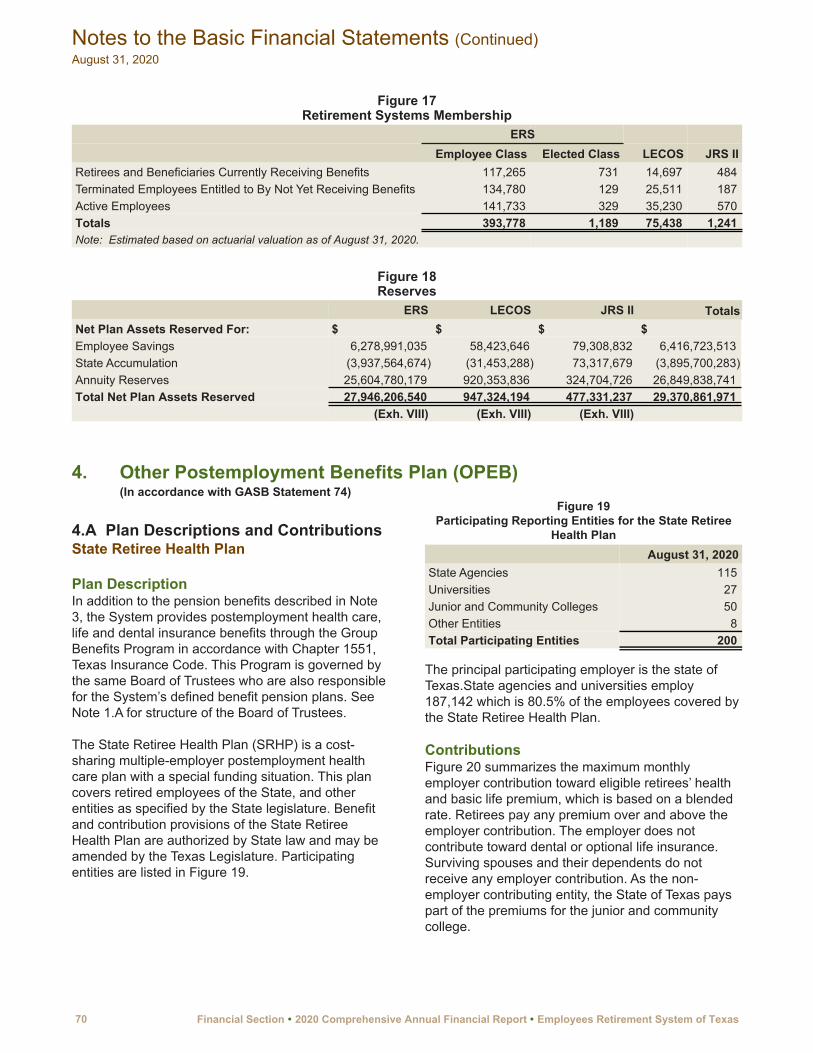
Figure 17Retirement Systems Membership
ERSEmployee Class Elected Class LECOS JRS II
Retirees and Beneficiaries Currently Receiving Benefits 117,265 731 14,697 484 Terminated Employees Entitled to By Not Yet Receiving Benefits 134,780 129 25,511 187 Active Employees 141,733 329 35,230 570 Totals 393,778 1,189 75,438 1,241 Note: Estimated based on actuarial valuation as of August 31, 2020.
Figure 18Reserves
ERS LECOS JRS II TotalsNet Plan Assets Reserved For: $ $ $ $Employee Savings 6,278,991,035 58,423,646 79,308,832 6,416,723,513 State Accumulation (3,937,564,674) (31,453,288) 73,317,679 (3,895,700,283) Annuity Reserves 25,604,780,179 920,353,836 324,704,726 26,849,838,741 Total Net Plan Assets Reserved 27,946,206,540 947,324,194 477,331,237 29,370,861,971
(Exh. VIII) (Exh. VIII) (Exh. VIII)
4. Other Postemployment Benefits Plan (OPEB)(In accordance with GASB Statement 74)
4.A Plan Descriptions and ContributionsState Retiree Health Plan
Plan DescriptionIn addition to the pension benefits described in Note 3, the System provides postemployment health care, life and dental insurance benefits through the Group Benefits Program in accordance with Chapter 1551, Texas Insurance Code. This Program is governed by the same Board of Trustees who are also responsible for the System’s defined benefit pension plans. See Note 1.A for structure of the Board of Trustees.
The State Retiree Health Plan (SRHP) is a cost-sharing multiple-employer postemployment health care plan with a special funding situation. This plan covers retired employees of the State, and other entities as specified by the State legislature. Benefit and contribution provisions of the State Retiree Health Plan are authorized by State law and may be amended by the Texas Legislature. Participating entities are listed in Figure 19.
Figure 19Participating Reporting Entities for the State Retiree
Health PlanAugust 31, 2020
State Agencies 115 Universities 27 Junior and Community Colleges 50 Other Entities 8 Total Participating Entities 200
The principal participating employer is the state of Texas.State agencies and universities employ 187,142 which is 80.5% of the employees covered by the State Retiree Health Plan.
ContributionsFigure 20 summarizes the maximum monthly employer contribution toward eligible retirees’ health and basic life premium, which is based on a blended rate. Retirees pay any premium over and above the employer contribution. The employer does not contribute toward dental or optional life insurance. Surviving spouses and their dependents do not receive any employer contribution. As the non-employer contributing entity, the State of Texas pays part of the premiums for the junior and community college.
Notes to the Basic Financial Statements (Continued)August 31, 2020
70 Financial Section � 2020 Comprehensive Annual Financial Report � Employees Retirement System of Texas
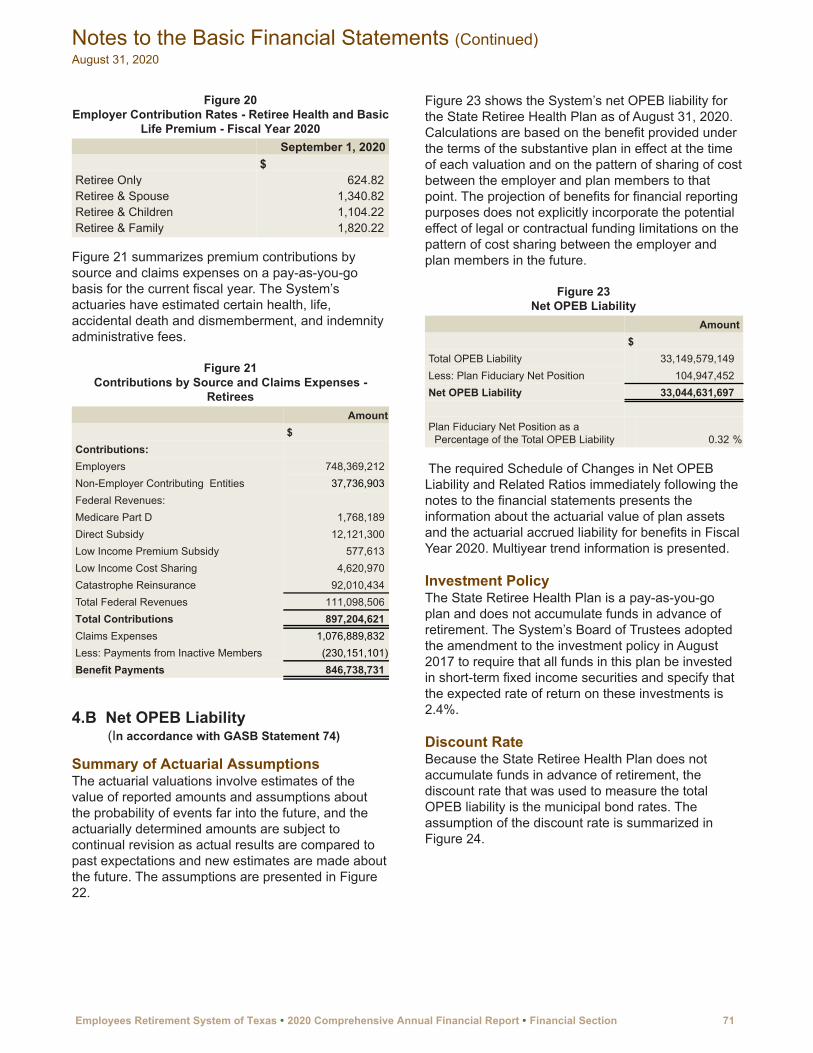
Figure 20Employer Contribution Rates - Retiree Health and Basic
Life Premium - Fiscal Year 2020September 1, 2020
$Retiree Only 624.82 Retiree & Spouse 1,340.82 Retiree & Children 1,104.22 Retiree & Family 1,820.22
Figure 21 summarizes premium contributions by source and claims expenses on a pay-as-you-go basis for the current fiscal year. The System’s actuaries have estimated certain health, life, accidental death and dismemberment, and indemnity administrative fees.
Figure 21Contributions by Source and Claims Expenses -
RetireesAmount
$Contributions:Employers 748,369,212 Non-Employer Contributing Entities 37,736,903 Federal Revenues:Medicare Part D 1,768,189 Direct Subsidy 12,121,300 Low Income Premium Subsidy 577,613 Low Income Cost Sharing 4,620,970 Catastrophe Reinsurance 92,010,434 Total Federal Revenues 111,098,506 Total Contributions 897,204,621 Claims Expenses 1,076,889,832 Less: Payments from Inactive Members (230,151,101) Benefit Payments 846,738,731
4.B Net OPEB Liability(In accordance with GASB Statement 74)
Summary of Actuarial AssumptionsThe actuarial valuations involve estimates of the value of reported amounts and assumptions about the probability of events far into the future, and the actuarially determined amounts are subject to continual revision as actual results are compared to past expectations and new estimates are made about the future. The assumptions are presented in Figure 22.
Figure 23 shows the System’s net OPEB liability for the State Retiree Health Plan as of August 31, 2020. Calculations are based on the benefit provided under the terms of the substantive plan in effect at the time of each valuation and on the pattern of sharing of cost between the employer and plan members to that point. The projection of benefits for financial reporting purposes does not explicitly incorporate the potential effect of legal or contractual funding limitations on the pattern of cost sharing between the employer and plan members in the future.
Figure 23Net OPEB Liability
Amount$
Total OPEB Liability 33,149,579,149 Less: Plan Fiduciary Net Position 104,947,452 Net OPEB Liability 33,044,631,697
Plan Fiduciary Net Position as a Percentage of the Total OPEB Liability 0.32 %
The required Schedule of Changes in Net OPEB Liability and Related Ratios immediately following the notes to the financial statements presents the information about the actuarial value of plan assets and the actuarial accrued liability for benefits in Fiscal Year 2020. Multiyear trend information is presented.
Investment PolicyThe State Retiree Health Plan is a pay-as-you-go plan and does not accumulate funds in advance of retirement. The System’s Board of Trustees adopted the amendment to the investment policy in August 2017 to require that all funds in this plan be invested in short-term fixed income securities and specify that the expected rate of return on these investments is 2.4%.
Discount RateBecause the State Retiree Health Plan does not accumulate funds in advance of retirement, the discount rate that was used to measure the total OPEB liability is the municipal bond rates. The assumption of the discount rate is summarized in Figure 24.
Notes to the Basic Financial Statements (Continued)August 31, 2020
Employees Retirement System of Texas � 2020 Comprehensive Annual Financial Report � Financial Section 71

Figure 22Actuarial Assumptions - State Retiree Health Plan
Valuation Date August 31, 2020Actuarial Cost Method Entry AgeLast Experience Study State Agency Members: 5-year period from September 1, 2014 to August 31, 2019
Higher Education Members: 7-year period from September 1, 2010 to August 31, 2017Actuarial Assumptions:Discount Rate 2.20%Projected Annual Salary Increase 2.30% to 9.05%, including inflationAnnual Healthcare Trend Rate HealthSelect
8.80% for FY2022, 5.25% for FY2023, 5.00% for FY2024, 4.75% for FY2025, 4.60% for FY2026, decreasing 10 basis points per year to an ultimate rate of 4.30% for FY2029 and later years
HealthSelect Medicare Advantage-53.30% for FY2022, 0.00% for FY2023, 66.67% for FY2024, 24.00% for FY2025, 4.60% for FY2026, decreasing 10 basis points per year to an ultimate rate of 4.30% for FY2029 and later years
Pharmacy10.00% for FY2022 and FY2023, decreasing 100 basis points per year to 5.00% for FY2028 and 4.30% for FY2029 and later years
Inflation Assumption Rate 2.30%Ad hoc Postemployment Benefit Changes NoneMortality Rate State Agency Members
a. Service Retirees, Survivors and other Inactive Members (Regular, Elected, CPO/CO and JRS I and II Employee Classes): 2020 State Retirees of Texas Mortality table with a 1 year set forward for male CPO/CO members and Ultimate MP Projection Scale projected from the year 2020.
b. Disability Retirees (Regular, Elected, CPO/CO and JRS I and II Employee Classes): 2020 State Retirees of Texas Mortality table with a 3 year set forward for males and females with minimum rates at all ages of 3.0% for males and 2.5% for females, respectively, and Ultimate MP Projection Scale projected from the year 2020.
c. Active Members: Pub-2010 General Employees Active Member Mortality table for non-CPO/CO members and Pub-2010 Public Safety Active Member Mortality table for CPO/CO members with Ultimate MP Projection Scale from the year 2010.
Higher Education Membersa. Service Retirees, Survivors and other Inactive Members: Tables based on TRS experience
with Ultimate MP Projection Scale from the year 2018.b. Disability Retirees: Tables based on TRS experience with Ultimate MP Projection Scale
from the year 2018 using a 3-year set forward and minimum mortality rates of four per 100 male members and two per 100 female members.
c. Active Members: Sex Distinct RP-2014 Employee Mortality multiplied by 90% with Ultimate MP Projection Scale from the year 2014
Figure 24Assumptions for Single Discount Rate -
State Retiree Health PlanExpected investment rate of return
Not applicable because the plan operates on a pay-as-you-go basis
Municipal bond rate (Note A) 2.20%Year fiduciary net position depleted
2021
Single Discount Rate 2.20%Note A: The source of the municipal bond rate is the Bond Buyer
Index of general obligation bonds with 20 years to maturity and mixed credit quality. The bonds' average credit quality is roughly equivalent to Moody's Investors Service's Aa2 rating and Standard & Poor's Corp.'s AA.
The sensitivity of the net OPEB liability to one percentage point increase or decrease to the discount rate is summarized in Figure 25.
Figure 25Sensitivity of Net OPEB Liability to Changes in
Discount Rate (in Thousands) - State Retiree Health Plan
1% Decrease
Single Discount Rate
1% Increase
Rate 1.20% 2.20% 3.20%
Net OPEB Liability $39,275,875 $33,044,632 $28,163,011
Notes to the Basic Financial Statements (Continued)August 31, 2020
72 Financial Section � 2020 Comprehensive Annual Financial Report � Employees Retirement System of Texas
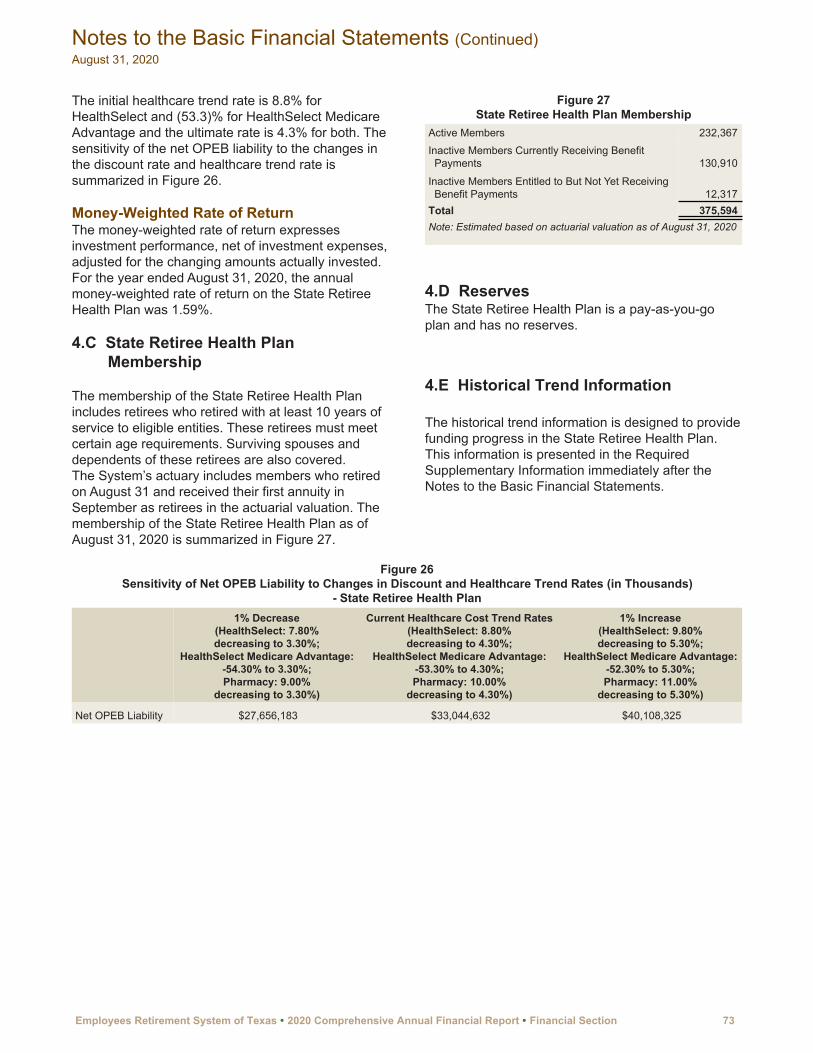
The initial healthcare trend rate is 8.8% for HealthSelect and (53.3)% for HealthSelect Medicare Advantage and the ultimate rate is 4.3% for both. The sensitivity of the net OPEB liability to the changes in the discount rate and healthcare trend rate is summarized in Figure 26.
Money-Weighted Rate of ReturnThe money-weighted rate of return expresses investment performance, net of investment expenses, adjusted for the changing amounts actually invested. For the year ended August 31, 2020, the annual money-weighted rate of return on the State Retiree Health Plan was 1.59%.
4.C State Retiree Health Plan Membership
The membership of the State Retiree Health Plan includes retirees who retired with at least 10 years of service to eligible entities. These retirees must meet certain age requirements. Surviving spouses and dependents of these retirees are also covered.The System’s actuary includes members who retired on August 31 and received their first annuity in September as retirees in the actuarial valuation. The membership of the State Retiree Health Plan as of August 31, 2020 is summarized in Figure 27.
Figure 27State Retiree Health Plan Membership
Active Members 232,367 Inactive Members Currently Receiving Benefit
Payments 130,910
Inactive Members Entitled to But Not Yet Receiving Benefit Payments 12,317
Total 375,594 Note: Estimated based on actuarial valuation as of August 31, 2020
4.D ReservesThe State Retiree Health Plan is a pay-as-you-go plan and has no reserves.
4.E Historical Trend Information
The historical trend information is designed to provide funding progress in the State Retiree Health Plan. This information is presented in the Required Supplementary Information immediately after the Notes to the Basic Financial Statements.
Figure 26Sensitivity of Net OPEB Liability to Changes in Discount and Healthcare Trend Rates (in Thousands)
- State Retiree Health Plan1% Decrease
(HealthSelect: 7.80% decreasing to 3.30%;
HealthSelect Medicare Advantage: -54.30% to 3.30%; Pharmacy: 9.00%
decreasing to 3.30%)
Current Healthcare Cost Trend Rates (HealthSelect: 8.80% decreasing to 4.30%;
HealthSelect Medicare Advantage: -53.30% to 4.30%; Pharmacy: 10.00%
decreasing to 4.30%)
1% Increase(HealthSelect: 9.80% decreasing to 5.30%;
HealthSelect Medicare Advantage: -52.30% to 5.30%; Pharmacy: 11.00%
decreasing to 5.30%)
Net OPEB Liability $27,656,183 $33,044,632 $40,108,325
Notes to the Basic Financial Statements (Continued)August 31, 2020
Employees Retirement System of Texas � 2020 Comprehensive Annual Financial Report � Financial Section 73

5. Interfund Activity and Transactions
5.A Interfund Receivables and Payables(In accordance with GASB Statement 38)
At year-end, accruals related to interfund transfers and interfund reimbursements between the System’s funds, are reported as Due From Other Funds or Due To Other Funds in the fund financial statements (See Note 1.G).
The majority of the due to other funds balance in the Employees Life, Accident and Health Insurance and Benefits fund are payments from retirees, which are due to the State Retiree Health Plan. Figure 28 presents individual interfund receivable and interfundpayable balances at August 31, 2020.
Figure 28Interfund Receivables and Payables
Due From Other Funds
Due toOther Funds
Governmental Activities: $ $
Governmental Funds 9,892
Employees Life, Accident & Health Insurance and Benefits Fund 917,867 11,260,983
Total Governmental Activities 917,867 11,270,875
Fiduciary Funds:Pension & Other Employee Benefit Trust Funds 13,385,543 3,032,535
Total - Interfund Receivables & Payables 14,303,410 14,303,410
5.B Interfund Transfers(In accordance with GASB Statement 38)
Interfund Transfers include transfers of membership fees from the Employees Retirement Fund to other funds of the System and transfers between the Employees Retirement Fund and the Excess Benefit Arrangement Fund for retirement benefit payments (See Note 1.G). Interfund Transfers between governmental activities and fiduciary funds are reclassified to revenues and expenses in the government-wide Statement of Activities. Figure 29 presents interfund transfers for the year ended August 31, 2020.
Figure 29 Interfund Transfers
Transfers In Transfers Out$ $
Governmental Activities:Non-Major Governmental Fund:Social Security Administration 47,500 Total Governmental Activities 47,500 — Fiduciary Funds:Pension and Other Employee
Benefit Trust Funds 1,077,860 1,125,360 Total - Interfund Transfers 1,125,360 1,125,360
5.C Interagency Transfers
Interagency Transfers include transfers between the System’s funds and other funds of the State of Texas reporting entity that are for payment of benefits from the Compensation to Victims of Crime fund that are funded by the Office of the Attorney General. (See Note 1.G). Also included in this category is the amount transferred to the Teacher Retirement System for service established in the Employees Retirement Fund and payable from the Excess Benefit Arrangement Fund. Interagency Transfers between Governmental Activities and other funds of the State are reclassified to revenues and expenses in the government-wide Statement of Activities.
6. Contingent Liability
6.A Litigation
The System is a defendant in various lawsuits. Although the outcome of these lawsuits is not presently determinable, in the opinion of the System’s attorneys, the resolution of these matters will not have a material adverse effect on the financial condition of the System.
6.B Sick LeaveSick leave, the accumulation of which is unlimited, is earned at the rate of eight hours per month and is taken only in the event of illness. In the event of an employee’s death, a payment is made to the employee’s estate for one-half of the accumulated leave or 336 hours, whichever is less. Such payments are recognized as expenses/expenditures when paid.
Service credit is given upon retirement at the rate of one month of service for each 160 hours of an employee’s accumulated sick leave balance. Additional fractions of 160 hours are counted as full
Notes to the Basic Financial Statements (Continued)August 31, 2020
74 Financial Section � 2020 Comprehensive Annual Financial Report � Employees Retirement System of Texas

months of service credit. Effective August 28, 1995, accumulated sick leave may also be used to meet service requirements to qualify for retirement at a rate of one month of service for each 160 hours of accrued unused sick leave for employees hired before September 1, 2009. Employees hired after September 1, 2009 will not be able to use accumulated sick leave to meet retirement eligibility. The additional contingent liability for future compensation of sick leave, based on accumulated sick leave balances as of August 31 was not considered material.
6.C Incentive Compensation Plan
An Incentive Compensation Plan was adopted in December 2006 and amended subsequently to enable the System to remain competitive in its efforts to attract, retain, and motivate talented employees who are specialized in investments and other functions that support investment decisions. The purpose of the Plan is to provide the opportunity for Plan participants to earn performance incentive pay based on the System’s investment performance and the participant’s job performance. Payments can only be earned following years in which the System earns a positive return, and plan participants must be employed by the System on the designated dates in the Plan in order to earn and receive payment. The Board of Trustees may cancel or modify the Plan at any time. The performance incentive pay is paid over the subsequent 2 years. The remaining liability for the incentive pay plan as of August 31, 2020 will not exceed $6.2 million.
7. Risk Management(In accordance with GASB Statement 10)
7.A Risk Exposure
The System is exposed to the following types of claims for risk of loss:
• Health insurance• Life insurance• Accidental death and dismemberment (AD & D)
insurance• Disability insurance• Dental insurance• Property and casualty• Unemployment• Workers’ compensation
7.B Risk Financing
Claims for health, life, accidental death and dismemberment (AD & D), disability, and dental insurance coverages are recorded in the Employees Life, Accident and Health Insurance and Benefits Fund under the Texas Employees Group Benefits Program (GBP). These coverages are provided through a combination of insurance contracts, a self-funded health plan, a self-funded dental indemnity plan, health maintenance organization (HMO) contracts, dental health maintenance organization (DHMO) contracts, and dental discount plan.
The System purchases commercial insurance to cover the risk of loss related to general liability; theft of, damage to, and destruction of assets; and natural disasters. Claims for unemployment and workers compensation are funded by the System on a pay-as- you-go basis, and they are paid out of the Employees Retirement System Fund. These claim expenses are allocated periodically to other funds based on percentages determined by a study of each fund’s usage. The risk financing for different coverages is summarized in Figure 30.
Notes to the Basic Financial Statements (Continued)August 31, 2020
Employees Retirement System of Texas � 2020 Comprehensive Annual Financial Report � Financial Section 75

Figure 30 Summary of Risk Financing
Type of Coverage Plan Name Self-Funded Risk Retained withHealth • HealthSelect Yes System
• Consumer Directed HealthSelect Yes System• HMOs No Insurance Carrier• Prescription Drug Yes System• Vision Yes System
Life N/A No Insurance CarrierAccidental Death and Dismemberment N/A No Insurance CarrierDisability N/A Yes SystemDental • DHMOs No Insurance Carrier
• Dental Indemnity Plan Yes System• Dental Discount Plan No Insurance Carrier
Property and Casualty N/A No Insurance CarrierUnemployment N/A Yes SystemWorkers’ Compensation N/A Yes System
7.C Liabilities
For self-funded coverages of the Internal Service Fund, the System’s liabilities are reported when it is both probable that a loss has occurred and the amount of that loss can be reasonably estimated. Liabilities include an amount for claims that have been incurred but not reported. Based on the estimates provided by the System’s insurance actuary (Rudd and Wisdom, Inc.), liabilities are reevaluated to consider current settlements, frequency of claims, past experience and economic factors. Changes in the balances of the self-funded claims liabilities for the current fiscal year are presented in Figure 31.
Figure 31Changes in Self-Funded Claims Liabilities
Amount$
Beginning Balance 635,161,172
Current-Year Claims and Changes in Estimates 2,160,806,204
Claim Payments (2,120,813,266)
Ending Balance 675,154,110
For coverages that are insured (not self-funded), no significant reductions in insurance coverage occurred in the past year. For both self-funded and insured coverages of the Internal Service Fund, the balance of claims that have been incurred but not reported as of August 31, 2020 is $618,851,172. Claim settlements did not exceed coverage in the last three fiscal years.
8. Termination Benefits(In accordance with GASB Statement 47)
Termination benefits in the form of healthcare continuation under Consolidated Omnibus Budget Reconciliation Act (COBRA) are provided for both voluntary and involuntary terminations under the Group Benefits Program. The System maintains the COBRA membership in the Group Benefits Program as part of a group without designating the entity where the members worked prior to being eligible for COBRA benefits. The Group Benefits Program has 1,199 COBRA participants.
The COBRA members are eligible to remain in the Group Benefits Program for 18 months, 29 months if disabled, and their dependents are eligible to remain in the program for 36 months. The premium rates are set annually, and are based on the experience of the group.
Notes to the Basic Financial Statements (Concluded)August 31, 2020
76 Financial Section � 2020 Comprehensive Annual Financial Report � Employees Retirement System of Texas

Schedule of Changes in Net Pension Liability and Related Ratios – Defined Benefit Plans (in 000’s)
2014 2015 2016 2017 2018 2019 2020 $ $ $ $ $ $ $
Employees Retirement Fund (Note A)
Total Pension LiabilityService Cost 1,139,451 1,231,203 1,146,791 1,457,263 1,445,557 1,346,986 1,827,864 Interest 2,324,180 2,373,849 2,522,626 2,510,128 2,559,723 2,694,083 2,516,723 Changes of Benefit Terms — (87,835) — — — — — Difference between Expected and
Actual Experience (252,967) (284,751) 133,557 115,632 91,881 (578,195) 510,657 Changes of Assumptions 1,199,067 (3,429,167) 5,301,965 2,219,672 (1,982,914) 8,469,458 6,366,987 Benefit Payments and Refunds (1,963,481) (2,049,291) (2,147,307) (2,288,825) (2,406,361) (2,540,262) (2,621,737) Net Change in Total Pension Liability 2,446,250 (2,245,992) 6,957,632 4,013,870 (292,114) 9,392,070 8,600,494 Total Pension Liability - Beginning 37,064,667 39,510,917 37,264,925 44,222,557 48,236,427 47,944,313 57,336,383 Total Pension Liability - Ending 39,510,917 37,264,925 44,222,557 48,236,427 47,944,313 57,336,383 65,936,877
Plan Fiduciary Net PositionContributions - Employer 482,239 500,395 686,763 700,078 697,189 712,648 735,856 Contributions - Member 430,595 462,159 674,678 685,461 683,933 694,788 713,985 Pension Plan Net Investment Income 3,252,417 56,941 1,273,414 2,832,628 2,430,297 758,467 1,791,061 Benefit Payments and Refunds (1,963,481) (2,049,291) (2,147,307) (2,288,825) (2,406,361) (2,540,262) (2,621,737) Pension Plan Administrative Expense (20,195) (21,840) (20,449) (23,095) (23,550) (27,752) (24,182) Net Change in Plan Fiduciary Net
Position 2,181,575 (1,051,636) 467,099 1,906,247 1,381,508 (402,111) 594,983 Plan Fiduciary Net Position -
Beginning 22,868,542 25,050,117 23,998,481 24,465,580 26,371,827 27,753,335 27,351,224 Plan Fiduciary Net Position - Ending 25,050,117 23,998,481 24,465,580 26,371,827 27,753,335 27,351,224 27,946,207
Net Pension Liability - Ending 14,460,800 13,266,444 19,756,977 21,864,600 20,190,978 29,985,159 37,990,670
Plan Fiduciary Net Position as a Percentage of Total Pension Liability 63.4 % 64.4 % 55.32 % 54.67 % 57.89 % 47.7 % 42.38 %
Covered Payroll (Note B) 5,955,461 6,150,195 6,742,143 6,859,707 6,811,926 6,947,625 7,158,435
Net Pension Liability as a Percentage of Covered Payroll 242.82 % 215.71 % 293.04 % 318.74 % 296.41 % 431.59 % 530.71 %
- to next page
Required Supplementary Information
Employees Retirement System of Texas � 2020 Comprehensive Annual Financial Report � Financial Section 77

Schedule of Changes in Net Pension Liability and Related Ratios – Defined Benefit Plans (Continued) (in 000’s)
2014 2015 2016 2017 2018 2019 2020$ $ $ $ $ $ $
Law Enforcement and Custodial Officer Supplemental Fund (Note A)
Total Pension LiabilityService Cost 54,528 57,459 71,429 99,390 79,309 71,926 96,690 Interest 88,025 87,224 88,410 82,236 91,171 96,085 86,012 Difference between Expected and Actual
Experience (76,585) (9,640) (21,657) (17,532) (21,651) (54,147) (1,841) Changes of Assumptions 68,228 148,114 375,371 (144,398) (87,015) 427,818 158,946 Benefit Payments and Refunds (57,147) (61,344) (64,542) (69,756) (75,633) (82,250) (86,706) Net Change in Total Pension Liability 77,049 221,813 449,011 (50,060) (13,819) 459,432 253,101 Total Pension Liability - Beginning 1,465,929 1,542,978 1,764,791 2,213,802 2,163,742 2,149,923 2,609,355 Total Pension Liability - Ending 1,542,978 1,764,791 2,213,802 2,163,742 2,149,923 2,609,355 2,862,456
Plan Fiduciary Net PositionContributions - Employer 27,758 26,728 27,497 26,583 26,110 25,864 22,293 Contributions - Member 8,180 8,376 9,539 9,583 9,275 9,098 8,950 Pension Plan Net Investment Income 111,741 1,918 44,831 99,341 84,938 26,250 61,097 Benefit Payments and Refunds (57,147) (61,344) (64,542) (69,756) (75,633) (82,250) (86,706) Pension Plan Administrative Expense (1,324) (1,411) (1,421) (1,811) (1,851) (2,167) (1,933) Net Change in Plan Fiduciary Net Position 89,208 (25,733) 15,904 63,940 42,839 (23,205) 3,701 Plan Fiduciary Net Position - Beginning 780,670 869,878 844,145 860,049 923,989 966,828 943,623 Plan Fiduciary Net Position - Ending 869,878 844,145 860,049 923,989 966,828 943,623 947,324
Net Pension Liability - Ending 673,100 920,646 1,353,753 1,239,753 1,183,095 1,665,732 1,915,132
Plan Fiduciary Net Position as a Percentage of Total Pension Liability 56.38 % 47.83 % 38.85 % 42.70 % 44.97 % 36.16 % 33.09 %
Covered Payroll (Note B) 1,496,013 1,506,028 1,725,880 1,746,349 1,689,590 1,682,633 1,662,147
Net Pension Liability as a Percentage of Covered Payroll 44.99 % 61.13 % 78.44 % 70.99 % 70.02 % 99.00 % 115.22 %
- to next page
Required Supplementary Information (Continued)
78 Financial Section � 2020 Comprehensive Annual Financial Report � Employees Retirement System of Texas

Schedule of Changes in Net Pension Liability and Related Ratios – Defined Benefit Plans (Concluded) (in 000’s)
2014 2015 2016 2017 2018 2019 2020 Judicial Retirement System Plan II (Note A)
Total Pension LiabilityService Cost 17,805 16,244 19,429 20,420 16,056 16,415 28,965 Interest 28,004 30,785 30,980 31,671 34,440 36,103 35,248 Changes of Benefit Terms — — — — — (1,019) — Difference between Expected and Actual
Experience (640) (10,066) (5,833) 5,091 (1,463) 26,592 (12,695) Changes of Assumptions (25,924) 35,653 23,397 (56,699) — 111,655 113,895 Benefit Payments and Refunds (16,420) (19,238) (21,155) (23,361) (24,865) (29,220) (32,041) Net Change in Total Pension Liability 2,825 53,378 46,818 (22,878) 24,168 160,526 133,372 Total Pension Liability - Beginning 383,461 386,286 439,664 486,482 463,604 487,772 648,298 Total Pension Liability - Ending 386,286 439,664 486,482 463,604 487,772 648,298 781,670
Plan Fiduciary Net PositionContributions - Employer 12,211 12,457 12,374 12,495 12,560 13,100 14,186 Contributions - Member 5,195 5,465 5,754 6,017 5,940 6,463 8,634 Pension Plan Net Investment Income 46,186 820 19,862 44,875 39,192 12,832 30,633 Benefit Payments and Refunds (16,420) (19,238) (21,155) (23,361) (24,866) (29,220) (32,041) Pension Plan Administrative Expense (267) (284) (226) (295) (296) (363) (273)
Net Change in Plan Fiduciary Net Position 46,905 (780) 16,609 39,731 32,530 2,812 21,139 Plan Fiduciary Net Position - Beginning 318,385 365,290 364,510 381,119 420,850 453,380 456,192 Plan Fiduciary Net Position - Ending 365,290 364,510 381,119 420,850 453,380 456,192 477,331
Net Pension Liability - Ending 20,996 75,154 105,363 42,754 34,392 192,106 304,339
Plan Fiduciary Net Position as a Percentage of Total Pension Liability 94.56 % 82.91 % 78.34 % 90.78 % 92.95 % 70.37 % 61.07 %
Covered Payroll (Note B) 77,441 77,501 78,261 78,190 78,772 79,711 88,579
Net Pension Liability as a Percentage of Covered Payroll 27.11 % 96.97 % 134.63 % 54.68 % 43.66 % 241.00 % 343.58 %
Note A: Schedule is intended to show information for 10 years. Additional years will be displayed as they become available.Note B: The covered payroll is the annual payroll for the fiscal year as reported by the System. The change in the Total Pension Liability due
to the change in the Single Discount Rate is included as an assumption change.
Required Supplementary Information (Continued)
Employees Retirement System of Texas � 2020 Comprehensive Annual Financial Report � Financial Section 79
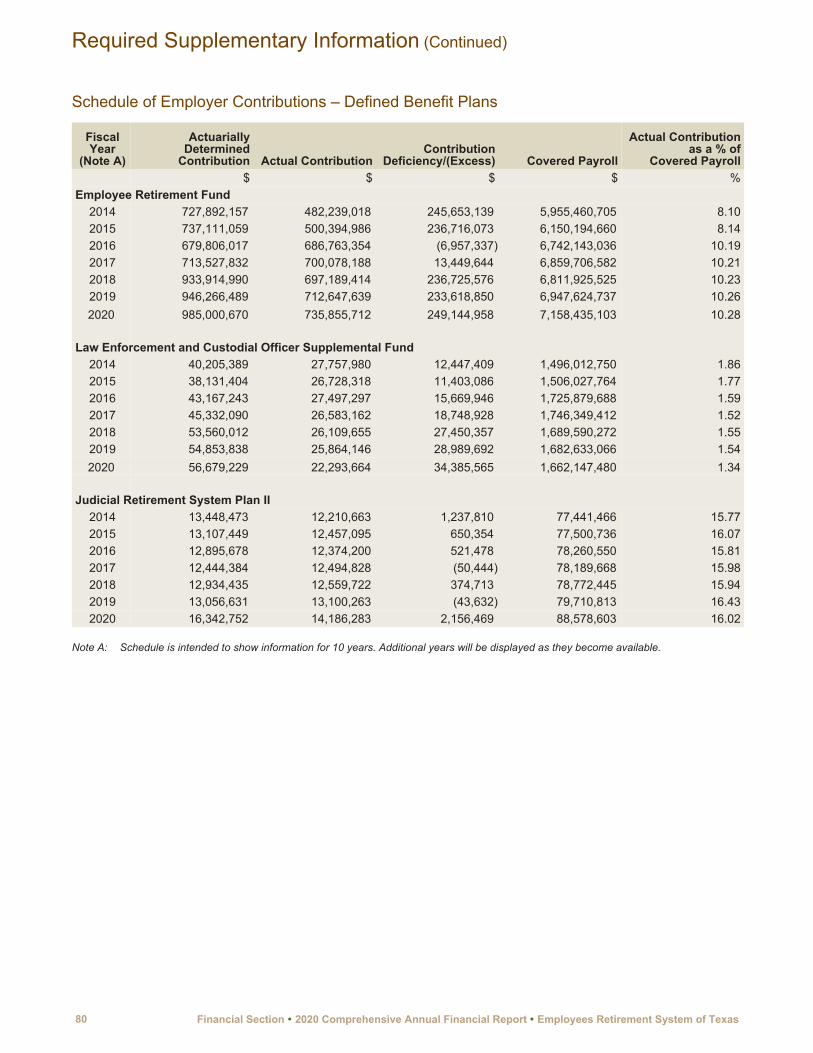
Schedule of Employer Contributions – Defined Benefit Plans
Fiscal Year
(Note A)
Actuarially Determined
Contribution Actual ContributionContribution
Deficiency/(Excess) Covered Payroll
Actual Contribution as a % of
Covered Payroll$ $ $ $ %
Employee Retirement Fund2014 727,892,157 482,239,018 245,653,139 5,955,460,705 8.102015 737,111,059 500,394,986 236,716,073 6,150,194,660 8.142016 679,806,017 686,763,354 (6,957,337) 6,742,143,036 10.192017 713,527,832 700,078,188 13,449,644 6,859,706,582 10.212018 933,914,990 697,189,414 236,725,576 6,811,925,525 10.232019 946,266,489 712,647,639 233,618,850 6,947,624,737 10.262020 985,000,670 735,855,712 249,144,958 7,158,435,103 10.28
Law Enforcement and Custodial Officer Supplemental Fund2014 40,205,389 27,757,980 12,447,409 1,496,012,750 1.862015 38,131,404 26,728,318 11,403,086 1,506,027,764 1.772016 43,167,243 27,497,297 15,669,946 1,725,879,688 1.592017 45,332,090 26,583,162 18,748,928 1,746,349,412 1.522018 53,560,012 26,109,655 27,450,357 1,689,590,272 1.552019 54,853,838 25,864,146 28,989,692 1,682,633,066 1.542020 56,679,229 22,293,664 34,385,565 1,662,147,480 1.34
Judicial Retirement System Plan II2014 13,448,473 12,210,663 1,237,810 77,441,466 15.772015 13,107,449 12,457,095 650,354 77,500,736 16.072016 12,895,678 12,374,200 521,478 78,260,550 15.812017 12,444,384 12,494,828 (50,444) 78,189,668 15.982018 12,934,435 12,559,722 374,713 78,772,445 15.942019 13,056,631 13,100,263 (43,632) 79,710,813 16.432020 16,342,752 14,186,283 2,156,469 88,578,603 16.02
Note A: Schedule is intended to show information for 10 years. Additional years will be displayed as they become available.
Required Supplementary Information (Continued)
80 Financial Section � 2020 Comprehensive Annual Financial Report � Employees Retirement System of Texas

Schedule of Changes in Net OPEB Liability and Related Ratios(in 000’s)
2017(Note A) 2018 2019 2020
State Retiree Health Plan (Note B)Total OPEB Liability
Service Cost 2,303,979 1,495,979 1,206,106 1,539,978 Interest 1,225,588 1,261,856 1,221,955 1,063,159 Difference between Expected and Actual Experience (501,666) (935,689) (89,009) (818,424) Changes of Assumptions (8,728,822) (5,924,045) 3,006,228 (2,520,337) Benefit Payments and Refunds (728,548) (662,723) (740,841) (737,408)
Net Change in Total OPEB Liability (6,429,469) (4,764,622) 4,604,439 (1,473,032) Total OPEB Liability - Beginning 41,212,263 34,782,794 30,018,172 34,622,611 Total OPEB Liability - Ending 34,782,794 30,018,172 34,622,611 33,149,579 Plan Fiduciary Net PositionContributions - Employer 892,205 307,029 401,285 748,369 Contributions - Non-employer Contributing Entity 45,035 16,585 20,183 37,737 Contributions - Member (Note C) 195,806 Contributions - Federal Revenues for Medicare Part D Subsidies 1,659 1,418 1,480 1,768 Contributions - Adjustments (2,071) Net Investment Income 4,517 10,907 3,323 1,336 Health Care Claims (995,816) (938,921) (1,038,588) (1,076,890) Payment from Members (Note C) 203,123 209,837 230,151 Total Benefit Payments (995,816) (735,798) (828,751) (846,739) Administrative Expense (5,629) (5,818) (6,008) (6,815) Other - Federal Revenues 71,462 73,075 87,909 109,331 Other Additions 356 3,249 85 24 Net Change in Plan Fiduciary Net Position 207,524 (329,353) (320,494) 45,011 Plan Fiduciary Net Position - Beginning 502,259 709,783 380,430 59,936 Plan Fiduciary Net Position - Ending 709,783 380,430 59,936 104,947
Net OPEB Liability - Ending 34,073,011 29,637,742 34,562,675 33,044,632
Plan Fiduciary Net Position as a Percentage of Total OPEB Liability 2.04 % 1.27 % 0.17 % 0.32 %
Covered Employee Payroll 11,745,310 12,047,167 12,320,028 12,655,247
Note A: The beginning balance and components of the total OPEB liability for fiscal year 2017 are recalculated based on the correct discount rate defined under GASB Statement No. 74.
Note B: Schedule is intended to show information for 10 years. Additional years will be displayed as they become available.Note C: In fiscal year 2017, payments from members were reported as contributions from members. Beginning from fiscal year 2018,
payments from members are reported as deductions from benefit payments.
Schedule of Contributions from Employers and Non-employer Contributing Entities– Other Postemployment Benefits Plan
Fiscal Year (Note A)
Actuarially Determined
Contribution Actual ContributionContribution
Deficiency/(Excess) Covered Payroll
Actual Contribution as a % of Covered
Payroll$ $ $ $ %
State Retiree Health Plan2017 2,714,958,093 936,827,489 1,778,130,604 11,745,310,057 7.982018 2,332,643,695 325,031,537 2,007,612,158 12,047,166,658 2.702019 2,687,207,910 422,947,418 2,264,260,492 12,320,028,164 3.432020 2,590,236,378 787,874,304 1,802,362,074 12,655,246,687 6.23
Note A: Schedule is intended to show information for 10 years. Additional years will be displayed as they become available.
Required Supplementary Information (Continued)
Employees Retirement System of Texas � 2020 Comprehensive Annual Financial Report � Financial Section 81

Schedule of Investment Returns– Annual Money-Weighted Rate of Return, Net of Investment Expense (Note A)
2014 2015 2016 2017 2018 2019 2020%
Defined Benefit Plans:Employees Retirement Fund 14.58 0.23 5.40 11.84 9.42 2.80 6.70Law Enforcement and Custodial Officer Supplemental Fund 14.55 0.22 5.39 11.80 9.40 2.79 6.64Judicial Retirement System Plan II 14.55 0.23 5.47 11.88 9.40 2.86 6.78Overall 14.58 0.23 5.40 11.84 9.42 2.80 6.70
Other Post-Employment Benefit Plan:State Retiree Health Plan N/A N/A N/A 1.03 1.84 2.32 1.59
Note A: Schedule intended to show information for 10 years. Additional years will be displayed as they become available.
Notes to The Required Supplementary Information
Defined Benefit PlansThe assumptions and methods used for this actuarial valuation were recommended by the actuary and adopted by the Board of Trustees. Additional information on the actuarial assumptions as of the latest actuarial valuation is summarized in Figure 1.The total pension liability reported in the Schedule of Changes in Net Pension Liability and Related Ratios was provided by the System’s actuary. The net pension liability is measured as the total pension liability less the amount of fiduciary net position of the pension plans.
The actuarially determined contributions for the
Employees Retirement Fund, the Law Enforcement and Custodial Supplemental Fund, and Judicial Retirement Plan II are calculated as of August 31, 2019, based on the actuarial assumptions described in Figure 1. These contributions are reported in the Schedule of Employer’s Contribution – Defined Benefit Plans.
Other Postemployment Benefit PlanThe assumptions and methods used for this actuarial valuation are the same as those used for defined benefit plans where appropriate. Additional information on the actuarial assumptions as of
Figure 1Summary of Actuarial Assumptions - Defined Benefit Plans
Employees Retirement Fund
Law Enforcement and Custodial Officer Supplemental
FundJudicial Retirement System
Plan II(In accordance with GASB Statement No. 67)
Valuation Date August 31, 2019 August 31, 2019 August 31, 2019Actuarial Cost Method Entry Age Normal Entry Age Normal Entry Age NormalAmortization Method Level Percentage of Payroll,
OpenLevel Percentage of Payroll,
OpenLevel Percentage of Payroll,
Open
Remaining Amortization Period 31 years 31 years 31 years
Asset Valuation Method Marked to Market. Future gains and losses each recognized over
closed five-year period, with allowance of direct offsetting of
deferrals by subsequent gains or losses.
Marked to Market. Future gains and losses each recognized over
closed five-year period, with allowance of direct offsetting of
deferrals by subsequent gains or losses.
Marked to Market. Future gains and losses each recognized over
closed five-year period, with allowance of direct offsetting of
deferrals by subsequent gains or losses.
Actuarial Assumptions:Investment Rate of Return 7.50% 7.50% 7.50%Projected Salary Increases 0.0% – 9.5% 4.5% – 9.5% 3.00%Inflation Rate 2.50% 2.50% 2.50%Cost-of-living Adjustments None – Employee
3.5% – ElectedNone None
Required Supplementary Information (Continued)
82 Financial Section � 2020 Comprehensive Annual Financial Report � Employees Retirement System of Texas

Notes to The Required Supplementary Information (Concluded)
the latest actuarial valuation is summarized in Figure 2. The following assumptions have been changed since the previous Other Postemployment Benefits (OPEB) valuation:
• Demographic assumptions (including rates of preretirement and post-disability mortality for all State Agency members; assumed rates of termination and retirement for certain members who are Certified Peace Officers/Custodial Officers (CPO/CO); and assumed salary, aggregate payroll increases and the assumed rate of general inflation) have been updated to reflect assumptions recently adopted by the System’s Board of Trustees.
• Assumed Per Capita Health Benefit Costs and assumed Health Benefit Cost and Retiree Contribution trends have been updated to reflect recent experience and its effects on our short term expectations.
• The percentage of current retirees and their spouses not yet eligible to participate in the HealthSelect Medicare Advantage Plan and future retirees and their spouses who will elect to participate in the plan at the earliest date at which
coverage can commence. The percentage of future female retirees assumed to be married and electing coverage for their spouse.
• The proportion of future retirees assumed to cover dependent children have been updated to reflect recent plan experience and expected trends. Moreover, the PCORI fees payable under the ACA have been updated to reflect IRS Notice 2020-44.
• The discount rate was changed from 2.97% as of August 31, 2019 to 2.20% as of August 31, 2020 as a result of requirements by GASB No. 74 to utilize the yield or index rate for 20-year, tax exempt general obligation municipal bonds rated AA/Aa (or equivalent) or higher in effect on the measurement date.
The valuation reflects the minor benefit changes that will become effective January 1, 2021, since these changes were communicated to plan members in advance of the preparation of this report. These changes, which are not expected to have a significant impact on plan costs for fiscal year 2021, are provided for in the fiscal year 2021 Assumed Per Capita Health Benefit Costs.
Figure 2Summary of Actuarial Assumptions - Other Postemployment Benefit Plan
State Retiree Health Plan(In accordance with GASB Statement No. 74)
Valuation Date August 31, 2020Actuarial Cost Method Entry AgeAmortization Method Level Percent of Payroll, OpenAmortization Period 30 YearsAsset Valuation Method Not applicableActuarial Assumptions:
Discount Rate 2.20%Projected Salary Increases 2.30% to 9.05%, including inflationInflation Rate 2.30%Healthcare Cost and Trend Rate HealthSelect
8.80% for FY2022, 5.25% for FY2023, 5.00% for FY2024, 4.75% for FY2025, 4.60% for FY2026, decreasing 10 basis points per year to an ultimate rate of 4.30% for FY2029 and
later years
HealthSelect Medicare Advantage-53.30% for FY2022, 0.00% for FY2023, 66.67% for FY2024, 24.00% for FY2025, 4.60% for FY2026, decreasing 10 basis points per year to an ultimate rate of 4.30% for FY2029
and later years
Pharmacy10.00% for FY2022 and FY2023, decreasing 100 basis points per year to 5.00% for
FY2028 and 4.30% for FY2029 and later years
Required Supplementary Information (Concluded)
Employees Retirement System of Texas � 2020 Comprehensive Annual Financial Report � Financial Section 83

84 Financial Section � 2020 Comprehensive Annual Financial Report � Employees Retirement System of Texas

Employee SavingsAccount
StateAccumulation
Account
RetirementAnnuity Reserve Account
InterestAccount
ExpenseAccount Totals
Operating Revenues $ $ $ $ $ $ Contributions to Retirement System: Member Contributions 706,040,644 706,040,644 Employer Contributions 735,403,354 735,403,354 Service Contributions from Teacher Retirement System 107,757,217 107,757,217 Membership Fees 499,858 499,858 Penalty Interest 7,944,392 7,944,392 Investment Income: Net Appreciation in Fair Value of
Investments 1,207,108,820 1,207,108,820 Interest and Dividends 620,298,444 620,298,444 Class Action Settlements 1,861,296 1,861,296 Rental Income 41,418 41,418 Warrants Voided By Statute of
Limitations 230,961 230,961 Recycling Revenue 589 589 Miscellaneous 2,361 2,361
Total Operating Revenues 706,040,644 743,578,707 107,757,217 1,829,268,560 544,226 3,387,189,354 Operating Expenses Retirement System Benefits Paid: Retirement Benefits 2,574,767,697 2,574,767,697 Death Benefits: Active Members 2,915,749 2,915,749 Retirees 1,877,113 1,877,113 Member Contributions Withdrawn 121,569,462 121,569,462 Service Contributions to Teacher Retirement System 27,517,707 27,517,707 Administrative Expenses 61,745,752 61,745,752 Depreciation Expense 688,131 688,131 Total Operating Expenses 121,569,462 2,915,749 2,604,162,517 — 62,433,883 2,791,081,611 Income (Loss) Before Operating
Transfers 584,471,182 740,662,958 (2,496,405,300) 1,829,268,560 (61,889,657) 596,107,743 Operating Transfers In (Out) Distribution of Interest 117,282,921 (55,024,087) 1,703,994,709 (1,766,253,543) Establishment of Benefit Reserves (463,956,777) (2,247,226,439) 2,711,183,216 Distribution of Interest for
Administrative Expenses (63,015,017) 63,015,017 Member Accounts-Escheated (3,228,787) 3,228,787 Membership Fees Transferred Out (47,500) (47,500) Excess Benefit Arrangement
Transfers (1,077,860) (1,077,860) Net Operating Transfers (349,902,643) (2,299,021,739) 4,415,177,925 (1,829,268,560) 61,889,657 (1,125,360) Net Income (Loss) 234,568,539 (1,558,358,781) 1,918,772,625 — — 594,982,383 Account Balances - Beginning 6,044,422,496 (2,379,205,893) 23,686,007,554 — — 27,351,224,157 Account Balances - Ending 6,278,991,035 (3,937,564,674) 25,604,780,179 — — 27,946,206,540
Note: As required by Texas Government Code Chapter 815.322, the System moved funds from the State Accumulation Account to the Retirement Annuity Reserve Account based on the actuarial determined present value of future benefits to be paid to retirees. Fund balance is sufficient to pay the future annuities to the current population of retirees.
Other Supplementary Information – Schedule 1Revenues, Expenses and Changes in Statutory Account Balances(Non-GAAP Presentation) - Employees Retirement FundYear Ended August 31, 2020
Employees Retirement System of Texas � 2020 Comprehensive Annual Financial Report � Financial Section 85
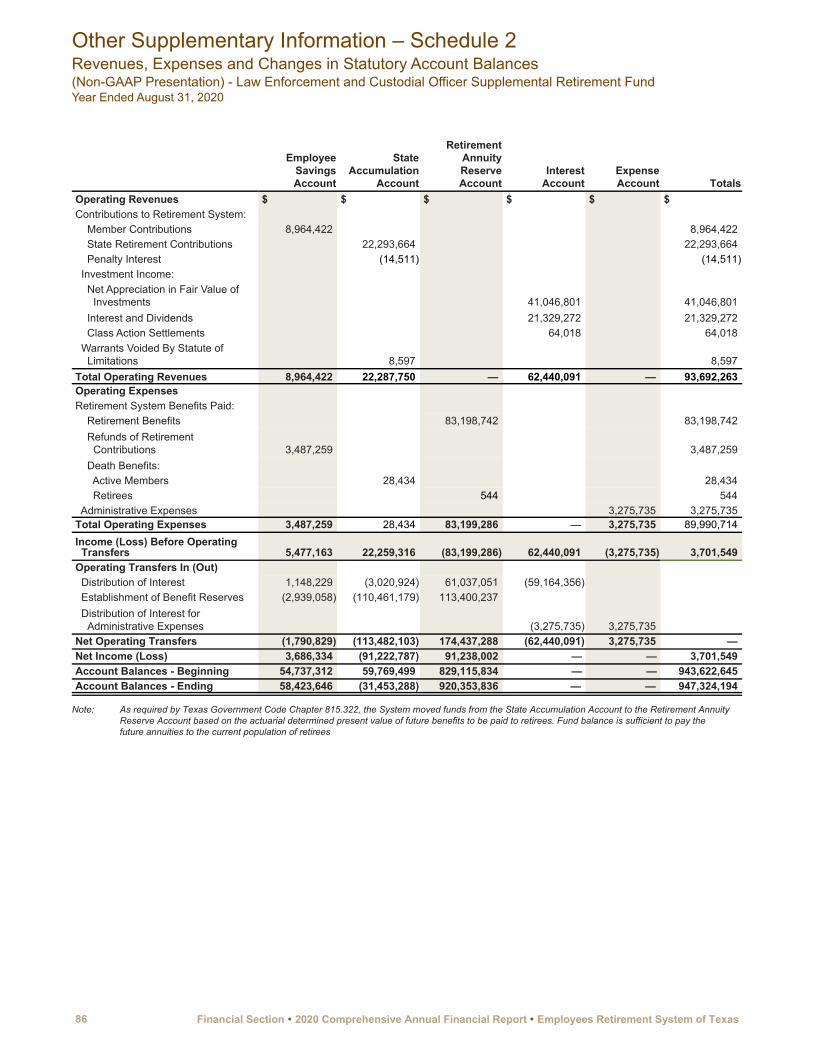
Employee SavingsAccount
StateAccumulation
Account
RetirementAnnuity Reserve Account
InterestAccount
ExpenseAccount Totals
Operating Revenues $ $ $ $ $ $Contributions to Retirement System: Member Contributions 8,964,422 8,964,422 State Retirement Contributions 22,293,664 22,293,664 Penalty Interest (14,511) (14,511) Investment Income: Net Appreciation in Fair Value of
Investments 41,046,801 41,046,801 Interest and Dividends 21,329,272 21,329,272 Class Action Settlements 64,018 64,018 Warrants Voided By Statute of
Limitations 8,597 8,597 Total Operating Revenues 8,964,422 22,287,750 — 62,440,091 — 93,692,263 Operating ExpensesRetirement System Benefits Paid: Retirement Benefits 83,198,742 83,198,742 Refunds of Retirement
Contributions 3,487,259 3,487,259 Death Benefits: Active Members 28,434 28,434 Retirees 544 544 Administrative Expenses 3,275,735 3,275,735 Total Operating Expenses 3,487,259 28,434 83,199,286 — 3,275,735 89,990,714 Income (Loss) Before Operating
Transfers 5,477,163 22,259,316 (83,199,286) 62,440,091 (3,275,735) 3,701,549 Operating Transfers In (Out) Distribution of Interest 1,148,229 (3,020,924) 61,037,051 (59,164,356) Establishment of Benefit Reserves (2,939,058) (110,461,179) 113,400,237 Distribution of Interest for
Administrative Expenses (3,275,735) 3,275,735 Net Operating Transfers (1,790,829) (113,482,103) 174,437,288 (62,440,091) 3,275,735 — Net Income (Loss) 3,686,334 (91,222,787) 91,238,002 — — 3,701,549 Account Balances - Beginning 54,737,312 59,769,499 829,115,834 — — 943,622,645 Account Balances - Ending 58,423,646 (31,453,288) 920,353,836 — — 947,324,194
Note: As required by Texas Government Code Chapter 815.322, the System moved funds from the State Accumulation Account to the Retirement Annuity Reserve Account based on the actuarial determined present value of future benefits to be paid to retirees. Fund balance is sufficient to pay the future annuities to the current population of retirees
Other Supplementary Information – Schedule 2Revenues, Expenses and Changes in Statutory Account Balances(Non-GAAP Presentation) - Law Enforcement and Custodial Officer Supplemental Retirement FundYear Ended August 31, 2020
86 Financial Section � 2020 Comprehensive Annual Financial Report � Employees Retirement System of Texas

Employee SavingsAccount
StateAccumulation
Account
RetirementAnnuity Reserve Account
InterestAccount
ExpenseAccount Totals
Operating Revenues $ $ $ $ $ $Contributions to Retirement System: Member Contributions 8,575,003 8,575,003 Employer Contributions 14,186,283 14,186,283 Penalty Interest 59,068 59,068 Investment Income: Net Appreciation in Fair Value of
Investments 20,674,031 20,674,031 Interest and Dividends 10,547,295 10,547,295 Class Action Settlements 31,321 31,321 Total Operating Revenues 8,575,003 14,245,351 — 31,252,647 — 54,073,001 Operating ExpensesRetirement System Benefits Paid: Retirement Benefits 31,902,116 31,902,116 Death Benefits: Active Members 10,622 10,622 Member Contributions Withdrawn 128,056 128,056 Administrative Expenses 893,219 893,219 Total Operating Expenses 128,056 10,622 31,902,116 — 893,219 32,934,013 Income (Loss) Before Operating
Transfers 8,446,947 14,234,729 (31,902,116) 31,252,647 (893,219) 21,138,988 Operating Transfers In (Out) Distribution of Interest 1,278,390 8,191,201 20,889,837 (30,359,428) Establishment of Benefit Reserves (659,035) (26,989,422) 27,648,457 Distribution of Interest for
Administrative Expenses (893,219) 893,219 Net Operating Transfers 619,355 (18,798,221) 48,538,294 (31,252,647) 893,219 — Net Income (Loss) 9,066,302 (4,563,492) 16,636,178 — — 21,138,988 Account Balances - Beginning 70,242,530 77,881,171 308,068,548 — — 456,192,249 Account Balances - Ending 79,308,832 73,317,679 324,704,726 — — 477,331,237
Other Supplementary Information – Schedule 3Revenues, Expenses and Changes in Statutory Account Balances(Non-GAAP Presentation) - Judicial Retirement System Plan Two FundYear Ended August 31, 2020
Employees Retirement System of Texas � 2020 Comprehensive Annual Financial Report � Financial Section 87

Administrative Expenses (Note A)Non-Investment Investment
Personnel Services $ $ Salaries and Wages 23,868,920 15,192,716 Payroll Related Costs: Retirement Contributions 2,176,166 1,093,746 Retirement Membership Fees 19,383 262 Employees Insurance Contributions 2,600,628 741,627 Retirees Insurance Contributions 1,304,029 307,013 Social Security Contributions 1,691,708 825,185 Unemployment Compensation 26,150 6,158 Total Payroll Related Costs 7,818,064 2,973,991 Total Personnel Services 31,686,984 18,166,707 Professional Fees and Services Actuarial Services 1,060,218 Audit Services 651,872 Investment Consulting Fees 7 2,948,521 Investment Advisors 10,073,706 Group Benefits Advisors 997 Medical Board Member Fees 51,100 Architectural Services 6,000 Legal Services 178,762 921,812 Computer Programming Services 4,775,936 560,785 Other Professional Services 1,641,441 101,917 Total Professional Fees and Services 8,366,333 14,606,741
Other Services and Charges Travel 100,525 317,581 Materials and Supplies: Postage 666,293 General Office and Other Supplies 142,008 298 Subscriptions 52,979 33,839 Furniture and Equipment 213,950 5,039 Computer Software 813,785 Total Materials and Supplies 1,889,015 39,176 Communications and Utilities: Electricity, Gas and Water 194,363 Telephone and Telegraph 575,747 19 Electronic Communication Services 224,759 6,181,810 Total Communications and Utilities 994,869 6,181,829 Repairs and Maintenance: Land and Building 308,266 Furniture and Equipment 13,893 Computer Software and Equipment 1,488,764 Total Repairs and Maintenance 1,810,923 — Rentals and Leases: Computer Software and Equipment 188,873 Office Equipment 233,335 Space 127,102 Total Rentals and Leases 549,310 — Printing and Reproduction Services 122,595 Depreciation 688,131
- to next page
Other Supplementary Information – Schedule 4Administrative and Investment Expenses/ExpendituresStatutory Administrative Funds and AccountsYear Ended August 31, 2020
88 Financial Section � 2020 Comprehensive Annual Financial Report � Employees Retirement System of Texas
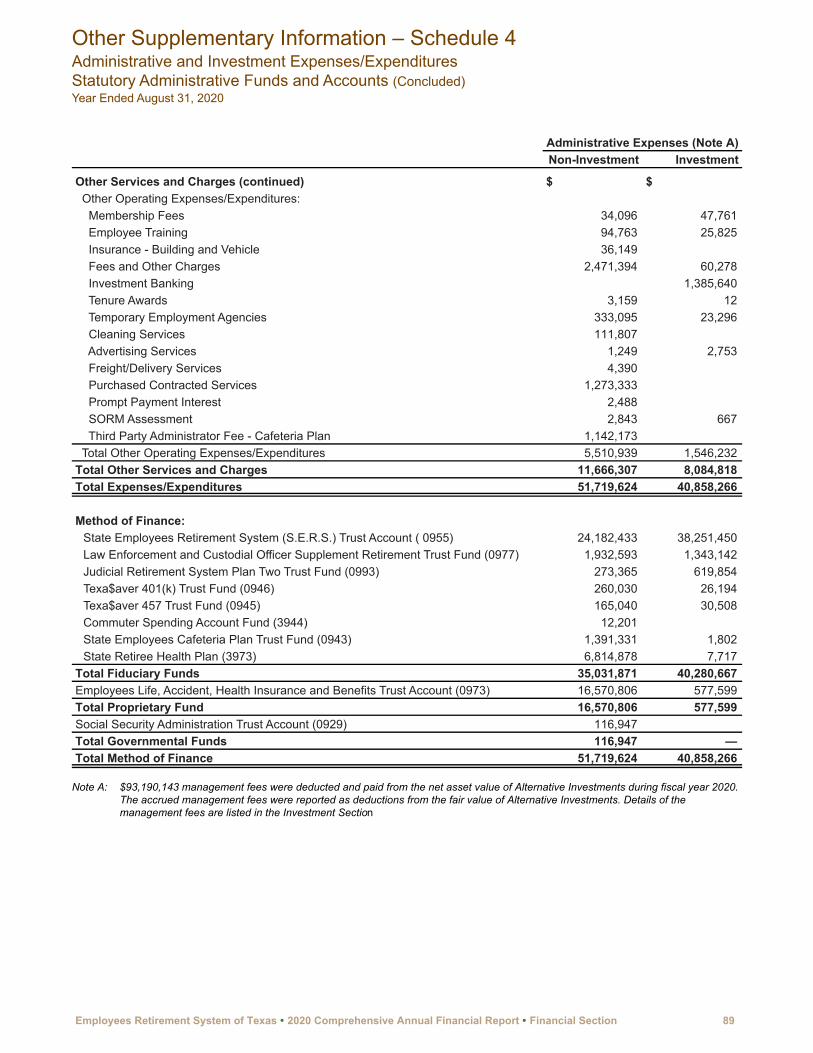
Administrative Expenses (Note A)Non-Investment Investment
Other Services and Charges (continued) $ $ Other Operating Expenses/Expenditures: Membership Fees 34,096 47,761 Employee Training 94,763 25,825 Insurance - Building and Vehicle 36,149 Fees and Other Charges 2,471,394 60,278 Investment Banking 1,385,640 Tenure Awards 3,159 12 Temporary Employment Agencies 333,095 23,296 Cleaning Services 111,807 Advertising Services 1,249 2,753 Freight/Delivery Services 4,390 Purchased Contracted Services 1,273,333 Prompt Payment Interest 2,488 SORM Assessment 2,843 667 Third Party Administrator Fee - Cafeteria Plan 1,142,173 Total Other Operating Expenses/Expenditures 5,510,939 1,546,232 Total Other Services and Charges 11,666,307 8,084,818 Total Expenses/Expenditures 51,719,624 40,858,266
Method of Finance:State Employees Retirement System (S.E.R.S.) Trust Account ( 0955) 24,182,433 38,251,450 Law Enforcement and Custodial Officer Supplement Retirement Trust Fund (0977) 1,932,593 1,343,142 Judicial Retirement System Plan Two Trust Fund (0993) 273,365 619,854 Texa$aver 401(k) Trust Fund (0946) 260,030 26,194 Texa$aver 457 Trust Fund (0945) 165,040 30,508 Commuter Spending Account Fund (3944) 12,201 State Employees Cafeteria Plan Trust Fund (0943) 1,391,331 1,802 State Retiree Health Plan (3973) 6,814,878 7,717
Total Fiduciary Funds 35,031,871 40,280,667 Employees Life, Accident, Health Insurance and Benefits Trust Account (0973) 16,570,806 577,599 Total Proprietary Fund 16,570,806 577,599 Social Security Administration Trust Account (0929) 116,947 Total Governmental Funds 116,947 — Total Method of Finance 51,719,624 40,858,266
Note A: $93,190,143 management fees were deducted and paid from the net asset value of Alternative Investments during fiscal year 2020. The accrued management fees were reported as deductions from the fair value of Alternative Investments. Details of the management fees are listed in the Investment Section
Other Supplementary Information – Schedule 4Administrative and Investment Expenses/ExpendituresStatutory Administrative Funds and Accounts (Concluded)Year Ended August 31, 2020
Employees Retirement System of Texas � 2020 Comprehensive Annual Financial Report � Financial Section 89

Nature of Service Totals$
Actuarial Services - Retirement 347,942 Actuarial Services - Insurance 712,276 Audit Fees - Financial 282,999 Audit Fees - Insurance Carrier 227,721 Audit Fees - Other 141,152 Investment Consulting Fees 2,948,528 Investment Advisors 10,073,706 Group Benefits Advisors 997 Medical Board 51,100 Architectural Services 6,000 Legal Services 1,100,574 Computer Programming Services 5,336,721 Educational Services 95,497 Other Professional Services 1,534,923 Other Consulting Services 112,938 Total Professional and Consulting Fees 22,973,074
Method of Finance: State Employees Retirement System (S.E.R.S.) Trust Account ( 0955) 19,703,874 Law Enforcement and Custodial Officer Supplement Retirement Trust Fund (0977) 734,080 Judicial Retirement System Plan Two Trust Fund (0993) 306,995 Texa$aver 401(k) Trust Fund (0946) 7,079 Texa$aver 457 Trust Fund (0945) 3,245 Commuter Spending Account Fund (3944) 370 State Employees Cafeteria Plan Trust Fund (0943) 16,835 State Retiree Health Plan (3973) 708,952 Total Fiduciary Funds 21,481,430 Employees Life, Accident, Health Insurance and Benefits Trust Account (0973) 1,486,765 Total Proprietary Fund 1,486,765 Social Security Administration Fund (0929) 4,879 Total Governmental Funds 4,879 Total Method of Finance 22,973,074
Other Supplementary Information – Schedule 5Professional and Consulting FeesYear Ended August 31, 2020
90 Financial Section � 2020 Comprehensive Annual Financial Report � Employees Retirement System of Texas
INVESTMENT SECTION
Report on Investment Activity
Outline of Investment Policies
Time-weighted Rates of Return and Asset Allocations
Broker Commissions
Fees for Alternative Investments
Investment Advisory and Service Fees
List of Largest Assets Held
Investment Summary at Fair Value
91

92 Investment Section � 2020 Comprehensive Annual Financial Report � Employees Retirement System of Texas
Overview
The System's investment portfolio closed the fiscal year with a fair value of $29.1 billion and received a net return of 6.82% for the year, compared to the global policy benchmark return of 8.17%. The fiscal year was extremely volatile with a 35% decline in the popular Standard & Poor’s 500 Index and other investments assets, due to the economic fallout from the COVID-19 pandemic. Over the longer term, the fund returned 7.30% for the 5 years ended August 31, 2020, compared to the policy benchmark of 7.47%. For the 10 years ended August 31, 2020, the fund returned 8.12%, outperforming the policy benchmark of 8.03%. The fiscal year-end asset allocation stood at 23.31% fixed-income, 39.98% global public equity, 10.96% global real estate, 15.42% in private equity, infrastructure of 3.70%, 4.46% in absolute return funds, 0.45% other investments, and 1.72% in cash.
During Fiscal Year 2020, the Investments Division ("Division") continued to work with the Executive Director, Board of Trustees, Investment Advisory Committee and other divisions within the System to build a premier and competitive investment organization in the best interest of the Trust and its beneficiaries. The Division successfully sustained operations and investment management during the COVID-19 global pandemic, transitioned to a new consultant for the private equity asset class, and completed significant deals associated with the ERS Hedge Fund Emerging Manager Program.
The Division co-hosted the 5th Biennial Real Estate Emerging Manager Program with over 200 investment professionals in attendance. In efforts to equip stakeholders for informed decision making, the staff also broadened in-house educational conferences and promoted strategic outreach, including investment primers to Board and Investment Advisory Committee (IAC), and external stakeholders.
The Division remains committed to enhancing the agency’s performance and accountability. The Division’s leaders completed the evaluation of the appropriateness, adequacy and effectiveness of the system’s practices and performance, as set out in SB 322 passed by the 86th Legislature. The Division also held over 28 asset class investment committee meetings.
As of June 30, 2020 the following had occurred:
• Held 3,481 meetings with external companies, brokers, managers and advisors to provide due
diligence of investable ideas for the trust.• HYLB, a high yield bond ETF created by the
Agency, grew to a market capitalization of $4.6 billion.
• Committed $175 million to two Fixed Income funds.
• Committed $480 million to hedge fund investments associated with Absolute Return Portfolio and closed on 4 new funds and 1 existing fund.
• Committed $650 million to Real Estate and closed 12 funds.
• Committed $534.7 million to Private Equity and closed on 9 funds and 1 co-investment.
• Committed $339 million to Private Infrastructure and closed on 3 funds and 3 co-investments.
In Fiscal Year 2021, the Division will continue its goal to expand existing core competencies for innovative investment management by exploring new investment alternatives, enhance the investment manager monitoring process through implementing a manager scorecard, continue enhancing the System's Emerging Manager Program, and co-host the 6th Biennial Real Estate Emerging Manager Conference.
In addition the Division will strive to continue to have educational in-house conferences and promote strategic outreach to the Board, Investment Advisory Committee (IAC), and external stakeholders.
The Division will continue to review and refine the asset class procedures, guidelines, and tactical plans in efforts to continue to enhance the performance and accountability in Fiscal Year 2021.
Domestic Equity
The fiscal year ending August 31, 2020 was a remarkable year for domestic public equities. In general, returns were strong. Positive returns, however, came with volatility and divergence on historical levels. Volatility picked up in February as the market quickly shifted its focus from a trade deal with China to the emerging COVID-19 pandemic. The pandemic then accelerated some fundamental trends and drove a sharp divergence between growth and technology and everything else.
The fiscal year started off strong, as optimism around a China-U.S. trade pact sent the S&P 500 up about 25% from early September to late February. The S&P 500 then tumbled by about 30% through late March. At that point, COVID-19 daily infections began to decline in early-hit areas and governments began to
Report on Investment ActivityFiscal Year 2020
Employees Retirement System of Texas � 2020 Comprehensive Annual Financial Report � Investment Section 93

inject tremendous amounts of money into economies. The result was a run-up of about 60% from the low through August 31.
The technology-heavy NASDAQ Index was up 47.9% in Fiscal Year 2020, leading the major U.S. benchmarks. The S&P 500 Growth was up 35.7% with the full S&P 500 up 19.6%. The less tech-weighted Dow Jones Industrial Average was up just 7.7%, S&P 500 Value up just 0.6% and the S&P Small Cap 600 index down 2.2%.
In terms of the S&P 500 sector performance, Information Technology led the way at 55.9%, with Apple Inc. and Microsoft Corp. driving the sector. Consumer Discretionary followed at 33.3%, but it is important to note that Amazon.com Inc. accounts for 41% of that sector by market weight. Communication Services was up 25.5%, with half of that sector weighted in Google parent Alphabet Inc. and Facebook Inc. In general, markets gravitated to sectors and firms where business was helped, or at least not disrupted, by COVID-19.
The worst-performing sector was Energy, down 36.9%. The oil & gas industry faced a perfect storm of COVID-19-related demand weakness, and posturing between OPEC and Russia sent West Texas Intermediate Crude as low as negative $37 in April. Real Estate was down 7.4% due to exposure to pandemic-affected areas like hospitality and restaurants.
In terms of the S&P 500 stocks, semiconductor company NVIDIA Corp. was the best performer, up 219%. In terms of market impact, Apple and Amazon Inc. were up 147% and 94%, respectively and are the highest- and third-highest-weighted names. The worst-returning stocks included a variety of oil & gas companies and cruise lines.
International Equity
International stock markets, as measured by the Morgan Stanley Capital International All Country World Index (MSCI ACWI) ex U.S. Index, rose 8.9% in Fiscal Year 2020 as investors grappled with the sizable shock of the COVID-19 virus and subsequent rebound. Returns were positive across all but two sectors, with Information Technology (38.7%) and Health Care (24.6%) leading the index while Financials (-6.4%) and Energy (-20.6%) were the largest detractors of performance. Morgan Stanley Capital International Europe, Australasia and Far East Index (MSCI EAFE) lagged
the broader international index in Fiscal Year 2020 (6.7%). Europe and Developed Asia endured a fiscal year comprising waves of volatility related not just to COVID-19, but also to trade wars, Brexit and the Hong Kong protests. Pre-COVID-19, the index enjoyed strong gains as a cyclical upswing unfolded in Asia. However, impacts from COVID-19 led to a dramatic drop from January to March, followed by an equally dramatic recovery supported by various fiscal and monetary recovery packages from governments around the globe.
Both European and Japanese markets finished the fiscal year ahead of the MSCI EAFE index while the U.K. suffered a loss that weighed on the index. Information Technology and Health Care were the top-performing sectors, and Materials benefited from demand for gold and the supply chain recovery. Energy declined on plummeting demand from COVID-19 lockdowns and European environmental, social, governance (ESG) mandates while Real Estate suffered from concerns around delayed rent payments, challenging contract rates and an escalation of China-Hong Kong tensions.
Morgan Stanley Capital International Emerging Markets (MSCI EM) had a strong Fiscal Year 2020, rising more than the broader international index (14.9%). The fiscal year went through several distinct stages as the region absorbed the many tumultuous events, while each country and sector followed a similar pattern to global equities. MSCI EM equities endured a dramatic drop in February and March, followed by an equally dramatic recovery the remainder of the fiscal year. Health Care, Discretionary and Information Technology were the big winners among the sectors. Laggards were focused either on sectors exposed to the drop in oil prices, such as Utilities and Energy, or those subject to default and credit risk concerns, such as Financials and Real Estate. Country performance followed a similar pattern, as tech heavy China, Taiwan and South Korea ended the fiscal year in positive territory, while countries that lagged tended to have exposure to tourism (Greece, Mexico), commodities (Columbia, Chile, Indonesia) or both (Brazil, Egypt, Turkey).
Real Estate
Following four years of consecutive positive returns, the global real estate equity markets as measured by the Financial Times Stock Exchange European Public Real Estate Association Nareit (FTSE EPRA/NAREIT) Developed Index was down -12.8% for the fiscal year ending August 31, 2020, underperforming
Report on Investment Activity (Continued)Fiscal Year 2020
94 Investment Section � 2020 Comprehensive Annual Financial Report � Employees Retirement System of Texas
the broader equities market MSCI World Index return of +17.4% for the same period.
The real estate equity market performance was relatively stable for the first half of the fiscal year until mid-February when COVID-19 became a global pandemic. Global countries adopted social distance rules and the real estate sector was significantly impacted as investors were concerned about rent collections. The sector declined over 40% within one month from February to March. By the end of the fiscal year, the Real Estate sector was up 40% from the trough in March, but still down 20% from the peak in February. Hotel and Retail sectors were hit the most. The Office sector was also negatively impacted as investors questioned the future demand of office space, especially for urban areas.
The Industrial sector was the best-performing sector, up over 20% during the same period. During the fiscal year, the political tension between the U.S. and China continued to escalate and the upcoming U.S. presidential election continued to dominate the headlines.
Global government bond yields in general dropped over the period. The U.S. 10-year government bond yield dropped 70 basis points to 0.7% over the period. While the market was concerned about recession risk, global governments and central banks proactively provided liquidity support and fiscal stimulus, which supported the equity markets.
In Asia, all markets posted negative returns, with Singapore being the relative better performer, down 1.2% (local -5.4%), supported by the relatively larger exposure of the Industrial sector which was up 30% for the period. Australia was down 23.5% (local -30.3%). Not surprising, Retail was the worst performing subsector, down 30.2%, and Self Storage was the best performer. The Australian Central Bank cut interest rates twice during the period from 1.00% to 0.25%. Hong Kong was down 12.7%. Office was the worst performer, down 21.2%, as investors were concerned about the economic cycle and China’s continuing intrusion into Hong Kong politics and governing impacting multinationals’ presence there. Performance among the retail names was mixed. Mainland China-focused retail names outperformed the Hong Kong-focused retail names. China imposed a National Security Law in Hong Kong effective July 1, 2020, which has had a chilling effect on its future. The U.S. announced sanction measures against some of China’s government officials. Japan was down 14.2% (local -14.3%).
Similar to other markets, Industrial was the best-performing subsector, while Retail and Hotels lagged. The Olympic Games, previously scheduled for July 2020 in Tokyo, were postponed until 2021. In the European market, the U.K. was up 3.1%, mainly helped by stronger local currency against the USD. While Brexit continued to be an overhang, the escalation of friction between the U.S. and China overshadowed it, as well as the political tension in the Middle East and COVID-19. Logistics and Residential subsectors were up 34.7% and 44.2%, respectively, while Retail was down 58.9%. Finland was the best performer, up 32.5%, driven by one name in the index, which was up 64.0% as investors favored the residential rental business. France was the worst performer, down 39.5%, mainly affected by the concentration of retail exposure names.
Following a strong 2019 fiscal year (+11.7%), the U.S. as measured by the FTSE EPRA / NAREIT United States Index posted underwhelming returns (-16.0%) for the fiscal year ending August 31, 2020. Notably, U.S. REITs significantly underperformed the broader equities market (MSCI World Index), which finished +17.4% in Fiscal Year 2020, after materially outperforming the broader equities market in the prior fiscal year. Fiscal Year 2020 was quite the reversal from the prior fiscal year when the anniversary of tax cuts allowed REITs to look relatively attractive versus general equities from an earnings perspective, which positively benefited fund flows in the REIT space. Furthermore, an extended lower-rate environment, as well as volatility associated with the China-U.S. trade war, increased the attractiveness of REITs in the first half of the fiscal year given the sector’s interest rate sensitivity and domestic-oriented businesses.
Unfortunately, the emergence of the COVID-19 pandemic, which essentially shut down the economy, forced retail business closures and prevented person-to-person interaction. Along these lines, the more defensive subsectors such as Industrial (+20.6%), Diversified (-5.2%, led by data centers) and Self-Storage (-12.1%) that benefit either directly or indirectly from work-from-home business models and migration trends outperformed. Given the fallout from the pandemic, which led to out-migration from more dense coastal cities, it was no surprise that the Residential (-16.5%) subsector underperformed the index, but certain names did benefit from strong demand and in-migration to suburban and Sunbelt locations.
Alternatively, those subsectors that had dense coastal footprints were most negatively impacted by stay-at-
Report on Investment Activity (Continued)Fiscal Year 2020
Employees Retirement System of Texas � 2020 Comprehensive Annual Financial Report � Investment Section 95
home orders, such as Office (-17.1%), Health Care (-24.4%), Lodging/Resorts (-33.6%) and Retail (-36.1%), and underperformed.
Although unprecedented fiscal and monetary stimulus helped the REIT index rally from the March lows, the negative investor perception, associated with an impairment of long-term earnings growth in REIT subsectors and concerns about rent collections in the short hit Office, Lodging, Retail and Health Care disproportionately. Specifically, the uncertainty associated with changes in long-term consumer preferences could depress the stock prices of REITs in the aforementioned subsectors and M&A (mergers and acquisitions) consolidation could be the only catalyst to unlock value in the near- to medium-term.
During the 2020 fiscal year, the System committed $699.5 million across 13 equity commitments. This comprised six “re-up” commitments to managers to which the System already had committed, six commitments to new managers and one sidecar co-investment commitment. These fund commitments comprised six diversified, two property tech (main fund and sidecar), two multifamily, one retail/mixed use and one data center. Eleven of these new commitments were for non-core equity investment strategies and one was to an equity open-end core-plus fund. These commitments exceeded the commitment target of $650 million, but were below the upper range of $975 million set forth in the Fiscal Year 2020 Tactical Plan. Eleven of these commitments were to domestic-focused funds and one was to an Asian-focused fund.
Co-investments typically have focused investments, lower management fees and stronger governance structures. From inception through the end of Fiscal year 2020, the System’s Private Real Estate Portfolio had total co-investment commitments of approximately $261 million in seven co-investments. The System's staff expects to make additional co-investments in Fiscal Year 2021 as opportunities become available that meet risk and return parameters, and have strong “hands-on” property management that can drive performance and create value for the System and complement its existing portfolio of investments.
As of August 31, Private Real Estate commitments totaled approximately $5.2 billion to 74 funds and seven co-investments. The System continues to play an active role in monitoring each investment and is on the Advisory Board on all but seven fund investments.
Since inception, approximately $3.9 billion in capital has been called and the net asset value of the System's Private Real Estate Portfolio is approximately $2.4 billion. The System has also received approximately $3 billion as income, realized gains or a return of principal. In Fiscal Year 2020, approximately $500 million in equity capital was called for the System's portfolio and $312 million was returned as income, realized gains or a return of principal, resulting in a net contribution of $188 million. The System is carefully monitoring the pace of capital calls and distributions from all of the investments to ensure the Private Real Estate portfolio is within an acceptable range of the target allocation.
Beginning in Fiscal Year 2018, The System's target allocation to real estate increased to 12% of the Trust’s total assets, up from 10%. The increase will be phased in to the Private Real Estate portfolio through Fiscal Yeas 2021. At the end of Fiscal Year 2020, the Private Real Estate portfolio represented 8.1% of the overall Trust’s assets, which is slightly above the Fiscal Year 2020 interim target weight of 8%. The System will continue to prudently add to the portfolio to work toward achieving the 9% Fiscal Year 2021 target allocation and maintain an appropriate vintage year exposure.
Private Equity
For Fiscal Year 2020, Private Equity closed on 13 deals, including three co-investments, with commitments totaling $638 million, versus a goal of $800 million and a range of $600 million to $1.0 billion.
As of August 31, the Private Equity portfolio net asset value was $4.49 billion, compared to $4.08 billion for the fiscal year ending August 31, 2019. Since inception, the Private Equity team has closed 114 funds and 57 co-investments with commitments totaling $10.2 billion (adjusted for currency exchange rates). In addition, the System has obtained LP Advisory Committee seats on 69 active funds and six fund LP Advisory Observer seats
Fixed Income
EconomyFiscal Year 2020 was completely defined by the introduction of COVID-19. Prior to COVID-19, the U.S. economic growth was relatively steady and the unemployment rate was historically low. That all changed in March as cases of COVID-19 accelerated
Report on Investment Activity (Continued)Fiscal Year 2020
96 Investment Section � 2020 Comprehensive Annual Financial Report � Employees Retirement System of Texas
in New York and began spreading throughout the country. Local, state and federal governments took unprecedented actions to shut down large parts of the economy to control the spread of the virus. Record numbers of Americans began filing for unemployment benefits as businesses shuttered, sending the unemployment rate to 14.7% by the end of April. The Federal Reserve and Congress took swift monetary and fiscal policy actions to support the economy. The Fed essentially lowered the Fed Funds rate to zero and announced other actions such as small business loans, a bond purchase program and state and local government loans. Congress passed a record fiscal stimulus to support households and enable businesses to retain employees.
Some states began reopening their economies in May, but many had to backtrack on some of their reopening as they began to see their initial surge of the virus. Governments have begun to have the virus under control and at more manageable levels. The virus remains with us, which will continue to weigh on a full reopening of the economy. At the end of August, as states had taken measures to reopen, the unemployment rate declined to 8.4%. Economic measures of industrial production have sharply rebounded and the housing market is particularly strong, supported by record-low mortgage rates and movement among the population from cities to suburbs as many employees work from home. Going forward, we expect the Federal Reserve to remain very accommodative for an extended period of time and for Congress to pass additional fiscal measures to support the economy.
• Labor: The unemployment rate surged to 14.7% in April as governments shut down large portions of the economy. The unemployment rate subsequently declined to 8.4% as states partially reopened.
• Inflation: The Federal Reserve’s preferred measure of inflation, Core PCE, was at 1.3% year-over-year for August, well below the Fed’s 2% target. The Fed has signaled that it is willing to let inflation run above 2% in the future to target a longer run 2% average.
• Housing: The housing market has remained relatively robust amid record low interest rates and migration from cities amidst work from home. In August, existing home sales increased 24.7% month-over-month and new home sales increased 13.9% month-over-month.
• Durable Goods: Durable goods orders have rebounded sharply from the depths of the crisis.
In August, orders increased 11.4% month-over-month.
Note: Due to the lagged nature of economic data we have not yet seen the data fully reflect the current economic environment.
The Bond MarketsTreasury yields declined significantly as the Federal Reserve lowered rates to spur the economy. The decline in yields drove very robust returns for Treasuries and rates-sensitive Investment Grade Corporate Bonds for the fiscal year; the Treasury index returned 6.98% and Investment Grade Corporates returned 7.5% for the fiscal year. This type of performance for these two asset classes is unlikely to be replicated for the coming fiscal year given the absolute levels of yields and very tight spreads. High-yield bonds returned 4.65% for the fiscal year; the asset class continues to recover from the significant sell-off that occurred in March.
Private Infrastructure
For Fiscal Year 2020, the Private Infrastructure team closed on seven deals (three fund investments and four co-investments), with commitments totaling $414 million. The total commitment target for Fiscal Year 2020 was $450 million with a commitment range of +/- 30% ($315-$585 million).
Since inception, the Private Infrastructure team has closed on 20 co-investments and 18 funds with commitments totaling $2.1 billion (adjusted for currency exchange rates). The System holds an LP Advisory Committee seat on 17 funds and an observer seat on one fund. As of August 31, 2020, the Infrastructure portfolio net asset value was $1.08 billion, or 3.7% of System assets, compared to $827.0 million, or 2.9% of System assets, for the fiscal year ending August 31, 2019.
Hedge Funds
The Absolute Return Portfolio generated an estimated return of +7.32% for Fiscal Year 2020. Please note that this return is preliminary, as the August returns are not final and several of the managers have less liquid holdings. Over the same time period, the 90-day T-bills plus 350 basis points has returned an estimated +5.02%. The portfolio’s secondary benchmark, the HFRI Fund of Funds Diversified, returned +7.34% for the fiscal year.
Report on Investment Activity (Continued)Fiscal Year 2020
Employees Retirement System of Texas � 2020 Comprehensive Annual Financial Report � Investment Section 97

The start of the 2020 fiscal year was led by risk-on market environments. During September and into 4Q 2019, ongoing U.S.-China tensions and Brexit dominated the news headlines. Positive developments helped support the equity markets, in particular, the announcement and agreement to the “phase-one” trade deal between the U.S. and China. Additionally, the risks of a hard Brexit began to subside. The U.S. Fed cut rates in both September and October, which also was a tailwind for equity markets.
Calendar Year 2019 closed strong for the Absolute Return program, whereby all managers were positive for December. The new year began with risk assets moving higher as a continuation of 2019. By the end of January, the market headlines were led by the discovery of a mystery virus that had originated in China. Investors began taking a risk-off stance in response as uncertainty around the spread and magnitude of the virus lingered. Due to the effects of COVID-19 spreading outside of China, the markets began exhibiting heightened volatility. Moreover, investors began de-risking their portfolios. This led to a massive de-grossing, most notably in March, which resulted in sharp equity market drawdowns.
In response to COVID-19 and the falling markets, several central banks began to look at measures to stimulate their respective economies. During this time, the U.S. Fed reduced benchmark interest rates to 0%. Toward the end of the fiscal year, the equity markets began to rebound, although COVID-19 and its effects remained the dominant theme within the news. The markets remained in risk-on mode for most of the summer. Within the credit markets, the Fed announced a corporate bond buying program that helped lift credit markets. The fiscal year ended with overall strong equity markets.
In the U.S., investor sentiment remained positive on encouraging COVID-19 vaccine development as well as an overall dovish Fed outlook leading to the view of a prolonged interest rate environment. Europe markets remained mostly positive toward the end of the fiscal year. Finally, Asia ended the fiscal year in mostly positive territory as COVID-19 impacts have lessened and with favorable industrial data coming out of China. In Japan, Prime Minister Shinzo Abe announced his resignation due to heath issues. The Japanese markets digested the news without too much concern as his proposed replacement will continue with “Abenomics” as planned.
The System's Absolute Return Portfolio ended the fiscal year quite strong on both an absolute and relative basis. All but three managers ended the fiscal year in positive territory. The System's Hedge fund team is focused on increasing its exposure to event-driven and equity long/short strategies.
Key Portfolio Statistics
Statistics 2020 2019 Contributions to Pool 1,308,700,000 1,246,000,000 Withdrawals from Pool (2,615,200,000) (2,558,000,000) Interest & Dividends 649,744,916 709,416,286 Securities Lending Net Income 2,430,095 3,190,953
Net Appreciation in Fair Value 1,268,829,652 124,061,087
Basic of Presentation: Master custodian and the System's financials records. The time weighted method is used to calculate the rates of return
Report on Investment Activity (Concluded)Fiscal Year 2020
98 Investment Section � 2020 Comprehensive Annual Financial Report � Employees Retirement System of Texas

Background
The Board of Trustees’ investment policies are governed by the Texas Government Code and the Texas State Constitution. As fiduciaries of the System’s funds, the Board of Trustees practices the following duties of care:
• Manage the assets for the exclusive benefit of the Beneficiaries;
• Adopt a long-term asset allocation• Establish prudent investment policies defining
investment objectives and strategies;• Seek to maximize investment returns while
maintaining the safety of principal;• Diversify the assets to reduce risk of loss;• Monitor investment performance;• Efficiently manage the costs associated with
implementation of the Trust; and• Exercise reasonable care consistent with ERS’
fiduciary duty, and maintain the integrity of the investment program.
Investments shall be made in securities that are considered prudent investments, exercising the judgment and care, under the circumstances prevailing at the time of the investment, that persons of ordinary prudence, discretion, and intelligence exercise in the management of their own affairs, not in regard to speculation, but in regard to the permanent disposition of their funds, considering the probable income from the disposition and the probable safety of their capital. However, the Board of Trustees shall not participate in individual investment selections unless it is specifically provided for herein because that responsibility has been delegated to the Executive Director and the System’s investment staff, with oversight by the Board of Trustees.
Roles and Responsibilities
The Board of Trustees in responsible for formulating, adopting, and overseeing the investment policies of the Trust. The Board shall (i) invest the funds as a single Trust without distinction as to their source (ii) hold securities purchased with such funds collectively for the proportionate benefit of the pension plans. Separate investment objective, investment guidelines, investment strategy and accounting will be used for Texas Employees Group Benefits Program assets.
The Board of Trustees will approve alternative investments over 0.6% of the total market value of the System’s assets as reported in the most recent
Comprehensive Annual Financial Report pursuant to Texas Government Code Section 815.3016.
In accordance with Texas Government Code 815.301 (b), the Executive Director is delegated full authority and responsibility by the Board of Trustees to perform the responsibilities of the Board of Trustees and in the implementation of the Trust subject to the Board of Trustee’s policies, rules, regulation and directives consistent with constitutional and statutory limitations. The Executive Director will establish procedures and controls for efficient implementation of the Trust by the System’s staff. The Executive Director may delegate to another employees of the System any right, power of duty assigned to the Executive Director pursuant to Texas Government Code § 815.202 (f).
Asset Allocation
The Board of Trustees has adopted the assets allocation to improve the long-term expected return and the return relative to the risk taken of the trust. This frameworks for the asset allocation between return seeking and risk reduction/liquidity assets provides boarder diversification and improved returns in disparate economic regimes. This framework is segregated into asset classes that are geared to seek returns and those that provide both risk reduction and liquidity as needed. In addition, the Board of Trustees has established specific sub-targets with minimums and maximums around target allocations.
Risk Management
The following statements represent the core values and beliefs that form the basis of the risk philosophy for the Trust in a long-term perspective.
• The System’s investment program is structured to address systematic risk (or market risk) and non-systematic risk (risks associated with an asset class or portfolio).
• Risk management recognizes that some risks are quantitative or statistically measurable while others are not.
• Risk reporting should be timely, relevant, and understandable.
Risk management is a primary responsibility for the System’s staff and investment results will be reviewed in the context of risk-adjusted returns. The Risk Management frameworks is established through (1) the adoption of the investment policies and the
Outline of Investment PoliciesFiscal Year 2020
Employees Retirement System of Texas � 2020 Comprehensive Annual Financial Report � Investment Section 99
strategic asset allocation, (2) adoption of individual asset class benchmarks, and (3) reasonable risk limits within the investment policies for the implementation of the investment program. The goal is not to eliminate risk but to strive to achieve a balance between risk and return. The System’s’ Chief Investment Officer is responsible for reporting and effectively communicating risk management results to the Board of Trustees on a regular basis.
Permissible Investments
The Board of Trustees will consider investment instruments appropriate for the System’s funds and deemed to be prudent based on:
• Compliance with the definition of “securities” set forth in Texas Government Code § 815.301(f);
• Their consistency with Policy and portfolio objectives;
• Their application to the portfolio's diversification;• The System’s staff and /or advisor competency in
evaluating, managing and trading the securities; • Consideration of their liquidity within the portfolio;
and• The costs.
Proxy Voting
All proxies and bond exchanges shall be voted to consider only those factors that relate to the economic value of the System’s investment, and such votes should cast in accordance with the System’s best interest and investment objectives for the funds.
Basis of Presentation: Texas Statute and the System’s Investment Policy
Outline of Investment Policies (Concluded)Fiscal Year 2020
100 Investment Section � 2020 Comprehensive Annual Financial Report � Employees Retirement System of Texas

Time-Weighted Rates of Return (Note A)3 Year 5 Year 10 Year
2016 2017 2018 2019 2020 (2018-2020) (2016-2020) (2011-2020)% % % % % % % %
Fixed IncomeERS 5.14 3.49 1.19 6.57 4.16 3.95 4.1 3.47Index 6.5 1.34 -0.93 10.08 6.41 5.09 4.61 3.97Domestic EquitiesERS 8.48 15.81 20.89 -0.01 17.67 12.46 12.31 14.24Index 12.54 15.87 20.06 1.72 21.64 14.1 14.14 15.04International EquitiesERS 1.44 19.38 3.72 -2.96 10.04 3.46 6.05 6.03Index 2.92 18.88 3.18 -3.27 8.31 2.63 5.75 5.26Alternative InvestmentsERS 6.76 11.26 12.5 6.47 0.98 6.53 7.51 10.19Index NA NA NA NA NA NA NA NA Cash EquivalentsERS 0.76 1.91 2.72 2.16 1.01 1.96 1.71 0.86Index 0.23 0.62 1.52 2.36 1.26 1.72 1.2 0.64ERS Overall ERS 5.32 12.15 9.58 3.04 6.85 6.46 7.34 8.22Index 7.23 11.08 7.94 3.06 8.17 6.36 7.47 8.03
Change in CPI 0.87 1.74 3.01 1.81 1.03 1.93 1.68 1.74
Asset Class
Perc
ent
(%)
Overall One Year Time-Weighted Return
6.57-0.01 -2.96
6.472.16
10.081.72
-3.272.36 ERS %
Index %
FixedIncome
DomesticEquities
InternationalEquities
AlternativeInvestments
CashEquivalents
0.00
5.00
10.00
Asset Class
Perc
ent
(%)
Overall One Year Average Asset Allocation
26.94 23.6316.97
30.93
1.53%
28.6523.27
16.73
30.35
1.00%ActualTarget
FixedIncome
DomesticEquities
InternationalEquity
AlternativeInvestments
CashEquivalents
0.00
10.0020.00
30.00
Note A: The Time-Weighted Rate of Return measures the gross of fees performance of the total investment portfolio, considering income and market impact, including realized and unrealized gains, and eliminates the effect of timing of cash flows due to contributions and withdrawals which are not controllable by the investment managers. The 5-year return is used to smooth market swings and to maintain consistency with the long-term nature of the fund. The Time-Weighted Rate of Return is calculated as follows:
Ending Market Value / (Beginning Market Value + Net Cash Flows)
The indices used for comparison are net of fees. The names of the index are listed as follow
Fixed Income Securities Portfolio: Barclays Capital Universal and Floating Fixed IncomeDomestic Equities Portfolio: S&P 1500/ S&P 1500 BlendInternational Equities Portfolio: MSCI EAFE/MSCI ACWI ex US Blended Index
(i.e., Europe, Australia and Far East Index excluding securities unavailable to foreign investors)Cash Equivalents Portfolio: 91-Day U.S. Treasury Bill
Basis of Presentation: Master custodian records.
Time-Weighted Rates of Return and Asset AllocationsInvestment PoolAugust 31, 2020
Employees Retirement System of Texas � 2020 Comprehensive Annual Financial Report � Investment Section 101

Domestic Equity
Brokerage Firm No. of Shares Traded CommissionsCommission
Per Share$ $
Baird, Robert W & Co., Inc. 5,346,038 106,921 0.020Barclays Capital 8,791,988 170,681 0.019BMO Capital Markets Corp. 4,280,754 85,615 0.020BNY Mellon Clearing 8,402,359 168,047 0.020Cantor Fitzgerald 549,540 10,991 0.020Capital Institutional Services, Inc. 1,234,072 37,022 0.030Citigroup Global Markets, Inc. 6,964,029 111,659 0.016Cowen & Co., LLC 2,534,959 50,699 0.020Credit Suisse 10,981,744 213,030 0.019Euroclear Bank SA 118,584 1,767 0.015Goldman Sachs 5,470,853 99,159 0.018ICBC Financial Services LLC 12,704 635 0.050Instinet LLC 190,143 1,901 0.010Investment Technology Group, Inc. 595,203 5,952 0.010Jefferies & Co, Inc. 11,228,393 224,568 0.020JP Morgan Securities, LLC 18,827,193 199,722 0.011Macquarie Securities (USA), Inc. 896,853 17,937 0.020Merrill Lynch & Co., Inc. 15,781,544 315,631 0.020Morgan Stanley & Co., Inc. 5,101,486 102,030 0.020National Financial Services, LLC 9,394,752 179,888 0.019Raymond James & Associates, Inc. 5,622,848 145,285 0.026RBC Capital Markets 3,791,388 75,828 0.020Sanford C Bernstein & Co., Inc. 2,444,005 48,845 0.020Stifel, Nicolaus & Co., Inc. 5,401,634 108,033 0.020UBS 3,934,095 78,682 0.020Wells Fargo Securities, LLC 2,525,792 50,516 0.020
140,422,953 2,611,044 0.019
- to next page
Broker CommissionsYear Ended August 31, 2020
102 Investment Section � 2020 Comprehensive Annual Financial Report � Employees Retirement System of Texas

International Equity
Brokerage Firm No. of Shares Traded CommissionsCommission
Per Share$ $
Bank of America 4,673,014 14,570 0.003Barclays Capital 2,685,976 41,605 0.015BMO Nesbitt Burns 2,521,482 37,225 0.015BNP Paribus 1,943,443 56,505 0.029BNY Mellon Clearing 2,861,260 39,176 0.014Bradesco SA 97,000 1,105 0.011Caceis Bank 589,600 18,496 0.031Calyon Securities 6,143,654 52,752 0.009Cenkos 187,972 3,672 0.020Citigroup Global Markets, Inc. 17,614,116 137,789 0.008CLSA 8,519,183 76,387 0.009Credit Agricole Cheuvreux N.A., Inc. 225,000 4,420 0.020Credit Lyonnais Securities 33,446,177 158,675 0.005Credit Suisse 9,101,316 126,764 0.014Daiwa Securities 142,151,266 335,652 0.002Euroclear Bank SA 626,879 8,881 0.014Exane 4,532,595 82,888 0.018Fidelity Clearing Canada 211,700 3,219 0.015Goldman Sachs 580,154 4,040 0.007HSBC 52,875,613 154,526 0.003Instinet LLC 4,411,600 8,291 0.002Investec Securities Limited 14,512 95 0.007Investment Technology Group, Inc. 232,672 8,192 0.035ITG, Inc. 22,100 330 0.015Jefferies & Co, Inc. 21,041,663 171,143 0.008JP Morgan Securities, LLC 37,897,744 233,187 0.006KEB Salomon Smith Barney Securities 2,242 2,541 1.134Kepler Cheuvreux 1,773,828 39,406 0.022Liquidnet, Inc. 87,719 1,331 0.015Macquarie Securities (USA), Inc. 49,902,911 201,207 0.004Merrill Lynch & Co., Inc. 12,592,699 195,529 0.016Mitsubishi Securities 954,000 32,838 0.034Mizuho Securities USA, Inc. 2,267,661 102,607 0.045Morgan Stanley & Co., Inc. 36,990,677 230,186 0.006Nomura Securities Co. Ltd. 157,000 1,815 0.012Parel 682,649 30,921 0.045Redburn Partners, LLP 5,750,684 127,292 0.022S. G. Warburg & Co., Ltd. 20,100 59 0.003Sanford C Bernstein & Co., Inc. 2,334,164 25,588 0.011SG SEC (London) LTD, London 379,679 701 0.002Societe Generale 1,354,109 20,196 0.015The Depository Trust Company 33,000 503 0.015UBS 17,341,986 220,749 0.013
487,832,799 3,013,054 0.006
Basis of Presentation: Master custodian records.
Broker Commissions (Concluded)Year Ended August 31, 2020
Employees Retirement System of Texas � 2020 Comprehensive Annual Financial Report � Investment Section 103
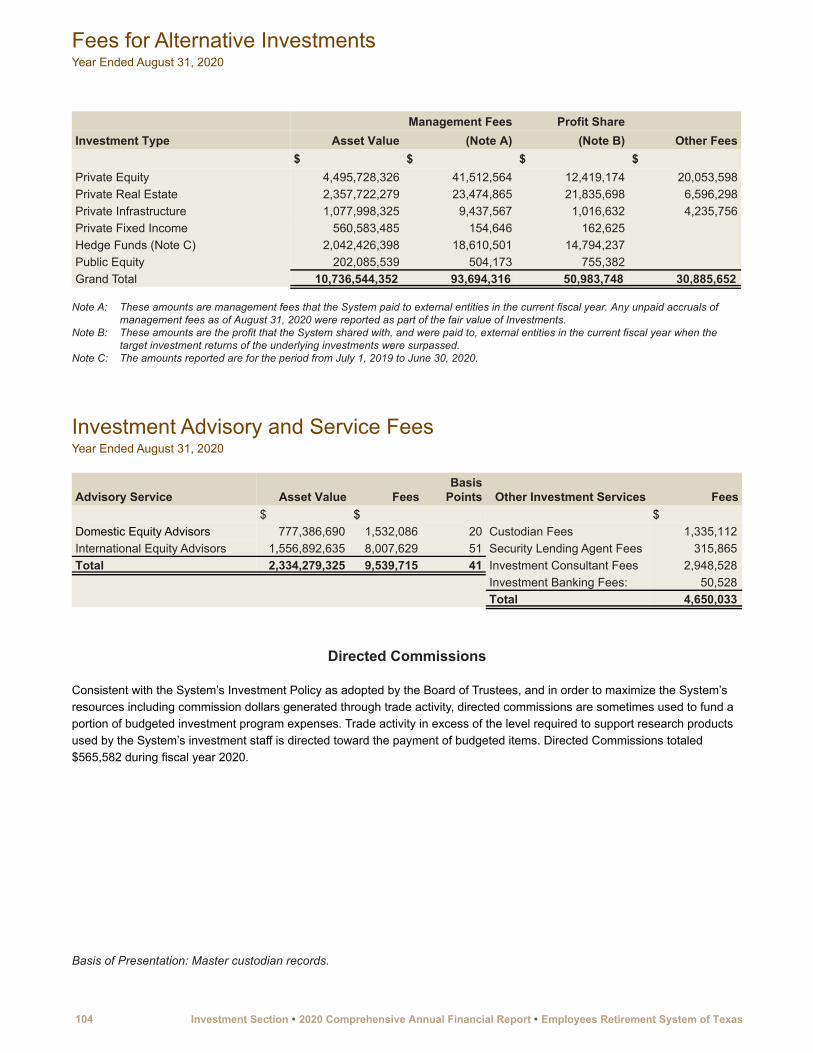
Management Fees Profit ShareInvestment Type Asset Value (Note A) (Note B) Other Fees
$ $ $ $Private Equity 4,495,728,326 41,512,564 12,419,174 20,053,598Private Real Estate 2,357,722,279 23,474,865 21,835,698 6,596,298Private Infrastructure 1,077,998,325 9,437,567 1,016,632 4,235,756Private Fixed Income 560,583,485 154,646 162,625Hedge Funds (Note C) 2,042,426,398 18,610,501 14,794,237Public Equity 202,085,539 504,173 755,382Grand Total 10,736,544,352 93,694,316 50,983,748 30,885,652
Note A: These amounts are management fees that the System paid to external entities in the current fiscal year. Any unpaid accruals of management fees as of August 31, 2020 were reported as part of the fair value of Investments.
Note B: These amounts are the profit that the System shared with, and were paid to, external entities in the current fiscal year when the target investment returns of the underlying investments were surpassed.
Note C: The amounts reported are for the period from July 1, 2019 to June 30, 2020.
Investment Advisory and Service FeesYear Ended August 31, 2020
Advisory Service Asset Value FeesBasis
Points Other Investment Services Fees$ $ $
Domestic Equity Advisors 777,386,690 1,532,086 20 Custodian Fees 1,335,112 International Equity Advisors 1,556,892,635 8,007,629 51 Security Lending Agent Fees 315,865 Total 2,334,279,325 9,539,715 41 Investment Consultant Fees 2,948,528
Investment Banking Fees: 50,528 Total 4,650,033
Directed Commissions
Consistent with the System’s Investment Policy as adopted by the Board of Trustees, and in order to maximize the System’s resources including commission dollars generated through trade activity, directed commissions are sometimes used to fund a portion of budgeted investment program expenses. Trade activity in excess of the level required to support research products used by the System’s investment staff is directed toward the payment of budgeted items. Directed Commissions totaled $565,582 during fiscal year 2020.
Basis of Presentation: Master custodian records.
Fees for Alternative InvestmentsYear Ended August 31, 2020
104 Investment Section � 2020 Comprehensive Annual Financial Report � Employees Retirement System of Texas
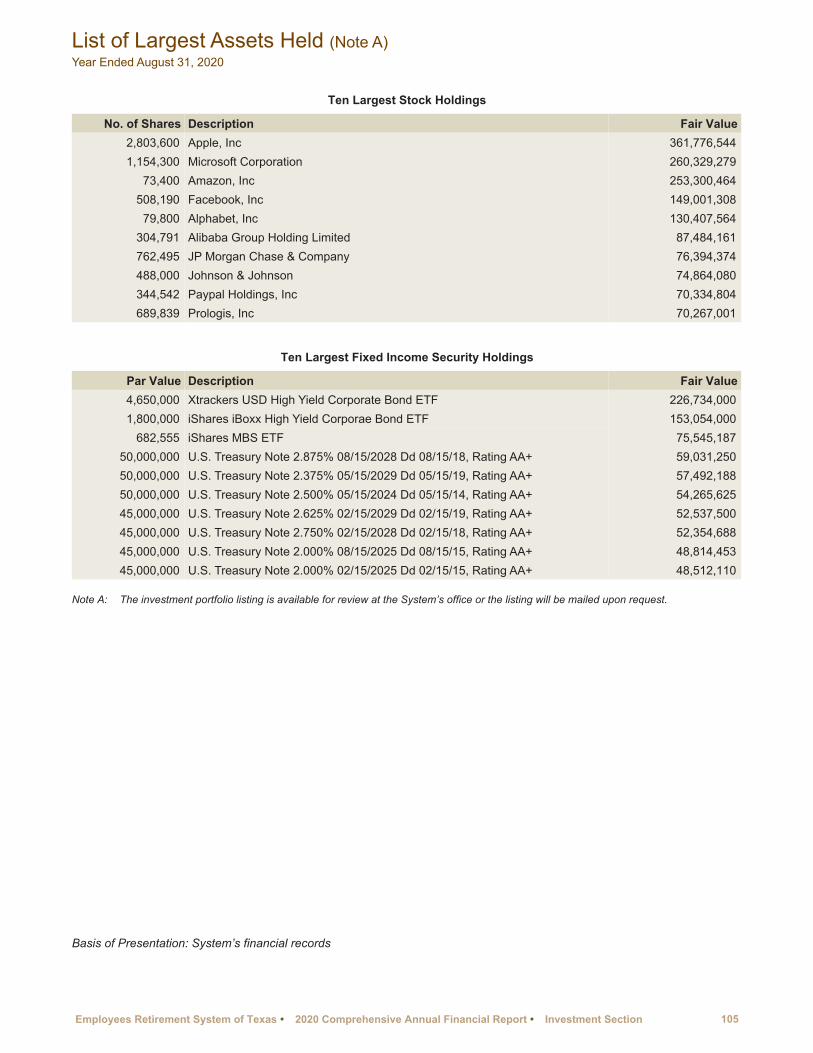
Ten Largest Stock Holdings
No. of Shares Description Fair Value 2,803,600 Apple, Inc 361,776,544 1,154,300 Microsoft Corporation 260,329,279 73,400 Amazon, Inc 253,300,464 508,190 Facebook, Inc 149,001,308 79,800 Alphabet, Inc 130,407,564 304,791 Alibaba Group Holding Limited 87,484,161 762,495 JP Morgan Chase & Company 76,394,374 488,000 Johnson & Johnson 74,864,080 344,542 Paypal Holdings, Inc 70,334,804 689,839 Prologis, Inc 70,267,001
Ten Largest Fixed Income Security Holdings
Par Value Description Fair Value 4,650,000 Xtrackers USD High Yield Corporate Bond ETF 226,734,000 1,800,000 iShares iBoxx High Yield Corporae Bond ETF 153,054,000 682,555 iShares MBS ETF 75,545,187 50,000,000 U.S. Treasury Note 2.875% 08/15/2028 Dd 08/15/18, Rating AA+ 59,031,250 50,000,000 U.S. Treasury Note 2.375% 05/15/2029 Dd 05/15/19, Rating AA+ 57,492,188 50,000,000 U.S. Treasury Note 2.500% 05/15/2024 Dd 05/15/14, Rating AA+ 54,265,625 45,000,000 U.S. Treasury Note 2.625% 02/15/2029 Dd 02/15/19, Rating AA+ 52,537,500 45,000,000 U.S. Treasury Note 2.750% 02/15/2028 Dd 02/15/18, Rating AA+ 52,354,688 45,000,000 U.S. Treasury Note 2.000% 08/15/2025 Dd 08/15/15, Rating AA+ 48,814,453 45,000,000 U.S. Treasury Note 2.000% 02/15/2025 Dd 02/15/15, Rating AA+ 48,512,110
Note A: The investment portfolio listing is available for review at the System’s office or the listing will be mailed upon request.
Basis of Presentation: System’s financial records
List of Largest Assets Held (Note A)Year Ended August 31, 2020
Employees Retirement System of Texas �2020 Comprehensive Annual Financial Report �Investment Section 105

Pooled Pension Trust Funds (Note A) Investment PoolFund 0955 Fund 0977 Fund 0993 Fund 0973 Fair Value % Total
Type of Investment $ $ $ $Public Equities:
Domestic Equities 5,636,463,316 191,964,840 96,452,835 11,452,205 5,936,333,196 18.64 %Foreign Equities 4,267,611,283 145,344,922 73,028,632 858 4,485,985,695 14.09 %Exchange Traded Funds 108,666,555 3,700,930 1,859,534 114,227,019 0.36 %Real Estate Investment Trust 1,029,593,906 35,065,576 17,618,717 1,082,278,199 3.40 %
Total Public Equities 11,042,335,060 376,076,268 188,959,718 11,453,063 11,618,824,109 36.49 %Fixed Income:
U.S. Treasury Securities 2,476,931,301 84,358,523 42,385,984 1,066,823,847 3,670,499,655 11.53 %U.S. Government Agency Obligations 439,560,540 14,970,410 7,521,891 198,931,245 660,984,086 2.08 %Corporate Obligations 1,825,104,433 62,158,815 31,231,729 305,767,636 2,224,262,613 6.98 %Corporate Asset and Mortgage
Backed Securities 46,319,851 1,577,547 792,639 18,262,783 66,952,820 0.21 %Exchange Traded Funds 380,690,561 12,965,436 6,514,490 77,878,701 478,049,188 1.50 %Real Estate Investment Trust 59,461,118 2,025,108 1,017,516 10,085,081 72,588,823 0.23 %Foreign Obligations 479,415,863 16,327,790 8,203,907 81,312,765 585,260,325 1.84 %
Total Fixed Income 5,707,483,667 194,383,629 97,668,156 1,759,062,058 7,758,597,510 24.37 %Alternative Investments 9,924,225,848 337,996,066 169,826,201 102,410,698 10,534,458,813 33.08 %Other Investments 346,421,358 11,798,306 5,928,065 364,147,729 1.14 %Short-term Investments:
Investment in Pool Cash 3,821,696 131,865 63,983 4,017,544 0.01 %Other Short-term Investment 485,577,239 16,537,632 8,309,342 1,056,508,516 1,566,932,729 4.91 %
Total Short-term Investments 489,398,935 16,669,497 8,373,325 1,056,508,516 1,570,950,273 4.92 %Total Before Securities Lending
Collateral (Notes B & C) 27,509,864,868 936,923,766 470,755,465 2,929,434,335 31,846,978,434 100.00 %
Securities Lending Collateral 107,364,040 3,657,466 1,836,817 8,166,676 121,024,999 Total Pension Investment PoolTrust Fund (0888) 27,617,228,908 940,581,232 472,592,282 2,937,601,011 31,968,003,433 Cash Equivalents:Cash in State Treasury-Pension Funds 66,742,458 3,033,967 1,546,448 93,696,153 Total Investments 27,683,971,366 943,615,199 474,138,730 3,031,297,164
Note A: The Pension Investment Pool Trust Fund (Fund 0888) includes the Employees Retirement Fund (Fund 0955), the Law Enforcement and Custodial Officer Supplemental Retirement Fund (Fund 0977), the Judicial Retirement System Plan Two Fund (Fund 0993), and the long- term investments from the Employees Life, Accident and Health Insurance and Benefits Fund (Fund 0973).
Note B: Fair value of investments adjusted to comply with the CFA Institute Standards:
Fair ValueFund 0955 Fund 0977 Fund 0993 Fund 0973 Total
$ $ $ $ $Total Fair Value of Investments Before Securities
Lending Collateral, as above 27,509,864,868 936,923,766 470,755,465 2,929,434,335 31,846,978,434 Unsettled Sales-Investment Receivables 194,652,000 6,629,395 3,330,943 1,694,009 206,306,347 Unsettled Purchases-Investment Payables (69,277,221) (2,359,421) (1,185,493) (4,852,184) (77,674,319) Accrued Interest and Dividends/Tax Reclaims
Receivable/Prepaid Fees 95,534,956 3,253,833 1,634,899 11,958,025 112,381,713 Securities Lending Fees Payables/
Miscellaneous Payables (1,324,353) (45,104) (22,663) 12,458 (1,379,662) Total Fair Value of Investments, Adjusted to
Comply with the CFA Institute Standards 27,729,450,250 944,402,469 474,513,151 2,938,246,643 32,086,612,513
Note C: The investment portfolio listing is available for review at the System’s office or the listing will be mailed upon request.
Basis of Presentation: System’s financial records in accordance with the CFA Institute Standards
Investment Summary at Fair ValueAugust 31, 2020
106 Investment Section � 2020 Comprehensive Annual Financial Report � Employees Retirement System of Texas

ACTUARIAL SECTION
Pension Plans:
Actuary’s Certification Letter
Actuarial Balance Sheets
Summary of Actuarial Methods and Assumptions
Active Member Valuation Data
Retirees and Beneficiaries Added to and Removed from the Annuity Payrolls
Schedule of Funding Progress — Defined Benefit Plans
Solvency Test
Analysis of Financial Experience
Effect of Changes in Actuarial Assumptions
State Retirees Health Plan:
Actuary’s Certification Letter
Actuarial Valuation Results
Summary of Actuarial Methods and Assumptions
Active Member Valuation Data
Retirees and Nominees Added to and Removed
Schedule of Funding Progress — State Retiree Health Plan
107

108 Actuarial Section � 2020 Comprehensive Annual Financial Report � Employees Retirement System of Texas
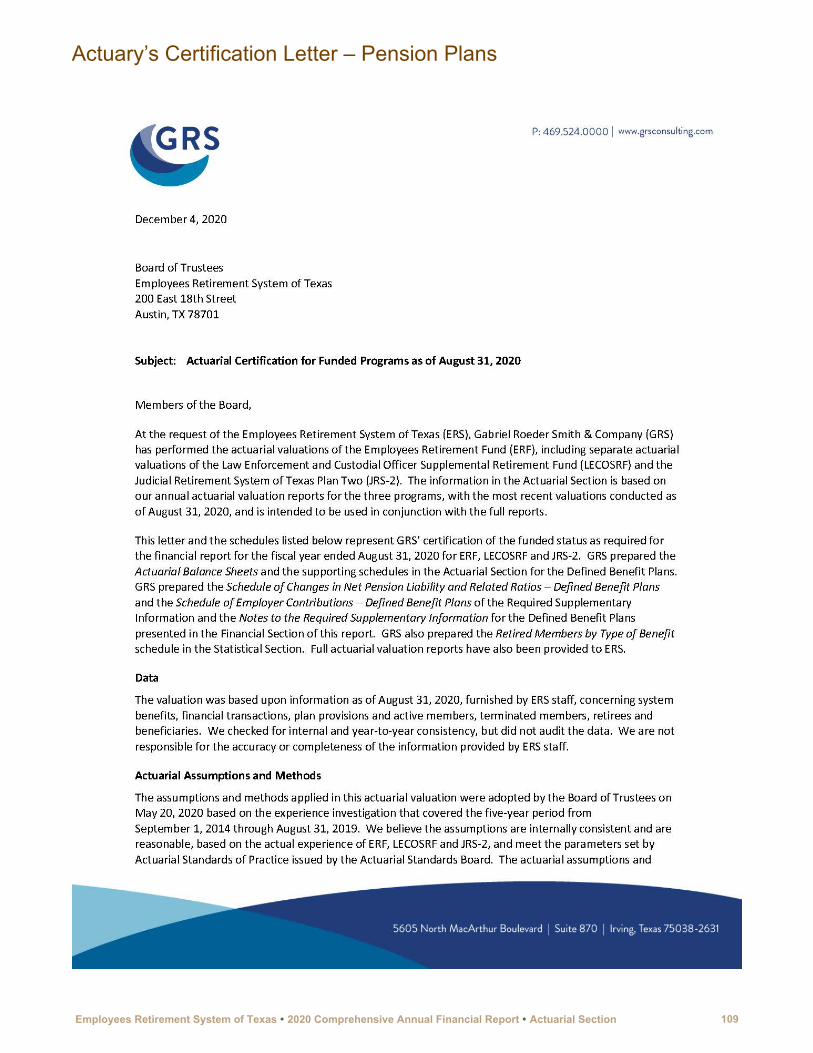
Actuary’s Certification Letter – Pension Plans
Employees Retirement System of Texas � 2020 Comprehensive Annual Financial Report � Actuarial Section 109
Actuary’s Certification Letter – Pension Plans (Continued)
110 Actuarial Section � 2020 Comprehensive Annual Financial Report � Employees Retirement System of Texas
Actuary’s Certification Letter – Pension Plans (Continued)
Employees Retirement System of Texas � 2020 Comprehensive Annual Financial Report � Actuarial Section 111

Actuary’s Certification Letter – Pension Plans (Continued)
112 Actuarial Section � 2020 Comprehensive Annual Financial Report � Employees Retirement System of Texas

Actuary’s Certification Letter – Pension Plans (Continued)
Employees Retirement System of Texas � 2020 Comprehensive Annual Financial Report � Actuarial Section 113

Actuary’s Certification Letter – Pension Plans (Continued)
114 Actuarial Section � 2020 Comprehensive Annual Financial Report � Employees Retirement System of Texas

Actuary’s Certification Letter – Pension Plans (Concluded)
Employees Retirement System of Texas � 2020 Comprehensive Annual Financial Report � Actuarial Section 115

ACTUARIAL BALANCE SHEET August 31, 2020 August 31, 2019Assets:
Actuarial Value Assets $ 28,543,207,745 $ 28,060,120,223 Present Value of Future Normal CostMember 4,967,126,377 4,718,694,315 Employer 2,056,813,451 1,768,371,175
Total 7,023,939,828 6,487,065,490 Total $ 35,567,147,573 $ 34,547,185,713
Liabilities:Present Value of BenefitsActive Members
– service retirement $ 20,518,535,700 $ 18,826,885,220 – disability 173,006,886 164,793,909 – death before retirement 176,360,290 241,503,386 – termination 1,864,913,185 1,645,020,068
Total 22,732,816,061 20,878,202,583 Inactive Members 1,944,655,661 1,724,214,031 Annuitants 25,604,780,179 23,686,007,554 Total $ 50,282,251,901 $ 46,288,424,168
Unfunded Accrued Liability (UAL) $ 14,715,104,328 $ 11,741,238,455
SUMMARY OF ACTUARIAL VALUATION RESULTSTotal Contribution Rate 19.5 % 19.5 %Normal Cost
– dollars $ 1,022,572,697 $ 961,077,754 – percent of payroll 14.16 % 13.76 %
Contribution Available to Amortize UAL 5.34 % 5.74 %Accrued Liability $ 43,258,312,073 $ 39,801,358,678 Amortization Period in Years Never Never Funded Ratio 66.0 % 70.5 %Valuation Payroll $ 7,221,558,595 $ 6,984,576,697 Active Members 142,062 141,865
Actuarial Balance Sheet –Employees Retirement FundAugust 31, 2020 (With Comparative Totals at August 31, 2019)
116 Actuarial Section � 2020 Comprehensive Annual Financial Report � Employees Retirement System of Texas

ACTUARIAL BALANCE SHEET August 31, 2020 August 31, 2019Assets:
Actuarial Value Assets $ 968,062,761 $ 968,129,751 Present Value of Future Normal CostMember 55,185,707 58,033,991 Employer 158,372,607 180,310,577
Total 213,558,314 238,344,568 Total $ 1,181,621,075 $ 1,206,474,319
Liabilities:Present Value of Benefits
Active Members– service retirement $ 860,946,338 $ 850,915,208 – disability 4,629,103 4,852,577 – death before retirement 4,163,566 6,227,199 – termination 14,910,772 13,583,538
Total 884,649,779 875,578,522 Inactive Members 18,141,759 16,285,415 Annuitants 920,353,836 829,115,833
Total $ 1,823,145,374 $ 1,720,979,770
Unfunded Accrued Liability (UAL) $ 641,524,299 $ 514,505,451
SUMMARY OF ACTUARIAL VALUATION RESULTSTotal Contribution Rate 1.00 % 1.00 %Estimated Contribution from Court Fees $ 17,100,000 $ 17,100,000 Normal Cost
– dollars $ 31,935,981 $ 34,203,347 – percent of payroll 1.96 % 2.08 %
Contribution Available to Amortize UAL 0.09 % (0.04) %Accrued Liability $ 1,609,587,060 $ 1,482,635,202 Amortization Period in Years Never NeverFunded Ratio 60.1 % 65.3 %Valuation Payroll $ 1,629,386,809 $ 1,644,391,700 Active Members 35,230 36,296
Actuarial Balance Sheet –Law Enforcement and Custodial Officers Supplemental Retirement FundAugust 31, 2020 (With Comparative Totals at August 31, 2019)
Employees Retirement System of Texas � 2020 Comprehensive Annual Financial Report � Actuarial Section 117
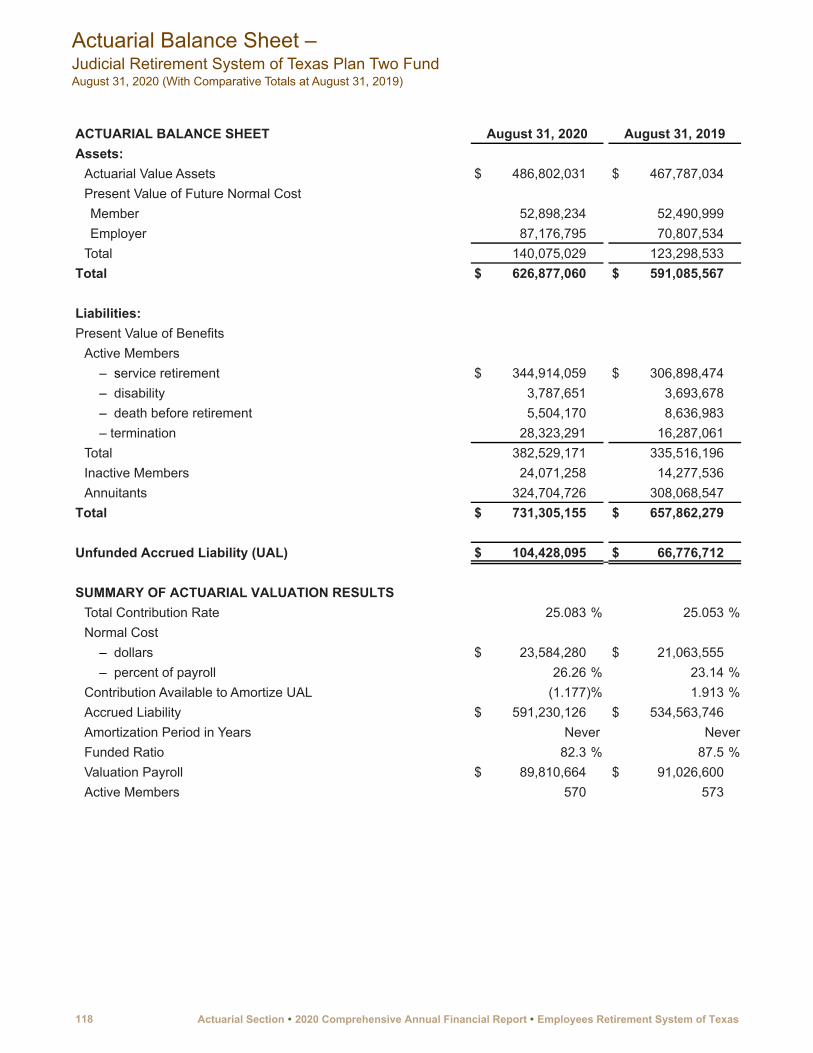
ACTUARIAL BALANCE SHEET August 31, 2020 August 31, 2019Assets:
Actuarial Value Assets $ 486,802,031 $ 467,787,034 Present Value of Future Normal CostMember 52,898,234 52,490,999 Employer 87,176,795 70,807,534
Total 140,075,029 123,298,533 Total $ 626,877,060 $ 591,085,567
Liabilities:Present Value of Benefits
Active Members– service retirement $ 344,914,059 $ 306,898,474 – disability 3,787,651 3,693,678 – death before retirement 5,504,170 8,636,983 – termination 28,323,291 16,287,061
Total 382,529,171 335,516,196 Inactive Members 24,071,258 14,277,536 Annuitants 324,704,726 308,068,547
Total $ 731,305,155 $ 657,862,279
Unfunded Accrued Liability (UAL) $ 104,428,095 $ 66,776,712
SUMMARY OF ACTUARIAL VALUATION RESULTSTotal Contribution Rate 25.083 % 25.053 %Normal Cost
– dollars $ 23,584,280 $ 21,063,555 – percent of payroll 26.26 % 23.14 %
Contribution Available to Amortize UAL (1.177) % 1.913 %Accrued Liability $ 591,230,126 $ 534,563,746 Amortization Period in Years Never NeverFunded Ratio 82.3 % 87.5 %Valuation Payroll $ 89,810,664 $ 91,026,600 Active Members 570 573
Actuarial Balance Sheet –Judicial Retirement System of Texas Plan Two FundAugust 31, 2020 (With Comparative Totals at August 31, 2019)
118 Actuarial Section � 2020 Comprehensive Annual Financial Report � Employees Retirement System of Texas

In May 2020, the Board of Trustees of the System adopted the actuarial methods and assumptions for the Employees Retirement System (ERS), the Law Enforcement and Custodial Officer Supplemental Retirement Fund (LECOSRF), and the Judicial Retirement Plan II Fund (JRS II) with assistance from the System’s actuary and based on the actuarial experience study that covered the fiscal years from 2015 to 2019. No plan provision change took place in fiscal year 2020. This actuarial valuation also incorporates the most significant across-the-board pay increases budgeted by the State Legislature when they are granted for the current biennium.
The System relies on the services of qualified actuaries to perform periodic valuations of the assets and liabilities of the pension funds. Gabriel, Roeder, Smith and Company has been the pension actuary for the System since June 2013. The actuarial methods used for the three funds are summarized in Figure 1.
Actuarial Cost MethodThe Entry Age Normal Actuarial Cost Method was used for the actuarial valuation. Actuarial gains and losses resulting from differences between actual and assumed experience are recognized as they occur each year. These gains or losses increase or decrease the unfunded actuarial accrued liability.
The normal cost rate is based on the benefits payable to each individual member. As the number of members eligible for the newest benefit provisions increases over time, the normal cost rate is expected to decrease, and the amount available to amortize the unfunded liability will increase as a percentage of payroll. The calculation of the years required to amortize the unfunded actuarial accrued liability uses
an open group projection. The total contribution rate is set by statute; the variable from year to year is the funding period.
Actuarial Valuation of AssetsThe actuarial value of assets is based on the market value of assets with a five-year phase-in of actual investment return in excess of (less than) expected investment income. Offsetting unrecognized gains and losses are immediately recognized, with the shortest remaining bases recognized first and the net remaining bases continue to be recognized on their original time frame. Expected investment income is determined using the assumed investment return rate and the market value of assets (adjusted for receipts and disbursements during the year). The returns are computed net of investment-related expenses.
For actuarial assumptions, the members of the System are segregated into four groups – Regular State Employees, Law Enforcement and Custodial Officer (LECO) Members, Elected Class, and Judicial Class. The economic assumptions for these groups are summarized in Figure 1.
Pension Liability for GASB Statement 67 Reporting The calculation of the liability associated with the benefits to satisfy the reporting requirements of GASB Statement No. 67 is not applicable for purposes of funding the plan. A calculation of the plan’s liability for other purposes may produce significantly different results. The Schedule of Employer Contribution in the Required Supplementary Information section provides a comparison of the actuarial determined contribution to actual contribution.
Summary of Actuarial Methods and Assumptions – Pension Plans
Employees Retirement System of Texas � 2020 Comprehensive Annual Financial Report � Actuarial Section 119
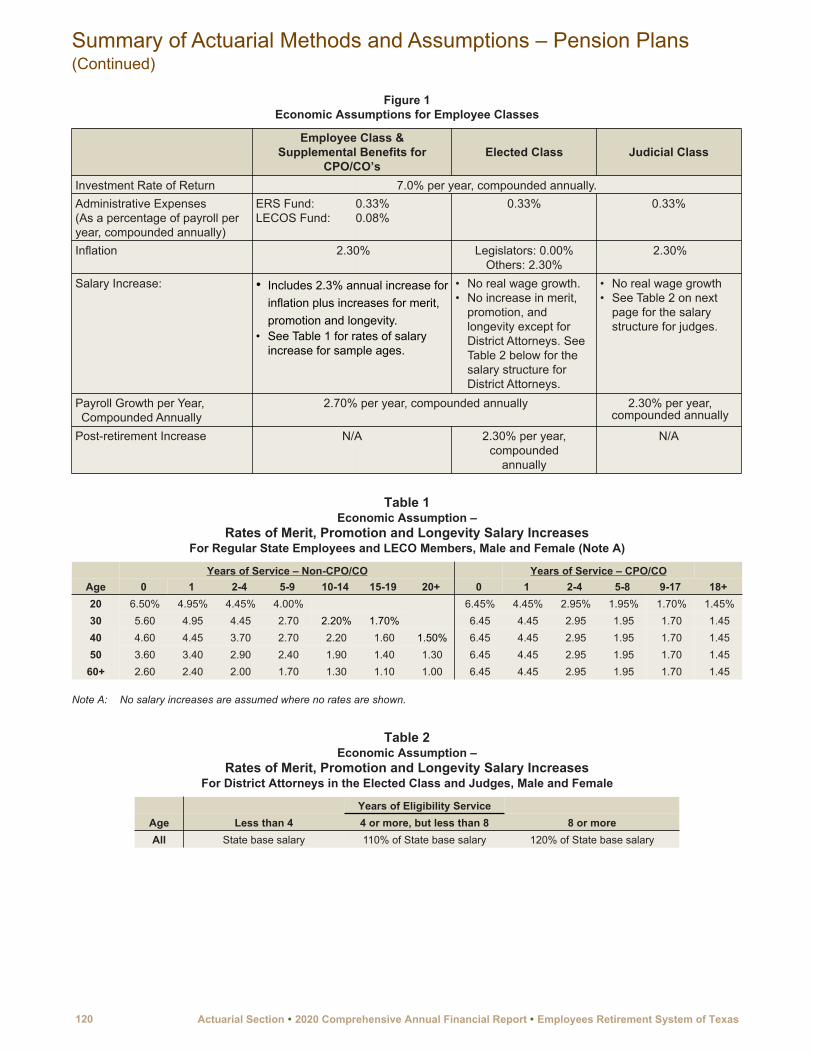
Figure 1Economic Assumptions for Employee Classes
Employee Class &Supplemental Benefits for
CPO/CO’sElected Class Judicial Class
Investment Rate of Return 7.0% per year, compounded annually.Administrative Expenses(As a percentage of payroll per year, compounded annually)
ERS Fund:LECOS Fund:
0.33%0.08%
0.33% 0.33%
Inflation 2.30% Legislators: 0.00%Others: 2.30%
2.30%
Salary Increase: • Includes 2.3% annual increase for inflation plus increases for merit, promotion and longevity.
• See Table 1 for rates of salary increase for sample ages.
• No real wage growth.• No increase in merit,
promotion, and longevity except for District Attorneys. See Table 2 below for the salary structure for District Attorneys.
• No real wage growth• See Table 2 on next
page for the salary structure for judges.
Payroll Growth per Year, Compounded Annually
2.70% per year, compounded annually 2.30% per year, compounded annually
Post-retirement Increase N/A 2.30% per year, compounded
annually
N/A
Table 1Economic Assumption –
Rates of Merit, Promotion and Longevity Salary IncreasesFor Regular State Employees and LECO Members, Male and Female (Note A)
AgeYears of Service – Non-CPO/CO Years of Service – CPO/CO
0 1 2-4 5-9 10-14 15-19 20+ 0 1 2-4 5-8 9-17 18+20 6.50% 4.95% 4.45% 4.00% 6.45% 4.45% 2.95% 1.95% 1.70% 1.45%30 5.60 4.95 4.45 2.70 2.20% 1.70% 6.45 4.45 2.95 1.95 1.70 1.4540 4.60 4.45 3.70 2.70 2.20 1.60 1.50% 6.45 4.45 2.95 1.95 1.70 1.4550 3.60 3.40 2.90 2.40 1.90 1.40 1.30 6.45 4.45 2.95 1.95 1.70 1.45
60+ 2.60 2.40 2.00 1.70 1.30 1.10 1.00 6.45 4.45 2.95 1.95 1.70 1.45
Note A: No salary increases are assumed where no rates are shown.
Table 2Economic Assumption –
Rates of Merit, Promotion and Longevity Salary IncreasesFor District Attorneys in the Elected Class and Judges, Male and Female
Years of Eligibility Service Age Less than 4 4 or more, but less than 8 8 or moreAll State base salary 110% of State base salary 120% of State base salary
Summary of Actuarial Methods and Assumptions – Pension Plans (Continued)
120 Actuarial Section � 2020 Comprehensive Annual Financial Report � Employees Retirement System of Texas
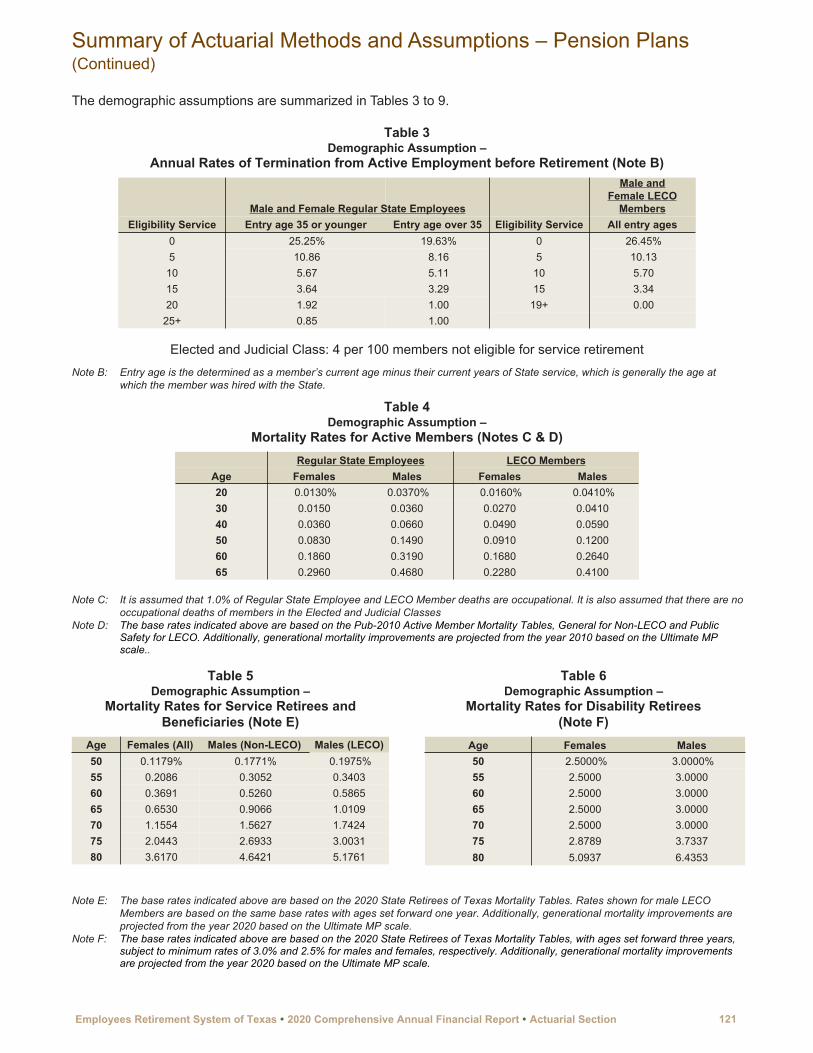
The demographic assumptions are summarized in Tables 3 to 9.
Table 3Demographic Assumption –
Annual Rates of Termination from Active Employment before Retirement (Note B)
Male and Female Regular State Employees
Male andFemale LECO
MembersEligibility Service Entry age 35 or younger Entry age over 35 Eligibility Service All entry ages
0 25.25% 19.63% 0 26.45%5 10.86 8.16 5 10.1310 5.67 5.11 10 5.7015 3.64 3.29 15 3.3420 1.92 1.00 19+ 0.00
25+ 0.85 1.00
Elected and Judicial Class: 4 per 100 members not eligible for service retirementNote B: Entry age is the determined as a member’s current age minus their current years of State service, which is generally the age at
which the member was hired with the State.
Table 4Demographic Assumption –
Mortality Rates for Active Members (Notes C & D)Regular State Employees LECO Members
Age Females Males Females Males20 0.0130% 0.0370% 0.0160% 0.0410%30 0.0150 0.0360 0.0270 0.041040 0.0360 0.0660 0.0490 0.059050 0.0830 0.1490 0.0910 0.120060 0.1860 0.3190 0.1680 0.264065 0.2960 0.4680 0.2280 0.4100
Note C: It is assumed that 1.0% of Regular State Employee and LECO Member deaths are occupational. It is also assumed that there are no occupational deaths of members in the Elected and Judicial Classes
Note D: The base rates indicated above are based on the Pub-2010 Active Member Mortality Tables, General for Non-LECO and Public Safety for LECO. Additionally, generational mortality improvements are projected from the year 2010 based on the Ultimate MP scale..
Table 5Demographic Assumption –
Mortality Rates for Service Retirees andBeneficiaries (Note E)
Age Females (All) Males (Non-LECO) Males (LECO)50 0.1179% 0.1771% 0.1975%55 0.2086 0.3052 0.340360 0.3691 0.5260 0.586565 0.6530 0.9066 1.010970 1.1554 1.5627 1.742475 2.0443 2.6933 3.003180 3.6170 4.6421 5.1761
Table 6Demographic Assumption –
Mortality Rates for Disability Retirees(Note F)
Age Females Males50 2.5000% 3.0000%55 2.5000 3.000060 2.5000 3.000065 2.5000 3.000070 2.5000 3.000075 2.8789 3.733780 5.0937 6.4353
Note E: The base rates indicated above are based on the 2020 State Retirees of Texas Mortality Tables. Rates shown for male LECO Members are based on the same base rates with ages set forward one year. Additionally, generational mortality improvements are projected from the year 2020 based on the Ultimate MP scale.
Note F: The base rates indicated above are based on the 2020 State Retirees of Texas Mortality Tables, with ages set forward three years, subject to minimum rates of 3.0% and 2.5% for males and females, respectively. Additionally, generational mortality improvements are projected from the year 2020 based on the Ultimate MP scale.
Summary of Actuarial Methods and Assumptions – Pension Plans (Continued)
Employees Retirement System of Texas � 2020 Comprehensive Annual Financial Report � Actuarial Section 121

Table 7Demographic Assumption –
Disability Retirement Rates (Note G)
Regular State Employees, Elected
Class and Judicial Class LECO Members
Age Females Males Females & Males30 0.0135% 0.0275% 0.0092%
40 0.0896 0.0749 0.0586
50 0.2072 0.1484 0.1774
60 0.5583 0.3740 0.3150
Note G: It is assumed that 99% of Regular State Employee disability retirements are non-occupational and 1% of Regular State Employee disability retirements are occupational. Similarly, it is assumed that 95% of LECO Member disability retirements are non-occupational, 4.5% of LECO Member disability retirements are non-total occupational, and 0.5% of LECO Member disability retirements are total occupational. It is also assumed that there are no occupational disability retirements in the Elected and Judicial Classes. The rates do not apply before the member is eligible for the benefit.
Table 8Demographic Assumption –
Percentage of Members Electing Various Benefit Options (Notes H & I)
Option Selection PercentageStandard Option 1 Option 4
Male Member
Disability 50 % 50 % 50 %
Service Retirement
Non-LECO Members 100 % 0 % 0 %
LECO Members 60 % 40 % 0 %
Death Benefit Plan 0 % 85 % 15 %
Female MemberDisability 75 % 25 % 0 %Service Retirement 100 % 0 % 0 %Death Benefit Plan 0 % 70 % 30 %
Note H: Descriptions of Options 1 and 4 are presented in the Summary of Plan Provisions in the Introductory Section.Note I: Males are assumed to be two years older than females
Summary of Actuarial Methods and Assumptions – Pension Plans (Continued)
122 Actuarial Section � 2020 Comprehensive Annual Financial Report � Employees Retirement System of Texas
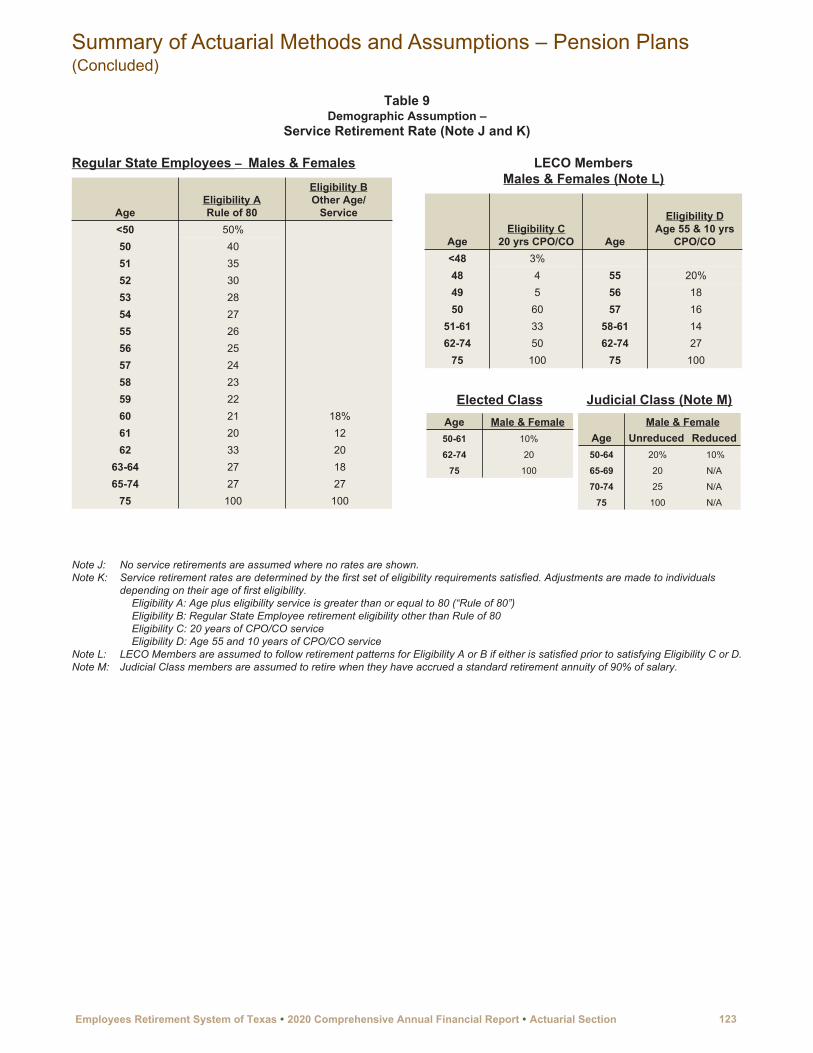
Table 9Demographic Assumption –
Service Retirement Rate (Note J and K)
Regular State Employees – Males & Females
AgeEligibility ARule of 80
Eligibility BOther Age/
Service<50 50%50 4051 3552 3053 2854 2755 2656 2557 2458 2359 2260 21 18%61 20 1262 33 20
63-64 27 1865-74 27 27
75 100 100
LECO MembersMales & Females (Note L)
AgeEligibility C
20 yrs CPO/CO Age
Eligibility DAge 55 & 10 yrs
CPO/CO<48 3%48 4 55 20%49 5 56 1850 60 57 16
51-61 33 58-61 1462-74 50 62-74 27
75 100 75 100
Elected Class Judicial Class (Note M)Age Male & Female Male & Female50-61 10% Age Unreduced Reduced62-74 20 50-64 20% 10%
75 100 65-69 20 N/A
70-74 25 N/A
75 100 N/A
Note J: No service retirements are assumed where no rates are shown.Note K: Service retirement rates are determined by the first set of eligibility requirements satisfied. Adjustments are made to individuals
depending on their age of first eligibility.Eligibility A: Age plus eligibility service is greater than or equal to 80 (“Rule of 80”)Eligibility B: Regular State Employee retirement eligibility other than Rule of 80Eligibility C: 20 years of CPO/CO serviceEligibility D: Age 55 and 10 years of CPO/CO service
Note L: LECO Members are assumed to follow retirement patterns for Eligibility A or B if either is satisfied prior to satisfying Eligibility C or D.Note M: Judicial Class members are assumed to retire when they have accrued a standard retirement annuity of 90% of salary.
Summary of Actuarial Methods and Assumptions – Pension Plans (Concluded)
Employees Retirement System of Texas � 2020 Comprehensive Annual Financial Report � Actuarial Section 123
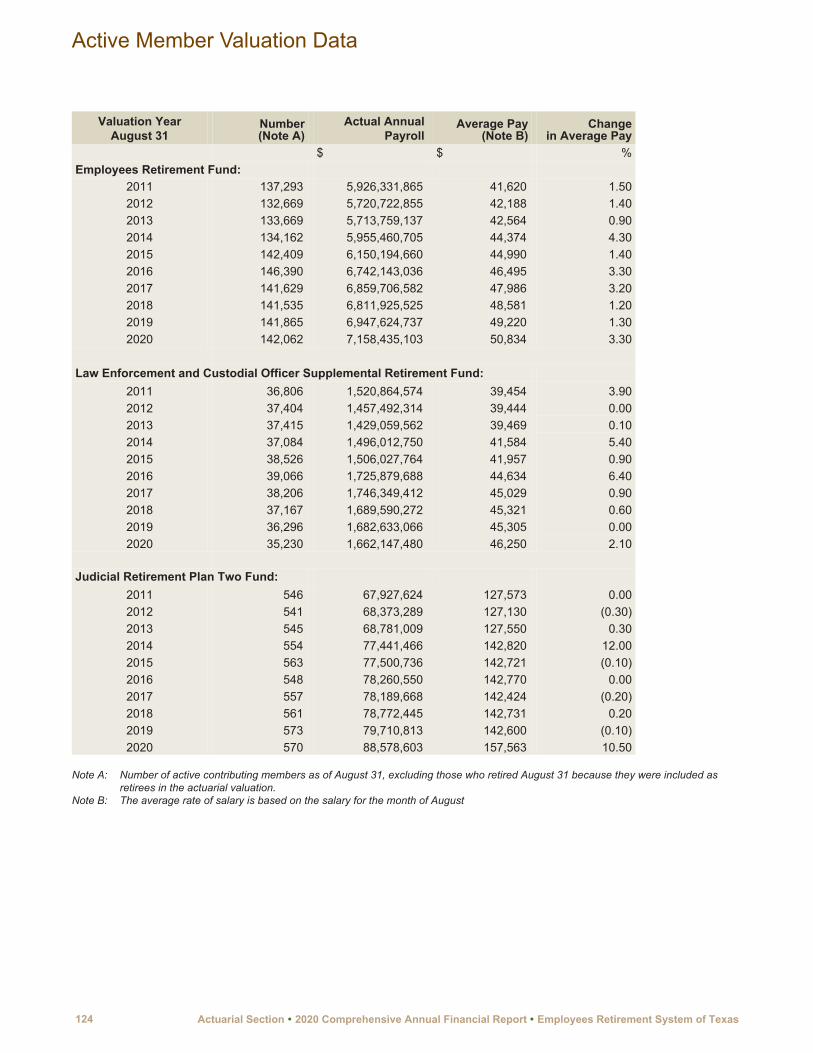
Valuation YearAugust 31
Number(Note A)
Actual AnnualPayroll
Average Pay(Note B)
Changein Average Pay
$ $ %Employees Retirement Fund:
2011 137,293 5,926,331,865 41,620 1.502012 132,669 5,720,722,855 42,188 1.402013 133,669 5,713,759,137 42,564 0.902014 134,162 5,955,460,705 44,374 4.302015 142,409 6,150,194,660 44,990 1.402016 146,390 6,742,143,036 46,495 3.302017 141,629 6,859,706,582 47,986 3.202018 141,535 6,811,925,525 48,581 1.202019 141,865 6,947,624,737 49,220 1.302020 142,062 7,158,435,103 50,834 3.30
Law Enforcement and Custodial Officer Supplemental Retirement Fund:2011 36,806 1,520,864,574 39,454 3.902012 37,404 1,457,492,314 39,444 0.002013 37,415 1,429,059,562 39,469 0.102014 37,084 1,496,012,750 41,584 5.402015 38,526 1,506,027,764 41,957 0.902016 39,066 1,725,879,688 44,634 6.402017 38,206 1,746,349,412 45,029 0.902018 37,167 1,689,590,272 45,321 0.602019 36,296 1,682,633,066 45,305 0.002020 35,230 1,662,147,480 46,250 2.10
Judicial Retirement Plan Two Fund:2011 546 67,927,624 127,573 0.002012 541 68,373,289 127,130 (0.30)2013 545 68,781,009 127,550 0.302014 554 77,441,466 142,820 12.002015 563 77,500,736 142,721 (0.10)2016 548 78,260,550 142,770 0.002017 557 78,189,668 142,424 (0.20)2018 561 78,772,445 142,731 0.202019 573 79,710,813 142,600 (0.10)2020 570 88,578,603 157,563 10.50
Note A: Number of active contributing members as of August 31, excluding those who retired August 31 because they were included as retirees in the actuarial valuation.
Note B: The average rate of salary is based on the salary for the month of August
Active Member Valuation Data
124 Actuarial Section � 2020 Comprehensive Annual Financial Report � Employees Retirement System of Texas

Valuation Year August,
31
Added to Rolls Removed from Rolls Other Beneficiaries Rolls end of Year Increase Average
No.Annual
Benefits No.Annual
Benefits No.Annual
Benefits No.Annual
BenefitsAnnual
BenefitsAnnualBenefit
$ $ $ $ % $Employees Retirement Fund:
2011 5,808 123,585,132 2,237 35,797,140 548 8,145,660 83,430 1,552,999,200 6.6 18,614 2012 5,928 124,604,412 2,128 35,049,012 569 7,965,072 87,799 1,650,519,672 6.3 18,799 2013 5,287 108,395,484 2,418 36,921,000 699 8,999,592 91,367 1,730,993,748 4.9 18,946 2014 6,231 132,027,948 2,331 38,751,696 573 11,250,312 95,840 1,835,520,312 6.0 19,152 2015 6,042 134,725,212 2,506 40,066,764 627 10,129,440 100,003 1,940,308,200 5.7 19,402 2016 5,668 132,332,424 2,555 42,411,504 642 10,458,660 103,758 2,040,687,780 5.2 19,668 2017 5,967 141,001,272 2,869 48,060,288 674 11,351,772 107,530 2,144,980,536 5.1 19,948 2018 6,029 151,352,376 2,912 49,203,420 714 11,816,892 111,361 2,258,946,384 5.3 20,285 2019 6,034 155,789,472 2,910 49,004,268 670 11,670,672 115,155 2,377,402,260 5.2 20,645 2020 5,264 136,837,956 3,104 53,016,372 681 11,670,036 117,996 2,472,893,880 4.0 20,957
Law Enforcement and Custodial Officer Supplemental Retirement Fund:2011 695 3,915,084 186 1,536,500 44 22,352 7,728 42,536,244 6.0 5,504 2012 895 5,069,712 195 1,439,820 49 202,200 8,477 46,368,336 9.0 5,470 2013 744 3,771,816 183 1,336,200 51 230,952 9,089 49,034,904 5.8 5,395 2014 1,071 5,376,924 194 1,238,712 58 225,252 10,024 53,398,368 8.9 5,327 2015 959 4,989,900 197 1,336,440 59 332,088 10,845 57,383,916 7.5 5,291 2016 803 4,540,728 205 1,149,108 72 305,328 11,515 61,080,864 6.4 5,304 2017 876 5,132,832 214 1,106,412 71 310,464 12,248 65,417,748 7.1 5,341 2018 966 6,151,404 205 1,094,460 71 287,868 13,080 70,762,560 8.2 5,410 2019 1,020 6,720,840 179 981,720 60 284,784 13,981 76,786,464 8.5 5,492 2020 873 5,648,916 230 1,150,728 73 346,260 14,697 81,630,912 6.3 5,554
Judicial Retirement Plan Two Fund:2011 43 2,792,244 1 29,580 2 152,880 208 12,532,536 30.3 60,253 2012 8 441,948 4 250,680 3 167,892 215 12,891,696 2.9 59,961 2013 43 2,571,696 5 278,964 1 68,580 254 15,253,008 18.3 60,051 2014 14 1,024,752 7 348,120 6 249,000 267 16,178,640 6.1 60,594 2015 57 4,365,012 9 467,832 7 403,020 322 20,478,840 26.6 63,599 2016 10 555,060 5 319,908 4 289,548 331 21,003,540 2.6 63,455 2017 48 3,177,144 8 448,908 7 383,532 378 24,115,308 14.8 63,797 2018 16 1,032,864 6 481,368 5 309,336 393 24,976,140 3.6 63,553 2019 83 6,458,064 6 424,044 2 122,124 472 31,132,284 24.6 65,958 2020 18 1,399,572 7 527,352 1 29,868 484 32,034,372 2.9 66,187
Retirees and Beneficiaries Added to and Removed from the Annuity Payrolls
Employees Retirement System of Texas � 2020 Comprehensive Annual Financial Report � Actuarial Section 125

ActuarialValuation Date
August 31
(a)Actuarial Value
of Assets
[Note A](b)
Actuarial AccruedLiability
(AAL)
(c)(Overfunded)
Unfunded AAL(UAAL)(b) - (a)
(b)Funded
Ratio(a)/(b)
[Note B](e)
CoveredPayroll
(f)UAAL As A
Percentage OfCovered Payroll
(c)/(e)(000’s) (000’s) (000’s) % (000’s) %
Employees Retirement Fund:2011 23,997,445 28,398,213 4,400,768 84.50 5,795,185 75.902012 24,272,514 29,377,069 5,104,555 82.60 5,676,509 89.902013 24,667,639 31,886,026 7,218,387 77.40 5,959,473 121.102014 25,431,922 32,924,737 7,492,815 77.20 6,171,443 121.402015 25,850,542 33,868,360 8,017,818 76.30 6,659,647 120.402016 26,557,130 35,303,165 8,746,035 75.20 6,806,457 128.502017 26,371,827 37,629,785 11,257,958 70.10 6,796,226 165.702018 27,359,943 38,989,263 11,629,320 70.20 6,875,887 169.102019 28,060,120 39,801,359 11,741,239 70.50 6,984,577 168.102020 28,543,208 43,258,312 14,715,104 66.00 7,221,559 203.80
Law Enforcement and Custodial Officer Supplemental Retirement Fund:2011 830,522 960,953 130,431 86.40 1,475,432 8.802012 832,451 1,015,668 183,217 82.00 1,498,979 12.202013 843,017 1,197,164 354,147 70.40 1,627,699 21.802014 883,595 1,206,770 323,175 73.20 1,609,491 20.102015 909,249 1,262,311 353,062 72.00 1,750,709 20.202016 933,534 1,312,392 378,858 71.10 1,743,679 21.702017 923,990 1,399,877 475,887 66.00 1,720,362 27.702018 953,054 1,452,658 499,604 65.60 1,684,458 29.702019 968,130 1,482,635 514,505 65.30 1,644,392 31.302020 968,063 1,609,587 641,524 60.10 1,629,387 39.40
Judicial Retirement System Plan Two Fund:2011 283,936 300,163 16,227 94.60 69,655 23.302012 300,433 315,199 14,766 95.30 68,778 21.502013 318,026 359,059 41,033 88.60 77,854 52.702014 348,431 386,286 37,855 90.20 79,123 47.802015 372,615 404,011 31,396 92.20 80,352 39.102016 395,457 425,865 30,408 92.90 78,238 38.902017 420,850 463,604 42,754 90.80 79,330 53.902018 447,078 487,772 40,694 91.70 80,072 50.802019 467,787 534,564 66,777 87.50 91,027 73.402020 486,802 591,230 104,428 82.30 89,811 116.30
Note A: For ERS and LECOS, the actuarial accrued liability along with funded ratio are based on a total liability, which is based on the benefit provisions in effect for each active member and a normal cost rate that is based on the benefits in effect for new members after plan changes in August 31, 2009 and August 31, 2013.
Note B: Covered payroll is the expected payroll for the fiscal year following the valuation date.
Schedule of Funding Progress – Defined Benefit Plans
126 Actuarial Section � 2020 Comprehensive Annual Financial Report � Employees Retirement System of Texas

Funding ObjectiveThe System’s funding objective is to meet long term benefit promises through contributions that remain approximately level from year to year as a percent of member payroll. If the contributions to the System are level in concept and soundly executed, the System will pay all promised benefits when due – the ultimate test of financial soundness.
Evaluation of Funding ObjectiveA short-term solvency test is one way of evaluatinga system’s progress under its funding program. In a short-term solvency test, the plan’s present assets are compared with:
1. Active member contributions on deposit;
2. The liabilities for future benefits to present retirees;and3. The liabilities for service already rendered by active
members.
In a system that has been following the level contribution rate of payroll financing principle, the liabilities for active member contributions on deposit (liability 1) and the liabilities for future benefits to present retirees (liability 2) will be fully covered by present assets except in rare circumstances. In addition, the liabilities for service already rendered by active members (liability 3) will be partially covered by the remainder of present assets. Generally, if the system has been using level contribution rate financing, the funded portion of liability 3 will increase over time. Following is a summary of the solvency test:
Aggregate Accrued Liabilities ForPortion of Accrued
Liabilities Covered by Assets
ValuationYear
August 31,
(1)Active
MemberContributions
(2)Retirees andBeneficiaries
(3)Active Member
(Employer FinancedPortion)
ValuationAssets (1) (2) (3)
$ $ $ $ % % %Employees Retirement Fund (Note A):
2011 4,943,684,166 14,325,177,797 9,781,265,638 23,997,444,804 100 100 48.3 2012 5,075,213,967 15,243,956,208 9,657,986,616 24,272,514,483 100 100 40.9 2013 5,201,006,487 16,148,245,090 10,536,774,798 24,667,639,104 100 100 31.5 2014 5,213,640,470 17,113,870,539 10,597,226,202 25,431,922,496 100 100 29.3 2015 5,235,063,313 18,080,000,823 10,553,295,814 25,850,542,024 100 100 24.0 2016 5,509,428,282 19,017,977,910 10,775,759,170 26,557,130,705 100 100 18.8 2017 5,709,094,713 21,378,759,742 10,541,930,919 26,371,827,298 100 96.7 0.0 2018 5,897,455,633 22,527,977,524 10,563,830,405 27,359,943,116 100 95.3 0.0 2019 6,044,422,496 23,686,007,554 10,070,928,628 28,060,120,223 100 92.9 0.0 2020 6,278,991,035 25,604,780,179 11,374,540,859 28,543,207,745 100 87.0 0.0
Law Enforcement and Custodial Officer Supplemental Retirement Fund (Note A):2011 13,897,600 400,877,467 578,021,779 830,522,385 100 100 71.9 2012 19,540,552 447,451,269 577,263,635 832,451,079 100 100 63.3 2013 24,432,912 482,687,108 690,043,817 843,016,798 100 100 48.7 2014 29,508,062 533,252,341 644,009,518 883,594,932 100 100 49.8 2015 34,455,599 578,926,025 648,929,765 909,249,614 100 100 45.6 2016 41,480,394 618,987,770 651,924,337 933,534,062 100 100 41.9 2017 47,025,982 702,926,185 649,924,490 923,989,580 100 100 26.8 2018 51,536,313 762,668,410 638,453,074 953,054,283 100 100 21.7 2019 54,737,312 829,115,833 598,782,057 968,129,751 100 100 14.1 2020 58,423,646 920,353,836 630,809,578 968,062,761 100 98.8 0.0
Judicial Retirement Plan Two Fund (Note A):2011 57,768,713 120,798,133 121,595,978 283,935,401 100 100 86.7 2012 63,677,503 122,570,887 128,950,762 300,433,111 100 100 88.5 2013 64,435,226 147,052,378 147,571,031 318,025,658 100 100 72.2 2014 69,364,268 153,382,909 163,539,195 348,430,575 100 100 76.9 2015 67,427,634 194,524,402 142,058,536 372,615,005 100 100 77.9 2016 73,450,388 196,779,287 155,635,632 395,457,335 100 100 80.5 2017 72,977,421 241,314,049 149,312,220 420,850,181 100 100 71.4 2018 78,282,916 246,496,810 162,991,820 447,077,710 100 100 75.0 2019 70,242,531 308,068,547 156,252,668 467,787,034 100 100 57.3 2020 79,308,832 324,704,726 187,216,568 486,802,031 100 100 44.2
Note A: The actuarial accrued liability for ERS and LECOS is based on a total liability which is based on the benefit provisions in effect for each active member and a normal cost rate which is based on the benefits in effect for members hired after August 31, 2013.
Solvency Test
Employees Retirement System of Texas � 2020 Comprehensive Annual Financial Report � Actuarial Section 127
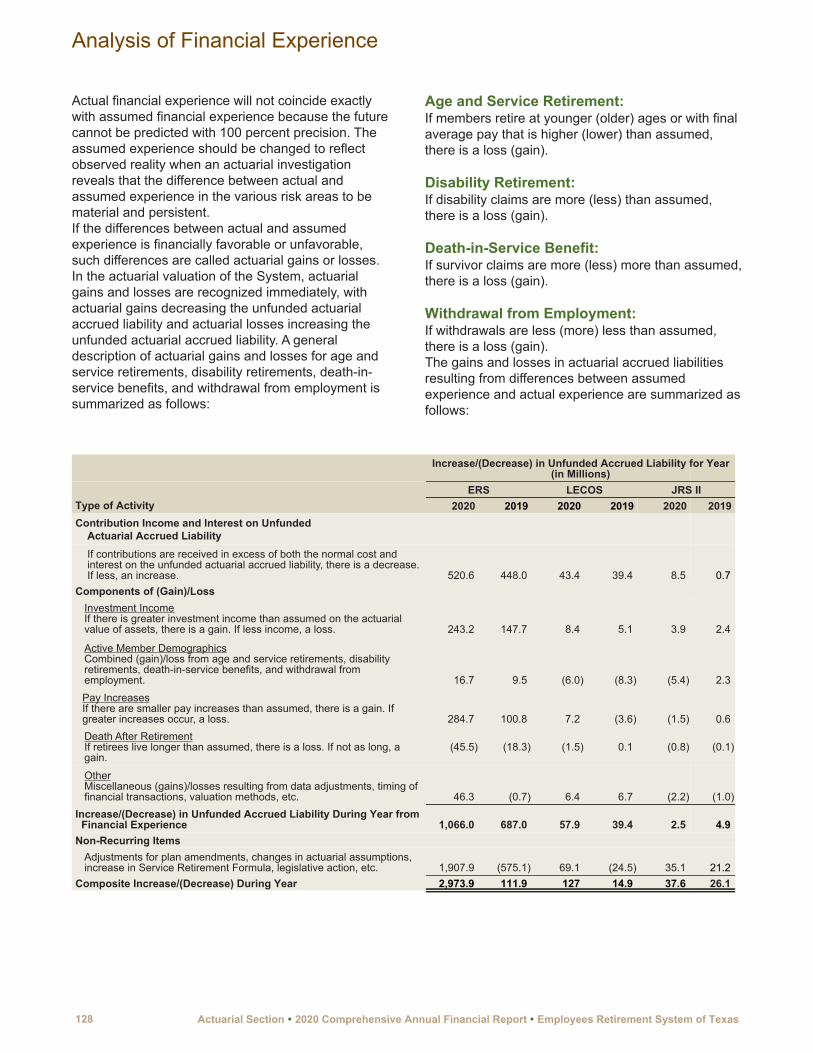
Actual financial experience will not coincide exactly with assumed financial experience because the future cannot be predicted with 100 percent precision. The assumed experience should be changed to reflect observed reality when an actuarial investigation reveals that the difference between actual and assumed experience in the various risk areas to be material and persistent.If the differences between actual and assumed experience is financially favorable or unfavorable, such differences are called actuarial gains or losses. In the actuarial valuation of the System, actuarial gains and losses are recognized immediately, with actuarial gains decreasing the unfunded actuarial accrued liability and actuarial losses increasing the unfunded actuarial accrued liability. A general description of actuarial gains and losses for age and service retirements, disability retirements, death-in-service benefits, and withdrawal from employment is summarized as follows:
Age and Service Retirement:If members retire at younger (older) ages or with final average pay that is higher (lower) than assumed, there is a loss (gain).
Disability Retirement:If disability claims are more (less) than assumed, there is a loss (gain).
Death-in-Service Benefit:If survivor claims are more (less) more than assumed, there is a loss (gain).
Withdrawal from Employment:If withdrawals are less (more) less than assumed, there is a loss (gain).The gains and losses in actuarial accrued liabilities resulting from differences between assumed experience and actual experience are summarized as follows:
Type of Activity
Increase/(Decrease) in Unfunded Accrued Liability for Year (in Millions)
ERS LECOS JRS II2020 2019 2020 2019 2020 2019
Contribution Income and Interest on UnfundedActuarial Accrued LiabilityIf contributions are received in excess of both the normal cost and interest on the unfunded actuarial accrued liability, there is a decrease. If less, an increase. 520.6 448.0 43.4 39.4 8.5 0.7
Components of (Gain)/LossInvestment IncomeIf there is greater investment income than assumed on the actuarial value of assets, there is a gain. If less income, a loss. 243.2 147.7 8.4 5.1 3.9 2.4
Active Member DemographicsCombined (gain)/loss from age and service retirements, disability retirements, death-in-service benefits, and withdrawal from employment. 16.7 9.5 (6.0) (8.3) (5.4) 2.3 Pay IncreasesIf there are smaller pay increases than assumed, there is a gain. If greater increases occur, a loss. 284.7 100.8 7.2 (3.6) (1.5) 0.6 Death After RetirementIf retirees live longer than assumed, there is a loss. If not as long, a gain.
(45.5) (18.3) (1.5) 0.1 (0.8) (0.1)
OtherMiscellaneous (gains)/losses resulting from data adjustments, timing of financial transactions, valuation methods, etc. 46.3 (0.7) 6.4 6.7 (2.2) (1.0)
Increase/(Decrease) in Unfunded Accrued Liability During Year from Financial Experience 1,066.0 687.0 57.9 39.4 2.5 4.9
Non-Recurring ItemsAdjustments for plan amendments, changes in actuarial assumptions, increase in Service Retirement Formula, legislative action, etc. 1,907.9 (575.1) 69.1 (24.5) 35.1 21.2
Composite Increase/(Decrease) During Year 2,973.9 111.9 127 14.9 37.6 26.1
Analysis of Financial Experience
128 Actuarial Section � 2020 Comprehensive Annual Financial Report � Employees Retirement System of Texas
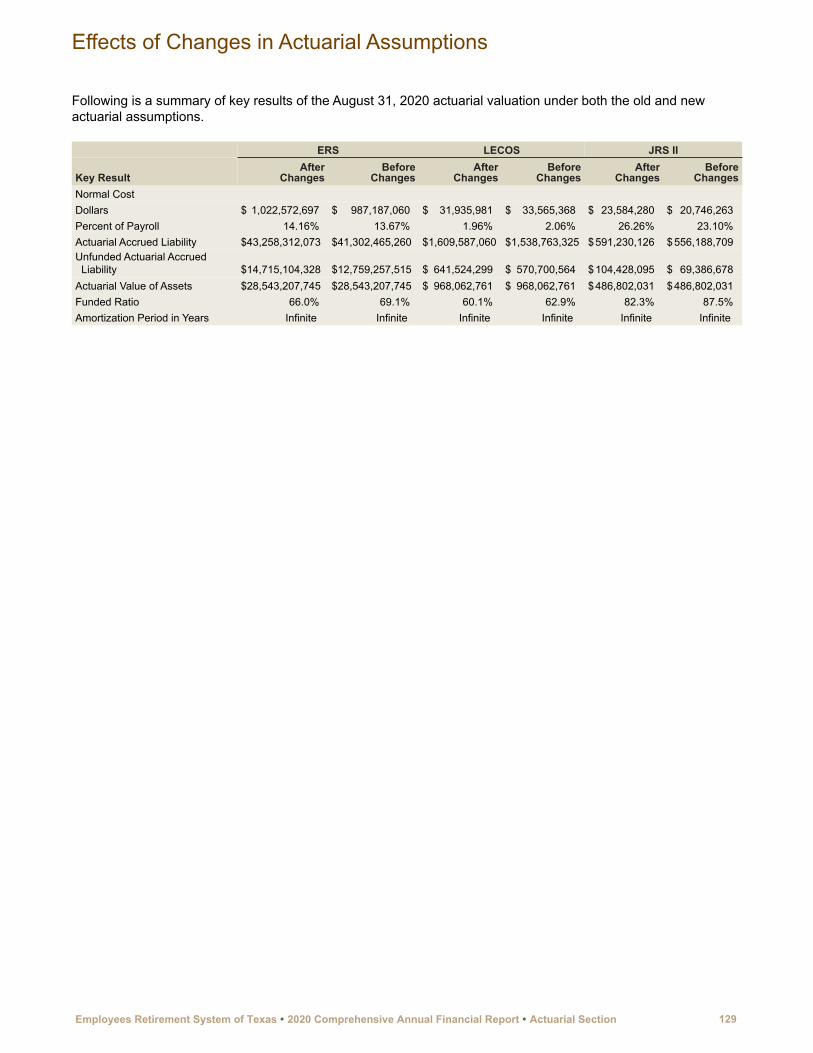
Following is a summary of key results of the August 31, 2020 actuarial valuation under both the old and new actuarial assumptions.
ERS LECOS JRS II
Key ResultAfter
ChangesBefore
ChangesAfter
ChangesBefore
ChangesAfter
ChangesBefore
ChangesNormal CostDollars $ 1,022,572,697 $ 987,187,060 $ 31,935,981 $ 33,565,368 $ 23,584,280 $ 20,746,263 Percent of Payroll 14.16 % 13.67 % 1.96 % 2.06 % 26.26 % 23.10 %Actuarial Accrued Liability $ 43,258,312,073 $ 41,302,465,260 $ 1,609,587,060 $ 1,538,763,325 $ 591,230,126 $ 556,188,709 Unfunded Actuarial Accrued
Liability $ 14,715,104,328 $ 12,759,257,515 $ 641,524,299 $ 570,700,564 $ 104,428,095 $ 69,386,678 Actuarial Value of Assets $ 28,543,207,745 $ 28,543,207,745 $ 968,062,761 $ 968,062,761 $ 486,802,031 $ 486,802,031 Funded Ratio 66.0 % 69.1 % 60.1 % 62.9 % 82.3 % 87.5 %Amortization Period in Years Infinite Infinite Infinite Infinite Infinite Infinite
Effects of Changes in Actuarial Assumptions
Employees Retirement System of Texas � 2020 Comprehensive Annual Financial Report � Actuarial Section 129

Effects of Changes in Actuarial Assumptions
130 Actuarial Section � 2020 Comprehensive Annual Financial Report � Employees Retirement System of Texas

EMPLOYEES RETIREMENT SYSTEM OF TEXASGROUP BENEFITS PROGRAM
FY19 GASB NO. 74 ACTUARIAL VALUATION
Summary of Results for FY2020
Actuarial Valuation Results as of August 31, 2020
($ thousands)As a % of
Payroll1. Number of Members (actual count, not in thousands)
a. Actives 232,367 b. Deferred Vested 12,317 c. Retirees and Nominees 130,910 d. Total Number of Members 375,594
2. Payroll of Active Members for FY2020 $12,655,247
3. Actuarial Present Value of Projected Benefit Paymentsa. Actives $38,171,488 b. Deferred Vested 2,081,191 c. Retirees and Nominees 13,124,846 d. Total $53,377,525 421.4 %
4. Total OPEB Liabilitya. Actives $17,943,542 b. Deferred Vested 2,081,191 c. Retirees and Nominees 13,124,846 d. Total $33,149,579 261.7 %
5. Fiduciary Net Position $104,947 0.8 %
6. Net OPEB Liability [4.d - 5] $33,044,632 260.9 %
7. Actuarially Determined Contribution for FYE August 31, 2020a. Normal Cost $1,564,918 12.4 %b. Amortization of Net OPEB Liability 1,025,319 8.1 %c. Total ADC for FYE August 31, 2020 $2,590,236 1 20.5 %
1 Adjusted due to rounding error caused by rounding individual components.
RUDD AND WISDOM, INC. II-3 NOVEMBER 2020
Actuarial Valuation Results – State Retiree Health Plan
Employees Retirement System of Texas � 2020 Comprehensive Annual Financial Report � Actuarial Section 131
Consistency with Assumptions Used forRetirement Plan ValuationsMost of the employees and retirees covered by the Group Benefits Program are also covered by either the System or Teacher Retirement System (TRS) retirement plans that are subject to periodic actuarial valuations. Where appropriate, assumptions were utilized that were previously adopted by the System and TRS Boards for use in performing the retirement plan valuations. However, certain aspects of the OPEB valuation process require the use of assumptions that are unique to OPEB; for example, the discount rate assumption and the health benefit cost trend assumption as discussed below.
Actuarial Cost MethodThe Entry Age Normal Actuarial Cost Method was used for the actuarial valuation. Actuarial gains and losses resulting from differences between actual and assumed experience are recognized as they occur each year. These gains or losses increase or decrease the unfunded actuarial accrued liability. Unfunded net OPEB liability is amortized over 30 years as a level percentage of projected payroll.
Changes in Actuarial AssumptionsSince the last valuation was prepared for this plan, demographic assumptions (including rates of preretirement and post-disability mortality for all State Agency members; assumed rates of termination and retirement for certain members who are Certified Peace Officers/Custodial Officers (CPO/CO); and assumed salary, aggregate payroll increases and the assumed rate of general inflation) have been updated to reflect assumptions recently adopted by the ERS Trustees. These new assumptions were adopted to reflect an experience study on the ERS retirement plan performed by the ERS retirement plan actuary.
Assumed Per Capita Health Benefit Costs and assumed Health Benefit Cost and Retiree Contribution trends have been updated to reflect recent experience and its effects on our short-term expectations. Furthermore, (a) the percentage of current retirees and their spouses not yet eligible to participate in the HealthSelect Medicare Advantage Plan and future retirees and their spouses who will elect to participate in the plan at the earliest date at which coverage can commence, (b) the percentage of future female retirees assumed to be married and electing coverage for their spouse and (c) the proportion of future retirees assumed to cover dependent children have been updated to reflect recent plan experience and expected trends.
Moreover, the PCORI fees payable under the ACA have been updated to reflect IRS Notice 2020-44.
The discount rate was changed from 2.97% as of August 31, 2019 to 2.20% as of August 31, 2020 as a result of requirements by GASB No. 74 to utilize the yield or index rate for 20-year, tax-exempt general obligation municipal bonds rated AA/Aa (or equivalent) or higher in effect on the measurement date.
Discount Rate AssumptionsIn accordance with Paragraph No. 48 of GASB No. 74, the discount rate should be the single rate that reflects the following:
(a) the long-term expected rate of return on OPEB plan investments that are expected to be used to finance the payment of benefits, to the extent that (i) the OPEB plan’s fiduciary net position (i.e., plan assets) is projected to be sufficient to make projected benefit payments and (ii) OPEB plan assets are expected to be invested using a strategy to achieve that return, and
(b) a yield or index rate for 20-year, tax-exempt general obligation municipal bonds with an average rating of AA/Aa or higher (or equivalent quality on another rating scale), to the extent that the conditions in (a) are not met.
For each future period, if the amount of the OPEB plan’s fiduciary net position is projected to be greater than or equal to the benefit payments that are projected to be made in that period and OPEB plan assets up to that point are expected to be invested using a strategy to achieve the long-term expected rate of return, the actuarial present value of benefit payments projected to be made in the period should be determined using the long-term expected rate of return on those investments. Per Paragraph No. 52 of GASB No. 74, the long-term expected rate of return should be based on the nature and mix of current and expected OPEB plan investments over a period representative of the expected length of time between (1) the point at which a plan member begins to provide service to the employer and (2) the point at which all benefits to the plan member have been paid. For this purpose, the long-term expected rate of return should be determined net of OPEB plan investment expense but without reduction for OPEB plan administrative expense. The municipal bond rate discussed in (b) above should be used to calculate the actuarial present value of all other benefit payments. The discount rate is the single rate of return that, when applied to all projected benefit payments, results in an actuarial present value of projected benefit payments equal to the total of the
Summary of Actuarial Methods and Assumptions – State Retiree Health Plan
132 Actuarial Section � 2020 Comprehensive Annual Financial Report � Employees Retirement System of Texas

actuarial present values determined using the long-term rate of return and the municipal bond rate applied to the appropriate periods as described above.
For this plan, the amount that the participating employers contribute to the OPEB plan each year is limited to the anticipated cost of providing benefits incurred during that year. As a result, the GBP is not expected to accumulate funds. (Although there are some accumulated funds as of August 31, 2020, such funds provide less than a full year’s benefit payments and are expected to be depleted shortly.) Since no plan assets are expected to accumulate, the discount rate assumption must be based solely on the municipal bond rate discussed in (b) above. The assumed discount rate for the fiscal year ending August 31, 2020 is 2.20% based upon the Bond Buyer Index of general obligation bonds with 20 years to maturity with an average credit quality that is roughly equivalent to Moody’s Investors Service’s Aa2 rating and Standard & Poor’s Corp.’s AA rating.
Health Benefit Cost TrendFor purposes of this valuation, the health benefit cost trend represents the expected annual rate of increase in health benefit costs, excluding the effects of changes in demographics and changes in plan provisions.
The health benefit cost trend has exceeded the rate of price increases in the general economy, as measured by changes in the Consumer Price Index (CPI), for many decades. Although this pattern is expected to continue for the foreseeable future, many economists anticipate that the degree to which the health benefit cost trend exceeds general inflation will eventually abate. These economists believe that the health benefit cost trend will reach an ultimate level that still exceeds general inflation, but not by as wide a margin as in past decades.
The health benefit cost trend assumption used in this report begins with our short term expectations of expected health benefit cost increases in the next year and gradually declines to a rate that exceeds the assumed rate of general price inflation by 2.0%.
Changes in Plan ProvisionsUnder Q/A #4.107 of GASB’s Implementation Guide No. 2017-2, Financial Reporting for Postemployment Benefit Plans Other Than Pension Plans, any plan changes that have been adopted and communicated to plan members by the time the valuation is prepared must be included in the valuation. Accordingly, this valuation reflects the benefit changes that will become effective January 1, 2021, since these
changes were communicated to plan members in advance of the preparation of this report. These changes, which are not expected to have a significant impact on plan costs for Fiscal Year 2021, are provided for in the Fiscal Year 2021 Assumed Per Capita Health Benefit Costs. There are no benefit changes for HealthSelect retirees and dependents for whom Medicare is Primary.
High-Cost Plan Excise Tax and Health Insurance Providers FeeConsistent with the prior valuation, the effects of the High-Cost Plan Excise Tax imposed by the ACA under Internal Revenue Code Section 4980I (sometimes referred to as the “Cadillac Tax”) have been included in the Net OPEB Liability as of the August 31, 2019 measurement date presented in this report. The Net OPEB Liability as of August 31, 2019 is increased by the $251 million present value of the estimated Excise Taxes in future years. The Cadillac Tax provisions of the ACA were repealed by the Further Consolidated Appropriations Act, 2020 which was signed into law on December 20, 2019. Due to the repeal of these provisions, the Net OPEB Liability as of August 31, 2020 presented in this report is not adjusted for the Cadillac Tax provisions of the ACA.
Consistent with the prior valuation, the effects of the Health Insurance Providers Fee imposed by Section 9010 of the ACA (sometimes referred to as the “HIP Fee”) on fully insured health plans have been included in the Net OPEB Liability as of the August 31, 2019 measurement date presented in this report. The HIP Fee provisions of the ACA were also repealed by the Further Consolidated Appropriations Act, 2020. Due to the repeal of these provisions, the Net OPEB Liability as of August 31, 2020 presented in this report does not include provision for the HIP Fee.
Medicare Part DThe Medicare Prescription Drug Improvement and Modernization Act of 2003 introduced a prescription drug benefit under Medicare (Medicare Part D) as well as a federal subsidy, the Retiree Drug Subsidy (RDS), to sponsors of retiree healthcare benefit plans that provide a prescription drug benefit that is at least actuarially equivalent to the basic coverage provided under Medicare Part D.
For purposes of GASB No. 74, the valuation of future OPEB may not reflect the anticipated receipt of future RDS payments as required under GASB Technical Bulletin No. 2006-1. The Bulletin requires that the RDS payments to an employer be reported by the employer as revenue, rather than being netted
Summary of Actuarial Methods and Assumptions – State Retiree Health Plan (Continued)
Employees Retirement System of Texas � 2020 Comprehensive Annual Financial Report � Actuarial Section 133

against the employer’s OPEB cost for prescription drug coverage.
ERS implemented an Employer Group Waiver Plan plus Commercial Wrap (EGWP plus Wrap) on January 1, 2013 in order to provide the plan with the benefit of increased subsidies and discounts available under such an arrangement. ERS is no longer eligible for the RDS for retirees enrolled in the EGWP plus Wrap. As a result, the RDS has been significantly reduced.
The projected cost of the EGWP plus Wrap reflects the subsidies which are expected to be provided by the Federal government under Medicare Part D and the discounts expected to be provided by drug manufacturers as required under the ACA.
Economic Assumptions
Administrative ExpensesThe expenses to directly related to the payment of BP health benefits are $180.24 for medical for HealthSelect plus $9.00 for prescription drugs for HealthSelect and HealthSelect Medicare Advantage per year per covered member for fiscal year 2021.The expenses per covered member are the same regardless of whether the member covers dependents.
Stop-loss ReinsuranceStop-loss reinsurance is not purchased for the Group Benefits Program.
Discount RateEqual to the municipal bond rate of 2.20%.
Health Benefit Cost TrendThe Annual Rate of Increase in Per Capita Health Benefit Cost assumptions are shown below.
Annual Rate of Increase
Fiscal Year HealthSelectHealthSelect
Medicare% %
2022 8.80 (53.30)2023 5.25 0.002024 5.00 66.672025 4.75 24.002026 4.60 4.602027 4.50 4.502028 4.40 4.40
2029 and beyond 4.30 4.30
Trend Rate for Retiree ContributionsThe portions of retiree contributions attributable to
non-life insurance benefits for both HealthSelect and HealthSelect Medicare Advantage Plan are assumed to increase from their amounts in fiscal year 2021 at the rates shown below.
Annual Rate of Increase
Fiscal Year HealthSelectHealthSelect
Medicare% %
2022 0.00 0.002023 0.00 0.002024 6.30 27.452025 5.80 13.102026 5.40 6.252027 5.00 5.502028 4.60 4.80
2029 and beyond 4.30 4.30
Expense Trend RateThe expenses directly related to the payment of GBP Health benefits are contractually guaranteed at the current rate through fiscal year 2023. They are assumed to increase 2.30% per annum thereafter.
Trend Rate for the Opt-Out CreditThe monthly benefit of $60 in fiscal year 2021 is not assumed to increase in the future.
Health Coverage by Governmental Plans There has been no consideration of anticipated changes in laws concerning health costs covered by governmental programs. However, presently enacted changes in the law that take effect in future periods that will affect future benefit coverages are considered. The proportion of health benefits which are currently covered by governmental programs has been assumed to remain constant in the future.
Summary of Actuarial Methods and Assumptions – State Retiree Health Plan (Concluded)
134 Actuarial Section � 2020 Comprehensive Annual Financial Report � Employees Retirement System of Texas
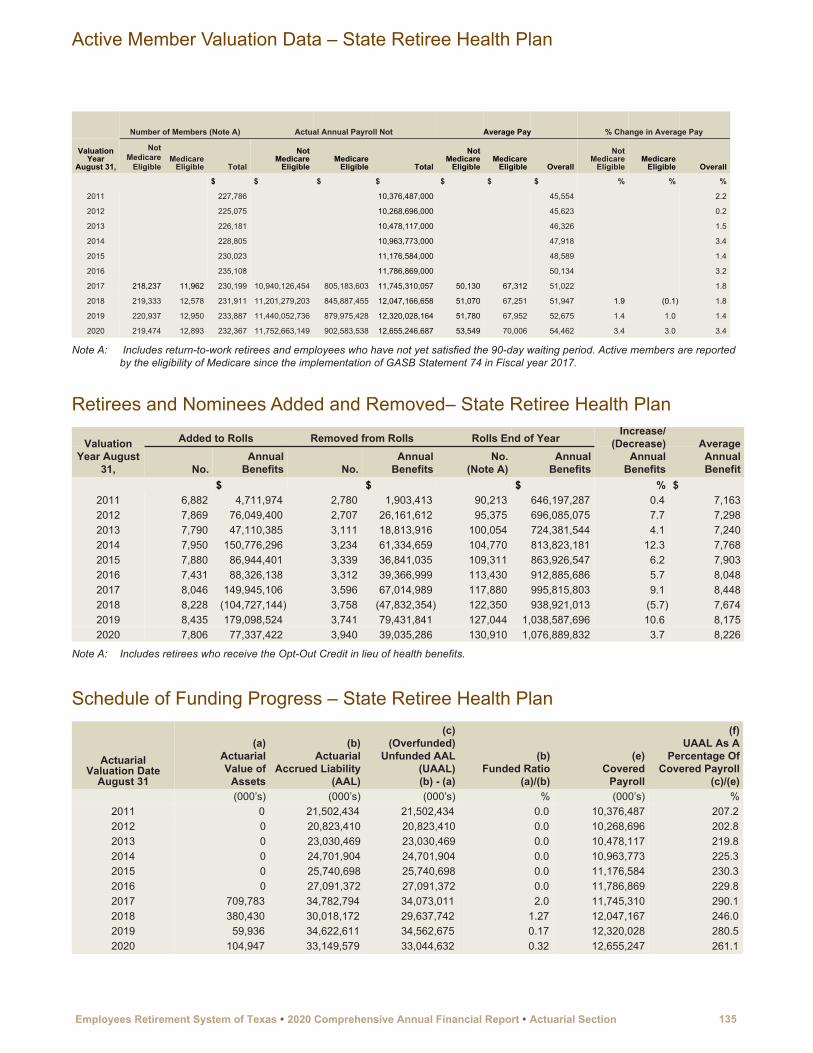
Number of Members (Note A) Actual Annual Payroll Not Average Pay % Change in Average Pay
Valuation Year
August 31,
NotMedicare
EligibleMedicare
Eligible Total
NotMedicare
EligibleMedicare
Eligible Total
NotMedicare
EligibleMedicare
Eligible Overall
NotMedicare
EligibleMedicare
Eligible Overall
$ $ $ $ $ $ $ % % %
2011 227,786 10,376,487,000 45,554 2.2
2012 225,075 10,268,696,000 45,623 0.2
2013 226,181 10,478,117,000 46,326 1.5
2014 228,805 10,963,773,000 47,918 3.4
2015 230,023 11,176,584,000 48,589 1.4
2016 235,108 11,786,869,000 50,134 3.2
2017 218,237 11,962 230,199 10,940,126,454 805,183,603 11,745,310,057 50,130 67,312 51,022 1.8
2018 219,333 12,578 231,911 11,201,279,203 845,887,455 12,047,166,658 51,070 67,251 51,947 1.9 (0.1) 1.8
2019 220,937 12,950 233,887 11,440,052,736 879,975,428 12,320,028,164 51,780 67,952 52,675 1.4 1.0 1.4
2020 219,474 12,893 232,367 11,752,663,149 902,583,538 12,655,246,687 53,549 70,006 54,462 3.4 3.0 3.4
Note A: Includes return-to-work retirees and employees who have not yet satisfied the 90-day waiting period. Active members are reported by the eligibility of Medicare since the implementation of GASB Statement 74 in Fiscal year 2017.
Retirees and Nominees Added and Removed– State Retiree Health Plan
Valuation Year August
31,
Added to Rolls Removed from Rolls Rolls End of YearIncrease/
(Decrease)Annual
Benefits
Average Annual BenefitNo.
AnnualBenefits No.
AnnualBenefits
No.(Note A)
AnnualBenefits
$ $ $ % $2011 6,882 4,711,974 2,780 1,903,413 90,213 646,197,287 0.4 7,1632012 7,869 76,049,400 2,707 26,161,612 95,375 696,085,075 7.7 7,2982013 7,790 47,110,385 3,111 18,813,916 100,054 724,381,544 4.1 7,2402014 7,950 150,776,296 3,234 61,334,659 104,770 813,823,181 12.3 7,7682015 7,880 86,944,401 3,339 36,841,035 109,311 863,926,547 6.2 7,9032016 7,431 88,326,138 3,312 39,366,999 113,430 912,885,686 5.7 8,0482017 8,046 149,945,106 3,596 67,014,989 117,880 995,815,803 9.1 8,4482018 8,228 (104,727,144) 3,758 (47,832,354) 122,350 938,921,013 (5.7) 7,6742019 8,435 179,098,524 3,741 79,431,841 127,044 1,038,587,696 10.6 8,1752020 7,806 77,337,422 3,940 39,035,286 130,910 1,076,889,832 3.7 8,226
Note A: Includes retirees who receive the Opt-Out Credit in lieu of health benefits.
Schedule of Funding Progress – State Retiree Health Plan
Actuarial Valuation Date
August 31
(a)Actuarial Value of
Assets
(b)Actuarial
Accrued Liability(AAL)
(c)(Overfunded)
Unfunded AAL(UAAL)(b) - (a)
(b)Funded Ratio
(a)/(b)
(e)Covered
Payroll
(f)UAAL As A
Percentage Of Covered Payroll
(c)/(e)(000’s) (000’s) (000’s) % (000’s) %
2011 0 21,502,434 21,502,434 0.0 10,376,487 207.2 2012 0 20,823,410 20,823,410 0.0 10,268,696 202.8 2013 0 23,030,469 23,030,469 0.0 10,478,117 219.8 2014 0 24,701,904 24,701,904 0.0 10,963,773 225.3 2015 0 25,740,698 25,740,698 0.0 11,176,584 230.3 2016 0 27,091,372 27,091,372 0.0 11,786,869 229.8 2017 709,783 34,782,794 34,073,011 2.0 11,745,310 290.1 2018 380,430 30,018,172 29,637,742 1.27 12,047,167 246.0 2019 59,936 34,622,611 34,562,675 0.17 12,320,028 280.5 2020 104,947 33,149,579 33,044,632 0.32 12,655,247 261.1
Active Member Valuation Data – State Retiree Health Plan
Employees Retirement System of Texas � 2020 Comprehensive Annual Financial Report � Actuarial Section 135

136 Actuarial Section � 2020 Comprehensive Annual Financial Report � Employees Retirement System of Texas

STATISTICAL SECTION
Summary of Statistical Section
Governmental Activities:
Net Position
Changes in Net Position
Governmental Funds:
Fund Balances
Changes in Fund Balances
Changes in Net Position:
Proprietary Fund
Defined Benefit Plans
Deferred Compensation Plan and Cafeteria Plan
Benefit and Refund Payments — Defined Benefit Plans
Average Benefit Payments — Employee Class
Retired Members by Type of Benefit
Contribution Rates
Other Statistical Information:
Defined Benefit Plans
Other Programs
List of Participating Reporting Entities for State Retiree Health Plan
137

138 Statistical Section � 2020 Comprehensive Annual Financial Report � Employees Retirement System of Texas

This section contains additional historical perspective, context, and detail to assist financial statement users in understanding the System’s economic condition and benefit offerings.
Financial TrendsThe following statistical information provides trends to assist in understanding changes over time in financial performance of the benefit offerings:
• Net Position – Governmental Activities• Changes in Net Position – Governmental Activities• Fund Balances – Governmental Funds• Changes in Fund Balances – Governmental Funds• Changes in Net Position – Proprietary Fund• Changes in Net Position – Defined Benefit Plans• Changes in Net Position – Deferred Compensation Plans and Cafeteria Plan
Operating InformationThe following statistical information provides benefit and member data to assist in understanding of the System’s operations and benefit offerings:
• Benefit and Refund Payments – Defined Benefit Plans• Average Benefit Payments – Employee Class• Retired Members by Type of Benefit• Contribution Rates• Other Information: Defined Benefit Plans• Other Information: Other Programs• List of Participating Reporting Entities for State Retiree Health Plan
Employees Retirement System of Texas � 2020 Comprehensive Annual Financial Report �Statistical Section 139

This schedule provides ten year trend information for restricted and unrestricted assets. The information source of this schedule is Exhibit I.
Fiscal Year2011 2012 2013 2014 2015 2016 2017 2018 2019 2020
Governmental Activities: $ $ $ $ $ $ $ $ $ $Restricted 227,985 284,814 325,412 379,311 440,466 498,874 87,945 1,060,687 2,033,429 2,591,955 Unrestricted 8 18 — 5000 17 22 4 25 4 1 Total Governmental Activities 227,993 284,832 325,412 379,316 440,483 498,896 87,949 1,060,712 2,033,433 2,591,956
Changes in Net Position – Governmental ActivitiesLast Ten Fiscal Years (in 000’s)(Accrual Basis of Accounting)
This schedule provides trend information for the last ten fiscal years for expenses, program revenues, general revenues, and net revenues. The information source of this schedule is Exhibits II and VI.
Fiscal Year (Note A)2011 2012 2013 2014 2015 2016 2017 2018 2019 2020
Expenses $ $ $ $ $ $ $ $ $ $Governmental Activities:
Social Security Administration 102 105 92 156 178 139 152 85 94 117 Judicial Retirement System Plan I 19,941 Death Benefits:
Peace Officers, Firemen, etc. 2,784 2,141 5,444 5,738 2,162 7,281 8,826 9,432 7,831 7,839 Compensation to Victims of Crime 1,750 1,000 2,000 1,625 1,000 2,000 3,500 4,905 2,000 3,500 Retiree $5,000 Lump Sum 7,885 8,628 9,108 8,846 9,286 10,080 10,893 10,167 9,811 9,696
Employees Life, Accident and Health Insurance and Benefits:
Claims Expenses 1,776,296 1,826,996 1,934,325 2,047,749 2,242,195 2,455,030 2,434,697 2,163,858 2,212,805 2,298,095 Administration 9,437 9,401 9,356 24,535 36,692 19,390 14,977 13,911 13,158 17,050
Total Expenses 1,798,254 1,848,271 1,960,325 2,088,649 2,291,513 2,493,920 2,473,045 2,202,358 2,245,699 2,356,238 Program RevenuesGovernmental Activities:
Charges for Services:Administration Fees 66 74 75 70 71 71 70 70 73 66 Appropriations:
Judicial Retirement System Plan I 19,941 Death Benefits:Peace Officers, Firemen, etc. 2,784 2,141 5,444 5,738 2,162 7,281 8,826 9,432 7,831 7,839 Compensation to Victims of Crime 1,750 1,000 2,000 1,625 1,000 2,000 3,500 4,905 2,000 3,500 Retiree $5,000 Lump Sum 7,885 8,628 9,108 8,846 9,289 10,075 10,893 10,167 9,811 9,696
Insurance Contributions:Employer 1,414,732 1,434,186 1,527,002 1,631,916 1,834,956 1,992,220 1,963,388 2,582,653 2,529,624 2,219,782 Member 444,731 444,786 460,944 482,566 495,723 521,361 562,140 559,111 562,373 545,585 Other 209 192 179 141 121 120 125 135 141 142
Operating Grants and Contributions:Investment Income 12,758 13,188 (5,885) 10,913 6,298 19,492 13,569 5,631 91,752 95,789 Other 4,688 875 2,039 647 2,945 1,386 1,782 2,981 14,815 12,374
Total Program Revenues 1,889,603 1,905,070 2,000,906 2,142,462 2,352,565 2,554,006 2,564,293 3,175,085 3,218,420 2,914,714 General Revenues
Transfers — 90 115 (1,673) 64 37 — 48Total General Revenues — 40 — 90 115 (1,673) 64 37 — 48Net Revenue Governmental Activities 91,349 56,839 40,581 53,903 61,167 58,413 91,312 972,764 972,721 558,523
Note A: Because of the implementation of GASB Statement 84 Fiduciary Activities, Judicial Retirement System Plan I is reclassified from an Agency Fund to a General Fund beginning in fiscal year 2020.
Net Position – Governmental ActivitiesLast Ten Fiscal Years (in 000’s)(Accrual Basis of Accounting)
140 Statistical Section � 2020 Comprehensive Annual Financial Report � Employees Retirement System of Texas
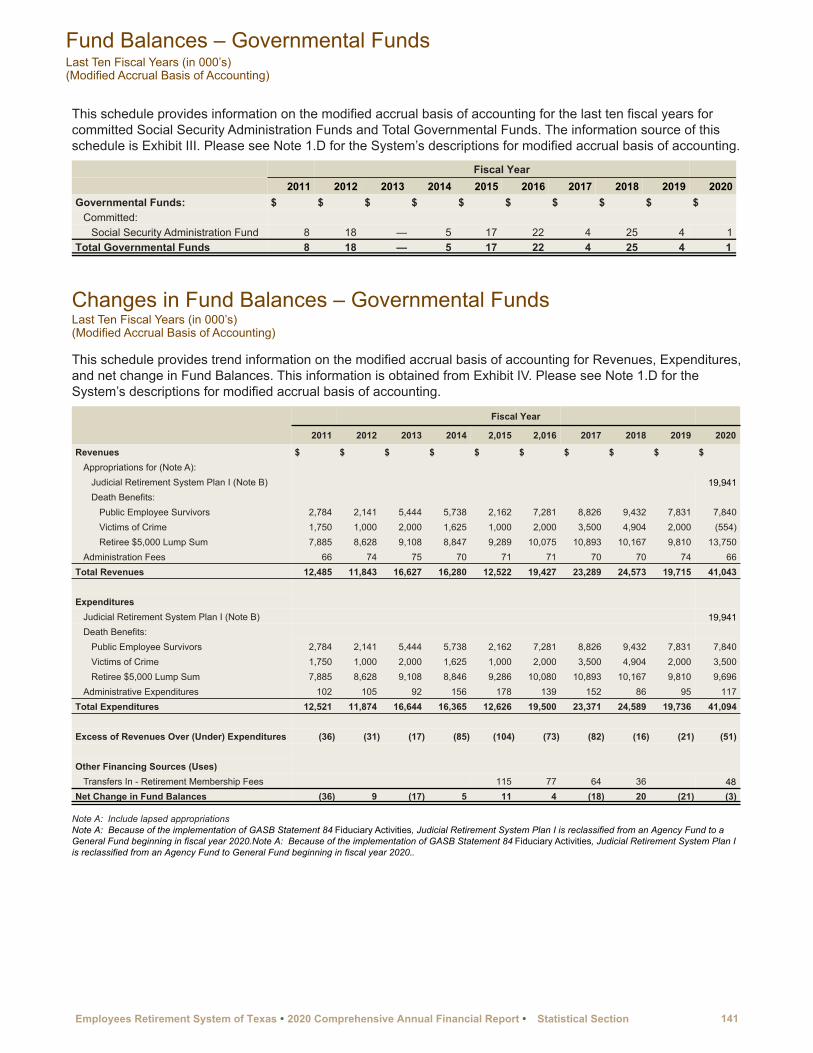
This schedule provides information on the modified accrual basis of accounting for the last ten fiscal years for committed Social Security Administration Funds and Total Governmental Funds. The information source of this schedule is Exhibit III. Please see Note 1.D for the System’s descriptions for modified accrual basis of accounting.
Fiscal Year2011 2012 2013 2014 2015 2016 2017 2018 2019 2020
Governmental Funds: $ $ $ $ $ $ $ $ $ $Committed:
Social Security Administration Fund 8 18 — 5 17 22 4 25 4 1Total Governmental Funds 8 18 — 5 17 22 4 25 4 1
Changes in Fund Balances – Governmental FundsLast Ten Fiscal Years (in 000’s)(Modified Accrual Basis of Accounting)
This schedule provides trend information on the modified accrual basis of accounting for Revenues, Expenditures, and net change in Fund Balances. This information is obtained from Exhibit IV. Please see Note 1.D for the System’s descriptions for modified accrual basis of accounting.
Fiscal Year
2011 2012 2013 2014 2,015 2,016 2017 2018 2019 2020
Revenues $ $ $ $ $ $ $ $ $ $Appropriations for (Note A):
Judicial Retirement System Plan I (Note B) 19,941Death Benefits:
Public Employee Survivors 2,784 2,141 5,444 5,738 2,162 7,281 8,826 9,432 7,831 7,840Victims of Crime 1,750 1,000 2,000 1,625 1,000 2,000 3,500 4,904 2,000 (554)Retiree $5,000 Lump Sum 7,885 8,628 9,108 8,847 9,289 10,075 10,893 10,167 9,810 13,750
Administration Fees 66 74 75 70 71 71 70 70 74 66Total Revenues 12,485 11,843 16,627 16,280 12,522 19,427 23,289 24,573 19,715 41,043
ExpendituresJudicial Retirement System Plan I (Note B) 19,941Death Benefits:
Public Employee Survivors 2,784 2,141 5,444 5,738 2,162 7,281 8,826 9,432 7,831 7,840Victims of Crime 1,750 1,000 2,000 1,625 1,000 2,000 3,500 4,904 2,000 3,500Retiree $5,000 Lump Sum 7,885 8,628 9,108 8,846 9,286 10,080 10,893 10,167 9,810 9,696
Administrative Expenditures 102 105 92 156 178 139 152 86 95 117Total Expenditures 12,521 11,874 16,644 16,365 12,626 19,500 23,371 24,589 19,736 41,094
Excess of Revenues Over (Under) Expenditures (36) (31) (17) (85) (104) (73) (82) (16) (21) (51)
Other Financing Sources (Uses)Transfers In - Retirement Membership Fees 115 77 64 36 48
Net Change in Fund Balances (36) 9 (17) 5 11 4 (18) 20 (21) (3)
Note A: Include lapsed appropriationsNote A: Because of the implementation of GASB Statement 84 Fiduciary Activities, Judicial Retirement System Plan I is reclassified from an Agency Fund to a General Fund beginning in fiscal year 2020.Note A: Because of the implementation of GASB Statement 84 Fiduciary Activities, Judicial Retirement System Plan I is reclassified from an Agency Fund to General Fund beginning in fiscal year 2020..
Fund Balances – Governmental FundsLast Ten Fiscal Years (in 000’s)(Modified Accrual Basis of Accounting)
Employees Retirement System of Texas � 2020 Comprehensive Annual Financial Report �Statistical Section 141

This schedule provides trend information on Operating Revenues, Operating Expenses and the resulting Operating Income or Loss. It also provides non-operating revenue and expense information and the resulting change in net position. The information source of this schedule is Exhibit VI.
Fiscal Year2011 2012 2013 2014 2015 2016 2017 2018 2019 2020
Operating Revenues $ $ $ $ $ $ $ $ $ $Insurance Contributions:
Employer 1,414,731 1,434,186 1,527,002 1,631,916 1,834,956 1,992,220 1,963,388 2,582,653 2,529,624 2,219,782 Member 444,731 444,786 460,944 482,566 495,723 521,360 562,140 559,111 562,373 545,585 Federal Revenues-COBRA Stimulus 1,312 27 Other 3,089 835 2,199 604 1,856 1,480 1,905 3,116 14,956 12,066
Total Operating Revenues 1,863,863 1,879,834 1,990,145 2,115,086 2,332,535 2,515,060 2,527,433 3,144,880 3,106,953 2,777,432
Operating ExpensesBenefit Payments:
Employee 1,743,897 1,792,645 1,900,026 2,017,586 2,213,193 2,428,066 2,408,452 2,141,516 2,186,649 2,269,293 COBRA 32,398 34,351 34,299 30,163 29,003 26,963 25,972 21,817 25,282 27,664 Health Savings Account 525 874 1,138
Administrative and Other Expenses 9,437 9,401 9,356 24,535 36,692 19,390 15,060 13,880 13,066 17,148 Total Operating Expenses 1,785,732 1,836,397 1,943,681 2,072,284 2,278,888 2,474,419 2,449,757 2,177,738 2,225,871 2,315,244
Operating Income (Loss) 78,131 43,437 46,464 42,802 53,647 40,641 77,676 967,142 881,082 462,189
Non-Operating Revenues (Expenses)Net Appreciation (Depreciation) in Fair
Value of Investments 4,273 5,395 (17,215) 1,284 (3,195) 7,771 (830) (15,417) 33,360 32,731 Investment Income 8,485 7,794 11,331 9,629 9,493 11,721 14,482 21,017 58,300 63,156 Other 496 204 18 184 1,210 25 1 Total Non-Operating Revenues (Expenses) 13,254 13,393 (5,866) 11,097 7,508 19,517 13,653 5,600 91,660 96,337
Transfer Out (1,750)
Change in Net Position 91,385 56,830 40,598 53,899 61,155 58,408 91,329 972,742 972,742 558,526
Changes in Net Position – Proprietary FundLast Ten Fiscal Years (in 000’s)
142 Statistical Section � 2020 Comprehensive Annual Financial Report � Employees Retirement System of Texas
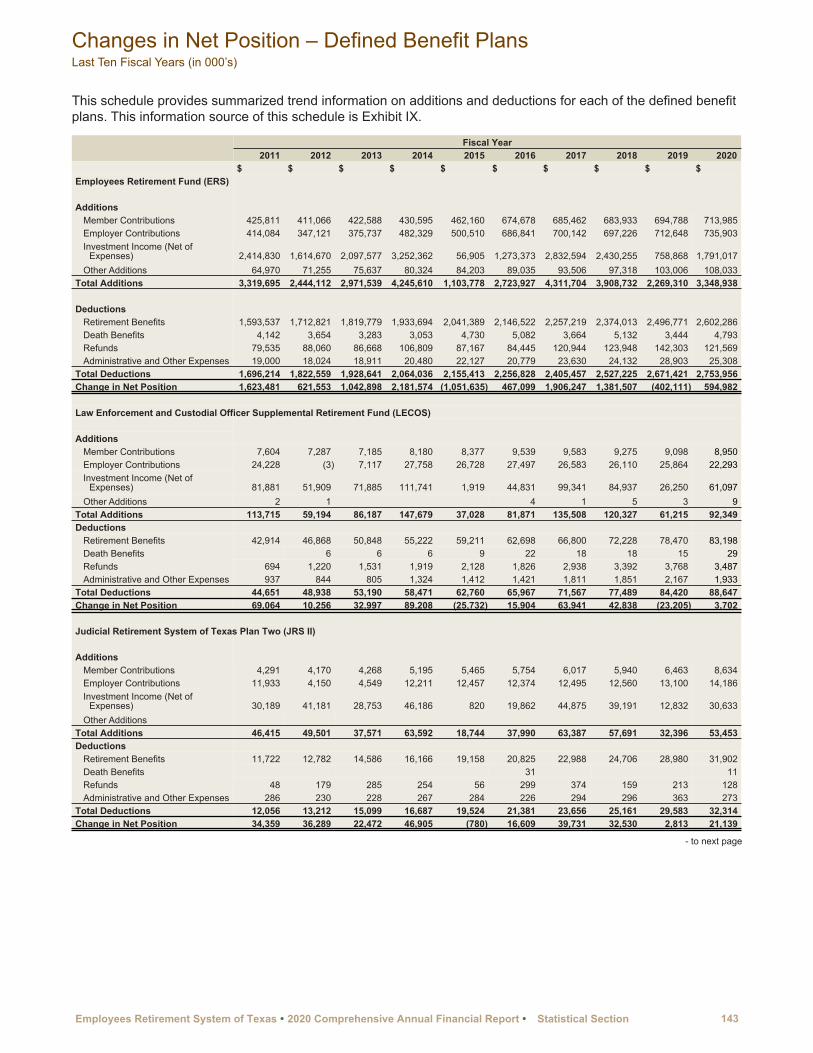
This schedule provides summarized trend information on additions and deductions for each of the defined benefit plans. This information source of this schedule is Exhibit IX.
Fiscal Year 2011 2012 2013 2014 2015 2016 2017 2018 2019 2020 $ $ $ $ $ $ $ $ $ $
Employees Retirement Fund (ERS)
AdditionsMember Contributions 425,811 411,066 422,588 430,595 462,160 674,678 685,462 683,933 694,788 713,985Employer Contributions 414,084 347,121 375,737 482,329 500,510 686,841 700,142 697,226 712,648 735,903Investment Income (Net of
Expenses) 2,414,830 1,614,670 2,097,577 3,252,362 56,905 1,273,373 2,832,594 2,430,255 758,868 1,791,017Other Additions 64,970 71,255 75,637 80,324 84,203 89,035 93,506 97,318 103,006 108,033
Total Additions 3,319,695 2,444,112 2,971,539 4,245,610 1,103,778 2,723,927 4,311,704 3,908,732 2,269,310 3,348,938
DeductionsRetirement Benefits 1,593,537 1,712,821 1,819,779 1,933,694 2,041,389 2,146,522 2,257,219 2,374,013 2,496,771 2,602,286Death Benefits 4,142 3,654 3,283 3,053 4,730 5,082 3,664 5,132 3,444 4,793Refunds 79,535 88,060 86,668 106,809 87,167 84,445 120,944 123,948 142,303 121,569Administrative and Other Expenses 19,000 18,024 18,911 20,480 22,127 20,779 23,630 24,132 28,903 25,308
Total Deductions 1,696,214 1,822,559 1,928,641 2,064,036 2,155,413 2,256,828 2,405,457 2,527,225 2,671,421 2,753,956Change in Net Position 1,623,481 621,553 1,042,898 2,181,574 (1,051,635) 467,099 1,906,247 1,381,507 (402,111) 594,982
Law Enforcement and Custodial Officer Supplemental Retirement Fund (LECOS)
AdditionsMember Contributions 7,604 7,287 7,185 8,180 8,377 9,539 9,583 9,275 9,098 8,950Employer Contributions 24,228 (3) 7,117 27,758 26,728 27,497 26,583 26,110 25,864 22,293Investment Income (Net of
Expenses) 81,881 51,909 71,885 111,741 1,919 44,831 99,341 84,937 26,250 61,097Other Additions 2 1 4 1 5 3 9
Total Additions 113,715 59,194 86,187 147,679 37,028 81,871 135,508 120,327 61,215 92,349Deductions
Retirement Benefits 42,914 46,868 50,848 55,222 59,211 62,698 66,800 72,228 78,470 83,198Death Benefits 6 6 6 9 22 18 18 15 29Refunds 694 1,220 1,531 1,919 2,128 1,826 2,938 3,392 3,768 3,487Administrative and Other Expenses 937 844 805 1,324 1,412 1,421 1,811 1,851 2,167 1,933
Total Deductions 44,651 48,938 53,190 58,471 62,760 65,967 71,567 77,489 84,420 88,647Change in Net Position 69,064 10,256 32,997 89,208 (25,732) 15,904 63,941 42,838 (23,205) 3,702
Judicial Retirement System of Texas Plan Two (JRS II)
AdditionsMember Contributions 4,291 4,170 4,268 5,195 5,465 5,754 6,017 5,940 6,463 8,634Employer Contributions 11,933 4,150 4,549 12,211 12,457 12,374 12,495 12,560 13,100 14,186Investment Income (Net of
Expenses) 30,189 41,181 28,753 46,186 820 19,862 44,875 39,191 12,832 30,633Other Additions
Total Additions 46,415 49,501 37,571 63,592 18,744 37,990 63,387 57,691 32,396 53,453Deductions
Retirement Benefits 11,722 12,782 14,586 16,166 19,158 20,825 22,988 24,706 28,980 31,902Death Benefits 31 11Refunds 48 179 285 254 56 299 374 159 213 128Administrative and Other Expenses 286 230 228 267 284 226 294 296 363 273
Total Deductions 12,056 13,212 15,099 16,687 19,524 21,381 23,656 25,161 29,583 32,314Change in Net Position 34,359 36,289 22,472 46,905 (780) 16,609 39,731 32,530 2,813 21,139
- to next page
Changes in Net Position – Defined Benefit Plans Last Ten Fiscal Years (in 000’s)
Employees Retirement System of Texas � 2020 Comprehensive Annual Financial Report �Statistical Section 143

Fiscal Year 2011 2012 2013 2014 2015 2016 2017 2018 2019 2020 $ $ $ $ $ $ $ $ $ $
Excess Benefit ArrangementAdditionsOther Additions 342 506 569 493 457 540 746 817 953 1,324
Total Additions 342 506 569 493 457 540 746 817 953 1,324
DeductionsRetirement Benefits 297 436 488 422 392 448 668 753 797 988 Administrative and Other Expenses 45 70 81 71 65 92 78 64 156 90
Total Deductions 342 506 569 493 457 540 746 817 953 1,078 Change in Net Position — — — — — — — — — 246
State Retiree Health Plan
AdditionsMember Contributions 135,133 134,993 141,008 155,276 169,075 183,284 195,806 Employer Contributions 444,895 483,636 535,905 605,512 612,769 663,986 890,735 307,028 401,285 748,369 Non-Employer Contributing Entity
Contributions (Note A) N/A N/A N/A N/A N/A N/A 44,433 16,585 20,183 37,737 Federal Revenues 38,207 39,612 50,874 63,362 86,054 69,186 73,120 74,493 89,389 111,099 Early Retirees Reinsurance Program 40,724 Investment Income (Net of Expenses) 436 329 236 255 324 1,137 4,517 10,907 3,324 1,336 Other Additions 5,961 357 3,249 85 24
Total Additions 648,847 699,294 728,023 824,405 872,191 923,554 1,208,968 412,262 514,266 898,565
DeductionsHealthcare Benefits 646,197 696,085 724,381 813,823 863,926 912,886 995,815 938,921 1,038,588 1,076,890 Less: Payments from Members
(Note B) N/A N/A N/A N/A N/A N/A N/A (203,123) (209,837) (230,151) Administrative and Other Expenses 2,650 3,209 3,642 10,582 8,265 10,668 5,629 5,817 6,008 6,815
Total Deductions 648,847 699,294 728,023 824,405 872,191 923,554 1,001,444 741,615 834,759 853,554 Change in Net Position — — — — — — 207,524 (329,353) (320,493) 45,011
Note A:` To comply with the reporting requirements under GASB Statement 74, the System begins report the contributions from non-employer contributing entity in Fiscal Year 2017. These contributions are the portion of the insurance premiums that the State of Texas pays for the retirees from the junior and community colleges and were reported as part of the employer contributions before Fiscal Year 2017.
Note B: Beginning from fiscal year 2018, contributions from members are reported as payments from members to be in compliance with the reporting requirements under GASB Statement 74.
Changes in Net Position – Defined Benefit Plans (Concluded)Last Ten Fiscal Years (in 000’s)
144 Statistical Section � 2020 Comprehensive Annual Financial Report � Employees Retirement System of Texas

This schedule provides summarized trend information on additions and deductions for the Tex$aver 401(k) and 457 plans, the Commuter Spending Account, and the state employees’ cafeteria plan (TexFlex). The information source of this schedule is Exhibit IX.
Fiscal Year 2011 2012 2013 2014 2015 2016 2017 2018 2019 2020 $ $ $ $ $ $ $ $ $ $
Texa$aver 401(k) Plan
AdditionsInvestment Income (Net of Expenses) 43 26 27 (7) 7 18 (7) 59 71 11 Other Additions 830 607 550 398 188 50 565 390 486 1,210
Total Additions 873 633 577 391 195 68 558 449 557 1,221
DeductionsAdministrative and Other Expenses 615 596 759 590 529 433 479 482 490 260 Total Deductions 615 596 759 590 529 433 479 482 490 260 Change in Net Position 258 37 (182) (199) (334) (365) 79 (33) 67 961
Texa$aver 457 Plan
AdditionsInvestment Income (Net of Expenses) 13 12 11 (2) 6 17 18 52 75 23 Other Additions 513 486 520 507 581 587 719 763 896 570
Total Additions 526 498 531 505 587 604 737 815 971 593
DeductionsAdministrative and Other Expenses 510 452 330 334 265 233 269 512 523 165
Total Deductions 510 452 330 334 265 233 269 512 523 165 Change in Net Position 16 46 201 171 322 371 468 303 448 428
Commuter Spending Account Fund (CSA)
AdditionsContributions 73 129 141 140 127Investment Income (Net of Expenses) 1 4 7 12 8Other Additions 6Transfers In 1,750
Total Additions 0 0 0 0 0 1,824 133 154 152 135
DeductionsReimbursement Account Claims 43 114 116 115 79Administrative and Other Expenses 1,276 72 19 4 12
Total Deductions 0 0 0 0 0 1,319 186 135 119 92Change in Net Position 0 0 0 0 0 505 (53) 19 33 44
State Employees Cafeteria Plan (TexFlex)
AdditionsContributions 96,033 95,986 95,578 83,214 83,092 80,953 79,559 76,656 73,406 73,290 Investment Income (Net of Expenses) 20 19 20 9 20 34 72 193 336 184
Other Additions 104 76 92 113 398 194 92 101 Total Additions 96,157 96,081 95,690 83,336 83,510 81,181 79,723 76,950 73,742 73,503
DeductionsReimbursement Account Claims 93,737 92,093 92,799 78,720 77,744 81,179 69,697 73,729 71,301 65,837 Administrative and Other Expenses 2,725 2,485 2,365 2,460 3,662 1,815 1,619 1,526 1,452 1,391
Total Deductions 96,462 94,578 95,164 81,180 81,406 82,994 71,316 75,255 72,753 67,228 Change in Net Position (305) 1,503 526 2,156 2,104 (1,813) 8,407 1,695 989 6,274
Note A: The System implemented the Commuter Spending Accounts on January 1, 2016.
Changes in Net Position –Deferred Compensation Plans and Cafeteria PlanLast Ten Fiscal Years (in 000’s)
Employees Retirement System of Texas � 2020 Comprehensive Annual Financial Report �Statistical Section 145
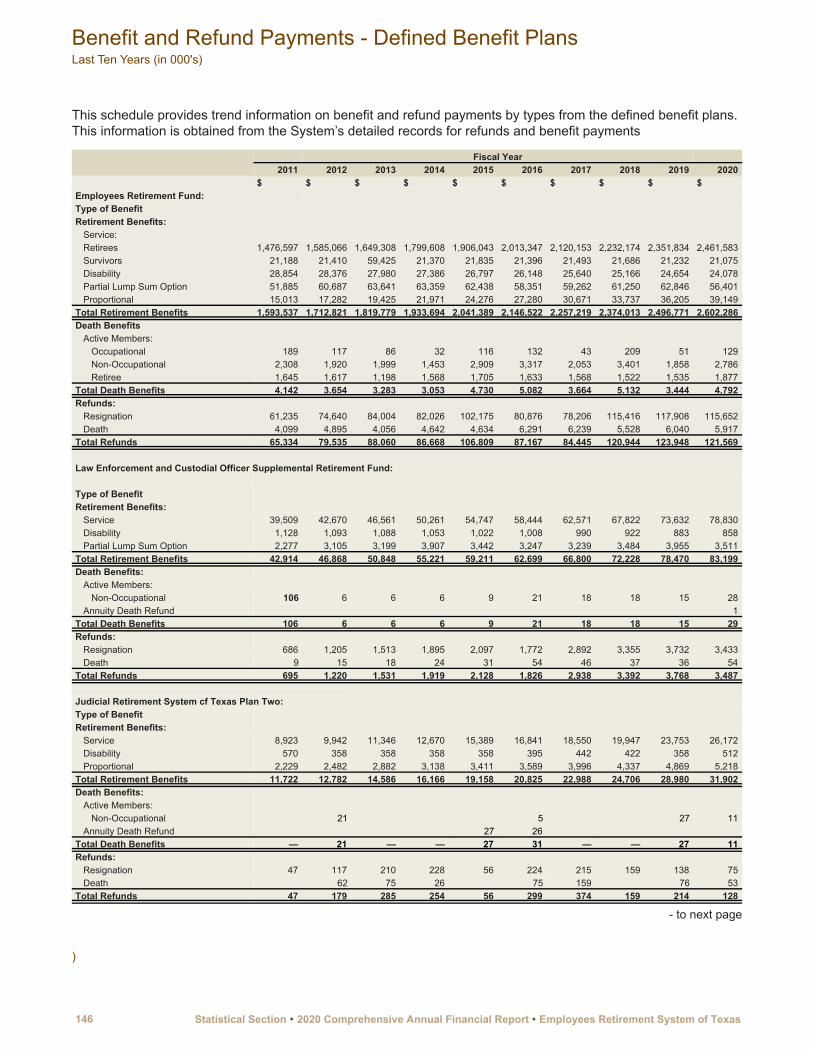
This schedule provides trend information on benefit and refund payments by types from the defined benefit plans. This information is obtained from the System’s detailed records for refunds and benefit payments
Fiscal Year 2011 2012 2013 2014 2015 2016 2017 2018 2019 2020 $ $ $ $ $ $ $ $ $ $
Employees Retirement Fund:Type of BenefitRetirement Benefits:
Service:Retirees 1,476,597 1,585,066 1,649,308 1,799,608 1,906,043 2,013,347 2,120,153 2,232,174 2,351,834 2,461,583 Survivors 21,188 21,410 59,425 21,370 21,835 21,396 21,493 21,686 21,232 21,075 Disability 28,854 28,376 27,980 27,386 26,797 26,148 25,640 25,166 24,654 24,078 Partial Lump Sum Option 51,885 60,687 63,641 63,359 62,438 58,351 59,262 61,250 62,846 56,401 Proportional 15,013 17,282 19,425 21,971 24,276 27,280 30,671 33,737 36,205 39,149
Total Retirement Benefits 1,593,537 1,712,821 1,819,779 1,933,694 2,041,389 2,146,522 2,257,219 2,374,013 2,496,771 2,602,286 Death Benefits
Active Members:Occupational 189 117 86 32 116 132 43 209 51 129 Non-Occupational 2,308 1,920 1,999 1,453 2,909 3,317 2,053 3,401 1,858 2,786 Retiree 1,645 1,617 1,198 1,568 1,705 1,633 1,568 1,522 1,535 1,877
Total Death Benefits 4,142 3,654 3,283 3,053 4,730 5,082 3,664 5,132 3,444 4,792 Refunds:
Resignation 61,235 74,640 84,004 82,026 102,175 80,876 78,206 115,416 117,908 115,652 Death 4,099 4,895 4,056 4,642 4,634 6,291 6,239 5,528 6,040 5,917
Total Refunds 65,334 79,535 88,060 86,668 106,809 87,167 84,445 120,944 123,948 121,569
Law Enforcement and Custodial Officer Supplemental Retirement Fund:
Type of BenefitRetirement Benefits:
Service 39,509 42,670 46,561 50,261 54,747 58,444 62,571 67,822 73,632 78,830 Disability 1,128 1,093 1,088 1,053 1,022 1,008 990 922 883 858 Partial Lump Sum Option 2,277 3,105 3,199 3,907 3,442 3,247 3,239 3,484 3,955 3,511
Total Retirement Benefits 42,914 46,868 50,848 55,221 59,211 62,699 66,800 72,228 78,470 83,199 Death Benefits:
Active Members:Non-Occupational 106 6 6 6 9 21 18 18 15 28
Annuity Death Refund 1 Total Death Benefits 106 6 6 6 9 21 18 18 15 29 Refunds:
Resignation 686 1,205 1,513 1,895 2,097 1,772 2,892 3,355 3,732 3,433 Death 9 15 18 24 31 54 46 37 36 54
Total Refunds 695 1,220 1,531 1,919 2,128 1,826 2,938 3,392 3,768 3,487
Judicial Retirement System cf Texas Plan Two:Type of BenefitRetirement Benefits:
Service 8,923 9,942 11,346 12,670 15,389 16,841 18,550 19,947 23,753 26,172 Disability 570 358 358 358 358 395 442 422 358 512 Proportional 2,229 2,482 2,882 3,138 3,411 3,589 3,996 4,337 4,869 5,218
Total Retirement Benefits 11,722 12,782 14,586 16,166 19,158 20,825 22,988 24,706 28,980 31,902 Death Benefits:
Active Members:Non-Occupational 21 5 27 11
Annuity Death Refund 27 26 Total Death Benefits — 21 — — 27 31 — — 27 11 Refunds:
Resignation 47 117 210 228 56 224 215 159 138 75 Death 62 75 26 75 159 76 53
Total Refunds 47 179 285 254 56 299 374 159 214 128
- to next page
)
Benefit and Refund Payments - Defined Benefit PlansLast Ten Years (in 000's)
146 Statistical Section � 2020 Comprehensive Annual Financial Report � Employees Retirement System of Texas

Fiscal Year 2011 2012 2013 2014 2015 2016 2017 2018 2019 2020
Excess Benefit Arrangement:Type of BenefitRetirement Benefits:
Service 297 436 488 422 392 448 668 753 797 988 Total Retirement Benefits 297 436 488 422 392 448 668 753 797 988
State Retiree Health Plan:Type of BenefitInsurance Benefits:
Accrued Claims 53,835 50,148 36,356 22,706 9,848 (5,601) 20,769 (27,916) 4,781 6,762 Life Claims 24,663 29,722 37,349 41,763 45,740 46,994 55,347 54,426 58,278 60,363 Prescriptions Drugs 171,191 201,279 217,332 241,583 253,591 279,144 255,976 289,856 308,940 355,589 Administrative Fees 18,872 15,061 15,775 19,077 18,721 19,338 20,744 19,802 19,776 20,405 HMO Payments 32,349 73,491 98,107 110,232 139,696 156,418 188,633 179,537 201,752 195,654 Health 330,801 310,261 301,785 358,696 373,469 391,327 426,911 393,907 411,988 409,119 Dental 14,486 16,123 17,677 19,766 22,861 25,266 27,436 29,309 33,073 28,998
Total Insurance Benefits 646,197 696,085 724,381 813,823 863,926 912,886 995,816 938,921 1,038,588 1,076,890
Benefit and Refund Payments - Defined Benefit Plans (Concluded)Last Ten Years (in 000's)
Employees Retirement System of Texas � 2020 Comprehensive Annual Financial Report �Statistical Section 147

This schedule provides ten years of information for service retirements. It shows the average monthly benefit, the average final salary and the number of retired members. The information source of this schedule is the System’s member records.
Retirement Effective Dates (Note A) Years of Credited ServiceSeptember 30, 2010 to August 31, 2020 5-10 10-15 15-20 20-25 25-30 30+- Period 9/30/10 to 8/31/11: Average Monthly Benefit $ 541.71 863.85 1,437.10 2,048.33 2,814.49 3,727.77 Average Final Average Salary $ 3,585.54 3,308.86 3,770.38 4,254.06 4,662.99 5,128.08 Number of Retired Members 226 558 558 770 745 614- Period 9/30/11 to 8/31/12: Average Monthly Benefit $ 509.22 871.22 1,425.95 2,071.83 2,858.45 3,712.65 Average Final Average Salary $ 3,323.09 3,340.22 3,689.58 4,247.05 4,732.90 5,076.86 Number of Retired Members 223 525 658 796 735 551- Period 9/30/12 to 8/31/13: Average Monthly Benefit $ 548.59 953.18 1,511.04 2,087.00 2,926.64 3,765.11 Average Final Average Salary $ 3,522.61 3,574.99 3,899.28 4,253.98 4,845.43 5,153.36 Number of Retired Members 278 583 696 847 797 547- Period 9/30/13 to 8/31/14: Average Monthly Benefit $ 512.26 920.39 1,480.19 2,006.38 2,903.39 3,875.10 Average Final Average Salary $ 3,390.86 3,519.12 3,840.45 4,148.11 4,845.08 5,374.15 Number of Retired Members 326 598 691 875 720 532- Period 9/30/14 to 8/31/15: Average Monthly Benefit $ 579.74 949.71 1,449.46 1,985.29 2,944.35 4,049.72 Average Final Average Salary $ 3,736.26 3,669.72 3,803.01 4,195.95 4,901.39 5,617.38 Number of Retired Members 264 636 717 1,013 888 628- Period 9/30/15 to 8/31/16: Average Monthly Benefit $ 563.58 929.75 1,468.28 2,046.85 3,095.95 4,317.90 Average Final Average Salary $ 3,494.31 3,671.12 3,851.78 4,284.99 5,147.43 5,898.58 Number of Retired Members 219 628 665 928 896 613- Period 9/30/16 to 8/31/17: Average Monthly Benefit $ 588.47 956.75 1,515.58 2,099.24 3,118.94 4,364.50 Average Final Average Salary $ 3,615.38 3,761.76 3,986.35 4,320.64 5,134.90 6,048.32 Number of Retired Members 264 734 705 912 858 628- Period 9/30/17 to 8/31/18: Average Monthly Benefit $ 610.95 985.97 1,628.58 2,255.54 3,227.34 4,575.79 Average Final Average Salary $ 3,618.41 3,823.68 4,216.69 4,653.16 5,333.30 6,235.86 Number of Retired Members 147 681 621 813 804 636- Period 9/30/18 to 8/31/19: Average Monthly Benefit $ 578.52 1,030.91 1,681.05 2,383.37 3,244.38 4,647.97 Average Final Average Salary $ 3,687.87 3,968.15 4,387.83 4,853.83 5,316.72 6,295.96 Number of Retired Members 133 748 602 825 827 605- Period 9/30/19 to 8/31/20: Average Monthly Benefit $ 653.68 1,027.41 1,685.92 2,282.41 3,378.41 4,677.15 Average Final Average Salary $ 4,036.79 3,903.44 4,358.01 4,665.01 5,571.28 6,359.58 Number of Retired Members 100 651 513 729 746 520
Five Year Average -Period 9/30/15 to 8/31/20: Average Monthly Benefit $ 542.40 780.72 1,294.36 1,771.39 2,603.85 3,665.67 Average Final Average Salary $ 3,645.18 3,829.12 4,142.79 4,541.27 5,291.43 6,161.30 Average Number of Retired Members 173 688 621 841 826 600
Ten Year Average -Period 9/30/10 to 8/31/20: Average Monthly Benefit $ 559.38 953.50 1,523.04 2,120.20 3,054.33 4,177.89 Average Final Average Salary $ 3,741.18 3,547.51 3,968.60 4,344.15 4,979.11 5,734.77 Average Number of Retired Members 218 634 643 851 802 587
Note A: This schedule includes service retirements of the employee class as of November 2, 2020. It does not include disability retirements or the elected state official class. This schedule does not include Partial Lump Sum (PLSO) payments.
Average Benefit Payments – Employee ClassLast Ten Fiscal Years
148 Statistical Section � 2020 Comprehensive Annual Financial Report � Employees Retirement System of Texas

This schedule provides the average amount of monthly benefit, the number of retirees and the type of retirement for ERS, LECOS, and JRS2. The information source of this schedule is the System’s pension actuary.
Average Amount of Monthly Benefit
Number of Retirees
Type of Retirement Option Selected (Note B)Service Disability Life Option 1 Option 2 Option 3 Option 4 Option 5
Employees Retirement Fund (Note A)$$ 0-300 7,242 7,000 242 4,757 1,442 441 136 245 221 301-600 12,721 12,106 615 8,901 2,220 629 215 335 421 601-900 14,299 13,639 660 10,002 2,407 825 266 286 513 901-1,200 13,396 13,053 343 9,142 2,283 981 236 279 475 1,201-1,500 13,264 13,105 159 8,734 2,361 1,103 228 215 623 1,501-2,000 18,150 18,042 108 11,676 3,032 1,854 294 338 956 2,001-2,500 13,247 13,219 28 8,010 2,286 1,649 207 297 798 2,501-3,000 8,926 8,916 10 5,099 1,603 1,207 157 223 637 3,001-4,000 9,601 9,597 4 5,381 1,877 1,193 128 233 789 4,001-10,999 7,150 7,149 1 3,482 1,849 889 78 146 706 Total 117,996 115,826 2,170 75,184 21,360 10,771 1,945 2,597 6,139
Law Enforcement And Custodial Officer Supplemental Retirement Fund (Not e A)$$ 0-200 429 429 0 285 100 23 4 5 12 201-400 7,020 6,976 44 3,933 1,733 749 78 93 434 401-600 4,635 4,618 17 2,492 967 648 44 85 399 601-800 1,290 1,287 3 561 335 189 16 24 165 801-1,000 732 732 0 279 241 108 9 8 87 1,001-1,200 354 353 1 118 137 44 0 4 51 1,201-1,400 137 131 6 43 53 15 1 2 23 1,401-1,600 49 40 9 19 18 4 0 1 7 1,601-1,800 22 17 5 11 6 2 0 1 2 1,801-9,999 29 24 5 10 13 0 0 1 5 Total 14,697 14,607 90 7,751 3,603 1,782 152 224 1,185
Judicial Retirement Plan Two Fund (Note A)$$ 0-2,000 33 33 0 14 15 2 1 0 1 2,001-2,500 10 10 0 5 5 0 0 0 0 2,501-3,000 8 8 0 1 3 1 1 0 2 3,001-3,500 7 7 0 2 2 2 0 0 1 3,501-4,000 20 20 0 9 8 2 0 1 0 4,001-4,500 41 41 0 15 19 5 0 1 1 4,501-5,000 49 49 0 25 18 3 0 3 0 5,001-5,500 63 63 0 20 26 5 1 0 11 5,501-6,000 58 58 0 24 25 5 0 1 3 6,001-6,500 58 57 1 32 17 6 1 0 2 6,501-7,000 39 39 0 12 15 7 0 2 3 7,001-9,999 98 97 1 55 21 14 0 4 4 Total 484 482 2 214 174 52 4 12 28
Note A: These calculations are based on actuarial estimates.Note B: Life - standard annuity.
Option 1 - a reduced annuity for the lifetime of the member, then pays the same amount throughout the life of the nominee.Option 2 - a reduced annuity for the lifetime of the member, then pays one-half of that amount throughout the life of the nominee.Option 3 - a reduced annuity to the member or the nominee for a guaranteed period of 5 years, and for the lifetime of the member.Option 4 - a reduced annuity to the member or the nominee for a guaranteed period of 10 years, and for the lifetime of the member.Option 5 - a reduced annuity for the lifetime of the member, then pays three-fourths of that amount throughout the life of the nominee.
Retired Members by Type of BenefitAugust 31, 2020
Employees Retirement System of Texas � 2020 Comprehensive Annual Financial Report �Statistical Section 149
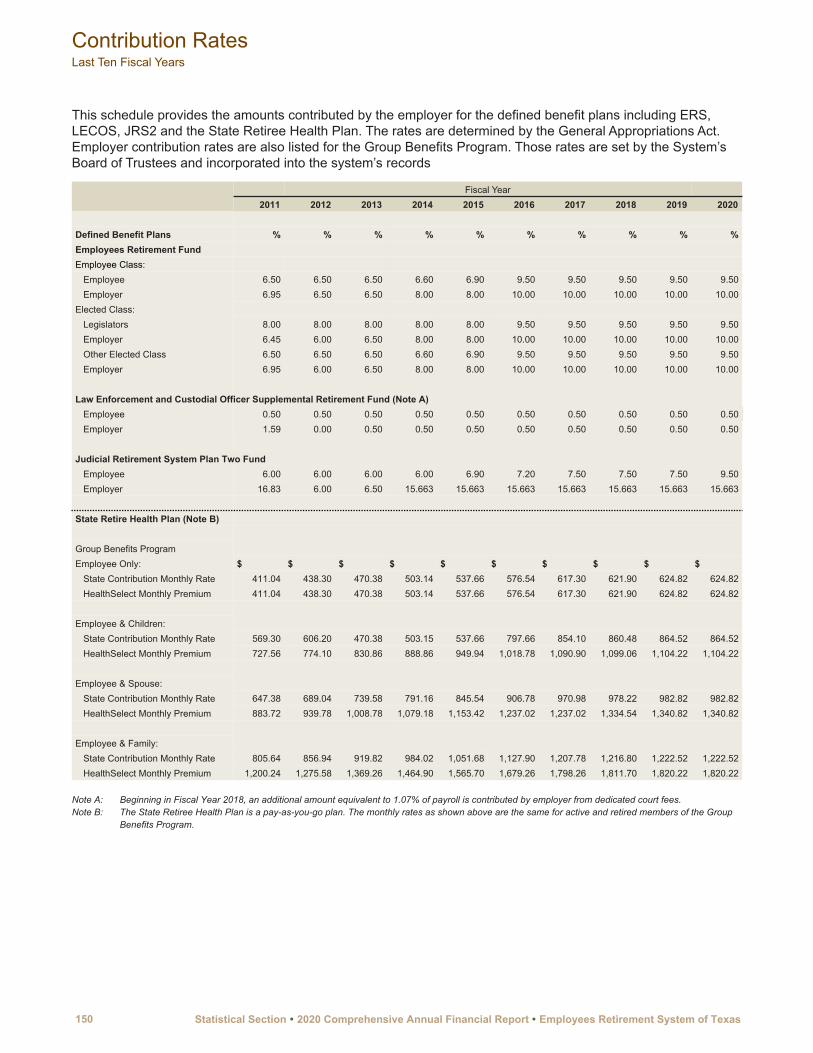
This schedule provides the amounts contributed by the employer for the defined benefit plans including ERS, LECOS, JRS2 and the State Retiree Health Plan. The rates are determined by the General Appropriations Act. Employer contribution rates are also listed for the Group Benefits Program. Those rates are set by the System’s Board of Trustees and incorporated into the system’s records
Fiscal Year 2011 2012 2013 2014 2015 2016 2017 2018 2019 2020
Defined Benefit Plans % % % % % % % % % %Employees Retirement FundEmployee Class:
Employee 6.50 6.50 6.50 6.60 6.90 9.50 9.50 9.50 9.50 9.50Employer 6.95 6.50 6.50 8.00 8.00 10.00 10.00 10.00 10.00 10.00
Elected Class:Legislators 8.00 8.00 8.00 8.00 8.00 9.50 9.50 9.50 9.50 9.50Employer 6.45 6.00 6.50 8.00 8.00 10.00 10.00 10.00 10.00 10.00Other Elected Class 6.50 6.50 6.50 6.60 6.90 9.50 9.50 9.50 9.50 9.50Employer 6.95 6.00 6.50 8.00 8.00 10.00 10.00 10.00 10.00 10.00
Law Enforcement and Custodial Officer Supplemental Retirement Fund (Note A)Employee 0.50 0.50 0.50 0.50 0.50 0.50 0.50 0.50 0.50 0.50Employer 1.59 0.00 0.50 0.50 0.50 0.50 0.50 0.50 0.50 0.50
Judicial Retirement System Plan Two FundEmployee 6.00 6.00 6.00 6.00 6.90 7.20 7.50 7.50 7.50 9.50Employer 16.83 6.00 6.50 15.663 15.663 15.663 15.663 15.663 15.663 15.663
State Retire Health Plan (Note B)
Group Benefits ProgramEmployee Only: $ $ $ $ $ $ $ $ $ $
State Contribution Monthly Rate 411.04 438.30 470.38 503.14 537.66 576.54 617.30 621.90 624.82 624.82HealthSelect Monthly Premium 411.04 438.30 470.38 503.14 537.66 576.54 617.30 621.90 624.82 624.82
Employee & Children:State Contribution Monthly Rate 569.30 606.20 470.38 503.15 537.66 797.66 854.10 860.48 864.52 864.52HealthSelect Monthly Premium 727.56 774.10 830.86 888.86 949.94 1,018.78 1,090.90 1,099.06 1,104.22 1,104.22
Employee & Spouse:State Contribution Monthly Rate 647.38 689.04 739.58 791.16 845.54 906.78 970.98 978.22 982.82 982.82HealthSelect Monthly Premium 883.72 939.78 1,008.78 1,079.18 1,153.42 1,237.02 1,237.02 1,334.54 1,340.82 1,340.82
Employee & Family:State Contribution Monthly Rate 805.64 856.94 919.82 984.02 1,051.68 1,127.90 1,207.78 1,216.80 1,222.52 1,222.52HealthSelect Monthly Premium 1,200.24 1,275.58 1,369.26 1,464.90 1,565.70 1,679.26 1,798.26 1,811.70 1,820.22 1,820.22
Note A: Beginning in Fiscal Year 2018, an additional amount equivalent to 1.07% of payroll is contributed by employer from dedicated court fees.Note B: The State Retiree Health Plan is a pay-as-you-go plan. The monthly rates as shown above are the same for active and retired members of the Group
Benefits Program.
Contribution RatesLast Ten Fiscal Years
150 Statistical Section � 2020 Comprehensive Annual Financial Report � Employees Retirement System of Texas
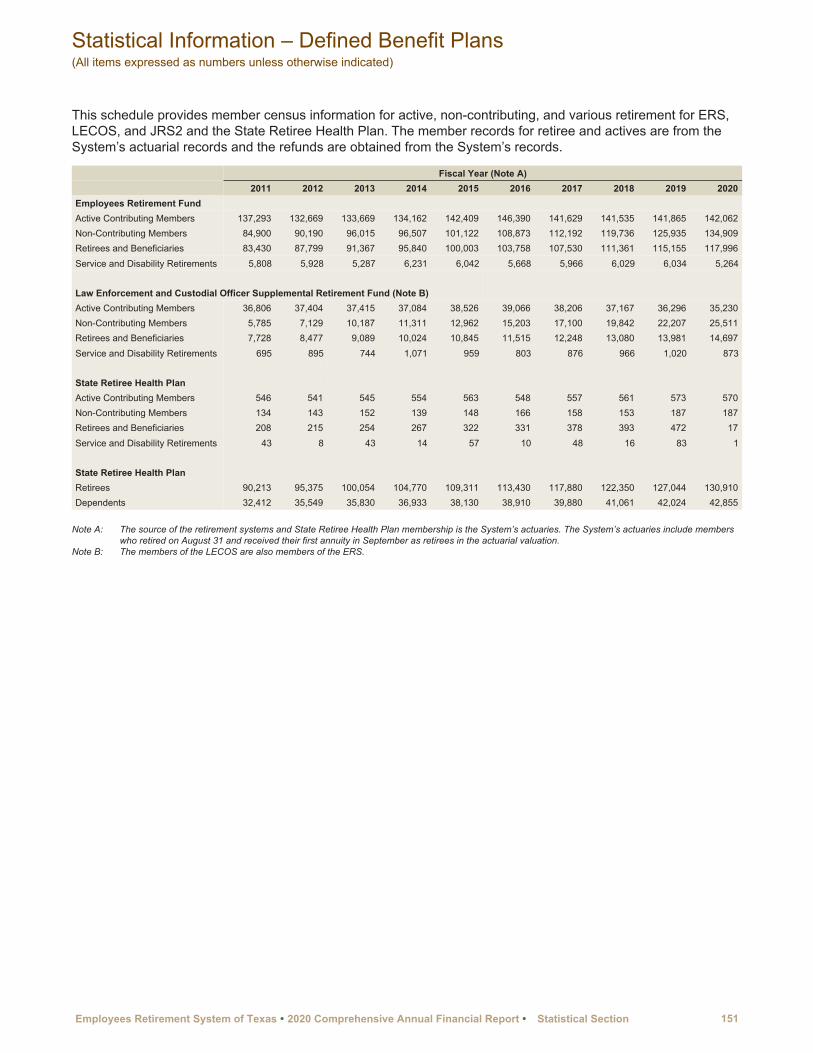
This schedule provides member census information for active, non-contributing, and various retirement for ERS, LECOS, and JRS2 and the State Retiree Health Plan. The member records for retiree and actives are from the System’s actuarial records and the refunds are obtained from the System’s records.
Fiscal Year (Note A) 2011 2012 2013 2014 2015 2016 2017 2018 2019 2020
Employees Retirement FundActive Contributing Members 137,293 132,669 133,669 134,162 142,409 146,390 141,629 141,535 141,865 142,062 Non-Contributing Members 84,900 90,190 96,015 96,507 101,122 108,873 112,192 119,736 125,935 134,909 Retirees and Beneficiaries 83,430 87,799 91,367 95,840 100,003 103,758 107,530 111,361 115,155 117,996 Service and Disability Retirements 5,808 5,928 5,287 6,231 6,042 5,668 5,966 6,029 6,034 5,264
Law Enforcement and Custodial Officer Supplemental Retirement Fund (Note B)Active Contributing Members 36,806 37,404 37,415 37,084 38,526 39,066 38,206 37,167 36,296 35,230 Non-Contributing Members 5,785 7,129 10,187 11,311 12,962 15,203 17,100 19,842 22,207 25,511 Retirees and Beneficiaries 7,728 8,477 9,089 10,024 10,845 11,515 12,248 13,080 13,981 14,697 Service and Disability Retirements 695 895 744 1,071 959 803 876 966 1,020 873
State Retiree Health PlanActive Contributing Members 546 541 545 554 563 548 557 561 573 570 Non-Contributing Members 134 143 152 139 148 166 158 153 187 187 Retirees and Beneficiaries 208 215 254 267 322 331 378 393 472 17 Service and Disability Retirements 43 8 43 14 57 10 48 16 83 1
State Retiree Health PlanRetirees 90,213 95,375 100,054 104,770 109,311 113,430 117,880 122,350 127,044 130,910 Dependents 32,412 35,549 35,830 36,933 38,130 38,910 39,880 41,061 42,024 42,855
Note A: The source of the retirement systems and State Retiree Health Plan membership is the System’s actuaries. The System’s actuaries include members who retired on August 31 and received their first annuity in September as retirees in the actuarial valuation.
Note B: The members of the LECOS are also members of the ERS.
Statistical Information – Defined Benefit Plans(All items expressed as numbers unless otherwise indicated)
Employees Retirement System of Texas � 2020 Comprehensive Annual Financial Report �Statistical Section 151

This schedule provides ten year historical trend information for members of the Texa$aver 457 and 401(k) deferred compensation plans, the Commuter Spending Accounts, the cafeteria plan, and the Group Benefits Program. It also provides death benefit program information. Participant counts, current market values, and death benefit payments are from the System’s records. Group Benefit Program member counts are from the System’s insurance actuary.
Fiscal Year 2011 2012 2013 2014 2015 2016 2017 2018 2019 2020
457 Deferred Compensation Plan (Note A)Texa$aver 457 Plan (Note A):
Total Participants 21,153 23,219 24,689 26,902 29,129 31,515 33,131 34,023 34,102 33,456 Participants Currently Deferring 13,293 14,189 14,385 20,030 16,685 17,052 19,803 18,591 18,281 17,886 Current Fair Value of Plan Assets (in millions) $ 380.6 442.6 494.7 591.1 603.7 669.7 759 869.0 896.2 1,053
Original 457 Plan (Notes A & B):Total Participants 734 657 598 580 513 468 440 424 401 388 Participants Currently Deferring 57 53 38 32 22 17 15 14 12 10
Texa$aver 401(k) Deferred Compensation PlanTotal Participants 109,613 121,516 135,237 151,034 165,513 181,249 195,737 206,617 220,430 213,974 Participants Currently Deferring 64,704 66,910 69,692 89,774 82,851 92,527 95,813 95,392 99,909 103,190 Current Fair Value of Plan Assets (in millions) $ 1,315.5 1,527.2 1,593.8 1,853.9 1,836.2 1,984.7 2,193.6 2,449 2,478.1 2,876 Deferrals (in millions) $ 107.3 105.5 145.7 152.2 160.3 182.3 159.3 135.1 141.9 148.2
Commuter Spending Account (CSA)Reimbursement Accounts:Parking 14 26 26 29 32 Transit 127 120 134 129 72 Participant Contributions (Note C)
Cafeteria PlanReimbursement Accounts:
Health Care 48,807 47,591 46,942 46,173 46,609 48,010 47,799 46,337 44,584 43,134 Dependent Care 3,686 3,747 3,747 3,785 3,880 3,825 3,713 3,636 3,574 3,117 Total Redirected (in millions) $ 93.7 92.8 91.9 78.9 78.5 80.3 78.7 75.8 73 69.9
Premium Conversion:Participants 222,295 218,587 219,357 221,876 222,789 226,864 223,026 223,233 224,699 224,626 Premiums Redirected (in millions) $ 482.4 487.5 500.9 509.2 522.1 548.3 504.5 505.8 509.7 506.4
Tax Savings (in millions):Employees $ 109.2 110.4 113.5 115.3 118.3 124.2 132.1 131.7 132.0 130.5 State of Texas $ 36.9 37.3 38.3 39 39.9 41.9 44.6 44.5 44.6 44.1
Group Benefits Program (Note D)Membership:
Active 239,138 237,041 226,181 228,805 230,023 235,108 230,199 231,911 233,887 232,367 Dependents 183,626 172,695 171,023 169,282 166,772 168,161 166,266 164,685 163,172 162,180 COBRA (Note E) 2,213 2,460 1,674 1,144 1,167 984 723 1,104 1,137 1,199
Total Membership 424,977 412,196 398,878 399,231 397,962 404,253 397,188 397,700 398,196 395,746
Death Benefit ProgramsLump Sum Payments 14 9 23 29 8 14 21 17 13 14 Monthly Payments to Guardians 107 99 111 112 114 114 111 122 116 139 Victims of Violent Crime 13 5 11 8 4 4 7 10 4 7
Note A: In fiscal year 2001, a new Texa$aver 457 Plan was established with different investment options. The original 457 Plan only offers life insurance products.
Note B: Data for the original 457 Plan is as of June 30, 2018.Note C: The System implemented the Commuter Spending Accounts on January 1, 2016. During fiscal year 2018, the participant contributions to the
reimbursement accounts were immaterial for reporting in this schedule.Note D: In fiscal year 2007, the Group Benefits Program was separated into two funds (Active and Retiree) due to the implementation of GASB 43.
Retired members and their dependents were moved to a fiduciary fund named the State Retiree Health Plan. The source of the membership is the System’s actuary.
Statistical Information – Other Programs(All items expressed as numbers unless otherwise indicated)
152 Statistical Section � 2020 Comprehensive Annual Financial Report � Employees Retirement System of Texas
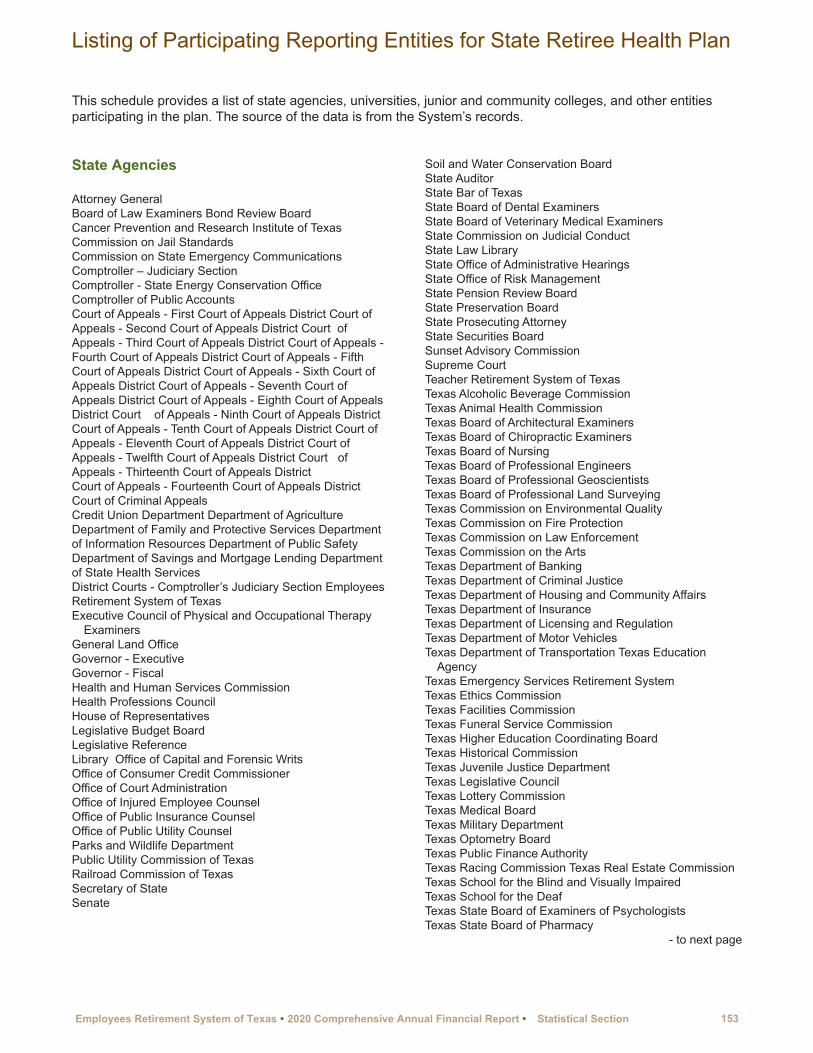
This schedule provides a list of state agencies, universities, junior and community colleges, and other entities participating in the plan. The source of the data is from the System’s records.
State Agencies
Attorney GeneralBoard of Law Examiners Bond Review BoardCancer Prevention and Research Institute of Texas Commission on Jail StandardsCommission on State Emergency Communications Comptroller – Judiciary SectionComptroller - State Energy Conservation OfficeComptroller of Public AccountsCourt of Appeals - First Court of Appeals District Court of Appeals - Second Court of Appeals District Court of Appeals - Third Court of Appeals District Court of Appeals - Fourth Court of Appeals District Court of Appeals - Fifth Court of Appeals District Court of Appeals - Sixth Court of Appeals District Court of Appeals - Seventh Court of Appeals District Court of Appeals - Eighth Court of Appeals District Court of Appeals - Ninth Court of Appeals District Court of Appeals - Tenth Court of Appeals District Court of Appeals - Eleventh Court of Appeals District Court of Appeals - Twelfth Court of Appeals District Court of Appeals - Thirteenth Court of Appeals DistrictCourt of Appeals - Fourteenth Court of Appeals District Court of Criminal AppealsCredit Union Department Department of AgricultureDepartment of Family and Protective Services Department of Information Resources Department of Public SafetyDepartment of Savings and Mortgage Lending Department of State Health ServicesDistrict Courts - Comptroller’s Judiciary Section Employees Retirement System of TexasExecutive Council of Physical and Occupational Therapy
ExaminersGeneral Land Office Governor - ExecutiveGovernor - FiscalHealth and Human Services CommissionHealth Professions CouncilHouse of Representatives Legislative Budget Board Legislative Reference Library Office of Capital and Forensic WritsOffice of Consumer Credit Commissioner Office of Court AdministrationOffice of Injured Employee Counsel Office of Public Insurance Counsel Office of Public Utility Counsel Parks and Wildlife Department Public Utility Commission of TexasRailroad Commission of Texas Secretary of StateSenate
Soil and Water Conservation Board State AuditorState Bar of TexasState Board of Dental ExaminersState Board of Veterinary Medical Examiners State Commission on Judicial ConductState Law LibraryState Office of Administrative Hearings State Office of Risk ManagementState Pension Review Board State Preservation Board State Prosecuting Attorney State Securities BoardSunset Advisory CommissionSupreme CourtTeacher Retirement System of Texas Texas Alcoholic Beverage Commission Texas Animal Health Commission Texas Board of Architectural Examiners Texas Board of Chiropractic Examiners Texas Board of NursingTexas Board of Professional Engineers Texas Board of Professional Geoscientists Texas Board of Professional Land Surveying Texas Commission on Environmental Quality Texas Commission on Fire ProtectionTexas Commission on Law Enforcement Texas Commission on the ArtsTexas Department of BankingTexas Department of Criminal JusticeTexas Department of Housing and Community Affairs Texas Department of InsuranceTexas Department of Licensing and Regulation Texas Department of Motor VehiclesTexas Department of Transportation Texas Education
AgencyTexas Emergency Services Retirement System Texas Ethics CommissionTexas Facilities CommissionTexas Funeral Service CommissionTexas Higher Education Coordinating Board Texas Historical CommissionTexas Juvenile Justice Department Texas Legislative CouncilTexas Lottery Commission Texas Medical Board Texas Military Department Texas Optometry BoardTexas Public Finance Authority Texas Racing Commission Texas Real Estate CommissionTexas School for the Blind and Visually ImpairedTexas School for the DeafTexas State Board of Examiners of Psychologists Texas State Board of Pharmacy
- to next page
Listing of Participating Reporting Entities for State Retiree Health Plan
Employees Retirement System of Texas � 2020 Comprehensive Annual Financial Report �Statistical Section 153

exas State Board of Plumbing Examiners Texas State Board of Public Accountancy Texas State Library and Archives Commission Texas Treasury Safekeeping Trust Company Texas Veterans CommissionTexas Water Development Board Texas Workforce Commission
Universities
Angelo State UniversityLamar Institute of Technology Lamar State College - OrangeLamar State College - Port Arthur Lamar UniversityMidwestern State University Sam Houston State UniversityStephen F. Austin State UniversitySul Ross State UniversityTexas Southern UniversityTexas State Technical College System Texas State UniversityTexas State University SystemTexas Tech UniversityTexas Tech University Health Sciences CenterTexas Tech University Health Sciences Center - El Paso Texas Tech University SystemTexas Woman’s University University of HoustonUniversity of Houston - Clear Lake University of Houston - Downtown University of Houston - Victoria University of Houston System University of North Texas University of North Texas at DallasUniversity of North Texas Health Science Center at Fort
WorthUniversity of North Texas System
Junior and Community Colleges
Alamo Community College Alvin Community CollegeAmarillo CollegeAngelina CollegeAustin Community CollegeBlinn CollegeBrazosport CollegeCentral Texas CollegeCisco Junior CollegeClarendon CollegeCoastal Bend CollegeCollege of the MainlandCollin County Community College District Dallas County Community College
Del Mar CollegeEl Paso Community CollegeFrank Phillips College Galveston CollegeGrayson County College Hill CollegeHouston Community CollegeHoward College and Southwest Collegiate Institute for the
Deaf are a part of the Howard County Junior College District
Kilgore CollegeLaredo Junior CollegeLee CollegeLone Star College SystemMcLennan Community College Midland CollegeNavarro CollegeNorth Central Texas College Northeast Texas Community College Odessa CollegePanola College Paris Junior CollegeRanger Junior CollegeSan Jacinto College South Plains CollegeSouth Texas Community College Southwest Texas Counties Junior College Tarrant County College DistrictTemple College Texarkana CollegeTexas Southmost CollegeTrinity Valley Community College Tyler Junior CollegeVernon Regional Junior College Victoria CollegeWeatherford College Western Texas CollegeWharton County Junior College
Other Entities
Community Supervision & Corrections Departments Texas Cooperative Inspection ProgramTexas County and District Retirement System Texas Municipal Retirement SystemTexas Turnpike AuthorityUniversity of Texas Medical Branch at GalvestonUniversity of Texas Mental Sciences Institute Windham School District
The principal participating employer is the state of Texas. State agencies and universities employ 187,142 which is 80.5% of the employees covered by the State Retiree Health Plan.
Listing of Participating Reporting Entities for State Retiree Health Plan(Concluded)
154 Statistical Section � 2020 Comprehensive Annual Financial Report � Employees Retirement System of Texas

ERS SUPPORTS THE STATE WORKFORCE BY OFFERING COMPETITIVE BENEFITS AT A REASONABLE COST.
®
200 E. 18th StreetP.O. Box 13207
Austin, Texas 78711-3207www.ers.texas.gov