the mit lincoln laboratory rt-04f diarization systems ... rich transcription workshop november 2004...
TRANSCRIPT
NIST Rich Transcription Workshop November 2004
The MIT Lincoln Laboratory RT-04F Diarization Systems: Applications to Broadcast Audio and Telephone Conversations•
D. A. Reynolds and P. Torres-Carrasquillo
{dar,ptorres}@ll.mit.edu
MIT Lincoln Laboratory, Lexington, MA USA
• This work is sponsored by the Defense Advanced Research Agency under Air Force Contract F19628-00-C-0002. Opinions, interpretations, conclusions and recommendations are those of the author and are not necessarily endorsed by the United States Government.
ABSTRACT Audio diarization is the process of annotating an input audio channel with information that attributes (possibly overlapping) temporal regions of signal energy to their specific sources. These sources can include particular speakers, music, background noise sources, and other signal source/channel characteristics. Diarization has utility in making automatic transcripts more readable and in searching and indexing audio archives. In this paper we describe the systems developed by MITLL and used in DARPA EARS Rich Transcription Fall 2004 (RT-04F) speaker diarization evaluation. The primary system is based on a new proxy speaker model approach and the secondary system follows a more standard BIC based clustering approach. We present experiments analyzing performance of the systems and present a cross-cluster recombination approach that significantly improves performance. In addition, we also present results applying our system to a telephone speech, summed channel speaker detection task.
1. INTRODUCTION
Audio diarization is the process of annotating an input audio channel with information that attributes (possibly overlapping) temporal regions of signal energy to their specific sources. These sources can include particular speakers, music, background noise sources, and other signal source/channel characteristics. Diarization has utility in making automatic transcripts more readable, searching and indexing audio archives and as input to other automatic human language technologies (HLT) (e.g., for adaptation in Speech-to-Text (STT) systems).
While the general task of diarization can cover many types of audio sources, the focus if the DARPA EARS project and the NIST Rich Transcription evaluations is primarily speaker diarization: marking where speaker changes occur in speech and associating segments of speech coming from the same speaker. This is task is also referred to as “who spoke when” and as speaker segmentation and clustering in the literature. For the EARS task there is no prior knowledge of the number of speakers present or samples of any of the speakers. An overview of the general diarization problem and approaches can be found in [1]. In this paper, we describe the speaker diarization systems developed by MITLL and applied to the NIST RT-04F evaluation. In the next section we describe the components and operation of our primary and secondary systems. The diarization data and error measure used for system development and the RT-
04F evaluation is described in Section 3. This is followed in Section 4 with presentation of development experiments, evaluation results and some post-evaluation experiments. In Section 5 we then describe systems and experiments for applying our diarization system to aid in a telephone speech, summed channel speaker detection task. Lastly, we wrap up with some conclusions and discussion of future directions.
2. DIARIZATION SYSTEMS
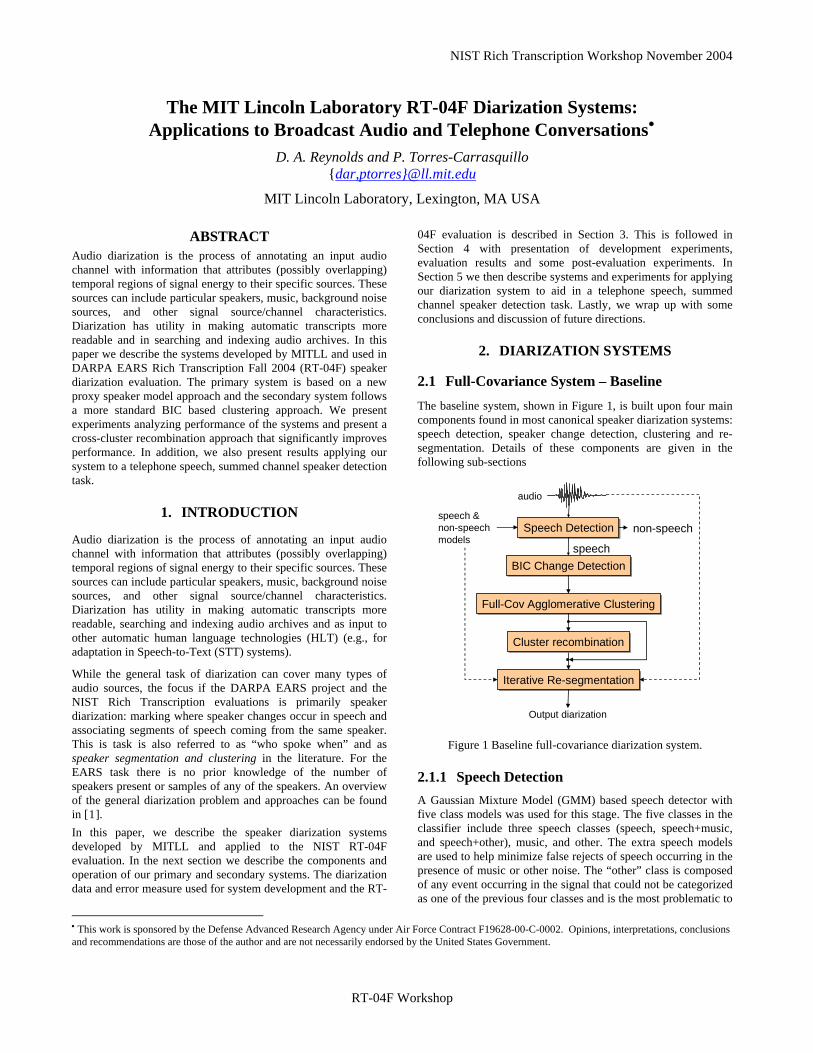
2.1 Full-Covariance System – Baseline The baseline system, shown in Figure 1, is built upon four main components found in most canonical speaker diarization systems: speech detection, speaker change detection, clustering and re-segmentation. Details of these components are given in the following sub-sections
Output diarization
audio
BIC Change DetectionBIC Change Detection
Speech DetectionSpeech Detection
speech
non-speech
Full-Cov Agglomerative ClusteringFull-Cov Agglomerative Clustering
Iterative Re-segmentationIterative Re-segmentation
speech & non-speech models
Cluster recombinationCluster recombination
Figure 1 Baseline full-covariance diarization system.
2.1.1 Speech Detection A Gaussian Mixture Model (GMM) based speech detector with five class models was used for this stage. The five classes in the classifier include three speech classes (speech, speech+music, and speech+other), music, and other. The extra speech models are used to help minimize false rejects of speech occurring in the presence of music or other noise. The “other” class is composed of any event occurring in the signal that could not be categorized as one of the previous four classes and is the most problematic to
RT-04F Workshop

Report Documentation Page Form ApprovedOMB No. 0704-0188
Public reporting burden for the collection of information is estimated to average 1 hour per response, including the time for reviewing instructions, searching existing data sources, gathering andmaintaining the data needed, and completing and reviewing the collection of information. Send comments regarding this burden estimate or any other aspect of this collection of information,including suggestions for reducing this burden, to Washington Headquarters Services, Directorate for Information Operations and Reports, 1215 Jefferson Davis Highway, Suite 1204, ArlingtonVA 22202-4302. Respondents should be aware that notwithstanding any other provision of law, no person shall be subject to a penalty for failing to comply with a collection of information if itdoes not display a currently valid OMB control number.
1. REPORT DATE NOV 2004 2. REPORT TYPE
3. DATES COVERED 00-00-2004 to 00-00-2004
4. TITLE AND SUBTITLE The MIT Lincoln Laboratory RT-04F Diarization Systems: Applicationsto Broadcast Audio and Telephone Conversations
5a. CONTRACT NUMBER
5b. GRANT NUMBER
5c. PROGRAM ELEMENT NUMBER
6. AUTHOR(S) 5d. PROJECT NUMBER
5e. TASK NUMBER
5f. WORK UNIT NUMBER
7. PERFORMING ORGANIZATION NAME(S) AND ADDRESS(ES) Massachusetts Institute of Technology,Lincoln Laboratory,244 Wood Street,Lexington,MA,02420-9185
8. PERFORMING ORGANIZATIONREPORT NUMBER
9. SPONSORING/MONITORING AGENCY NAME(S) AND ADDRESS(ES) 10. SPONSOR/MONITOR’S ACRONYM(S)
11. SPONSOR/MONITOR’S REPORT NUMBER(S)
12. DISTRIBUTION/AVAILABILITY STATEMENT Approved for public release; distribution unlimited
13. SUPPLEMENTARY NOTES DARPA EARS RT-04F Workshop, White Plains, NY, Nov. 8-11, 2004
14. ABSTRACT see report
15. SUBJECT TERMS
16. SECURITY CLASSIFICATION OF: 17. LIMITATION OF ABSTRACT Same as
Report (SAR)
18. NUMBEROF PAGES
10
19a. NAME OFRESPONSIBLE PERSON
a. REPORT unclassified
b. ABSTRACT unclassified
c. THIS PAGE unclassified
Standard Form 298 (Rev. 8-98) Prescribed by ANSI Std Z39-18

NIST Rich Transcription Workshop November 2004
adequately characterize. Each class model is a 128 mixture, diagonal GMM with 30 cepstra plus 30 delta-cesptra features trained using about 2 hours each of labeled data from the Hub4 1996 ‘a’ and ‘b’ shows.
The frame scores from the models are smoothed using a 50 frame (0.5 sec) window and segments are created and labeled based on the maximum score per frame. All segments from speech, speech+music and speech+other are merged into a single speech label. Likewise, music and other labeled segments are merged into a non-speech label. The sequence of speech/non-speech segments are then passed through filters to merge speech segments separated by less than 0.5 seconds, remove remaining speech segments less than 0.5 seconds and finally pad speech segment times by 0.2 seconds. Some development results for the speech detector are given in Table 1. It is clear that the classification of the ill-defined class other is the most difficult.
Table 1 Development results (percent correct) for the speech detector using segments of varying durations from the 1998 Hub4 corpus
Hypothesis
speech
non-speech
speech 96.5 3.5
speech+music 91.4 8.6
speech+other 92.1 7.9
music 8.9 91.1
Tru
th
other 28.9 71.1
2.1.2 BIC Based Change Detection The aim of this change detection stage is to find speaker change points within the speech segments. We employ the widely used Bayesian Information Criterion (BIC) technique introduced in [2]. This technique searches for change points within a window using a penalized likelihood ratio test of whether the data in the window is better modeled by a single distribution (no change point) or two different distributions (change point). As illustrated in Figure 2, at each point in a window of N frames we compute the penalized likelihood ratio (BIC score) between modeling the pdf of the window as a single full-covariance Gaussian (hyp 0) versus two full-covariance Gaussians (hyp 1), one for each portion of the window about the point. The BIC score is
( | ) ( | )
BIC score log( | )x y
z
p x p yP
p zλ λ
αλ
= − (1)
where P is the BIC penalty and α is the BIC weight (typically set to 1.0). For d-dimensional, full-covariance Gaussian models in a window of size N, the penalty is
1 12 2( ( 1)) logP d d d= + +
For a segment x with Nx frames and a full-covariance Gaussian pdf model, ( , )
x xN μ Σ ,
12( | ) logx xp x Nλ x= − Σ (3)
A change point is detected when the BIC score is > 0. If a change is found, the window is reset to the change point and the search restarted. If no change point is found, the window is increased and the search is redone.
p(x|λx) p λy)
p(z|λz)
(y|Putative change point
Hyp 1:
Hyp 0:
Figure 2 Illustration of BIC change point detection for a point in a window.
To reduce computations, we apply a faster Hotelling-T2 test at each pointi in a window, find a putative change point at the maximum, and then run the full BIC test at that point to validate [3]. The initial window size is set to 100 frames with a size increase of (50+10*(k-1)) frames and start offset of (50+10*(k-2))/4 for the kth time no change point is found. A maximum window size of 3000 frames is allowed, at which time a change point is forced at the leading edge and a new window is begun. Speech segments of 200 frames or less are not searched for change points. The features used are 30 dimensional cepstral vectors without channel compensation, since wish to exploit all possible varibailities to detect change points.
While the BIC change detector works well in general, it has high miss rates on detecting short turns (< 2-5 seconds), so can be problematic to use on fast interchange speech like conversations. Tuning the change detector is a tradeoff between the desires to have long, pure segments to aid in initializing the clustering stage, and minimizing missed change points which produce contaminations in the clustering.
2.1.3 Full-Covariance Agglomerative Clustering The purpose of this stage is to associate or cluster segments from the same speaker together. The clustering ideally produces one cluster for each speaker in the audio with all segments from a given speaker in a single cluster. Our systems use a hierarchical, agglomerative clustering algorithm consisting of the following steps:
0. Initialize leaf clusters of tree with segments from the change detection stage.
1. Compute pair-wise distances between each cluster. 2. Merge closest clusters.
N (2) i This test does not require computing the covariance matrix determinant at each point, but it is not as stable for detection threshold testing as the BIC test.
RT-04F Workshop

NIST Rich Transcription Workshop November 2004
3. Update distances of remaining clusters to new cluster. 4. Iterate steps 1-3 until stopping criterion is met.
Our systems’ clustering schemes differ in selection of the distance function, the merging process and the stopping criterion.
The baseline system uses a generalized likelihood ratio distance function, model re-estimation with combined data for cluster merges, and a BIC based stopping criterion [2]. If the data in two clusters are denoted as x and y, then the distance between the clusters is computed as
( | ) ( | )
( , ) log( | )x y
z
p x p yd x y
p zλ λ
λ= (4)
where z is the union of x and y and λz is the joint pdf. As with the change detection, this is a likelihood ratio test between whether the two clusters are better modeled by two separate distributions or a single distribution; the lower the distance the more likely the clusters should be merged. Previously, we have used a tied-Gaussian mixture model for the cluster pdf models [4], but changed to a full-covariance Gaussian model based on improved performance. Cluster likelihoods are computed as in Equation (3). For each iteration, the closest pair of clusters are replaced by the combined data z and model λz, and distances to the remaining clusters are updated. The process is stopped when the penalized minimum distance (ΔBIC score) is greater than a specified threshold (typically 0). The ΔBIC score is
( , )min ( , )ci cj
BIC d ci cj PαΔ = − (5)
where (ci,cj) are the current clusters, α is the BIC weight, and P is the BIC penalty given in Equation (2).
We found that using 12 linear filterbank cepstra vectors with no channel compensation gave the best performance. Contrary to results in [2] stating that the BIC penalty factor can be set at 1.0, we found that a BIC penalty factor of 6.0 was needed for best performance.
While other factors are important for clustering (distance, merging, features), the stopping criterion is critical to good performance. Under-clustering fragments speaker data over several clusters, while over-clustering produces contaminated clusters containing speech from several speakers. How the output is used determined the impact of these errors. For indexing information by speaker, both are suboptimal. However, when using cluster output to assist in speaker adaptation of speech recognition models, under-clustering may be suitable when a speaker occurs in multiple acoustic environments and over-clustering may be advantageous in aggregating speech from similar speakers or acoustic environments.
2.1.4 Cluster Recombination In this recent approach [5], state-of-the-art speaker recognition modeling and matching techniques are used as a secondary test for re-fining speaker clusters. While not used in our RT-04F evaluation systems, we did implement this step for post-evaluation experiments with our baseline system.
The speech processing and modeling used in the clustering stage are simple: no channel compensation, such as RASTA, since we
wish to take advantage of common channel characteristics among a speaker’s segments, and limited parameter distribution models, since the model needs to work with small cluster data at the start. With cluster recombination, clustering is run to under-cluster the audio and produce clusters with a reasonable amount of speech (> 30s). Each cluster’s data is then used to train an adapted GMM with channel compensated features [6] and a cross-cluster likelihood ratio distance is computed between clusters by scoring each cluster’s data against all cluster models. For cluster data c1 and c2, their adapted models λc1 and λc2, and the UBM λubm, the cross-cluster likelihood ratio distance is
2 1( 1| ) ( 2 | )1( 1, 2) log2 ( 1| ) ( 2 |
c
ubm ubm
p c p cd c cp c p c )
cλ λλ λ
= − (6)
A similar distance has been used for inter-audio file clustering [7]. These distances are then used to drive an agglomerative clustering with an empirically derived stopping threshold on the minimum distance. As done in [5], for each merge a new speaker model can be trained with the combined data and distances updated. In our experiments, we instead used a static distance matrix between input clusters and the minimum distance between cluster elements (single linkage) for clustering. In our experiments, a 1024 mixture GMM UBM using RATSA filtered cepstra and delta-cepstra features and 1000 frame feature mean and variance normalization, was trained using data from the Hub4 1996 corpus.
2.1.5 Iterative Re-segmentation The last stage we applied in our baseline system is re-segmentation of the audio via an iterative Viterbi-like decoding using the final cluster models and the music and other non-speech models. The purpose of this stage is to refine the original segment boundaries using information from the clustering. We first train 128 mixture GMMs for each cluster. Clusters with less than 1 sec of data are not used. The entire audio file is scored using these speaker models as well as the music and other non-speech models from the speech detection stage. The frame scores from the models are smoothed using a 100 frame (1 sec) window and segments are created and labeled based on the maximum score per frame. Segments corresponding to the speakers are used to retrain models (non-speech models are not retrained) and the process is iterated. Typically only 1-3 iterations are needed.
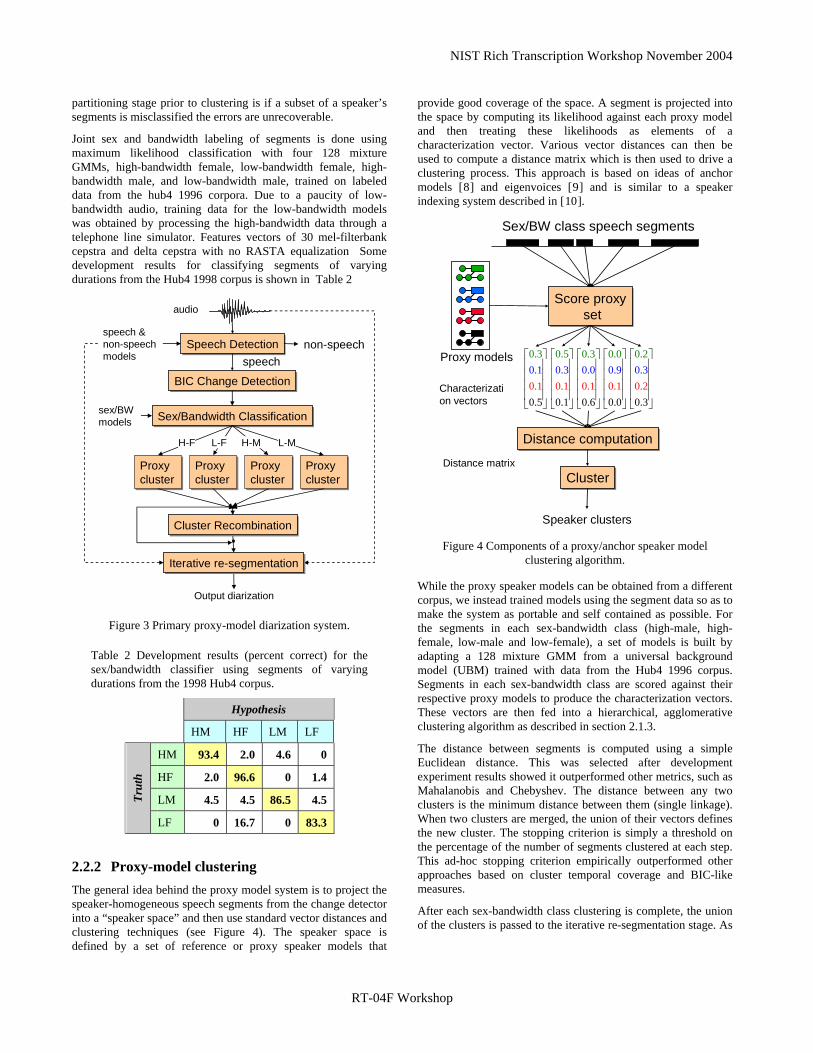
2.2 Proxy-Model System - Primary The primary system, shown in Figure 3, uses the same speech detection, change detection and iterative re-segmentation stages as the baseline system, but uses a sex/bandwidth segregation of segments and a new clustering scheme based on proxy-models.
2.2.1 Sex/Bandwidth Classification The aim of this stage is to partition the segments into common groupings of sex (male or female) and bandwidth (low-bandwidth: narrowband/telephone or high-bandwidth: studio). This is done to reduce the load on subsequent clustering, provide more flexibility in clustering settings (for example female speakers may have different optimal parameter settings than male speakers), and supply more side information about the speakers in the final output. The potential drawback in this
RT-04F Workshop
NIST Rich Transcription Workshop November 2004
partitioning stage prior to clustering is if a subset of a speaker’s segments is misclassified the errors are unrecoverable.
Joint sex and bandwidth labeling of segments is done using maximum likelihood classification with four 128 mixture GMMs, high-bandwidth female, low-bandwidth female, high-bandwidth male, and low-bandwidth male, trained on labeled data from the hub4 1996 corpora. Due to a paucity of low-bandwidth audio, training data for the low-bandwidth models was obtained by processing the high-bandwidth data through a telephone line simulator. Features vectors of 30 mel-filterbank cepstra and delta cepstra with no RASTA equalization Some development results for classifying segments of varying durations from the Hub4 1998 corpus is shown in Table 2
ClusterProxy clusterProxy cluster
audio
ClusterProxy clusterProxy cluster
ClusterProxy clusterProxy cluster
ClusterProxy clusterProxy cluster
BIC Change DetectionBIC Change Detection
Speech DetectionSpeech Detectionspeech
non-speech
Sex/Bandwidth ClassificationSex/Bandwidth Classification
L-MH-ML-FH-F
speech & non-speech models
sex/BW models
Output diarization
Iterative re-segmentationIterative re-segmentation
Cluster RecombinationCluster Recombination
Figure 3 Primary proxy-model diarization system.
Table 2 Development results (percent correct) for the sex/bandwidth classifier using segments of varying durations from the 1998 Hub4 corpus.
Hypothesis
HM HF LM LF
HM 93.4 2.0 4.6 0
HF 2.0 96.6 0 1.4
LM 4.5 4.5 86.5 4.5 Trut
h
LF 0 16.7 0 83.3
Proxy-model clustering el system is to project the
2.2.2The general idea behind the proxy modspeaker-homogeneous speech segments from the change detector into a “speaker space” and then use standard vector distances and clustering techniques (see Figure 4). The speaker space is defined by a set of reference or proxy speaker models that
provide good coverage of the space. A segment is projected into the space by computing its likelihood against each proxy model and then treating these likelihoods as elements of a characterization vector. Various vector distances can then be used to compute a distance matrix which is then used to drive a clustering process. This approach is based on ideas of anchor models [8] and eigenvoices [9] and is similar to a speaker indexing system described in [10].
0
0
.
.30.1
10.5
⎡ ⎤⎢ ⎥
Sex/BW class speech segments
Proxy models
Score proxyset
⎢ ⎥⎢ ⎥⎢ ⎥⎣ ⎦
Characterization vectors
Distance matrix
Speaker clusters
Score proxyset
Distance computation
0
0
.
.50.3
1 0
0
.
.30.0
10.6
⎡ ⎤⎢ ⎥⎢ ⎥⎢ ⎥⎢ ⎥⎣ ⎦
0
0
.
.20.3
20.3
⎡ ⎤⎢ ⎥⎢ ⎥⎢ ⎥⎢ ⎥⎣ ⎦
0
0
.
.00.9
10.0
⎡ ⎤⎢ ⎥⎢ ⎥⎢ ⎥⎢ ⎥⎣ ⎦
⎡ ⎤⎢ ⎥⎢ ⎥⎢ ⎥
0.1⎢ ⎥⎣ ⎦
Distance computation
ClusterCluster
Figure 4 Components of a proxy/anchor speaker model
While the proxy speaker models can be obtained from a different
sing a simple
ex-bandwidth class clustering is complete, the union
clustering algorithm.
corpus, we instead trained models using the segment data so as to make the system as portable and self contained as possible. For the segments in each sex-bandwidth class (high-male, high-female, low-male and low-female), a set of models is built by adapting a 128 mixture GMM from a universal background model (UBM) trained with data from the Hub4 1996 corpus. Segments in each sex-bandwidth class are scored against their respective proxy models to produce the characterization vectors. These vectors are then fed into a hierarchical, agglomerative clustering algorithm as described in section 2.1.3.
The distance between segments is computed uEuclidean distance. This was selected after development experiment results showed it outperformed other metrics, such as Mahalanobis and Chebyshev. The distance between any two clusters is the minimum distance between them (single linkage). When two clusters are merged, the union of their vectors defines the new cluster. The stopping criterion is simply a threshold on the percentage of the number of segments clustered at each step. This ad-hoc stopping criterion empirically outperformed other approaches based on cluster temporal coverage and BIC-like measures.
After each sof the clusters is passed to the iterative re-segmentation stage. As
RT-04F Workshop
NIST Rich Transcription Workshop November 2004
with the baseline system we also implemented a cluster recombination stage for post-evaluation experiments.
3. RT-04F DIARIZATION DATA AND ERROR MEASURE
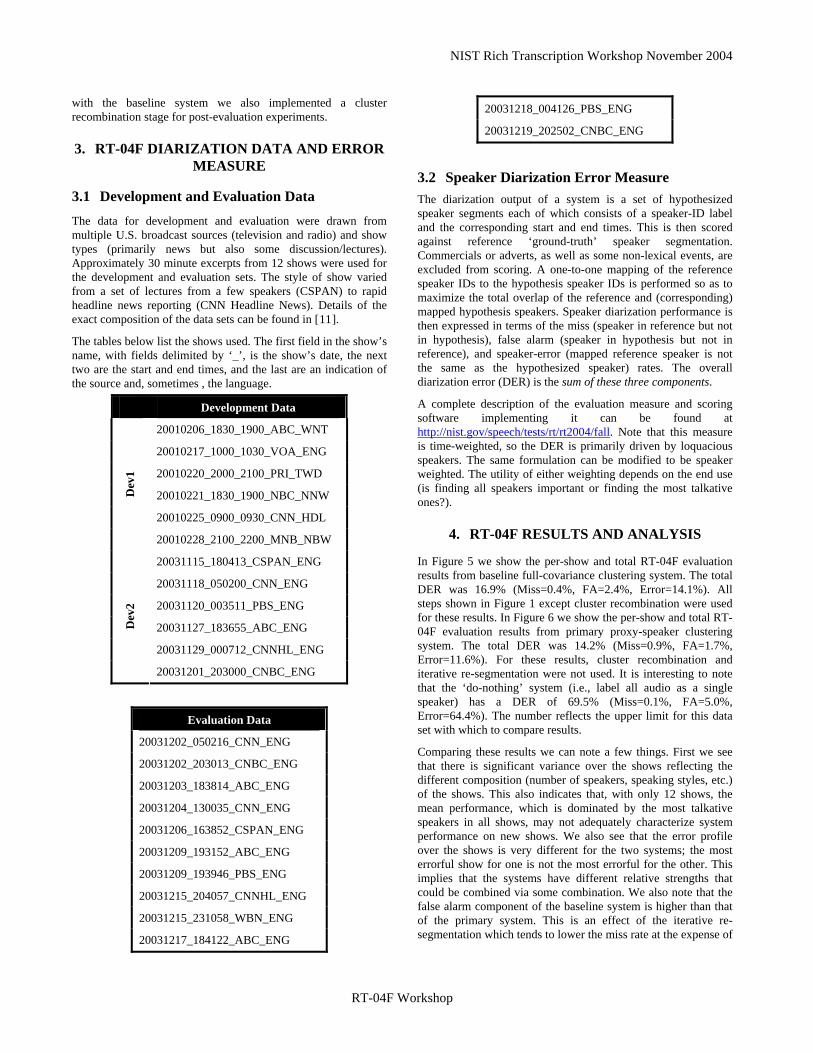
3.1 Development and Evaluation Data The data for development and evaluation were drawn from multiple U.S. broadcast sources (television and radio) and show types (primarily news but also some discussion/lectures). Approximately 30 minute excerpts from 12 shows were used for the development and evaluation sets. The style of show varied from a set of lectures from a few speakers (CSPAN) to rapid headline news reporting (CNN Headline News). Details of the exact composition of the data sets can be found in [11].
The tables below list the shows used. The first field in the show’s name, with fields delimited by ‘_’, is the show’s date, the next two are the start and end times, and the last are an indication of the source and, sometimes , the language.
Development Data
20010206_1830_1900_ABC_WNT
20010217_1000_1030_VOA_ENG
20010220_2000_2100_PRI_TWD
20010221_1830_1900_NBC_NNW
20010225_0900_0930_CNN_HDL
Dev
1
20010228_2100_2200_MNB_NBW
20031115_180413_CSPAN_ENG
20031118_050200_CNN_ENG
20031120_003511_PBS_ENG
20031127_183655_ABC_ENG
20031129_000712_CNNHL_ENG
Dev
2
20031201_203000_CNBC_ENG
Evaluation Data
20031202_050216_CNN_ENG
20031202_203013_CNBC_ENG
20031203_183814_ABC_ENG
20031204_130035_CNN_ENG
20031206_163852_CSPAN_ENG
20031209_193152_ABC_ENG
20031209_193946_PBS_ENG
20031215_204057_CNNHL_ENG
20031215_231058_WBN_ENG
20031217_184122_ABC_ENG
20031218_004126_PBS_ENG
20031219_202502_CNBC_ENG
3.2 Speaker Diarization Error Measure The diarization output of a system is a set of hypothesized speaker segments each of which consists of a speaker-ID label and the corresponding start and end times. This is then scored against reference ‘ground-truth’ speaker segmentation. Commercials or adverts, as well as some non-lexical events, are excluded from scoring. A one-to-one mapping of the reference speaker IDs to the hypothesis speaker IDs is performed so as to maximize the total overlap of the reference and (corresponding) mapped hypothesis speakers. Speaker diarization performance is then expressed in terms of the miss (speaker in reference but not in hypothesis), false alarm (speaker in hypothesis but not in reference), and speaker-error (mapped reference speaker is not the same as the hypothesized speaker) rates. The overall diarization error (DER) is the sum of these three components.
A complete description of the evaluation measure and scoring software implementing it can be found at http://nist.gov/speech/tests/rt/rt2004/fall. Note that this measure is time-weighted, so the DER is primarily driven by loquacious speakers. The same formulation can be modified to be speaker weighted. The utility of either weighting depends on the end use (is finding all speakers important or finding the most talkative ones?).
4. RT-04F RESULTS AND ANALYSIS
In Figure 5 we show the per-show and total RT-04F evaluation results from baseline full-covariance clustering system. The total DER was 16.9% (Miss=0.4%, FA=2.4%, Error=14.1%). All steps shown in Figure 1 except cluster recombination were used for these results. In Figure 6 we show the per-show and total RT-04F evaluation results from primary proxy-speaker clustering system. The total DER was 14.2% (Miss=0.9%, FA=1.7%, Error=11.6%). For these results, cluster recombination and iterative re-segmentation were not used. It is interesting to note that the ‘do-nothing’ system (i.e., label all audio as a single speaker) has a DER of 69.5% (Miss=0.1%, FA=5.0%, Error=64.4%). The number reflects the upper limit for this data set with which to compare results.
Comparing these results we can note a few things. First we see that there is significant variance over the shows reflecting the different composition (number of speakers, speaking styles, etc.) of the shows. This also indicates that, with only 12 shows, the mean performance, which is dominated by the most talkative speakers in all shows, may not adequately characterize system performance on new shows. We also see that the error profile over the shows is very different for the two systems; the most errorful show for one is not the most errorful for the other. This implies that the systems have different relative strengths that could be combined via some combination. We also note that the false alarm component of the baseline system is higher than that of the primary system. This is an effect of the iterative re-segmentation which tends to lower the miss rate at the expense of
RT-04F Workshop
NIST Rich Transcription Workshop November 2004
increasing the false alarm rate by broadening boundaries around speech segments.
05
101520253035
CNN-12-02
CNBC-12-02
ABC-12-03
CNN-12-04
CSPAN-12-06
ABC-12-09
PBS-12-09
CNNHL-12-15
WBN-12-15
ABC-12-17
PBS-12-18
CNBC-12-19 Total
DER
(%)
MissFAError
Full Covariance Clustering
Figure 5 Per-show and total RT-04F evaluation results from baseline full-covariance clustering system. The total DER was 16.9% (Miss=0.4%, FA=2.4%, Error=14.1%)
05
101520253035
CNN-12-02
CNBC-12-0
2
ABC-12-03
CNN-12-04
CSPAN-12-06
ABC-12-09
PBS-12-09
CNNHL-12-15
WBN-12
-15
ABC-12-17
PBS-12-18
CNBC-12-1
9Total
DER
(%)
Proxy SpeakersMissFAError
Figure 6 Per-show and total RT-04F evaluation results from primary proxy-speaker clustering system. The total DER was 14.2% (Miss=0.9%, FA=1.7%, Error=11.6%)
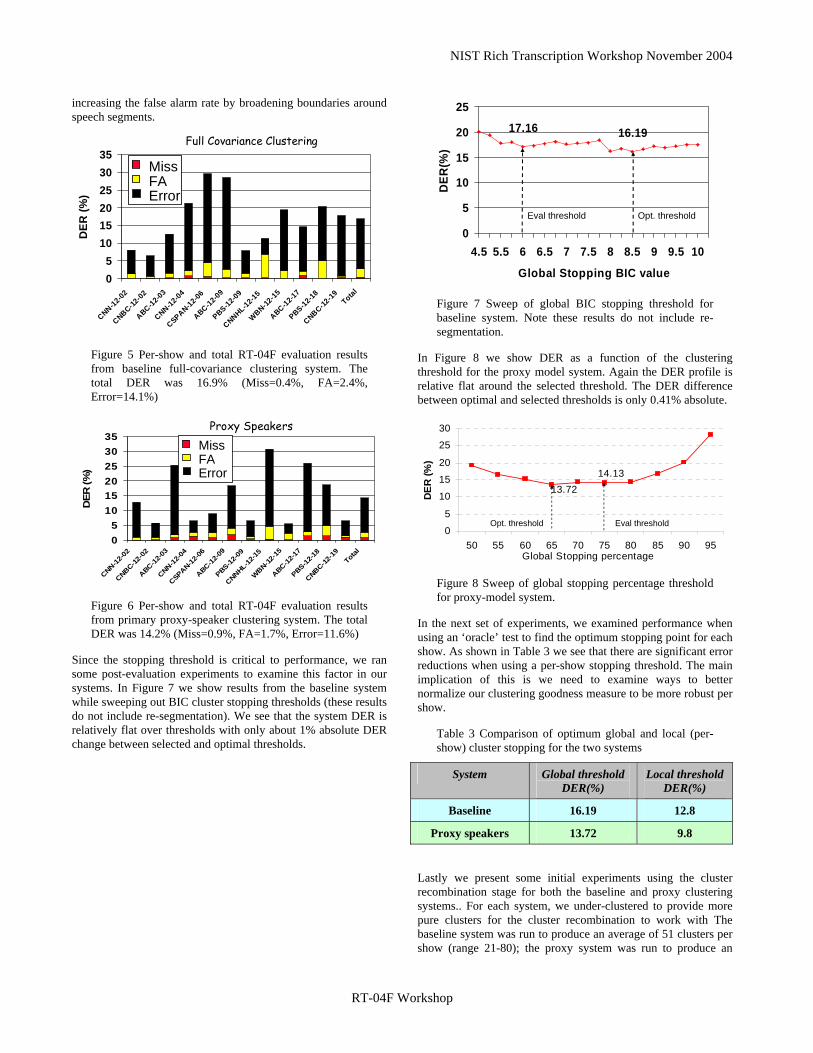
Since the stopping threshold is critical to performance, we ran some post-evaluation experiments to examine this factor in our systems. In Figure 7 we show results from the baseline system while sweeping out BIC cluster stopping thresholds (these results do not include re-segmentation). We see that the system DER is relatively flat over thresholds with only about 1% absolute DER change between selected and optimal thresholds.
16.1917.16
0
5
10
15
20
25
4.5 5.5 6 6.5 7 7.5 8 8.5 9 9.5 10
Global Stopping BIC value
DER
(%)
Eval threshold Opt. threshold
Figure 7 Sweep of global BIC stopping threshold for baseline system. Note these results do not include re-segmentation.
In Figure 8 we show DER as a function of the clustering threshold for the proxy model system. Again the DER profile is relative flat around the selected threshold. The DER difference between optimal and selected thresholds is only 0.41% absolute.
14.1313.72
0
5
10
15
20
25
30
50 55 60 65 70 75 80 85 90 95Global Stopping percentage
DER
(%)
Eval thresholdOpt. threshold
Figure 8 Sweep of global stopping percentage threshold for proxy-model system.
In the next set of experiments, we examined performance when using an ‘oracle’ test to find the optimum stopping point for each show. As shown in Table 3 we see that there are significant error reductions when using a per-show stopping threshold. The main implication of this is we need to examine ways to better normalize our clustering goodness measure to be more robust per show.
Table 3 Comparison of optimum global and local (per-show) cluster stopping for the two systems
System Global threshold DER(%)
Local threshold DER(%)
Baseline 16.19 12.8
Proxy speakers 13.72 9.8
Lastly we present some initial experiments using the cluster recombination stage for both the baseline and proxy clustering systems.. For each system, we under-clustered to provide more pure clusters for the cluster recombination to work with The baseline system was run to produce an average of 51 clusters per show (range 21-80); the proxy system was run to produce an
RT-04F Workshop

NIST Rich Transcription Workshop November 2004
average of 69 clusters per show (range 46-95). The under-clustering for the recombination was not optimized.
Table 4 summarizes the results for the two systems. We clearly see that the cluster recombination provides a significant reduction in DER for both systems. The largest drop was for the baseline system. These results represent performance for the complete systems depicted in Figure 1 and Figure 3.
Table 4 Initial results of applying cluster recombination and re-segmentation to the baseline and proxy systems.
System Miss (%)
False Alarm
(%)
Spkr Error (%)
DER (%)
Baseline 0.9 1.7 14.6 17.2
+ recombination 0.7 1.8 10.7 13.2
+ re-segmentation 0.5 1.9 10.3 12.8
Proxy speakers 0.9 1.7 11.6 14.1
+ recombination 1.7 1.5 8.5 11.7
+ re-segmentation 0.9 1.7 8.4 11.0
5. TELEPHONE SPEECH SPEAKER RECOGNITION EXPERIMERNTS
One key application of speaker diarization is to aid some downstream process. In this section we describe how we have applied our speaker diarization system to improve performance in a speaker recognition task using conversational telephone speech.
5.1 Summed Channel Speaker Recognition Task One of the recent challenges in the NIST Speaker Recognition Evaluations (SREs) has been speaker detection using summed channel telephone speech. The core task is speaker detection: given telephone conversations known to include a particular speaker (training data), determine if that speaker is speaking in a new telephone conversation between unknown participants (testing data). Normally, only one channel of the telephone conversations is used, which is the classic text-independent speaker detection or verification task. In the summed channel task, the two channels are summed for the training data, the testing data or both. Such a situation could arise when searching through audio containing more than one speaker, such as call center or meeting archives. The problem now becomes dealing with “contaminated” training and testing audio and a natural approach is to use speaker diarization to aid in purifying the audio prior to training and testing a speaker detection system. Other approaches are discussed in [12].
The data used in experiments presented here is the 2004 NIST SRE [13] and was derived from the MIXER/MMSR corpus [14]. The data is comprised of telephone conversations from 310 speakers. Most of the conversations are in English, although a subset is in Arabic, Mandarin, Spanish or Russian. For the summed channel task, the training data for a speaker consists of
three conversations, each containing the speaker talking with three different participants, and the test data consists of one conversation between two unknown speakers. The non-summed data for training and testing (i.e. the individual sides) are also used for contrastive experiments when only the training or testing data is summed.
5.2 Application to Test Data Figure 9 shows how we apply speaker diarization when the test input is multi-speaker audio. We use the diarization system to produce speaker-homogeneous speech clusters that are then processed as normal through our speaker detection system. The detection scores for each cluster are then combined via a max function to produce the final detection score for the input conversation.
1sp detector
1sp detector
1sp detector
1sp detector
MAX
MAX
Speaker DiarizationSpeaker
DiarizationDetection score
Speaker Model
… …
Test conversation
Figure 9 Application of speaker diarization in summed channel speaker detection
We applied the baseline full-covariance clustering system to the data. In the speech detection only a non-speech model trained from non-speech audio from telephone audio was used. Cluster re-combination was not applied. The fact that conversations generally only contain two speakers can be used to assist the diarization system. However, this is not always the case and it can be beneficial allow the diarization system to produce more than two clusters to deal with not only extra speakers, but extraneous audio sources. In our experiments we did not explicitly use knowledge of the number of speakers, but did do development experiments using two speaker telephone conversations.
The detection error tradeoff (DET) curves for the experiment are shown in Figure 10. For these results the speaker model was trained using the individual side (un-summed) data. The 1s test also used the individual side data for test and processed it through the standard speaker detection system. This is provided to show the optimum case of using uncontaminated test data. The 1c test uses the summed test audio and processes with the diarization system shown in Figure 9ii. It is clear that the diarization system pre-processing is able to bring the detector performance very close to the uncontaminated situation.
ii Performance for processing the 1c test data through the standard speaker detector is particularly poor and not shown here since it is not considered a viable alternative.
RT-04F Workshop

NIST Rich Transcription Workshop November 2004
5.3 Application to Training Data For speaker model training from summed channel audio, we need to first diarize each training conversation into speaker homogeneous clusters, second determine which conversation clusters are from a common speaker, and finally train a speaker model with the data from the common speaker. Figure 11shows the system used for summed channel training involving these steps.
The speaker diarization system processes each training conversation individually to produce conversation dependent clusters. We next run cluster recombination on these conversation clusters to find which ones are from a common speaker. One constraint added here is that clusters from the same conversation can not be merged during the recombination process. The constraint usually works to stop the recombination process before a single node is formed, thus this step does not require a stopping threshold. At the end of the recombination, the set of conversation clusters with the smallest average intra-cluster distance is selected as the one containing the common speaker and a speaker model is trained from the corresponding data.
3s train
1c test
1s test
Figure 10 DET curves for speaker detection system using summed channel test data. The 1c test applied the speaker diarization system to the summed conversation test. To contrast with no contamination, the 1s test uses the individual side test data in the standard detector.
A1. B1, C2
Clustercombination
Clustercombination
Speaker diarizationSpeaker
diarizationSpeaker diarizationSpeaker
diarizationSpeaker diarizationSpeaker
diarization
A2. B2, C1
SelectSelect
TrainTrain
Speaker model
Figure 11 Application of speaker diarization to model training with summed channel data.
In Figure 12 we show the DET curves from applying this system to summed channel training data. In these results, the test data was always the individual side (un-summed) data. The 3c train case used summed training data and applied the system in Figure 11for speaker model training. The 3s train case used un-summed data to train the speaker model and is presented to show the optimum uncontaminated training condition. Again we see that the application of the diarization system for summed training data produces results very close to the optimum un-summed condition.
1s test
3c train
3s train
Figure 12 DET curves for speaker detection system using summed channel training data. The 3c train applied the speaker diarization training system to the summed conversation data. To contrast with no contamination, the 3s train uses the individual side train data to train the speaker model. .
Finally, Figure 13 shows the performance of using summed channel data and the above systems for both training and testing. The optimum un-summed case is also shown. This again
RT-04F Workshop

NIST Rich Transcription Workshop November 2004
demonstrates that diarization can indeed aid speaker detection systems when using summed channel audio.
3c train1c test
3s train1s test
Figure 13 DET curves for speaker detection system using summed channel train and test data. The 3c train / 1c test curve applied the diarization systems described in the test. The 3s train / 1s train used un-summed data and standard train and detection systems.
6. CONCLUSIONS This paper has outlined the speaker diarization systems developed by MITLL and applied in the DARPA EARS Rich Transcription evaluations on Broadcast audio. In addition to a baseline system using full-covariance Gaussian clustering, we also developed a new proxy-speaker based clustering system which uses anchor model concepts to project speech segments into vectors in a speaker space. Our systems produced diarization error rates of 16.9% and 14.2%, respectively, on the RT-04F evaluation. Subsequent experiments found using cluster recombination reduced our baseline system DER to 12.8% and our Proxy-speaker system DER to 11.0%. It is expected these numbers will decrease further with optimization. We also described systems and experiments that applied speaker diarization as input to improve speaker detection on multi-speaker audio.
As the DER continues to decrease, it is more important to correlate the DERs with application utility so as to know when and how to deploy these systems. The required DER for diarization consumption by machines, such as speaker detection or STT adaptation, may be very different that that needed for human consumption. Indeed, the error measure used may not be applicable for all consuming applications. Is temporal weighting optimal? How do we account for segment continuity? To help gain a better idea of human perception of diarization output and as a tool to aid research, we have produced a plug-in to WaveSurfer [15], an open source tool for sound visualization and manipulation, to allow display and play-back of diarization outputiii. A screen shots from the plug-in are shown in Figure
iii The plug-in can actually display any RTTM record type.
14. We expect to make this plug-in publicly availbe in the near future.
RTTM + UEM displays
Cluster segments display
Figure 14 Screen shots of RTTM display tool plug-in for WaveSurfer. The plug-in displays multiple RTTMs, optional UEM masking, and speaker segment play-next/-play-last features along with all display and analysis capabilities of WaveSurfer.
Future research efforts will continue to focus on improving the diarization systems, with an emphasis on better exploiting STT output (e.g., [16]).
REFERENCES [1] D. A. Reynolds and P. Torres-Carrasquillo, “Approaches and Applications of Audio Diarization,” Special Session on HLT, ICASSP 2005
[2] S. Chen and P. Gopalakrishnam, “Speaker, Environment and Channel Change Detection and Clustering via the Bayesian Information Criterion,” 1998 DARPA Broadcast News Workshop [3] B. Zhou, J.H.L. Hansen, "Unsupervised Audio Stream Segmentation and Clustering via the Bayesian Information Criterion," ICSLP 2000 [4] L. Wilcox, F. Chen, D. Kumber, and V. Balasubramanian, "Segmentation of speech using speaker identification," ICASSP 2004 [5] C. Barras, X. Zhu, S. Meignier and J.-L. Gauvain, “Improving Speaker Diarization,” RT-04F Workshop, Nov 2004 [6] D. A. Reynolds, T. F. Quatieri, R. B. Dunn, “Speaker Verifcation Using Adapted Gaussian Mixture Models," Digital Signal Processing, vol.10, pp. 19-41 [7] D. Reynolds, E. Singer, B. Carlson, J. O'Leary, J. McLaughlin and M. Zissman; “Blind clustering of speech utterances based on speaker and language characteristics,” ICSLP 1998 [8] D.E. Sturim, D. A. Reynolds, E. Singer, and J. P. Campbell, “Speaker Indexing in Large Audio Databases using Anchor Models,” ICASSP 2001
RT-04F Workshop
NIST Rich Transcription Workshop November 2004
[9] O. Thyes, R. Kuhn, P. Nguyen, and J.-C. Junqua, “Speaker Identification And Verification Using Eigenvoices,” ICSLP 2000 [10] Y. Akita and T. Kawahara, “Unsupervised Speaker Indexing using Anchor Models and Automatic Transcription of Discussions,” Eurospeech 2003 [11] J. Fiscus, et. al, “Results of the Fall 2004 STT and MDE Evaluation,” RT-04F Workshop, Nov. 2004 [12] R.B. Dunn, D. A. Reynolds, and T. F. Quatieri, “Approaches to Speaker Detection and Tracking in Conversational Speech,” Digital Signal Processing Review Journal, January 2000 [13] http://www.nist.gov/speech/tests/spk/2004/ [14] Cieri, C., Campbell, J. P., Nakasone, H., Miller, D., and Walker, K., “The Mixer Corpus of Multilingual, Multichannel Speaker Recognition Data,” LREC 2004, Lisbon, Portugal, 24-30 May 2004 [15] http://www.speech.kth.se/wavesurfer/ [16] L. Canseco-Rodriguez, L. Lamel, and J-L. Gauvain, "Speaker Diarization from Speech Transcripts", ICSLP 2004, pp. 1272-1275, Oct. 2004.
RT-04F Workshop