the mobile moneymaker
TRANSCRIPT


T h e M o b i l e M o n e y m a k e r D e c e m b e r 3 , 2 0 1 0
MASTER THESIS - THE MOBILE MONEYMAKER
HOW TUNING THE CONFIGURATION OF PRODUCT CHARACTERISTICS
AND PRICING CAN INCREASE PROFITABILITY OF APP DEVELOPERS.
PLACE AND DATE
AMSTERDAM, DECEMBER 3RD 2010
AUTHOR
G.J. (GERT JAN) SPRIENSMA
MASTER STUDENT INDUSTRIAL ENGINEERING AND MANAGEMENT
TRACK FINANCIAL ENGINEERING
UNIVERSITY OF TWENTE
1ST SUPERVISOR
R.A.M.G. (REINOUD) JOOSTEN – ASSISTANT
PROFESSOR IN ECONOMICS
2ND SUPERVISOR
A.B.J.M. (FONS) WIJNHOVEN – ASSOCIATE
PROFESSOR OF KNOWLEDGE MANAGEMENT AND
INFORMATION SYSTEMS
COMPANY SUPERVISOR
M.P. (MICHIEL) BOERE – DIRECTOR BUSINESS
DEVELOPMENT EBUDDY

T h e M o b i l e M o n e y m a k e r D e c e m b e r 3 , 2 0 1 0
Acknowledgements
In the past 6 months I performed a research in order to graduate from Industrial Engineering and
Management – Financial Engineering. This graduation thesis, which you are reading right now, is a
combined result of a lot of people which I hereby would like to thank for their support.
First of all I would like to thank the supervisors of the University of Twente, Reinoud Joosten en
Fons Wijnhoven. As the study lacked a clear assignment to start with, both professors contributed
greatly with research ideas and encouraged me to just start. Moreover, in the proceeding of the
process their sharp remarks, the discussions, individual support and most important enthusiasm
kept me motivated to improve the study to this level.
Of great help were my colleagues at eBuddy. I wish to thank the company’s supervisor Michiel
Boere and colleague Rob Draaijer for the great atmosphere and inspiring environment. By inviting
me into discussions and talk about business, I got more insight and feeling for the mobile
ecosystem. Additionally, I want to thank Rob for his help in setting up and discussing a
methodological solid survey framework. As I was not aware of all available literature this saved a
lot of time and certainly increased the quality. Special thanks go to Viache Babic and Remco van den
Elzen for reviewing my thesis and discussing mathematical problems with me. I want to thank Jan
Joost Rueb for hiring me without a clear assignment and giving me the opportunity to set up my
own research.
Last, but not least, I would like to thank my parent, brother, sister and all my great friends for
supporting me in different kind of ways. My family, for always being there and supporting me, even
while the path to graduation was a bumpy and long one. My friends for joining me in the greatest
time of my life! All those trips, events, drinks and talks really made me to who I am today.
KEYWORDS

T h e M o b i l e M o n e y m a k e r D e c e m b e r 3 , 2 0 1 0
Management Summary
PURPOSE – Mobile Appstores only recently attracted attention after Apple introduced their
Appstore. With the tremendous increase in the number of smartphones the mobile ecosystem is to
become important. With expected app revenue of 30 billion in 2013, price discrimination methods,
already used in other types of markets, happen to be increasingly important. This study aims to
map the mobile ecosystem and find feasible price discrimination methods, with a specific focus on
virtual goods, which turns out to be a major revenue driver.
APPROACH – This study is founded on extensive literature about price discrimination and
information systems aimed at the mobile ecosystem. By following a structured literature search
much effort has been done to not miss important papers. Based on existing economic models, a
model aimed at the virtual goods situation could be derived. Because one of the variables in the
model was unknown, a survey, based on prior literature, was developed to use as a measure of
correlation. To show instrument validity, conceptual validation, pretest, pilot test and statistical
controls are used.
FINDINGS – This study shows that virtual goods are from both a product characteristics perspective
and a price discrimination perspective the best monetization method. Furthermore, the results of
the study show, that although literature suggests different, bundling, versioning and virtual goods
are actually different sides of the same concept and hence one economic model could explain all
three. The economic model shows that offering goods together in a bundle is always favorable
regardless of the correlation between goods, although the degree to which bundling is favorable
differs. Additionally seven measures, to estimate the correlation between two goods in the mobile
ecosystem, are proven to indeed influence the correlation between two goods.
VALUE – This study contributes in many ways to the academic world. First it contributes to a
deeper understanding of the mobile ecosystem as almost no prior literature is available. Secondly it
connects two research streams, about bundling and versioning and offers a theoretical solution for
combined offerings. Finally this study elaborates on the, unexplored, virtual goods territory and
partly validates preliminary research about motivations to purchase virtual goods.
NEXT STEPS – To implement the findings of this study, mobile developers should reconsider their
functionality offering based on the measures found in this study and aim for the most diversified
(low correlation) offering. While diversification yields higher profits in general, bundling high
correlated goods is relatively more favorable over the a’-la-carte offering so with an existing set of
functionalities, it is recommend to bundle the highest correlated goods. Several interesting further
research ideas can be derived from this study. Most importantly is how a’-la-carte pricing and
bundling can be mutually used within companies and how bundling affects competition. Moreover,
validation of the measures for correlation should be replicated in more reliable and representative
sample populations. Lastly customized bundling i.e., variable good choice within bundles is based
on unrelated literature a viable research opportunity.

T h e M o b i l e M o n e y m a k e r D e c e m b e r 3 , 2 0 1 0
TABLE OF CONTENTS
1 INTRODUCTION ............................................................................................................................................. 1
1.1 BACKGROUND .................................................................................................................................................. 1
1.2 RESEARCH GOAL................................................................................................................................................ 2
1.3 RESEARCH APPROACH ........................................................................................................................................ 2
1.4 STRUCTURE OF THESIS ........................................................................................................................................ 3
2 THE MOBILE APPSTORE ECOSYSTEM ............................................................................................................. 4
2.1 DEFINITIONS .................................................................................................................................................... 4
2.2 CHARACTERISTICS OF MOBILE APPSTORES .............................................................................................................. 4
2.3 GOODS IN APPSTORES ...................................................................................................................................... 14
2.4 MONETIZATION STRATEGIES OF PUBLISHERS ......................................................................................................... 17
2.5 CONCLUSIONS ................................................................................................................................................ 20
3 PRICE DISCRIMINATION IN MOBILE APPSTORES .......................................................................................... 23
3.1 DEFINITIONS .................................................................................................................................................. 23
3.2 NON-UNIFORM PRICING ................................................................................................................................... 23
3.3 POTENT PRICING STRATEGIES IN MOBILE APPSTORES .............................................................................................. 26
3.4 NON-UNIFORM PRICING WITH VIRTUAL GOODS ..................................................................................................... 31
3.5 CONCLUSIONS ................................................................................................................................................ 32
4 ECONOMIC MODEL ...................................................................................................................................... 34
4.1 DEFINITIONS .................................................................................................................................................. 34
4.2 ASSUMPTIONS ................................................................................................................................................ 34
4.3 MODEL ......................................................................................................................................................... 35
4.4 THEORETICAL RESULTS ...................................................................................................................................... 41
4.5 CONCLUSIONS ................................................................................................................................................ 49
5 CORRELATION ............................................................................................................................................. 51
5.1 DEFINITIONS .................................................................................................................................................. 51
5.2 DIMENSIONS .................................................................................................................................................. 51
5.3 SURVEY DESIGN .............................................................................................................................................. 55
5.4 SURVEY IMPLEMENTATION ................................................................................................................................ 58
5.5 CORRELATION SURVEY RESULTS .......................................................................................................................... 64
5.6 CONCLUSIONS ................................................................................................................................................ 69
6 DISCUSSION ................................................................................................................................................. 71
6.1 CONCLUSIONS ................................................................................................................................................ 71
6.2 THEORETICAL IMPLICATIONS .............................................................................................................................. 71
6.3 MANAGERIAL IMPLICATIONS ............................................................................................................................. 72
6.4 LIMITATIONS AND FURTHER RESEARCH ................................................................................................................. 73
7 REFERENCES ................................................................................................................................................ 77
P a g e | 1
T h e M o b i l e M o n e y m a k e r D e c e m b e r 3 , 2 0 1 0
1 INTRODUCTION
1.1 Background
A range of applications stores (Chang and Yuan 2008) saw the light of day after Apple introduced
the iPhone in July 2008 enabling customers to intuitively buy apps by an on device Appstore
application. The number of apps quickly increased from 500 to more than 25,000 after eight
months, leading to over 800 million downloads (Apple 2009). In January 2010 the number of apps
in the Appstore exceeded 150,000 (Techcrunch 2010). Although a few Appstores (Getjar, Handango
and Handmark) existed for many years already, Apple made it successful.
These Appstores created opportunities for app developers like eBuddy (see Appendix A for the
company profile). Customers tend to be more likely to pay for software on mobile phones e.g., the
web messenger of eBuddy is free and nobody wants to pay for it, while a significant percentage of
the users pays for the same functionalities on the mobile phone. The total Appstore market will be
important in the near future, since total sales of all Appstores combined is expected to grow to 30
billion in 2013 (Gartner 2010), hence eBuddy decided to launch products in multiple stores like the
Apple App Store, Google Android Market, Nokia Ovi Store and Getjar.
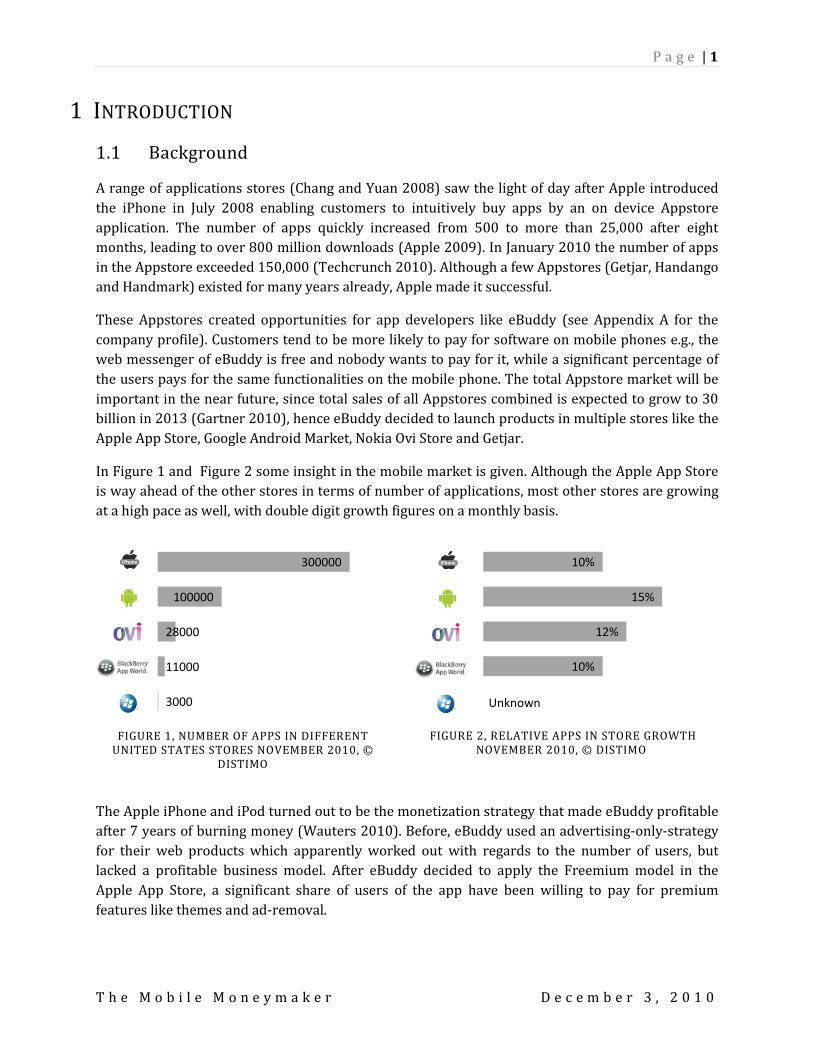
In Figure 1 and Figure 2 some insight in the mobile market is given. Although the Apple App Store
is way ahead of the other stores in terms of number of applications, most other stores are growing
at a high pace as well, with double digit growth figures on a monthly basis.
FIGURE 1, NUMBER OF APPS IN DIFFERENT
UNITED STATES STORES NOVEMBER 2010, © DISTIMO
FIGURE 2, RELATIVE APPS IN STORE GROWTH NOVEMBER 2010, © DISTIMO
The Apple iPhone and iPod turned out to be the monetization strategy that made eBuddy profitable
after 7 years of burning money (Wauters 2010). Before, eBuddy used an advertising-only-strategy
for their web products which apparently worked out with regards to the number of users, but
lacked a profitable business model. After eBuddy decided to apply the Freemium model in the
Apple App Store, a significant share of users of the app have been willing to pay for premium
features like themes and ad-removal.
3000
11000
28000
100000
300000
Unknown
10%
12%
15%
10%
P a g e | 2
T h e M o b i l e M o n e y m a k e r D e c e m b e r 3 , 2 0 1 0
Several different monetization methods are used in the Appstores; among the important ones are
ad-driven apps like Nu.nl1, paid-only apps like TomTom2 and a combination of both, like the eBuddy
app3. The eBuddy app offers a free version which is a limited version of the paid one, trying to
convert free customers to paying customers. A third monetization method needs a little more
explanation. Apple decided to include in-app payments, allowing developers to build in-app stores
to sell premium features and virtual goods. A lot of games utilize this opportunity selling in-game
credit via the Appstore, allowing customers to increase experience points (Farmville4), buy favor
points to attack the enemy (iMobster5) or buy extra levels (Tap Tap Revenge6).
In this study pricing issues related to mobile Appstores are examined. Although many developers
publishing in Appstores are profitable, no prior academic research has been done about Appstores
in general and potent pricing strategies.
1.2 Research goal
This study is focused on the way that publishers can enhance their profitability in the relatively
new mobile Appstores market. Therefore the overall research question is:
What configuration of product characteristics and pricing will increase profitability of
mobile App developers?
Eventually the principal, eBuddy, will be taken into account and the configuration of product
characteristics and pricing strategy will be specified to eBuddy.
1.3 Research approach
To answer all research questions properly a structured way of finding and assessing literature is
used according to papers of Schwartz and Russo (2004), Webster and Watson (2002), and van der
Linde (2004). The process and results can be found in Appendix B. In Appendix B, table 9 the
concept matrix can be found, where all concepts are on both axes in order to show missing fields in
the literature. Based on the concept matrix three fields of interest are defined.
Price elasticity in combination with bundling and versioning
Network effects in combination with bundling and versioning
Customer behavior in combination with bundling and versioning
This study will discuss network effects only circuitous, because there is not sufficient relevance
with the general scope of the study. Both price elasticity and customer behavior in combination
with bundling and versioning will be dealt with in greater detail.
1 http://itunes.apple.com/nl/app/nu/id294726570?mt=8 2 http://itunes.apple.com/nl/app/tomtom-west-europa/id326075062?mt=8 3 http://itunes.apple.com/us/app/ebuddy-messenger/id320087242?mt=8 4 http://itunes.apple.com/us/app/farmville-by-zynga/id375562663?mt=8 5 http://itunes.apple.com/nl/app/imobsters/id326987512?mt=8 6 http://itunes.apple.com/us/app/tap-tap-revenge-3/id326916014?mt=8

P a g e | 3
T h e M o b i l e M o n e y m a k e r D e c e m b e r 3 , 2 0 1 0
Section 2 gives a broad introduction into the world of mobile Appstores and the characteristics of
the actors. Section 3 describes all suitable pricing methods and concludes with which methods are
feasible given the characteristics from Section 2. Based on these sections an economic model will be
constructed in Section 4, where, without determining exact configurations, mathematically some
ideal types are constructed.
The results will be interpreted and discussed in the final part of the study. First in section 5 the
model is used to determine what configuration will yield the highest profit for eBuddy. Finally in
section 6, the conclusions are drawn, followed by a discussion about how universal the research is,
what limitations apply and what theoretical and managerial (aimed at eBuddy) implications there
are.
In order to determine the optimal strategy for eBuddy, the following research questions have to be
answered, with between curly brackets the type of question (Vaus 2001).
1. What price discrimination method is the most feasible given the characteristics of the
mobile ecosystem?
a. What are the characteristics of the actors in the mobile ecosystem and how do they
monetize applications? (Descriptive)
b. What kind of price discrimination methods can be distinguished and under which
circumstances are they applicable? (Descriptive)
c. Which price discrimination methods are feasible to adopt and how do they related?
(Prescriptive)
2. When does price discrimination increase profits and how can we measure these conditions?
a. How can feasible price discrimination methods be mathematically modeled?
(Prescriptive)
b. Under what conditions are price discrimination methods preferable? (Evaluative)
c. What causal relationships are available to measure the variable and which are statistical significant? (Evaluative)
1.4 Structure of thesis
Every section consists of several subsections, where the first subsection identifies several key
definitions the reader should know before reading the section. The last subsection wraps up the
content discussed in the section and draws some preliminary conclusions. Each subsection deals
with a specific subject and ends with a recap of what is discussed in that subsection.
The first part of the thesis is the result of the literature research to answer the first research
question. Afterwards an economic model is constructed taken into account the limitations and
assumptions made in the first sections. Finally the model is used to find guidelines for the
configuration of the product portfolio and theoretical and managerial implications are discussed.
The study clearly omits eBuddy in the first three sections in order to remain general, but in order to
stay close to eBuddy’s environment; most examples will be related to the (mobile) software
industry.

P a g e | 4
T h e M o b i l e M o n e y m a k e r D e c e m b e r 3 , 2 0 1 0
2 THE MOBILE APPSTORE ECOSYSTEM In this section the overall goal is to find the best method to generate revenue in mobile Appstores.
In order to find a suitable answer, first the characteristics of Appstores and products therein are
discussed. Afterwards the study digs deeper into suitable monetization models and concludes with
assumptions and restrictions applicable to the remainder of the study.
2.1 Definitions
In this section various new terms will be introduced. To increase readers’ convenience in this
subsection, all definitions of new terms used in this section are given in alphabetical order.
APPSTORE An online shop to purchase Smartphone software (apps).
EXPERIENCE GOOD
A product or service where product characteristics such as quality or usefulness are difficult to observe in advance, but these characteristics can be ascertained upon consumption.
HEDONIC GOOD A product of service that pleasures the senses.
INFORMATION GOOD
A type commodity whose main market value is derived from the information it contains.
NETWORK EFFECTS The utility that a given user derives from a good depends upon the number of other users who are in the same network.
2.2 Characteristics of mobile Appstores
The distribution of mobile content is changing at a high pace. However, only until a few years ago
the industry could be described as hardly existing. Ringtones and applications distribution was
dominated by the carriers, who tried to monetize their customers by selling games and other
consumer targeted products. Besides, third-party distributors such as Jamba, sold ringtones and
wallpapers while the high-end market was covered by Smartphone-focused storefronts like
Handango, aimed at enterprise and productivity applications.
After the introduction of the Apple App Store all industry players were forced to innovate as well.
The Apple App Store, accessible by iPhone and iPod touch users, was an immediate success. From
the initial more than expected number of apps available (500) to the download behavior of
customers (1 billion downloads in just 9 months). Currently, as of November 2010, the number of
apps available exceeds 300,000, while the number of downloads already surpassed the 5 billion7.
2.2.1 THE MARKET Soon many players in the market followed Apple’s lead and announced their own Appstore.
However, not only the handset manufacturers tried to copy the Appstore idea, companies down-
and upstream in the value chain as well. In Table 1 a hierarchical overview of all segments in the 7 http://www.distimo.com/appstores/app-store/18-Apple_App_Store_for_iPhone

P a g e | 5
T h e M o b i l e M o n e y m a k e r D e c e m b e r 3 , 2 0 1 0
value chain is given, with an example in every segment. While aware of the ‘food web’ (Lin and Ye
2009) to describe the value chain, the notion exists that this web is not sufficient to fully identify all
actors in the value chain. So therefore a value chain from manufacturer to end services is
constructed, as can be seen in Table 1.
Value Description Example
Services Online services like IM, Social Networks, Navigation, etc. Google Service delivery Apps Tapulous Service distribution Appstores Getjar Device design Industrial design, look & feel Apple UI design Design of the user interface SPB Core apps Basic functions of phone, dialer, inbox, etc. Myriad Operating system Software middleware and hardware interfaces Microsoft Hardware platform Integrated hardware designs RIM Chipset IP Design of Chipsets HTC Manufacturing Component sourcing and assembly Mediatek
TABLE 1, VALUE CHAIN OF MOBILE PHONES
When looking at the examples in Table 1, in 6 segments, players launched or at least announced an
Appstore. Google was first after Apple with a market on Android, the Operating System (OS) they
developed to work closely with their services. Microsoft, whose install base on new mobile phones
dropped from 10% to 5% in only 1 year8, took their losses and started from scratch with Windows
Phone 7 and Windows Marketplace. RIM tried to keep momentum and leveraged their 75 million
already online devices, with Blackberry Appworld. Even a typical chipset manufacturer, like
Mediatek launched a pre-installed Appstore on their chipsets.
2.2.2 WHAT IS THERE TO LIKE? All those actors putting efforts in developing and maintaining the Appstores, raises the question,
what is there to like? Although no figures are known about what the costs are to maintain an
Appstore, a break-down of the costs of Apple show the returns were relatively low compared to
other business activities (Elmer-DeWitt 2010). Instead of being a money-maker a more suitable
explanation, of all those companies jump on the bandwagon, is to take advantage of the network
effects of application software (Lin and Ye 2009). A wider variety of quality applications available
makes the phone more usable and increases the utility of the OS. Especially for OS developers who
need to sell their OS to device manufacturers the value a customer addresses to the OS is an
important issue. Device manufacturers try to produce the phones as cheap as possible, so the value
of the OS to customer must exceed the implementation value of the device manufacturer.
To the device manufacturers with an own OS and operators, raising the switching costs is likely to
be even more important since an average customer buys a new phone every 1.5 years. When this
customer bought many useful applications which will be available on the new version of the device
the customer has at that moment, but not on another platform, more customers are likely to buy a
phone where their already purchased software works on. In that way creating a vendor lock-in
because there are substantial switching costs i.e., the customer is dependent on the vendor.
8 http://www.gartner.com/it/page.jsp?id=1421013

P a g e | 6
T h e M o b i l e M o n e y m a k e r D e c e m b e r 3 , 2 0 1 0
Another advantage of a platform with successful adoption by 3rd party developers is leverage. For
example Apple revolutionized mobile phones by creating an app platform, and was subsequently
able to leverage that success by creating the iPad and enter a whole new market. The main success
factor was the wide adoption of the Appstore, so that software (utility) was already available on the
iPad.
2.2.3 WHY DOES IT WORK? So there is an incentive for companies to launch an Appstore, but why does it work? Why are people
eager to access an Appstore and even pay for content they would not pay for on their computer?
And why are developers willing to develop for mobile phones. Something even Apple was surprised
of. 9
Developers According to the report of Vision Mobile (Constantinou et al. 2010), Appstores have revolutionized
time to market for applications. To research exactly how radical the time to market for applications
has changed since the introduction of Appstores, the survey pays attention to two parameters.
TIME TO SHELF How long it takes from submitting an application to that application being available for purchase.
TIME TO PAYMENT The length of time between an application being sold and the proceeds reaching the developer’s bank account.
The report’s findings show that Appstores have reduced the average time-to-shelf by two thirds:
from 68 days across traditional channels, to 22 days via an Appstore. For developers choosing an
Appstore to retail their apps, almost 60 percent get paid within a month from the sale of the
application. In contrast, when using traditional channels, the time-to-payment increases
substantially. On average it takes 55 days to get paid via an operator channel, 69 days when
preloading an app via an operator and 168 days (5.5 months) when pre-loading an app via a
handset manufacturer.
Consumers Chen et al. (2004) studied the critical success factors of virtual stores. Their survey of 253 online
consumers, indicated that there are 5 concepts that can explain and predict consumer acceptance of
a store and hence the success of a store. Since in most Appstores all five concepts (product
offerings, information richness, usability, service quality and trust) are better applied than in any
other Appstore on the web before, consumers are more likely to start using these Appstores. In
subsection 2.2.5 these concepts are discussed in more detail.
Although all players have other incentives to set-up and maintain an Appstore, the different
Appstores are surprisingly equal. In the next subsection both the most important stores at the
moment and promising just released stores will be discussed.
9 http://www.cultofmac.com/apple-execs-surprised-by-app-store-success/23925

P a g e | 7
T h e M o b i l e M o n e y m a k e r D e c e m b e r 3 , 2 0 1 0
2.2.4 THE APPSTORE LANDSCAPE Below an extensive, but not complete, overview of mobile Appstores to date is given, divided in 5
categories10.
DEVICE MANUFACTURERS
CHIPSET MANUFACTURERS
OS DEVELOPER
OPERATORS
INDEPENDENT
As can be seen in the landscape overview, already 38 Appstores already exists while there are more
to come, expected to over 100 in 2012. Although already important from a strategic point of view,
the payoffs will become more important in the near future, since the total sales in all Appstores
combined is expected to grow to 30 billion in 2013 (Gartner 2010). At the moment, given the
10 http://www.appstores.info
P a g e | 8
T h e M o b i l e M o n e y m a k e r D e c e m b e r 3 , 2 0 1 0
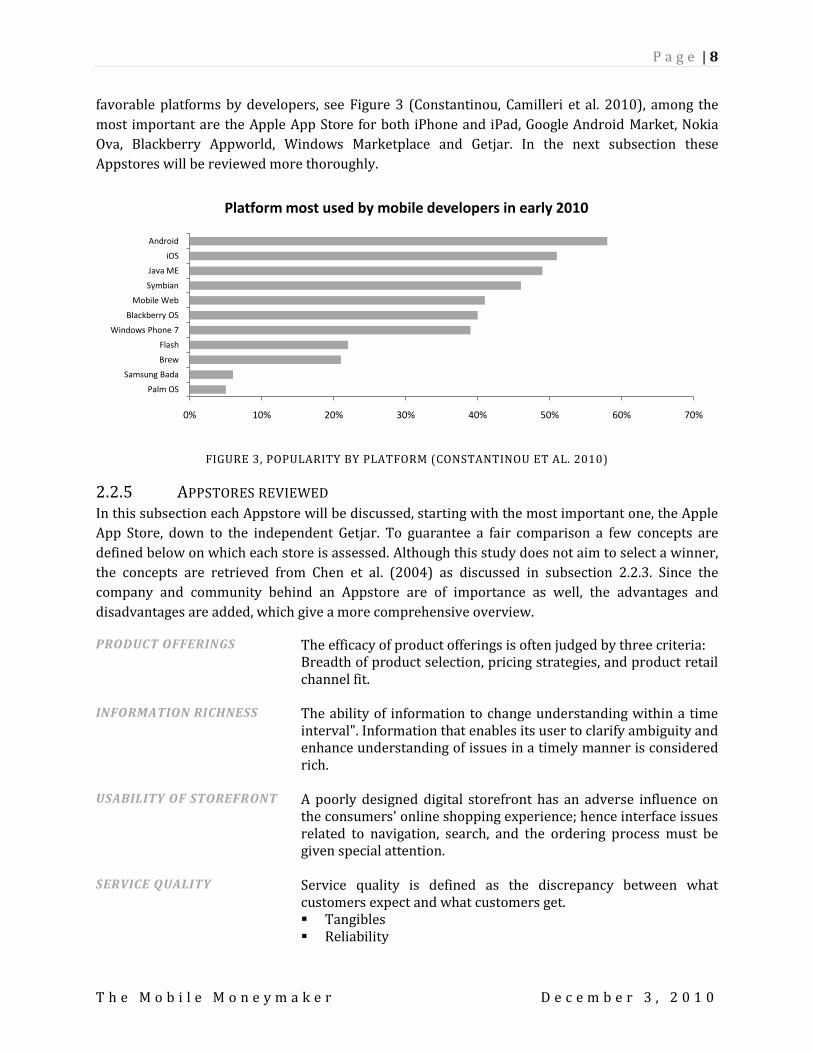
favorable platforms by developers, see Figure 3 (Constantinou, Camilleri et al. 2010), among the
most important are the Apple App Store for both iPhone and iPad, Google Android Market, Nokia
Ova, Blackberry Appworld, Windows Marketplace and Getjar. In the next subsection these
Appstores will be reviewed more thoroughly.
FIGURE 3, POPULARITY BY PLATFORM (CONSTANTINOU ET AL. 2010)
2.2.5 APPSTORES REVIEWED In this subsection each Appstore will be discussed, starting with the most important one, the Apple
App Store, down to the independent Getjar. To guarantee a fair comparison a few concepts are
defined below on which each store is assessed. Although this study does not aim to select a winner,
the concepts are retrieved from Chen et al. (2004) as discussed in subsection 2.2.3. Since the
company and community behind an Appstore are of importance as well, the advantages and
disadvantages are added, which give a more comprehensive overview.
PRODUCT OFFERINGS The efficacy of product offerings is often judged by three criteria: Breadth of product selection, pricing strategies, and product retail channel fit.
INFORMATION RICHNESS The ability of information to change understanding within a time interval". Information that enables its user to clarify ambiguity and enhance understanding of issues in a timely manner is considered rich.
USABILITY OF STOREFRONT A poorly designed digital storefront has an adverse influence on the consumers' online shopping experience; hence interface issues related to navigation, search, and the ordering process must be given special attention.
SERVICE QUALITY Service quality is defined as the discrepancy between what customers expect and what customers get. Tangibles Reliability
0% 10% 20% 30% 40% 50% 60% 70%
Palm OS
Samsung Bada
Brew
Flash
Windows Phone 7
Blackberry OS
Mobile Web
Symbian
Java ME
iOS
Android
Platform most used by mobile developers in early 2010

P a g e | 9
T h e M o b i l e M o n e y m a k e r D e c e m b e r 3 , 2 0 1 0
Responsiveness Assurance Empathy
TRUST Trust can be defined as feeling secure about relying on an entity. It has positive influence on the development of positive customer attitude, intention to purchase, and purchasing behaviors.
Key statics11
Owner Apple Google Nokia RIM Microsoft GetJar Distribution iTunes,
Device Device only
Web, Device
Web, Device
Web, Device
Web only
Platform iOS Android Symbian, Meego, Java
Java Windows Java, Flash, Android, Windows ME, Palm, RIM
Scripting Language
Objective C, C
Java, C Java, C, C++, Qt
Java C, C#, Silverlight, XNA
NA
Ratings, review
Ratings, review
Ratings, review
Ratings, review
Ratings, review
Ratings, review
TABLE 2, APPSTORE FUNDAMENTALS
Addressable market
~120M ~75M +500M ~80M -1M +1000M
Applications ~300,000 ~100,000 ~30,000 ~15,000 ~3,000 ~75,000 Downloads p/m
300M 200M 90M 50M 5M 100M
Revenue model
30% split, iAd
30% split, adMob
30% split, shelf space
30% split 30% split 30% split, shelf space
TABLE 3, APPSTORE FIGURES
Product offerings Apple was among the first to launch its Appstore and as of today the store is the best loaded store.
To date there are more than 300,000 apps in store and the store is still growing with double digit
numbers. When companies decide to launch an app, most still choose the Apple App Store as the
first to launch (Miller 2010). But Android market is quickly catching up with even higher growth
figures as is the Nokia OVI store. Getjar, the only independent Appstore covered in this study,
showed growth as well, but has also been around for quite some time now. Both Getjar and OVI
have huge potential since they can leverage the enormous addressable market of feature phones
with Java. Especially in less developed countries but also in western countries, the high volume
phones are still feature phones.
11 http://www.distimo.com/appstores/

P a g e | 10
T h e M o b i l e M o n e y m a k e r D e c e m b e r 3 , 2 0 1 0
RIM’s Appworld and Microsoft’s marketplace lag behind the others in terms of number of apps
available, but their approach is different. Both companies focus more on quality and have a focus on
enterprise-related and productivity apps. Consequently the apps are on the average more
expensive than all other platforms. Microsoft marketplace is latest addition to the ecosystem and
while the platform has an enormous legacy of software for previous versions of the Windows
mobile platform they decided to start from scratch and hence the store has the lowest number of
apps available.
Some stores have one major drawback according to developers; the review process. Especially
Apple is criticized about the procedures to review apps. This is not based on quality, but on some
arbitrary rules12. These rules harm among others applications containing nudity and application
copying original functions of the phone like the address book (Apple 2010). Apple does not have a
consistent rejecting policy and hence developers can develop apps for months and be rejected
without notice. Nokia13, Microsoft and RIM also have (less strict) rules in place to reject apps, but
their review process has not attracted any critics yet.
However, by not reviewing apps, like Google, another problem occurs. The quality of the apps can
be very low, because even non-working apps are allowed. On the other hand, the absence of a
reviewing process allows developers to develop just everything that enters their mind, encouraging
innovation.
Information richness Over time all stores copy best practices from each other, adopting similar functionalities. All
developers can add an extensive description showed in the store with every published app. The
quality of this information differs, but assuming a developer wants to sell as much apps as possible,
the average quality of this information is sufficient. The on device storefronts of Apple, Android,
RIM and Microsoft have limited space to show additional information, so only the description, some
screenshots, the ratings and reviews are showed.
The online / offline computer storefront is available to all except for Android users and can show
more information, with a people who bought this also bought section and the variation in ratings.
For most apps there is a substitute, but it is impossible to compare apps to each other. Missing is
also a function which recommends new apps on basis of the apps someone already possesses.
Usability of the storefronts As mentioned before most stores have two store fronts, both having the same content, but aimed at
a different screen size. The online / offline client needs to be downloaded or visited via the browser,
while the on device store is prepackaged on the phone.
In the Apple App Store, the apps are categorized into 20 categories where the games category has
an additional 20 subcategories. There are distinct top overalls for paid and free apps, showing the
most popular apps in terms of download. For paid apps, the top grossing shows the most popular
12 http://developer.apple.com/appstore/guidelines.html 13 https://publish.ovi.com/login

P a g e | 11
T h e M o b i l e M o n e y m a k e r D e c e m b e r 3 , 2 0 1 0
apps in terms of revenue to the publisher, promoting the high quality apps (assuming higher quality
apps have, on average, a higher price).
Shopping in the Appstore is just like you shop in the already familiar iTunes store for music or
movies. Since customers already allowed Apple to charge their credit card, it is easy to purchase an
app. Just click, enter a password and the deal is done.
As mentioned already Android Market is not as fancy as the Apple App Store, but shares almost all
characteristics. All apps are categorized and there is a ranking for each category. The rankings are
world-wide rankings without adjustments for downloads within a county, so an highly popular app
in the U.S. pops up, although never downloaded, as a highly popular app in the Netherlands as well,
given the app is made available in the Netherlands.
Ovi uses categories as well, although less than the other stores already discussed. Rankings are
based on downloads per country, so each country have their own specific most popular apps
listings. Appworld is categorized into 20 categories, for paid free and paid apps, available on both
the handset which is prepackaged on all devices right now. Older handsets need to download the
store. Not all apps are available to each RIM phone, making the web interface less usable with older
phones.
Marketplace is not directly available on the device yet, which is a usability drawback. The online
storefront is equal to the others, although Microsoft announced a progressive, user-friendly
shopping experience that stresses improved discoverability. But it is not available yet and success
has to be seen. Getjar is also web only and not directly accessible via an app on the device. The
storefront is divided in 19 categories, where only apps for the selected phone are showed.
Service quality Apple only sells the iPhone with a selected number of operators e.g., U.S.: AT&T, Europe: T-mobile,
in order to get the experience right. Therefore the perceived quality to customers when using the
store is higher, due to high Internet speed and no additional costs for downloading content. Since
all apps are reviewed by Apple and no core apps can be installed, the phone remains fast and stable
and the typical Apple look and feel is guaranteed in the core functionalities.
Google does not possess restrictions on handset manufacturers to install Android, leaving some
customers with slow working phones and apps. The perceived quality can therefore be low for
some customers. This problem was addressed by Google who introduced the Nexus One (Arrington
2010) to get the experience right and more recently possessed minimal requirement for the new
version of Android (Coldewey 2010).
Nokia controls both the device manufacturing and the Appstore, making sure that, by their review
process, only apps aimed at a specific device are made available to that device. This should enhance
perceived quality of the apps. However, apps available to one Nokia device while not available to
another can cause too high expectations, leading to less satisfaction and finally a low perceived
quality level.

P a g e | 12
T h e M o b i l e M o n e y m a k e r D e c e m b e r 3 , 2 0 1 0
RIM provides a closed ecosystem, with one OS on all phones, just like Apple, albeit RIM has some
problems with obsolete software on the older phones because RIM is active for many years.
However, RIM always sold the phones in combination with Internet bundles, and reviews all apps;
hence the service quality on par with Apple.
By focusing on the new Windows phone, Microsoft want to make a fresh start, allowing them to
have the same advantages as Apple and only supporting one type of system, available to all phones.
By opposing minimal requirement to handset manufacturers, Microsoft tries to get the experience
right as well, enhancing the service quality of the store.
Getjar does not charge any costs and does not review apps before publishing, enabling developers
to publish low quality apps. Next to the tremendous number of devices supported, without
availability on the device itself, the perceived quality of the store is likely to be lower.
Trust The Appstore is owned by Apple which people already found trustworthy when they bought their
iPhone. Customers can shop in the Appstore after providing credentials to Apple, including credit
card information to buy paid applications. Although Google is a company trusted online by many
people, the payment system Google uses, Google Checkout14 is not used by many (Reisinger 2009).
Additionally, customers do not buy a Google phone, they buy a phone from one of the OEM’s
equipped with the Android OS. Therefore the perceived trust is lower, showed by monetization
issues Android developers face (Kincaid 2009).
Nokia is an established brand – among the five best brands globally15 - and when customers buy a
Nokia phone they apparently trust Nokia. While some customer might be reluctant to provide Nokia
with their credit card credentials, operator billing is available as well. RIM is a trusted brand,
although not as well known as the other brands. Originally the phones were very popular among
business people, but become increasingly popular among teenagers because of the free texting
possibilities (Ping!). By integrating PayPal, which is a well known payment provider, as their
payment service customers should trust payments in store. Microsoft and Windows are both
respected brands, trusted by a lot of people, however the payment option available are by direct
credit card billing, which is less trusted by customers. Carrier billing will become possible as well,
making it easier for customer to buy apps. Getjar is not a known brand and therefore not trusted by
default. But because payments are not supported on Getjar, this issue is less relevant.
Other characteristics Apple already sold an estimated 120 million devices, shipping around 15 million new iPhones every
quarter16. Developers do not need to support multiple handsets, since iPod and iPhone are similar,
attracting many developers. Apple also continues to invest heavily in commercials, promoting the
capabilities, ease of use and the high number of applications available. Apple also has a reputation
about how to go viral. Besides, Kleiner Perkins Caufield & Byers raised a $100 million fund to seed
third-party development of iPhone apps. But Apple is rather strict in who they allow into their
14 http://checkout.google.com/ 15 http://www.interbrand.com/best_global_brands.aspx 16 http://www.apple.com/pr/library/2010/10/18results.html

P a g e | 13
T h e M o b i l e M o n e y m a k e r D e c e m b e r 3 , 2 0 1 0
ecosystem. Developers are continuously complaining about developing in uncertainty i.e., not
knowing whether the app will be approved or not, while Apple approves a host of flatulence-
imitation wares. Another slightly different example is Adobe, which was banned from publishing
apps developed using its Flash technology. Finally there are worries about the huge library of
Apple, which can lead to discovery nightmares for consumers and monetization issues of
developers.
Android recently got the lead in terms of handset in the United States. Worldwide over 200.000
android devices are activated on a daily basis17. Google has secured support from a broad range of
players across the mobile spectrum including key operators e.g., Verizon, and handset
manufacturers e.g., HTC and Motorola. Developers appreciate the open policies Google adopted,
which allows them to publish and update rather quickly.
Besides, Google is likely to deploy carrier billing, allowing
operators to earn from apps as well. There are several issues
regarding to the open character of Android, the dispersed
version use (see Figure 4) and diverse handset specifications.
Developers might not develop for each version / handset
combination which might distract customers. Since apps are
not reviewed by Google, the change for viruses and malware
functionalities in apps is present.
Nokia boasts a massive base of addressable handsets, both among smart phones and feature
phones. The company has a great presence in Europe as well as in emerging markets. A key
differentiator for OVI is the scope of its offerings; Nokia seeks to become not just an app retailer but
a social networking provider and a cloud-based service provider, among other things. But Nokia has
failed to gain much traction in North America, and its global dominance is slipping even as the
overall Smartphone market grows. OVI faces a formidable task in creating an Appstore to address a
wide variety of handset models and while Symbian still is the most popular Smartphone OS on the
planet (300,000 activations per day18), it has yet to develop the kind of simple, intuitive user
interface that some of Nokia’s competitors have built, to remain leader.
RIM’s reputation among enterprise users is iron-clad, the company is successfully expanding its
audience to include lower-end business users and even consumers without a business need for a
Smartphone, with their unique ping (free texting) proposition. Because RIM cuts operators out of
the revenue chain, only sharing the revenue with the developers, it risks to be ignored by operators.
RIM’s longstanding presence in this space has produced five different SDK’s, leading to a
fragmented environment where developers have to choose between supporting all handsets by
developing simpler apps, or building more sophisticated apps and addressing a smaller market.
While the Windows platform remains a primarily business-oriented mobile OS, it maintains a
respectable market share in the Smartphone space and Microsoft has deep coffers to enter the
17 http://mobile.venturebeat.com/2010/08/05/googles-eric-schmidt-200000-android-units-now-activated-every-day-video/ 18 http://www.gomonews.com/300000-symbian-phones-shipped-every-day/
FIGURE 4, PLATFORM DISTRIBUTION,
AS OF JULY 1, 2010

P a g e | 14
T h e M o b i l e M o n e y m a k e r D e c e m b e r 3 , 2 0 1 0
market and compete below costs for a long time. Their new OS got good reviews at start but success
is not guaranteed in this crowded place.
Getjar just received a series B funding of 11 million from Accel partners which is considered to be
one of the major Venture Capital firms in the world. Because Getjar supports all devices and no
strict review process is applicable they might be able to attract customers not willing to comply
with the rigid policies of the others. Besides Getjar addresses the huge feature phone market, which
is completely left aside except by Nokia. But the storefront is not pre-installed on any phone, there
is no on-device storefront available and Getjar user base is highly dispersed.
2.2.6 WRAP UP In this subsection an overview of the mobile Appstore landscape is given. All appstores are
fundamentally like each other so therefore in the proceeding of this study the Apple App Store will
be used in every analysis.
The Apple App Store is the most mature, most reliable and best documented store available right
now, hence the data and knowledge about this store is more complete compared to the other
mobile Appstores. As point out by Miller (2010) based on interviews, it is almost impossible for
content provider to ignore the Apple App Store at this point.
Besides, at the end of 2009, the iPhone and its cousin the iPod Touch together accounted for 49-70
percent of all mobile web browsing in the US, UK, Germany and France (West and Mace 2010). This
clearly supports the case of focusing on the Apple App Store, although mainly Android is rapidly
catching up.
2.3 Goods in Appstores
2.3.1 POSITIONING Apps are just another piece of software distributed in a more structured way via a closed
ecosystem, the Apple App Store. Software is part of the type of goods known as digital information
goods.
FIGURE 5, APP POSITIONING

P a g e | 15
T h e M o b i l e M o n e y m a k e r D e c e m b e r 3 , 2 0 1 0
Information goods are intangible e.g., stock quote or tangible e.g., manual and can be experience
goods. Experience goods are goods consumers have to experience to determine the precise value
(Chellappa and Shivendu 2005). Other examples of information goods are music, movies, or games.
A digital product is content stored in a digital form and transferred via communication networks
but excluding services (Viswanathan and Anandalingam 2005).
Apps share all characteristics of digital information goods i.e., development is expensive, an extra
user costs almost nothing and does not harm the availability and customers are never excluded
from the platform. Figure 5 shows all above discussed concepts as overlapping sets, to clarify the
position of apps and an example for every category. Based on the figure, the study will from now on
regard apps as digital information goods that can be experience goods. Because most apps are
connected to the internet and use online services this can also be part of the app.
Digital information goods are characterized by high fixed costs and very low (zero) marginal costs.
Because information goods are also public goods i.e., the consumption of one customer does not
harm the availability to another customer, which is called non-rivalness. A second property of a
public good is that no one can be effectively excluded from using the good; this is known as non-
excludability (Viswanathan and Anandalingam 2005).
Excludable Non-excludable
Rivalrous Private goods Common goods
Non-rivalrous Club goods Public goods
TABLE 4, TYPES OF GOODS
When looking from the consumers’ perspective, choices are driven by utilitarian and hedonic
considerations (Dhar and Wertenbroch 2000). Hedonism and utilitarianism are two related
dimensions, but products can score high and low on both. The hedonic dimension results from the
sensations derived from the experience of using the product and the utilitarian dimension is
derived from the function performed by the product (Voss, Spangenberg et al. 2003). Apps can
score high on the utilitarian dimension when effective, helpful, functional, necessary and practical,
which will be the case for business apps, while some Apps will be more fun, exciting, delightful,
thrilling and enjoyable, scoring high on the hedonism dimension (Voss, Spangenberg et al. 2003).
2.3.2 CHARACTERISTICS As mentioned in the last subsection, apps are just like software delivered via a closed ecosystem.
However there are some differences as well, as Miller (2010) points out the characteristics are;
They deliver a combination of content and functionality designed specifically for one or
more mobile platforms.
They are delivered as products, made available in a standardized store i.e., online
environment and are offered for free or a fee managed by a centralized payment system.

P a g e | 16
T h e M o b i l e M o n e y m a k e r D e c e m b e r 3 , 2 0 1 0
While apps may provide a simple type of content or functionality such as a ringtone or an
eBook, they are distinguished from other types of content or functionality by their
packaging for delivery and use via a standardized interface that sets them apart from typical
web-based delivery channels.
Many apps take advantage of the platform-provided Application programming interfaces
(API) to use the features of a mobile device to add value to the app experience and/or to
deliver content that can be shared with others. For example, foursquare, a mobile
application that enables people to announce their “check-ins” at locations uses the geo-
location services of various mobile platforms.
Concluding, an app is software designed specifically for mobile handsets which is most likely deeply
integrated with the Internet in order to deliver real-time content aimed at the user’s location. It
differs from websites as well since the user experience is better, the control of content is more
sophisticated and content providers are able to finally monetize the content (Miller 2010), where
people tend to pay more easily for content (Sangani 2010), and advertisement can be better
targeted.
2.3.3 REINFORCEMENT VERSUS NETWORK EFFECTS Where on the web network externalities, for most companies, are most important to become and
remain successful, mobile apps face other obstacles too. The Internet exhibits what is known as
positive externalities, or network effects, where the value of a good depends on the number of other
people who use it. Thus, the more people joining the Internet, the more valuable an individual
connection to the Internet becomes (Coiera 2000). On the Internet lots of shelf space is available via
portals, search engines and social networks, to get started and maintain momentum. Not restricted
by limited shelf space, storing ground, high product maintenance costs and pushed by a shift of
consumers to personalization the tails of the sales distribution became fatter over the years (Kong
and Lv 2008).
In a sales distribution the tails are considered ‘fatter’ when relatively more sales originate from low
volume products. In traditional businesses however few high volume products generate the
majority of the total sales. Typically 20% of the products generate 80% of the sales (Anderson
2006), this is known as the 80/20 rule. In electronic markets, like online music sales (iTunes) and
movie streams (Hulu) the tails are fatter than in traditional businesses (Anderson 2006). In some
cases more than 50% of the sales (both in terms of downloads and revenues) originate from the
long tail (Brynjolfsson, Hu et al. 2007).
But on mobile handsets several restrictions apply, including small screens, inferior input methods
and slower data connections. Research about Manga sales in Japan on mobile phones showed a
deviation from the long tail where the top 12% of the Manga comics was responsible for 80% of the
downloads (Sugihara, Kobayashi et al. 2009). Insufficient time and passive attitude makes
customers rely on recommendation and rankings, leading to an even steeper curve than the
standard 80/20 rule.
Although as showed in subsection 2.2.3 time to the shelf is greatly reduced, the war for attention
intensifies on mobile. In the Apple App Store just like many other markets a Pareto (power law)

P a g e | 17
T h e M o b i l e M o n e y m a k e r D e c e m b e r 3 , 2 0 1 0
distribution is applicable (Ghose and Sundararajan 2006; Brynjolfsson, Hu et al. 2007) leading to a
straight line on double logarithmic axes i.e., download quantity decreases rapidly when sales rank
increases. Therefore it is of utmost importance to conquer a top position in the rank listings of the
Appstore and retain this ranking to keep momentum. This effect is called reinforcement effects.
So while on the Internet network effects are important, on mobile reinforcement effects are really
important as well. Although these two concepts are related, it is important in the proceeding of this
study to keep this in mind.
2.3.4 WRAP UP Apps are positioned as digital information goods, often used in combination with online services.
Apps can have hedonic, utilitarian or a combined nature. Apps have the promise to finally unleash
the potential of virtual communities to monetize the user base.
When writing about digital information goods it is impossible to neglect the piracy issue. Many
papers are written about the economic impact of piracy. However, since mobile phones and their
Appstores are closed ecosystems, where piracy is very hard and uncommon, in the proceeding of
this study piracy will be omitted.
2.4 Monetization strategies of publishers
The main goal of a business model is to answer the question: “who is offering what to whom and
expects what in return” (Wijnhoven 2010), in other words, how does an organization deliver their
products to their customers and how do a company monetizes their apps. The who, what and whom
question are less relevant in this study while the what-in-return question is particularly important.
The Internet world is famous for companies with unsustainable business models while receiving
major funding, in search for future profits (Loebbecke and Powell 2002). However, companies
active in the mobile ecosystem, are able to finally earn money for delivering online services to
customers, i.e. have a sustainable monetization strategy.
ABI research (2009) conducted a survey among 235 US Smartphone users who installed
applications on their devices in 2008. It revealed that 17 percent spent more than $100 on apps.
That level of spending is especially significant given the low cost of most mobile applications –
ranging from as little as a dollar or two in the Apple App Store (Distimo 2010) on average.
Concluding, customers are likely to pay for apps on mobile, whereas for the same service on the
Internet they will rather look for a free version; mobile has better ways to monetize apps, as
mentioned before in subsection 2.3.2.
2.4.1 MONETIZATION STRATEGIES USED IN THE APPLE APP STORE There is plenty of promise, but how do publishers in the Apple App Store make money? What
strategies are used? First a distinction is made between supporting apps and stand alone apps.
Supporting apps are left out of this study because the goal of the apps is to support an existing
platform e.g., eBay has apps to make life easier for sellers on their platform. For the stand alone
apps, the most used strategy in the Appstore is to offer a paid app, where around 73% of the apps
was paid in June 2010 (Distimo 2010).

P a g e | 18
T h e M o b i l e M o n e y m a k e r D e c e m b e r 3 , 2 0 1 0
Although most apps are paid, the high volume apps are all free, with in the United States, the
highest ranked app in Top Overall Free is downloaded 10 times more than the highest ranked paid
app (Spriensma 2010). To monetize free i.e., non-monetary revenues, the most common way is to
receive revenues from other sources by display advertisements. Since location, age and sometimes
preferences like buying habits and personal characteristics are known the advertizing is more
targeted (personalized) and therefore higher click-through rates (hence, higher revenues) are
applicable (Wijnhoven and Kraaijenbrink 2008; Hung 2010).
A third way to monetize an app is by offering a basic free version and selling additional
functionalities or features to increase the usability or pleasure of the consumer. Additional
functionalities can be for example, selling ad-remover packages e.g., eBuddy, or adding speech
recognition e.g., IM+, scoring high on the utilitarian dimension of subsection 2.3.1. Additional
features, also called virtual goods will have a high score on the hedonism dimension and need some
explanation, see subsection 2.4.2. This practice is, in popular literature, called freemium but is
closely related to two-sided markets, were one party is subsidizing (sponsoring) the surplus of the
user base (Wijnhoven 2010).
2.4.2 VIRTUAL GOODS Virtual goods are not extensively described in the literature and there is no agreement about a
precise definition yet. The best attempt so far states that virtual goods are a subset of virtual assets
that can be mass-produced and as a result are frequently bought and sold like conventional
consumers commodities (Lehdonvirta 2009). The properties of virtual goods are rivalrous,
persistent and interconnected. In this study the rivalrous property has been discussed already in
subsection 2.3.1. The use of one customer harms the availability to another customer (Viswanathan
and Anandalingam 2005), which is true since a customer cannot share the items he or she bought.
Of course, another person can buy the same good, but that is then another independent item. The
persistent property refers to the idea the object is an asset e.g., it must exist for some time. While
the interconnectedness property means that the object must not exist in isolation, others must be
affected by it (Lehdonvirta 2009). Therefore, as can be derived from Table 4 virtual goods are club
goods.
In order to make the virtual good concept clear a famous example from the Appstore is used; Farm
Ville19. Farm Ville is a game, where users can build a virtual farm, and plow, plant and harvest crops
in order to earn experience points (XP) and coins. With these XP and coins you can decorate or
expand your farm and buy equipment like tractors. Although the game is essentially free to play and
will remain free to play, when you quickly want to become a top player, having the highest crop
yield, the nicest farm, etc you have to buy additional coins or farm cash, which is sold via in-app
payments in bundles ranging from $4.99 to $49.99. So although a user can earn all the
functionalities by simply playing Farm Ville a lot, to become successful quickly it is required to
spend money. And this strategy works. The game is categorized as a simulation game in the Apple
App Store. While in this category, as of 13-7-2010, the most popular paid game (U.S.) by download
19 http://itunes.apple.com/nl/app/farmville-by-zynga/id375562663?mt=8

P a g e | 19
T h e M o b i l e M o n e y m a k e r D e c e m b e r 3 , 2 0 1 0
numbers is fishing king in the top grossing listing the app is only at spot 10. The top grossing list is
dominated by free apps (rank 2 to 7), with Farm Ville on the second spot.
A recent report of Flurry20, a company that tracks consumer behavior in apps, shows that virtual
goods outpaced advertising by 4 times. Although the report is highly biased by only taking into
account social network and social gaming apps, the growth of the virtual good model is clearly
observed.
However in earlier literature the virtual good economy is limited to a small subsection because
most of the virtual products are only decorative goods. People buy these products to dress up their
avatars of decorating their houses. These products may help users to express themselves, and help
others know more about the owners’ styles and the roles they want to play, but there are more
types of virtual goods (Shang, Chen et al. 2010). Virtual goods are, in this study, everything
consumers can purchase in the app which change something (functionalities, appearance, etc.)
within the app. Retailers selling real world products in-app are therefore excluded, but everything
from articles in the New York Times app to digital clothes for your avatar in a virtual world app, are
virtual goods.
The interconnected property is harmed by this extension but the researchers argue this property is
not necessarily applicable to virtual good. A virtual good can exist in virtual world without users
interacting with it i.e., no multiplayer environment, or a virtual world might have separate
instances for individual users i.e., where the owner is alone and therefore not able to interact with
others. Both situations would imply that when offering the same goods, the term of virtual good is
not applicable anymore, which is not true, hence the assumption of the interconnected property is
relaxed. A good example, that this property cannot hold, is the game TapTap Revenge, which was
discussed in subsection 1.1. In this game in which most users play alone without multiplayer
capabilities, it is possible to buy a wide range of goods like avatars and hit song packages. Not
calling these virtual goods would not make any sense, but then the interconnected property cannot
hold.
As mentioned before the top free app is downloaded 10 times as much as the top paid app and
although the majority of those consumers will initially not pay for the app, in the end consumers
pay anyhow. The reason why customers buy virtual goods range from advancement in status
hierarchy to advantage in completive settings, keeping up with co-players, experiencing new
content, customization and self-expression (Lehdonvirta 2009). This is an interesting business
model since, as showed in subsection 2.3.1, the costs of every new user is (almost) zero, and overall
profit is higher.
In this study has been showed before, that purchase decisions are driven by utilitarian and hedonic
considerations. According to Lehdonvirta (2009) the show-off factor should be included as well,
when virtual goods are discussed (this mainly relates to the interconnectedness property). This
social attribute indicates the satisfaction derived from their use a marker. The good can be
functionally inferior as long as the goods are exclusive and thus capable of drawing distinction.
20 http://blog.flurry.com/bid/48418/Madison-Avenue-and-the-Land-of-Make-Believe (visited; 25/10/2010)

P a g e | 20
T h e M o b i l e M o n e y m a k e r D e c e m b e r 3 , 2 0 1 0
And while games seem to fit especially well with virtual good sales21, other types of software adopt
the business model rather successfully as well. For example Mig33, a chat and voice company, only
recently started selling virtual goods and now sells around 4 million items monthly with their
users22.
Next to a solid monetization model, virtual goods can strengthen acquisition and retention. By
enabling consumers to first try the product for free or at a low costs before buying the essential
virtual goods to use the app can be a good acquisition strategy, especially taken into account the
difference between downloads in the free and paid section. Essential in this strategy are good
conversion rates. Because relevant in-app advertizing is guaranteed, since the virtual goods should
be relevant to the users of the app, higher click-through rates are applicable as discussed before.
Virtual goods strengthen retention as well because for two reasons. First consumers using the app
can select virtual goods to their taste and would therefore be happier customers. The app publisher
can easily adopt customer feedback and offer requested new virtual goods without timely update
procedures. Secondly when consumers buy virtual goods, switching costs increase, making is less
likely for existing users to switch to competing apps. When customers continue using the app, they
might in the future buy virtual goods again, increasing switching costs even more.
2.4.3 WRAP UP In this subsection monetization methods were discussed. In the proceeding of this study the virtual
goods monetization method will be the leading strategy, since it is the most promising. Among
other favorable features described before, it enables companies to leverage their already existing
user base better, by offering premium features and packages.
Although virtual goods sales are an increasingly popular monetization method the model is not
suited to all Appstores. A prerequisite to the successful adoption of virtual goods is the availability
of in-app payments. In-app payments are available in the Apple App Store and Blackberry
Appworld (just released) while announced for Android Market. Virtual goods do not necessarily
need in-app payments but conversion-rates will be significantly lower, as in-app payments allow
consumers to buy with a single click. Without in-app payments a difficult payment process
including registration is needed, which will harm conversion rates. That virtual goods, on mobile,
are only successful in the Apple App Store so far amplifies this case.
2.5 Conclusions
The aim of this section was to give insight into the mobile ecosystem and find the best way to
monetize apps. Figure 6 gives a graphical summary of the mobile ecosystem.
In this mobile Appstore ecosystem the six most influential Appstores were discussed, where in
Figure 6 the size of the bubble does not have any absolute value, the underlying idea is applicable
21 http://venturebeat.com/2010/07/21/about-75-percent-of-online-users-have-bought-virtual-goods-survey-finds/ 22 http://mobile.venturebeat.com/2010/07/15/mig33s-virtual-gifts-business-grows-400-percent-in-second-quarter/

P a g e | 21
T h e M o b i l e M o n e y m a k e r D e c e m b e r 3 , 2 0 1 0
i.e., one very big store, in terms of number of apps and many small competitors. This idea is even
stronger applicable to apps in general, represented by the rounded squares within the bubbles.
There are a few winners, and a lot of, in terms of download, small to very small apps. The icons
within the app refer to virtual goods, which are sold in some apps.
FIGURE 6, MOBILE APPSTORE ECOSYSTEM
In the remainder of this study only the Appstore of Apple will be used given the store is the most
mature, most reliable and best documented store. Apps are positioned as digital information goods;
often used in combination with online services where apps can have hedonic, utilitarian or a
combined nature.
There is no proven best method to monetize apps, but there is indisputable a trend towards the
sales of virtual goods via in-app purchases. Virtual goods seem to increase the average revenue per
user (ARPU) compared to traditional monetization methods, although the ‘established’ brands from
the traditional software studios remain using these methods. This effect is most clear in the gaming
area where virtual goods adopters are frequent in the top grossing rankings. The figures are slightly
biased because of the shift to social gaming which is changing the gaming landscape radically.
To give some perspective, about the shift to social gaming, the best known social gaming company,
Zynga (the publisher of among others Farmville) is, by second shares, valued just below 5 billion23
while EA, one of the biggest traditional gaming companies with a huge portfolio including Fifa, Need
for Speed and the Sims, has, as of 12/08/2010, a market cap of only slightly above the 5 billion24.
23 http://www.secondshares.com/2010/04/06/zynga-5-billion-valuation-buy-–-early-leader-in-social-gaming-is-printing-money/ 24 http://finance.yahoo.com/q?s=ERTS

P a g e | 22
T h e M o b i l e M o n e y m a k e r D e c e m b e r 3 , 2 0 1 0
Because the turnover of Zynga is way below the turnover of EA, investors see much potential in
social gaming. But even when taken this shift into account, virtual goods seem a better way to
monetize app as similar effects can be observed in other types of apps.
Besides monetization effects, virtual goods have other nice properties as well. Virtual goods
strengthen acquisition and retention of consumers and can leverage existing customers better.
Because there is only one app which can be offered for free or at low costs, the reinforcement and
network effect of subsection 2.3.3 are supported as well. Therefore in remaining of this study
virtual goods are considered as the business model of the future in Appstores.

P a g e | 23
T h e M o b i l e M o n e y m a k e r D e c e m b e r 3 , 2 0 1 0
3 PRICE DISCRIMINATION IN MOBILE APPSTORES In this section the aim is to determine the best ways of price discrimination in mobile Appstores. In
order to find the answer the study starts with a general overview of non-uniform pricing methods
followed by applicable methods to apply in mobile Appstores and ends by choosing a winner to be
used in the proceeding of the study.
3.1 Definitions
In this section various new terms will be introduced. To increase readers’ convenience in this
subsection, all definitions of new terms used in this section are given in alphabetical order.
BUNDLING A strategy that involves offering several products for sale as one combined product.
DEADWEIGHT LOSS When people who would have more marginal benefit than marginal cost are not buying the product or people who would have more marginal cost than marginal benefit are buying the product.
PRICE DISCRIMINATION
When sales of identical goods or services are transacted at different prices from the same provider.
PRICE ELASTICITY OF DEMAND
A measure to show the responsiveness of the quantity demanded of a good or service to a change in its price.
RESERVATION PRICE The maximum amount a person would be willing to pay for a unit of output.
VERSIONING A strategy to differentiate the products with vertically differentiated quality levels.
WELFARE Sum of the consumers’ and producers’ surplus.
3.2 Non-uniform pricing
Companies can, instead of setting a single price, use non-uniform pricing. A students discount is a
very popular way of non-uniform pricing, where students get a discount on the price because, on
average, their reservation price is lower. Ways of non-uniform pricing include two-part tariffs, tie-
in sales and the most common form, price discrimination (Perloff 2008).
The example of Figure 7 will be used in the remainder of the study
to explain price discrimination. Most important in this study is the
producers’ surplus (black box), which is the sale price minus the
marginal costs (zero in the example). Consumer surplus is the
surplus of the buyers (grey top) of the good. When a certain
consumer has a reservation price of 2 while the actual price is 1,
both the consumer and producer surplus are 1. The deadweight FIGURE 7, PRICE DEMAND GRAPH

P a g e | 24
T h e M o b i l e M o n e y m a k e r D e c e m b e r 3 , 2 0 1 0
loss (grey right) is the not utilized surplus, since the reservation price of those consumers did not
exceed the actual price and therefore the product is not purchased.
3.2.1 PRICE DISCRIMINATION Price discrimination refers to the situation when a firm charges consumers different prices for the
same good. There are three levels of price discrimination, but at all levels they share three
conditions that have to be met before any price discrimination strategy could be successful (Perloff
2008).
MARKET POWER A firm with market power can raise prices without losing its customers to competitors. In perfectly competitive markets, market participants have no market power, so a monopoly, oligopoly or cartel has to be applicable to the firms’ competitive situation, in order to have market power.
CONSUMERS MUST DIFFER IN SENSITIVITY TO PRICE
When the sensitivity differs it is possible to offer different versions of products to reach different groups of consumers.
PREVENT OR LIMIT RE-SALES A firm must make sure the low price customers are not able to resell the products to high price customers. Else the average selling price will fall to the price offered to the low price customers.
First degree price discrimination First degree price discrimination is also known as perfect
price discrimination and is based on the idea that a company
knows exactly how much every customer is willing to pay i.e.,
knows the reservation price of each customer. When
applicable, the welfare, which is the sum of the consumers’
and producers’ surplus, is maximized as can be seen in Figure
8. Note that the entire surplus is gathered by the producer i.e.,
perfect price discrimination extracts surplus from the
customers and is therefore disadvantageous for consumers. In
competitive markets producers’ surplus converges to zero and
is therefore favorable for consumers.
Although some firms approach perfect price discrimination, it is impossible to know, of each and
every customer, the reservation price exactly and hence it is a theoretical-only form of price
discrimination. Even when aiming for, the transaction costs will be too high to gather information
about each customer’s price sensitivity although, for Internet companies this information becomes
easier (less costly) to retrieve.
Second degree price discrimination First degree price discrimination is not suitable because of the high costs, so other ways of price
discrimination are more potent strategies. Second degree price discrimination is sometimes
referred to as quantity discrimination. As companies do not know the reservation prices they just
FIGURE 8, 1ST DEGREE PRICE
DISCRIMINATION DEMAND CURVE

P a g e | 25
T h e M o b i l e M o n e y m a k e r D e c e m b e r 3 , 2 0 1 0
sell large quantities for lower marginal fees and forgo profit, as the efficiency profits should be
lower than the surplus given to the consumer, to be second degree price discrimination (Perloff
2008).
From a more general perspective this method allows consumers to differentiate themselves, by
choice. But, the choice is not limited to quantity and could very well be quality or functionalities. In
this way companies are able to distinguish classes of consumers. This more general view is
something that is missing in (Perloff 2008), but described by multiple authors (Viswanathan and
Anandalingam 2005; Lee, Yu et al. 2006). This allows the producer to set different prices to the
different groups and capture a larger portion of the total welfare.
Third degree price discrimination Third degree price discrimination is also known as multimarket price discrimination since the
common method is to divide potential customers into multiple groups based on the expected
reservation price. The distinction can be made on several characteristics including but not limited
to income level e.g., student discount, location e.g., McDonalds and age e.g., Rollercoaster parks.
Thus, the supplier sets a lower price for a specific consumer type because that consumer type has a
more elastic price elasticity of demand.
3.2.2 DYNAMIC MONOTONE PRICING Price discrimination focuses on a difference of elasticity of demand, and by tuning quantity, quality
or characteristics tries to capture a larger portion of the surplus. When we look to market
introductions of products often a price drop can be observed, where first the early adopters buy the
products against fairly high prices, while when the mass adopts a product, prices significantly go
down. Typically a company starts selling a new product at a relatively high price then gradually
reduces the price to reach the low price elasticity segment. This practice is called price skimming
(Dolgui and Proth 2010). The other way around is possible as well. For example, when network
effects are strong and a product needs a critical user base, starting with low pricing and gradually
increasing prices can be a potent strategy. A great example in the Apple App Store is Whatsapp25,
which is a free SMS service over IP i.e., a user can only text people for free who have Whatsapp
installed on their phone as well. They offered their app for free in the first two months to
accumulate a big user base while after those two months Whatsapp has been among the most
downloaded paid apps for over six months in the Apple App Store. This kind of pricing is called
penetration pricing (Dolgui and Proth 2010).
3.2.3 YIELD MANAGEMENT The types of non-uniform pricing discussed in the two preceding subsections are not mutually
exclusive. Combinations of strategies can be used in order to get a larger part of the total welfare.
This process is called yield management.
The goal of yield management is to anticipate customers’ and competitors’ behavior in order to
maximize revenue (Dolgui and Proth 2010). Anticipating includes both understanding and
25 http://www.whatsapp.com/

P a g e | 26
T h e M o b i l e M o n e y m a k e r D e c e m b e r 3 , 2 0 1 0
influencing the behavior of customers. The challenge is to sell the right resources to the right
customer at the right time for the right price.
Note that, in order to maximize revenue or profits it can even be possible to ask one static price.
Especially when re-sales are very easy or transactions costs to retrieve information are very high.
But given the characteristics of apps from subsection 2.3.1 and 2.3.2, this study will focus on
dynamic pricing and leave static pricing out.
However, price discrimination can have countervailing effects on producers’ profit. For instance,
one consequence of introducing a lower quality version of an existing product is the loss of profits
from customers who switch from purchasing the higher quality version to purchasing the lower
quality version. This effect is known as cannibalization and equals the effect when two products
(old / new) compete simultaneously (Ghose and Sundararajan 2006).
3.2.4 WRAP UP The effect of yield management can lead to perverse incentives for producers. In 2000, Amazon
revealed that it used a type of dynamic pricing, explained by an example.
a consumer ordered DVD of Julie Taymor’s “Titus” at $24.49
checks back next week and finds price is $26.24
removes HTTP cookie with stored site preferences; price fell to $22.74
After newspaper articles (Streitfeld 2000), Amazon announced it had dropped this policy. Another
known example is the airlines business. If airline companies make economy class seats as
uncomfortable as possible to attract people with a larger price differential to business class they
make more profit. So such a company may have substantial incentive to make economy seating
more uncomfortable.
But apparently abundance creates new scarcity. For example, although the coffee is free at the
office, just before the start of a typical office day, many employees buy Starbucks or Coffee
Company coffee. So customers tend to pay for premium products while the inferior, but still
working properly, product is free. Again this is the difference between utilitarian goods and hedonic
goods, I need coffee (utilitarian) but I want a more exciting, delightful and enjoyable (hedonic)
coffee.
So some strategies might be immoral ways to subtract surplus of the customer as the Amazon
example showed. People want price discrimination themselves, as showed by the coffee example
but also when looking to airlines. Companies like Ryan air and Easyjet, lower customer convenience
in order to fly as cheap as possible, hence the low ticket prices and significant market share.
3.3 Potent pricing strategies in Mobile Appstores
Although knowing every customer’s reservation price is the holy grail of firms, applying first degree
price discrimination is impossible; hence this strategy will be omitted from the study. In today’s
world a rapid increasing number of people have a phone subscription, with 5 billion subscriptions

P a g e | 27
T h e M o b i l e M o n e y m a k e r D e c e m b e r 3 , 2 0 1 0
milestone crossed and an estimated 500 million 3G users in July 201026. Given the huge GDP per
capita differences throughout the world, one might expect that multi-market discrimination would
be a very potent strategy. While 17% of the customers in the U.S. can spend, as showed in
subsection 2.4, more than 100 USD to buy apps. This 100 USD equals, according to the CIA world
factbook27, the total GDP per capita of Zimbabwe in 2009.
But, since this study only considers the Apple App Store and therefore only users of iPhones, iPods
and iPads customers already tend to be in the high income class independent of which country they
live in. Therefore Multi-Market price discrimination, although it might have some impact, is left out
of the scope of this research.
Second degree discrimination seems to be a good alternative as Viswanathan et al. (2005) point out,
the properties of ease of mix and match and modify the product for different customers of software
makes customization, bundling and versioning potent strategies.
In order to apply price discrimination some conditions have to be met, as showed in subsection
3.2.1. First the price discriminating company needs to have market power and although some
companies in the Appstore might have a monopoly for a while, soon after an app proved to be
successful competitors will enter the market due to the properties from subsection 2.2.3.
Nevertheless there are two reasons why market power can be assumed. First the strong network
and reinforcement effects of subsection 2.3.3, can result in a winner takes it all market i.e.,
monopoly. A good example is the app used in subsection 3.2.2, Whatsapp. A user of Whatsapp can
only text for free to users of Whatsapp and so is the case for all other players (Pingchat, Textplus,
etc.) therefore it is likely that in the end only one player ends-up as monopolist (at least a local
winner will emerge). Another way of looking to the monopolistic situation is with regard to the
item’s originality (Dolgui and Proth 2010), as long as an app can be distinguished from
reproductions, clones, forgeries, or derivative works, market power can be maintained.
The second property, different sensitivity to price, is assumed to be true, since it seems to be in the
nature of the human being as showed in subsection 3.2.4. The last property requires that re-sales
are at least limited. Apps are bonded to the owner and in no way heritable to others given the
closed character of the Apple App Store, hence this property is fully met.
3.3.1 BUNDLING Bundling allows firms that cannot directly price discriminate
to charge customers different prices (Perloff 2008). Bundling
is favored when combining multiple products reduces the
heterogeneity of the consumers, which is the case with many
information goods (Altinkemer and Bandyopadhyay 2000).
This reduces the deadweight loss. With bundling the price
elasticity decreases i.e., the price demand curve is flatter, so
26 http://www.ericsson.com/thecompany/press/releases/2010/07/1430616 27 https://www.cia.gov/library/publications/the-world-factbook/index.html
FIGURE 9, BUNDLE DEMAND CURVE

P a g e | 28
T h e M o b i l e M o n e y m a k e r D e c e m b e r 3 , 2 0 1 0
it easier to determine the optimal price.
To clarify, an example of Microsoft is given. Microsoft used bundling to get a critical mass
(diffusion) in the browser market, by bundling Internet Explorer as the standard browser in
Windows, thereby leveraging the monopoly Microsoft had on the O.S. market by that time
(Chandrashekaran, Grewal et al. 2010). But the more interesting bundling example for this study is
Office. Office is Microsoft’s office suite, and exists among others out of Word, Excel, Powerpoint and
Access. While most people only need Word to write a letter once in a while, Microsoft only sells
bundles. Table 5 shows an example with every product’s reservation prices per customer type.
Word Excel Powerpoint Bundle Office worker 70 20 10 100 Data analyst 25 50 25 100 Marketer 40 0 60 100
TABLE 5, RESERVATION PRICES OF DIFFERENT TYPES OF CUSTOMERS PER PRODUCT
When all three products are offered stand-alone, the maximum turnover would be only $190, Word
($80), Excel ($50) and Powerpoint ($60), while in a bundle the reservation price for the bundle
equals 100, having a total turnover of $300. Note that unprofitable bundles are possible as well.
The critical success factors of bundling are (Bakos and Brynjolfsson 1999):
There are economies of scale in production
There are economies of scope in distribution
Marginal costs of bundling are low
Production set-up costs are high
Customer acquisition costs are high
Consumers appreciate the resulting simplification of the purchase decision and benefit from
the joint performance of the combined product
As Bakos et al. (2000) showed, bundling very large numbers of unrelated information goods can be
surprisingly profitable. Surprisingly because information goods share not all critical success factors,
like economies of scope in distribution and high customer acquisition costs. However they showed
that because it is much easier to predict valuations of customers for a bundle than for individual’s
goods, optimal prices can be determined and hence the overall profit is increased.
While Bakos et al. (1999) showed that bundling can enhance profits greatly, they identified that
Internet clearly affects competition in many other ways as well. For instance, lower search costs,
network externalities, high fixed costs, rapid market growth and changes in interactivity. As this
study showed already, most of those threats are strongly applicable to the mobile ecosystem.
Another assumption is the equilibrium in the market, which is in a growth market like the mobile
ecosystem certainly not the case.
Finally, although as showed before, bundling might be efficient, it restricts the choice of consumers.
It might provoke frustration and unhappiness, hence in customer relationship bundling might not
be the right thing to do (Liebowitz and Margolis 2009).

P a g e | 29
T h e M o b i l e M o n e y m a k e r D e c e m b e r 3 , 2 0 1 0
The antithesis of bundling is called a’-la-carte pricing i.e., pay exactly what a customer consumes.
A’-la-carte pricing is common in commodity markets, like people pay exactly for the amount of
gasoline or electricity they use. A’-la-carte pricing seems to be fair, a perfectly homogeneous good is
sold that can be purchased as narrowly as someone wish. Consumers will choose themselves
whether the reservation price of a good exceeds the price set (Liebowitz and Margolis 2009).
At this moment we don´t see any viable business models in the mobile ecosystem related to
bundling. Apps are originally aimed to do one specific task, but this might be changing already. For
example, IM bundled with voice e.g., Nimbuzz, Fring. Although the IM and voice functionalities are
complementary they are still distinct. Another example is Facebook, on the web it started as a Social
Network but is expanding rapidly to become a gaming platform, a marketplace and even introduced
an own currency. While these functionalities are not available on mobile yet, it is only a matter of
time.
3.3.2 VERSIONING The point of versioning is to get customers to segment themselves according to their willingness to
pay. In order to do so, a company should differentiate the products with vertically differentiated
quality levels. Versioning is an attractive strategy for information goods such as software, music,
movies, and satellite images, because the firm can create low-quality variants at little additional
cost (Bhargava and Choudhary 2008).
There are an extensive number of examples available, but this study will stick with Microsoft
examples. Microsoft identified the problem of different market segments, with various valuations as
well and therefore offered different versions of their Operating System e.g., Windows Starter, Home,
Pro, Ultimate. While Ultimate is the flagship version, every other version disables a subset of
features of the Flagship. Still Starter offers a complete O.S. suitable to most users but power users
want to have professional functions like Virtual Desktop, aimed at business user. They are willing to
pay extra for the functionalities.
Another form is based on releasing successive generations of the same products, with a period of
time where the old and the new generations overlap. A new generation usually represents
improvements, which equals the offering of related products of varying quality (Ghose and
Sundararajan 2006). This strategy is used by Microsoft as well, Windows XP, the inferior OS, is still
installed on cheap net books, aimed at the lower-end market, while the newer Windows Vista or
Windows 7 is prepackaged on more expensive computers. This concept is also linked to price
skimming, but fits better within versioning.
The most common business model in the mobile ecosystem is
freemium as showed in subsection 2.4.1. Freemium is related to
versioning since the basic product is free, but for extra
functionalities you have to pay a premium, see Figure 10. To
quantify this statement, the Top 100 Overall Free of 1 October
2010 in the United States was analyzed and for 52 out of the 100,
there either was a paid version or in-app purchases available.
When supported apps were omitted from the research, the FIGURE 10, VERSIONING DEMAND
GRAPH

P a g e | 30
T h e M o b i l e M o n e y m a k e r D e c e m b e r 3 , 2 0 1 0
percentage of versioning adopters increases to just over 60%. See Appendix C for an outline of the
algorithm used to extract the information.
3.3.3 PRICE SKIMMING This concept was already shortly discussed in subsection 3.2.2.
In this strategy, a relatively high price is set at first, and then
lowered over time. This strategy is especially useful for
innovative products since its enables a publisher to reimburse
huge investments made in the research and development
process. Unfortunately for the companies the high prices
cannot be maintained for a long time, given competitors will
catch up soon. This strategy is applicable when customers are
less sensitive to price e.g., Cosmetic industry or are attracted by innovations e.g., app industry
(Dolgui and Proth 2010). See Figure 11 for the demand price graph.
The manufacturer could develop negative publicity if they lower the price too fast and without
significant product improvements. Some early purchasers will feel they have been paid a too high
price. This negative sentiment will be transferred to the brand (Dolgui and Proth 2010).
It is difficult to assess if the actual strategy of a developer is price skimming. But an estimate, to see
if price skimming is common in the Apple App Store, can be made. When 100 applications that were
in the top 100 Overall U.S. paid on the first of January 2010 were tracked during the year. Of the 52
still available in the Appstore 13 apps were cheaper at the first of October, while only 3 were more
expensive. 33 apps were over the year at least for a certain period priced lower than the January
2010 price. In Appendix C an outline of the used algorithm is given.
3.3.4 TIE-IN SALES A tie-in sale results from a contractual arrangement between a consumer and a producer whereby
the consumer can obtain the desired good (tying good) only if he agrees also to purchase a different
good (tied good) from the producer (Perloff 2008). Examples are copiers and razors, which are sold
below cost, but require customers to buy specific supplies from the manufacturer in the future
(cartridges / blades).
The Apple App Store is an example as well although the core products (iPod / iPhone) are not
below costs. On an iPod and iPhone a customer is only allowed to buy apps via the Apple App Store,
where Apple charges 30% on every purchase.
Virtual goods are related to tie-in sales; the free product enables consumers to buy virtual goods,
but only from one provider (the publisher of the app). As showed in subsection 2.4.2, virtual goods
sales are already observed in the Appstore. In order to see how common the tie-in practice is (with
the assumption, virtual goods is the only way of tie-in sales) the top 100 Overall Free and Paid of 1
October 2010 was assessed. 42 of the 200 apps sold virtual goods via their app. An outline of the
algorithm to retrieve this information can be found in Appendix C.
FIGURE 11, SKIMMING DEMAND
GRAPH

P a g e | 31
T h e M o b i l e M o n e y m a k e r D e c e m b e r 3 , 2 0 1 0
3.3.5 WRAP UP In this subsection price discrimination strategies applicable to the Apple App Store were discussed.
First is demonstrated that price discrimination is applicable to publishers in the Appstore given the
restriction of subsection 3.2.1. Afterwards the most viable discrimination methods; bundling,
versioning, skimming and tying were discussed in more detail, including information about the
current use in the Apple App Store.
Earlier the decision was made to focus on virtual goods (subsection 2.4.3). As showed in this
subsection, virtual goods are related to tie-in sales. In the next subsection more aspects of virtual
goods as a method to price discriminate are given.
3.4 Non-uniform pricing with virtual goods
Virtual goods share certain characteristics of the non-uniform pricing methods described above but
do not completely fit in one. One might argue that offering virtual goods in the app is equal to
versioning, since the capabilities of the app are extended when virtual goods are bought. Even a
nice colored farm, which seems useless to many people, does extend the quality of the app to a
particular part of the users.
Virtual goods are also defined as mass customization, which fit within the properties from
subsection 2.4.2; mass-produced and sold like conventional consumers commodities. Viswanathan
et al. (2005) describe in their model highly customizable information goods with zero marginal
costs and named it mass customization. Customization occurs when the customer self-selects
attributes from a given menu to configure an offering that is best suited to his or her requirements
(Bharadwaj, Naylor et al. 2009). An app with virtual goods can fit within this description, as the app
only offers basic functionalities while the virtual goods enable the customer to tailor the product to
their personal preferences. However one property of customization is not necessarily met, in
customization, the information goods provider tries to understand what the consumer wants and
designs and delivers a good to meet the customer’s needs (Viswanathan and Anandalingam 2005).
But, this does not differ from conventional consumer behavior i.e., customers have a wide array
(menu) of products they can choose from to maximize welfare. So, because the sale of virtual goods
can be regarded as any other goods, standard price discrimination methods are applicable again.
Something Viswanathan et al. (2005) identified as well; combining mass customization and price
discrimination can enhance profit even more.
So virtual goods have the promise to lead to perfect price
discrimination and subsequently extract the consumers’
entire surplus as in Figure 8. This is only possible when
available in infinite little pieces, which is by definition
impossible. When virtual goods in combination with price
discriminating methods are used, a demand graph like Figure
12 can be established, leaving some surplus to the consumers
and having some, limited deadweight loss. FIGURE 12, VIRTUAL GOODS
DEMAND GRAPH

P a g e | 32
T h e M o b i l e M o n e y m a k e r D e c e m b e r 3 , 2 0 1 0
It is critical to understand that, in this study, information goods sales are based solely on demand;
not supply and demand, since supply is infinite. While supply may not be a constraint for a virtual
good seller, there is the potential to leverage supply constraints. These supply constraints can be a
strategic decision to increase price and ultimately, profit. Consider luxury goods, like a diamond
ring or a painting, most of the value stems from rarity. The fascinating property of these products is
that even when prices increase, demand remains relatively stable i.e., price elasticity around zero,
or even positive (Joosten 2007). This is closely related to the social dimension of subsection 2.4.2.
3.5 Conclusions
In section 2 the decision to proceed with the virtual goods monetization model was made. Yet in
this section a broad overview of price discrimination methods is given, to keep a general
perspective.
After all, the virtual good model is the most viable model from a price discriminating perspective as
well since it allows a supplier to apply several forms of price discrimination within the app. The
virtual goods model is similar to versioning; it allows customers to self-select the appropriate
quality. Therefore the fields of interest as proposed in subsection 1.3 are still applicable as in this
study virtual goods are regarded as versioning. In Figure 13 this is graphically described, where ( ,
, , ) are additional functionalities and ( ) is the core functionality. In Figure 13, the shape of
the figures illustrates functions, while the color illustrates different products.
FIGURE 13, PRICE DISCRIMINATION METHODS COMPARED
In this section a clear distinction is made between bundling and versioning as proposed by the
literature. Versioning is vertically price discrimination i.e., based on quality, while bundling refers
to horizontal price discrimination, based on functions. From Figure 13 it is clear that virtual good is
equal to versioning when the assumption, that the core functionality needs to be included in
different versions, is relaxed.
However as Figure 13 further shows versioning and bundling are not distinct, actually both
methods do exactly the same; combine several functionalities into one product. The difference
between the two methods lies in the characteristics of the products. When looking to a typical
bundling example, used before in this study, Microsoft Office, the products sold together are not
related. Customers will use Excel and Word in the same setting, but the products are rather distinct.

P a g e | 33
T h e M o b i l e M o n e y m a k e r D e c e m b e r 3 , 2 0 1 0
Moreover, the two products are not substitutes at all i.e., when a customer buys Excel there can still
be a need for Word.
Versioning on the other hand refers to more related products. The example used before is Microsoft
Windows, where Windows Starter and Windows Ultimate are related products. A customer that
bought Windows Starter will, in almost all cases, not need Windows Ultimate and vice versa, hence
the products are substitutes.
Nevertheless, when looking to the additional functionalities offered in superior versions, these can
be again rather distinct. For example, Windows Ultimate offers additionally encryption and
multiple language support. Those functionalities, as such, are likely to most customers not related.
Specific functionalities can also be referred to as virtual goods. For example the premium offering of
the earlier mentioned Farmville, exists among others out of animal, trees and equipment. Rabbits
are highly related and for most users substitutes to the Dutch rabbits. Trees on the other hand
might be, to some users, substitutes to rabbits because they both enable to express themselves, for
others the relation is non-existing. Rabbits and the tractor will probably, to almost all users, have no
relation because the tractors do have a yield increasing purpose while rabbits are for decoration
only. When multiple virtual goods are offered together like in TapTap Revenge it resembles
bundling and versioning.
So versioning, virtual goods and bundling are conceptually the same, combining or separating
multiple functionalities. The only discrepancy between the three is how the products are related.
Therefore the rich line of literature available to bundling should be applicable to versioning and
virtual goods as well. As will be discussed in more detail in the next section, bundling’ literature is
based on the assumption that products are unrelated, hence to apply the literature a measurement
for relation has to be introduced. indicates the relation between two goods, when ,
the goods are highly related, while when the goods are unrelated. Even though, versioning
and bundling are conceptually the same, the goals are different i.e., segmentation versus
heterogeneity reduction. This difference will be discussed in more detail in section 6.
Note that, so far, no explanation is given about what the explicitly represents. Neither is any
explanation given about how to measure the . In the next section the first is discussed from a
theoretical point of view, while for the latter an attempt is made in the section 5. So far the relation
between two products is described by related and unrelated (following prior literature), while this
only refers to a connection in general. What is meant in this study is correlation i.e., having
corresponding characteristics, or a reciprocal relationship between two products. Therefore in the
proceeding of this study correlated and uncorrelated is used instead of related and unrelated. Note
however that uncorrelated refers to unrelated in prior literature.

P a g e | 34
T h e M o b i l e M o n e y m a k e r D e c e m b e r 3 , 2 0 1 0
4 ECONOMIC MODEL In this section the aim is to model the mathematical implications of bundling, versioning and virtual
goods. In order to model correctly the study starts with the assumptions and proceeds with
adjusting just one property of the model in every subsection. To conclude the model is simulated to
find when bundling is favorable.
4.1 Definitions
In this section various new terms will be introduced. To increase readers’ convenience in this
subsection, all definitions of new terms used in this section are given in alphabetical order.
COPULAS A way of formulating a multivariate distribution in such a way that various general types of dependence can be represented (Nelsen 1998).
DISTRIBUTION
Describes the probability of the value falling within a particular interval.
JOINT PROBABILITY DENSITY
Describes the joint distribution for X and Y and defines the probability of events defined in terms of both X and Y.
LINEAR SYSTEM
A mathematical model of a system based on the use of a linear operator.
SIMULATION
The imitation for scientific modeling of natural systems or human systems in order to gain insight into their functioning.
UNIFORMLY DISTRIBUTED
Distribution where all intervals of the same length on the distribution's support are equally probable.
VARIANCE A measure of the amount of variation within the values of the variable.
4.2 Assumptions
In the last two sections certain restrictions have been proposed that are used as boundaries of the
model. In this subsection a small recap is given for the readers’ convenience. First of all, only one
Appstore is considered, the Apple App Store, which is the most mature store at the.
Secondly the virtual goods model is the most promising method of monetization in Appstores and
interesting from a price discriminative perspective as well. Besides, up to now the study
disregarded the stakeholders in all analysis in order to get an overview of the market without
predefined restrictions. However since in the end the goal is to increase eBuddy´s revenues, the
study will from now on focus on eBuddy’s situation. eBuddy’s current business model is freemium,
but they want to change to a model including virtual goods. Hence virtual goods are considered in
this section. As mentioned before, the line of literature available to bundling is comprehensive and
hence this will be used to extend to virtual goods.

P a g e | 35
T h e M o b i l e M o n e y m a k e r D e c e m b e r 3 , 2 0 1 0
The effects of tie-in sales are applicable when selling virtual goods i.e., customers who already
bought virtual goods will be less likely to use another party without those goods and users already
using the app can only buy the app publishers’ virtual goods. Although interesting, these effects are
left out of this study and are not quantified. Besides tie-in sales, price skimming is omitted as well. It
could be a very lucrative monetization model, but less suitable for a mathematical economic model
and therefore not taken into account.
As discussed in subsection 2.3 the marginal costs of eBuddy are nearly zero, and hence the costs are
omitted from this section. While marginal costs might not be applicable, less visible costs might be
attributable to the model. These costs are not taken into consideration in the economic model, but
will be discussed in subsection 4.4.4.
Note that bundling is used in two ways, stand-alone and in combination with virtual goods. From
now on, bundling will refer to bundling with virtual goods as a’-la-carte pricing will refer to
unbundled virtual goods. Contraire to the previous sections, products are called goods now because
of the focus on virtual goods.
4.3 Model
In order to show exactly the process from the generic model to one specifically aimed at the
situation, the study starts with a basic model. In every subsection the model is extended by one
property.
Notations uses in the Model
v Valuation of the virtual good p The price of the virtual good y The demand for the virtual good R Revenue from selling the virtual good i Virtual good
TABLE 6, NOTATIONS USED IN THIS SECTION
4.3.1 A SINGLE GOOD MODEL 1 Consumers’ valuation of a virtual good is assumed to be
uniformly distributed at the unit of interval , as
prior literature assumed as well (Salinger 1995; Bakos and
Brynjolfsson 1999).
2 Each customer has the same valuation probability
distribution as the other customers and all are mutually
independent (i.i.d).
3 A consumer will always buy exactly 1 virtual good if the
price is lower or equal than the valuation ( ).
4 It is not possible to re-sell goods.
From assumption 1, the demand of the virtual good in the first period is . In
Figure 4 the demand curve is showed, these kinds of graphs will be used throughout the whole
FIGURE 14, ONE GOOD DEMAND
CURVE
p
y

P a g e | 36
T h e M o b i l e M o n e y m a k e r D e c e m b e r 3 , 2 0 1 0
section, where the red line will represent the demand curve of the single good. Contraire to the last
section the price (demand) is presented on the vertical (horizontal) axis.
The company’s revenue in each period is
From the first and second order condition, the optimal price ( ) and the optimal revenue ( ) can
be determined.
4.3.2 MULTIPLE UNCORRELATED VIRTUAL GOODS 1 Consumers’ valuation of each virtual good is assumed to
be uniformly distributed at the unit of interval .
2 Each customer has for each good the same valuation
probability distribution as the other customers and all are
mutually independent (i.i.d).
3 Goods are completely uncorrelated i.e., when a customer
buys good the valuation of good does not change.
Demand for each virtual good equals
. From now on in this study the different goods are not explicitly
named anymore, the demand and prices of all goods are written down in a vector marked by a bold
and , so the demand function is;
In Figure 15 the aggregated demand curve for two goods is showed, which shape does not differ
from the one good curve. The company’s revenue in each period is and
hence the revenue over infinite periods is;
To determine the first order condition is more complex, because we need the partial derivative of
the objective function with respect to each good.
To check if the second order condition is negative in this multi-good situation, a Hessian matrix
must be negative semidefinite.
FIGURE 15, TWO GOODS
DEMAND CURVE
p
y

P a g e | 37
T h e M o b i l e M o n e y m a k e r D e c e m b e r 3 , 2 0 1 0
Where is . For a Hessian Matrix to be negative semidefinite any vector
must satisfy;
In this case, since there is no relation between the goods the vector h has a non-zero as its first
element followed by zeroes and hence the 2nd order condition is met (Varian 1992). Therefore the
optimal prices ( ) and hence the optimal revenue ( ) is;
4.3.3 BUNDLING UNCORRELATED VIRTUAL GOODS To understand what is happening when multiple goods are bundled, the valuation distribution
should be reconsidered. In order to explain, the two-good situation from the article of Salinger
(1995) is used.
Let be the joint probability density function of the valuations . If the two goods
are not bundled, demand for good is given by;
Where is the density of reservation prices for good , and are the upper bounds of the
ranges of valuations of the goods.
Now suppose the good is bundled and let . The demand for the bundle is then given by;
With the uniformly distributed probability density function used
before, demand for the bundle is given by;
In Figure 16 the straight line (red) still represents the
aggregated demand curve of the sole goods, while the blue line
represents the demand curve of the bundle. As can be seen from
the graph the demand curve of the bundle differs from the a’-la-carte offering. The middle part of
the blue line is more flattened than the red one; this implies less heterogeneity in valuation, while in
the tails the heterogeneity is higher. Because price times demand is revenue, the bundle is favorable
FIGURE 16, 2 GOODS BUNDLE
DEMAND CURVE
p
y

P a g e | 38
T h e M o b i l e M o n e y m a k e r D e c e m b e r 3 , 2 0 1 0
over a’-la-carte when the price is below 1 while a’-la-carte is favorable when the price is higher than
1. As the optimal price is at the mean in a’-la-carte situation and there are only two goods bundled,
it is likely the optimal situation for bundling is around the mean as well. Because the demand curve
is more flat around the mean a slightly lower price will gain relatively more demand compared to
a’-la-carte pricing, hence higher revenue. This can be proved mathematically as well.
By calculating the first derivative of
, can be determined.
Given the two optimal values of the optimal revenue is;
So despite the slightly lower price the overall revenue of the bundle is higher, (
).
In a multiple ( ) goods scenario, let be the joint probability density function of the
valuations
. Now suppose the good is bundled and let . The
demand for the bundle is then given by;
This problem can be solved using convolution theory, based on Fourier transformations. However
in general (Uspensky 1937), the distribution of the sum of independent variables with uniform
distribution ( has a density function of;
So in the five-good case the demand function is;

P a g e | 39
T h e M o b i l e M o n e y m a k e r D e c e m b e r 3 , 2 0 1 0
In Figure 17 the cases for are displayed and there is a clear trend towards a more
flattened middle part of the curve, which makes it easier to determine the optimal price and
increase the optimal revenue. A more detailed outline of the steps taken to find these graphs can be
found in Appendix D.
n=3 n=4 n=5
FIGURE 17, BUNDLED DEMAND GRAPHS (N=3, 4, 5)
4.3.4 CORRELATED VIRTUAL GOODS In the previous subsections the assumption of i.i.d. were applicable, but as discussed in subsection
3.5 the aim is to include correlated goods in the model. In order to test whether bundling is also
favorable when the goods are (partly) substitutes, the relation between two goods is expressed in
where can be in the interval . When there is no relation between good and
good , while when projects and can be regarded as full substitutes i.e., when one of the
two goods is purchased there is no need for the other anymore. Another way of thinking about
substitutes is in terms of changing demand of one good when the price of the other changes.
This results in a correlation matrix whose entry is the correlation between good and
and . Consequently, it is a positive-semidefinite matrix because all eigenvalues are positive.
The correlation matrix is symmetric because of the reciprocal character of correlation, described in
subsection 3.5. The correlation between good and equals the correlation between and .
In the uncorrelated case the demand for each good is , but in this case there is a relationship
between the goods of . Imaging , then of the consumers of good , the average valuation
of good declines to 50% of the original value. This equals a decline of 50% in demand, so 50% of
the consumers who bought good do not need good anymore.
p p p
y y y

P a g e | 40
T h e M o b i l e M o n e y m a k e r D e c e m b e r 3 , 2 0 1 0
So the demand of good 1 ( ) depends on the demand of good 2 ( and 3 ( , which depends on
the price of the goods. But now a problem arises; it is possible to calculate when knowing
and , but both and depend on as well. Because and are unknown is also
unknown.
The relationship is equal to the relationship defined in a market interaction model with
substitutes and complements. After all, good 2 is a competitor of good 1 since good 2 sales harm
good 1 sales and vice versa. In Varian (1992) a model is given to describe the effects of substitutes
in Cournot and Bertrand competition models. The models’ initial situation is perfect substitutes, i.e.
two competitors sell the exact same good, while in this study the initial situation is the precise
opposite i.e., the goods are completely uncorrelated. However this does not harm the usability of
the consumers’ inverse demand function of the competition models.
Where , and . Given that , rewriting these equations gives:
Generalizing this to the three-good case discussed earlier, the problem becomes a multivariate
optimization problem which can be solved by using the linear system .
Solving such linear system problems in more theoretical situations can be done using Cramer’s rule
(Varian 1992) Cramer’s rule enables to find the component of the solutions vector by replacing
the column of the matrix with the column vector to form a matrix . is the determinant
of divided by the determinant of ;
The company’s revenue in each period is
.
In order to obtain and the first and second order conditions have to be calculated as showed
in the previous subsection. In this case calculating the first and second order condition is more
complex because of the correlation between different goods.

P a g e | 41
T h e M o b i l e M o n e y m a k e r D e c e m b e r 3 , 2 0 1 0
To determine the second order condition, the Hessian matrix is used again, like in subsection 4.3.2.
The optimal value of p can be derived from these formula’s ( ), while depends on the
correlation matrix.
4.3.5 PURE BUNDLING WITH CORRELATED VIRTUAL GOODS 1 Only one good is offered as virtual good, so all virtual goods are offered in one bundle.
2 A consumer will always buy the bundle if the price is lower or equal to the valuation of all
bundled goods altogether ( ).
In subsection 4.3.3, bundling uncorrelated goods was discussed, while subsection 4.3.4 describes
correlated goods. The aim of this subsection is to combine both subsections in order to model a
bundle with correlated goods.
Although copulas could be useful to find the correlated joint probability density function,
simulation is chosen over copulas. First of all copulas are difficult to obtain and need to preselect a
probability distribution (Nelsen 1998), which is unknown to the researchers. Secondly, in nearly all
cases, analytical analysis of the copulas is not possible, making it necessary to perform numerical
analysis, which is based on simulation as well.
Simulation results are in subsection 4.4.2. An outline of the simulation code is given in Appendix E.
Below the used formulas, for the 3 goods example, is given.
ma ma ma
The valuation of a good within a bundle can never be below zero i.e., a free good within the bundle
does not influence the bundle negatively. Therefore the max statement is included in the formula.
The simulation simulates independent customers with a valuation for each good , each
entering the system. If the population size is sufficient an accurate distribution of bundles’ demand
can be obtained. As mentioned before, results are in subsection 4.4.2.
4.3.6 WRAP UP In this subsection a model given consumers’ uniform valuation is discussed in various settings. In
every subsection one property changed, while the last subsection combined the results of two
subsections in order to describe a bundling model with correlated goods. Yet, the results of this
subsection do not give any insight into the aim of this section; find when bundling is favorable. In
the next subsection the mathematical results from this subsection are used to determine when
what solution is the best one.
4.4 Theoretical results
4.4.1 SIMULATION
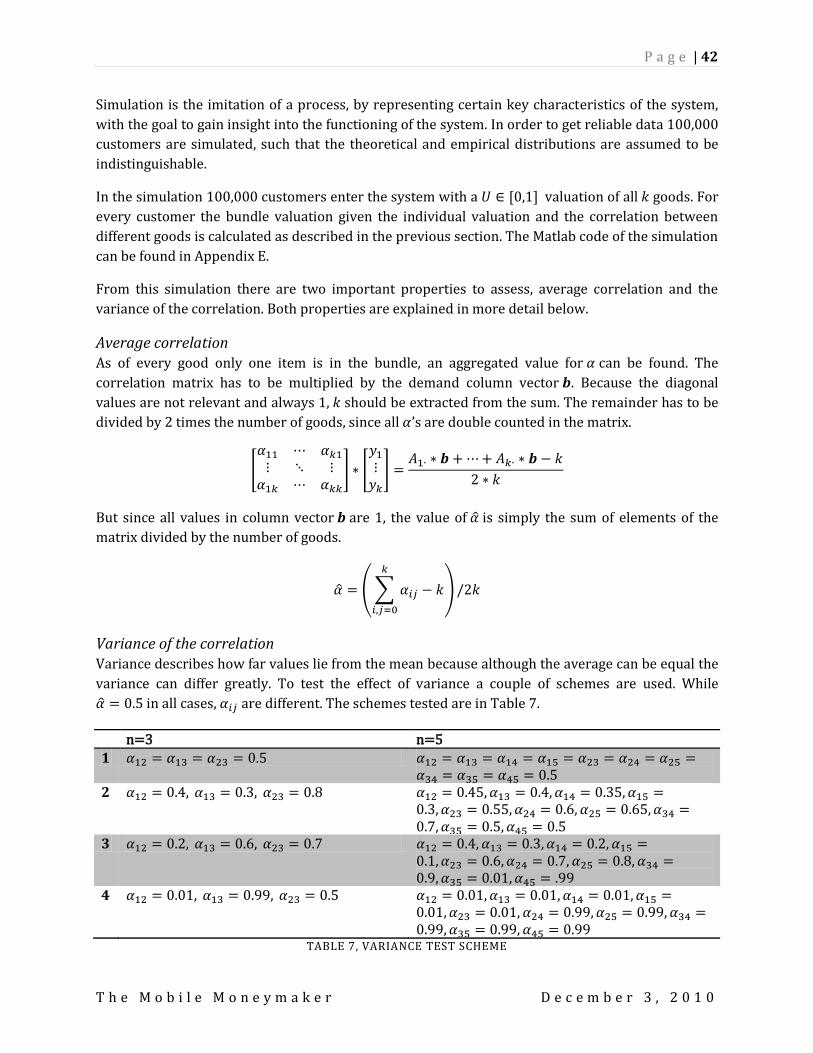
P a g e | 42
T h e M o b i l e M o n e y m a k e r D e c e m b e r 3 , 2 0 1 0
Simulation is the imitation of a process, by representing certain key characteristics of the system,
with the goal to gain insight into the functioning of the system. In order to get reliable data 100,000
customers are simulated, such that the theoretical and empirical distributions are assumed to be
indistinguishable.
In the simulation 100,000 customers enter the system with a valuation of all goods. For
every customer the bundle valuation given the individual valuation and the correlation between
different goods is calculated as described in the previous section. The Matlab code of the simulation
can be found in Appendix E.
From this simulation there are two important properties to assess, average correlation and the
variance of the correlation. Both properties are explained in more detail below.
Average correlation As of every good only one item is in the bundle, an aggregated value for can be found. The
correlation matrix has to be multiplied by the demand column vector . Because the diagonal
values are not relevant and always 1, should be extracted from the sum. The remainder has to be
divided by 2 times the number of goods, since all ’s are double counted in the matrix.
But since all values in column vector are 1, the value of is simply the sum of elements of the
matrix divided by the number of goods.
Variance of the correlation Variance describes how far values lie from the mean because although the average can be equal the
variance can differ greatly. To test the effect of variance a couple of schemes are used. While
in all cases, are different. The schemes tested are in Table 7.
n=3 n=5
1
2
3
4
TABLE 7, VARIANCE TEST SCHEME
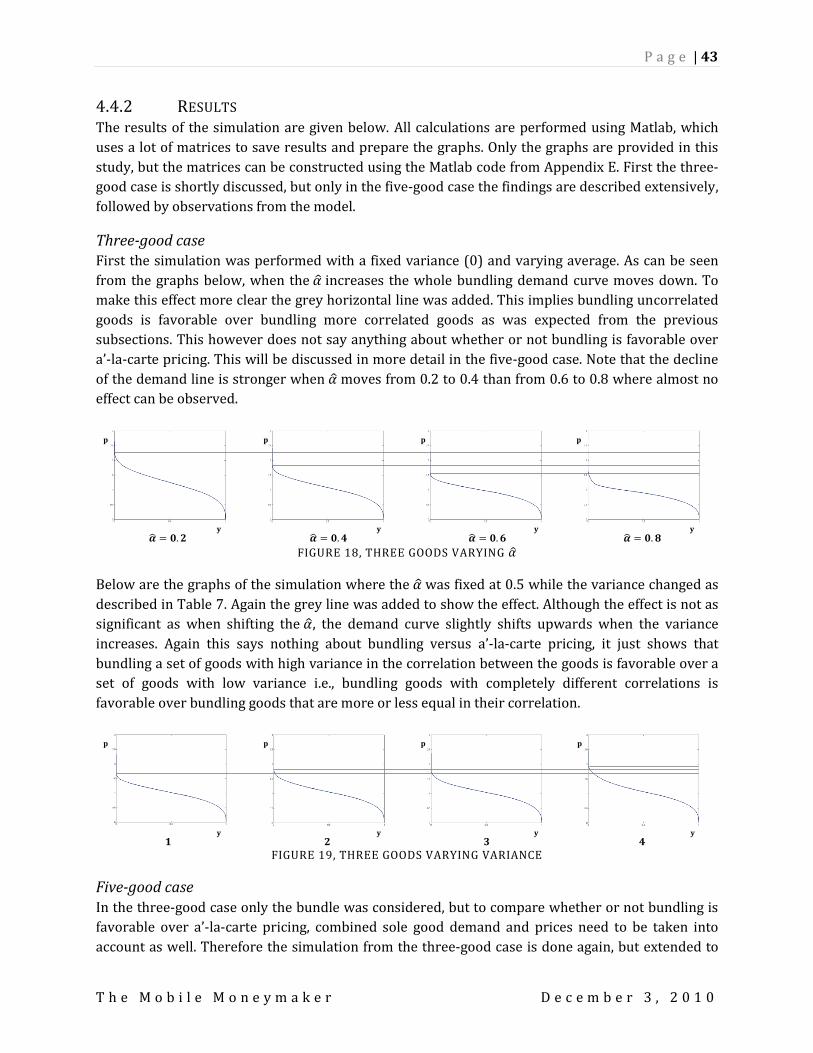
P a g e | 43
T h e M o b i l e M o n e y m a k e r D e c e m b e r 3 , 2 0 1 0
4.4.2 RESULTS The results of the simulation are given below. All calculations are performed using Matlab, which
uses a lot of matrices to save results and prepare the graphs. Only the graphs are provided in this
study, but the matrices can be constructed using the Matlab code from Appendix E. First the three-
good case is shortly discussed, but only in the five-good case the findings are described extensively,
followed by observations from the model.
Three-good case First the simulation was performed with a fixed variance (0) and varying average. As can be seen
from the graphs below, when the increases the whole bundling demand curve moves down. To
make this effect more clear the grey horizontal line was added. This implies bundling uncorrelated
goods is favorable over bundling more correlated goods as was expected from the previous
subsections. This however does not say anything about whether or not bundling is favorable over
a’-la-carte pricing. This will be discussed in more detail in the five-good case. Note that the decline
of the demand line is stronger when moves from 0.2 to 0.4 than from 0.6 to 0.8 where almost no
effect can be observed.
FIGURE 18, THREE GOODS VARYING
Below are the graphs of the simulation where the was fixed at 0.5 while the variance changed as
described in Table 7. Again the grey line was added to show the effect. Although the effect is not as
significant as when shifting the , the demand curve slightly shifts upwards when the variance
increases. Again this says nothing about bundling versus a’-la-carte pricing, it just shows that
bundling a set of goods with high variance in the correlation between the goods is favorable over a
set of goods with low variance i.e., bundling goods with completely different correlations is
favorable over bundling goods that are more or less equal in their correlation.
1 2 3 4
FIGURE 19, THREE GOODS VARYING VARIANCE
Five-good case In the three-good case only the bundle was considered, but to compare whether or not bundling is
favorable over a’-la-carte pricing, combined sole good demand and prices need to be taken into
account as well. Therefore the simulation from the three-good case is done again, but extended to
p
y
p
y
p
y
p
y
p
y
p
y
p
y
p
y

P a g e | 44
T h e M o b i l e M o n e y m a k e r D e c e m b e r 3 , 2 0 1 0
five goods and compared to the aggregated demand of the individual goods. In Appendix E the used
Matlab code can be found.
1 2 3 4
FIGURE 20, FIVE-GOOD CASE
The effects observed in the three-goods case are, as expected, observed again in the five-good case.
The demand curve shifts downwards when increases, while the demand curve shifts upwards
when the variance of correlation increase. The absolute effects are obviously stronger in the five-
good case. Note that exactly the same effects occur in the a’-la-carte situation.
Given that price is on the vertical axis and revenue equals price times demand, the revenue and
hence the profits are, in seven of the eight graphs above, by definition higher while bundling. As can
be seen in all graphs but the first, the blue curve (bundling) is on every single price point on top of
the red line (a’-la-carte). Therefore the price with a given demand is always higher and therefore
profits are always higher. But as the first graph shows, intersection can occur as well. Known is,
from the previous subsections, that the optimal price point for a’-la-carte pricing is half way.
Because the bundling demand curve is in that point ( ) on top of the aggregated demand
curve, the profit is by definition higher. The minimum additional profit bundling elicit is
.
The degree to which bundling is favorable differs depending on variation in correlation and
variance of correlation. This suggests that when bundling does have a negative impact on the total
revenue, as several motives showed in subsection 4.2 with some correlation configuration, a’-la-
carte pricing could become favorable over bundling. In subsection 4.4.4 this will be discussed in
more detail.
These findings lead to the following four observations.
OBSERVATION 1 More correlation has a negative impact on the inverse demand functions of both bundling and a’-la-carte pricing, with uniform valuations, although the degree to which both are sensitive to correlation differs.
OBSERVATION 2 A higher variance within the correlation between the goods has a positive impact on the inverse demand functions of both bundling and a’-la-carte
p
y
p
y
p
y
p
y
p
y
p
y
p
y
p
y

P a g e | 45
T h e M o b i l e M o n e y m a k e r D e c e m b e r 3 , 2 0 1 0
pricing, with uniform valuations, although the degree to which both are sensitive to this variance differs.
OBSERVATION 3 Adding more goods with uniform valuations to the bundle increase the maximum of the average profit per good, while the maximum of the average profit per good given a’-la-carte pricing remains equal.
OBSERVATION 4 Bundling, with more than three goods, is always favorable over a’-la-carte pricing, with uniform valuations, although the degree to which bundling is favorable differ.
4.4.3 OTHER DISTRIBUTIONS The simulations in the previous subsection showed that it is always favorable to bundle even if the
correlation between goods and variance between correlations is high. However, multiple aspects
are left out of the study, that are important to consider, especially given the demographics of
eBuddy.
One aspect is expense restrictions (Bakos and Brynjolfsson 2000). If a company decides to sell a
bundle exclusively, customers with a limited amount of money will not buy the bundle although the
individual valuations and hence the valuation of the bundle is higher than the price. This effect is
particularly important when bundling large amounts of goods (Bakos and Brynjolfsson 2000), but
relevant to eBuddy as well since the largest part of eBuddy’s users are teenagers i.e., low income
customers.
Another related aspect is that competitors, who offer a chat client and virtual goods a’-la-carte,
might be preferred by potential users. This will lead to lower sales and hence lower revenue for the
company. This will be discussed in more detail in the next subsection.
One simulation is done with an e p valuation, which describes
an exponential distribution with mean . The probability
density function is and others already studied this
distribution for bundling with uncorrelated goods (Wu, Hitt et al.
2008). In Figure 21 the five-good demand curve for both the
bundled situation and the a’-la-carte situation is showed. Note
that, the average valuation of the e p distribution is higher,
but the density at lower prices ( ) is also higher and hence the
customer with a limited amount of money compared to other is
imitated. Consequently it is impossible to directly compare the
results from the previous simulations with these and other distribution results.
As was shortly discussed in subsection 2.3.3 sales in the Apple App Store follow a power law. A
classic example of this behavior, first observed by Zipf (Naumis and Cocho 2008), is the size of
cities. The distribution the data follows is highly skewed to the right i.e., many fairly small towns
and a few big cities. What Zipf discovered, and is known as Zipfs’ law, is that when the cities are
ranked from the biggest to the smallest city and the rank and city size are plotted on double
logarithmic axis, a straight line appears, which implies a power law. In many real-world
FIGURE 21, DEMAND CURVE
EXP(1) DISTRIBUTION
p
y

P a g e | 46
T h e M o b i l e M o n e y m a k e r D e c e m b e r 3 , 2 0 1 0
phenomenon’s, like word frequencies, web hits and wealth
distribution the power law, in a discrete form, can be observed
(Newman 2005).
The probability density function of the power law applicable to
the Apple App Store is , where is the cutoff point
(1) and differs per country and category in the Apple App Store
but is most found around 1.25 (Spriensma 2010). This
distribution has an even higher density at low prices than the
exponential distribution, as can be seen for the five-good case in
Figure 22.
An advantage of the numerical approach in the last subsection is that it is easier to examine the
performance with other valuation distribution. The first aspect discussed, stated there are
customers with a limited amount of money i.e., the valuation distribution deviates to more weight
at the lower tail. In the previous subsection both the price and demand could move between as
result of the uniform distribution. Due to the nature of the used distributions this restriction could
not hold in this simulation. Because of one of the properties of virtual goods from subsection 2.4.2,
the assets property, the demand is limited to 1. Hence the price of each good can differ over a larger
range.
Derived from the market interaction model the use of was justified while simulating with the
uniform distribution in subsection 4.4.2. As the simulation is extended to other distributions the
use of is open to discussion. Because the simulation remains essentially the same, except from the
valuation distributions the can be used as a measure of correlation. Note that this says nothing
about the way the can be incorporate in a non-numerical situation.
The same settings as in the previous subsection are used while simulating for the exponential and
power law distribution, however only the five-good case is evaluated (See Appendix E).
Exponential distribution
1 2 3 4
FIGURE 23, EXPONENTIAL DISTRIBUTION CASE
FIGURE 22, DEMAND CURVE
PL(1.25) DISTRIBUTION
p
y
p
y
p
y
p
y
p
y
p
y
p
y
p
y
p
y

P a g e | 47
T h e M o b i l e M o n e y m a k e r D e c e m b e r 3 , 2 0 1 0
The same pattern as in the uniform case can be observed with the exponential distribution. First,
the bundling’ demand curve is in almost all cases (except and ) on top of the a’-la-
carte demand curve and as will be quantified in the next subsection bundling yields always higher
revenue. When increasing the , the a’-la-carte demand curve clearly move downwards while the
bundles’ demand curve remains fairly stable, it slightly moves downwards as well. The tuning of the
variance within the correlation carries a positive effect, especially to the bundles’ demand curve
while a’-la-carte offering is fairly stable. As mentioned, both effects were observed with the uniform
distribution as well, but are much stronger as will be proven in the next subsection.
Power law distribution
1 2 3 4
FIGURE 24, POWER LAW DISTRIBUTION CASE
What was observed in the exponential case can be observed (Figure 24) with the power law
distribution too. The effects are stronger than in the exponential case and consequently stronger
than in the uniform case. This presumes that, the more skewed the distribution, the stronger the
observed effects, which will be numerically proven in the next subsection. It is clear from Figure 24,
that given the power law distribution, the demand curve is on top of the a’-la-carte offering. The
joint distribution is fairly stable while the sole good demand curve is still vulnerable to differences
in the correlations between goods. This effect can also be observed while changing the variance
within the correlation but then carry a positive effect in a’-la-carte demand as the demand curve
moves to the stable bundle demand curve in Figure 24.
These findings lead to the following two observations.
OBSERVATION 5 Observations 1 & 2 applicable to the uniform distribution are applicable to the exponential distributions as well.
OBSERVATION 6 Observations 1 & 2 applicable to the uniform distribution are applicable to the power law distribution as well.
4.4.4 THE DEGREE TO WHICH BUNDLING IS FAVORABLE As could be noticed from the last two subsections, the degree to which bundling is favorable over a’-
la-carte pricing depends primarily on the value of and the chosen distribution.
p
y
p
y
p
y
p
y
p
y
p
y
p
y
p
y

P a g e | 48
T h e M o b i l e M o n e y m a k e r D e c e m b e r 3 , 2 0 1 0
Moreover, although there are no direct costs involved, there are some issues that need attention.
First of all, although bundling might be efficient, it restricts the choice of consumers. It might
provoke frustration and unhappiness, hence in customer relationship bundling might not be the
right thing to do (Liebowitz and Margolis 2009). Another related aspect is that competitors, who
offer a chat client and virtual goods a’-la-carte, might be preferred by potential users. This will lead
to lower usage and hence lower revenue for the company.
It is difficult to get an idea to what extent this will influence the joint distribution of the bundle.
Nevertheless, it is possible to determine for each distribution and combination, the tipping point
i.e., the point when a’-la-carte pricing becomes more profitable than bundling. This tipping point is
represented by a new variable . represents the degree to which bundling is favorable over
a’-la-carte pricing.
In Table 8 the results of the simulation in the three- and five-good case (See Appendix E) are
provided, which are intuitive given the graphs from the previous subsection. If for example a
negative demand of 40% is expected from only offering a bundle of 5 goods, the must, in case of
an uniform distribution, be larger than 0.2 to gain higher profits.
N=3 – N=5
N=3 – N=5
N=3 – N=5
0.1 0.79 - 0.68 0.69 - 0.57 0.27 - 0.22 0.2 0.74 - 0.61 0.64 - 0.50 0.26 - 0.21 0.3 0.69 - 0.55 0.59 - 0.45 0.25 - 0.20 0.4 0.65 - 0.51 0.55 - 0.40 0.25- 0.19 0.5 0.62 - 0.47 0.52 - 0.37 0.24 - 0.17 0.6 0.59 - 0.44 0.49 - 0.34 0.23 - 0.16 0.7 0.56 - 0.41 0.47 - 0.31 0.22 - 0.15 0.8 0.53 - 0.39 0.44 - 0.28 0.21 - 0.14 0.9 0.51 - 0.36 0.42 - 0.26 0.20 - 0.12 1 0.49 - 0.35 0.40 - 0.24 0.19 - 0.11
TABLE 8, SIMULATION RESULTS
What can be concluded from Table 8 is that in general the five-goods case shows significant
decrease in the value of compared to the three-good case i.e., significant increase in the degree to
which bundling is favorable over a’-la-carte pricing when the number of goods increase. This
finding is in line with bundling uncorrelated goods (Bakos and Brynjolfsson 1999). Moreover the
gap between both the three- and five-good case becomes wider when the increases i.e., the five-
good bundle is less reluctant to more correlated goods than the three-good bundle. Finally bundling
in a more left skewed distribution is more favorable over a’-la-carte pricing than in a more uniform
distribution as can be seen from the lower value of when simulating the exponential and power
law distribution (with three and five goods).

P a g e | 49
T h e M o b i l e M o n e y m a k e r D e c e m b e r 3 , 2 0 1 0
These findings lead to the following four observations.
OBSERVATION 7 Bundling with more than three goods is always favorable over a’-la-carte pricing, although the degree to which bundling is favorable differ.
OBSERVATION 8 The more goods are added to the bundle the more favorable it becomes to bundle over a’-la-carte pricing.
OBSERVATION 9 The more skewed the valuation distribution is to the left, the more favorable bundling becomes over a’-la-carte pricing.
OBSERVATION 10 When more goods are added to the bundle the bundle becomes less vulnerable to increasing correlation.
4.4.5 WRAP UP By simulation some rather unexpected results are found. Although it was not explicitly stated in any
paper the notion existed that bundling uncorrelated goods was favorable over bundling correlated
good. Simulation showed the exact opposite. This preconceived opinion existed because many
contributors wrote that the results were only valid to uncorrelated goods (Salinger 1995; Bakos
and Brynjolfsson 1999; 2000).
While bundling is always favorable over a’-la-carte pricing in the simulation, in subsection 4.4.4 the
degree to which bundling is favorable are given. If considering several problems in customer
satisfaction and behavior of competitors, it might be, in certain cases, better to drop the bundle and
sell single features.
4.5 Conclusions
Although in this section a highly stylized model is used which is also based on a number of
premises, it is in line with the models of several influential contributors (Salinger 1995; Bakos and
Brynjolfsson 1999; 2000). The uniform distribution is almost never observed in the real
world and based on earlier research at eBuddy not applicable to their situation. However as others
proved before (Wu, Hitt et al. 2008) the results can even be better with other distributions, like
broader width uniform- and exponential distributions. In this section is proved that not only in
uncorrelated cases this is valid but is applicable to correlated goods as well.
This section started to study effects when bundling virtual goods but the findings are more general.
The findings can be applied to basically all goods with zero marginal costs and as was discussed in
section 2, all information goods share this property and thus these results are applicable to all
information goods. Note that because distribution of the software will not be as easy as with in-app
virtual goods, the value of should be estimated higher.
In this section the valuations of the goods were assumed to be mutually independent in all
simulations. Although, theoretical convenient, one can ask questions about the tenability of this.
Partial substitutes are not only substitutes in demand i.e., why will a customer have a higher
valuation for a substitute good? Although counterintuitive it is frequent, imaging a gaming console
like the Playstation which is twice the price of the Xbox, when a consumer bought one of the two

P a g e | 50
T h e M o b i l e M o n e y m a k e r D e c e m b e r 3 , 2 0 1 0
the need to buy the other will disappear for almost all consumers. Besides, this effect is likely to be
only applicable when goods are full substitutes and those edge cases should be approach with more
caution anyway.
To use this model two unknowns have to be estimated, 1) the valuation distribution of the
consumers and 2) the value of for every combination of goods. For the first it is, although
unknown, relative easy to get an idea of. The latter however is more difficult to assess, therefore in
the next section an attempt to perform an educated estimation of is made.

P a g e | 51
T h e M o b i l e M o n e y m a k e r D e c e m b e r 3 , 2 0 1 0
5 CORRELATION Key in the last subsection is the correlation between virtual goods. Proven in the model is, that if
correlation between the available goods is high it is more profitable to bundle, while a higher
variation in correlations is favorable as well. Therefore in this section a framework is provided to
assess the correlation between virtual goods.
5.1 Definitions
In this section various new terms will be introduced. To increase readers’ convenience in this
subsection, all definitions of new terms used in this section are given in alphabetical order.
CONSTRUCTS An explanatory variable which is not directly observable.
CONSTRUCT OPERATIONALIZATION
The process making the concept measurable and to understand it in terms of empirical observations.
CROSS-SECTIONAL DESIGNS A class of research methods that involve observation of all of a population, or a representative subset, at a defined time.
CRONBACH’S ALPHA
Measure of reliability for a set of two or more constructs indicators. Values range between 0 and 1, with higher values indicating higher reliability among the indicators.
ERROR VARIANCE
Unreliable and inexplicable variation in a variable.
FACTOR LOADING
Weighting which reflect the correlation between the original variables and derived factors.
HYPOTHESIS
A proposed explanation for an observable phenomenon.
INSTRUMENT VALIDITY
The extent to which an instrument measures what it is supposed to.
INTERNAL VALIDITY
The validity of (causal) inferences in scientific studies, based on experiments
STATISTICAL VALIDITY
The degree to which an observed result, can be relied upon and not attributed to random error in sampling and measurement.
5.2 Dimensions
As described multiple times before, a virtual good can, according to Lehdonvirta (2009), be
described on three dimensions, the utilitarian-, the hedonic- and the social-dimension. By thinking
in dimension as a XYZ plane as in Figure 25, where utilitarian dimension is represented by x, the
hedonic by y, and finally the social dimension by z, the distance between the different goods can be
quantified.
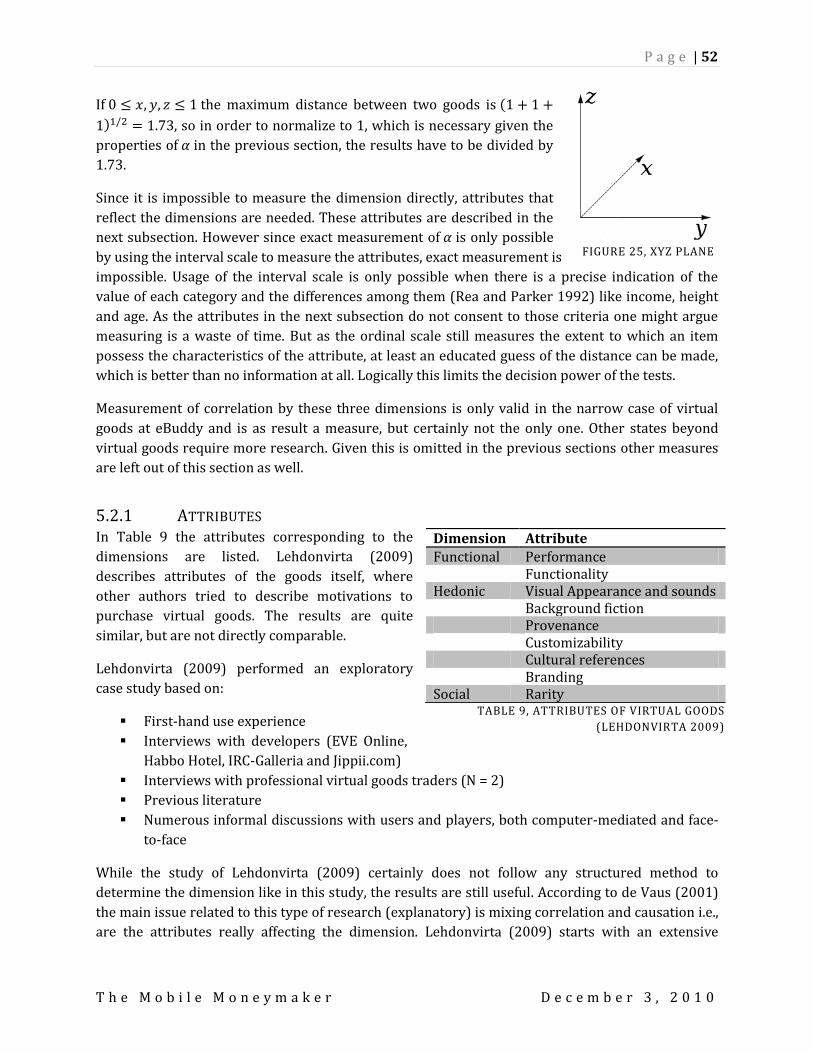
P a g e | 52
T h e M o b i l e M o n e y m a k e r D e c e m b e r 3 , 2 0 1 0
If the maximum distance between two goods is
, so in order to normalize to 1, which is necessary given the
properties of in the previous section, the results have to be divided by
1.73.
Since it is impossible to measure the dimension directly, attributes that
reflect the dimensions are needed. These attributes are described in the
next subsection. However since exact measurement of is only possible
by using the interval scale to measure the attributes, exact measurement is
impossible. Usage of the interval scale is only possible when there is a precise indication of the
value of each category and the differences among them (Rea and Parker 1992) like income, height
and age. As the attributes in the next subsection do not consent to those criteria one might argue
measuring is a waste of time. But as the ordinal scale still measures the extent to which an item
possess the characteristics of the attribute, at least an educated guess of the distance can be made,
which is better than no information at all. Logically this limits the decision power of the tests.
Measurement of correlation by these three dimensions is only valid in the narrow case of virtual
goods at eBuddy and is as result a measure, but certainly not the only one. Other states beyond
virtual goods require more research. Given this is omitted in the previous sections other measures
are left out of this section as well.
5.2.1 ATTRIBUTES In Table 9 the attributes corresponding to the
dimensions are listed. Lehdonvirta (2009)
describes attributes of the goods itself, where
other authors tried to describe motivations to
purchase virtual goods. The results are quite
similar, but are not directly comparable.
Lehdonvirta (2009) performed an exploratory
case study based on:
First-hand use experience
Interviews with developers (EVE Online,
Habbo Hotel, IRC-Galleria and Jippii.com)
Interviews with professional virtual goods traders (N = 2)
Previous literature
Numerous informal discussions with users and players, both computer-mediated and face-
to-face
While the study of Lehdonvirta (2009) certainly does not follow any structured method to
determine the dimension like in this study, the results are still useful. According to de Vaus (2001)
the main issue related to this type of research (explanatory) is mixing correlation and causation i.e.,
are the attributes really affecting the dimension. Lehdonvirta (2009) starts with an extensive
Dimension Attribute
Functional Performance Functionality Hedonic Visual Appearance and sounds Background fiction Provenance Customizability Cultural references Branding Social Rarity
TABLE 9, ATTRIBUTES OF VIRTUAL GOODS
(LEHDONVIRTA 2009)
FIGURE 25, XYZ PLANE

P a g e | 53
T h e M o b i l e M o n e y m a k e r D e c e m b e r 3 , 2 0 1 0
overview of literature and based on this literature performed theory building, which was consistent
with earlier literature in both virtual goods and more tangible commodities. Some researchers
believe the case study should only be used to generate hypotheses for future, more rigorous, testing
(Vaus 2001), which is agreed by Lehdonvirta (2009) in the limitations and further research section.
So, more rigorous testing is necessary, before this study can obtain the attributes and dimensions as
the basis of the correlation coefficient. Besides it is important to note that several of the attributes
represent a positional characteristic instead of an absolute one i.e., their value stems from how they
compare to other goods and the surrounding environment (Lehdonvirta 2009). This property fits
within the goal of this study as several virtual goods should be positioned in order to determine the
best selling bundles.
5.2.2 CONSTRUCTS In Table 10 the constructs and the corresponding definition are given (retrieved from the
dictionary (most appealing definition), and slightly adjusted).
Abbr: Construct: Definition:
PERF Performance The degree to which an item improves the way the app functions.
FUNC Functionality The degree to which an item increases the abilities and options of the app.
VAAS Visual Appearance and Sounds
The degree to which an item improves the look of the app and enables the configuration of sounds.
BAFI Background fiction The degree to which an item provides underlying background information.
PROV Provenance The degree to which an item has historical value. CUST Customizability The degree to which an item enables the user to change
according to the individual requirements. CURE Cultural references The degree to which an item enables the user to express their
real-life national identity. BRAN Branding The degree to which an item identifies and differentiates the
user from the other users. RARI Rarity The degree to which an item is scarce.
TABLE 10, DEFINITIONS OF THE CONSTRUCTS
But in order to test whether the dimensions move along with the expected corresponding
constructs, the dimensions have to be tested as well. Therefore in Table 11 the dimensions and the
corresponding definitions are given.
Abbr: Dimension: Definition:
DFUN Functional The degree to which an item is capable of functioning and is practical rather than decorative.
DHED Hedonic The degree to which an item pursuits of or devotion to pleasure of the senses.
DSOC Social The degree to which an item is relating to or considered appropriate to one thought superior.
TABLE 11, DEFINITIONS OF THE DIMENSIONS

P a g e | 54
T h e M o b i l e M o n e y m a k e r D e c e m b e r 3 , 2 0 1 0
When looking at the definitions of all constructs and dimensions the provenance constructs does
not fit within the eBuddy environment. Historical value might be applicable to the focus of
Lehdonvirta (2009) study, games, but cannot be included into the virtual goods eBuddy will offer.
Therefore provenance is excluded from the research. This is also the case with the background
fiction construct, virtual goods sold by eBuddy will not have an underlying story as games
characters might have. Although rarity is an outsider as well, this construct can occur, in for
example very expensive or limited-sale goods. Finally, the visual appearance and sounds construct
actually measures two different properties and as the guidelines (Rea and Parker 1992) used in this
research said this should be avoided. Therefore in this study only the visual appearance will be
measured.
5.2.3 HYPOTHESES Expected is a positive relation for all of the constructs towards the connected dimensions in Figure
26. When following the line of use in other papers, each connection in Figure 26 would be
accompanied by a hypothesis i.e., this leads to 12 hypotheses. As all hypotheses are equal in nature
only the three types are discussed.
FIGURE 26, CONSTRUCTS NETWORK
HYPOTHESIS TYPE 1 The functional dimension (DFUN) is positively influenced by performance (PERF) and functionality (FUNC)
HYPOTHESIS TYPE 2
The hedonic dimension (DHEF) is positively influenced by visual appearance (VAAS), background fiction (BAFI), customizability (CUST), cultural reference (CURE), branding (BRAN) and rarity (RARI).
HYPOTHESIS TYPE 3 The social dimension (DSOC) is positively influenced by visual appearance (VAAS), background fiction (BAFI), customizability (CUST), cultural reference (CURE), branding (BRAN) and rarity (RARI).
5.2.4 WRAP UP

P a g e | 55
T h e M o b i l e M o n e y m a k e r D e c e m b e r 3 , 2 0 1 0
In this subsection the outline of what this study wants to test is given. In order to make an educated
guess about the introduced in section 4 the dimensions introduced in subsection 2.4.2 are used.
With the attributes defined in this subsection, constructs are defined and causal relations are
proposed. To validate this subsections’ propositions, in the next subsections the set-up and
implementation of the survey is discussed to check whether the relations really exist.
5.3 Survey design
5.3.1 METHOD OF TESTING There is nothing about the logic of cross-sectional designs that requires a particular method of data
collection. It is essential to obtain a structured set of data that enables systematic comparison
between cases or groups of cases. The most used, and preferred method in this study, is the
structured questionnaire. Given the population to perform the test on, the best way is a self-
administered survey by the respondent via an online survey system. There are several weaknesses
of this method. When assuming mail is equal to online surveys, there is 1) no control over who
completes the questionnaire, 2) avoidance of refusal bias, 3) not suited to handle more complex and
time consuming questions (Vaus 2001).
In general, the larger the sample the better, but beyond a certain point increases have more
marginal benefits (Vaus 2001). In the population used in this study (eBuddy) to find sufficient
participants should not be a problem given surveys executed before. However there are some
issues that can become a problem like response rate and demographics. These issues are discussed
in more detail in the next subsections.
5.3.2 DESIGN In order to perform this explanatory research with quantitative data this study will use a cross
sectional design, 1) because the observations relies on existing variations, 2) the data are collected
at one point of time and 3) there is no random allocation to ‘groups’ (Vaus 2001).
FIGURE 27, VALIDITY TOUCHSTONES (STRAUB, 1989)

P a g e | 56
T h e M o b i l e M o n e y m a k e r D e c e m b e r 3 , 2 0 1 0
The problem of rigor in research has always persisted, especially in dynamic and ever changing
fields like Information System research. Therefore Straub (1989) proposed a method to validate of
the instruments in order to find reliable i.e., the same results on repeated occasions (Vaus 2001),
findings and interpretations.
Straub assessed three top journals for three years and found that only 17% of the articles reported
reliability, 13% validated their constructs and 19% either did a pretest or a pilot test. 11 years later
an equal research was conducted and found that significant progress was made (Boudreau, Gefen et
al. 2001), proving that among researchers the issues brought up by Straub were relevant.
The proposed method of Straub exists of three phases to strengthen the empirical findings by
instrument validation, internal validity and statistical conclusion validity. The findings are
summarized in Figure 27. This is more or less in line with the book of de Vaus (2001).
5.3.3 STATISTICAL VALIDITY The problem of confounding variable is in a cross sectional design tackled at the data analysis stage
rather than at the data collection stage. Differences between groups are removed after the data
have been collected. In order to do so matching information is needed e.g., when we want to
distinguish groups based on age, the age of the participants is needed. In the subsection 5.4.1 more
information about the matching information is provided.
5.3.4 INTERNAL VALIDITY In cross sectional design threats for internal validity stems from 2 sources; problems in
establishing cause and problems at the level of meaning (Vaus 2001). To address the first problem a
preliminary literature review was performed to get rid of alternative explanations. Albeit it is
impossible to completely eliminate alternative explanations, it supports a priori for arguing a case.
The latter, to provide meaningful explanations, is harsh in cross sectional design but less relevant as
well. This questionnaire does not aim to explain why for example rarity provoke the social
dimension; this is done by others before (Lehdonvirta 2009). The focus is on proving the
relationships.
Another known threat is the non-responders bias, which is especially applicable in this situation as
eBuddy’s users are numerous, but do not have a strong bonding with the company and most likely
do not have interest in the survey. Unfortunately this problem cannot be solved; however some
effort can be made by making the objectives and time consumption clear beforehand.
Common method variance refers to the amount of spurious covariance shared among variables
because of the common method used in collecting data i.e., variance that is attributable to the
measurement method rather than to the constructs the measures represent (Podsakoff, MacKenzie
et al. 2003). This is a severe threat in general and especially to surveys that collect the responses at
one point in time. Given the difficulties with linking the data and expected unwillingness to
participate in the second round of questionnaires, the study is caught in the single setting. In order
to reduce the common method variance, in this study the guidelines of item and questionnaire
design of Rea and Parker (1992) are applied. There are procedures available to test for Common
method variance after data collection as will be discussed in subsection 5.5.4.

P a g e | 57
T h e M o b i l e M o n e y m a k e r D e c e m b e r 3 , 2 0 1 0
5.3.5 INSTRUMENT VALIDITY Instrument validity is based on three criteria: content validity, construct validity and reliability
(Straub 1989). The instrument is content valid when the measures tap the different aspects of the
concepts as defined. Construct validity measures of a construct actually measure what the construct
is supposed to measure. Construct validity can be accepted when both convergent i.e., degree to
which a measure is correlated with other measures that it should correlate with, and divergent
validity i.e., degree to which the measure does not correlate with other measures that it
theoretically should not be correlated with, is showed. Reliability measures the extent to which the
measure gives the same reading when used on repeated occasions. Reliability is commonly
assessed by using Cronbach alphas.
Invalidated instruments are a waste given it unnecessarily lowers the quality of the research. So
given the restrictions of the research it is key to obtain the highest instrument validity as possible.
In order to do so the sorting procedure of Moore and Benbasat (1991) is used. After the sorting
procedure, a pre-test is used to assess the reliability and other procedures of the survey. After this
pre-test a larger pilot-test is used to technically asses construct validity and reliability.
Phase Methods Content validity
Construct validity
Reliability
1 Conceptual validation Qualitative x x x 2 Pretest Qualitative x x x
3 Pilot test Composite Reliability Factor analysis
x x
4 Survey Composite Reliability Factor analysis
x x
TABLE 12, ASSESSSMENT OF VALIDITY
5.3.6 WRAP UP In this subsection the instruments to make this study robust are explained. Before the
implementation can be done, a few issues have to be discussed.
First the way the questionnaire is presented will be discussed. eBuddy is a web based service and
through the advertisement platform, empty inventory can be used to mention the survey to users.
Participants that are already logged in to eBuddy can click on the banner and can in that way
voluntary participate in the survey.
The questionnaire will be in English to avoid cross-language issues in the validity of the research.
Therefore only users that have a certain level of the English language should be allowed to
participate. The only way to guarantee a proper knowledge of the language is to include only native
speakers. Therefore only users that are from the United States, United Kingdom, Australia, Canada
and Ireland will be invited to participate in the survey. This country selection also minimizes cross-

P a g e | 58
T h e M o b i l e M o n e y m a k e r D e c e m b e r 3 , 2 0 1 0
cultural factors and economical differences since all five are wealthy countries and according to
Hofstede28 the countries are culturally more or less equal (see Table 13).
Country Power distance
Individualism Masculinity Uncertainty avoidance
Long-term orientation
U.S. 40 91 62 46 29 U.K. 35 89 66 35 25 Australia 36 90 61 51 31 Canada 39 80 52 48 23 Ireland 28 70 68 35 -
TABLE 13, CULTURAL DIMENSION, HOFSTEDE29
5.4 Survey implementation
5.4.1 CONSTRUCT OPERATIONALIZATION As Lehdonvirta (2009) mentioned the nine attributes should be broken down into more detailed
features aimed at specific types of goods. In this study the seven remaining attributes (see Figure
26) are used as constructs and operationalized by questions aimed at the virtual goods eBuddy
offers.
Survey questions Most studies use validated constructs, definition and questionnaires to set up a survey, but in this
new area of research no pre-validated surveys are available. Therefore all questions have to be
invented from scratch. In order to secure reliability the guidelines of Rea and Parker (1992) are
taken into account as are the steps of the previous subsection to validate the instruments.
The guidelines are divided into two categories, 1) phrasing and 2) formatting. Where phrasing
refers to how to construct a sequence of words with the right meaning, while formatting refers to
the arrangement of the questions and scaling issues (Rea and Parker 1992).
By focusing on good phrasing, the survey should be comprehensive to all participants and all
questions produce unbiased answers. First of all the wording in the survey should be simple,
straight forward and to the point without loss of substance. Besides, efforts must be devoted to
avoid ambiguity within the questions, multipurpose questions and manipulative information.
Finally it is really important to construct questions with unbiased words or phrases.
Construct & Questions
Functional DFUN1 DFUN2 DFUN3
I think [..] is a functional feature to eBuddy. The [..] is a practical good. I will use [..] because it supports eBuddy functioning.
Hedonic DHED1 DHED2
I think [..] will make eBuddy more attractive. The [..] is a decorative good.
28 http://www.geert-hofstede.com/ 29 http://www.geert-hofstede.com/hofstede_dimensions.php

P a g e | 59
T h e M o b i l e M o n e y m a k e r D e c e m b e r 3 , 2 0 1 0
DHED3 I will use [..] because it excites me. Social DSOC1 DSOC2 DSOC3
I think [..] has no use except increasing my status. The [..] is a status good. I will use [..] because it’s exclusive.
Performance PERF1 PERF2 PERF3
I think [..] will improve eBuddy performance. The [..] is a quality good. I will use [..] because it makes something functioning better.
Functionality FUNC1 FUNC2 FUNC3
I think [..] extends the capabilities of eBuddy. The [..] is a capacity increasing good. I will use [..] because it enables more options in eBuddy.
Visual Appearance VAAS1 VAAS2 VAAS3
I think [..] will extend the visual appearance of eBuddy. The [..] is a manifestation good. I will use [..] because it makes eBuddy look nicer.
Customizability CUST1 CUST2 CUST3
I think [..] enables me to change eBuddy’s look and feel. The [..] is a personalization good. I will use [..] because it enables customization.
Cultural references CURE1 CURE2 CURE3
I think [..] allows me to express where I come from. The [..] is an ethnic tied good. I will use [..] because it reflects my background and values.
Branding BRAN1 BRAN2 BRAN3
I think [..] will identify who I am. The [..] is a personal branding good. I will use [..] because it differentiates me from other users.
Rarity RARI1 RARI2 RARI3
I think [..] is exclusive. The [..] is a show off good. I will use [..] because it is scarce.
TABLE 14, SURVEY QUESTIONS
Formatting Closed questions entail compared to open questions more considerations (Rea and Parker 1992).
As discussed in subsection 5.2 the interval scale is preferable but impossible to use. Therefore the
ordinal scale will be used. Although findings suggest the number of response categories beyond five
to seven does not yield substantial gains in reliability, construct validity may (Sosik, Kahai et al.
2009). And therefore the responses are divided in a seven point likert scale; on a continuum from
totally disagree to totally agree.
The scales will be presented horizontally, while the questions are vertically located. The questions are within each category randomly presented to participants. Some survey questions are needed to collect matching information as discussed in subsection 5.3.3.
In this survey the following characteristics are collected;

P a g e | 60
T h e M o b i l e M o n e y m a k e r D e c e m b e r 3 , 2 0 1 0
Country
Age
Gender
Date of start using eBuddy
Login behavior of eBuddy
Messages send via eBuddy per session
Willingness to pay
The first three questions (closed) are asked at the beginning of the survey, while the latter four
(three open / one closed) are asked at the end, as proposed by Rea and Parker (1992). This
information can be matched against information retrieved from the database of eBuddy, in order to
determine whether or not the survey sample is representative.
Archetypes In order to secure construct validity, for all seven constructs an archetype has been constructed
measuring if the construct actually reflects what it should measuring (convergent) and not should
measure (divergent) as discussed in subsection 5.3.5. An archetype is an ideal (exemplified)
example. In the pre-, pilot test and actual survey the archetypes of Table 15 will be used.
Archetypes APERF iPad version
This package changes the eBuddy iPhone app to work properly on the iPad AFUNC
Skype chat This package enables you to start chatting with your friends on Skype.
AVAAS
New backgrounds This package includes 10 new funny backgrounds.
ACUST
Colorize your eBuddy This package enables you to colorize the eBuddy app and add multiple new fonts to chat.
ACURE
National flag When installed your screen picture will be a moving picture of your country.
ABRAN
Smiley package of your favorite brand This smiley package of your favorite brand (like coca cola or apple) can be used in every chat you make to all people.
ARARI
Shining diamond Only available for a limited time!! A beautiful screen picture of a shining diamond.
TABLE 15, ARCHETYPES
5.4.2 CONCEPTUAL VALIDATION As mentioned already in subsection 5.3.2 a structured validation procedure (Moore and Benbasat
1991) is used to confirm if the concepts validated in other studies are applicable. The study of
Moore et al. (1991) focuses on developing instruments to measure perceptions, as in this study is
done as well, measuring the perception of virtual goods. And although the study is done in a
different setting, this framework is, to some extent adjusted, used. The procedure exist of two
stages, a blind sorting round without prior knowledge and a sorting round with knowledge about
the definitions to determine the right category for every item.

P a g e | 61
T h e M o b i l e M o n e y m a k e r D e c e m b e r 3 , 2 0 1 0
First round In the first round unskilled people were used to match the questions to the constructs and
dimensions. First the goal and the exercise were explained comprehensively with an example.
When the participant said he or she fully understood the process, all seven constructs and three
dimensions, printed on a paper, were laid down on a table. The shuffled deck of questions (30) and
archetypes (7) was given to the participant to sort the questions to the right construct. This
exercise was done with four participants, so each construct can have a maximum score of 16 in
Table 16, while each dimension can have a maximum score of 12.
1 2 3 4 5 6 7 8 9 10
1 Functional 6 0 0 4 1 0 1 0 0 0 2 Hedonic 0 6 0 0 0 3 1 0 2 0 3 Social 0 1 7 0 0 0 0 0 3 1 4 Performance 2 0 0 10 4 0 0 0 0 0 5 Functionality 3 0 0 3 10 0 0 0 0 0 6 Visual appearance 0 4 0 0 0 11 1 0 0 0 7 Customizability 1 1 0 0 0 1 13 0 0 0 8 Cultural reference 0 0 0 0 0 0 0 16 0 0 9 Branding 0 1 3 0 0 1 0 0 11 0
10 Rarity 0 0 1 0 0 0 0 0 0 15 TABLE 16, SORTING ROUND 1 RESULT
In this sorting round, some errors in the survey were clearly visible. All three dimensions were only
sort well in half of the cases, which is not a good score. On the other hand most errors in the other
constructs were at least contributed to the right dimension i.e., according to the classification of
Table 9. Given the low error rate of 7, 8, 9 and 10 these are left intact, but all other need some
(slight) adjustments. Although branding did not score well, this error was attributable to only one
person, who, most likely, did not understand the concept; therefore the branding questions are not
adjusted. All of the archetypes were sorted perfectly correct. The problematic questions are
discussed below, while the adjusted questions are in Table 17.
DFUN3: This question looked at lot like question PERF3, and is therefore replaced.
DHED2: This question was answered wrong 4 times and placed each time at VAAS.
DSOC3: This question was used twice (RARI1).
PERF2: The definition of quality good was not clear to the participants.
FUNC1: Was not clear, but according to the researchers this question measures exactly what
it should, so was not adjusted.
VAAS2: See DHED2.
Adjusted questions
DFUN3 I will use [..] because it supports eBuddy’s utility. DHED2 The [..] is a pleasure of the senses good. DSOC3 I will use [..] because it facilitate my social rank. PERF1 I think [..] will increase the quality of working with eBuddy. PERF2 The [..] is a performance good. VAAS2 The [..] is a decorative good.
TABLE 17, ADJUSTED QUESTIONS AFTER SORTING ROUND 1

P a g e | 62
T h e M o b i l e M o n e y m a k e r D e c e m b e r 3 , 2 0 1 0
Second round In the second round another approach was taken. This time people with knowledge i.e., eBuddy
employees, were used to perform the sorting round. The procedure was a little bit different because
now no information about the construct was given. So after the deck with questions was given to
the participant, they were asked to sort the deck into 10 categories. In this round three employees
of eBuddy participated and hence the maximum score in Table 18 is nine for both the constructs
and the dimensions.
1 2 3 4 5 6 7 8 9 10 1 Functional 9 0 0 0 0 0 0 0 0 0 2 Hedonic 0 9 0 0 0 0 0 0 0 0 3 Social 0 0 8 0 0 0 0 0 0 1 4 Performance 0 0 0 9 0 0 0 0 0 0 5 Functionality 0 0 0 0 9 0 0 0 0 0 6 Visual appearance 0 0 0 0 0 9 0 0 0 0 7 Customizability 0 0 0 0 0 0 9 0 0 0 8 Cultural reference 0 0 0 0 0 0 0 9 0 0 9 Branding 0 0 0 0 0 0 0 0 9 0
10 Rarity 0 0 1 0 0 0 0 0 0 8 TABLE 18, SORTING ROUND 2 RESULTS
In this round almost no errors were made, except from one switch between RARI and DSOC.
However some changes are made based on feedback the researchers received about wording and
vague meaning, see Table 19. Next to the changes the following considerations were given:
Does everyone know what a good is?
Personal, showoff and status good are very closely related.
Adjusted questions
BRAN1 I think [..] will identifies what I’m like. BRAN3 I will use [..] because it distinguish me from other users. DHED2 The [..] is a pleasure good.
TABLE 19, ADJUSTED QUESTIONS AFTER SORTING ROUND 2
5.4.3 PRE-TEST In the pretest the online survey tool surveymonkey30 was used. This tool is used in the final survey
as well. In this pre-test friends were used to assess the survey. 10 participants were asked to
complete the survey, and were afterwards asked to evaluate the questionnaire. Misinterpretation of
questions result in measurement errors and therefore variations in the results were examined in
detail. For this pretest the archetype ACUST is used.
The feedback included notes about the colors and font, grammar and some small textual
adjustments. These notes were processed immediately. More serious remarks on the survey were:
Introduction text was not sufficient
Too many choices (seven point likert scale)
30 http://nl.surveymonkey.com/

P a g e | 63
T h e M o b i l e M o n e y m a k e r D e c e m b e r 3 , 2 0 1 0
The introduction text was slightly adjusted both formatting wise and textual to make more clear
what was tested. The likert scale was reconsidered but kept based on seven points; however the
pilot test has to prove that seven points is not too many.
Some considerations brought up in the second round were not confirmed in this test. Since the
participants were unfamiliar with the subject and did not have issues understanding the items,
these are left unaffected.
5.4.4 PILOT STUDY In the pilot study a trail of the final survey is conducted. On the eBuddy website the advertisement
to direct eBuddy users to the survey is showed, but only for a limited time (24 hours). In that way
attracted 620 people to start the survey i.e., complete the first page of the survey. Based on these
results some preliminary statistics were drawn; the Cronbach alphas ( ) and composite reliability
( ). These statistics are explained in more detail in subsection 5.5.3 but a rule of the thumb to
show good internal consistency, indicates that both coefficients should be above .7 (Podsakoff,
MacKenzie et al. 2003). For the pilot test the archetype ACUST is used again. The results of the pilot
study are in Table 20 and are reviewed using the procedures proposed in subsections 5.5.2 and
5.5.3. Of the 205 completed the survey only 102 are used in the analysis.
Construct To be adjusted
Functional 0.7192 0.8416 Hedonic 0.7227 0.8443 Social 0.5296 0.7588 DSOC1, DSOC3 Performance 0.7919 0.8782 Functionality 0.7225 0.8435 Visual appearance 0.7256 0.8454 Customizability 0.6341 0.8021 Cultural reference 0.7111 0.8384 Branding 0.5553 0.7693 BRAN1, BRAN3 Rarity 0.4543 0.7340 RARI1, RARI2, RARI3
TABLE 20, RESULTS OF THE PILOT STUDY
As can be seen from Table 20 the questions addressed in second round of the conceptual validation
(subsection 5.4.2), were relevant since the social, branding and rarity construct show low reliability
(low Cronbach alpha). Although the composite reliability of all constructs is sufficient ( ) to
accept the results and composite reliability is more accurate than Cronbach alphas, some questions
are rephrased.
Adjusted questions
DSOC1 I think [..] will confirm my status. DSOC2 The [..] is a prestige good. BRAN1 I think [..] will allow to represent my preferences. BRAN3 I will use [..] because it differentiate me from other users. RARI1 I think [..] is only limited available. RARI2 The [..] is a scarce good. RARI3 I will use [..] because it is rare.
TABLE 21, ADJUSTED QUESTIONS

P a g e | 64
T h e M o b i l e M o n e y m a k e r D e c e m b e r 3 , 2 0 1 0
5.4.5 WRAP UP In this subsection several steps are taken to make sure the questionnaire is content valid, construct
valid and reliable. However due to limited access to validate with the populations in the first three
validation steps it remain difficult to state if the survey is valid. To clarify a small example is given,
the instruments that are a valid measure of third grader's math skills probably are not a valid
measure of high school calculus student's math skills. But given the results of the pilot test there is
strong evidence that this survey is valid for this specific purpose and this specific group of people.
The final survey can be found in Appendix F, while the results are in the next subsection.
5.5 Correlation survey results
5.5.1 STATISTICAL TECHNIQUE As this study is more focused towards theory building than testing existing hypothesis other
statistical techniques are applicable than proposed in the theory de Vaus (2001) used before in this
study. Soft modeling seems to be more suitable in this situation. Soft modeling is a mathematically
rigorous procedure that leads to efficient predictions and is well suited for research constrained by
conditions of low information, nascent or emerging theory, and subjective observations of
phenomena (Sosik, Kahai et al. 2009). A common method of soft modeling is the partial least
squares (PLS) algorithm. PLS is a data reduction technique first introduced around 1975 by
Herman Wold for use in the econometrics field and is a generalization of multiple linear
regressions. Another technique is LISREL which is used quite frequent as well but is more suited for
confirmatory testing (Sosik, Kahai et al. 2009) and therefore omitted in this study.
Usage of PLS is increasingly popular in a wide variety of academic and practitioner domains, like in
the fields of education, engineering, chemistry, bioinformatics, and project management (Sosik,
Kahai et al. 2009). Despite popular, many studies in MIS research performed erroneous PLS
analysis (Carte and Russell 2003). That does not say PLS analysis is inappropriate, it just proves
researchers have to be careful using these kinds of statistics. In order to prevent this study from
errors made in other studies, the guidelines of many cited article of Gefen et al. (2000) are used.
Because PLS is better suited for more exploratory research and additionally does not require
normality of data distributions, observation independence, or variable metric uniformity (Sosik,
Kahai et al. 2009), PLS analysis will be used to confirm statistical validity. A regular used software
package to perform the PLS analysis is SmartPLS (Ringle, Marc/Wende et al. 2005), which is used in
this study as well.
5.5.2 SAMPLE SELECTION & DESCRIPTION The survey was advertised for in the same manner as in subsection 5.4.4 and therefore needed
advertisement inventory in a few of the highest income countries, which was limited. Therefore the
researchers decided to only test for one archetype AFUNC, since after all, the only purpose is to
validate the attributes. The survey was advertized for 6 days.
The advertising redirecting users to the survey resulted in 1462 of users starting the survey i.e.,
completing at least the first page. Of these 1070 did not complete the survey and were therefore
excluded from the research. Of the remaining 392, 273 responses had to be deleted. Although

P a g e | 65
T h e M o b i l e M o n e y m a k e r D e c e m b e r 3 , 2 0 1 0
respondent self-select to participate in the survey many do not answer serious e.g., answer all
questions with totally agree, or answer category in the same manner. This consistent answering
might result in unreliable cases and even overall skewed output and limited divergent validity.
In order to deal with this problem the variance within a case is considered. For each matrix of
questions (1, 2, 3) the variance is calculated, when the variance of a case is zero, it’s considered a
false entry and omitted from the research. For extremely high values, the cases were reviewed per
case and omitted when the researchers suspect not serious behavior.
With the 119 responses left, the sample characteristics are in Table 22, where the population
characteristics are retrieved from eBuddy’s database.
Population characteristics
Sample characteristics
Gender Male Female
48% 52%
32% 68%
Age 0-12
13-24 25-35 35+
4% 73% 14% 9%
16% 72% 8% 4%
Country Australia
Canada Ireland United Kingdom United States
17% 28% 1%
30% 22%
22% 22% 2%
33% 21%
Messages 310 p/m 884 p/m Login 7 p/m 17 p/m
TABLE 22, SAMPLE CHARACTERISTICS
5.5.3 MEASUREMENT MODEL The first step in PLS is to test for reliability and validity of the model. Both Cronbach alphas ( ),
which is commonly applied and the composite reliability ( ), a typical test for PLS, can be used.
Because Cronbach alphas assume equal weighting of items and therefore are less useful since
weighting is unknown, only composite reliability will be used to evaluate reliability.
Where , , and , are the factor loading (see Appendix G), factor variance, and unique/error
variance respectively.
According to the guidelines followed in this study the composite reliability should be above 0.7
(Gefen, Straub et al. 2000). As can be seen in Table 23 the value of composite reliability is higher
than 0.7 for all constructs hence the reliability of the survey is sufficient.

P a g e | 66
T h e M o b i l e M o n e y m a k e r D e c e m b e r 3 , 2 0 1 0
Construct Mean Std. dev Range CR
Functional 4.69 1.30 1-7 0.7849 Hedonic 4.71 1.28 1-7 0.7843 Social 4.20 1.33 1-7 0.8131 Performance 4.71 1.20 1-7 0.7768 Functionality 4.82 1.38 1-7 0.8424 Visual appearance 4.43 1.34 1-7 0.8311 Customizability 4.58 1.23 1-7 0.7989 Cultural reference 3.98 1.34 1-7 0.8093 Branding 4.32 1.27 1-7 0.7932 Rarity 3.79 1.20 1-7 0.7679
TABLE 23, DESCRIPTIVE STATISTICS
In order to secure construct validity, both convergent and divergent validity, as discussed in
subsection 5.3.5 must be observed. Convergent validity can be examined by Average Variance
Extracted (AVE) and should be higher than 0.5 according to the guidelines followed in the study of
Gefen et al. (2000). AVE measures the amount of variance captured by a construct in relation to the
variance due to random measurement error.
AV
E
DF
UN
DH
ED
DS
OC
PE
RF
FU
NC
VA
AS
CU
ST
CU
RE
BR
AN
RA
RI
DFUN 0.55 1 DHED 0.55 0.70 1 DSOC 0.59 0.61 0.67 1 PERF 0.54 0.81 0.72 0.51 1 FUNC 0.64 0.76 0.69 0.63 0.72 1 VAAS 0.62 0.64 0.71 0.69 0.54 0.66 1 CUST 0.57 0.65 0.72 0.65 0.62 0.67 0.75 1 CURE 0.59 0.52 0.57 0.69 0.44 0.55 0.62 0.57 1 BRAN 0.56 0.66 0.76 0.75 0.62 0.66 0.74 0.69 0.67 1 RARI 0.53 0.47 0.52 0.61 0.46 0.53 0.52 0.49 0.64 0.58 1
TABLE 24, CONSTRUCTS CORRELATIONS
The values of the AVE in Table 24 (bold values on the second column) are higher than 0.5 in all
cases and hence the convergent validity is sufficient within the survey. Divergent validity is
observed when a construct shares more variance with its items than with all other constructs. This
can be assessed by comparing the correlation for a particular construct with and the correlations
with the other constructs (Gefen, Straub et al. 2000). On the diagonal is the normalized value of the
construct correlation, which is higher than the correlation with all other constructs, proving
divergent validity.

P a g e | 67
T h e M o b i l e M o n e y m a k e r D e c e m b e r 3 , 2 0 1 0
5.5.4 COMMON METHOD VARIANCE Common method variance is problematic because the actual phenomenon under investigation
becomes hard to differentiate from measurement artifacts. Podsakoff et al. (2003) systematically
classified such causes of common method variance into the following four categories: common
rater effects, item characteristic effects, item context effects, and measurement context effects.
Generally speaking, there are two primary ways to control for method biases, through the design of
the study’s procedures and statistical controls. The first is already considered in subsection 5.3.4 by
following survey guidelines (Rea and Parker 1992). There are several statistical remedies available,
but single-method-factor approaches is the only one applicable to this study’s situation. Advantages
of this method are estimating method biases at the measurement level and controlling
measurement error, while disadvantages are that they only control for a single source of method
bias at a time and assume that Method Trait interactions are not present. On the latter issue, the
empirical evidence suggests that, although theoretically possible, Method Trait interactions is
unlikely to be very strong (Podsakoff, MacKenzie et al. 2003).
FIGURE 28, SINGLE-METHOD-FACTOR APPROACHES (Podsakoff, MacKenzie et al. 2003)
Using this approach, as can be seen in Figure 28, indicators (a1, …., b3) are allowed to manipulate
the theoretical constructs (A,B), as well as the common method variable. So each indicator is
determined by its construct and the method factor. However, PLS does not allow an indicator to be
defined by two variables. Therefore, the conversion strategy as described in Liang et al. (2007) is
used to test this model using PLS (see Appendix I). By converting each indicator into a single-
indicator construct the PLS software can perform the method of Podsakoff et al. (2003).
As in this study bootstrapping with 1000 runs is used the t-distribution threshold of is used to
determine the significance level ( ). In pursued of many papers, the following notation and
thresholds are used:
T * ** ***
As can be seen from Appendix H the common method variance is rather low, as only one factor
loading of the method factor was significant. The explained variance of indicators is only 58%, but
on the other hand only 1% is explained by the method factor. Hence in this study, the method
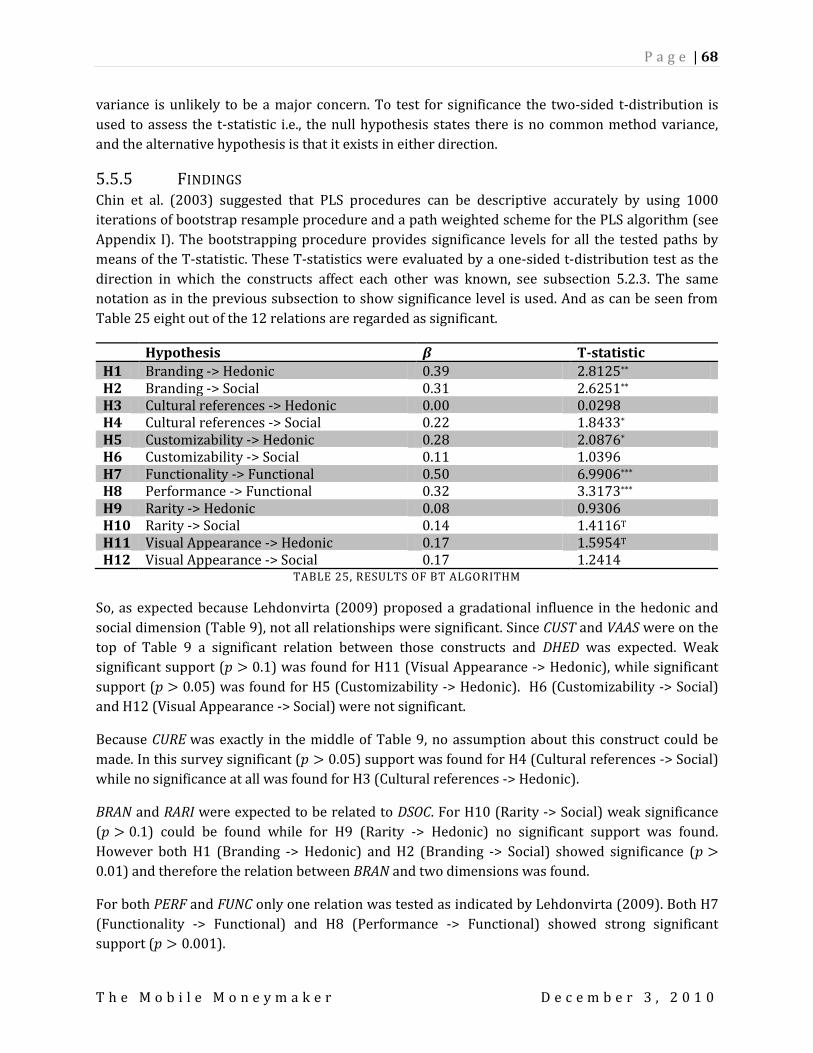
P a g e | 68
T h e M o b i l e M o n e y m a k e r D e c e m b e r 3 , 2 0 1 0
variance is unlikely to be a major concern. To test for significance the two-sided t-distribution is
used to assess the t-statistic i.e., the null hypothesis states there is no common method variance,
and the alternative hypothesis is that it exists in either direction.
5.5.5 FINDINGS Chin et al. (2003) suggested that PLS procedures can be descriptive accurately by using 1000
iterations of bootstrap resample procedure and a path weighted scheme for the PLS algorithm (see
Appendix I). The bootstrapping procedure provides significance levels for all the tested paths by
means of the T-statistic. These T-statistics were evaluated by a one-sided t-distribution test as the
direction in which the constructs affect each other was known, see subsection 5.2.3. The same
notation as in the previous subsection to show significance level is used. And as can be seen from
Table 25 eight out of the 12 relations are regarded as significant.
Hypothesis T-statistic
H1 Branding -> Hedonic 0.39 2.8125** H2 Branding -> Social 0.31 2.6251** H3 Cultural references -> Hedonic 0.00 0.0298 H4 Cultural references -> Social 0.22 1.8433* H5 Customizability -> Hedonic 0.28 2.0876* H6 Customizability -> Social 0.11 1.0396 H7 Functionality -> Functional 0.50 6.9906*** H8 Performance -> Functional 0.32 3.3173*** H9 Rarity -> Hedonic 0.08 0.9306 H10 Rarity -> Social 0.14 1.4116T H11 Visual Appearance -> Hedonic 0.17 1.5954T H12 Visual Appearance -> Social 0.17 1.2414
TABLE 25, RESULTS OF BT ALGORITHM
So, as expected because Lehdonvirta (2009) proposed a gradational influence in the hedonic and
social dimension (Table 9), not all relationships were significant. Since CUST and VAAS were on the
top of Table 9 a significant relation between those constructs and DHED was expected. Weak
significant support ( ) was found for H11 (Visual Appearance -> Hedonic), while significant
support ( ) was found for H5 (Customizability -> Hedonic). H6 (Customizability -> Social)
and H12 (Visual Appearance -> Social) were not significant.
Because CURE was exactly in the middle of Table 9, no assumption about this construct could be
made. In this survey significant ( ) support was found for H4 (Cultural references -> Social)
while no significance at all was found for H3 (Cultural references -> Hedonic).
BRAN and RARI were expected to be related to DSOC. For H10 (Rarity -> Social) weak significance
( ) could be found while for H9 (Rarity -> Hedonic) no significant support was found.
However both H1 (Branding -> Hedonic) and H2 (Branding -> Social) showed significance (
) and therefore the relation between BRAN and two dimensions was found.
For both PERF and FUNC only one relation was tested as indicated by Lehdonvirta (2009). Both H7
(Functionality -> Functional) and H8 (Performance -> Functional) showed strong significant
support ( ).
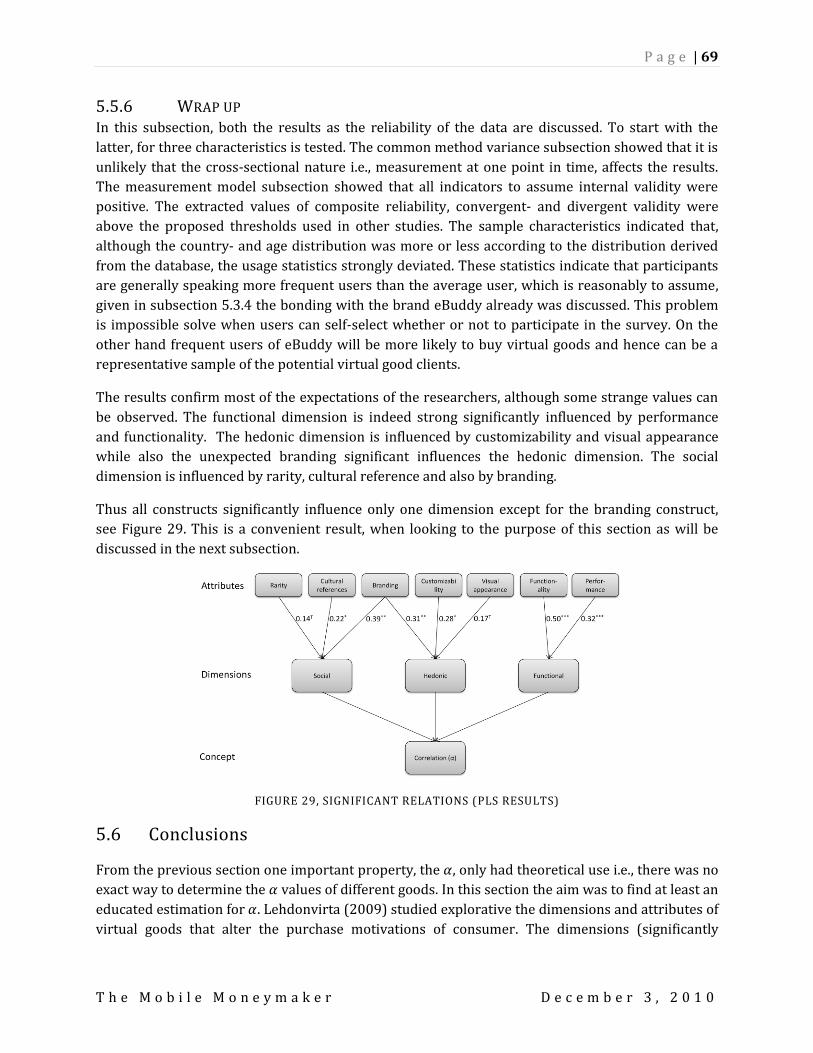
P a g e | 69
T h e M o b i l e M o n e y m a k e r D e c e m b e r 3 , 2 0 1 0
5.5.6 WRAP UP In this subsection, both the results as the reliability of the data are discussed. To start with the
latter, for three characteristics is tested. The common method variance subsection showed that it is
unlikely that the cross-sectional nature i.e., measurement at one point in time, affects the results.
The measurement model subsection showed that all indicators to assume internal validity were
positive. The extracted values of composite reliability, convergent- and divergent validity were
above the proposed thresholds used in other studies. The sample characteristics indicated that,
although the country- and age distribution was more or less according to the distribution derived
from the database, the usage statistics strongly deviated. These statistics indicate that participants
are generally speaking more frequent users than the average user, which is reasonably to assume,
given in subsection 5.3.4 the bonding with the brand eBuddy already was discussed. This problem
is impossible solve when users can self-select whether or not to participate in the survey. On the
other hand frequent users of eBuddy will be more likely to buy virtual goods and hence can be a
representative sample of the potential virtual good clients.
The results confirm most of the expectations of the researchers, although some strange values can
be observed. The functional dimension is indeed strong significantly influenced by performance
and functionality. The hedonic dimension is influenced by customizability and visual appearance
while also the unexpected branding significant influences the hedonic dimension. The social
dimension is influenced by rarity, cultural reference and also by branding.
Thus all constructs significantly influence only one dimension except for the branding construct,
see Figure 29. This is a convenient result, when looking to the purpose of this section as will be
discussed in the next subsection.
FIGURE 29, SIGNIFICANT RELATIONS (PLS RESULTS)
5.6 Conclusions
From the previous section one important property, the , only had theoretical use i.e., there was no
exact way to determine the values of different goods. In this section the aim was to find at least an
educated estimation for . Lehdonvirta (2009) studied explorative the dimensions and attributes of
virtual goods that alter the purchase motivations of consumer. The dimensions (significantly

P a g e | 70
T h e M o b i l e M o n e y m a k e r D e c e m b e r 3 , 2 0 1 0
influenced by) were functional (performance, functionality), hedonic (customizability, visual
appearance, branding), social (rarity, cultural reference, branding).
The significant attributes can be used to determine relative distance between goods, thus reflecting
a measurement of the . As the attributes (except branding) only significantly influence one
dimension, the dimensions seem rather distinct and hence strengthen the idea of the dimensions
and subsequently the idea of measurement of .
Given the structured and rigid method of validating the survey, reliable results were expected and
although all indicators of reliability were sufficient there is one major drawback in the research.
Apparently the user base of eBuddy is not keen on answering the surveys seriously (only 119 (8%)
out of 1462). Besides the way the survey was presented to the users might have inclined this
problem as well. Therefore more testing should be done among users with more bonding to the
good and in more strict settings. This might ignore many users and therefore the sample would be
smaller, but will most likely improve the results and therefore the predicting value of the survey.
Because the archetype connected to functionality was tested, high mean values were expected on
that particular construct. As can be seen in Table 23, the value of functionality was higher than all
other values as were the values of the related constructs performance and functional. However all
constructs scored between 3.5 and 5, which is a small bandwidth above the average of the seven
point likert scale. As participant tend to answer around the middle (Rea and Parker 1992) the
power to determine a real world reflecting value for as proposed in subsection 5.2.1 is not valid.
Therefore the second level (Figure 29) between dimensions and the concept should be studied.
Unfortunately due to managerial decisions at eBuddy, the in-app store planned to go live early
October 2010 was delayed, prohibiting the researchers to test the predicting value of the survey.
As was mentioned before, the results found in this section are only valid for a very small subset of
virtual goods. The results cannot be generalized to other kinds of virtual goods as described in
subsection 2.4.2 because other attributes could be applicable. Besides, eBuddy’s population is not
representative to the population of other apps and hence the results are limited in that sense as
well.

P a g e | 71
T h e M o b i l e M o n e y m a k e r D e c e m b e r 3 , 2 0 1 0
6 DISCUSSION In this chapter, conclusions about the research problem will be formulated. Then, implications for
theory and management will be given, to conclude with the limitations of this study and
recommendations for further research.
6.1 Conclusions
A conclusion is a proposition that is reached after considering the evidence, arguments or premises.
Conclusions are a fundamental feature in academic or research work.
Every section already ended with a short conclusion that answered a part of the research questions.
In this section the answer to the overall research goal is discussed. The research goal, as defined in
subsection 1.2, was “What configuration of product characteristics and pricing will increase
profitability of mobile App developers?”.
In the first two sections a mostly qualitative analysis was done by discussing product
characteristics and pricing methods. To start with the product characteristics, based on
developments in the most mature store, the Apple App Store, the most promising method to
monetize an app is selling virtual goods in the app itself. In the third section all applicable price
discrimination methods were discussed and while many seemed feasible to implement in the
mobile ecosystem, only one was selected as the most viable method i.e., yields the highest expected
returns.
So from these two sections a premise for the proceeding of the study was taken, the best pricing
method based on both price discrimination theory and mobile app store characteristics is virtual
goods. A part of the research problem was answered by these questions as well since virtual goods
define already product characteristics and pricing.
However the first two sections do not answer the configuration part of the research problem, so the
proposition that should derive from these premises is how to configure virtual goods. Bundling of
strictly unrelated goods was proven to be highly profitable (Salinger 1995; Bakos and Brynjolfsson
1999). So, under circumstances applicable to this study’s situation, combining multiple goods in one
package was chosen to investigate in more detail. However, as versioning, bundling and virtual
goods are conceptually equal, where correlation is the differentiator between these three, existing
bundling’ theory had to be adjusted. From section 4 can be concluded that bundling goods with zero
costs is favorable for all goods; completely uncorrelated to perfect substitutes. In addition it is
shown that bundles are less sensitive to correlation effects and remain relatively more profitable
with skewed income distributions. For all effects described, the following rule holds; the more
goods are bundled the stronger the effects in favor of the bundle.
Although, as was showed by the literature, there are no direct costs involved in producing,
distributing and selling virtual goods there are sufficient reasons to suppose that bundling
negatively influences demand. Therefore in Table 8 measures to adjust for those effects are given.

P a g e | 72
T h e M o b i l e M o n e y m a k e r D e c e m b e r 3 , 2 0 1 0
Because correlation of goods was only a theoretical idea without any real world propositions, a first
attempt to find a measurement of this correlation is made. From preliminary literature it can be
concluded that there are three dimensions influencing motivations to purchase virtual goods. That
these three dimensions could be used to measure the correlation is used as a premise. The findings
of section 5 suggest that the seven attributes tested in this study significantly influence one or two
dimensions and therefore, given the premises, could be used as a measurement of correlation. As
this study was rather explorative of nature, the results are only valid within eBuddy and even there
should be validated by further research.
It is clear from the results described above; the research problem could not directly be answered.
The problem was “What configuration of product characteristics and pricing will increase
profitability of mobile App developers?”.
So given an existing situation with an app with several product features first the correlation
between the goods should be tested with the survey provided in Appendix F, then the most
applicable distribution should be chosen and finally an estimation of the loss of demand due to
bundling has to be selected. With this set of estimations an indication of the best configuration can
be derived from this study. As bundling is strongly favorable over a’-la-carte pricing when
correlation is high, bundling in the high correlated case is more likely to occur than in uncorrelated
cases.
If the initial situation is a clean sheet where new virtual goods can be introduced, the best
configuration of virtual good characteristics is to find goods that are the least correlated and bundle
the most variance causing virtual goods regardless of the applicable distribution.
6.2 Theoretical Implications
As mentioned in subsection 1.4 this study focused on the theoretical perspective rather than
eBuddy’s situation because the goals of the graduation report are mostly academic of nature. As the
study was mainly explorative some theoretical implications can be derived, which are discussed per
section below.
The first two sections were not written with the purpose of theory building, the goal was rather to
build a good understanding of the environment. Since almost no research was done on mobile App
Stores, the results of section 2 could still be seen as a contribution to the academic world. Especially
the description of the six most important App Stores with the critical success factors of Chen et al.
(2004) is relevant. One of the going properties of virtual goods, the interconnected property i.e.,
virtual goods must not exist in isolation (Lehdonvirta 2009; Shang, Chen et al. 2010) was
challenged by the researchers as not necessarily applicable to virtual goods.
Albeit the results of section 3 were even more descriptive than in section 2, the addition of virtual
goods to existing field of price discrimination methods was not widely available in academic
literature. As this study showed virtual goods are in essence equal to versioning because it is based
on self-selection of the desired quality (in a broad way) by customers. But it is also much more

P a g e | 73
T h e M o b i l e M o n e y m a k e r D e c e m b e r 3 , 2 0 1 0
flexible than versioning and believed by the researchers to replace versioning on the web in the
near future where in-app payments will become the leading way of paying for additional features.
More interesting from a theoretical perspective is section 4. While bundling in a strictly
uncorrelated case has been studied by many authors (Bakos and Brynjolfsson 1999; 2000; Wu, Hitt
et al. 2008), no relevant papers about the correlated case were available to the researchers. By
generalizing the economic models describing how companies compete (Varian 1992) a model
describing how products cannibalize each other sales could be derived. This resulted in an
economic model to show bundling is also favorable when goods are correlated when the uniform
distribution is applicable. Since the uniform distribution is almost never observed in the real
world, several other distributions more applicable to mobile ecosystems were tested. In line with
other distributions tested on uncorrelated goods (Wu, Hitt et al. 2008), the exponential distribution
was tested and in line with earlier research on distributions applicable to App Stores (Spriensma
2010), the power law distribution was tested. Both distributions yielded even better results,
showing that bundling becomes even more favorable over a’-la-carte pricing when the distribution
is more skewed to the left i.e., a higher percentage of low income consumers but also a small
percentage of very high income consumers.
Finally in section 5, the attributes from the study of Lehdonvirta (2009) were tested. As his study
was explorative of nature, the attributes were untested. By surveying the population of eBuddy in
this study the relation between the dimensions and the attribute could be proven for almost all
attributes. However, as the demographics of eBuddy do not represent the real world demographics
it is impossible to generalize the results. But this study’s results could be used as a starting point for
further research as will be discussed in subsection 6.4.
6.3 Managerial Implications
The findings of this study can be used by the principal eBuddy in multiple ways, which will be
discussed in this subsection.
Although this study does not prove virtual goods are the best monetization strategy to implement,
sufficient empirical evidence is available. Several research firms launched reports to describe the
growth in virtual goods and the profitability of that industry. The lasting question was whether the
eBuddy client is well positioned to offer virtual goods. As eBuddy already decided (and postponed)
to build an in-app store to sell virtual goods further research on that topic was omitted from this
study.
While eBuddy postponed the in-app store to temporarily focus on more important business cases,
the store will eventually become an important part of the monetization strategy of eBuddy.
Lehdonvirta (2009) studied attributes of virtual goods that increase purchase motivations and
while this study did not test whether these goods really increased the motivations the attributes
should certainly be taken into account when execute the virtual good strategy.
What this study did test for was if the attributes by Lehdonvirta (2009) did invoke to the proposed
dimension, to determine whether a set of virtual goods should be bundled. For several attributes

P a g e | 74
T h e M o b i l e M o n e y m a k e r D e c e m b e r 3 , 2 0 1 0
(performance, functionality, visual appearance, customizability, branding, cultural reference and
rarity) this relationship was proven and with the survey of Appendix E eBuddy will be able to
preliminary test their virtual goods and decide which goods to bundle together. As the in-app store
was not available by the time this study was performed the results could not be tested and thus
back testing is necessary.
In the model constructed in this study are two unknown variables. The first, the value could be
determined by the attributes described above. The second unknown variable is the distribution of
eBuddy’s users. This distribution should reflect the aggregated willingness to pay of eBuddy’s users.
This distribution is difficult to determine precisely, but given the demographics of eBuddy’s current
user base a bias towards low income users is expected. Therefore the exponential and power law
distributions were tested to show results in those distributions. Accordingly to the simulations
bundling is even more favorable with more skewed distributions and hence bundling is even more
favorable to eBuddy.
Finally while virtual goods have many advantages there are several disadvantages, like
cannibalization when switching from the current monetization model, freemium, to virtual goods
especially when bundling many goods together, implying high bundle prices. Although no exact
measure can be given, managers in charge can have an intuitive feeling of the effects. This effect can
be compared to Table 8, to determine whether or not the chosen virtual good bundling strategy
should be executed.
Several potent price discrimination strategies are omitted in the research, like customized bundling
(Viswanathan and Anandalingam 2005) and price skimming. Especially price skimming has proven
to be a viable strategy, and should be used by eBuddy to address low income consumers. The best
way is probably with once in a while special price promotions like eBuddy already does.
Customized bundling is more complex and not studied in a correlated good case, so it is difficult to
give reliable recommendations.
6.4 Limitations and further research
Several concerns were already considered in the previous sections of this study, however other
matters were found over the course of this study as well. In this section these subjects are
discussed.
To start with the limitations, first of all the results from this study have a purely theoretical nature.
Although practically relevant, implementation of the results needs careful attention. Especially
since no behavior of competitors is included into the model and only producers’ surplus is
considered. was introduced to adjust for these effects, but does not provide a measurement of
these effects. Therefore careful research has to be done about how consumers’ surplus would
increase retention and the effect of competitors on the model performance.
There are two concepts important when developing research; internal- and external validity (Vaus
2001) and hence need to be considered while discussing the limitations of this study. In this study

P a g e | 75
T h e M o b i l e M o n e y m a k e r D e c e m b e r 3 , 2 0 1 0
close attention has been paid to both concepts especially in conducting the survey. Below both
concepts are discussed for the whole study.
To start with the internal validity i.e., the extent to which the structure of the research design
enables drawing unambiguous conclusions. In this study a lot of attention is paid to methodological
issues. This study started with a structured literature search to not miss an important paper, which
can literally sink the research project. As in this study the relative new topic of virtual goods is
covered and a lot of literature was only written in the last few years, a small additional literature
review was conducted at the end of the process. The only relevant paper found was the paper of
Shang et al. (2010), which is used in this study. Since section 2, 3 and 4 are based on this literature
review the internal validity of these sections is considered sufficient. In section 5 survey research is
conducted and a lot of attention is paid to guarantee internal validity, however due to problems in
the eBuddy user base internal validity was harmed. When surveying more reliable groups with the
same questionnaire the results should be more reliable.
The second concept is external validity; which refers to the extent to which results from this study
can be generalized beyond this particular study. As in the whole study the general perspective is
used, the conclusions of this study are not solely suited to eBuddy and hence can be generalized
beyond this study. The exception, as discussed before, is section 5, which need more rigor research
on the attributes to guarantee external validity i.e., an unrepresentative sample survey, hence
attributes are only valid to eBuddy user base. This study is about virtual goods but the economic
model of section 4 can be generalized beyond virtual goods. The limitation applicable is that it can
only be generalized to goods with zero costs. No research is done to multiple bundles within one
firm, hence the results cannot be generalized to multiple bundles as was studied in the uncorrelated
case already (Wu, Hitt et al. 2008).
As in this study several new fields in literature are explored a broad range of research
opportunities was available. Hence the researchers had to narrow down the opportunities to keep
focused. Therefore many interesting further research opportunities are available in this field.
To start with the limitation of this research, the attributes of Lehdonvirta (2009) in section 5, are
discussed. As both internal- and external validity is not as desired, more research has to be done to
check if the dimensions and attributes are correlated. As the research of Lehdonvirta (2009) only
considered social games and in this study virtual goods were considered in a more general
perspective broader theory building should be done as well, to find possible additional attributes.
Because the economic model is in many ways similar to the work of Bakos et al. (1999), which is a
many cited work about bundling, the papers which cited their paper offer a broad range of further
research opportunities. As was discussed in section 3, customized bundling is a viable price
discrimination method and only studied in the uncorrelated case, hence customized bundling i.e.,
allowing customers to choose to bundle up to N goods out of a larger pool of J goods (Wu, Hitt et al.
2008), is a interesting topic for further research. In the same study the issue of multiple bundles
was studied, which is one of the limitations of this study. By adjusting the simulations from this
study multiple bundles can be imitated. This is especially important when applying the study’s
findings to versioning. Because the idea of versioning is to get customers to segment themselves

P a g e | 76
T h e M o b i l e M o n e y m a k e r D e c e m b e r 3 , 2 0 1 0
according to their willingness to pay, multiple bundles with partly equal functionalities (see Figure
13) are important to consider.
In practice, goods will have different means or variances. Even the same good may have different
valuations at different times (Wu, Hitt et al. 2008). It is also possible that there is not one consumer
group, but multiple consumers groups can be defined (Venkatesh and Chatterjee 2006). Therefore
more variable testing should be done, where the valuation of goods and consumers types are not
fixed. One restriction in this model is, because of the nature of virtual good, that demand is limited
to 1 for each consumer. In many other examples this is not the case and hence a nice suggestion for
further research is to extend the model to multiple purchases per customer.
While in this study piracy was excluded since it was not relevant in the closed ecosystem of Apple it
starts to become a problem. Download figures of the eBuddy Pro app provided by Apple deviate by
20% of the number of activated apps on devices reported by Flurry. The only explanation is that
20% of the apps are not downloaded from the Appstore but from third party App Stores (piracy).
As this behavior is likely to be more applicable to more open platforms like Java and Android, the
topic is starting to be of interest for further research. On the other hand virtual goods provide
better ways to prevent for piracy and the effects hereof are not studied, hence this is a viable
research opportunity.
P a g e | 77
T h e M o b i l e M o n e y m a k e r D e c e m b e r 3 , 2 0 1 0
7 REFERENCES ABIresearch (2009, 2009-02-23). "Buying Mobile Applications: 17% of US Smartphone Survey Respondents Spent More Than $100 Last Year." from http://www.abiresearch.com/press/1375-Buying+Mobile+Applications:+17%25+of+US+Smartphone+Survey+Respondents+Spent+More+Than+$100+Last+Year. Altinkemer, K. and S. Bandyopadhyay (2000). "Bundling and distribution of digitized music over the internet." Journal of Organizational Computing and Electronic Commerce 10(3): 209-224. Anderson, C. (2006). The Long Tail: Why the Future of Business Is Selling Less of More. New York, Hyperion. Apple (2009). "Apple Previews Developer Beta of iPhone OS 3.0." from http://www.apple.com/pr/library/2009/03/17iphone.html. Apple (2010). iPhone Developer Program License Agreement. Apple. Arrington, M. (2010). Google Nexus One: The TechCrunch Review. Techcrunch. Palo Alto. 2010. Bakos, Y. and E. Brynjolfsson (1999). "Bundling information goods: pricing, profits, and efficiency." Management Science 45(12): 1613-1630. Bakos, Y. and E. Brynjolfsson (2000). "Bundling and competition on the internet." Marketing Science 19(1): 63-82. Bharadwaj, N., R. W. Naylor, et al. (2009). "Consumer response to and choice of customized versus standardized systems." International Journal of Research in Marketing 26(3): 216-227. Bhargava, H. K. and V. Choudhary (2008). "When is versioning optimal for information goods?" Management Science 54(5): 1029-1035. Boudreau, M. C., D. Gefen, et al. (2001). "Validation in information systems research: A state-of-the-art assessment." MIS Quarterly: Management Information Systems 25(1): 1-16. Brynjolfsson, E., Y. J. Hu, et al. (2007). Goodbye Pareto Principle, Hello Long Tail: The Effect of Search Costs on the Concentration of Product Sales. SSRN eLibrary, SSRN. Carte, T. A. and C. J. Russell (2003). "In pursuit of moderation: Nine common errors and their solutions." MIS Quarterly: Management Information Systems 27(3): 479-501. Chandrashekaran, M., R. Grewal, et al. (2010). "Estimating Contagion on the Internet: Evidence from the Diffusion of Digital/Information Products." Journal of Interactive Marketing 24(1): 1-13. Chang, W. L. and S. T. Yuan (2008). "Collaborative pricing model for bundling information goods." Journal of Information Science 34(5): 635-650. Chellappa, R. K. and S. Shivendu (2005). "Managing piracy: Pricing and sampling strategies for digital experience goods in vertically segmented markets." Information Systems Research 16(4): 400-417.

P a g e | 78
T h e M o b i l e M o n e y m a k e r D e c e m b e r 3 , 2 0 1 0
Chen, L. D., M. L. Gillenson, et al. (2004). "Consumer acceptance of virtual stores: A theoretical model and critical success factors for virtual stores." Data Base for Advances in Information Systems 35(2): 8-28. Chin, W. W., B. L. Marcelin, et al. (2003). "A partial least squares latent variable modeling approach for measuring interaction effects: Results from a Monte Carlo simulation study and an electronic-mail emotion/adoption study." Information Systems Research 14(2): 189-217+218. Coiera, E. (2000). "Information economics and the Internet." Journal of the American Medical Informatics Association 7(3): 215-221. Coldewey, D. (2010). First real details about Android 3.0 “Gingerbread” emerge. Techcrunch. Palo Alto. 2010. Constantinou, A., E. Camilleri, et al. (2010, 2010-07). "Mobile Developer Economics 2010 and Beyond." from http://www.visionmobile.com/research.php#devecon. Dhar, R. and K. Wertenbroch (2000). "Consumer choice between hedonic and utilitarian goods." Journal of Marketing Research 37(1): 60-71. Distimo (2010, 01-07-2010). "Distimo Report June 2010." Monthly Reports. from http://www.distimo.com/uploads/reports/Distimo%20Report%20-%20June%202010.pdf. Dolgui, A. and J. M. Proth (2010). "Pricing strategies and models." Annual Reviews in Control 34(1): 101-110. Elmer-DeWitt, P. (2010). "App Store: 1% of Apple's gross profit." Retrieved 30-06-2010, 2010, from http://tech.fortune.cnn.com/2010/06/23/app-store-1-of-apples-gross-profit/. Gartner (2010). "Apple responsible for 99.4% of mobile app sales in 2009 (Updated)." Retrieved 16-3-2010, from http://arstechnica.com/apple/news/2010/01/apple-responsible-for-994-of-mobile-app-sales-in-2009.ars. Gefen, D., D. W. Straub, et al. (2000). "Structural Equation Modeling and Regression; Guidelines for Research Practice." Communications of the Association for Information Systems 4(7): 77. Ghose, A. and A. Sundararajan (2006). "Evaluating pricing strategy using e-commerce data: Evidence and estimation challenges." Statistical Science 21(2): 131-142. Hung, J. (2010). "Economic Essentials of Online Publishing with Associated Trends and Patterns." Publishing Research Quarterly: 1-17. Joosten, R. (2007). "Patience, Fish Wars, rarity value & Allee effects." The Papers on Economics and Evolution 2007(#0724). Kincaid, J. (2009). Top Developer Reveals Android Market's Meager Sales. Techcrunch. Palo Alto. 2010.

P a g e | 79
T h e M o b i l e M o n e y m a k e r D e c e m b e r 3 , 2 0 1 0
Kong, X. B. and T. J. Lv (2008). The research of value loop in electronic commerce. Wireless Communications, Networking and Mobile Computing, 2008. WiCOM '08, Dalian. Lee, K. B., S. Yu, et al. (2006). "Analysis of pricing strategies for e-business companies providing information goods and services." Computers and Industrial Engineering 51(1): 72-78. Lehdonvirta, V. (2009). "Virtual item sales as a revenue model: Identifying attributes that drive purchase decisions." Electronic Commerce Research 9(1-2): 97-113. Liang, H., N. Saraf, et al. (2007). "Assimilation of enterprise systems: The effect of institutional pressures and the mediating role of top management." MIS Quarterly: Management Information Systems 31(1): 59-87. Liebowitz, S. J. and S. E. Margolis (2009). "Bundles of joy: The ubiquity and efficiency of bundles in new technology markets." Journal of Competition Law and Economics 5(1): 1-47. Lin, F. and W. Ye (2009). Operating system battle in the ecosystem of smartphone industry. 2009 International Symposium on Information Engineering and Electronic Commerce, Huangshi, IEEE Computer Society. Loebbecke, C. and P. Powell (2002). "E-business in the entertainment sector: The Egmont case." International Journal of Information Management 22(4): 307-322. Miller, R. (2010). "APPS: Exploring the next content frontier." EContent 33(5): 18-22. Moore, G. C. and I. Benbasat (1991). "Development of an instrument to measure the perceptions of adopting an information technology innovation." Information Systems Research 2(3): 192-222. Naumis, G. G. and G. Cocho (2008). "Tail universalities in rank distributions as an algebraic problem: The beta-like function." Physica A: Statistical Mechanics and its Applications 387(1): 84-96. Nelsen, R. B. (1998). An introduction to copulas. New York, Spinger-Verlag. Newman, M. E. J. (2005). "Power laws, Pareto distributions and Zipf's law." Contemporary Physics 46(5): 323-351. Perloff, J. M. (2008). Microeconomics. New York, Pearson Education Inc. Podsakoff, P. M., S. B. MacKenzie, et al. (2003). "Common Method Biases in Behavioral Research: A Critical Review of the Literature and Recommended Remedies." Journal of applied psychology 88(5): 879. Rea, L. M. and R. A. Parker (1992). Designing and Conducting Survey Research. San Francisco, Jossey-Bass Publishers. Reisinger, D. (2009). "Webware Radar: Google Checkout stalls as Bill Me Later soars." Retrieved 2010-07-05, 2010, from http://news.cnet.com/8301-17939_109-10162701-2.html. Ringle, C. Marc/Wende, et al. (2005). SmartPLS. Hamburg, Germany, SmartPLS.

P a g e | 80
T h e M o b i l e M o n e y m a k e r D e c e m b e r 3 , 2 0 1 0
Salinger, M. A. (1995). "A Graphical Analysis of Bundling." The Journal of Business 68(1): 85-98. Sangani, K. (2010). "Open all hours [iPhone]." Engineering and Technology 5(3): 18-19. Schwartz, R. B. and M. C. Russo (2004). "How to Quickly Find Articles in the Top IS Journals." Communications of the ACM: 98-101. Shang, R. A., Y. C. Chen, et al. (2010). Buying decorative virtual goods for the avatars in the virtual world. Sosik, J. J., S. S. Kahai, et al. (2009). "Silver bullet or voodoo statistics?: A primer for using the partial least squares data analytic technique in group and organization research." Group and Organization Management 34(1): 5-36. Spriensma, G. J. (2010). Mobile App Store Ecosystem - First Exploration in Applicable Distributions. Industrial Engineering and Management. Enschede, Twente University. Bachelor. Straub, D. W. (1989). "Validating Instruments in MIS Research." MIS Quarterly 13(2): 147-169. Streitfeld, D. (2000). Amazon Flunks Its Pricing Test / Sliding costs anger shoppers. Washington Post. Washington. Sugihara, T., Y. Kobayashi, et al. (2009). Risk factors of the long tail in mobile manga sales. Management of Engineering & Technology, 2009. PICMET 2009., Portland, OR Techcrunch (2010). App Store Now Has 150,000 Apps. Great News For The iPad: Paid Books Rule. Techcrunch. R. Wauters. Uspensky, J. B. (1937). Introduction to Mathematical Probability. New York, McGraw-Hill. van der Linde, H. (2004). "A systematic literature review on the effect of different prosthetic components on human functioning with a lower-limb prostesis." Journal of Rehablititaion Research and Development: 555-570. Varian, H. R. (1992). Microeconomic Analysis. New York, W.W. Norton & Company Inc. Vaus, D. A. d. (2001). Research Design in Social Research. London, Sage Publications Ltd. Venkatesh, R. and R. Chatterjee (2006). "Bundling, unbundling, and pricing of multiform products: The case of magazine content." Journal of Interactive Marketing 20(2): 21-38. Viswanathan, S. and G. Anandalingam (2005). "Pricing strategies for information goods." Sadhana - Academy Proceedings in Engineering Sciences 30(2-3): 257-274. Voss, K. E., E. R. Spangenberg, et al. (2003). "Measuring the hedonic and utilitarian dimensions of consumer attitude." Journal of Marketing Research 40(3): 310-320. Wauters, R. (2010). How eBuddy's Mobile Monetization Strategy Helped It Turn A Profit. Techcrunch. Palo Alto. 2010.

P a g e | 81
T h e M o b i l e M o n e y m a k e r D e c e m b e r 3 , 2 0 1 0
Webster, J. and R. T. Watson (2002). "Analyzing the past to prepare for the future." MIS Quarterly: 13-23. West, J. and M. Mace (2010). "Browsing as the killer app: Explaining the rapid success of Apple's iPhone." Telecommunications Policy 34(5-6). Wijnhoven, F. (2010). Information Services Design & Exploitation: A design science search for sustainable knowledge. Enschede. Wijnhoven, F. and J. Kraaijenbrink (2008). "Product-oriented design theory for digital information services: A literature review." Internet Research 18(1): 93-120. Wu, S. Y., L. M. Hitt, et al. (2008). "Customized bundle pricing for information goods: A nonlinear mixed-integer programming approach." Management Science 54(3): 608-622.

A p p e n d i x P a g e | 1
T h e M o b i l e M o n e y m a k e r D e c e m b e r 3 , 2 0 1 0
Appendix A: Company profile eBuddy
eBuddy was founded in 2004 by the current owners Jan-Joost Rueb, Onno Bakker and Paulo Taylor
and received investments from several venture capital parties like Lowlands Capital and Prime
Technology Ventures. The project originated from a bet Taylor had with some friend, where he
claimed to make Instant Messaging (IM) possible on mobile telephones. Phones by that time were
not that sophisticated and therefore the messenger was available via Internet without any software
download requirements. Bakker and Rueb saw business potential and jumped in the IM market.
After years of tremendous growth in both users and employees, eBuddy now serves over 30 million
users on a monthly basis and employs more than 60 people in an office at the Keizersgracht in
Amsterdam. Naturally, with the success, competitors jumped on the bandwagon as well, offering
similar products as eBuddy does.
Currently there are two main markets eBuddy focuses on:
Web messaging; offers instant messaging through all major instant messaging networks on
any computer connected to the Internet, without the need for software installation;
Mobile messaging; offers instant messaging through all major instant messaging networks
on any mobile phone or mobile gaming device connected to the Internet.
A person who wishes to use instant messaging chooses one or more of the worldwide instant
messaging networks; MSN (Microsoft), AIM (America Online), Yahoo, Facebook, Hyves, Google Talk
or the Chinese QQ. These networks all provide software, called a chat application that needs to be
installed on a computer. With this application, a person can chat with his contacts. The networks
are not integrated, so a person who for example uses Microsoft’s MSN is not able to chat with his
contacts that use America Online’s AIM.
Web messaging replaces the need for the installation of a chat application on a computer and is
accessible through a web browser on any computer connected to the Internet. Mobile messaging
gives users the ability to use instant messaging on the road, using their regular mobile phone. Both
products are also capable of collecting all contacts from different instant messaging networks
together, replacing the need for multiple chat applications if a person uses more than one instant
messaging networks to chat with his contacts.
While web messaging is continuously developed and improved, the product is essentially the same
as it was in 2004. In mobile the developments obliged eBuddy to change the strategy. Nowadays
eBuddy develops apps for several platforms like iOS, Android and Java. Although most people still
use IM via the computer, mobile devices are catching up. In Augustus 2010, 40% of the traffic on the
eBuddy network origin from mobile device.
A p p e n d i x P a g e | 2
T h e M o b i l e M o n e y m a k e r D e c e m b e r 3 , 2 0 1 0
APPENDIX B: LITERATURE REVIEW PROCESS
This literature search is conducted to provide a stable basis for the research eBuddy, Twente
University and the researchers agreed on. The overall objective of the study is to find the perfect
strategy for eBuddy to price their products in mobile Appstores.
This document follows a structured way to find relevant articles in order to make sure the research
will, in the end, not miss an important paper, which can literally sink the research project.
USED DATABASE FOR SEARCH To find the most relevant articles different databases are available, however the coverage of
important journals is not guaranteed in every database. Unfortunately no topic related database is a
known, like Ingenta (http://www.ingentaconnect.com) covers the IS related top journals the best,
by indexing 24 of the top 25 journals (Schwartz and Russo 2004).
However as an article in the MIS Quarterly complains about submitted new articles to the journal
“focus solely on North American or a small set of top publications” and “that does not excuse an
author from investigating all published articles in a field”(Webster and Watson 2002), therefore the
more general databases of Scopus (http://www.scopus.com), Web of Science
(http://www.isiwebofknowledge.com/) and early distribution database SSRN
(http://www.ssrn.com) are used.
KEYWORDS & CRITERIA Given the proposal the following keywords are identified to retrieve literature about the following
topics:
Competitive environment
“Competitive environment” + e-business, “Competitive environment” + digital good*, model +
“competitive environment” + internet, online customer behavior
Freemium
Freemium, two-sided digital market*, two-sided market* + online, two-sided market* + internet
Pricing models
Pricing model* digital good*, pricing model* internet software, price elasticit* + internet, versioning
digital good*
Testing models
Testing pricing model*
To identify relevant articles and guarantee more or less that the information is not outdated the
following criteria are used to assess each retrieved article at the very beginning of the research.
The article is written in the last 10 years

A p p e n d i x P a g e | 3
T h e M o b i l e M o n e y m a k e r D e c e m b e r 3 , 2 0 1 0
The article is written in Dutch or English Research field of the article is; behavior science, business & economics, computer science
or mathematics The article is unbiased / neutral Content of the article is relevant The article is available to the researchers
The two first criteria were easy to apply given databases’ additional information. The last criterion
happened only few times because articles or books were not accessible, however no really essential
papers have been missed. The fourth objective was met by checking whether an article was not
written by a biased organization e.g., apple writes a report about Appstores. Finally the fifth
criterion was assessed by whether or not the article fitted within the scope of the study e.g., no
articles about broadband Internet connections when searched for digital goods.
METHOD To score the articles on their scientific relevance a checklist was established, where the researchers
could assess the articles on the awarding criteria which are defined below (van der Linde 2004).
There were 3 classifications of awarding criteria identified; selection, review and general. These
classification were the basis of the underlying criteria, the score of each criteria can either be 0 or 1
and has a weight, so at the end each article got a rating. By using swing weights the relative
importance of the different criteria was assessed.
Since there are 7 criteria and the sum of the weights equals 1, the maximum score is 10. Therefore
an article receives an A when the score is equal to or above 8 (≥8), a B when the score is between 6
and 8 and a C when below 6 (<6).
Articles in category C were discarded. Articles rank A or B were used in the research. Table A. 1
shows the criteria and the corresponding weights; while in Table A. 2 the corresponding threshold
are stated.
Classification Abbr. Criteria weight
Design of the research
S1 S2 S3
Number of references Approximation to the subject of this research Explanation about how the research is done
0.05 0.30 0.15
Review R1 R2
Number of citations Availability of a critical discussion on the result(s)
0.20 0.15
General G1 G2
Publication date Type of university degree of the author
0.10 0.05
TABLE A. 1, CLASSIFICATIONS, CRITERIA AND WEIGHTS
Criteria Minimum: 0 points Maximum:1 point
Number of references Less than 20 More than 20 Approximation to the subject of this research
Does not answer (a part of) the research questions
Answers (a part of) the research question
Explanation about how the research is done
Explanation not included Explanation included
Above the average of < 5 citations ≥ 5 citations

A p p e n d i x P a g e | 4
T h e M o b i l e M o n e y m a k e r D e c e m b e r 3 , 2 0 1 0
citations Availability of a critical discussion of the result(s)
Discussion not included Discussion included
Publication date Before 2005 After 2005 Type of university degree of the author
Less qualified than PhD PhD degree or higher
TABLE A. 2, CRITERIA AND SCORING REQUIREMENTS
RESULTS & SCORING Figure A. 1 shows the discarded articles in every step of the process. The first block contains all the
articles found in the searching engines given the keywords mentioned before. The next step was
eliminating all the articles which were not available and are irrelevant based on the abstract.
FIGURE A. 1, DISCARDED ARTICLES FLOWCHART
The references of the remaining articles were used to conduct a forward- and backward search; in
this extended research the relevant articles (based on availability and abstract) are included.
At this stage all articles needed to be assessed based on the awarding criteria defined in Table A. 1
and the scoring method in Table A. 2. As explained before only the articles with the classification A
or B in Table A. 3 – Table A. 6 are included in the final literature research.
Competitive environment Design of the research
Review General
S1 S2 S3 R1 R2 G1 G2 Total score
Rank
(Slater and Olson 2002) 0 1 1 1 0 0 1 7 B (Loebbecke and Powell 2002) 1 1 1 1 1 0 1 9 A (Krueger, Swatman et al. 2004) 1 0 1 0 1 0 1 6 B (Chandrashekaran, Grewal et al. 2010)
1 1 1 0 1 1 1 8 A
(Krieger and Muller 2003) 1 1 0 0 0 0 1 4 C (Ulieru and Verdon 2009) 1 1 0 0 0 1 1 5 C
TABLE A.3, LITERATURE FOUND KEYWORD 'COMPETIVE ENVIRONMENT'
Query results
Articles
met
criteria
N = 47
Articles
down-
loadable
N = 46
Back- &
Forward
N = 58
Articles
met crite-
ria (2)
N = 68
Articles
used in
research
N = 30

A p p e n d i x P a g e | 5
T h e M o b i l e M o n e y m a k e r D e c e m b e r 3 , 2 0 1 0
Freemium Design of the research
Review General
S1 S2 S3 R1 R2 G1 G2 Total score
Rank
(Sidak 2006) 1 1 0 1 0 1 1 7 B (Cadre, Bouhtou et al. 2009) 0 0 1 0 0 1 1 3 C (Wang and Lu 2008) 0 1 1 0 0 1 1 6 B (Anderson and Gabszewicz 2006) 1 1 1 1 0 1 1 8 A (Bakos and Katsamakas 2008) 1 1 1 0 1 1 1 8 A (Vogelsang 2010) 1 1 1 0 0 1 1 6.5 B (Li, Liu et al. 2010) 0 0 1 0 0 1 1 3 C (Varian 2007) 0 1 1 1 0 1 1 8 A (Parker and Van Alstyne 2005) 1 1 1 1 0 1 1 8 A
TABLE A.4, LITERATURE FOUND KEYWORD 'FREEMIUM'
Pricing Design of the research
Review General
S1 S2 S3 R1 R2 G1 G2 Total score
Rank
(Jagannathan and Almeroth 2004) 0 0 1 0 0 0 1 2 C (Johnson 2007) 0 0 1 0 0 1 1 3 C (Brynjolfsson, Dick et al. 2010) 1 1 1 0 1 1 1 8 A (Lang and Vragov 2005) 1 0 1 1 0 1 1 5 C (Li, Chang et al. 2009) 0 0 0 0 0 1 1 1.5 C (Stevans and Sessions 2005) 0 0 1 1 0 1 1 5 C (Khouja, Hadzikadic et al. 2008) 1 1 1 0 1 1 1 8 A (Bakos and Brynjolfsson 2000) 1 1 1 1 0 0 1 7.5 B (Altinkemer and Bandyopadhyay 2000)
0 1 1 1 1 0 1 8 A
(Bhattacharjee, Gopal et al. 2006) 1 1 1 0 1 1 1 8 A (Goel, Hsieh et al. 2006) 0 0 1 0 0 1 1 3 C (Bansal, Chen et al. 2010) 0 1 1 0 0 1 1 6 B (Kannan and Kopalle 2001) 1 1 1 1 0 0 1 7.5 B (Bhattacharjee, Gopal et al. 2003) 1 1 1 1 0 0 1 7.5 B (Ghose and Sundararajan 2006) 0 1 1 0 0 1 1 6 B (Aron, Sundararajan et al. 2006) 1 1 0 1 1 1 1 8.5 A (Chellappa and Shivendu 2005) 1 1 1 1 1 1 1 10 A (Sundararajan 2004) 1 1 1 1 1 0 1 9 A (Jagannathan, Nayak et al. 2002) 1 1 1 0 1 0 1 7 B (Goldengorin, Keane et al. 2007) 0 0 1 0 0 1 1 3 C (Liang and He 2005) 0 0 1 0 0 1 1 3 C (Fathian, Sadjadi et al. 2009) 1 0 1 0 1 1 1 5 C (Gurnani and Karlapalem 2001) 0 1 1 1 0 0 1 7 B (Bhargava, Choudhary et al. 2001) 0 1 1 1 0 1 1 7 B (Yamori, Bessho et al. 2008) 0 1 1 0 0 1 1 6 B (Jain and Kannan 2002) 1 1 1 1 1 0 1 9 A (Li and Lin 2009) 1 1 1 0 0 1 1 6.5 B

A p p e n d i x P a g e | 6
T h e M o b i l e M o n e y m a k e r D e c e m b e r 3 , 2 0 1 0
(Viswanathan and Anandalingam 2005)
1 1 1 0 0 1 1 6.5 B
(Fan, Kumar et al. 2007) 1 1 1 0 1 1 1 8 A (Archak, Ghose et al. 2007) 1 1 1 0 1 1 1 8 A (Wu and Chen 2008) 1 1 1 0 1 1 1 8 A
TABLE A.5, LITERATURE FOUND KEYWORD 'PRICING'
Forward & backward search Design of the research
Review General
S1 S2 S3 R1 R2 G1 G2 Total score
Rank
(Lassila and Brancheau 1999) 1 0 1 1 0 0 1 4.5 C (Bakos and Brynjolfsson 1999) 1 1 1 1 1 0 1 9 A (Venkatesh and Chatterjee 2006) 1 1 1 1 1 1 1 10 A (Benkler 2002) 1 0 0 1 0 0 1 3 C (Kaplan and Duchon 1988) 1 1 0 1 1 0 1 7.5 B (Shankar, Carpenter et al. 1998) 1 0 1 1 0 0 1 4.5 C (Balasubramanian and Mahajan 2001)
1 1 1 1 1 0 1 9 A
(Bernstein and Federgruen 2004) 1 0 1 1 0 0 1 4.5 C (Chen and Xie 2007) 1 1 1 1 1 1 1 10 A (Lee and Mendelson 2008) 1 0 1 1 1 1 1 7 B (Tomak and Keskin 2008) 1 1 1 0 0 1 1 6.5 B (Economides 1996) 1 1 1 1 0 0 1 6.5 B (Rysman 2009) 1 1 1 0 0 1 1 6.5 B (Barnes 2002) 1 0 0 1 0 0 1 3 C (Rennhoff and Serfes 2009) 1 1 1 0 1 1 1 8 A (Gallaugher and Wang 2002) 1 1 1 1 0 0 1 7.5 B (Iyengar, Jedidi et al. 2008) 1 1 1 0 1 1 1 8 A (Xu and Hu 2007) 1 1 0 0 0 1 1 5 C (Post 2009) 0 1 1 0 1 1 1 7.5 B! (Lee, Yu et al. 2006) 0 1 1 0 0 1 1 6 B (Liebowitz and Margolis 2009) 1 1 1 0 1 1 1 8 A! (Krämer 2009) 1 0 1 1 1 1 1 7 B (Png and Wang 2010) 1 0 1 0 1 1 1 5 B (Varian 2000) 0 1 0 1 1 0 1 7 B (Chang and Yuan 2008) 1 1 1 0 0 1 1 6.5 B! (Dhar and Wertenbroch 2000) 1 1 1 1 1 0 1 9 A (Wu, Hitt et al. 2008) 1 1 1 0 1 1 1 8 B (Weber 2008) 1 1 0 0 1 1 1 6.5 B (Kumar and Sethi 2009) 1 0 0 0 1 1 1 4.5 C (Kauffman and Walden 2001) 1 0 0 1 1 0 1 4.5 C (Biswas 2004) 1 0 0 1 1 0 1 4.5 C (Chellappa and Kumar 2005) 1 1 1 1 1 1 1 10 A (Fishburn, Odlysko et al. 1997) 0 1 1 1 0 0 1 7 B (Coiera 2000) 0 1 1 1 0 0 1 7 B (Bhargava and Choudhary 2001) 0 1 0 1 0 0 1 5.5 C (Chen and Png 2003) 1 0 1 1 0 0 1 4.5 C

A p p e n d i x P a g e | 7
T h e M o b i l e M o n e y m a k e r D e c e m b e r 3 , 2 0 1 0
(Bhaskar and To 2004) 1 1 1 1 0 0 1 6.5 B
(Okada 2005) 1 1 1 1 1 1 1 10 A (Hann and Terwiesch 2003) 0 0 1 1 0 0 1 4 C (Voss, Spangenberg et al. 2003) 1 0 0 1 1 0 1 4.5 C (Pauwels and Weiss 2008) 1 0 1 0 1 1 1 5 C (Rochet and Stole 2002) 1 0 1 1 0 0 1 4.5 C (Yang and Ye 2008) 1 0 0 1 1 1 1 6.5 B (Zhou, Miao et al. 2009) 0 1 0 0 0 1 1 4.5 C (Funk 2009) 0 0 1 0 0 1 1 3 C (Choudhary, Ghose et al. 2005) 1 1 1 1 0 1 1 8 B (Tesauro and Kephart 2002) 0 1 1 1 0 0 1 7 B (Choudhary, Tomak et al. 1998) 1 1 1 0 1 0 1 7 B (Dewan, Jing et al. 2003) 1 0 0 1 1 0 1 4.5 C (Dubé, Sudhir et al. 2005) 1 0 1 1 0 1 1 5.5 C (Bakos 1997) 1 0 1 1 0 0 1 5.5 C (Bakos, Brynjolfsson et al. 1999) 1 0 1 1 1 0 1 6 B (Hagel 3rd and Rayport 1997) 0 1 0 1 1 0 1 7 B (Chuan-Chuan Lin and Lu 2000) 1 0 1 1 0 0 1 4.5 C (Han and Shum 2006) 1 0 1 1 0 1 1 5.5 C (Zinkhan, Kwak et al. 2003) 1 1 1 1 1 0 1 9 A! (Bhargava and Choudhary 2008) 1 1 1 1 0 1 1 8 A
TABLE A.6, LITERATURE FOUND, BACK- & FORWARDSEARCH
LINKING CONCEPTS By reading each individual article more thoroughly a helpful tool to structure the information
(overload) is to identify a couple concepts and categorize each article into these concepts(Webster
and Watson 2002). These concepts are at the same time the basis of the literature part of the thesis.
A concept is a cognitive unit of meaning—an abstract idea or a mental symbol sometimes defined as
a "unit of knowledge," built from other units which act as a concept's characteristics. The concepts
used in this study are;
Business model - business model describes the rationale of how an organization creates, delivers, and captures value - economic, social, or other forms of value.
Economic model - a theoretical construct that represents economic processes by a set of variables and a set of logical and/or quantitative relationships between them.
Price elasticity - price elasticity is a measure used in economics to show the responsiveness, or elasticity, of the quantity demanded of a good or service to a change in its price.
Price discrimination - price discrimination, or price differentiation, exists when sales of identical goods or services are transacted at different prices from the same provider
Bundling - product bundling is a marketing strategy that involves offering several products for sale as one combined product.

A p p e n d i x P a g e | 8
T h e M o b i l e M o n e y m a k e r D e c e m b e r 3 , 2 0 1 0
Versioning - versioning refers to creating vertically differentiated variants of a product and allowing consumers to self-select their preferred product type.
Network effects - In economics and business, a network effect (also called network externality) is the effect that one user of a good or service has on the value of that product to other people.
Information goods - in economics and law is a type commodity whose main market value is derived from the information it contains. It may also include services (information services).
Customer behavior - is the study of when, why, how, and where people do or do not buy product.
This concept matrix will be the starting point for the literature part of the thesis. After reading all
the articles rated A and B, the literature will be synthesized by discussing each identified concept
producing a framework for the thesis.
Bu
siness
mo
del
Eco
no
mic
mo
del
Price
elasticity
Price
discrim
inat
ion
Bu
nd
ling
Versio
nin
g
Netw
ork
effects
Info
rmatio
n go
od
s
Cu
stom
er b
ehav
ior
Business model
8 - - - - - - - -
Economic model
1 18 - - - - - - -
Price elasticit
y 1 5 21 - - - - - -
Price discrimination
1 6 2 23 - - - - -
Bundling
0 3 4 9 15 - - - -
Versioning
0 2 0 4 3 7 - - -
Network effects
1 7 6 4 1 0 16 - -
Information
goods 6 14 15 17 13 6 9 49 -
Customer
behavior
0 2 3 7 2 0 3 8 16

A p p e n d i x P a g e | 9
T h e M o b i l e M o n e y m a k e r D e c e m b e r 3 , 2 0 1 0
APPENDIX C: ALGORITHMS TO EXTRACT INFORMATION FROM
DATABASE
Versioning algorithm FOREACH app in the subset (top 100 Free Overall U.S. 1 October 2010)
IF inapp.parentid = app.id AND inapp.publisher = app.publisher
AND inapp.type = ‘inapp’
RETURN app.in_app_purchases = 1
IF paidapp.name LIKE %app.name% AND paidapp.publisher = app.publisher
AND paidapp.type = ‘paid’
RETURN app.paidversion = 1
Results
Price skimming algorithm FOREACH app in the subset (top 100 Paid Overall U.S. 1 January 2010)
FOREACH day between 20100201 and 20100931
IF app.price(201001) > app.price
RETURN app.pricelowerovertheyeat = 1
IF app.price(201001) > app.price(20101001)
RETURN app.pricelowerfirstoctober = 1
ELSEIF app.price(201001) < app.price(20101001)
RETURN app.pricehigherfirstoctober = 1
Results SELECT r.rank, a.name, r.price, r2.price FROM rankings r
JOIN appstore_instances ai ON (r.appstore_instance_id = ai.id)
JOIN countries cn ON (cn.id = ai.country_id)
JOIN applications a ON (r.application_id = a.id)
JOIN rankings r2 ON (r.application_id = r2.application_id AND r2.date = 20101001 AND
r2.rankcategory_id = 1)
JOIN appstore_instances ai2 ON (r2.appstore_instance_id = ai2.id)
JOIN countries cn2 ON (cn2.id = ai2.country_id)
WHERE r.date = 20100101
AND cn.name = "United States"

A p p e n d i x P a g e | 10
T h e M o b i l e M o n e y m a k e r D e c e m b e r 3 , 2 0 1 0
AND r.rankcategory_id = 1
AND ai.device_id = 1
AND ai2.device_id = 1
AND cn2.name = "United States"
ORDER BY r.rank;
Tie-in algorithm FOREACH app in the subset (top 100 Paid && Free Overall U.S. 1 October 2010)
IF inapp.parentid = app.id AND inapp.publisher = app.publisher
AND inapp.type = ‘inapp’
RETURN app.in_app_purchases = 1
The results are qualitatively assessed based on the description of the in app
purchase.
Results
SELECT r.rank, a.name, r.price, inapp.in_app_purchases FROM rankings r
JOIN appstore_instances ai ON (r.appstore_instance_id = ai.id)
JOIN countries cn ON (cn.id = ai.country_id)
JOIN applications a ON (r.application_id = a.id)
LEFT JOIN application_details inapp ON (inapp.application_id = r.application_id AND
inapp.date > 20100901)
WHERE r.date = 20101001
AND cn.name = "United States"
AND r.rankcategory_id = 82
AND ai.device_id = 1
ORDER BY r.rank;

A p p e n d i x P a g e | 11
T h e M o b i l e M o n e y m a k e r D e c e m b e r 3 , 2 0 1 0
APPENDIX D: JOINT UNIFORM DISTRIBUTION
This problem can be solved using convolution theory, based on Fourier transformations, but in
general (Uspensky 1937), the distribution of the sum of independent variables with
uniform distribution on [0,1] has a density function of:
In the two good case
Where,
So by integrating over ,
Below the for the three-, four- and five-good case is given, but only the five-good case is
elaborated into a demand function.
For ,
For ,

A p p e n d i x P a g e | 12
T h e M o b i l e M o n e y m a k e r D e c e m b e r 3 , 2 0 1 0
For ,

A p p e n d i x P a g e | 13
T h e M o b i l e M o n e y m a k e r D e c e m b e r 3 , 2 0 1 0
Appendix E: Simulation Matlab code
3 goods uniform %Number of products
k = 3;
%number of customers
n = 100000;
%bundle value vector
bv=zeros(n,2);
%Simulate n customers
for j=1:n
%valuationvector
v=zeros(k,1);
for i=1:k
v(i) = rand(1);
end
bv(j,1) = max(0,v(1)) + max(0,(v(2)-A(1,2)*v(1))) + max(0,(v(3)-A(1,3)*v(1)-A(2,3)*(v(2)-
A(1,2)*v(1))));
end
R=zeros(k/0.01,3);
for i=1:100*k
p = i/100;
R(i,1) = p;
for j=1:n
if bv(j,1) >= p
R(i,2) = R(i,2) + p;
end
end
R(i,3) = R(i,2) / p;
end
detA = det(A);
Result=zeros(100,12);
t = 1;
for t=1:100
i=t/100;
j=t/100;
k=t/100;
for l=1:3
PA = A;
PA(1,l) = (1-i);
PA(2,l) = (1-j);
PA(3,l) = (1-k);
if l == 1
Result(t,1) = i;
Result(t,6) = (det(PA)/detA);
elseif l == 2
Result(t,2) = j;
Result(t,7) = (det(PA)/detA);
elseif l == 3
Result(t,3) = k;
Result(t,8) = (det(PA)/detA);
end
end
Result(t,11) = max(0,Result(t,6)*i) + max(0,Result(t,7)*j) +
max(0,Result(t,8)*k);
Result(t,12) = Result(t,11)/(t/100);
End
5 goods uniform %Number of products
k = 5;
%number of customers

A p p e n d i x P a g e | 14
T h e M o b i l e M o n e y m a k e r D e c e m b e r 3 , 2 0 1 0
n = 100000;
%bundle value vector
bv=zeros(n,2);
%Simulate n customers
for j=1:n
%valuationvector
v=zeros(k,1);
for i=1:k
v(i) = rand(1);
end
bv(j,1) = max(0,v(1)) + max(0,(v(2)-A(1,2)*v(1))) + max(0,(v(3)-A(1,3)*v(1)-A(2,3)*(v(2)-
A(1,2)*v(1)))) + max(0,(v(4)-A(1,4)*v(1)-A(2,4)*(v(2)-A(1,2)*v(1))-A(3,4)*(v(3)-A(1,3)*v(1)-
A(2,3)*(v(2)-A(1,2)*v(1))))) + max(0,(v(5)-A(1,5)*v(1)-A(2,5)*(v(2)-A(1,2)*v(1))-A(3,5)*(v(3)-
A(1,3)*v(1)-A(2,3)*(v(2)-A(1,2)*v(1)))-A(4,5)*(v(4)-A(1,4)*v(1)-A(2,4)*(v(2)-A(1,2)*v(1))-
A(3,4)*(v(3)-A(1,3)*v(1)-A(2,3)*(v(2)-A(1,2)*v(1))))));
end
R=zeros(k/0.01,3);
for i=1:100*k
p = i/100;
R(i,1) = p;
for j=1:n
if bv(j,1) >= p
R(i,2) = R(i,2) + p;
end
end
R(i,3) = R(i,2) / p;
end
detA = det(A);
Result=zeros(100,12);
t = 1;
for t=1:100
i=t/100;
j=t/100;
k=t/100;
m=t/100;
n=t/100;
for l=1:5
PA = A;
PA(1,l) = (1-i);
PA(2,l) = (1-j);
PA(3,l) = (1-k);
PA(4,l) = (1-m);
PA(5,l) = (1-n);
if l == 1
Result(t,1) = i;
Result(t,6) = (det(PA)/detA);
elseif l == 2
Result(t,2) = j;
Result(t,7) = (det(PA)/detA);
elseif l == 3
Result(t,3) = k;
Result(t,8) = (det(PA)/detA);
elseif l == 4
Result(t,4) = m;
Result(t,9) = (det(PA)/detA);
elseif l == 5
Result(t,5) = n;
Result(t,10) = (det(PA)/detA);
end
end
Result(t,11) = max(0,Result(t,6)*i) + max(0,Result(t,7)*j) +
max(0,Result(t,8)*k) + max(0,Result(t,9)*k) + max(0,Result(t,10)*k);
Result(t,12) = Result(t,11)/(t/100);
End

A p p e n d i x P a g e | 15
T h e M o b i l e M o n e y m a k e r D e c e m b e r 3 , 2 0 1 0
5 goods exponential %Number of products
k = 5;
%number of customers
n = 100000;
%bundle value vector
bv=zeros(n,2);
%Simulate n customers
for j=1:n
%valuationvector
v=zeros(k,1);
for i=1:k
v(i) = exprnd(1);
end
bv(j,1) = max(0,v(1)) + max(0,(v(2)-A(1,2)*v(1))) + max(0,(v(3)-A(1,3)*v(1)-A(2,3)*(v(2)-
A(1,2)*v(1)))) + max(0,(v(4)-A(1,4)*v(1)-A(2,4)*(v(2)-A(1,2)*v(1))-A(3,4)*(v(3)-A(1,3)*v(1)-
A(2,3)*(v(2)-A(1,2)*v(1))))) + max(0,(v(5)-A(1,5)*v(1)-A(2,5)*(v(2)-A(1,2)*v(1))-A(3,5)*(v(3)-
A(1,3)*v(1)-A(2,3)*(v(2)-A(1,2)*v(1)))-A(4,5)*(v(4)-A(1,4)*v(1)-A(2,4)*(v(2)-A(1,2)*v(1))-
A(3,4)*(v(3)-A(1,3)*v(1)-A(2,3)*(v(2)-A(1,2)*v(1))))));
end
R=zeros(k/0.01,3);
for i=1:461*k
p = i/100;
R(i,1) = p;
for j=1:n
if bv(j,1) >= p
R(i,2) = R(i,2) + p;
end
end
R(i,3) = R(i,2) / p;
end
detA = det(A);
Result=zeros(100,12);
t = 1;
for t=1:100
i=t/100;
j=t/100;
k=t/100;
m=t/100;
n=t/100;
for l=1:5
PA = A;
PA(1,l) = -log(i);
PA(2,l) = -log(j);
PA(3,l) = -log(k);
PA(4,l) = -log(m);
PA(5,l) = -log(n);
if l == 1
Result(t,1) = i;
Result(t,6) = (det(PA)/detA);
elseif l == 2
Result(t,2) = j;
Result(t,7) = (det(PA)/detA);
elseif l == 3
Result(t,3) = k;
Result(t,8) = (det(PA)/detA);
elseif l == 4
Result(t,4) = m;
Result(t,9) = (det(PA)/detA);
elseif l == 5
Result(t,5) = n;
Result(t,10) = (det(PA)/detA);
end
end

A p p e n d i x P a g e | 16
T h e M o b i l e M o n e y m a k e r D e c e m b e r 3 , 2 0 1 0
Result(t,11) = max(0,Result(t,6)*i) + max(0,Result(t,7)*j) +
max(0,Result(t,8)*k) + max(0,Result(t,9)*k) + max(0,Result(t,10)*k);
Result(t,12) = Result(t,11)/(t/100);
End
5 goods power law %Number of products
k = 5;
%number of customers
n = 100000;
%bundle value vector
bv=zeros(n,2);
%Simulate n customers
for j=1:n
%valuationvector
v=zeros(k,1);
for i=1:k
%price between 0,1 with a exp. distribution.
v(i) = 1*(1-rand(1)).^(-1/1.25);
end
bv(j,1) = max(0,v(1)) + max(0,(v(2)-A(1,2)*v(1))) + max(0,(v(3)-A(1,3)*v(1)-A(2,3)*(v(2)-
A(1,2)*v(1)))) + max(0,(v(4)-A(1,4)*v(1)-A(2,4)*(v(2)-A(1,2)*v(1))-A(3,4)*(v(3)-A(1,3)*v(1)-
A(2,3)*(v(2)-A(1,2)*v(1))))) + max(0,(v(5)-A(1,5)*v(1)-A(2,5)*(v(2)-A(1,2)*v(1))-A(3,5)*(v(3)-
A(1,3)*v(1)-A(2,3)*(v(2)-A(1,2)*v(1)))-A(4,5)*(v(4)-A(1,4)*v(1)-A(2,4)*(v(2)-A(1,2)*v(1))-
A(3,4)*(v(3)-A(1,3)*v(1)-A(2,3)*(v(2)-A(1,2)*v(1))))));
end
R=zeros(k/0.01,3);
for i=1:3881*k
p = i/100;
R(i,1) = p;
for j=1:n
if bv(j,1) >= p
R(i,2) = R(i,2) + p;
end
end
R(i,3) = R(i,2) / p;
end
detA = det(A);
Result=zeros(100,12);
t = 1;
for t=1:100
i=t/100;
j=t/100;
k=t/100;
m=t/100;
n=t/100;
for l=1:5
PA = A;
PA(1,l) = (i^(1/-1.25))-1;
PA(2,l) = (j^(1/-1.25))-1;
PA(3,l) = (k^(1/-1.25))-1;
PA(4,l) = (m^(1/-1.25))-1;
PA(5,l) = (n^(1/-1.25))-1;
if l == 1
Result(t,1) = i;
Result(t,6) = (det(PA)/detA);
elseif l == 2
Result(t,2) = j;
Result(t,7) = (det(PA)/detA);
elseif l == 3
Result(t,3) = k;
Result(t,8) = (det(PA)/detA);
elseif l == 4
Result(t,4) = m;
Result(t,9) = (det(PA)/detA);
elseif l == 5

A p p e n d i x P a g e | 17
T h e M o b i l e M o n e y m a k e r D e c e m b e r 3 , 2 0 1 0
Result(t,5) = n;
Result(t,10) = (det(PA)/detA);
end
end
Result(t,11) = max(0,Result(t,6)*i) + max(0,Result(t,7)*j) +
max(0,Result(t,8)*k) + max(0,Result(t,9)*k) + max(0,Result(t,10)*k);
Result(t,12) = Result(t,11)/(t/100);
End
To determine restriction=zeros(10,2);
for looper=1:10
A = looper/10;
Code of case tested
for beta=1:100
beta2 = 100-beta;
C = max(R);
if (Result(50,11) > (beta2/100) * C(1,2) / 100000) && ind == 0
restriction(looper,1) = A;
restriction(looper,2) = beta2 / 100;
ind = 1;
end
end
ind = 0;
end
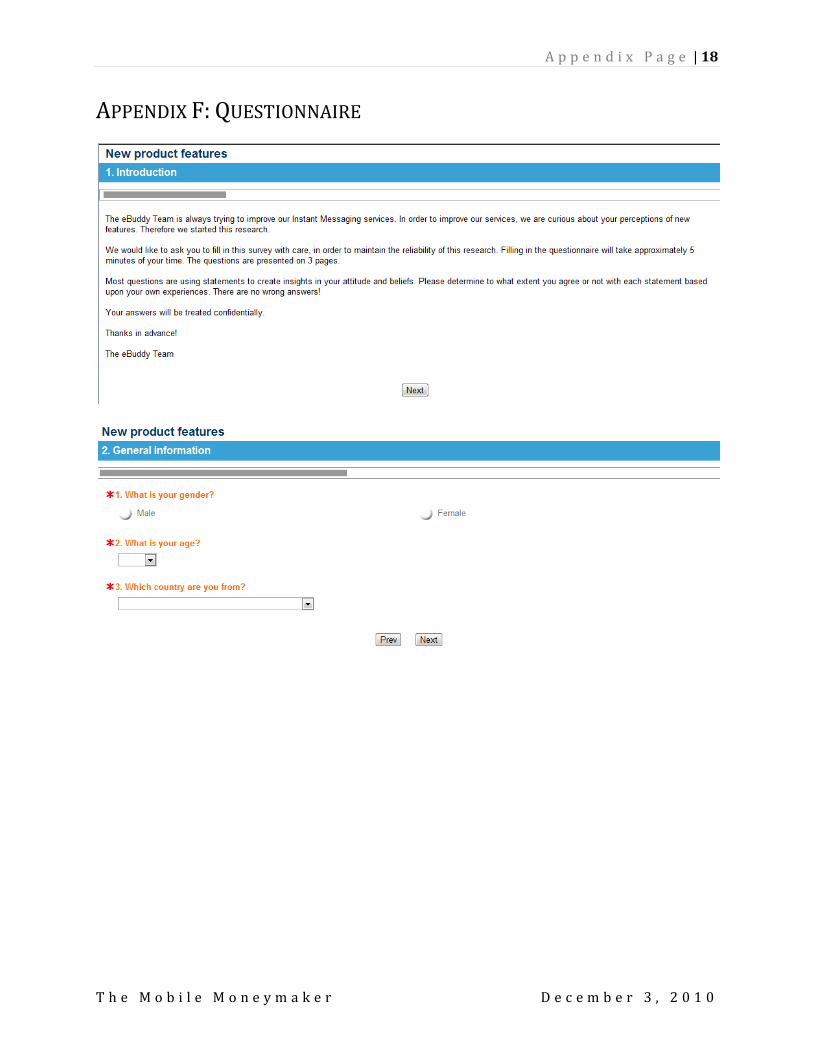
A p p e n d i x P a g e | 18
T h e M o b i l e M o n e y m a k e r D e c e m b e r 3 , 2 0 1 0
APPENDIX F: QUESTIONNAIRE

A p p e n d i x P a g e | 19
T h e M o b i l e M o n e y m a k e r D e c e m b e r 3 , 2 0 1 0

A p p e n d i x P a g e | 20
T h e M o b i l e M o n e y m a k e r D e c e m b e r 3 , 2 0 1 0

A p p e n d i x P a g e | 21
T h e M o b i l e M o n e y m a k e r D e c e m b e r 3 , 2 0 1 0

A p p e n d i x P a g e | 22
T h e M o b i l e M o n e y m a k e r D e c e m b e r 3 , 2 0 1 0
APPENDIX G: FACTOR ANALYSIS
DFU
N
DH
ED
DSO
C
FUN
C
PER
F
VA
AS
CU
ST
CU
RE
BR
AN
RA
RI
DFUN1 0,67 0,48 0,34 0,60 0,47 0,31 0,34 0,28 0,38 0,19 DFUN2 0,79 0,55 0,49 0,63 0,63 0,45 0,49 0,41 0,54 0,42 DFUN3 0,75 0,51 0,52 0,57 0,58 0,62 0,61 0,46 0,54 0,42 DHED1 0,57 0,62 0,40 0,60 0,56 0,49 0,48 0,28 0,41 0,21 DHED2 0,49 0,79 0,55 0,53 0,51 0,52 0,58 0,42 0,60 0,41 DHED3 0,51 0,79 0,55 0,47 0,47 0,57 0,54 0,56 0,65 0,51 DSOC1 0,45 0,52 0,71 0,39 0,46 0,45 0,54 0,53 0,60 0,35 DSOC2 0,53 0,58 0,81 0,46 0,52 0,54 0,48 0,52 0,60 0,60 DSOC3 0,43 0,46 0,78 0,31 0,47 0,61 0,49 0,55 0,52 0,45 FUNC1 0,55 0,44 0,31 0,78 0,47 0,36 0,48 0,27 0,44 0,26 FUNC2 0,70 0,64 0,52 0,80 0,61 0,45 0,50 0,41 0,55 0,45 FUNC3 0,67 0,59 0,37 0,82 0,60 0,46 0,52 0,36 0,49 0,38 PERF1 0,55 0,45 0,36 0,56 0,72 0,36 0,46 0,33 0,40 0,35 PERF2 0,62 0,57 0,56 0,56 0,79 0,55 0,50 0,42 0,58 0,42 PERF3 0,48 0,46 0,46 0,41 0,69 0,51 0,51 0,46 0,45 0,40 VAAS1 0,62 0,58 0,49 0,52 0,62 0,78 0,64 0,45 0,62 0,41 VAAS2 0,37 0,56 0,61 0,28 0,38 0,74 0,48 0,51 0,56 0,41 VAAS3 0,49 0,53 0,53 0,47 0,53 0,84 0,65 0,52 0,58 0,41 CUST1 0,30 0,41 0,42 0,25 0,42 0,39 0,62 0,43 0,48 0,29 CUST2 0,58 0,65 0,55 0,62 0,56 0,61 0,83 0,43 0,57 0,44 CUST3 0,55 0,54 0,50 0,48 0,53 0,66 0,81 0,46 0,53 0,36 CURE1 0,47 0,48 0,56 0,45 0,42 0,47 0,44 0,78 0,58 0,44 CURE2 0,33 0,43 0,44 0,31 0,39 0,41 0,38 0,70 0,40 0,54 CURE3 0,39 0,42 0,58 0,24 0,45 0,56 0,49 0,81 0,56 0,50 BRAN1 0,46 0,48 0,46 0,46 0,51 0,38 0,40 0,47 0,67 0,32 BRAN2 0,57 0,59 0,60 0,48 0,53 0,60 0,55 0,46 0,76 0,45 BRAN3 0,47 0,62 0,61 0,46 0,45 0,65 0,59 0,58 0,81 0,52 RARI1 0,28 0,38 0,32 0,31 0,28 0,14 0,23 0,28 0,29 0,60 RARI2 0,41 0,39 0,50 0,36 0,47 0,43 0,34 0,56 0,50 0,79 RARI3 0,33 0,39 0,49 0,34 0,38 0,52 0,46 0,53 0,46 0,77

A p p e n d i x P a g e | 23
T h e M o b i l e M o n e y m a k e r D e c e m b e r 3 , 2 0 1 0
APPENDIX H: COMMON METHOD BIAS ANALYSIS
Substantive loading ( )
Method Loading ( )
DFUN1 0.86*** 0.74 -0.22 0.05 DFUN2 0.79*** 0.62 -0.01 0.00 DFUN3 0.58** 0.34 0.20 0.04 DHED1 0.57* 0.32 0.08 0.01 DHED2 0.89*** 0.79 -0.11 0.01 DHED3 0.74*** 0.55 0.04 0.00 DSOC2 0.80*** 0.64 0.02 0.00 DSOC3 0.88*** 0.77 -0.11 0.01 DSOC1 0.63*** 0.40 0.09 0.01 FUNC1 0.99*** 0.98 -0.23 T 0.05 FUNC2 0.63*** 0.40 0.20 0.04 FUNC3 0.79*** 0.62 0.03 0.00 PERF1 0.82*** 0.67 -0.13 0.02 PERF2 0.66*** 0.44 0.13 0.02 PERF3 0.73*** 0.53 -0.01 0.00 VAAS1 0.69*** 0.48 0.13 0.02 VAAS2 0.70*** 0.49 0.00 0.00 VAAS3 0.96*** 0.92 -0.12 0.02 CUST1 0.76*** 0.58 -0.15 0.02 CUST2 0.71*** 0.50 0.12 0.02 CUST3 0.82*** 0.67 -0.02 0.00 CURE1 0.72*** 0.52 0.07 0.01 CURE2 0.73*** 0.53 -0.04 0.00 CURE3 0.84*** 0.71 -0.03 0.00 BRAN1 0.84*** 0.71 -0.17 0.03 BRAN2 0.64** 0.41 0.12 0.02 BRAN3 0.78*** 0.61 0.02 0.00 RARI1 0.65*** 0.42 -0.09 0.01 RARI2 0.78*** 0.61 0.02 0.00 RARI3 0.74*** 0.55 0.05 0.00 Average 0.58 0.01

A p p e n d i x P a g e | 24
T h e M o b i l e M o n e y m a k e r D e c e m b e r 3 , 2 0 1 0
Appendix I: SmartPLS Models
FIGURE A. 2, PLS STANDARD MODEL
FIGURE A. 3, PLS COMMON METHOD VARIANCE MODEL